1. Introduction
Pavements are considered the most important asset of public road infrastructure in Iraq. Selecting a suitable repair and rehabilitation plan improves journey comfort and transportation safety. Moreover, it decreases vehicle process budgets and environmental and construction budgets [
1]. A group of indices is regularly utilized to measure pavement performance [
2]. They have an important value in the pavement management field [
3]. The IRI and the PCI are two of the most common pavement performance indices [
4]. They have been extensively used to improve pavement repair plans [
2]. The first of them is the IRI, which is a well-known pavement performance index in many countries around the world [
5,
6]. The World Bank originally introduced it and it is also a measure of the unevenness of a pavement surface [
7,
8]. The IRI value may vary between 0.810 and 1.030 m/km for a newly built pavement section, but minor values have also been measured [
9,
10,
11]. The second index is the PCI, which is a worldwide common pavement performance index with numeric between 0 and 100, which the US Army firstly developed [
12]. In addition, the ASTM regulated it far ahead [
13]. The PCI represents the amount of distresses on the pavement and their severity. Consequently, a recently built pavement has a PCI of 100, and as it fails over time and becomes impractical, its PCI gets close to 0. Calculating the PCI requires records about a number of types of distresses and their extent [
4].
Machine learning approaches, specifically GEP modeling, offer an innovative solution for determining pavement condition indices without requiring detailed distress evaluations, resulting in significant resource optimization [
14]. Traditional PCI assessment methods are resource-intensive, demanding extensive field surveys and substantial data collection efforts. Transportation authorities rely on systematic pavement management frameworks to optimize their maintenance decisions and ensure road infrastructure maintains acceptable quality standards within budgetary constraints. Effective pavement preservation requires both consistent monitoring and accurate deterioration forecasting to implement timely maintenance interventions. While well-funded jurisdictions can conduct annual or biennial assessments of road surface quality metrics and deterioration patterns, agencies with limited resources typically extend their evaluation intervals to 3–5 years [
15].
The predictive models developed in this research enable resource-constrained agencies to derive PCI values from IRI measurements, creating a more efficient assessment framework. These computed PCI metrics empower infrastructure managers to evaluate network performance, schedule optimal maintenance timing, and forecast budget requirements more effectively. By incorporating these performance indices into strategic planning, organizations can develop cost-optimized intermediate-term rehabilitation strategies across their pavement networks. While this study’s methodology draws from both published research data and field surveys conducted in Jordan, its underlying principles are broadly applicable. The universal acceptance and standardization of metrics like the PCI and IRI in pavement engineering make this approach adaptable to diverse geographic contexts and transportation networks worldwide. This study proposes two GEP models. The GEP model predicts the PCI from the IRI. The GEP model was based on 401 data points collected from accumulated data points from the Iraqi road network. Our research develops dual GEP-based modeling approaches for pavement assessment. The primary model establishes predictive relationships between IRI measurements and PCI values. The model’s development utilized a comprehensive dataset of 401 observations gathered from roadway networks across Iraq.
The adoption of Gene Expression Programming (GEP) for pavement condition prediction represents a paradigm shift from conventional assessment methodologies, offering unique advantages that address critical limitations in traditional pavement management systems. Unlike linear regression models that assume predetermined mathematical relationships between variables, GEP employs evolutionary computation principles to automatically discover optimal mathematical expressions that best describe the complex, non-linear relationship between the International Roughness Index (IRI) and Pavement Condition Index (PCI). The self-learning nature of GEP enables it to identify hidden patterns and correlations within pavement data that traditional statistical methods might overlook, resulting in more accurate and robust predictive models. Furthermore, GEP’s ability to generate transparent, interpretable mathematical expressions provides engineers with valuable insights into the underlying physical relationships governing pavement performance, facilitating better decision-making in maintenance planning and resource allocation. The superior generalization capabilities demonstrated by GEP models, as evidenced by their enhanced validation performance, ensure reliable predictions for new, unseen pavement sections, making this approach particularly valuable for large-scale pavement network management where consistent and accurate condition assessment across diverse road segments is essential for optimal infrastructure investment strategies.
The proposed GEP-based approach offers an eco-friendly and economically viable substitute for traditional PCI assessment methods, demonstrating considerable promise for minimizing environmental footprint by reducing on-site activities, decreasing fuel usage, limiting equipment deployment, and lessening traffic interference during evaluation processes. Through optimizing pavement management workflows while preserving assessment precision and dependability, this technique advances sustainable infrastructure practices and fosters the creation of environmentally conscious transportation networks. The diminished resource demands and improved effectiveness of this GEP methodology correspond with modern sustainability objectives in civil engineering and infrastructure oversight, facilitating both financial feasibility and ecological responsibility in pavement evaluation frameworks. Additionally, the GEP model can contribute to carbon emission reduction, with calculations based on the AUC carbon footprint report [
16]. The average mass emissions for different vehicle types are as follows: gasoline vehicles (cars) produce 0.2131 kgCO
2e/km, while diesel vehicles (vans/microbuses/light duty trucks) generate 0.2933 kgCO
2e/km. For the 40 km study range, this translates to total CO
2 emissions of 11.76 kg for a vehicle operating velocity of 20 Kph. By implementing this approach, the carbon dioxide emissions associated with each road network survey conducted for Pavement Condition Index (PCI) assessment can be significantly reduced. Furthermore, when this methodology is applied to larger road networks, the potential for CO
2 emission reduction increases proportionally, demonstrating the scalability and environmental benefits of the GEP model approach.
2. Literature Review
The literature includes several diverse methods to model or calculate the PCI as a function of the IRI. Radwan [
17] created a relationship between the PCI and IRI in Egypt for a total of 44 km of urban roads which was separated into uniform segments. The PCI was measured using a visual inspection involving standard distress forms. An ultrasonic sensor fixed on an automobile was used to measure the IRI values for the same sections. An exponential model with an R
2 of 0.82 was developed to reflect the correlation between the IRI and PCI [
17]. Unlike the previous research, Pramesti [
18] tried to use the PCI to forecast the IRI with records made in 2019–2020, using a Hawkeye car on six segments of pavement in Indonesia, but their results showed that the IRI cannot be described by the PCI even when the two indices are used to measure pavement deterioration [
18]. This study’s focus on roads with only ‘good or acceptable’ conditions resulted in a limited data range, which hindered the development of meaningful correlations between these two independent pavement performance indices when using Hawkeye measurements. To address this limitation, the study developed a novel predictive modeling approach using Gene Expression Programming (GEP) with an expanded dataset to enhance the reliability of the prediction model. The research utilized 401 samples within an acceptable range, as established guidelines for high-dimensional genomic and imaging data indicate that effective sample sizes typically range from 100 to 10,000 specimens. Keymanesh [
19] conducted a regression analysis between the IRI and PCI for the main roads in a cold-weather area in the Ardabil Province, Iran, during 2014, 2017, and 2020. The results showed that the finest equation explaining their relationship is a linear inverse model with an R
2 = 0.992 [
19]. Abed [
20] considered starting relationships between the PCI and IRI for 83 segments for flexible pavements chosen in Al-Diwaniyah, Iraq. Numerous models were offered as relationship forms but only the two models with the highest R
2 were selected. The selected models had linear and quadratic relationships with R
2 equal to 0.715 and 0.722, respectively [
20].
Younos explored methods for predicting the PCI by incorporating multiple variables including environmental conditions, structural parameters, soil characteristics, and vehicular load factors. Their investigation compared two distinct analytical approaches: traditional regression techniques and advanced neural network modeling. The conventional regression analysis demonstrated strong predictive capability with a coefficient of determination of 0.80, while the artificial neural network methodology achieved enhanced accuracy with an R
2 value of 0.88. The researchers noted that their methodologies offered both precision and straightforward implementation, suggesting potential applications in regions sharing comparable weather patterns and traffic characteristics [
21].
The evolution of genetic programming methodologies began with genetic programming (GP), which emerged as an advancement of genetic algorithm principles. Building upon this foundation, Ferreira [
22] later introduced GEP, enhancing the field’s capabilities in addressing intricate computational challenges with minimal population requirements. The distinguishing feature of GEP lies in its computational architecture, which utilizes fixed-length genetic sequences within its programming framework. These sequences function as computational building blocks, encoding variable-sized expression trees (ETs). The system employs a gene-based structure where individual or multiple genes compose these fixed-length sequences, enabling flexible problem-solving approaches through diverse tree configurations [
23,
24]. Recent research has demonstrated the effectiveness of GEP across various domains in civil engineering [
25]. For instance, Kameshki developed a GEP algorithm aimed at optimizing the design of steel frames under diverse loading conditions with sidesway [
26]. Additionally, Murad et al. utilized a GEP empirical model to forecast the bond strength between concrete surfaces and carbon fiber-reinforced polymer sheets during direct pull-out tests [
27]. They also introduced GEP models to estimate the compressive strength of concrete mixtures containing silica fume, fly ash, and a combination of both [
28]. Furthermore, Murad et al. created GEP models to assess the joint shear strength of exterior joints subjected to biaxial loading [
28,
29].
Cevik and Sonebi employed regression analyses alongside computational methods like GEP and artificial neural networks (ANNs) to predict pavement behavior. They found that GEP might outperform both ANN and traditional regression analyses, as it can dynamically adjust the parameters included in the model formulation to align more closely with experimental findings, without requiring a predetermined function [
30]. Numerous researchers have also applied GEP and ANN models in various civil engineering contexts [
31,
32,
33]. Additional research developed a GEP model using records that were half collected from the available previous studies while the other half were organized and compiled from a visual survey by the authors. The data from the field were collected from an arterial road 50 km in length in Jordan. They made a comparison between the PCI values forecast by the GEP model and the estimated PCI values from models in the literature. The GEP model yielded well compared to all the other existing models in the literature, with an R
2 of 82%. The results showed that the IRI is the key predictor variable of the PCI [
3].
Figure 1 shows the variations of R
2 given by a number of studies in the literature.
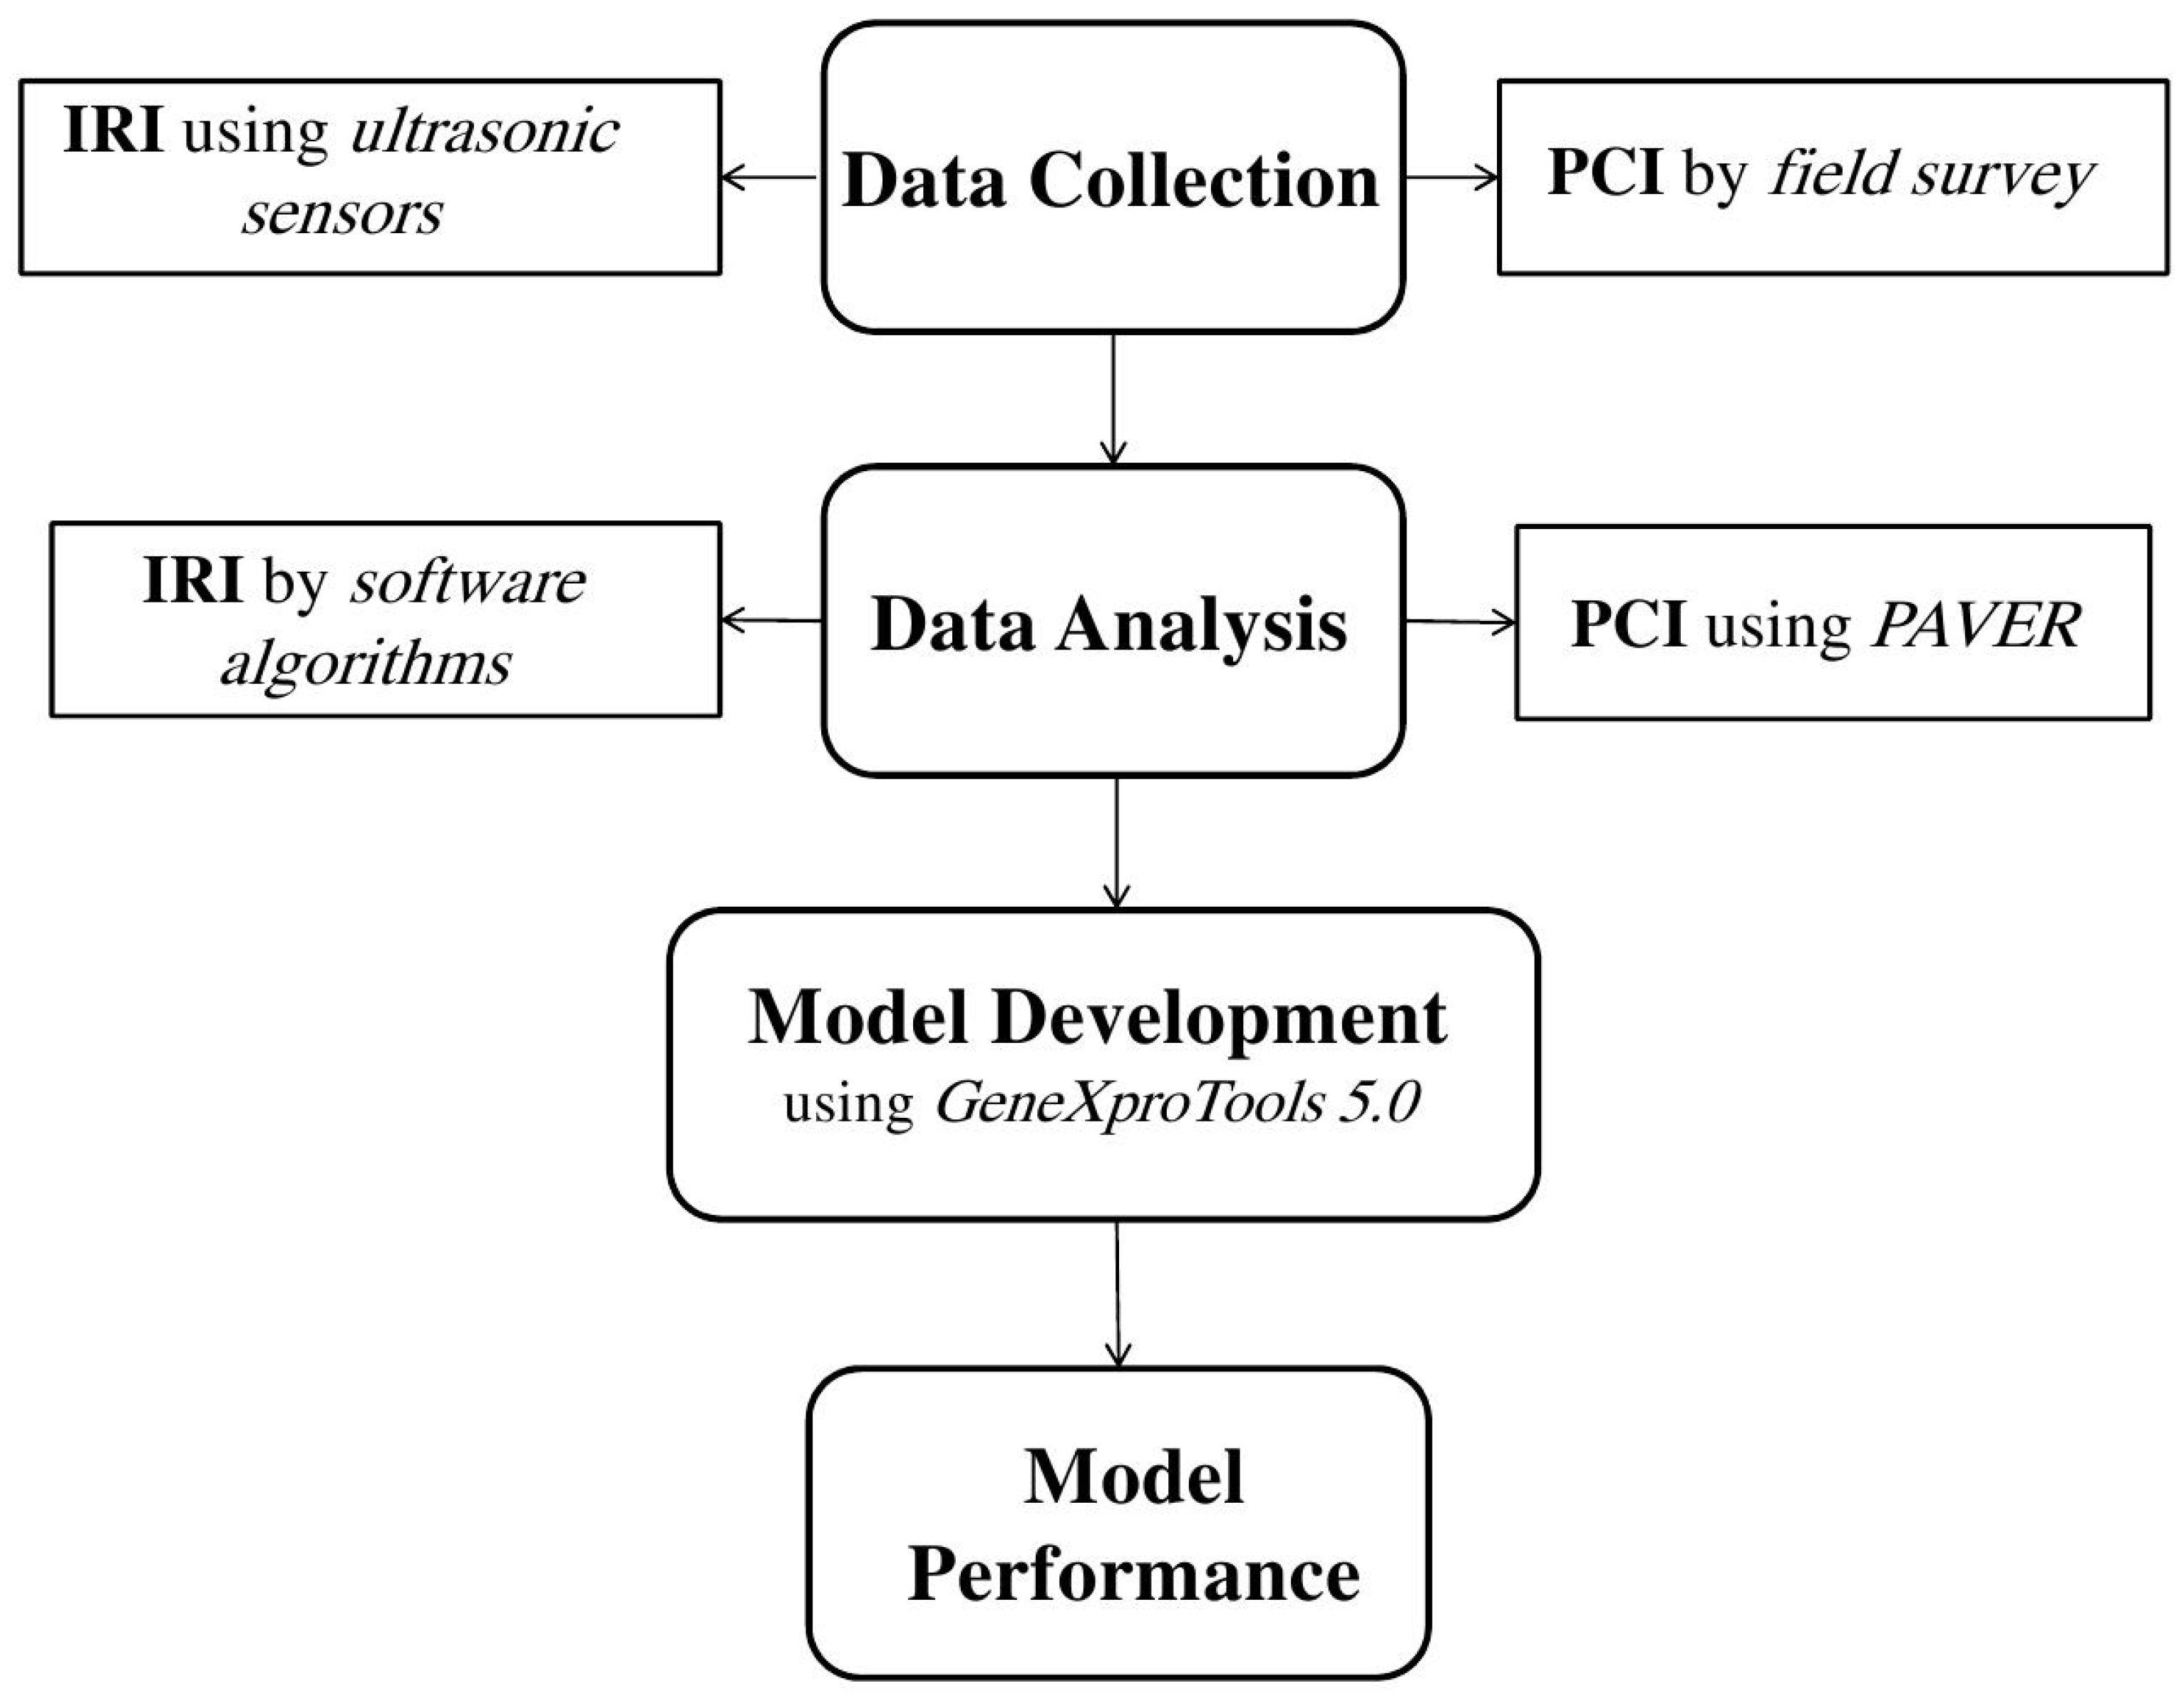
3. Methodology
The current study aims to practically value the state of the road pavement using the PCI technique and the IRI technique. The first step in fulfilling the purpose of this research is to select the roads in Al-Basra city in Iraq as the study area and then coordinate with local authorities for data collection. Therefore, visual inspection of the pavement was conducted to identify distress types such as cracks and potholes. An ultrasonic sensor was installed to measure vertical distance variations along the pavement surface. Secondly, each database employed in this research was analyzed, and in all, 401 samples were separately inspected. Therefore, the collected distress data were input into software to calculate PCI values for each sample and the IRI data were processed using software algorithms to calculate their values. The third step in this study was to develop a GEP method that can be utilized to forecast the PCI value for pavement sections using IRI values. This method was used because of the procedure using numerous firm input variables (distress type and severity), which makes the improvement of traditional statistical models impractical. Finally, the GEP model’s performance was assessed by comparing the model with other linear regression models.
Figure 2 presents a flowchart to summarize the methodology of the current study.
4. Data Collection
This study used a total of 401 samples. This data was collected from urban roads located in the city of Al-Basra, Iraq. During the on-site assessment, a systematic approach was used for data collection. A continuous video of the entire street was recorded while maintaining a constant driving speed. This video documentation served as a crucial reference for determining the precise length of each section and sample. Then, within each section, multiple samples were identified for detailed evaluation. These samples represented specific segments of the pavement where distresses such as cracks, potholes, and rutting were observed. The distribution and severity of distresses were organized in an Excel sheet and then all the data were transferred to Paver 5.2 software, allowing for the calculation of PCI percentages for each section and sample.
For PCI calculations, field data collection was conducted by inspectors who visually examined pavement surface conditions, considering distress type, severity, and extent. The current study utilized a PAVER system for distress data collection, which included specific guidelines for distress classification and quantification of severity and extent in designated measurement units (area, length, or number) based on the distress type [
34]. Detailed descriptions of the 19 distress types implemented in this PAVER system, along with the corresponding guidelines, are reported by Shahin (1994) [
12]. The pavement sections were evaluated using a PCI rating system. Additionally, the identified distress types, severity, and density for the study roads were assessed using Micro-PAVER Version 5.2 software, and a database for the corresponding PCI deduct values was created. Subsequently, the software was used to calculate the total and corrected deductive values and thus determine the PCI for the sample units along each road section.
After completing the PCI assessment, the road’s condition was further evaluated using the IRI. For the data collection for the IRI evaluation, this assessment involved the use of an ultrasonic sensor placed on a vehicle which is a sophisticated device capable of measuring the vertical distance between the ground and the sensor. This distance measurement is crucial for determining the roughness of the pavement surface. The process began by finding the mode vertical distance for each section, representing the most frequently occurring vertical distance within that specific segment. This mode distance served as a reference point, reflecting the typical roughness characteristics experienced by vehicle traveling along that section. Next, each measured vertical distance was subtracted from the mode distance, capturing the deviations or irregularities in pavement smoothness, providing a detailed profile of its roughness. The data obtained from the ultrasonic sensor were then processed using specialized software designed for IRI calculations. This software analyzed the evaluation data collected by the sensor, computing the IRI for different sections of the roads under study. The calculated IRI values for each section complemented the PCI assessment by offering additional valuable insights into the ride quality and comfort for road users.
Table 1 shows a sample of the collected PCI and IRI points.
To clarify the validation approach, the data was split into 80-20, where 80% of the data was used for training and 20% was reserved as an independent validation set. The validation set was separate from the training data and was not used during the model development or parameter tuning process.
5. Gene Expression Programming (GEP)
GP emerged as a groundbreaking computational approach introduced by John Koza in 1988. The methodology applies evolutionary principles to automatically generate computer programs that solve specific problems. At its core, GP leverages artificial intelligence to develop programs through a process that mirrors biological evolution [
35]. While GP evolved from genetic algorithms (GAs), these two evolutionary computation methods differ fundamentally in their representation of solutions. GAs encode solutions as fixed-length numerical strings, comparable to chromosomes. In contrast, GP employs a more flexible tree-structured representation using programming language constructs [
36]. This tree-based architecture allows GP to work with variable-sized solutions of different shapes, making it particularly adaptable for prediction tasks. The flexibility of GP’s variable-length tree structures, compared to GA’s rigid binary strings, enables it to tackle a broader range of problems. Although GP shares hierarchical problem-solving characteristics with GAs, its unique feature lies in its ability to autonomously search for optimized solutions through program evolution. This self-directed optimization process distinguishes GP as a powerful tool in computational problem-solving [
37,
38].
The core phases of the gene expression algorithm (GEA) follow a systematic progression. Initially, chromosomes are randomly generated for a specified population of individuals. These chromosomes undergo expression, followed by fitness evaluation against predetermined test cases (the selection environment, which serves as problem input). Individual selection occurs based on fitness performance within the given environment, enabling reproduction with modifications that generate offspring with novel characteristics. These new individuals undergo identical developmental cycles: genome expression, selection environment evaluation, selection processes, and modified reproduction. This iterative process continues for predetermined generations or until satisfactory solutions emerge. Unlike biological cellular gene expressions, GEP’s gene expression mechanism operates with relative simplicity. The methodology relies on two primary elements: chromosomes and expression trees, where expression trees represent the decoded manifestation of genetic data stored within chromosomes. The decoding procedure that transforms chromosomes into expression trees is termed translation, which necessitates both a coding framework and governing principles. The coding framework maintains simplicity through direct correspondence between chromosome symbols and their associated functions and terminals. The governing principles are equally straightforward, establishing the spatial arrangement of functions and terminals within expression trees and defining interactions among sub-expression trees in multi-gene architectures. Consequently, GEP operates with two distinct languages: the chromosomal language and the expression tree language, where understanding either structure allows complete inference of the other. In biological systems, while protein sequence prediction from gene sequences (and vice versa) is feasible, the mechanisms governing protein folding remain largely unknown. Protein gene expression achieves completion only through proper folding, as amino acid sequences transform into functional proteins solely when correctly folded into their native three-dimensional configurations [
39].
In addition, GEP differs fundamentally from traditional genetic programming (GP) in its dual representation approach. While conventional GP directly manipulates tree structures during genetic operations, GEP employs a linear chromosome representation that encodes the genetic information, which is then translated into expression trees for evaluation. This separation allows GEP to perform genetic operations on the simpler linear chromosome structure while maintaining the computational power of tree-based expressions. The linear encoding in GEP ensures that all genetic operations (crossover, mutation, transposition) always produce valid expressions, eliminating the syntactic constraints that often limit GP operations. Additionally, GEP’s fixed-length chromosome structure provides more predictable genetic manipulation compared to GP’s variable-length tree structures, resulting in more efficient evolution and better preservation of genetic diversity throughout the evolutionary process.
The GEP methodology employs dual representational systems for solution expression: genetic sequences and ET. These systems maintain bidirectional convertibility through the Karva language, allowing seamless translation between genetic codes and their corresponding tree structures [
40]. The fundamental computational units, chromosomes, comprise one or more genetic segments that represent mathematical functions. Each genetic segment exhibits a binary structure: an initial portion that accommodates both operational functions and terminal elements, followed by a secondary portion restricted to terminal components (consisting of variables and constant values). The integration of multiple genetic segments occurs through mathematical operators, including basic arithmetic functions such as addition, subtraction, multiplication, and division, which serve as connective elements in the broader computational framework [
41].
Creating a functional GEP model requires configuring multiple key parameters and components. The process encompasses determining appropriate fitness criteria, establishing terminal elements, and selecting functional operators for chromosome construction. Additional configuration requirements include specifying the head length of chromosomes, determining the optimal number of genetic components, choosing suitable linking mechanisms between components, and establishing genetic modification parameters with their corresponding frequencies. The model’s development process relies on empirical data to generate mathematical relationships, particularly in scenarios where theoretical frameworks are not readily available [
22].
5.1. Model Development
The research utilized GeneXproTools 5.0 software for model development [
42]. Multiple GEP models were constructed by adjusting various parameters including gene count, chromosome structures, head size dimensions, and linking function types to achieve optimal prediction accuracy.
On the other hand, a more comprehensive approach should incorporate multiple validation strategies to thoroughly assess model robustness. Cross-validation techniques like k-fold cross-validation provide more reliable performance estimates by repeatedly training and testing on different data subsets, while stratified variants ensure balanced representation across classes. For temporal data, time series cross-validation maintains chronological order to prevent data leakage. Beyond traditional splitting, domain-based validation approaches like domain adaptation testing and transfer learning evaluation assess how well models generalize across different but related datasets or tasks. Advanced techniques include bootstrap validation for confidence interval estimation, adversarial validation for robustness testing, and out-of-distribution testing to understand generalization limits. K-fold cross-validation splits your data into k equal parts, using each fold as validation while training on the remaining k − 1 folds, while domain adaptation addresses the challenge of training a model on one data distribution and applying it to a related but different data distribution [
43,
44,
45]. In addition, the 80/20 training-validation split holds particular importance in gene expression prediction models due to several critical factors that directly impact prediction accuracy. In gene expression modeling, where complex transcriptional regulatory networks must be captured from sequence data, empirical studies show that the best results are obtained if the amount of data used for testing ranges from 20 to 30%, with the remaining 70 to 80% of the data being used for training. This ratio becomes especially crucial in genomic applications because gene expression datasets often involve high-dimensional feature spaces with thousands of genes and regulatory elements, requiring substantial training data to adequately learn the intricate relationships between DNA sequences and expression levels. Research has discovered that the optimal proportion of cases for the training set tended to be in the range of 40% to 80% for high-dimensional classifiers, with 80/20 representing the upper bound that maximizes learning while preserving sufficient validation data. The 80% training allocation provides enough examples for capturing the complex combinatorial logic of transcriptional regulation, including promoter-enhancer interactions and transcription factor binding patterns, while the 20% validation allocation offers adequate statistical power to detect overfitting and assess generalization to unseen genomic sequences. A commonly used ratio is 80:20, which means 80% of the data is for training and 20% for testing, and this standard has proven particularly effective in gene expression prediction where increasing information flow between distal elements is a promising path to increase predictive accuracy. This balanced approach ensures sufficient model complexity learning while maintaining robust validation for the intricate regulatory patterns inherent in gene expression systems [
46,
47,
48,
49].
Prior to applying the Genetic Expression Programming (GEP) methodology, outlier detection was performed using the interquartile range (IQR) approach. Values positioned beyond the boundaries of Q1 − 1.5 × IQR and Q3 + 1.5 × IQR were identified as anomalous data points, with Q1 and Q3 corresponding to the 25th and 75th percentiles of the dataset, respectively. The dataset consisted of 401 paired observations for both the PCI (input variable) and IRI (output variable). The PCI values had a median of 50.10 and an interquartile range IQR of 45.90 (Q1 = 28.10, Q3 = 74.00). The IRI values exhibited a broader distribution with a median of 72.00 and an interquartile range IQR of 63.00 (Q1 = 37.00, Q3 = 100.00). Using the IQR method for outlier detection, the established bounds were −40.75 to 142.85 for the PCI and −57.50 to 194.50 for the IRI. Remarkably, the analysis revealed no outliers in either variable, indicating that all data points fell within the acceptable range of 1.5 times the IQR beyond the first and third quartiles. This finding suggests that the dataset exhibits consistent characteristics without extreme values that could potentially bias the GEP modeling process.
For the data distribution methodology, the dataset was partitioned with 80% designated for training purposes and the remaining 20% allocated to validation tasks. This distribution ratio was selected to ensure robust model training while maintaining sufficient data for validation and assessment of model generalization capabilities. Through iterative testing and parameter optimization, various GEP models were evaluated to determine the most effective configuration. The final parameter settings that produced the best fit with the experimental data are detailed in
Table 2. These optimal parameters were identified through extensive testing of different combinations to maximize model performance against the experimental dataset.
The key insight is that GEP’s symbolic regression approach captures the underlying biological logic of gene regulation more effectively than purely numerical methods, leading to superior generalization on new genomic sequences. This explains why GEP’s relative ranking improves from training to validation—it is learning transferable biological principles rather than dataset-specific patterns.
GEP validation performance stems from its unique ability to discover non-linear mathematical expressions that represent actual gene regulatory mechanisms through symbolic regression [
39]. Unlike traditional regression models that fit predetermined mathematical forms, GEP evolves interpretable expressions that can be directly related to known biological processes such as transcriptional activation, repression, and cooperative binding effects [
50]. Furthermore, the testing of model stability can be achieved by applying GEP to completely independent datasets and observed consistent performance, indicating that the model captures transferable biological principles rather than dataset-specific noise [
51]. The combination of mathematical interpretability, cross-validation consistency, and biological relevance of the evolved expressions provides strong evidence that GEP’s performance advantage reflects genuine learning of non-linear gene regulatory relationships rather than overfitting to validation set noise.
From a statistical modeling standpoint, a dataset containing 401 samples for gene expression prediction offers a balanced foundation with both advantages and constraints that require comprehensive assessment across multiple statistical criteria. While high-quality datasets can yield meaningful results even with smaller sample sizes, the 401-sample dataset positioned within the acceptable range for genomic machine learning applications provides moderate statistical power. The appropriateness of this sample size is contingent upon various determinants, including the computational complexity of the predictive model, the dimensionality of the feature space (number of genes analyzed), and the magnitude of biological effects being detected. Within the context of high-dimensional genomic and imaging data, established guidelines indicate that effective sample sizes typically range from 100 to 10,000 specimens. Although high-dimensional datasets with relatively modest sample sizes remain valuable for biomarker discovery and preliminary research phases, they inherently carry the risk of generating biased machine learning performance metrics, necessitating careful validation strategies to ensure reliable model generalization and statistical inference.
5.2. Development of the PCI Model
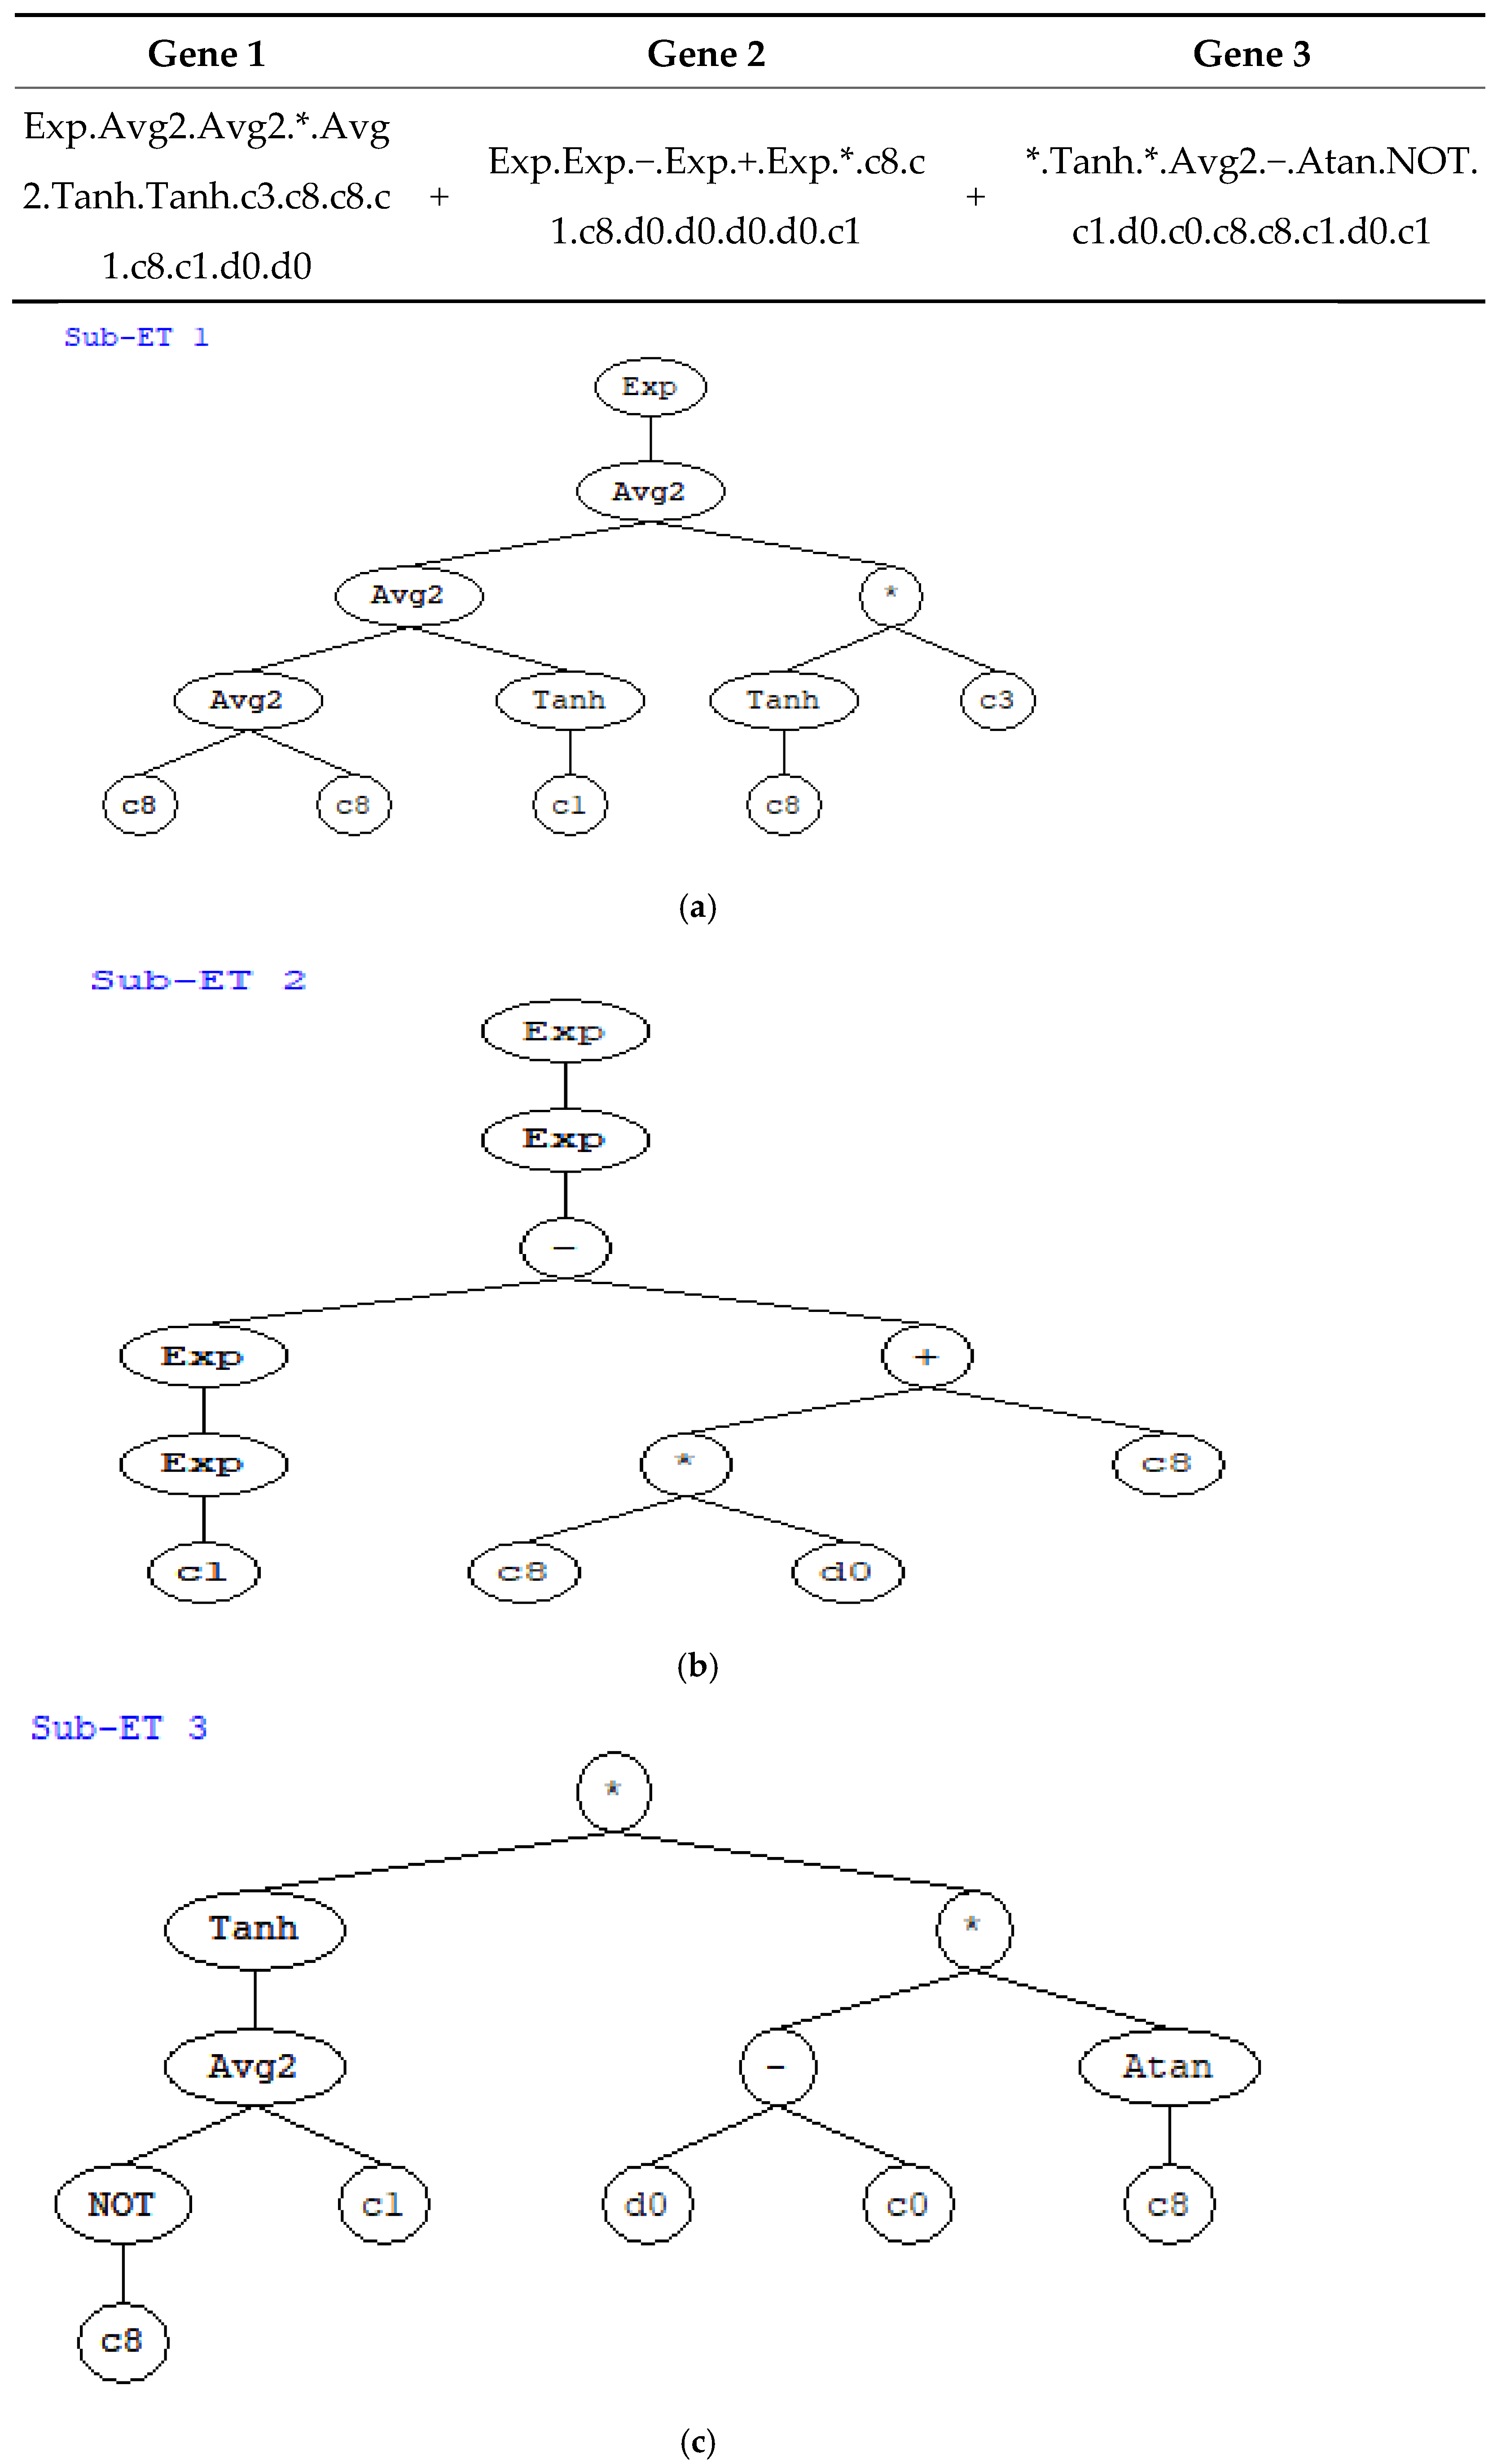
Initial development focused on creating a streamlined GEP model using a single gene structure to forecast PCI values. The model’s foundation relied on the IRI as the primary input parameter, which research indicated was the dominant factor influencing PCI outcomes. The architectural representation of this GEP model is depicted in
Figure 3, where the expression tree demonstrates the relationship between variables. Within this structure, the IRI parameter is denoted as d0, while numerical constants are represented by c0 through c9, with their corresponding values listed in
Table 2. The final mathematical formulation can be derived from the ET’s structure, which incorporates three distinct genetic components combined through additive relationships. The resulting mathematical expression encompasses these three interconnected genes, each contributing to the overall predictive capability of the model. The three genes are combined using addition (+) as the linking function to produce the final output. In addition, the asterisk (*) represents the multiplication operator. The expression would be evaluated from left to right, with each gene’s result being added to produce the final result. This appears to be a complex mathematical model that combines various mathematical functions to process the input variable d0 along with constants to produce a prediction or transformation of the data. The complete mathematical formulation can be expressed in Karva language as follows:
The symbols shown in
Figure 3 and
Table 2 in the Gene Expression Programming (GEP) formula represent mathematical functions that operate on the input variables and constants. Exp denotes the exponential function (e
x), which performs exponential transformation using Euler’s number. Avg2 represents the average function for two arguments, calculating the arithmetic mean of two input values, allowing the model to combine different sub-expressions or values. Tanh is the hyperbolic tangent function that maps any real number to a value between −1 and 1 using the formula tanh(x) = (e
x − e
(−x))/(e
x + e
(−x)), commonly used in machine learning as an activation function due to its smooth, bounded output. Within the GEP formula context, these functions serve as operators that process the IRI parameter (d0) and numerical constants (c0–c9) to create a complex mathematical expression. The GEP algorithm automatically evolved this combination of mathematical operators to capture non-linear relationships and perform sophisticated transformations, ultimately generating the most effective predictive model for this specific pavement condition dataset.
The methodology of GEP indeed generates several intermediate expressions during the evolutionary process, but these ultimately converge into a single, comprehensive mathematical model. The final mathematical formulation is derived from the expression tree’s (ET) structure, which integrates three distinct genetic components through additive operations. This unified mathematical expression incorporates all three interconnected genes, with each gene contributing specific predictive elements to the overall model capability. The three genetic components are linked using addition (+) as the connecting operator to generate the final output. The expression follows a left-to-right evaluation sequence, where each gene’s computational result is summed up to produce the ultimate prediction. This constitutes a single, albeit complex, mathematical model that combines various mathematical functions to process the input variable d0 alongside constants, ultimately producing a data prediction or transformation. Therefore, while multiple sub-expressions exist within the model structure, they collectively form one comprehensive predictive equation.
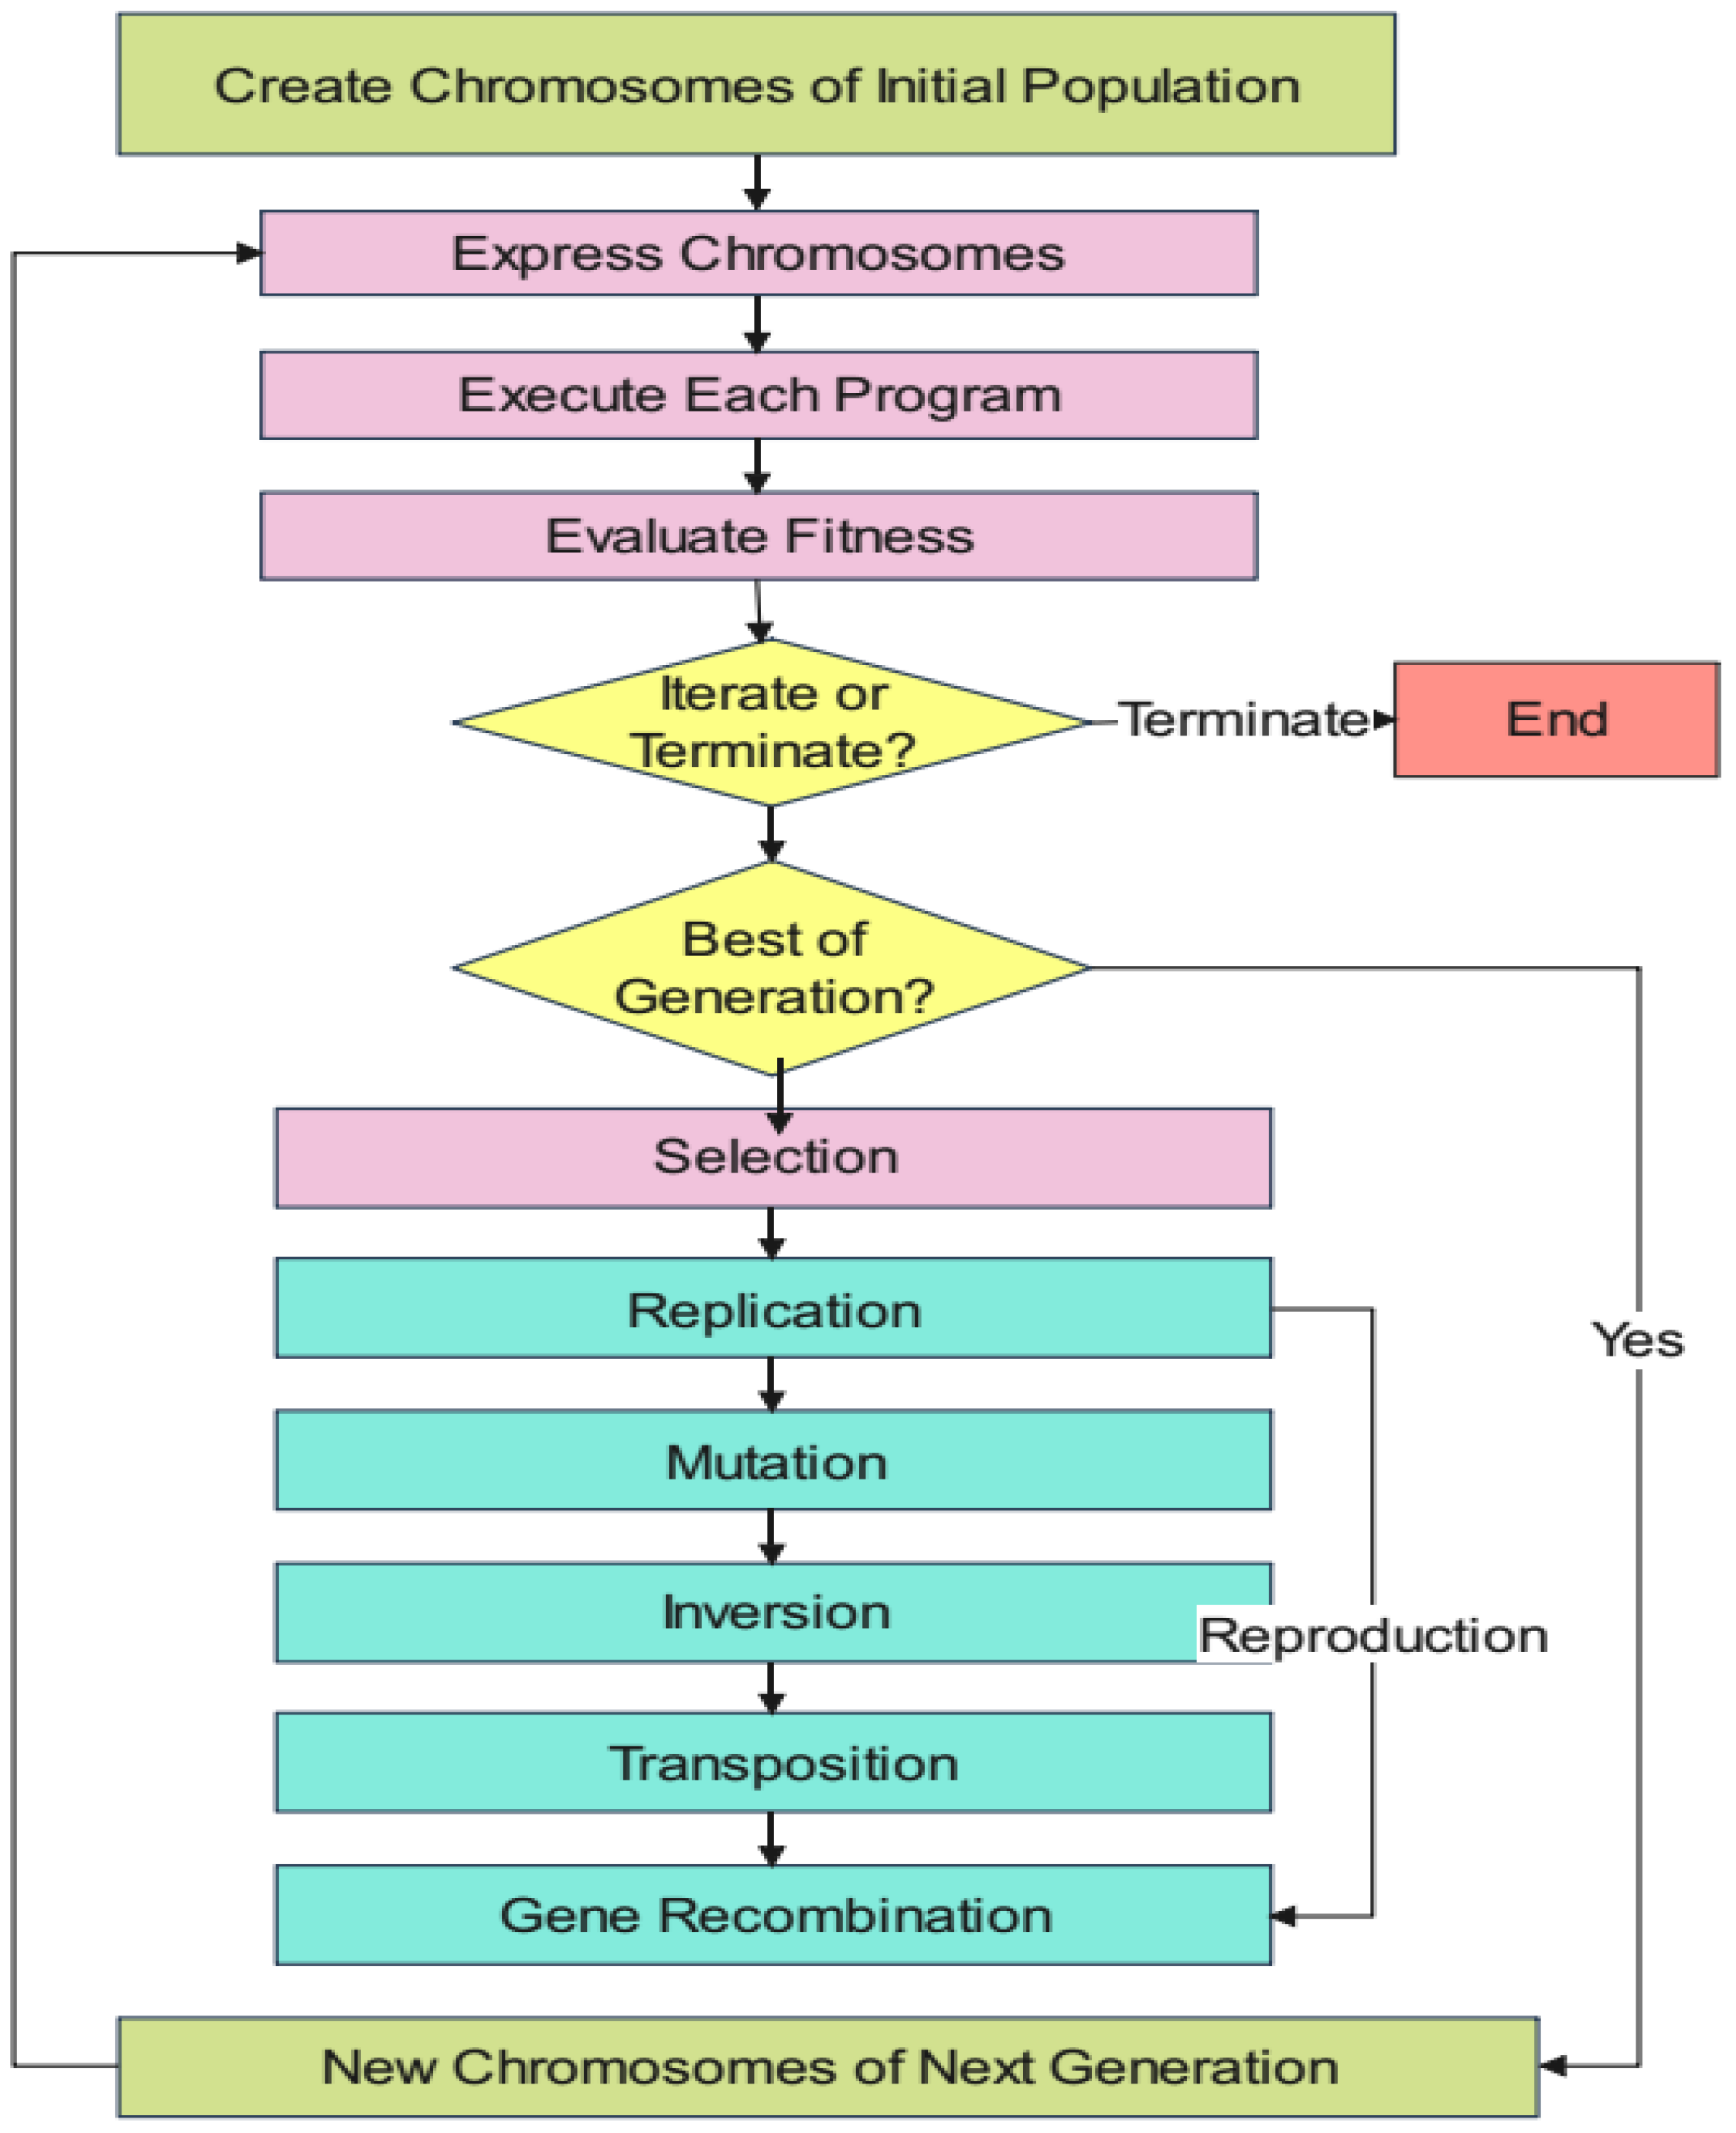
The development process for the GEP model is depicted through a series of sequential steps, presented visually in
Figure 4. It outlines the core components of the gene expression algorithm’s workflow. Initially, chromosomes are created at random for multiple individuals to establish the starting population. Next, these chromosomes undergo expression, followed by evaluating each individual’s fitness through specific test scenarios. Based on their performance, individuals are chosen for reproduction, which introduces modifications and creates offspring with distinct characteristics. These new specimens then undergo the same sequence: their genetic material is expressed, and they face environmental selection pressures, undergo selection, and reproduce with variations. This cycle continues either for a predetermined number of generations or until it reaches a satisfactory solution [
52].
6. Results and Discussion
6.1. Performance Measures of the GEP Model
The field of evolutionary computation finds valuable applications in symbolic regression, which seeks to discover mathematical expressions that can accurately predict numerical values. When evaluating these predictive models, researchers employ various performance metrics [
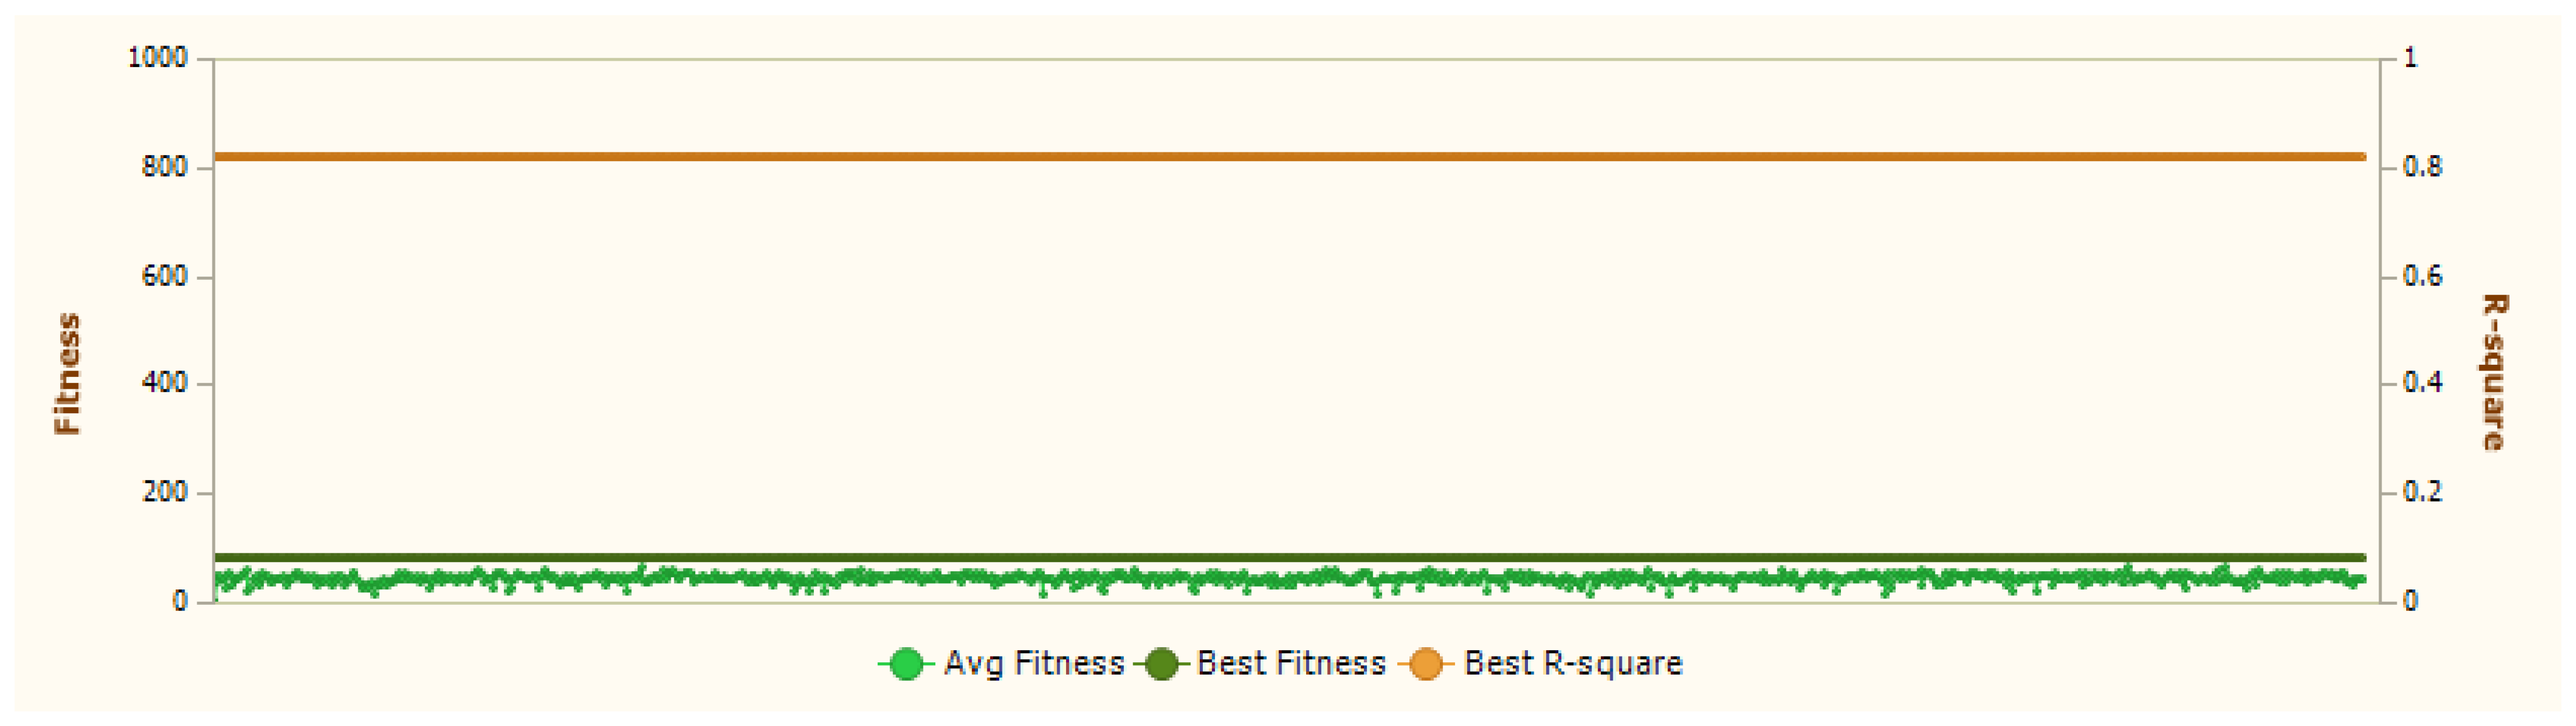
52]. These metrics generally fall into three categories: those measuring absolute differences between predictions and measured values, those focusing on relative errors, and those utilizing statistical correlation measures between predicted and target outcomes. The choice of which performance metric to use depends heavily on the specific characteristics of the problem being solved. However, certain standard evaluation methods like mean squared error and R-squared statistics have proven broadly applicable across many different scenarios, consistently helping to evolve effective predictive models. Through regression analysis, the model can be identified that most accurately captures relationships between variables by finding the optimal fitness score. In this particular study using GeneXpro, the analysis yielded a best fitness value of 58.41, as illustrated in
Figure 5.
Fitness in genetic programming represents a quantitative measure of how well the candidate mathematical model performs at solving the target regression problem, essentially quantifying how accurately a generated model predicts actual data values. In genetic programming systems like GeneXproTools, the algorithm begins by creating a diverse population of mathematical expressions, each representing a potential solution to the regression problem. These models are then evaluated against the dataset using a fitness function that typically incorporates correlation coefficients between predicted and actual values, error minimization metrics (inverse of MAE and RMSE), and complexity penalties to prevent overfitting. Models with superior fitness scores are preferentially selected for reproduction through genetic operators like crossover and mutation, creating successive generations of increasingly optimized mathematical expressions. This evolutionary process continues iteratively until convergence on the best possible solution. When the study reports a “best fitness value of 81.415,” as shown in
Figure 5, this indicates that among all generated mathematical models, one particular expression achieved this optimal score, representing the model that most accurately captured the underlying relationships between variables in the dataset. This fitness value reflects the algorithm’s success in evolving a mathematical expression that provides the optimal balance between predictive accuracy and model complexity, making it the final regression equation suitable for making predictions and understanding variable relationships within the specific research domain.
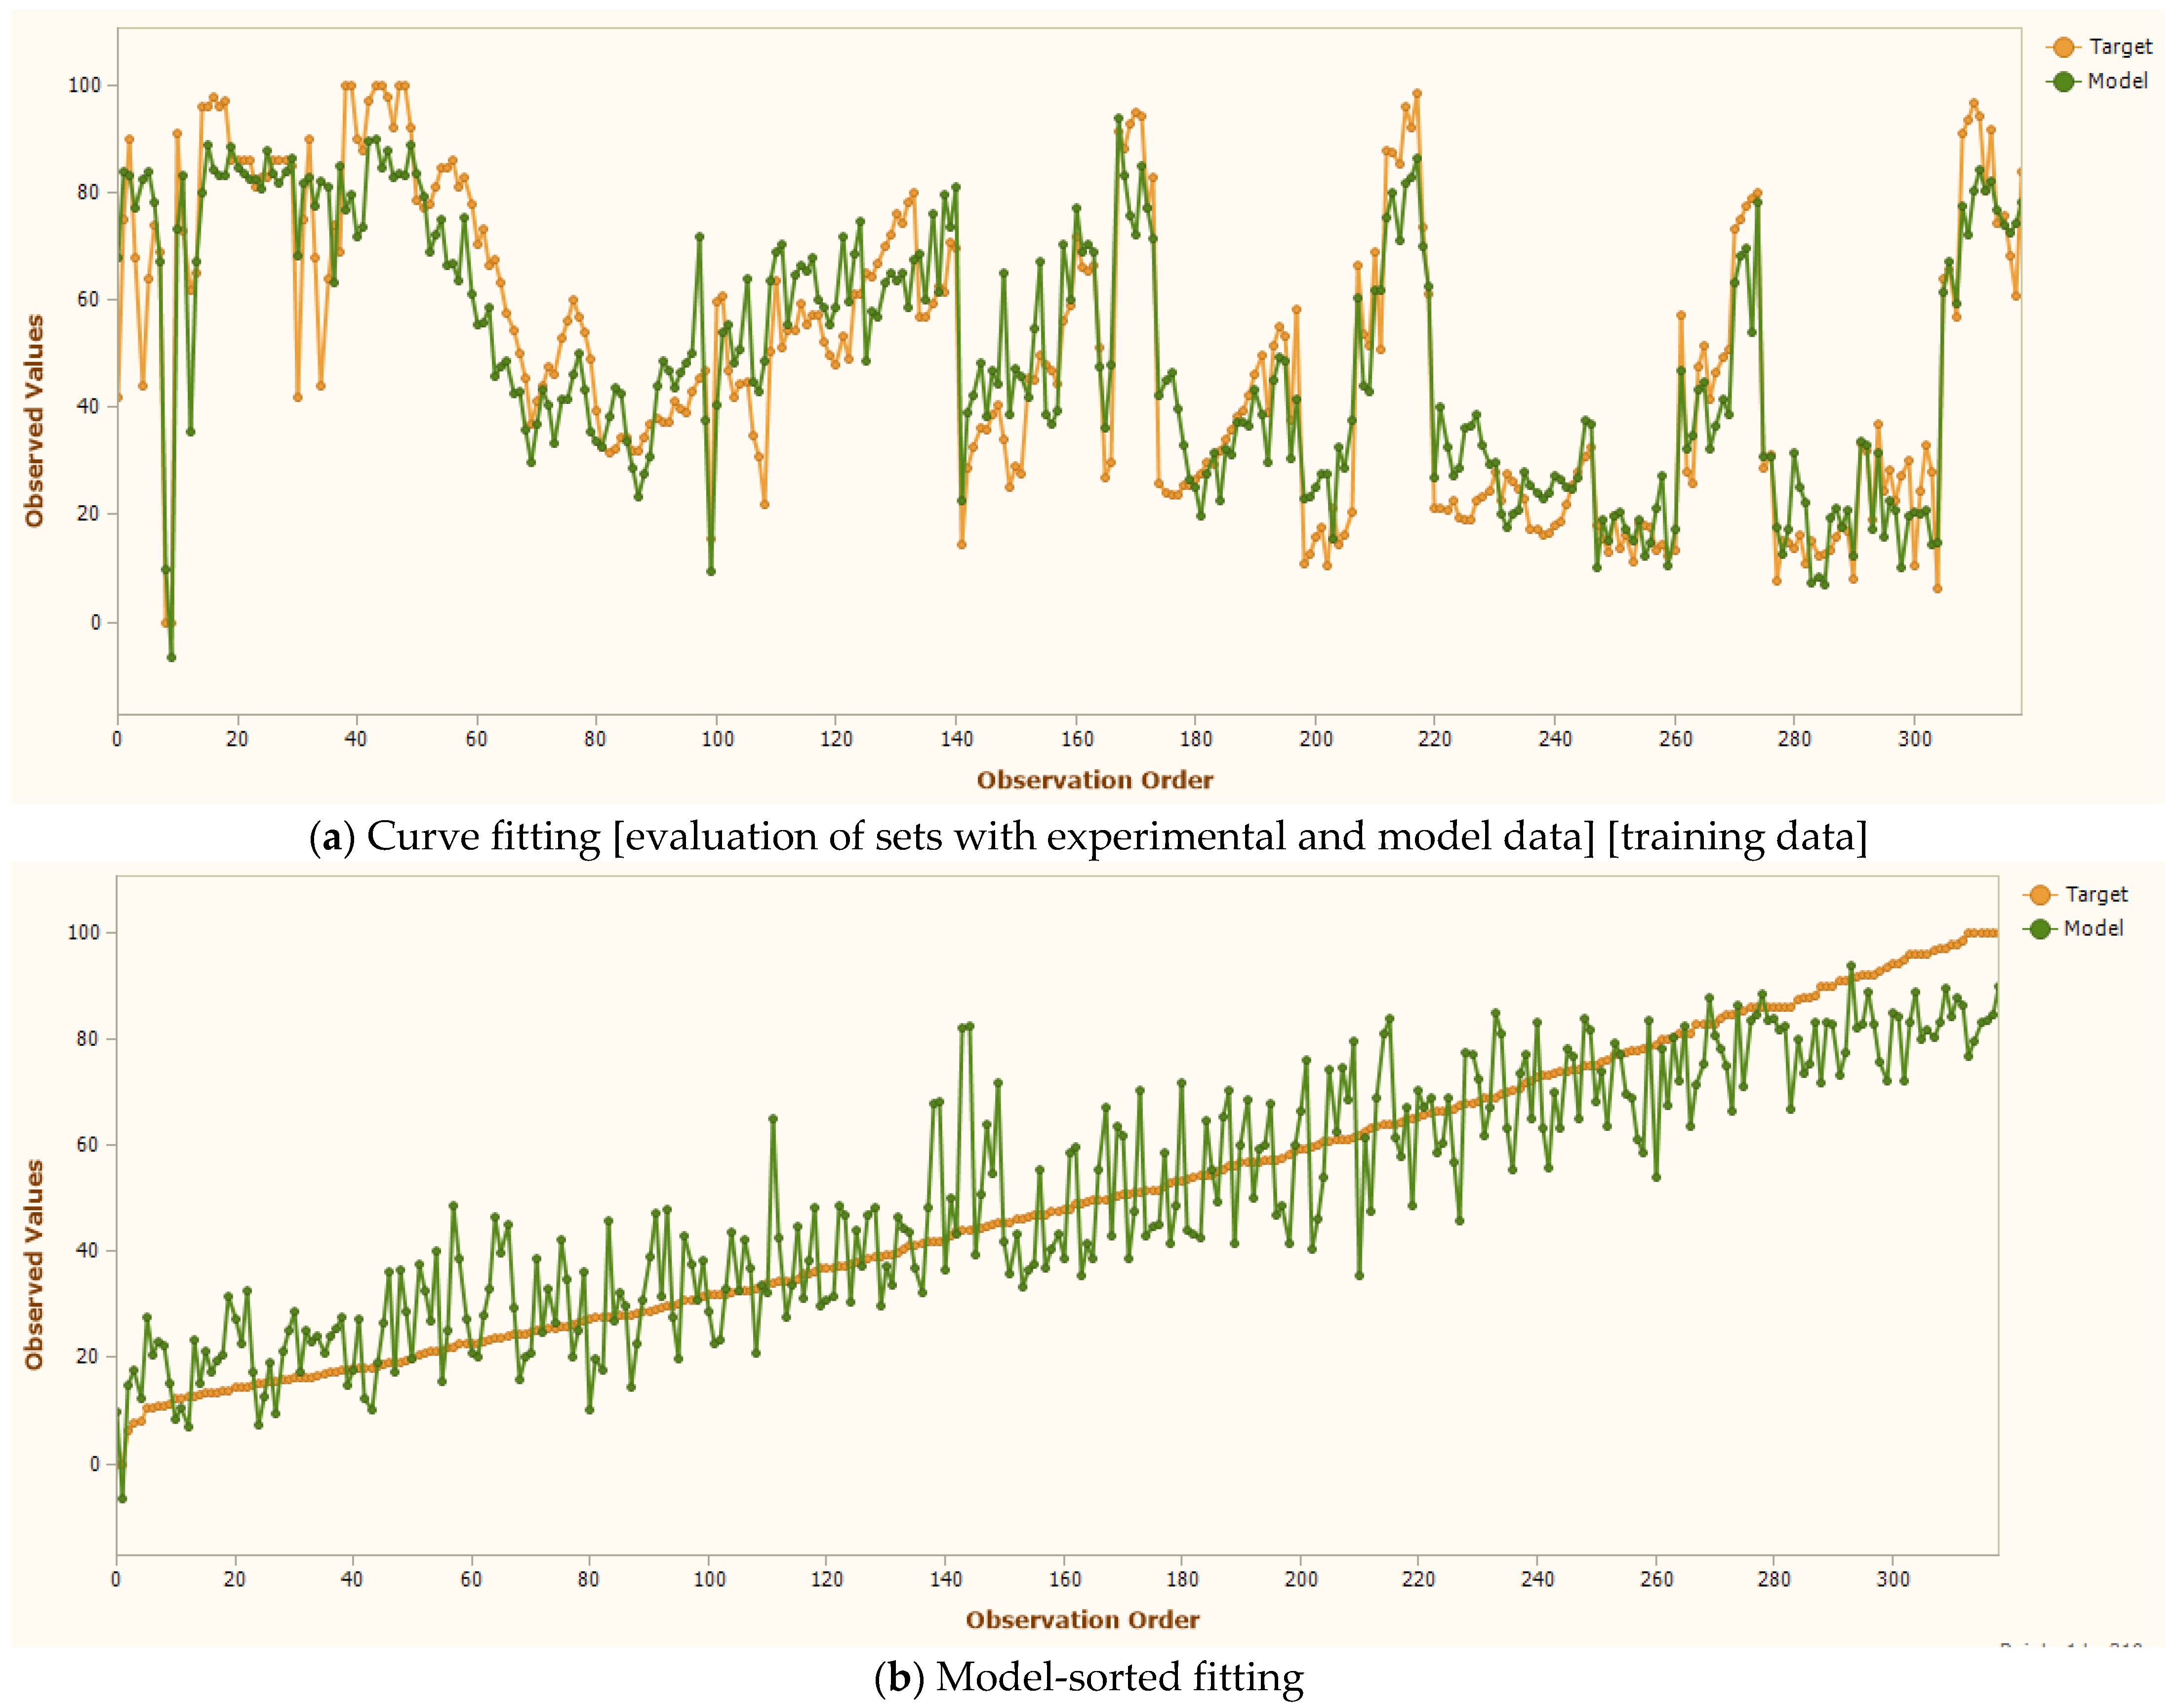
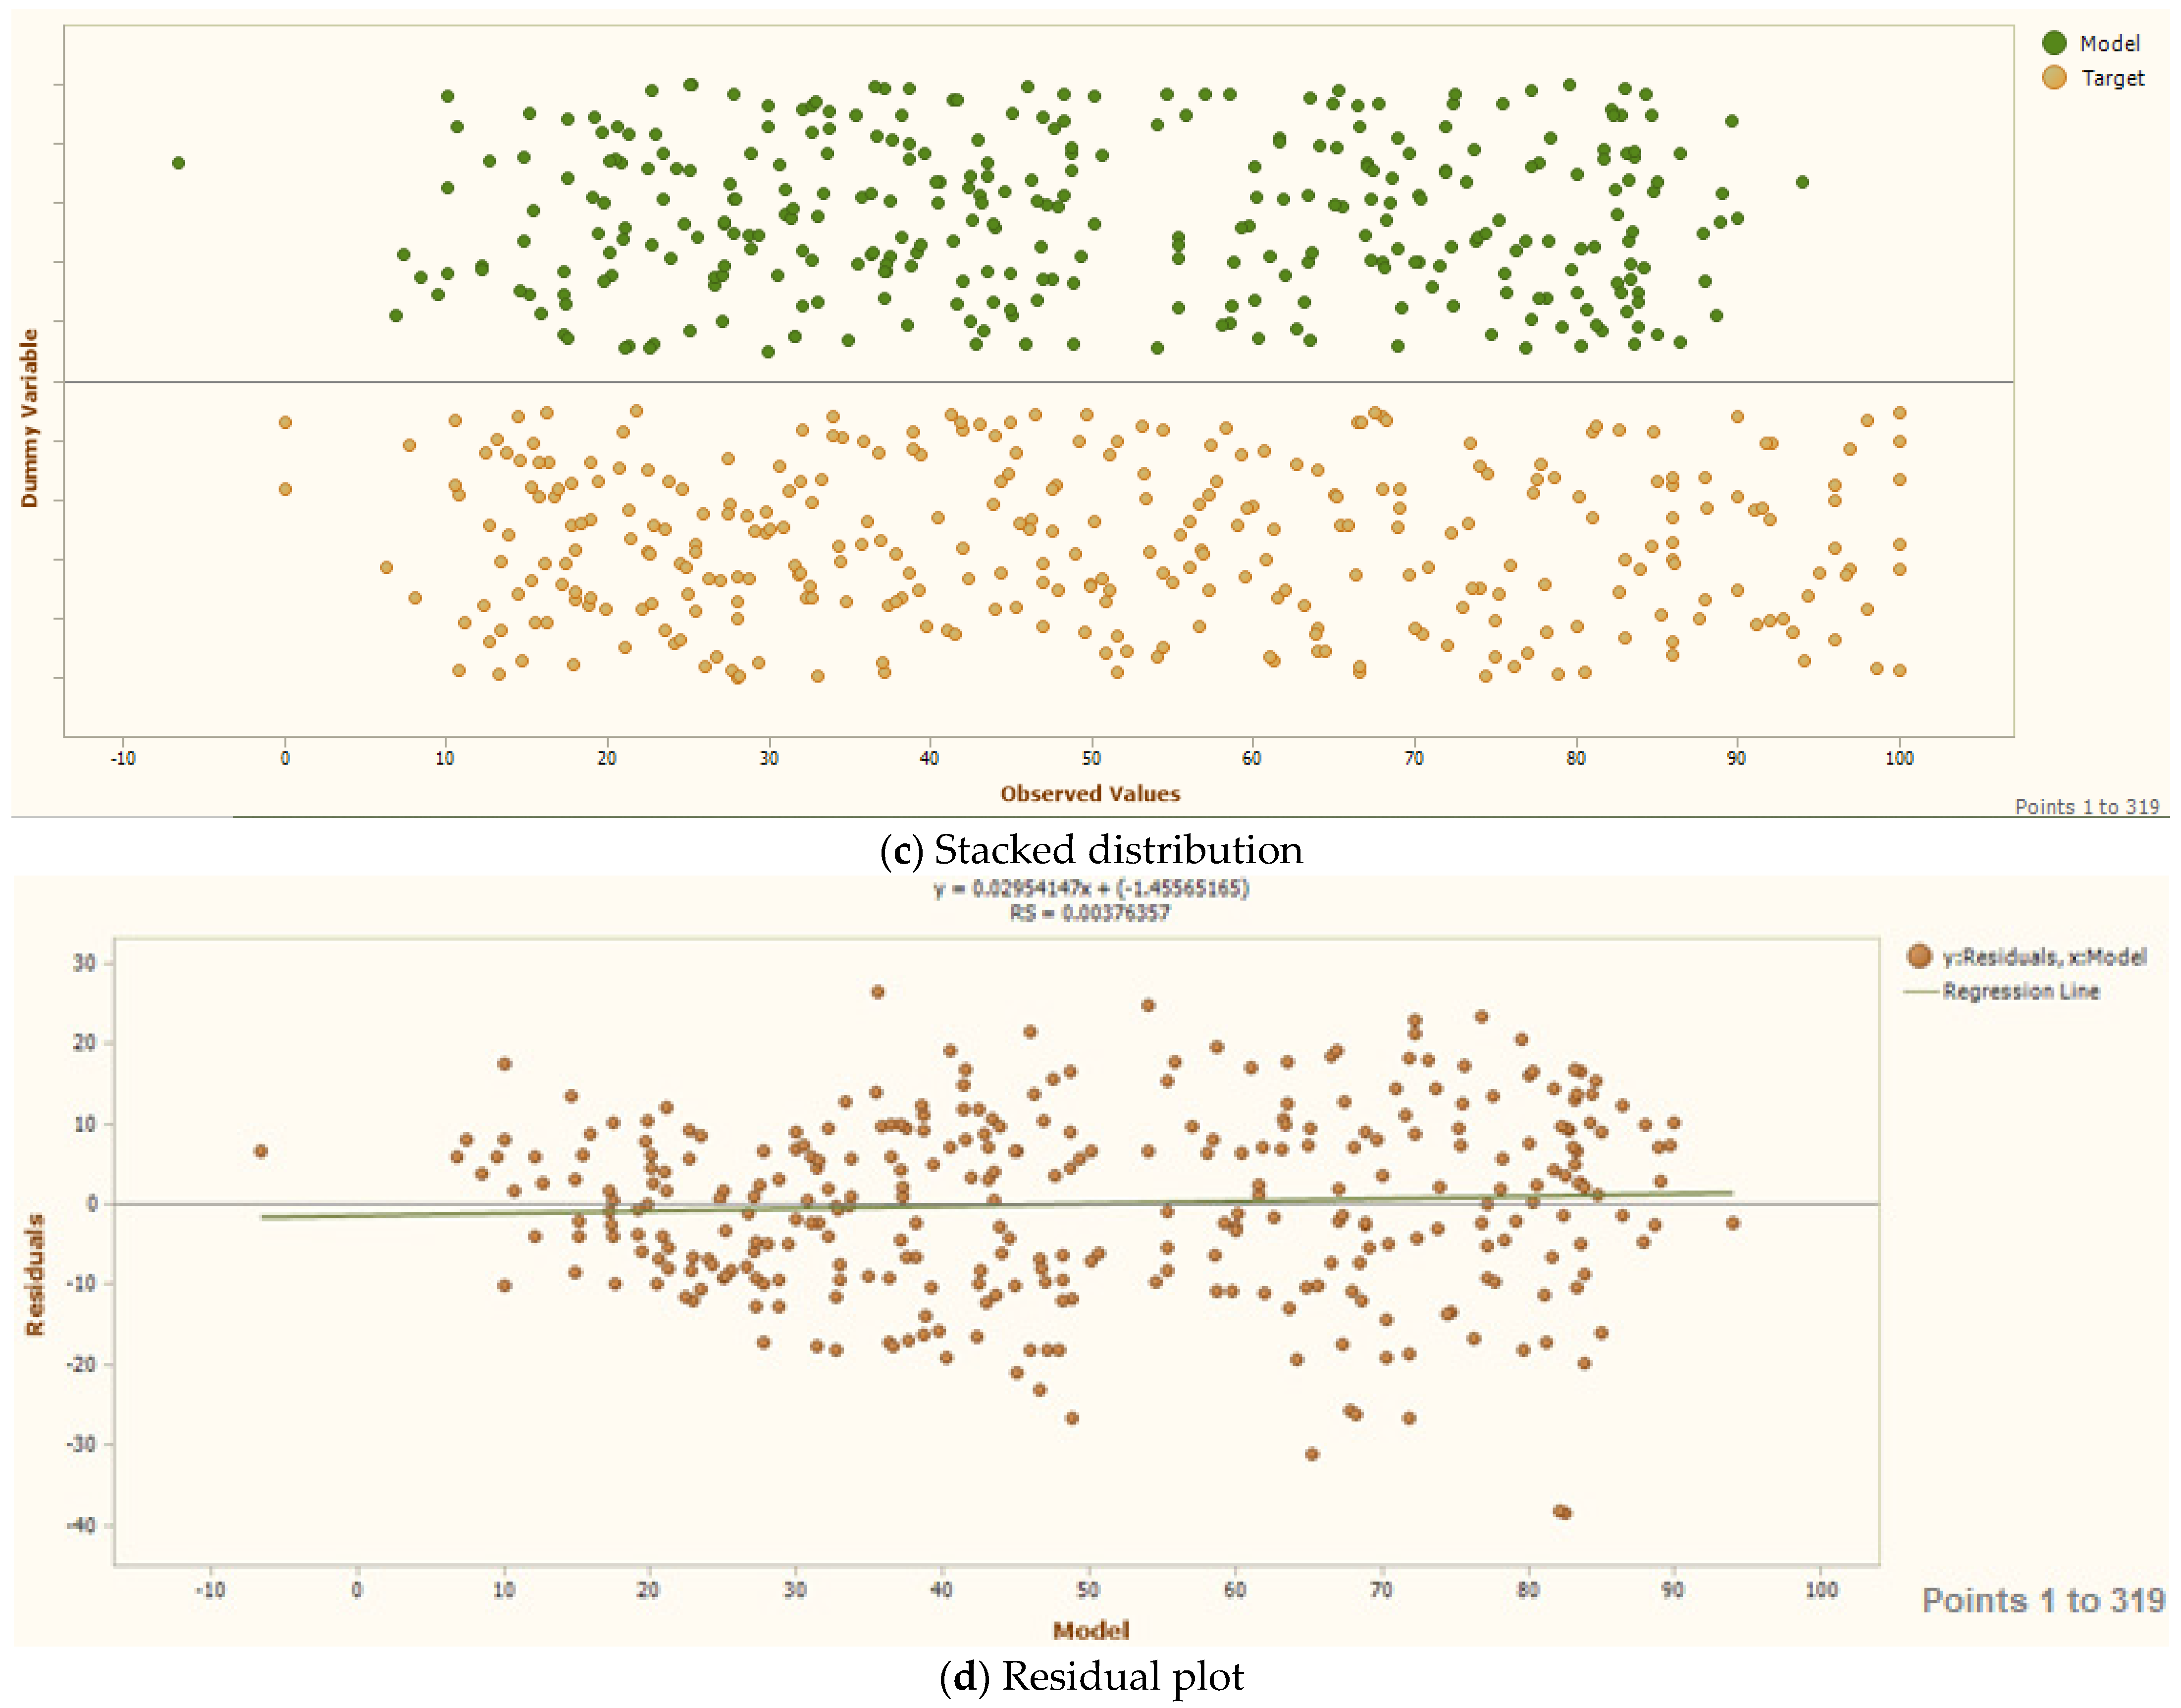
On the other hand,
Figure 6 displays the model’s sorted fitting analysis through three visualization components that examine the relationship between observed and predicted values, including observation ordering, stacked value distributions, and residual analysis plots. As shown in
Figure 6, the GEP model demonstrates remarkable capability in capturing data patterns and relationships. When analyzing its performance, the model shows superior fitting across both linear and non-linear datasets, achieving higher correlation coefficients (R values). This enhanced accuracy stems from GEP’s distinctive ability to process and integrate both linear and non-linear data patterns simultaneously within its computational framework. The model’s effectiveness is further enhanced by its two-step approach: first generating an expression tree to represent the relationships, then converting this complex structure into a simplified mathematical equation that can be easily understood and applied.
The statistical assessment of the PCI model was conducted using three primary performance metrics [the coefficient of determination (R
2), the MAE, and the RMSE, which are defined in Equations (1), (2), and (3), respectively] [
53,
54]. These metrics provided comprehensive insights into the model’s predictive capabilities across both training and validation datasets.
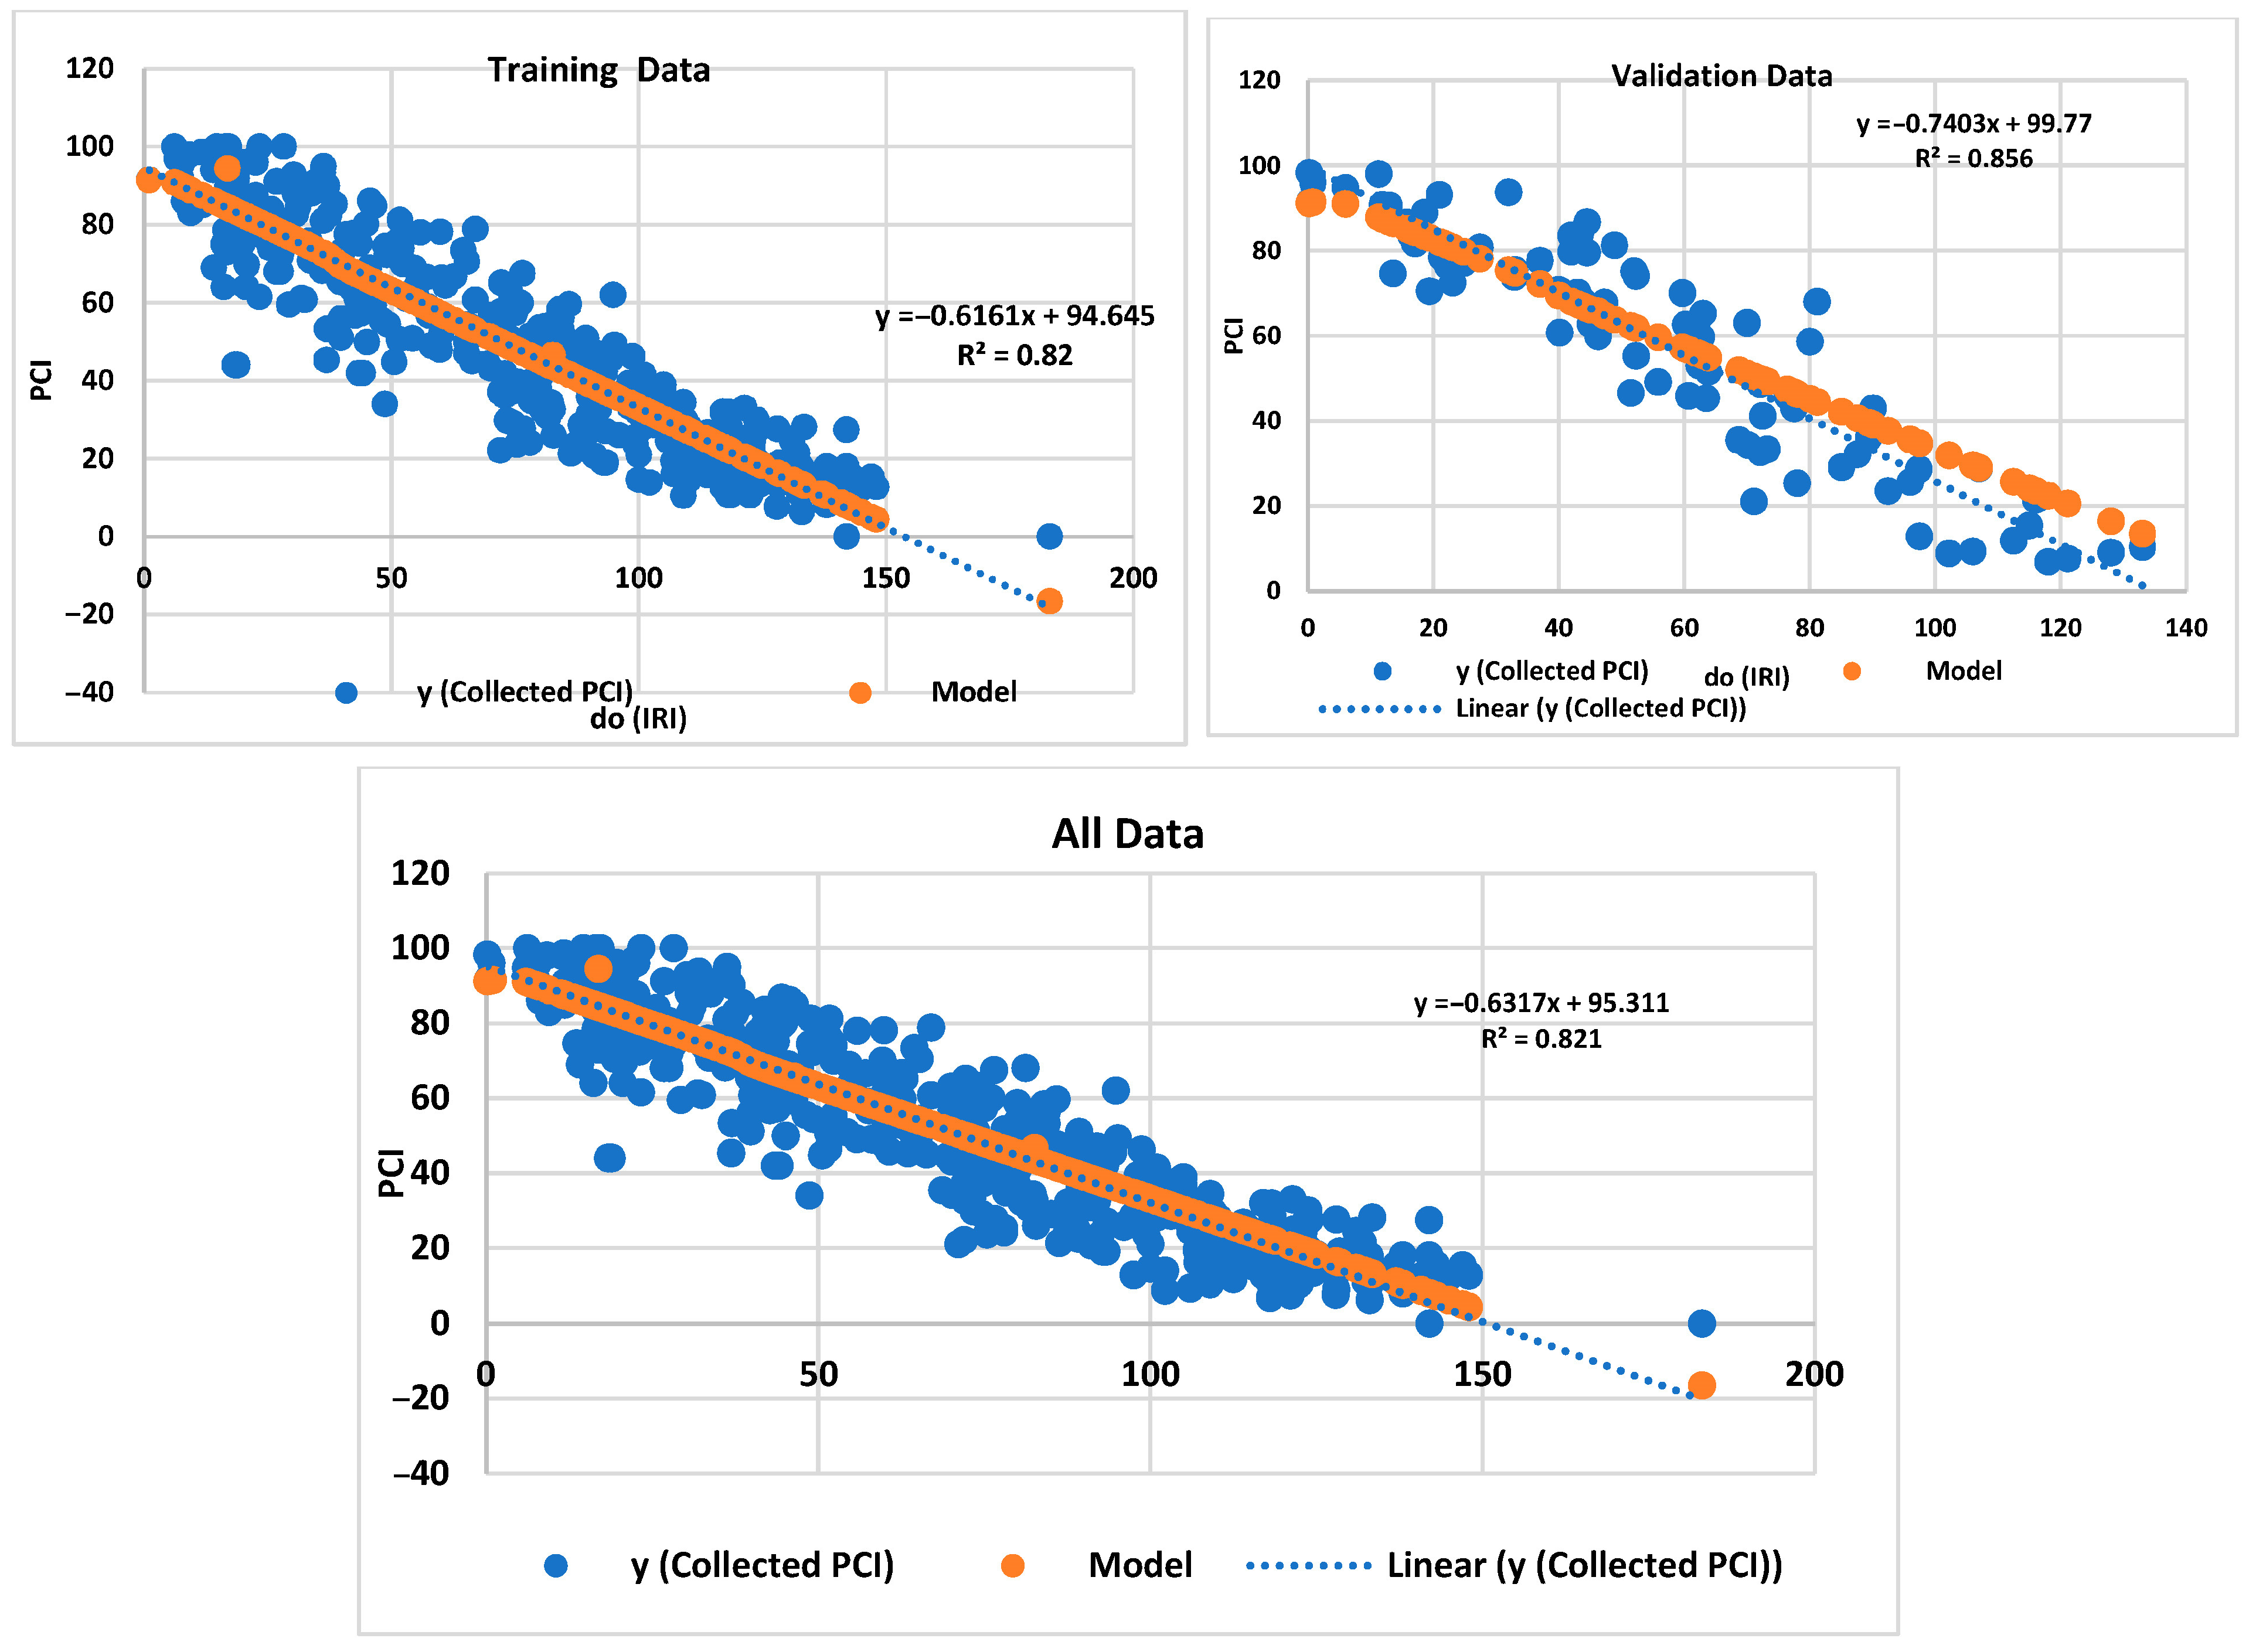
The GeneXpro model’s predictive accuracy for PCI was evaluated using multiple statistical indicators. The analysis encompassed three key metrics—the R
2, MAE, and RMSE—across training data, validation data, and the complete dataset as shown in
Table 3. The coefficient of determination (R
2) demonstrated strong model performance, with values of 0.821 and 0.856 for the training and validation sets, respectively, as shown in
Figure 7. This indicates that approximately 82–85% of the variance in the PCI values was effectively explained by the model. The overall R
2 value of 0.821 for the complete dataset further confirms the model’s robust predictive capability. On the other hand, the MAE analysis revealed average prediction deviations of 9.173 units for the training set and 8.828 units for the validation set. These MAE values suggest consistent prediction accuracy across both datasets, with slightly better performance in the validation phase. In addition, the RMSE evaluation showed values of 11.209 and 11.00 for the training and validation sets, respectively. These RMSE measures, being moderate relative to the data range, indicate reasonable prediction precision. The lower RMSE in the validation set compared to the training set suggests good model generalization without overfitting. Additional correlation analysis revealed strong positive relationships between predicted and measured values, with correlation coefficients of 0.906 for training and 0.926 for validation data. These high correlations further support the model’s effectiveness in capturing the underlying patterns in the PCI data. The relative absolute error (RAE) values were 0.403 and 0.387 for the training and validation sets, respectively, demonstrating acceptable error levels relative to the data scale.
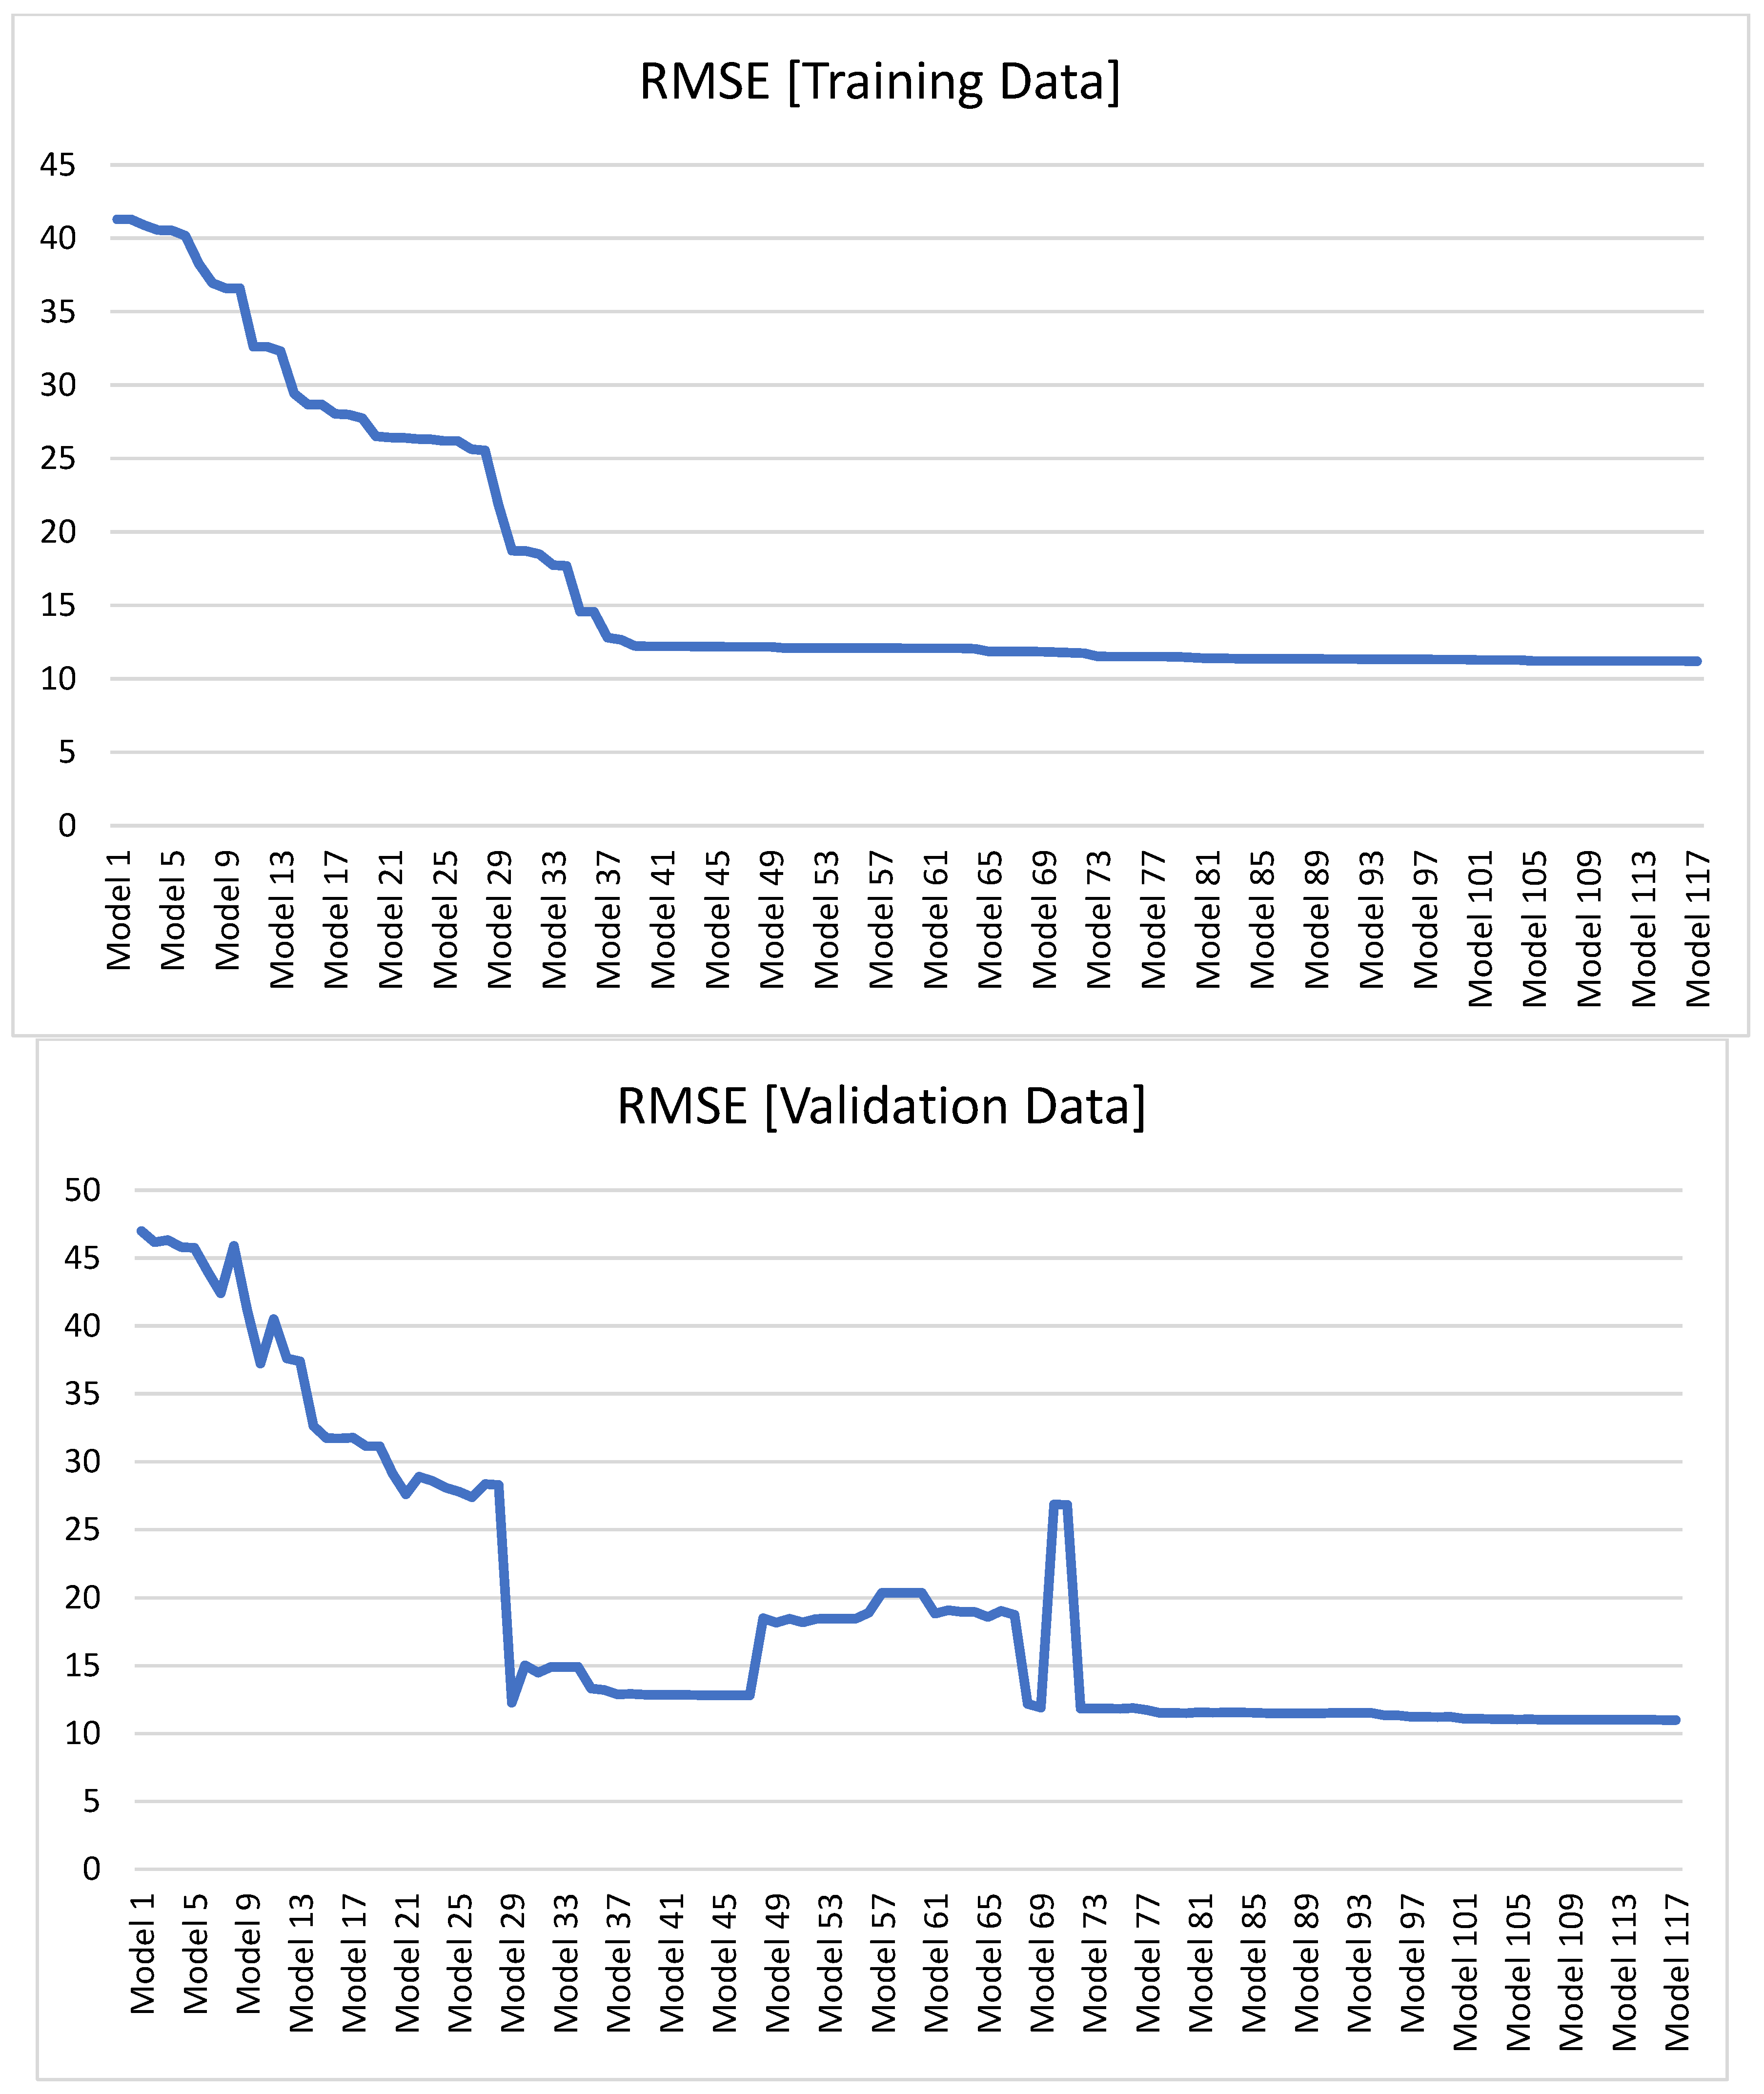
On the other hand,
Figure 8 illustrates the evolutionary convergence behavior of the GEP model by depicting the RMSE variation across successive generations for both training and validation datasets. The convergence analysis reveals that the RMSE values stabilize and reach a plateau approximately after generation 37, indicating that the model has achieved optimal fitness with minimal further improvement in both training and validation performance.
6.2. Comparison Between the PCI Predictions Using the GEP Model and Other Linear Regressio Models
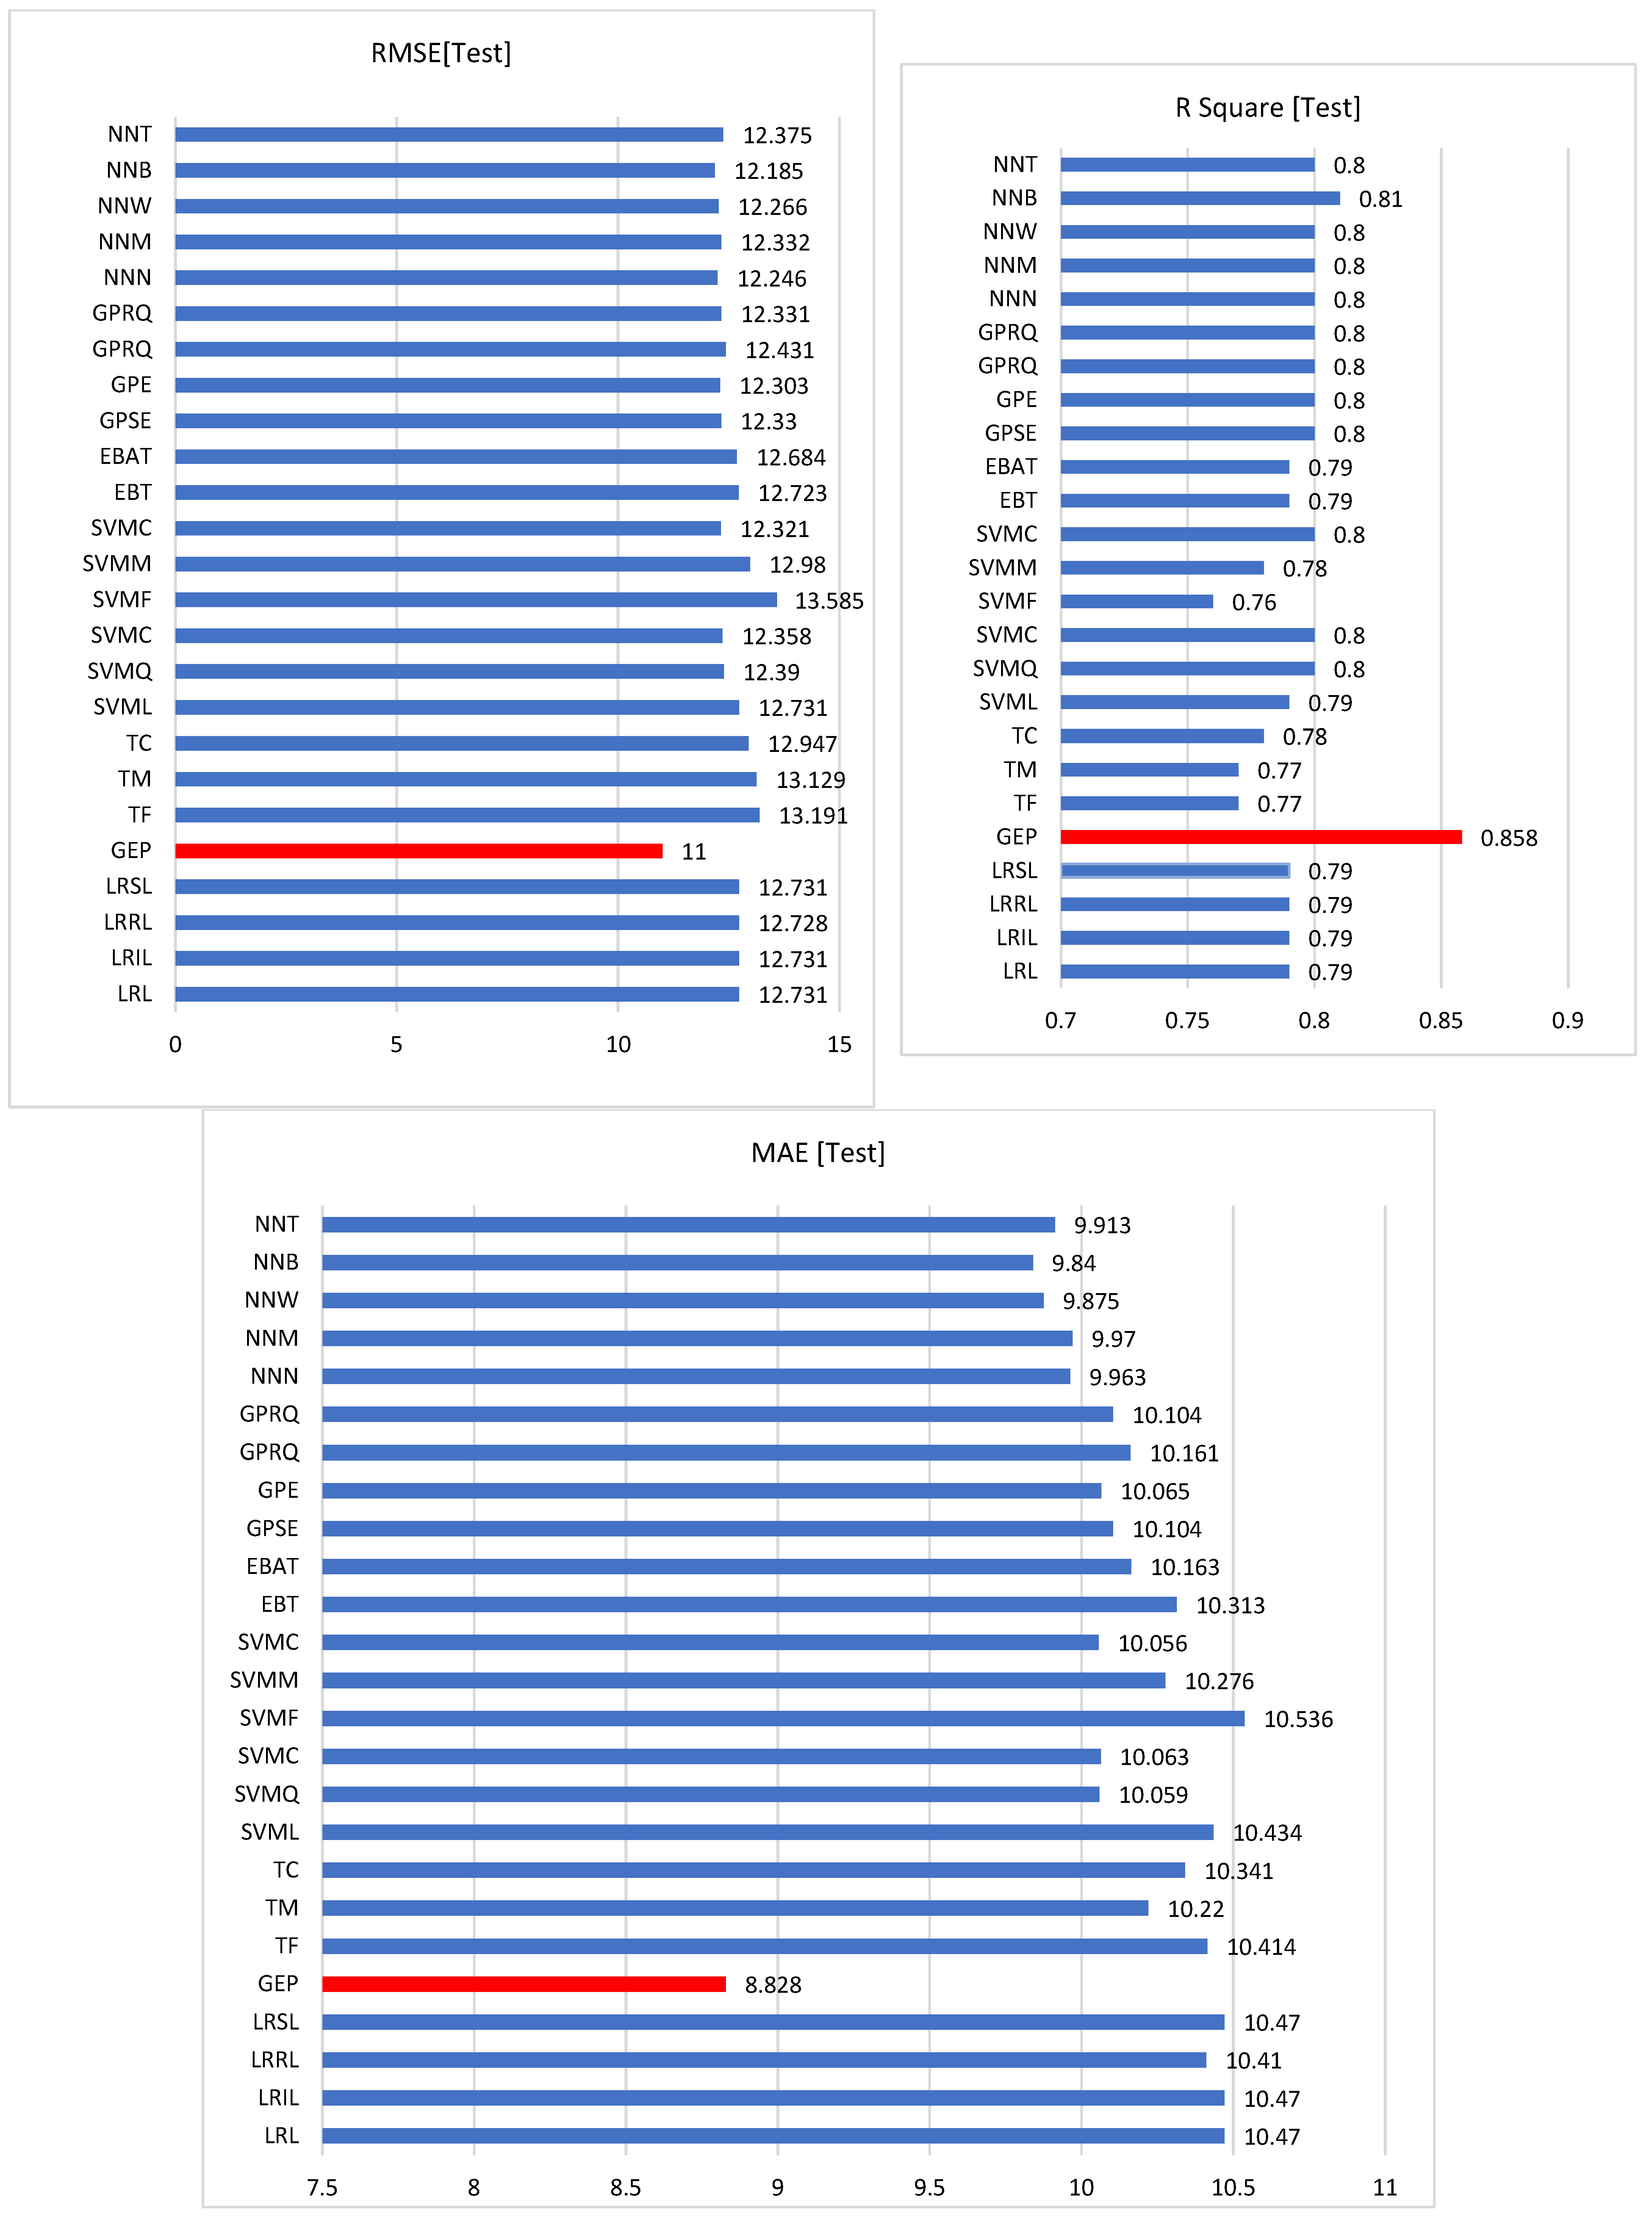
This research compares the performance of the developed GEP model against various regression methods to understand how differently these approaches predict PCI. The regression models selected for comparison can be classified into the following categories: linear regression models (ranging from simple linear to stepwise approaches) focus on finding linear relationships in data with varying levels of complexity and robustness. Tree models (Fine, Medium, and Coarse) create decision rules by splitting data into branches, with different granularities of decision boundaries. Support Vector Machine (SVM) models encompass both linear and non-linear kernels (linear, quadratic, cubic, and various Gaussian implementations) to find optimal hyperplanes for regression. Ensemble methods (Boosted trees, Bagged trees, and Squared Exponential GPR (Gaussian Process Regression)) combine multiple models to improve prediction accuracy. Gaussian Process models (including Matern 5/2, Exponential, and Rational Quadratic variants) use probabilistic approaches to define smooth functions over the input space. Neural network architectures (varying from Narrow to Wide, with both Bilayered and Trilayered configurations) learn complex patterns through interconnected layers of neurons with different network widths and depths.
Table 4 provides the frame coding system used to structure and identify the various regression analysis models for comparative assessment. Model performance is evaluated through multiple metrics: lower values of RMSE, Mean Square Error (MSE), and MAE demonstrate better predictive accuracy and resistance to overfitting, while R-squared (R
2) values approaching 1 indicate a stronger model fit to the observed data.
To visualize these differences,
Figure 9 and
Figure 10 present a comparison between measured PCI measurements and predicted values, showing both training and validation results from the GEP model alongside predictions from multiple regression models. The results show that firstly, in the training data analysis, Gaussian Process models, specifically the Squared Exponential GPR and Rational Quadratic GPB variants, achieved the lowest RMSE of 10.797, showing a 3.6% improvement over the GEP model’s 11.2. The SVM model with cubic configuration demonstrated the best MAE performance at 8.686, marginally outperforming GEP’s 9.173 by 5.31%. Regarding model fit quality, measured by R-squared (R
2), values closer to 1 indicate better model performance. The SVM Gaussian Process Neural Network achieved the highest R
2 value of 0.83, representing a 1.10% improvement in model fit accuracy compared to other approaches, whereas in the validation dataset evaluation, the GEP model demonstrated superior performance across all metrics compared to other models. It achieved the lowest error rates with an RMSE of 11 and MAE of 8.828. Additionally, GEP exhibited the strongest model with the highest R-squared value of 0.858, outperforming all other regression models in comparison.
This performance pattern suggests that GEP has better generalization capabilities than other regression models, making it particularly suitable for prediction tasks. While it may not always achieve the absolute best training metrics, its superior validation performance indicates it is less likely to overfit and more reliable for practical applications. The high R2 value in validation (0.858) particularly demonstrates that GEP can explain approximately 85.8% of the variance in the data, suggesting that it is a robust choice for prediction purposes.
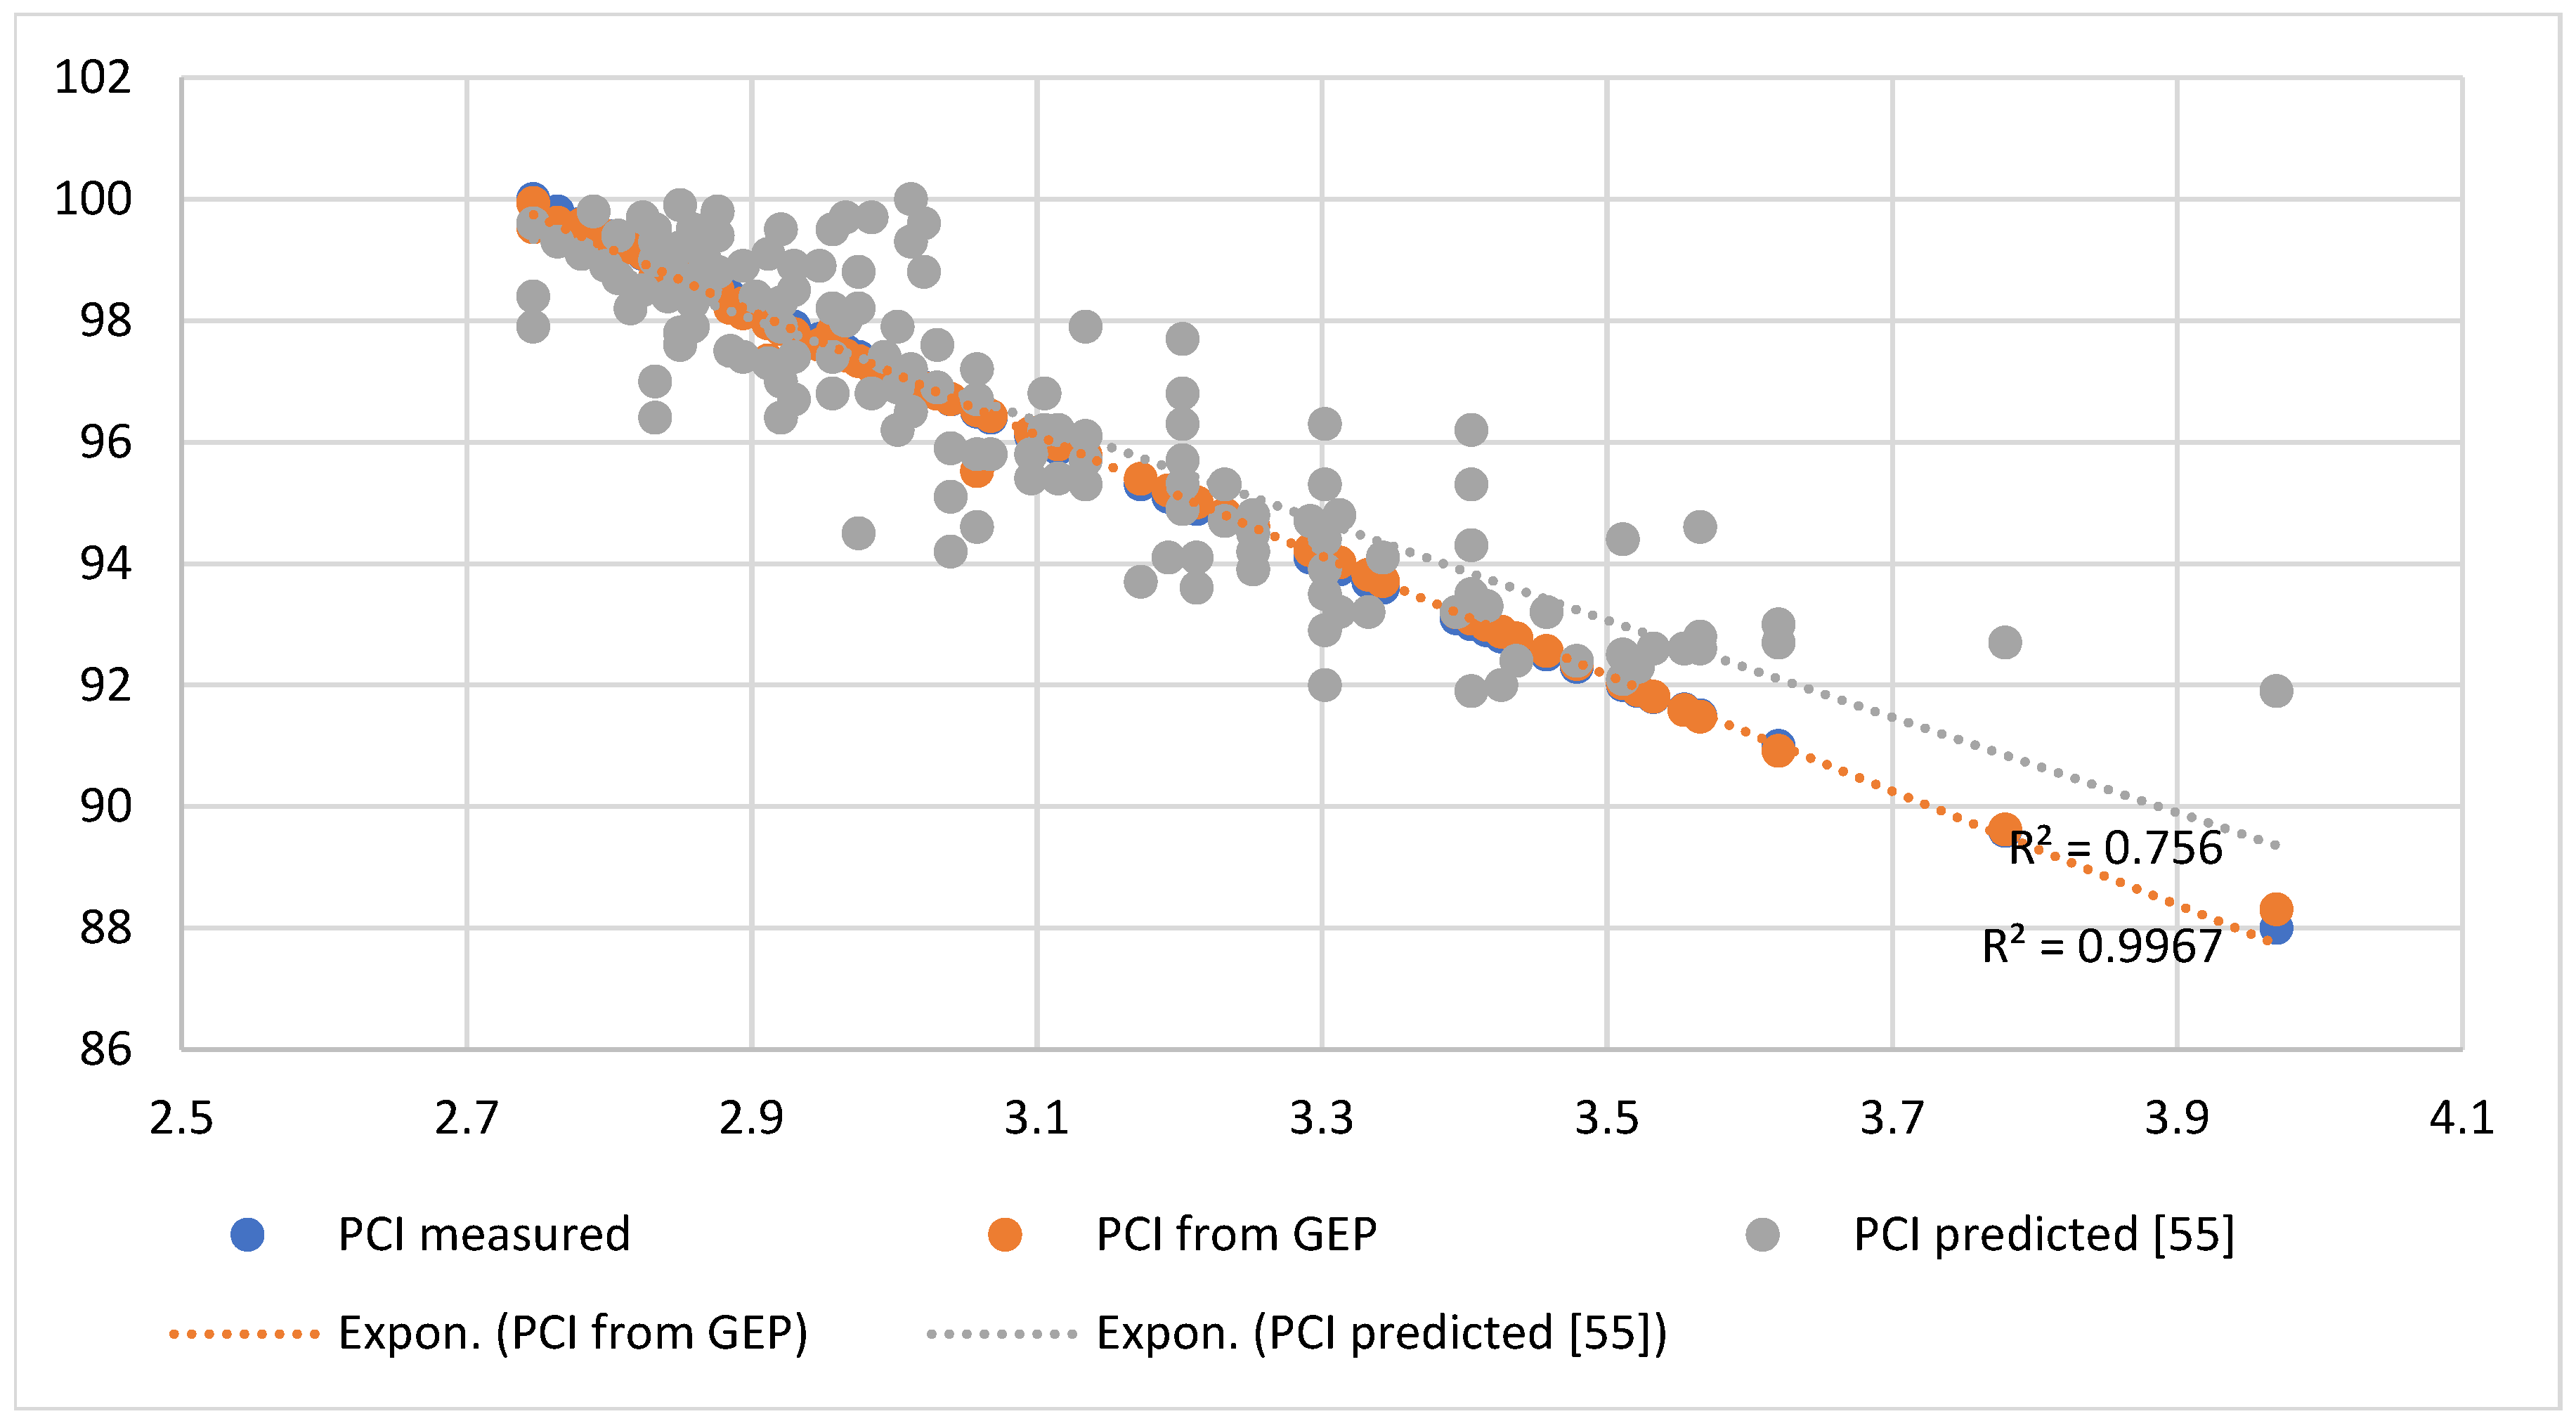
7. Verification GEP for Predicting the PCI
In a parallel investigation, Adeli [
55] examined the prediction of PCI from the IRI under nearly identical conditions [
55]. To validate the accuracy of the Gene Expression Programming (GEP) approach for PCI prediction, a comparative analysis was conducted between GEP results and those obtained from exponentiation regression reported in the published literature. The comparison revealed that the regression analysis results from GEP demonstrated superior performance compared to the exponentiation regression approach. The relationship between the IRI and PCI for both methods is illustrated in
Figure 11, which displays their respective R
2 values. The GEP model achieved an R
2 value of 0.996, significantly outperforming the exponentiation regression model’s R
2 value of 0.756. This substantial difference in correlation coefficients indicates that GEP exhibits considerably higher predictive accuracy than exponentiation regression when modeling the relationship between the IRI and PCI. The near-perfect correlation achieved by GEP (R
2 = 0.996) suggests that this method captures the underlying relationship between these pavement condition indices with remarkable precision. These findings demonstrate that GEP represents one of the most effective methods available for predicting the PCI from IRI measurements, offering superior reliability and accuracy compared to traditional neural network approaches. The high correlation coefficient obtained through GEP modeling provides strong evidence for its applicability in pavement condition assessment and management systems.
8. Conclusions
Gene Expression Programming (GEP) implementation in pavement condition assessment marks a significant advancement beyond traditional evaluation methods, providing distinctive capabilities that overcome the fundamental constraints of conventional pavement management approaches. While standard linear regression techniques rely on predefined mathematical frameworks between input variables, GEP utilizes evolutionary algorithms to autonomously identify and develop optimal mathematical relationships that effectively capture the complex, non-linear associations between the International Roughness Index (IRI) and Pavement Condition Index (PCI). The intelligent pattern recognition capabilities inherent in GEP allow for the detection of subtle relationships and dependencies within pavement datasets that conventional statistical techniques frequently fail to recognize, thereby producing enhanced accuracy and reliability in predictive modeling. Additionally, GEP’s capacity to produce clear, mathematically interpretable formulations offers engineering professionals deeper understanding of the fundamental mechanisms controlling pavement behavior, thereby supporting more informed decisions in maintenance scheduling and budget optimization. The demonstrated superior performance of GEP models in validation scenarios, particularly their ability to maintain accuracy when applied to previously unseen pavement data, establishes this methodology as exceptionally valuable for comprehensive pavement network analysis, where reliable and consistent condition evaluation across varied road infrastructures is fundamental to effective asset management and strategic planning initiatives.
Given the inherent correlations between various pavement performance metrics, this research leverages advanced GEP modeling techniques to establish a robust relationship between IRI and PCI measurements. Surface roughness serves as a comprehensive quality index, reflecting both user experience and underlying pavement deterioration patterns. As pavements deteriorate over time, increasing IRI values effectively capture this degradation process. The research’s analysis validates IRI as a reliable predictor for PCI estimation. Since PCI values are crucial for infrastructure management decisions and maintenance planning, this research provides a systematic approach to derive PCI assessments from readily available IRI measurements for asphalt concrete pavements. This methodology eliminates the need for time-consuming subjective evaluations, offering significant resource efficiency. The GEP model, developed using extensive data from Iraqi road networks, demonstrated robust statistical performance. The coefficient of determination (R2) showed strong predictive capability across different data subsets: 0.821 for training, 0.855 for validation, and 0.821 overall, explaining approximately 82–85% of PCI variance. Model accuracy remained consistent, with mean absolute errors ranging from 12 to 13 units. Root mean square errors of 11.209 and 11.00 were obtained for the training and validation sets, respectively, with lower validation RMSE indicating effective generalization without overfitting concerns. High correlation coefficients exceeding 0.90 between predicted and measured values, combined with acceptable relative absolute errors (0.403–0.416), further validate the model’s predictive reliability. This approach represents a cost-effective alternative to conventional PCI assessment methods, offering transportation agencies an efficient tool for maintaining accurate pavement condition monitoring programs.
On the other hand, the results reveal GEP’s stronger ability to generalize compared to alternative regression approaches. Despite not consistently leading in training metrics, GEP shines during validation testing—a key indicator of real-world applicability. The model’s validation R2 of 0.858 is especially noteworthy, as it captures 85.8% of the data’s variability. Based on these findings, the GEP model offers a reliable, objective approach for PCI prediction that can effectively replace subjective surveyor assessments. The model’s demonstrated accuracy makes it a practical choice for standardizing pavement condition evaluations.
This research advances machine learning applications in civil engineering by demonstrating several groundbreaking insights. First, it establishes the superiority of evolutionary computation approaches over traditional regression methods in handling complex infrastructure prediction tasks, specifically showing that Gene Expression Programming’s evolutionary learning mechanisms can automatically discover non-linear mathematical relationships that conventional statistical models cannot capture. The study introduces a critical finding in model validation theory: GEP’s exceptional performance during validation phases (R2 = 0.858) compared to training phases reveals its superior generalization capabilities, challenging the traditional assumption that high training performance correlates with real-world applicability.
The research contributes to transferring learning and domain adaptation knowledge by successfully applying GEP to transform readily available roughness measurements into complex condition indices, effectively creating a cross-domain prediction framework that bridges physical measurements with subjective assessment outcomes. This demonstrates machine learning’s potential to replace human-dependent evaluation processes with objective, automated systems while maintaining or exceeding accuracy levels. The study also advances understanding of overfitting prevention in evolutionary algorithms, as evidenced by the lower RMSE in validation compared to training datasets, suggesting that GEP’s evolutionary nature inherently develops more robust predictive models.
The integration of sustainability principles with pavement condition assessment through GEP-based predictive modeling represents a paradigm shift toward more responsible infrastructure management. By enabling precise prediction of pavement conditions, GEP models facilitate the transition from reactive to proactive maintenance strategies, resulting in significant environmental, economic, and social benefits. This approach not only preserves infrastructure performance but also aligns with global sustainability goals by minimizing resource consumption, reducing environmental impact, and ensuring long-term economic viability of transportation systems.
The success of this integrated approach depends on accurate predictive modeling, comprehensive data integration, and systematic implementation of sustainable maintenance strategies. GEP technology provides the analytical foundation necessary to achieve these goals while maintaining the reliability and performance standards essential for modern transportation infrastructure.
9. Future Work
This study focuses specifically on predicting the PCI from the IRI using a GEP model comprising 401 samples collected from urban roads in Al-Basra, Iraq. This substantial sample size was deliberately chosen to enhance the accuracy and reliability of our predictive modeling approach. While PCI prediction can indeed be approached through various methodological frameworks incorporating multiple variables, the study deliberately concentrates on establishing a robust IRI-based prediction model. This focused approach allows us to thoroughly investigate the relationship between these two critical pavement performance indices and develop a highly accurate predictive tool for this specific application. The large sample size enables us to capture the inherent variability in pavement conditions and provides a solid foundation for model validation and reliability assessment. On the other hand, the incorporation of additional factors such as climate variability, subgrade characteristics, and traffic conditions is particularly valuable because of the multifaceted nature of pavement deterioration mechanisms. These environmental and structural factors undoubtedly play critical roles in pavement performance and represent important avenues for future research expansion. Moreover, additional variables such as distress types and severity, structural parameters, and traffic data will be integrated into the predictive model.
On the other hand, GEP represents an innovative methodology for prediction modeling that can effectively handle multimodal datasets. And the flexibility and high accuracy of GEP make it particularly suitable for integrating diverse variables such as climatic conditions, traffic intensity, and other relevant parameters that affect pavement performance. This extension would allow for more comprehensive pavement condition assessment by considering the complex interactions between structural, environmental, and loading factors.
Author Contributions
M.M.R.: conceptualization, methodology, writing, acquisition of data, analysis, interpretation, and critical revision; M.F.J.: writing, review, and editing of the original draft; M.M.E.: writing, review, and editing of the original draft; S.A.B.A.-J.: writing, review, and editing of the original draft; Y.A.S.G.: conceptualization, methodology, investigation, writing, analysis, review, and editing of the original draft and submission. All authors have read and agreed to the published version of the manuscript.
Funding
The authors declare that there was no funding received for this research. The study was conducted using institutional resources.
Institutional Review Board Statement
Not applicable, as this study did not involve humans or animals.
Informed Consent Statement
Not applicable, as this study did not involve humans or animals.
Data Availability Statement
The corresponding author can provide interested parties with access to the relevant data and models used in this research upon receiving reasonable request.
Acknowledgments
The authors acknowledge the support given by the experts used for the experimental data provided.
Conflicts of Interest
The authors declare no competing interests.
Abbreviations
| ANN | Artificial Neural Network |
| ETs | Expression Trees |
| GAs | Genetic Algorithms |
| GEP | Gene Expression Programming |
| GP | Genetic Programming |
| IRI | International Roughness Index |
| MAE | Mean Absolute Error |
| PCI | Pavement Condition Index |
| RAE | Relative Absolute Error |
| RMSE | Root Mean Square Error |
| SVM | Support Vector Machine |
References
- Moazami, D.; Muniandy, R.; Hamid, H.; Yusoff, Z.M. Developing a comprehensive pavement management system in Tehran, Iran using MicroPAVER. Electron. J. Geotech. Eng 2010, 15, 1782–1792. [Google Scholar]
- Shah, Y.U.; Jain, S.; Tiwari, D.; Jain, M. Development of overall pavement condition index for urban road network. Procedia-Soc. Behav. Sci. 2013, 104, 332–341. [Google Scholar] [CrossRef]
- Imam, R.; Murad, Y.; Asi, I.; Shatnawi, A. Predicting pavement condition index from international roughness index using gene expression programming. Innov. Infrastruct. Solut. 2021, 6, 139. [Google Scholar] [CrossRef]
- Piryonesi, S.M.; El-Diraby, T.E. Examining the relationship between two road performance indicators: Pavement condition index and international roughness index. Transp. Geotech. 2021, 26, 100441. [Google Scholar] [CrossRef]
- Luo, X.; Gu, F.; Zhang, Y.; Lytton, R.L.; Zollinger, D. Mechanistic-empirical models for better consideration of subgrade and unbound layers influence on pavement performance. Transp. Geotech. 2017, 13, 52–68. [Google Scholar] [CrossRef]
- Piryonesi, S.M. The Application of Data Analytics to Asset Management: Deterioration and Climate Change Adaptation in Ontario Roads; University of Toronto: Toronto, ON, Canada, 2019. [Google Scholar]
- Sayers, M.W. On the Calculation of International Roughness Index from Longitudinal Road Profile; Transportation Research Record: Washington, DC, USA, 1995; pp. 1–12. [Google Scholar]
- Sayers, M.W.; Gillespie, T.D.; Paterson, W.D. Guidelines for Conducting and Calibrating Road Roughness Measurements; University of Michigan: Ann Arbor, MI, USA; Transportation Research Institute: Arlington, VA, USA, 1986. [Google Scholar]
- ASTM E1926-08; Standard Practice for Computing International Roughness Index of Roads from Longitudinal Profile Measurements. ASTM International: West Conshohocken, PA, USA, 2015.
- American Association of State Highway Officials. Methods of Sampling and Testing; American Association of State Highway Officials: Washington, DC, USA, 1950. [Google Scholar]
- Smith, K.D.; Ram, P. Measuring and Specifying Pavement Smoothness: [Techbrief]; Federal Highway Administration: Washington, DC, USA, 2016. [Google Scholar]
- Shahin, M.Y. Pavement Management for Airports, Roads, and Parking Lots; Kluwer Academic Publisher: Boston, NY, USA, 1994. [Google Scholar]
- ASTM E2840-11; Standard Practice for Roads and Parking Lots Pavement Condition Index Surveys. ASTM International: West Conshohocken, PA, USA, 2018.
- Khawaja, L.; Asif, U.; Onyelowe, K.; Al Asmari, A.F.; Khan, D.; Javed, M.F.; Alabduljabbar, H. Development of machine learning models for forecasting the strength of resilient modulus of subgrade soil: Genetic and artificial neural network approaches. Sci. Rep. 2024, 14, 18244. [Google Scholar] [CrossRef]
- Guha, S.K.; Hossain, K.; Lawlor, M. An economic pavement management framework for extremely budget-and resource-constrained agencies in Canada. Transp. Res. Rec. 2022, 2676, 554–570. [Google Scholar] [CrossRef]
- Tarabieh, K.; Mansour, Y.; Khorshed, M.; Rothrock, B. The AUC Carbon Footprint Report 2019; The American University in Cairo: New Cairo, Egypt, 2019. [Google Scholar]
- Radwan, M.M.; Mousa, A.; Zahran, E.M.M. Enhancing Pavement Sustainability: Prediction of the Pavement Condition Index in Arid Urban Climates Using the International Roughness Index. Sustainability 2024, 16, 3158. [Google Scholar] [CrossRef]
- Pramesti, F.P.; Setyawan, A.; Octavian, M.C.; Zein, A.P.M.; Safe’i, K.M.S.; Parnaningrum, K.N. Can We Predict the Roughness Index (IRI) of a Road Based on its Pavement Condition Index (PCI)? In Proceedings of the E3S Web of Conferences: The 4th International Conference on Green Civil and Environmental Engineering (GCEE 2023), Denpasar, Indonesia, 8–10 August 2023; EDP Sciences: Les Ulis, France, 2023; p. 01015. [Google Scholar]
- Keymanesh, M.R.; Shabani, S.; Moosavi, S.R. Predicting a Pavement Roughness on the Basis of PCI Data. Int. J. Transp. Eng. 2022, 10, 947–958. [Google Scholar]
- Abed, M.S. Development of regression models for predicting pavement condition index from the international roughness index. J. Eng. 2020, 26, 81–94. [Google Scholar] [CrossRef]
- Younos, M.; Abd El-Hakim, R.; El-Badawy, S.; Afify, H. Multi-input performance prediction models for flexible pavements using LTPP database. Innov. Infrastruct. Solut. 2020, 5, 27. [Google Scholar] [CrossRef]
- Ferreira, C. Gene expression programming in problem solving. In Soft Computing and Industry: Recent Applications; Springer: Berlin/Heidelberg, Germany, 2002; pp. 635–653. [Google Scholar]
- Sarıdemir, M. Modelling the flexural strength of mortars containing different mineral admixtures via GEP and RA. Comput. Concr. Int. J. 2017, 19, 717–724. [Google Scholar]
- Jafari, S.; Mahini, S.S. Lightweight concrete design using gene expression programing. Constr. Build. Mater. 2017, 139, 93–100. [Google Scholar] [CrossRef]
- Lim, J.C.; Karakus, M.; Ozbakkaloglu, T. Evaluation of ultimate conditions of FRP-confined concrete columns using genetic programming. Comput. Struct. 2016, 162, 28–37. [Google Scholar] [CrossRef]
- Kameshki, E. Discrete optimum design of steel frames by genetic algorithm. J. King Saud Univ.-Eng. Sci. 2003, 15, 217–233. [Google Scholar] [CrossRef]
- Murad, Y.; Ashteyat, A.; Hunaifat, R. Predictive model to the bond strength of FRP-to-concrete under direct pullout using Gene expression programming. J. Civ. Eng. Manag. 2019, 25, 773–784. [Google Scholar] [CrossRef]
- Murad, Y.Z.; Hunifat, R.; Wassel, A.-B. Interior reinforced concrete beam-to-column joints subjected to cyclic loading: Shear strength prediction using gene expression programming. Case Stud. Constr. Mater. 2020, 13, e00432. [Google Scholar] [CrossRef]
- Murad, Y.; Abdel-Jabar, H.; Diab, A.; Abu Hajar, H. Exterior RC joints subjected to monotonic and cyclic loading. Eng. Comput. 2020, 37, 2319–2336. [Google Scholar] [CrossRef]
- Cevik, A.; Sonebi, M. Modelling the performance of self-compacting SIFCON of cement slurries using genetic programming technique. Comput. Concr. 2008, 5, 475–490. [Google Scholar] [CrossRef]
- Al Bodour, W.; Tarawneh, B.; Murad, Y. A model to predict the standard penetration test N60 value from cone penetration test data. Soil Mech. Found. Eng. 2022, 59, 437–444. [Google Scholar] [CrossRef]
- Azim, I.; Yang, J.; Iqbal, M.F.; Javed, M.F.; Nazar, S.; Wang, F.; Liu, Q.-F. Semi-Analytical Model for Compressive Arch Action Capacity of RC Frame Structures; Elsevier: Amsterdam, The Netherlands, 2020; pp. 1231–1245. [Google Scholar]
- Azim, I.; Yang, J.; Iqbal, M.F.; Mahmood, Z.; Javed, M.F.; Wang, F.; Liu, Q.-F. Prediction of catenary action capacity of RC beam-column substructures under a missing column scenario using evolutionary algorithm. KSCE J. Civ. Eng. 2021, 25, 891–905. [Google Scholar] [CrossRef]
- Benmhahe, B.; Chentoufi, J.A. Automated pavement distress detection, classification and measurement: A review. Int. J. Adv. Comput. Sci. Appl. 2021, 12, 708–718. [Google Scholar] [CrossRef]
- Koza, J. On the programming of computers by means of natural selection. In Genetic Programming; MIT Press: Cambridge, MA, USA, 1992. [Google Scholar]
- Alavi, A.H.; Ameri, M.; Gandomi, A.H.; Mirzahosseini, M.R. Formulation of flow number of asphalt mixes using a hybrid computational method. Constr. Build. Mater. 2011, 25, 1338–1355. [Google Scholar] [CrossRef]
- Shi, M.; Lin, Q.; Zhang, Q.; Zhao, H. Hybrid Genetic Tabu Search Simulated Annealing algorithm and its application in vehicle routing problem with time windows. In Proceedings of the 2011 2nd International Conference on Artificial Intelligence, Management Science and Electronic Commerce (AIMSEC), Dengfeng, China, 8–10 August 2011; IEEE: Piscataway, NJ, USA, 2011; pp. 4022–4025. [Google Scholar]
- Aminian, P.; Javid, M.R.; Asghari, A.; Gandomi, A.H.; Esmaeili, M.A. A robust predictive model for base shear of steel frame structures using a hybrid genetic programming and simulated annealing method. Neural Comput. Appl. 2011, 20, 1321–1332. [Google Scholar] [CrossRef]
- Ferreira, C. Gene expression programming: A new adaptive algorithm for solving problems. arXiv 2001, arXiv:cs/0102027. [Google Scholar] [CrossRef]
- Tanyildizi, H.; Çevik, A. Modeling mechanical performance of lightweight concrete containing silica fume exposed to high temperature using genetic programming. Constr. Build. Mater. 2010, 24, 2612–2618. [Google Scholar] [CrossRef]
- Aval, S.B.; Ketabdari, H.; Gharebaghi, S.A. Estimating Shear Strength of Short Rectangular Reinforced Concrete Columns Using Nonlinear Regression and Gene Expression Programming; Elsevier: Amsterdam, The Netherlands, 2017; pp. 13–23. [Google Scholar]
- Gepsoft GeneXproTools—Data Modeling & Analysis Software. 2014. Available online: https://www.gepsoft.com/ (accessed on 28 July 2025).
- Yates, L.A.; Aandahl, Z.; Richards, S.A.; Brook, B.W. Cross validation for model selection: A review with examples from ecology. Ecol. Monogr. 2023, 93, e1557. [Google Scholar] [CrossRef]
- Shalev-Shwartz, S.; Ben-David, S. Understanding Machine Learning: From Theory to Algorithms; Cambridge University Press: Cambridge, UK, 2014. [Google Scholar]
- Eaton, E. Selective transfer between learning tasks using task-based boosting. In Proceedings of the AAAI Conference on Artificial Intelligence, San Francisco, CA, USA, 7–11 August 2011; pp. 337–343. [Google Scholar]
- Brownlee, J. How much training data is required for machine learning; In Machine Learning Mastery. 2019. Available online: https://machinelearningmastery.com/much-training-data-required-machine-learning/ (accessed on 28 July 2025).
- Vabalas, A.; Gowen, E.; Poliakoff, E.; Casson, A.J. Machine learning algorithm validation with a limited sample size. PLoS ONE 2019, 14, e0224365. [Google Scholar] [CrossRef]
- Figueroa, R.L.; Zeng-Treitler, Q.; Kandula, S.; Ngo, L.H. Predicting sample size required for classification performance. BMC Med. Inform. Decis. Mak. 2012, 12, 8. [Google Scholar] [CrossRef]
- Avsec, Ž.; Agarwal, V.; Visentin, D.; Ledsam, J.R.; Grabska-Barwinska, A.; Taylor, K.R.; Assael, Y.; Jumper, J.; Kohli, P.; Kelley, D.R. Effective gene expression prediction from sequence by integrating long-range interactions. Nat. Methods 2021, 18, 1196–1203. [Google Scholar] [CrossRef]
- Koza, J.R. Evolution of subsumption using genetic programming. In Proceedings of the First European Conference on Artificial Life, Paris, France, 15–19 July 1992; MIT Press: Cambridge, MA, USA, 1992; pp. 110–119. [Google Scholar]
- Manual, A.B.S. An Introduction to Statistical Learning with Applications in R; Springer: Berlin/Heidelberg, Germany, 2013. [Google Scholar]
- Ferreira, C. Gene Expression Programming: Mathematical Modeling by an Artificial Intelligence; Springer: Berlin/Heidelberg, Germany, 2006. [Google Scholar]
- Hastie, T.; James, G.; Witten, D.; Tibshirani, R. An Introduction to Statistical Learning; Springer: New York, NY, USA, 2013. [Google Scholar]
- Idriss, L.K.; Gamal, Y.A. Predicting concrete-encased column behavior under uniaxial load using adaptive neural fuzzy systems. Expert Syst. Appl. 2025, 278, 127354. [Google Scholar] [CrossRef]
- Adeli, S.; Najafi moghaddam Gilani, V.; Kashani Novin, M.; Motesharei, E.; Salehfard, R. Development of a Relationship between Pavement Condition Index and International Roughness Index in Rural Road Network. Adv. Civ. Eng. 2021, 2021, 6635820. [Google Scholar] [CrossRef]
| Disclaimer/Publisher’s Note: The statements, opinions and data contained in all publications are solely those of the individual author(s) and contributor(s) and not of MDPI and/or the editor(s). MDPI and/or the editor(s) disclaim responsibility for any injury to people or property resulting from any ideas, methods, instructions or products referred to in the content. |
© 2025 by the authors. Licensee MDPI, Basel, Switzerland. This article is an open access article distributed under the terms and conditions of the Creative Commons Attribution (CC BY) license (https://creativecommons.org/licenses/by/4.0/).


 ,
, 


