Article

A Prediction Method for Technically Recoverable Reserves Based on a Novel Relationship Between the Relative Permeability Ratio and Saturation

1
Chemical Engineering and Technology Flow Station, Northeast Petroleum University, Daqing 163318, China
2
Shanxi Key Laboratory of Advanced Stimulation Technology for Oil & Gas Reservoirs, Xi’an Shiyou University, Xi’an 710065, China
3
Key Laboratory of Enhanced Oil Recovery (Northeast Petroleum University), Ministry of Education, Daqing 163318, China
4
China National Petroleum Corporation Jilin Oilfield Branch, Songyuan 138001, China
*
Author to whom correspondence should be addressed.
Eng 2025, 6(8), 182; https://doi.org/10.3390/eng6080182 (registering DOI)
Submission received: 7 May 2025 / Revised: 28 July 2025 / Accepted: 29 July 2025 / Published: 2 August 2025
(This article belongs to the Section Chemical, Civil and Environmental Engineering)

Abstract

Upon reaching stabilized production in waterflooded reservoirs, waterflood performance curves are conventionally used to predict technically recoverable reserves (TRRs). However, as reservoirs enter high water-cut stages, the relationship between the relative permeability ratio and saturation becomes nonlinear, causing deflection in waterflood performance curves. This leads to systematic overestimation of both predicted TRR and ultimate recovery factors. To overcome these limitations in conventional TRR prediction methods, this study establishes a novel relative permeability ratio-saturation relationship based on characteristic relative permeability curve behaviors. The proposed model is validated for three distinct fluid-rock interaction types. We further develop a permeability-driven forecasting model for oil production rates and water cuts. Comparative analyses with a conventional waterflood curve methodology demonstrate significant accuracy improvements. The results show that while traditional methods predict TRR ranging from 78.40 to 92.29 million tons, our model yields 70.73 million tons—effectively resolving overestimation issues caused by curve deflection during high water-cut phases. This approach establishes a robust framework for determining critical development parameters, including economic field lifespan, strategy adjustments, and ultimate recovery factor.

1. Introduction

Currently, prediction methods for technically recoverable reserves (TRRs) primarily include static approaches (e.g., the volumetric method, empirical formulae, and an analogy), dynamic methods (e.g., Arps decline curve analysis, waterflood performance curves, displacement series curves, and empirical charts), theoretical techniques (e.g., numerical simulation), and intelligent predictive models (e.g., machine learning, neural networks, and random forests). Static approaches primarily reflect the influence of reservoir static parameters and well pattern density on recoverable reserves [1]. Although useful for estimating waterflood TRR in early development stages (where fluid flow is unstable), these methods fail to incorporate dynamic production data. This limitation reduces accuracy in predicting recovery factors under current operating conditions. Dynamic methods leverage historical production data and are applicable during stable exploitation periods [2]. When performance curves exhibit stable trends, future production behavior and TRR can be predicted with high accuracy. However, during ultra-high water-cut stages (>90% water cut), these curves deflect, leading to significant TRR overestimation that necessitates correction [3,4,5]. Numerical simulation (theoretical method) accounts for waterflood seepage mechanisms and applies to all development phases [6]. Its strength lies in physically grounded calculations with clear mechanisms, but drawbacks include computationally intensive geological modeling, history matching, stringent accuracy requirements, and poor scalability for routine field applications. Intelligent models utilize big data to uncover implicit patterns and enhance TRR prediction accuracy [7], yet they face the “black box” dilemma—limited prediction interpretability reduces acceptance among decision-makers. Furthermore, such models exhibit high sensitivity to data quality; insufficient training samples or systematic biases significantly compromise extrapolation capability.
In summary, dynamic methods are preferred for technically recoverable reserves (TRRs) prediction due to their consideration of multiphase flow mechanisms, production data dynamics, and field implementation considerations [8]. However, during high water-cut stages, nonlinearity in the relationship between the relative permeability ratio and saturation causes waterflood performance curves to deflect, leading to overestimated TRR and recovery factors [9]. To address this limitation, this study establishes a novel relationship between the relative permeability ratio and saturation based on characteristic relative permeability curves. We further develop a forecasting model for oil production rates and water cuts, which demonstrably improves TRR prediction accuracy.

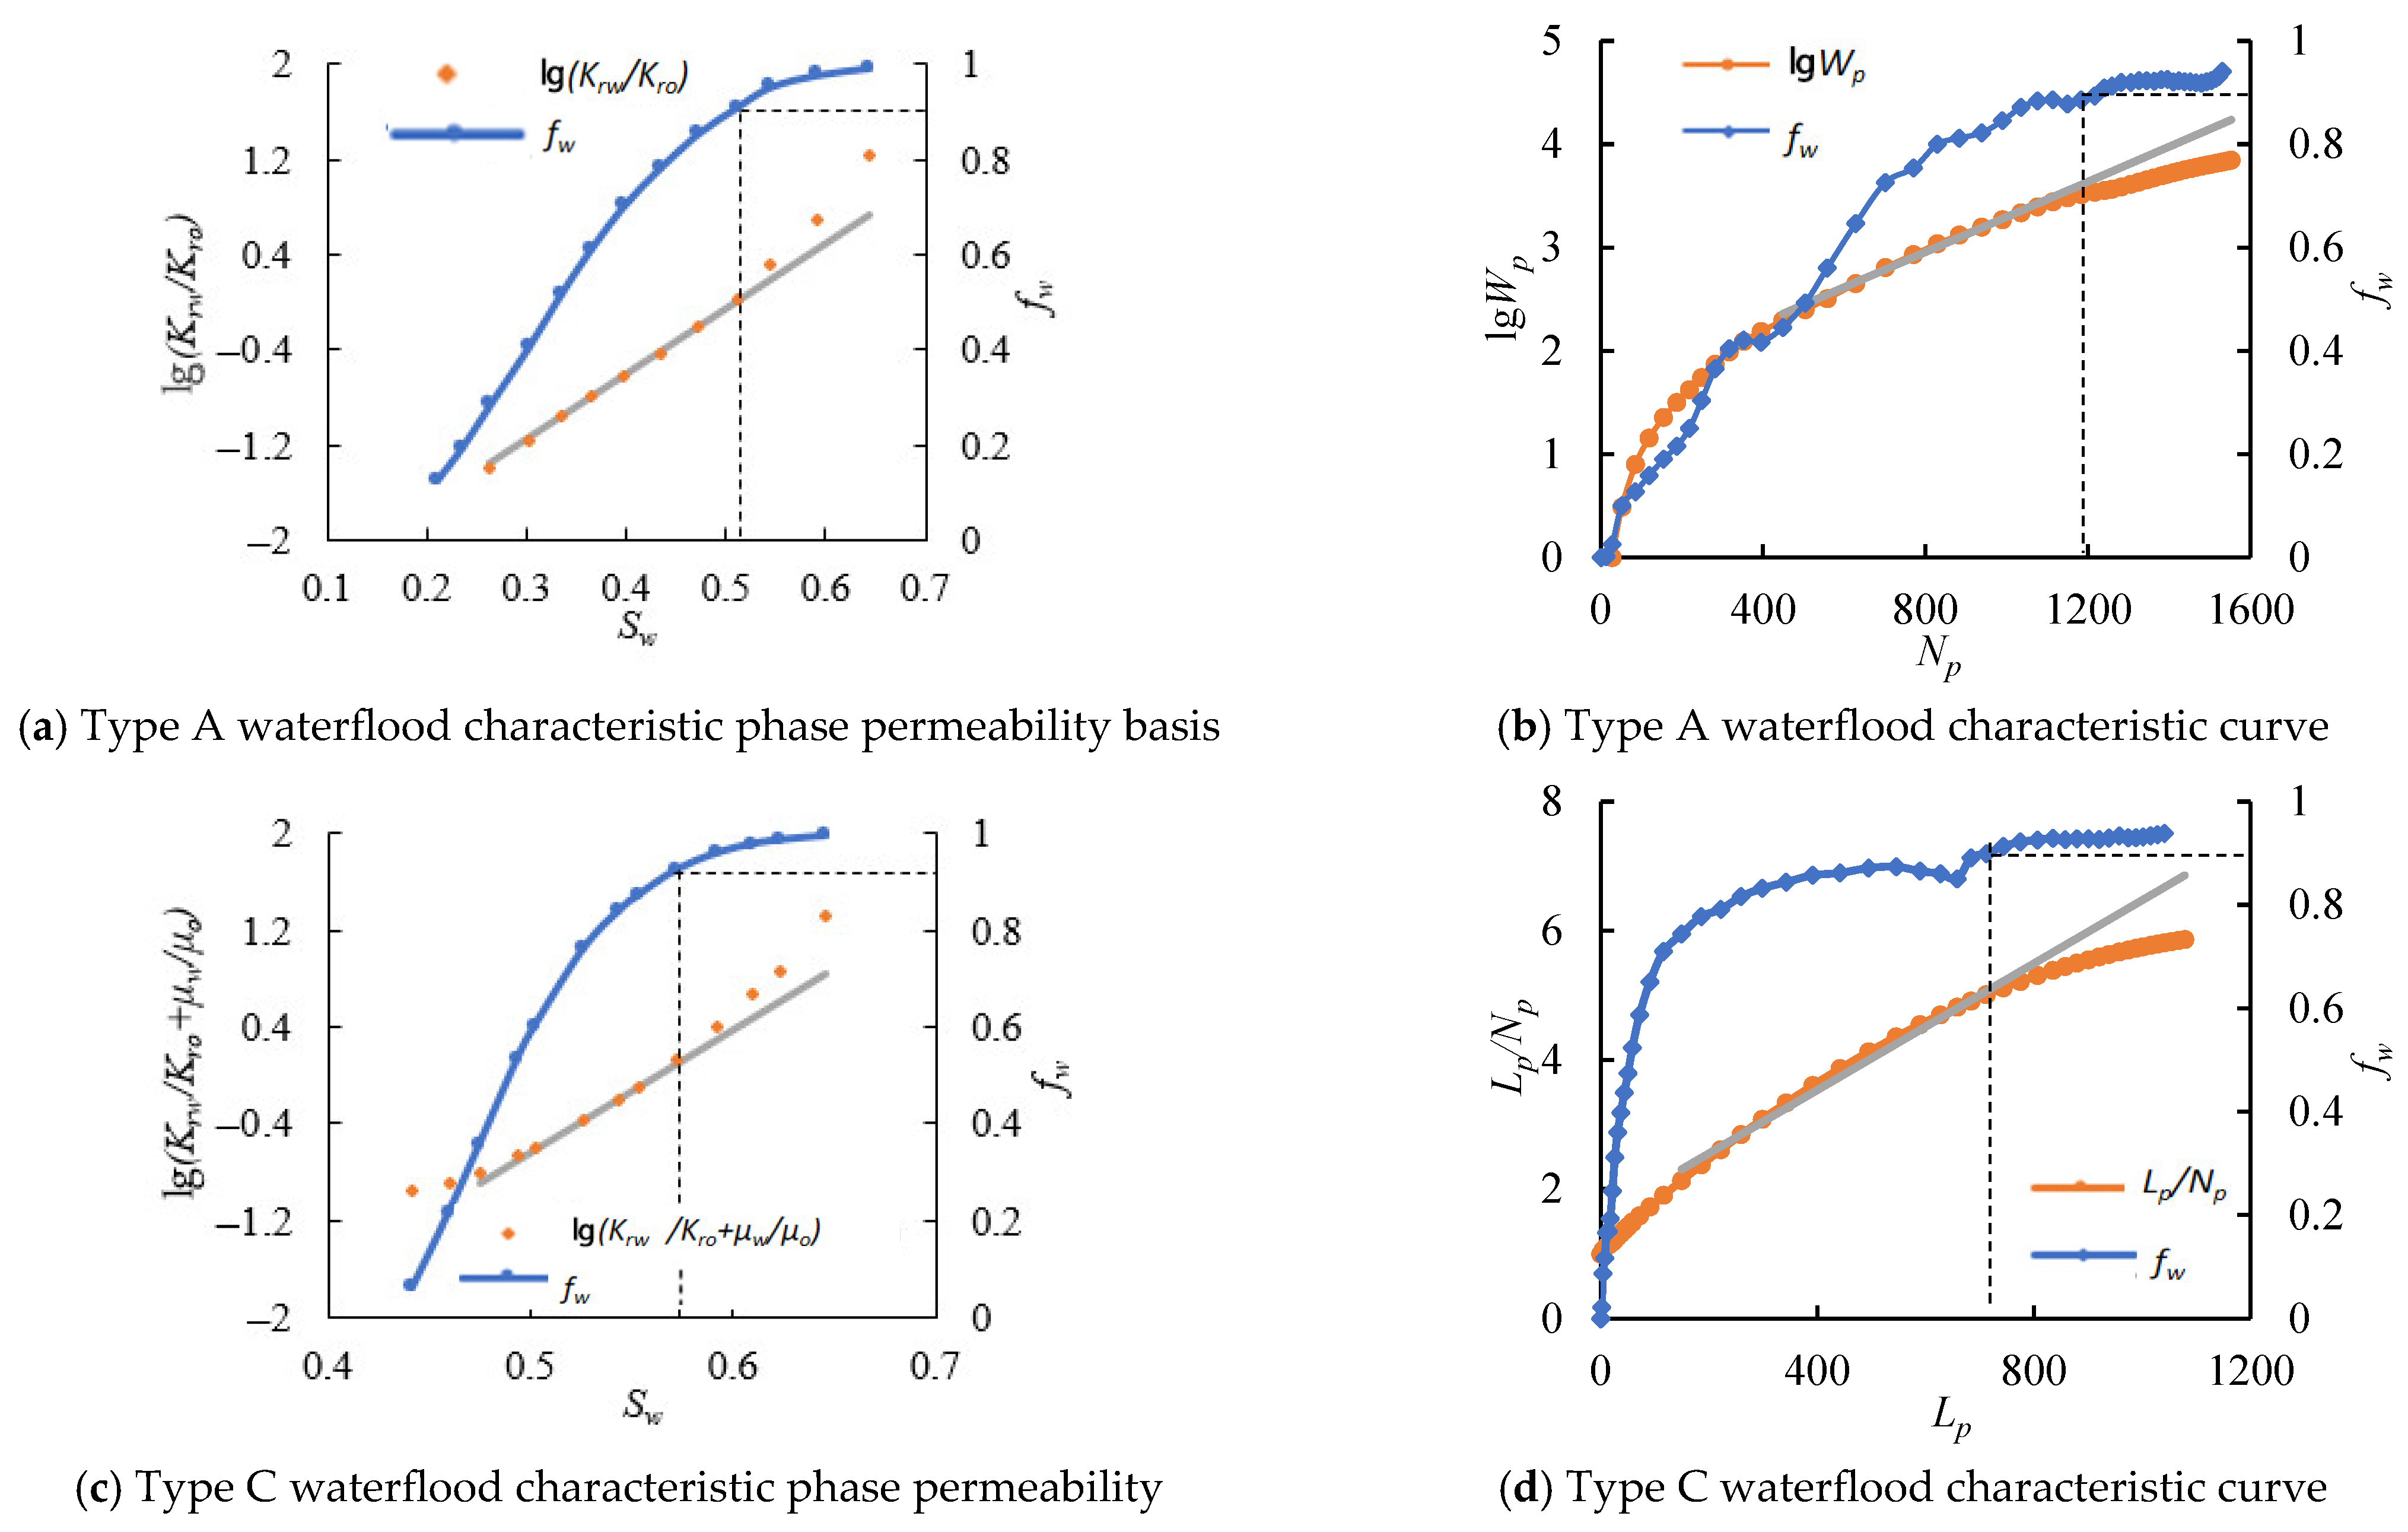
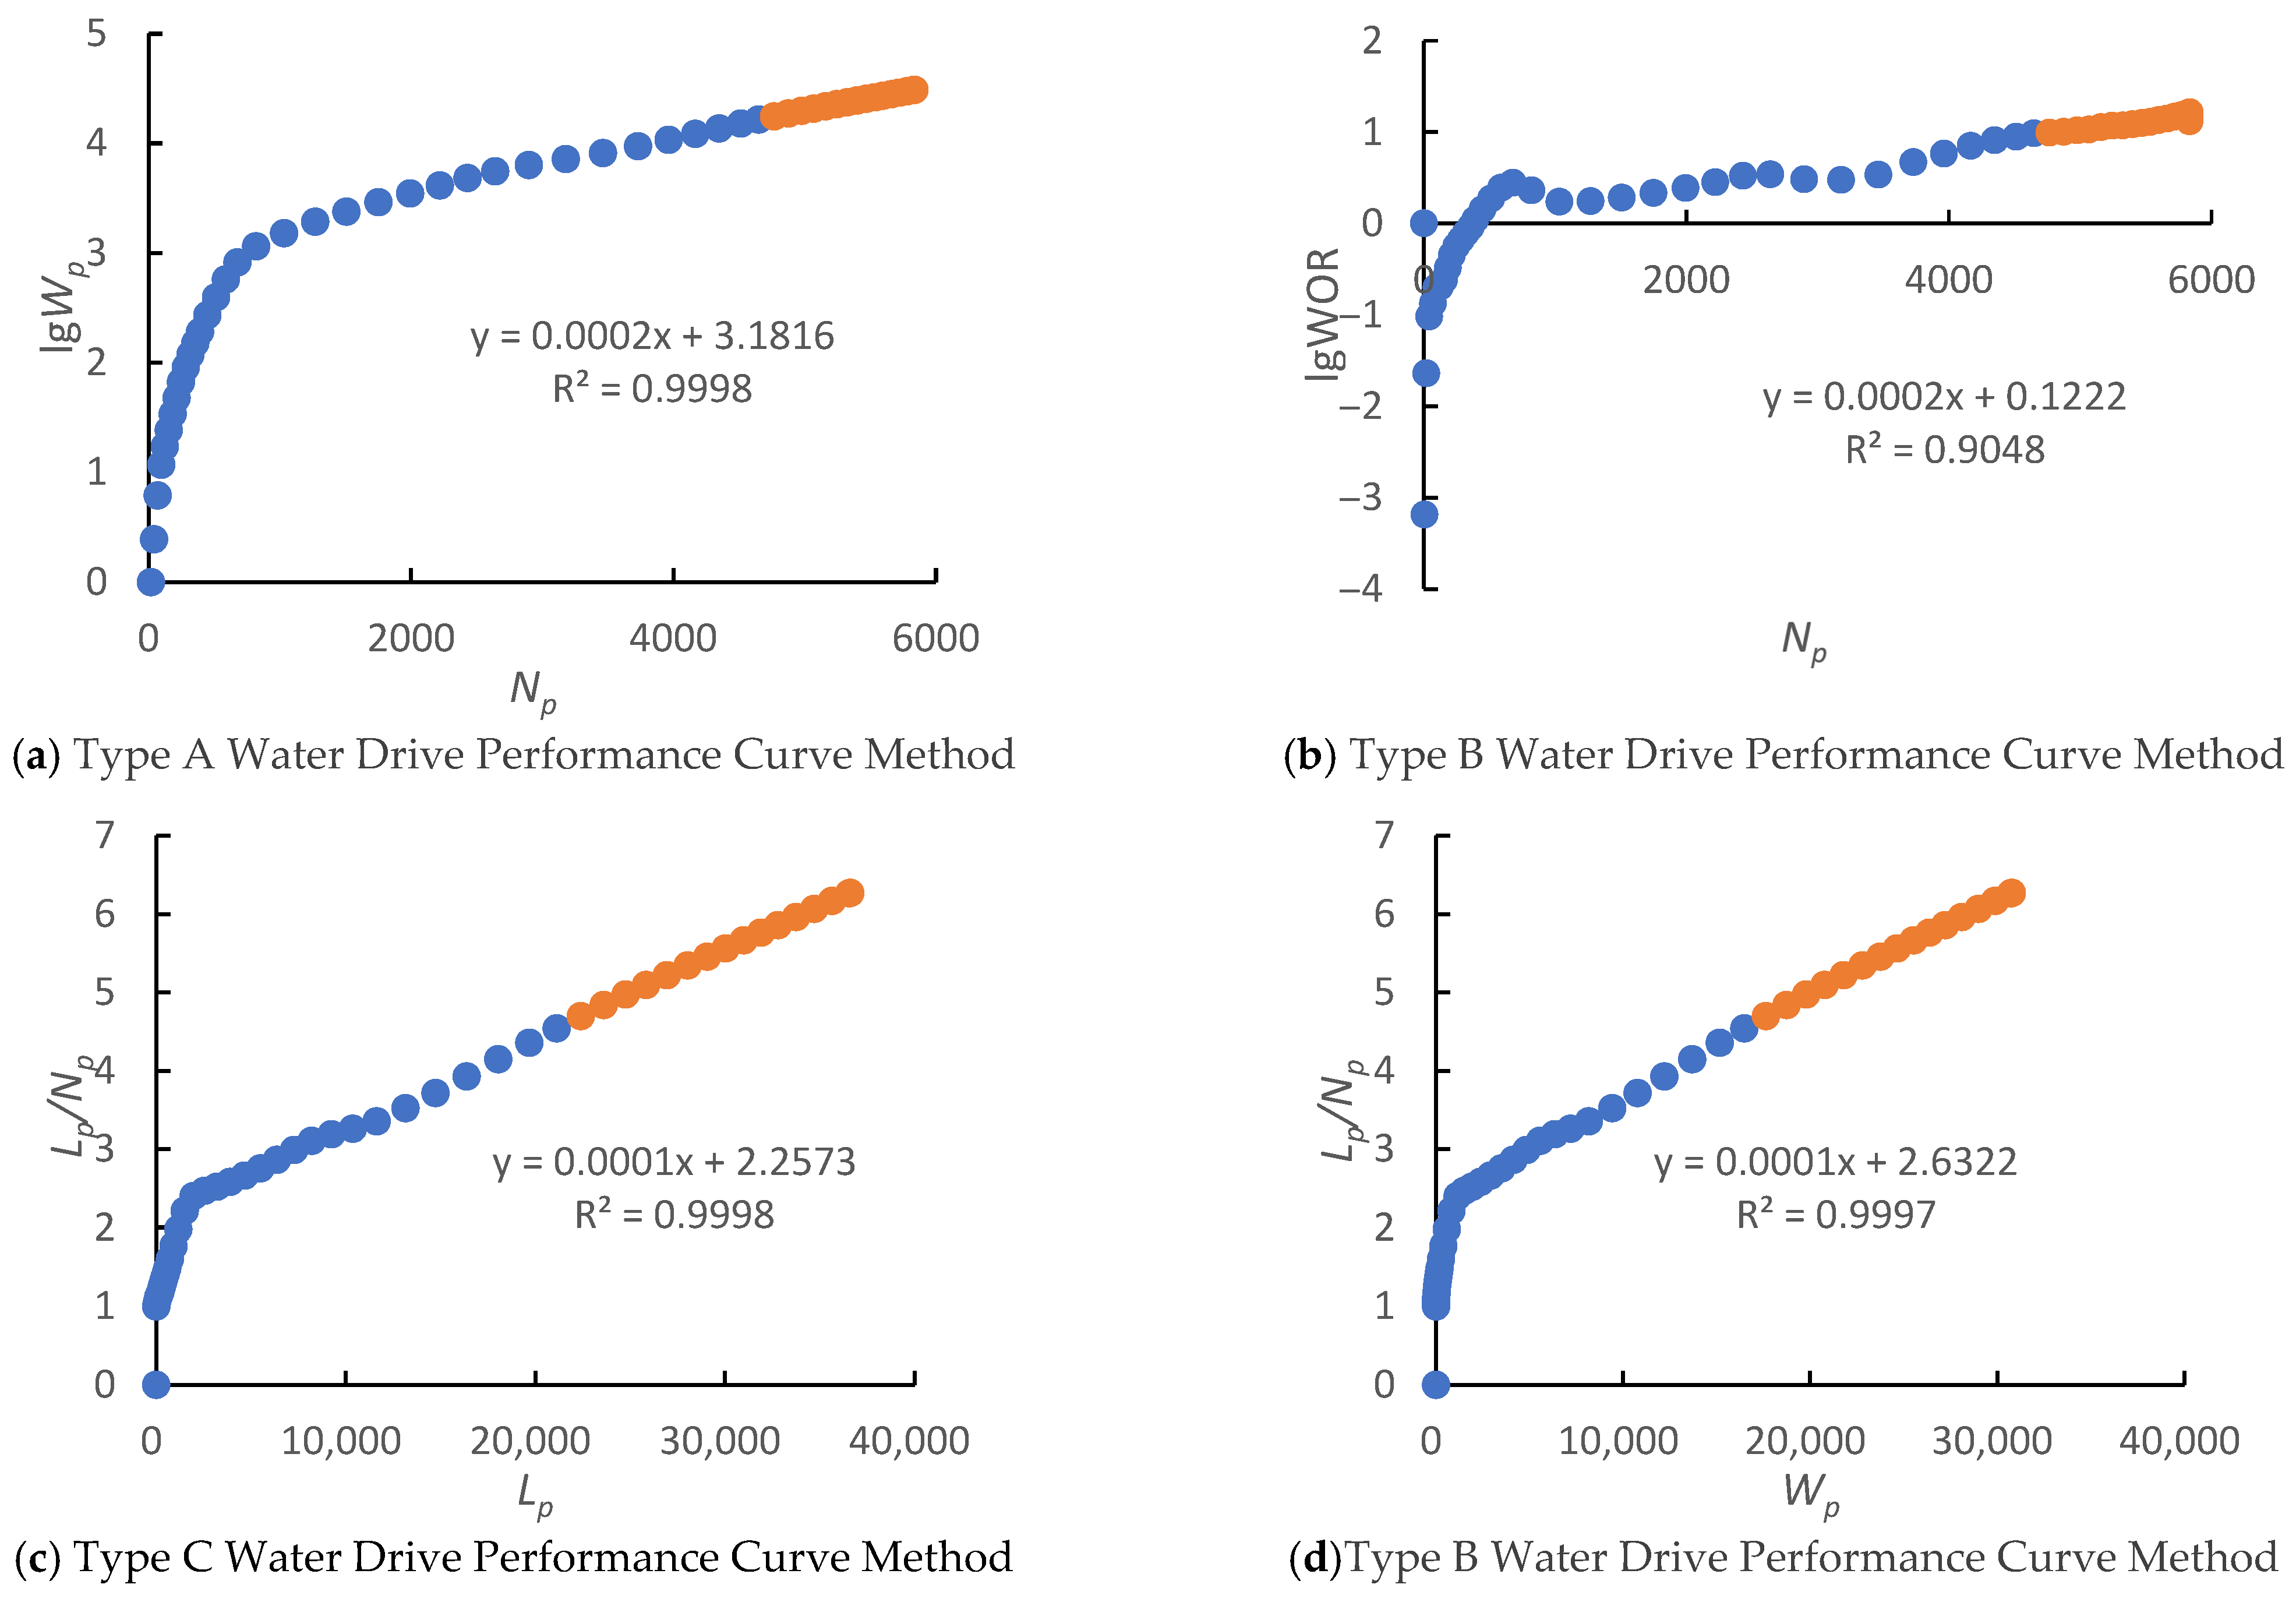
2. Problems of Waterflood Characteristic Curve Method for Predicting Technically Recoverable Reserves (TRR)

Waterflood characteristic curves are categorized into four types: Type A, Type B, Type C, and Type D [10]. When a discernible linear segment emerges in the waterflood characteristic curve during mid-to-late field development, cumulative oil production at 98% water cut can be determined through statistical correlations among production parameters [11,12,13]. This calculated value represents technically recoverable reserves (TRRs) per SY/T 5367-2010 standard [14], as presented in Table 1. Applicable during stabilized production phases—specifically when stable linearity is established in the characteristic curve—this method enables direct calculation of recovery factors using waterflood curve methodology [15,16]. A key limitation, however, is its inapplicability to evaluation units where significant development interventions have been implemented [17].
As shown in Figure 1, from the perspective of waterflood characteristic curves, most reservoir development behaviors conform to Type A and Type C curves. When the oilfield enters the ultra-high water-cut stage, the waterflood characteristic curve deflects. This deflection arises from the inherent characteristics of relative permeability [18,19]. If the classical method is applied without correction, significant errors will result. For Type A waterflood characteristic curves, in the ultra-high water-cut stage, the relationship curve between lg (Krw/Kro) and Sw deviates upwards from the linear trend predicted by the waterflood characteristic curve method [20,21]. The predicted end-point water saturation is lower than the actual value, leading to an overestimation of the recovery factor by the waterflood characteristic curve method. For Type C waterflood characteristic curves, in the ultra-high water-cut stage, the relationship curve between lg (Krw/Kro + μw/μo) and Sw deviates upwards from the linear trend predicted by the waterflood characteristic curve method [22]. The predicted end-point water saturation is lower than the actual value, resulting in an overestimation of the recovery factor by the waterflood characteristic curve method.
The main reason for the deflection of the waterflood characteristic curve when the oilfield enters the high water-cut period is that, with increasing water injection, the continuous oil phase is continuously divided and scoured, gradually transforming into dispersed oil columns, droplets, and films. The oil phase transitions from a continuous phase to a discontinuous (dispersed) phase, while the water phase becomes the continuous phase from the injector wellbore to the producer wellbore [23,24]. After water becomes the continuous phase, its flow capability is enhanced, but its oil-displacing effectiveness deteriorates. Eventually, a portion of the injected water in the formation essentially fails to displace oil and flows directly into the producer wellbore, forming ineffective water cycling [25]. This unique oil-water flow regime during the high water-cut period disrupts the composition of the produced fluid structure, causing the waterflood characteristic curve to exhibit an upward deflection (deviation from linearity).

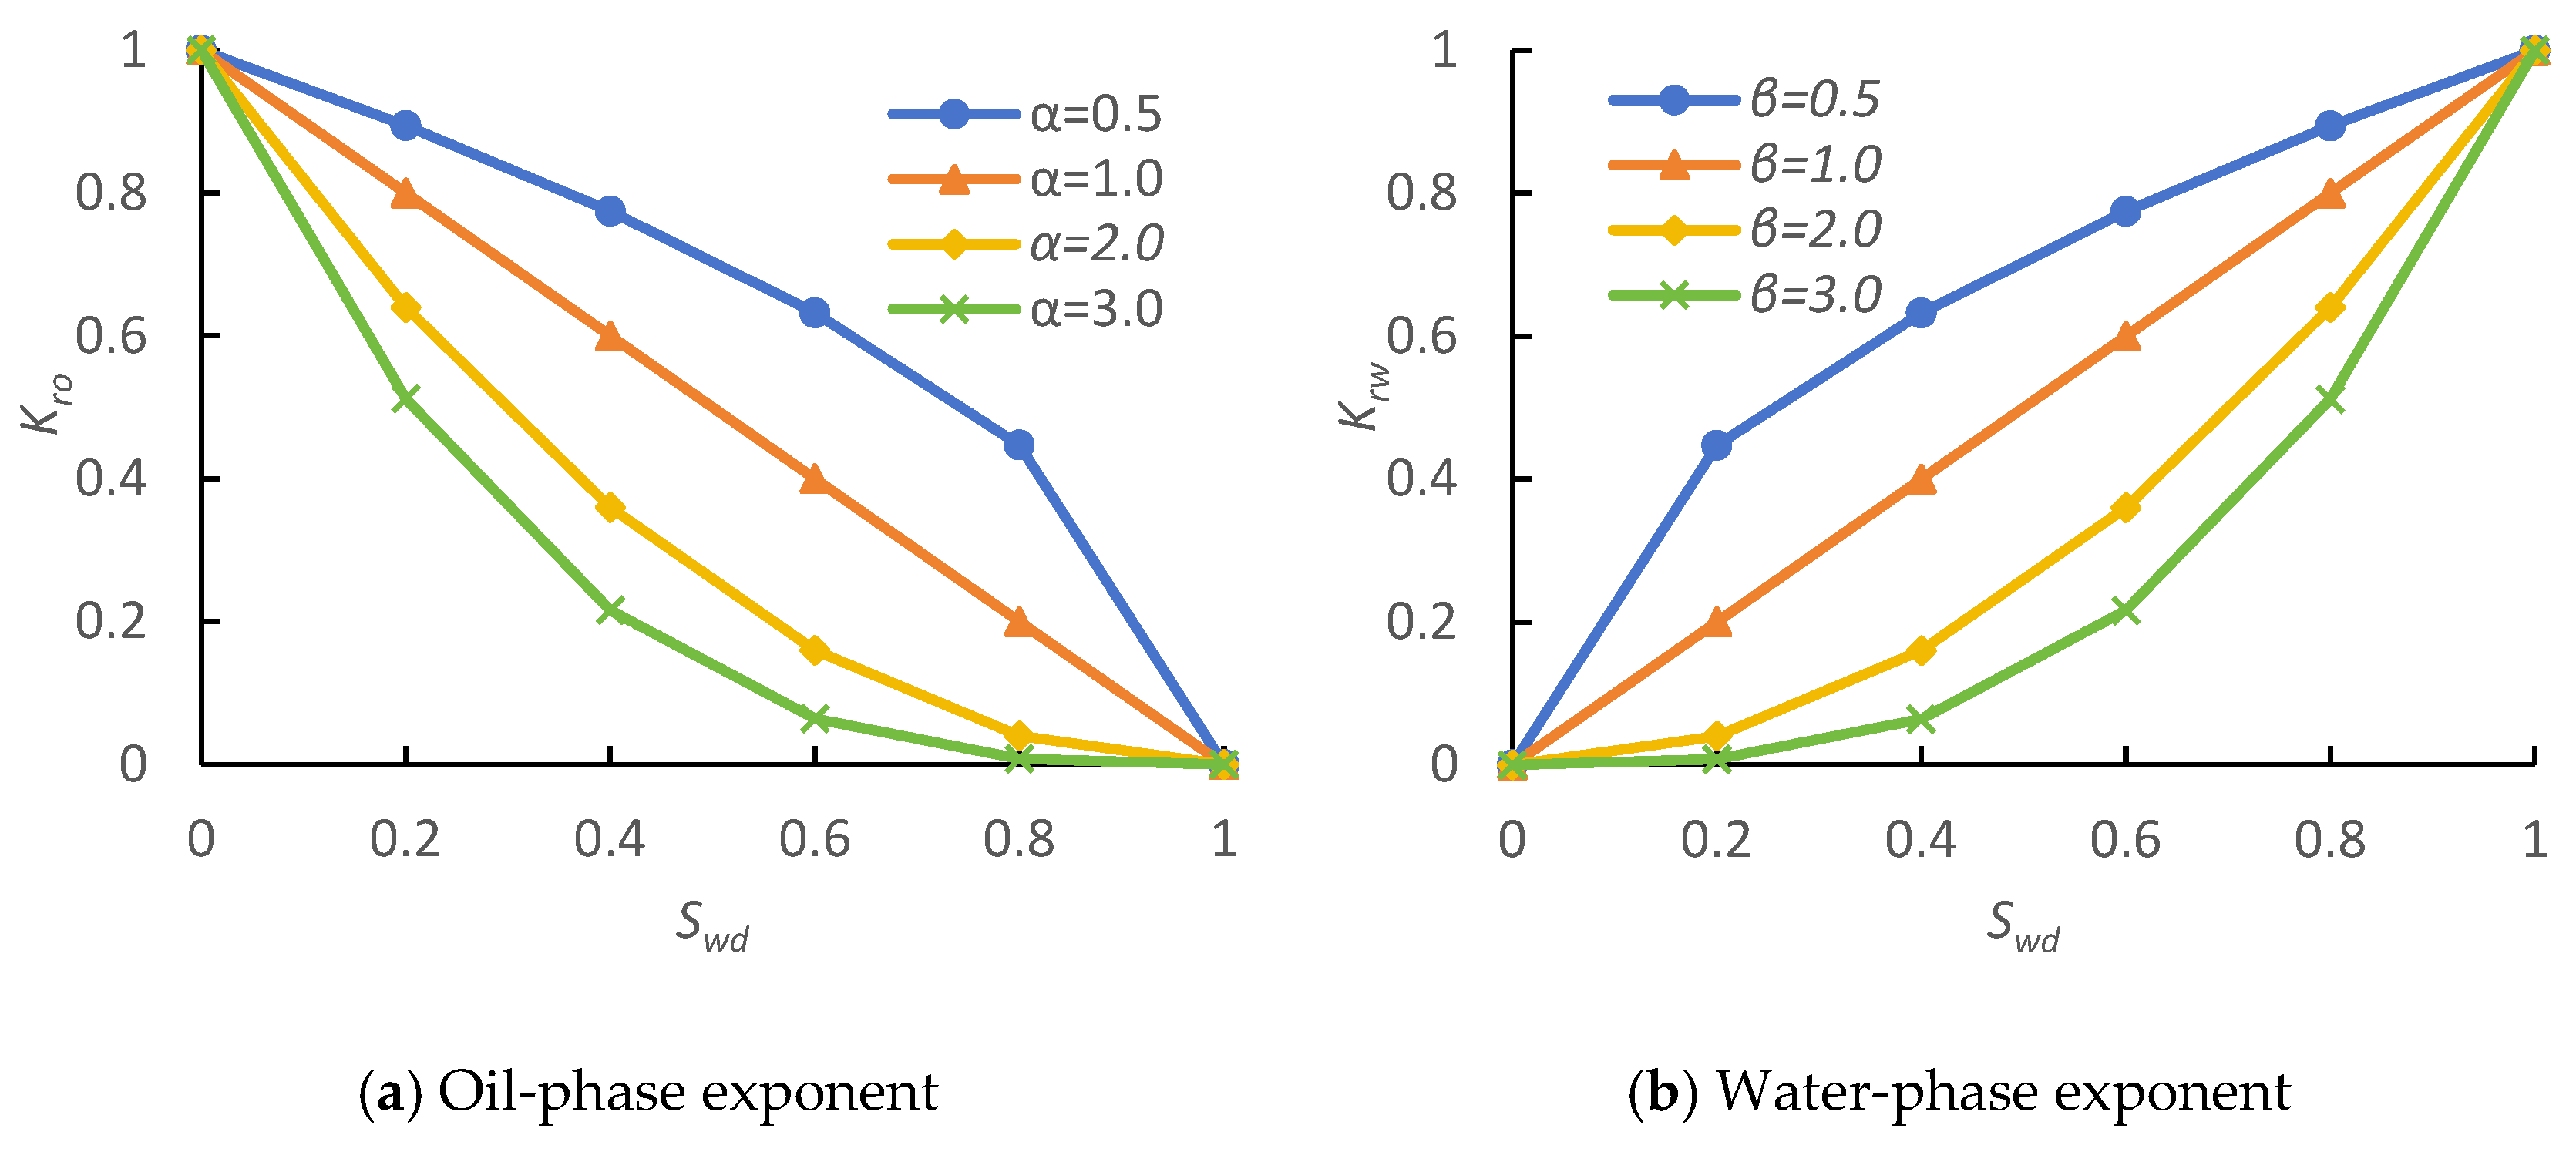
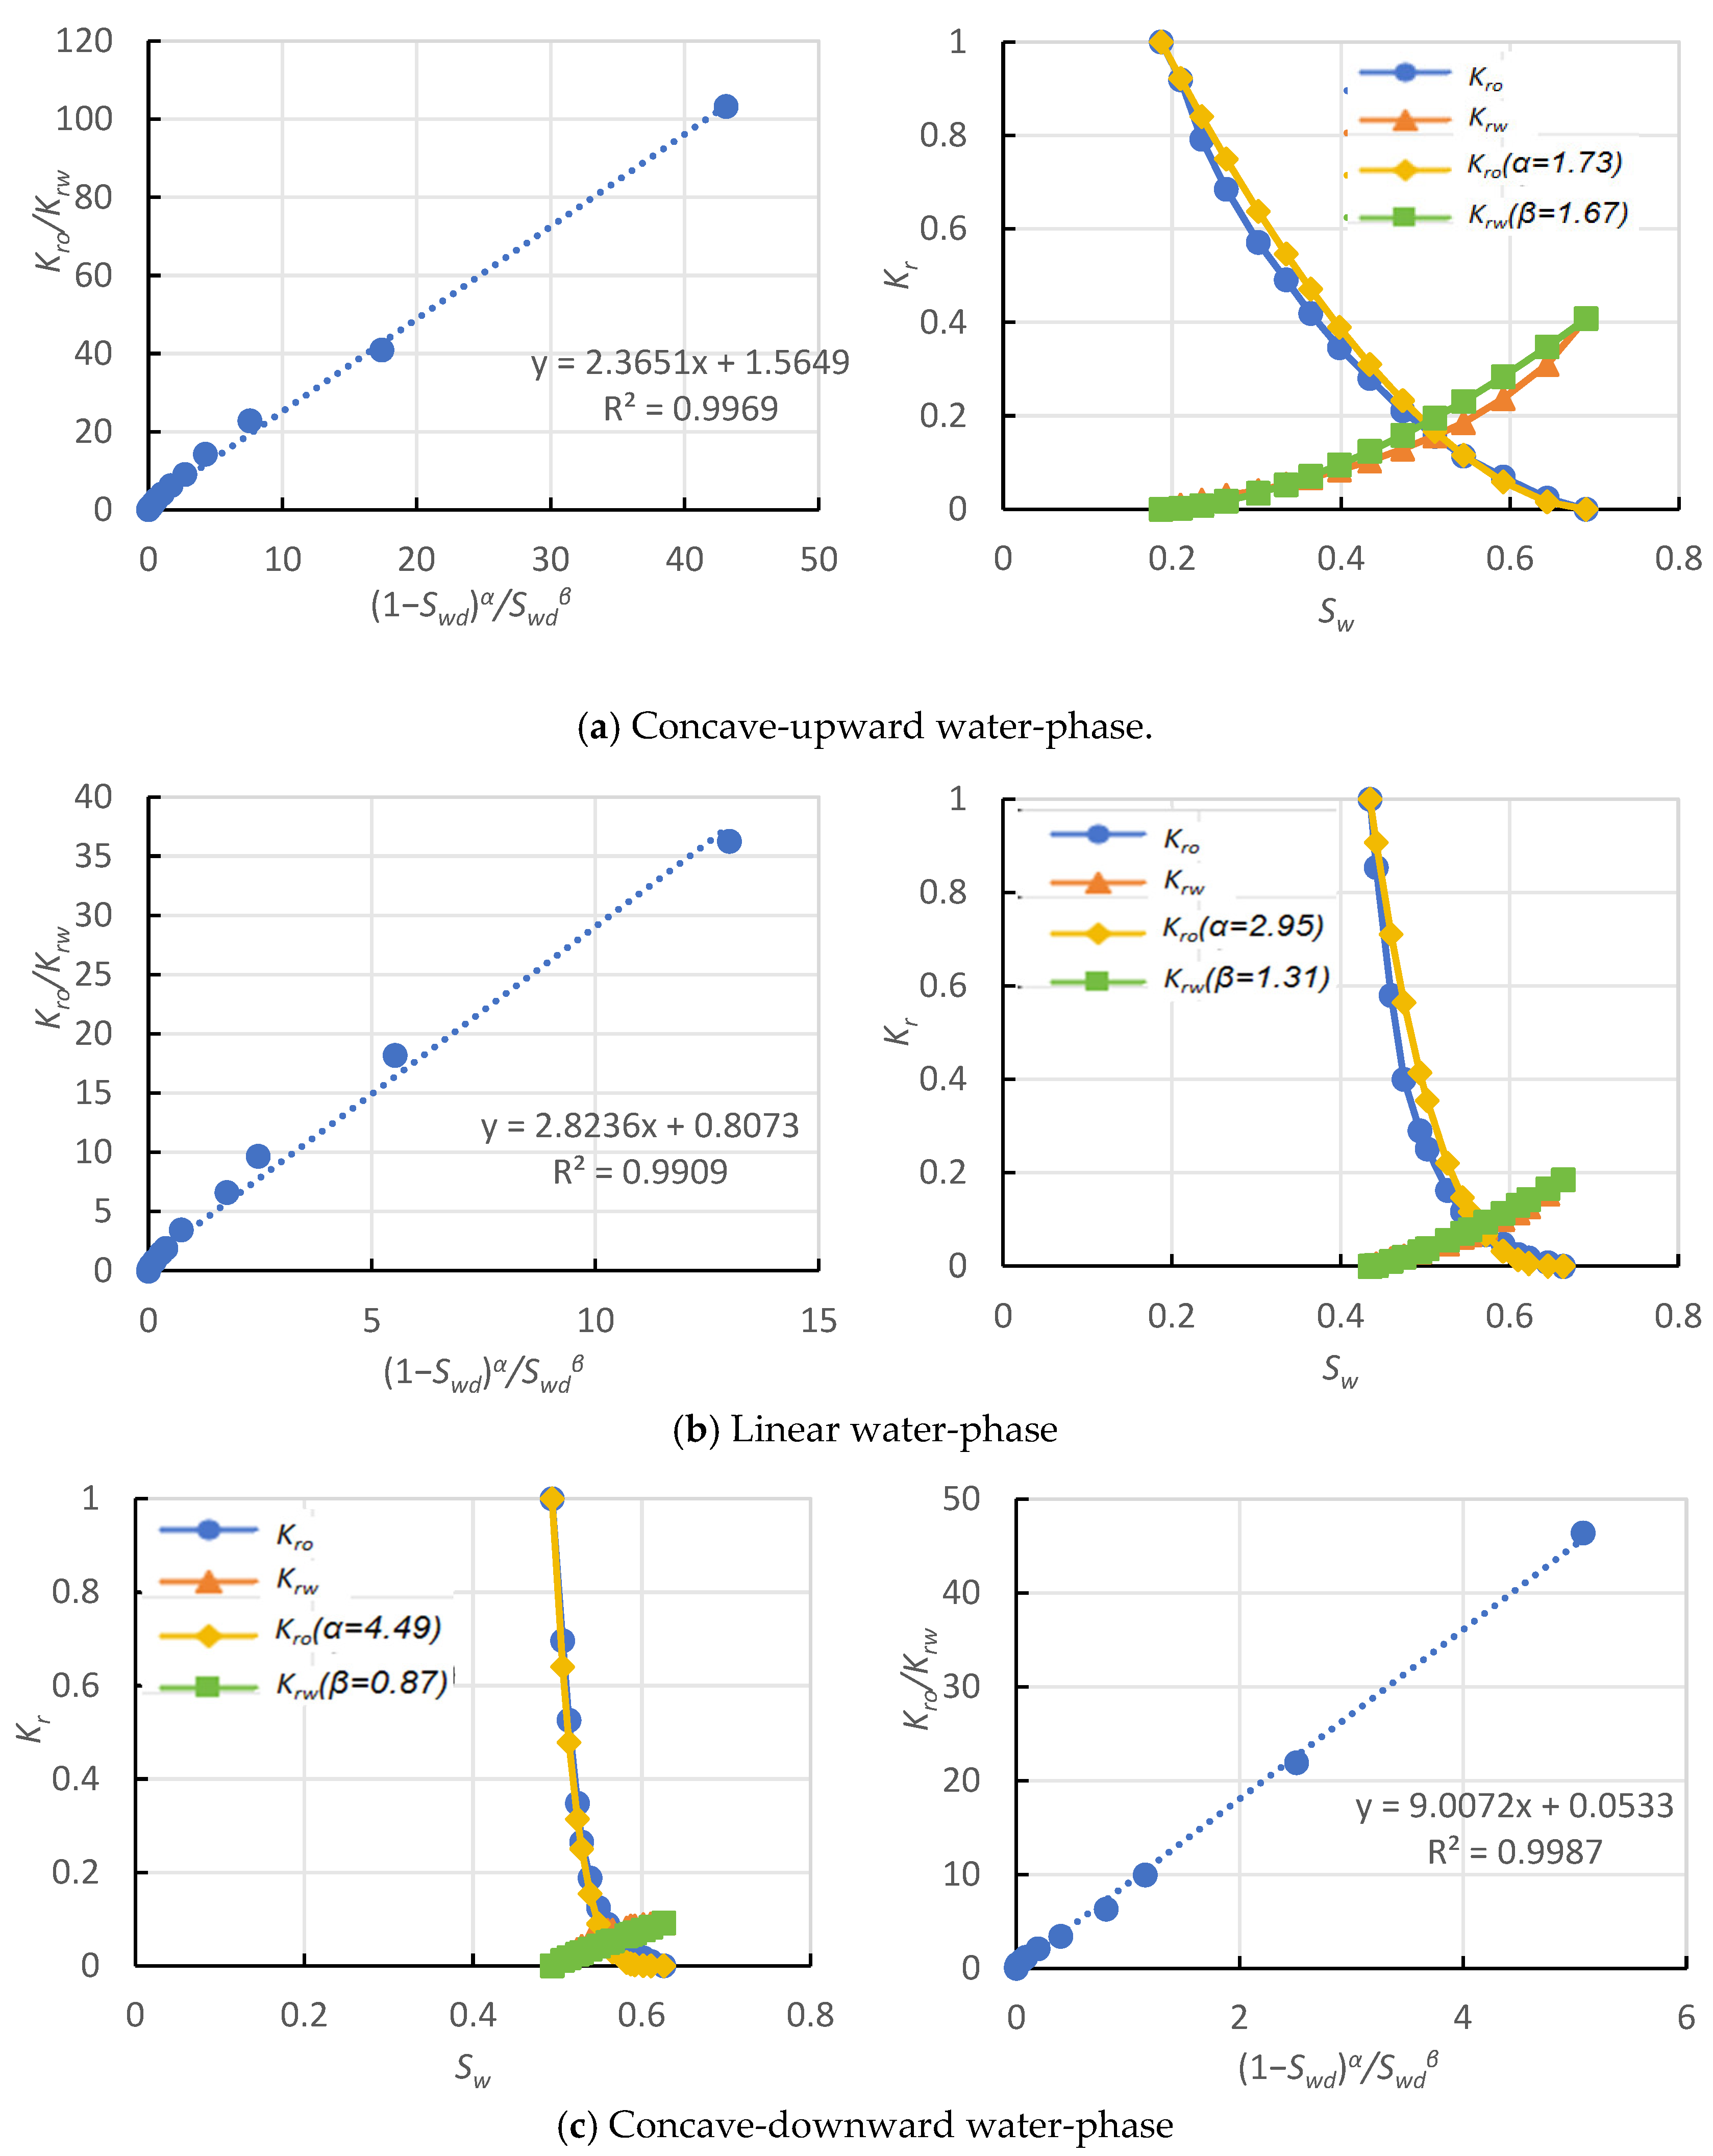
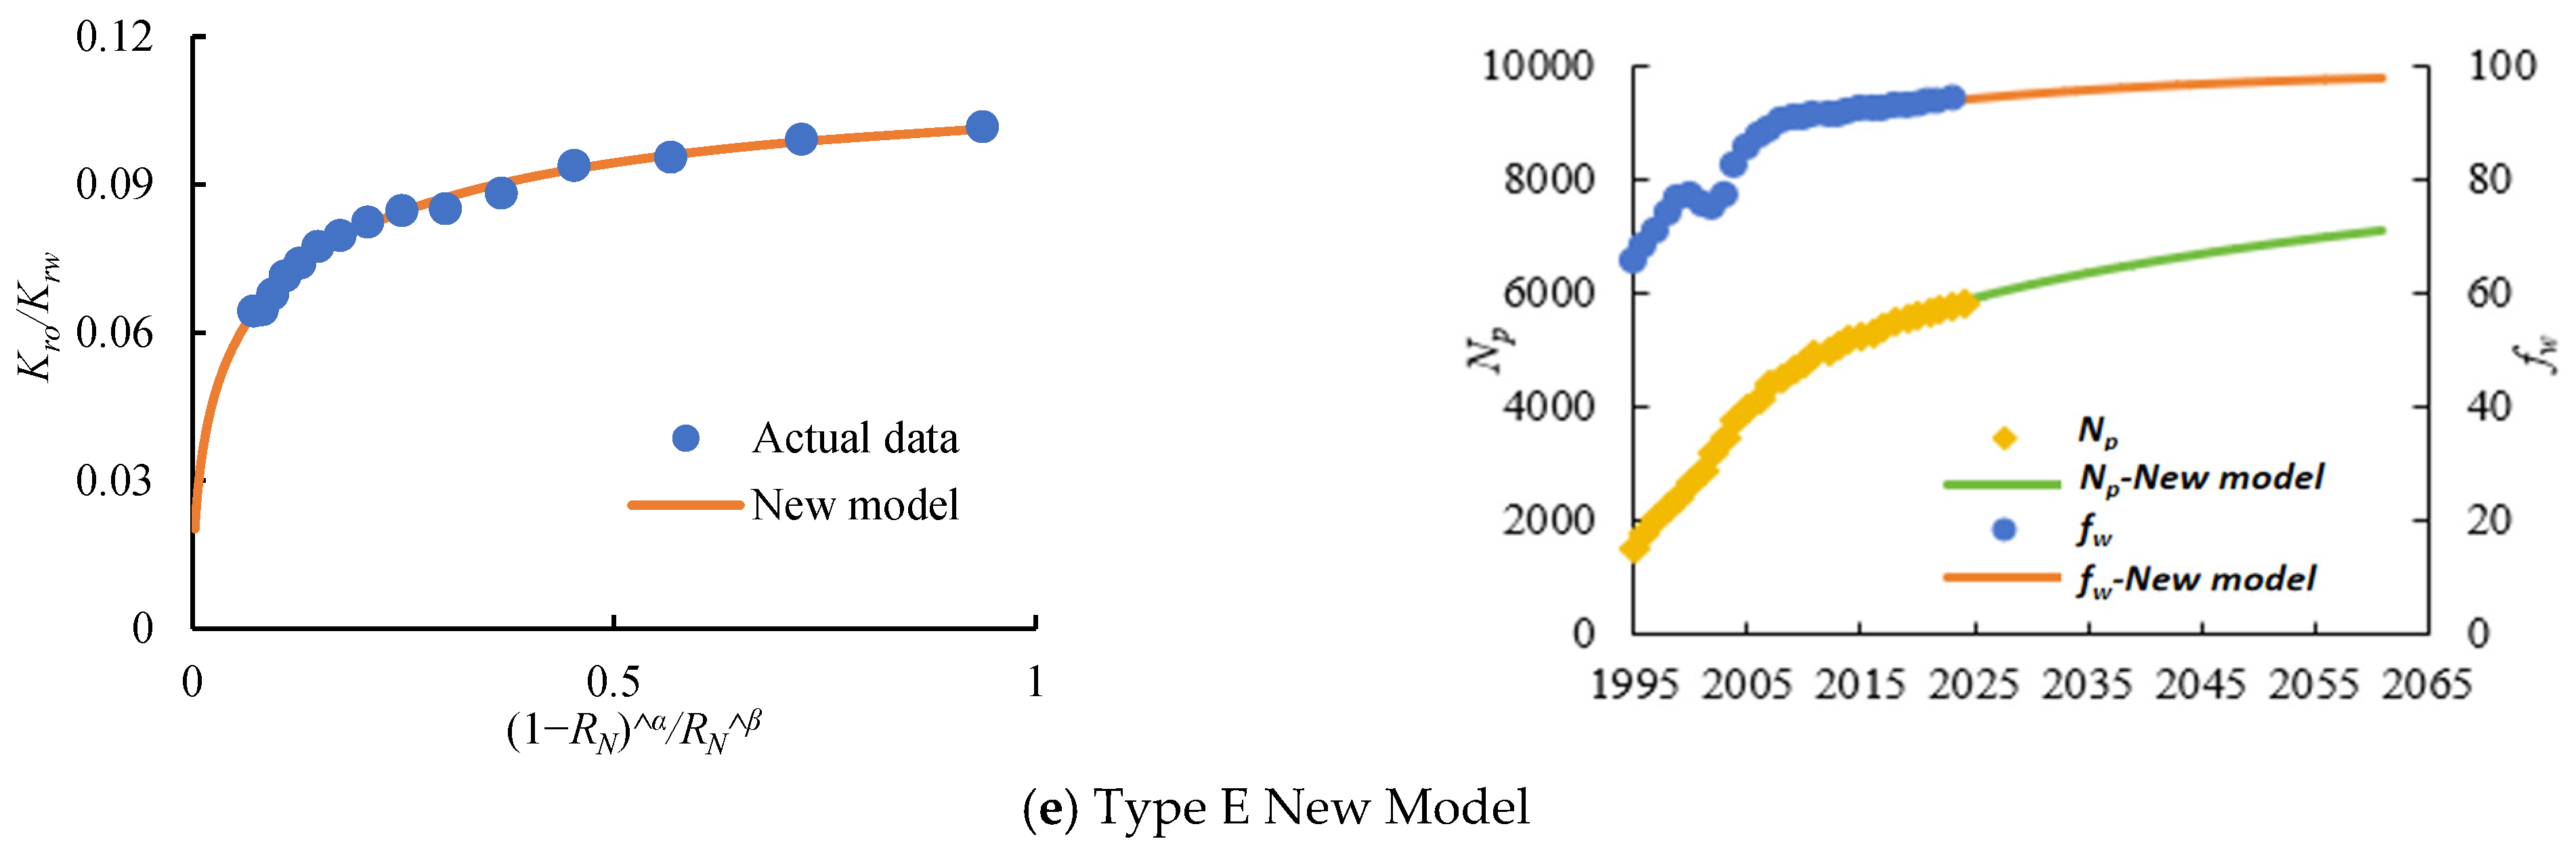
3. Establishment of a Novel Relative Permeability Ratio-Saturation Relationship

Based on Willhite’s empirical model, the relative permeabilities of oil (Kro) and water (Krw) phases are expressed as:
K r o = K r o S w c 1 S w d α
K r w = K r w S o r S w d β
where: S w d = S w S w c 1 S o r S w c
K r o : Oil-phase relative permeability (dimensionless)
K r o ( S w c ): Maximum oil-phase relative permeability at irreducible water saturation (dimensionless)
K r w : Water-phase relative permeability (dimensionless)
K r w ( S o r ): Maximum water-phase relative permeability at residual oil saturation (dimensionless)
S w d : Normalized water saturation (%)
S w : Water saturation at any time (%)
S w c : Irreducible water saturation (%)
S o r : Residual oil saturation (%)
α: Oil-phase exponent
β: Water-phase exponent
The relationship between the relative permeability ratio Kro/Krw and normalized water saturation Swd is derived from Equations (1) and (2):
K r o K r w = K r o S w c K r w S o r 1 S w d α S w d β
Logarithmic transformation yields a linear relationship:
lg K r o K r w = α lg 1 S w d - β lg S w d + lg K r o S w c K r w S o r
Here, Kro (Swc) and Krw (Sor) are constants. Given an experimental relative permeability curve, bilinear regression determines α and β. Substituting these exponents into Equations (1) and (2) reconstructs the relative permeability curves, validating the proposed model.
Relative permeability curves typically exhibit three characteristic morphologies based on the water-phase shape: concave, linear, and convex types. While the oil-phase relative permeability (Kro) consistently decreases monotonically across all types, the rate of decline differs significantly: concave water relative permeability curves exhibit a gradual decline in Kro.; linear and convex water relative permeability curves exhibit a rapid decline in Kro [26,27,28]. Conversely, water-phase relative permeability (Krw) curves themselves show distinct shapes: concave, linear, and convex. As Sw increases from Swc to 1 − Sor, Swd approaches 1 (from 0) and 1 − Swd approaches 0 (from 1). Figure 2 reveals distinct constraints for oil-phase exponent α and water-phase exponent β based on curve morphology: ① convex Krw curves: α > 1, β > 1; ② linear Krw curves: α > 1, β ≈ 1; ③ concave Krw curves: α > 1, 0 < β < 1. Excessively large values of α or β restrict fluid flow and contradict observed production behavior. Therefore, coefficient ranges must be constrained during the bilinear regression.
For the three types of relative permeability curves, bilinear regression was employed to determine the oil-phase exponent and water-phase exponent, validating the robustness of the novel permeability ratio-saturation relationship. As illustrated in Figure 3, with increasing normalized water saturation Swd, the permeability ratio Kro/Krw and the term (1 − Swd)α/Swdβ asymptotically approach zero and these variables exhibit strong linear correlation (R2 > 0.99). The reconstructed relative permeability curves, generated using the regressed α and β values, demonstrate exact alignment with experimental data (Figure 3). Critically, unlike conventional waterflood characteristic curves, the novel relationship maintains linearity throughout all development stages, enabling full-field lifecycle applicability. It preserves physical consistency: At Swd = 0, K r w ( S w c ) = 0, as Swd → 1: Kro/Krw → ∞. This endpoint behavior aligns with fundamental waterflood dynamics, confirming the model’s theoretical validity.

4. Establishment of a Technically Recoverable Reserves Prediction Model Based on the Novel Relative Permeability Relationship

Leveraging the novel relative permeability ratio-saturation relationship and reservoir engineering principles, we develop (1) an oil production prediction model based on relative permeability dynamics [29] and (2) a water-cut prediction model governing fluid displacement efficiency. These models enable accurate forecasting of technically recoverable reserves (TRRs), providing a scientific basis for determining (1) the economic life of oilfields, (2) development strategy adjustments, and (3) the ultimate recovery factor.

4.1. Oil Production Prediction Model Based on Relative Permeability

Under waterflooding conditions with maintained reservoir pressure, the oil production rate at any time is calculated from reservoir flow principles as:
Q o = 2 π K K r o h Δ P μ o B o ln r e r w 1 2
where:
Q o : Oil production rate at any time
K : Absolute permeability (D)
h : Reservoir thickness (m)
Δ P : Pressure differential (MPa)
μ o : Oil viscosity (mPa·s)
B o : Oil formation volume factor (dimensionless)
r e : Drainage radius (m)
r w : Wellbore radius (m)
K r o ( S w ) : Oil relative permeability at current water saturation
Initial Oil Production Rate:
Q o i = 2 π K K r o S w c h Δ P μ o B o ln r e r w 1 2
Combining Equations (5) and (6) yields:
Q o = Q o i K r o K r o S w c
Under voidage replacement conditions, where the volume of injected water equals the volume of produced oil on a reservoir pore volume basis, the differential equation for water saturation versus time is:
V ϕ d S w = Q o B o d t
Substituting Equations (1) and (7) into Equation (8) and expressing it in integral form yields:
S w c S w 1 1 S w d α d S w = 0 t Q o i B o V ϕ d t
Since d S w = d S w d , we have S w c S w d S w = 0 S w d d S w d , and substituting this relationship into the above equation yields:
0 S w d 1 S w d α d S w d = 0 t Q o i B o V ϕ d t
Integrating the above equation yields:
1 1 α 1 S w d 1 α 0 S w d = 1 1 α 1 1 S w d 1 α = Q o i B o V ϕ t
From Equation (11), the normalized water saturation is determined by solving:
S w d = 1 1 Q o i B o 1 α V ϕ t 1 1 α
Substituting Equations (1) and (12) into Equation (7) yields:
Q o = Q o i 1 S w d α = Q o i 1 Q o i B o 1 α V ϕ t α 1 α
The above equation constitutes a classical Arps hyperbolic decline model. The decline exponent n and initial decline rate Di are intrinsically related to the oil-phase exponent α. When the decline exponent n approaches 0, taking the limit yields the Arps exponential decline relationship. When the decline exponent n equals 1, the Arps harmonic decline formulation is obtained.
Q o = Q o i 1 + n D i t 1 / n n = α 1 α D i = Q o i B o α V ϕ
where n is the decline exponent and Di is the initial decline rate.
For actual production blocks, although historical oil production exhibits a declining trend, fluctuations may occur due to changes in production schemes and stimulation measures. The selection of the initial decline time and corresponding production rate significantly impacts the accuracy of Arps-based oil production forecasts. To improve prediction precision, a generalized decline law method is proposed. This method converts the production-time relationship into a cumulative production-dependent function.
After an oilfield enters the decline phase, the cumulative oil production at time t can be expressed as:
N p t = N p i + t 0 t Q d t
where:
N p t is the cumulative oil production.
N p i is the cumulative oil production prior to decline.
t 0 is the initial decline time.
Substituting the Arps exponential, hyperbolic, and harmonic decline models into Equation (15), integration yields the relationship between cumulative oil production and annual oil production.
N p t = N p i + t 0 t Q o i e D i t t 0 d t = N p i + Q o i D i 1 Q o Q o i N p i + t 0 t Q o i 1 + n D i t 1 n d t = N p i Q o i 1 n D i Q o Q o i 1 n N p i + t 0 t Q o i 1 + D i t t 0 d t = N p i + Q o i D i ln Q o i Q t
Based on Equation (16), the relationship between annual oil production and cumulative oil production is established.
Exponential decline:
Q o = A B N p t A = D i N p i + Q o i B = D i
Hyperbolic decline:
Q o 1 n = A B N p t A = B N p i B = 1 n D i Q i n
Harmonic decline:
ln Q o = A B N p t A = D i N p i / Q o i + ln Q o i B = D i / Q o i
where A and B are coefficients.
Using field data, Equations (17), (18), and (19) are respectively fitted to actual production data to identify the decline type governing the relationship between annual oil production and cumulative oil production. The coefficients in these equations can be directly obtained through regression of field data. Considering the inherent discrepancies between laboratory experiments and field applications, the decline exponent n and initial decline rate Di calculated from relative permeability curves may contain errors, which affect the accuracy of oil production predictions.

4.2. Water-Cut Prediction Model Based on Relative Permeability

Derived from the novel relative permeability ratio-saturation relationship, a predictive model is established to characterize the water-cut rise behavior versus the recovery degree of recoverable reserves [30,31,32].
The water production rate at any time can be calculated as:
Q w = 2 π K K r w h Δ P μ w B w ln r e r w 1 2
where:
Q w is the water production rate at any time (m3/a).
μ w is the crude oil viscosity (mPa·s).
B w is the water formation volume factor (dimensionless).
Q o Q w = K r o μ o B o / K r w μ w B w = μ w B w K r o S w c μ o B o K r w S o r 1 S w d α S w d β
Taking logarithms on both sides of Equation (21) yields:
lg Q o Q w = α lg 1 S w d β lg S w d + lg μ w B w K r o S w c μ o B o K r w S o r
Combining with the definition of normalized water saturation and dividing both numerator and denominator by 1 S w c yields:
S w d = S w S w c 1 S o r S w c = S w S w c 1 S w c / 1 S o r S w c 1 S w c
For waterflooded reservoirs, the recovery degree and recovery factor formulas are derived by combining the relationship between cumulative oil production and average water saturation with the volumetric method equation.
R = N p t N = S w S w c 1 S w c
R max = 1 S o r S w c 1 S w c
where:
R is the recovery degree (%).
R max is the recovery factor (%).
Substituting Equations (24) and (25) into Equation (23) yields:
S w d = R R max = R N
where R N is the recovery degree of recoverable reserves (%).
Substituting Equation (26) into Equation (22) yields:
lg Q o Q w = α lg 1 R N β lg R N + lg μ w B w K r o S w c μ o B o K r w S o r
Equation (27) demonstrates a strong linear relationship between lg Q o Q w and both lg 1 R N and lg R N . The parameters α and β in this equation can be derived either through regression against production data or obtained from relative permeability curves. Furthermore, during the history matching process, the laboratory-derived α and β values were treated as adjustable parameters. On the one hand, the fitting coefficients α and β can be determined through bilinear regression of production data. On the other hand, the oil-phase exponent α and water-phase exponent β can be derived from relative permeability curves. These two sets of coefficients (α and β) are determined independently. Given the inherent discrepancies between laboratory experiments and field applications, using coefficients derived from relative permeability curves to predict reservoir performance metrics generally yields more limited accuracy. Conversely, coefficients regressed directly from production data typically provide higher-accuracy predictions of field performance.
Q o and Q w are known terms. R N can be calculated from its definition. Based on the relative permeability-based oil production prediction model, when Q o approaches zero, the maximum cumulative oil production and the recovery degree of recoverable reserves are given by:
N p max = A B
R N = N p t N p max = B A N p t
Using the regressed oil-phase exponent α and water-phase exponent β, the temporal evolution of water-cut can be predicted:
f w = Q w Q w + Q o = 1 1 + Q o / Q w = 1 1 + μ w B w K r o S w c μ o B o K r w S o r 1 R N α R N β
The relative-permeability-based oil production rate and water cut prediction models enable forecasting of production metrics at any specified water cut. As water cut increases progressively from 95% to 100%, the technically recoverable reserves (TRRs) exhibit gradual growth with progressively diminishing increments. The cumulative oil production corresponding to the 98% water-cut threshold defines the TRR. This methodology, derived from a novel saturation-dependent relative-permeability-ratio function, remains applicable across all development stages of oilfields.
The theoretical foundation of relative permeability curves lies in Willhite’s mathematical model for oil-water relative permeability. The derivation of the relevant formula primarily serves to validate the linear relationship between the parameters α and β derived from these two distinct sources (relative permeability curves and production data), thereby establishing the theoretical basis for the linear correlation observed in production data.

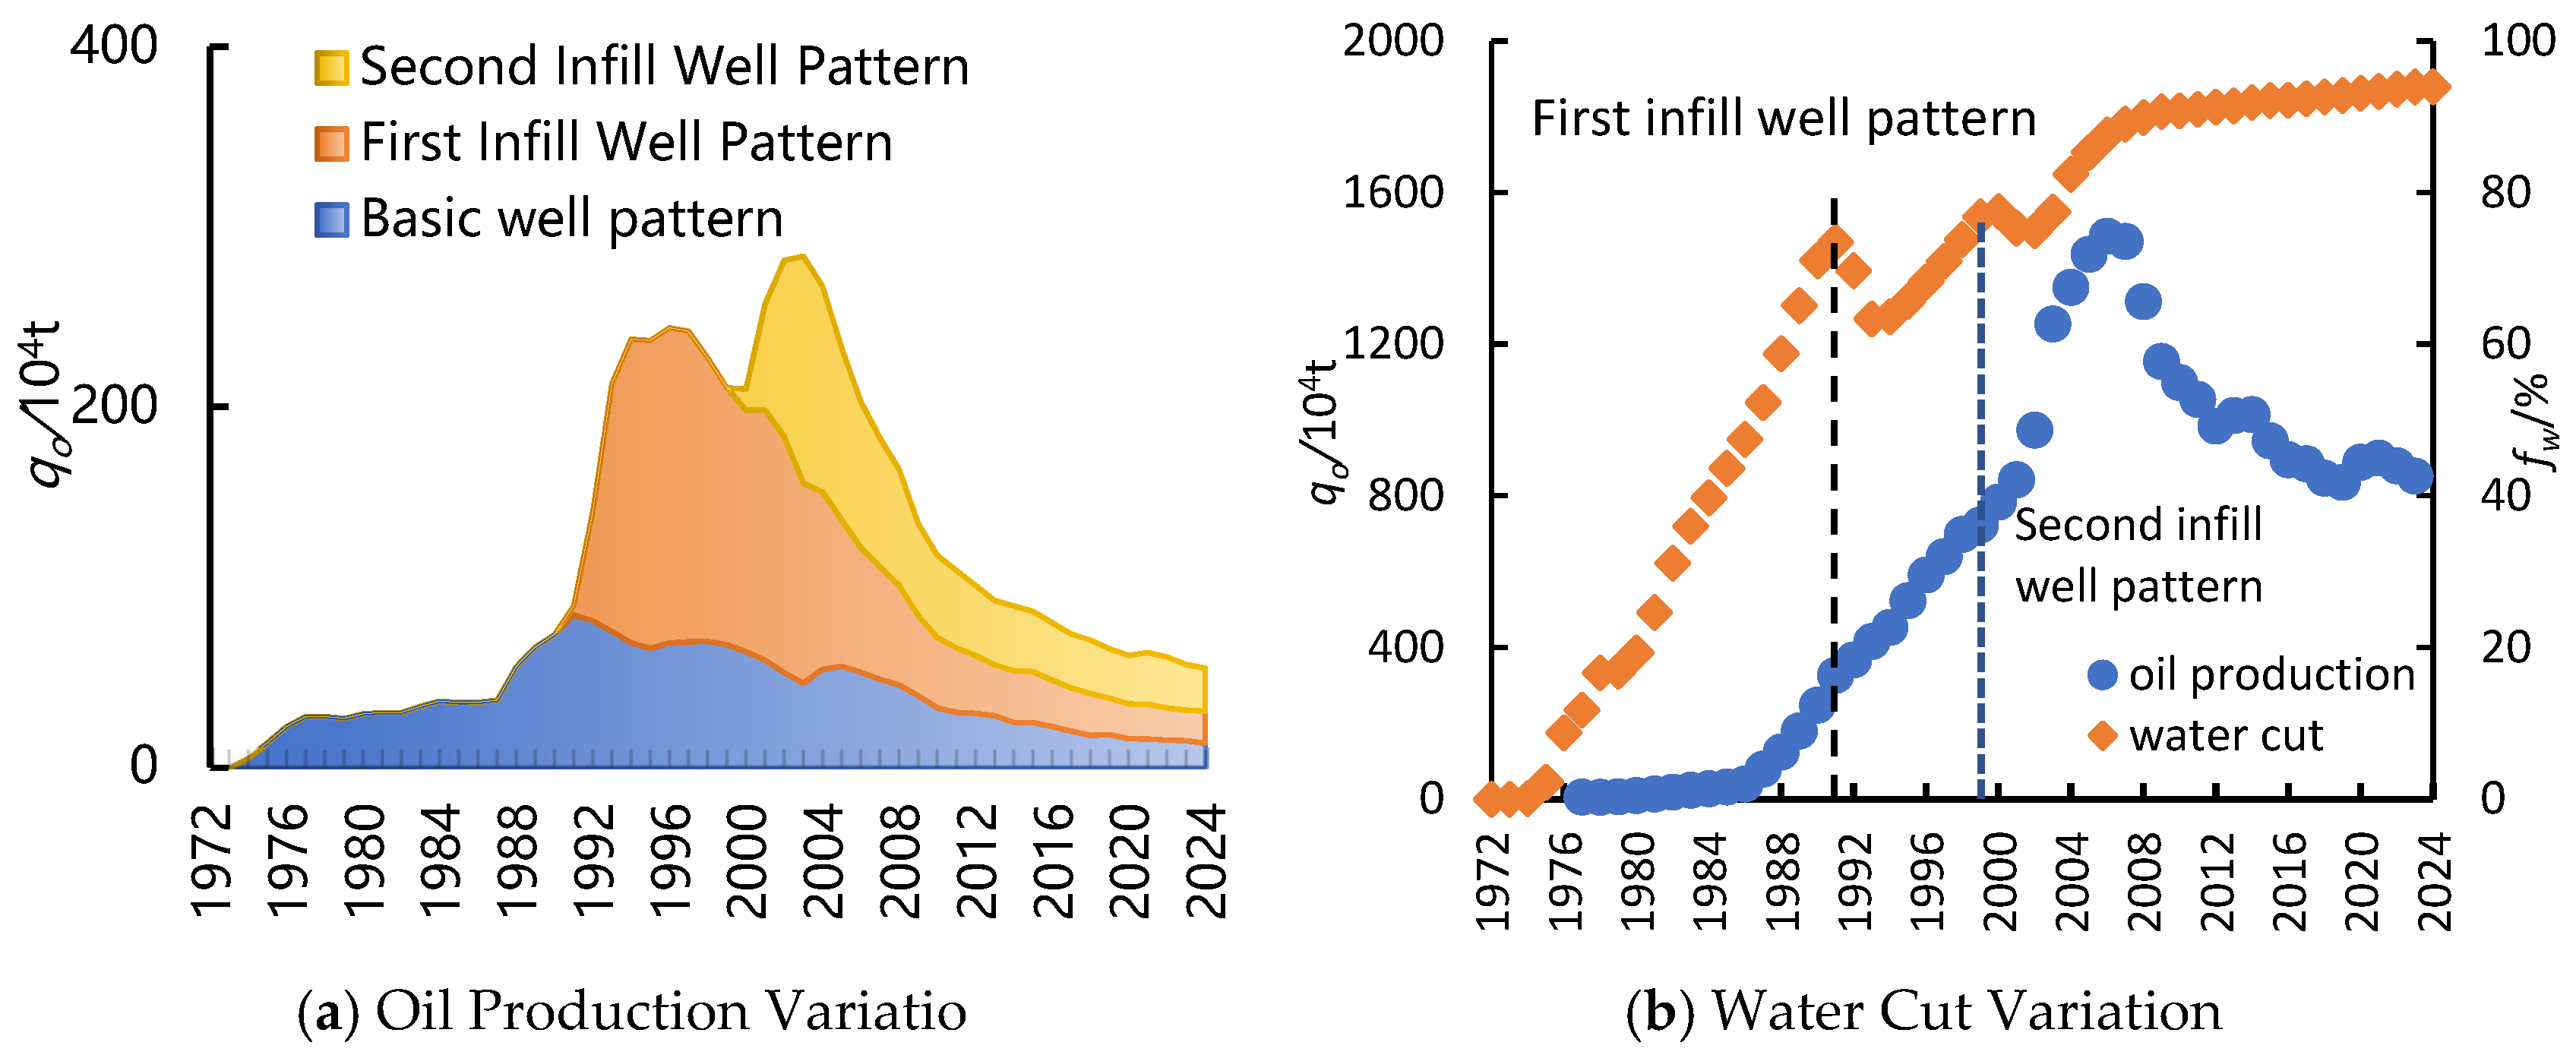
5. Model Case Application and Comparison of Technically Recoverable Reserve Predictions

Taking a high water-cut block in the Daqing Oilfield as an example, the reservoir burial depth ranges from 900 to 1200 m, with an average porosity of 25% and average permeability of 300 × 10−3 μm2. The average initial oil saturation is 68%, and the crude oil viscosity measures 6.8 mPa·s. This block was put into production in 1972 and has undergone successive development phases, including the primary well pattern, secondary infill well pattern [33], and tertiary infill well pattern. The current water cut is approximately 95%, as illustrated in Figure 4.
Analysis of the oil production trend indicates that the block entered the decline phase in 2005, at which point the water cut was 85.29%. The technically recoverable reserves (TRRs) for the block were predicted by applying both the water drive performance curve method and the technical recoverable reserves prediction method based on the new relative permeability ratio-saturation relationship, as illustrated in Figure 5. This study evaluates the applicability of both methods at different water-cut stages. A comparison of the technically recoverable reserve predictions is presented in Table 2.
Based on the calculation results, the Type A water drive performance curve method predicted the highest technically recoverable reserves (TRRs) at 92.2919 million tons. This was followed by the Type D, Type C, and Type B water drive performance curve methods, all of which calculated TRR values exceeding 78.3998 million tons. Although all four water drive performance curve methods exhibited linear relationships with correlation coefficients exceeding 0.90, the relationship between the relative permeability ratio and saturation progressively deviated from the linear segment as the water cut increased, resulting in persistently overestimated TRR predictions. In contrast to the water drive performance curve methods, the new model predicted lower TRRs at 70.7314 million tons. The introduction and establishment of this method address the problem of overestimating recoverable reserves and recovery factors inherent in water drive performance curve methods. It provides a scientific basis for determining core elements such as the economic life of the oilfield, adjustments to development strategies, and the ultimate recovery factor. This approach holds significant importance for formulating oilfield development plans and clarifying technically recoverable reserves (TRRs) and economically recoverable reserves (ERRs).

6. Conclusions

(1) Among reservoir water drive performance curves, Type A and Type C are predominant. After entering the high water-cut stage, the relationship between the relative permeability ratio and saturation deviates from the linear segment, causing the water drive performance curves to also deviate. This results in overestimations of both the technically recoverable reserves (TRRs) and the recovery factor.
(2) A new relationship between the relative permeability ratio and saturation has been established and validated for three types of relative permeability curves. The research results demonstrate that the relative permeability ratio and the normalized water saturation term maintain a linear relationship throughout all development stages. This relationship is applicable to the entire oilfield development life cycle and accurately reflects the physical significance of the waterflooding process. Future work should further demonstrate the feasibility of predicting TRR using this method at different water-cut stages.
(3) A new method for predicting technically recoverable reserves (TRR), based on the novel relative permeability ratio-saturation relationship, has been developed. This method provides accurate TRR predictions. Compared to the TRR range of 78.3998 to 92.2919 million tons predicted by water drive performance curve methods, the new model predicts TRR at 70.7314 million tons. This resolves the issue of overestimation of recoverable reserves and recovery factors inherent in water drive performance curve methods. It provides a scientific basis for determining core elements such as the economic life of the oilfield, development strategy adjustments, and the ultimate recovery factor.

Author Contributions

Validation, J.W. and Y.S.; Formal analysis, D.Y.; Writing—original draft, D.W. All authors have read and agreed to the published version of the manuscript.

Funding

This work was financially supported by the Open Fund of the Shaanxi Key Laboratory of Advanced Stimulation Technology for Oil & Gas Reservoirs (KFJJ-TZ-2023-2), the Heilongjiang Provincial Innovation and Entrepreneurship Training Programme for College Students (202110220070), and the Northeast Petroleum University Talent Introduction Scientific Research Start-Up Foundation Project: ‘Dynamic characterisation and prediction method of phase behaviour of microemulsion flooding’.

Institutional Review Board Statement

Not applicable.

Informed Consent Statement

Not applicable.

Data Availability Statement

The data presented in this study are available on request from the corresponding author.

Conflicts of Interest

Author Yang Sun is employed by the China National Petroleum Corporation Jilin Oilfield Branch. The remaining authors declare that the research was conducted in the absence of any commercial or financial relationships that could be construed as a potential conflict of interest.

Glossary

t0time of beginning of decreasing trend, a
tproduction year since the beginning, a
Noriginal geological reserves, 104 t
Npicumulative production at beginning of decreasing trend, 104 t
Npcumulative oil production starts from the production year to any year, 104 t
Nptcumulative oil production starts from the production time to t year, 104 t
Npmtechnologically recoverable reserves, 104 t
Qiproduction at the beginning of decreasing trend, 104 t/a
Qtannual production at time t, 104 t/a
QTLtechnological limited production, 104 t/a
Qoannual oil production, 104 t/a
Qwannual water production, 104 t/a
Didecreasing rate, a−1
ndecreasing index
Rrecovery degree, %
Edoil displacement efficiency, %
RNrecovery degree of recoverable reserves, %
Swwater saturation
Swdnormalized water saturation
Sorresidual oil saturation
Kro, Krwoil phase relative permeability and water phase relative permeability
Kro (Swc), Krw (Sor)oil phase relative permeability when water saturation is equal to irreducible water saturation and water phase relative permeability when oil saturation is equal to residual oil saturation
μo, μwviscosity of oil and viscosity of water, mPa·s
Bo, Bwvolume coefficient of oil and volume coefficient of water
ρo, ρwdensity of oil and density of water, 103 kg/m3
WORwater oil ratio
fwwater cut, %
A, B, a, b, cfitting coefficient
α, βoil phase index and water phase index

References

  1. Chen, Y.Q.; Xu, L. Multi-solution and uncertainty of Arps’ hyperbolic exponential decline model. Pet. Geol. Recovery Effic. 2022, 29, 80–84. [Google Scholar]
  2. Liu, Z. Application Examples of Dynamic Reserves Calculation Methods. Well Test. 2008, 17, 29–31, 73. [Google Scholar]
  3. Liu, F. Application of Dynamic Method. in Recoverable Reserve Evaluation of Nantun Formation Oil Reservoir in Bei 301 Block. Inner Mong. Petrochem. Ind. 2012, 7, 130–133. [Google Scholar]
  4. Guo, F.F.; Tang, J.R.; Luo, D.; Wang, J.; Zhang, H. Early Dynamic Reserve Calculation Methods and Case Application for Shale Gas Wells. In Proceedings of the 2016 Natural Gas Academic Annual Meeting, Yinchuan, China, 28–29 September 2016; pp. 1–6. [Google Scholar]
  5. Wang, Z.C.; Tian, L.; Li, J.; Li, P.; Chai, X.; Deng, X.; Jiang, L. Reserve utilization evaluation model for tight gas well based on low-velocity non-Darcy seepage. Nat. Gas Geosci. 2025, 36, 1000–1011. [Google Scholar]
  6. Lan, L.L. Application of Reservoir Numerical Simulation in Fluvial Facies Integrated Reservoirs. Henan Sci. Technol. 2024, 874, 42–47. [Google Scholar]
  7. Mi, N.Z.; Qiao, X.Y.; Li, X.F.; Lu, Y.; Xu, W.; Xie, X.F. Applying artificial intelligence methods to calculate recoverable reserves of tight gas reservoirs: Taking BP neural network as an example. Petrol. Geol. Oilfield Dev. Daqing 2025, 44, 70–76. [Google Scholar]
  8. Zhou, X.M.; Morrow, N.R. Interrelationship of Wettability, Initial Water Saturation, Aging Time, and Oil Recovery by Spontaneous Imbibition and Waterflooding. SPE J. 2000, 5, 199–207. [Google Scholar] [CrossRef]
  9. Wang, D.Q.; Yin, D.Y.; Zhou, Y.Z. Fine Classification of Ultra-Low Permeability Reservoirs around the Placanticline of Daqing oilfield (PR of China). J. Pet. Sci. Eng. 2019, 174, 1042–1052. [Google Scholar] [CrossRef]
  10. Li, S.S.; Feng, Q.H.; Zhang, X.M.; Yu, C.L.; Huang, Y.S. A new water flooding characteristic curve at ultra-high water cut stage. J. Pet. Explor. Prod. Technol. 2023, 13, 101–110. [Google Scholar] [CrossRef]
  11. Shin, H.J.; Lim, J.S.; Shin, S.H. Estimated ultimate recovery prediction using oil and gas production decline curve analysis and cash flow analysis for resource play. Geosyst. Eng. 2014, 17, 78–87. [Google Scholar] [CrossRef]
  12. Wang, L.Q.; Zheng, L.Q.; Luo, X.H.; Wang, M.X.; Yang, B.; Kou, G.; Sun, X. Testing and interpretation of differences in oil-water relative permeability curves for converntional heavy oil overseas. Contemp. Chem. Ind. 2023, 52, 2168–2171, 2191. [Google Scholar]
  13. Gu, J.W.; Ren, Y.L.; Zhang, Y.G.; Cui, W.F. Research and application of an Improved Type-B water-flooding characteristic curve. Spec. Oil Gas Reserv. 2020, 27, 102–107. [Google Scholar]
  14. SY/T 5367-2010; Methods for Determination of Rock Wettability. Petroleum Industry Press: Beijing, China, 2010.
  15. Li, K.; Hu, S.Y.; Zhang, J.Q.; Zhu, G.J.; Zhou, S.W.; Geng, Y.H. A new type water flooding characteristic curve and its application. Reserv. Eval. Dev. 2019, 9, 13–20. [Google Scholar]
  16. Guo, Y.H.; Zhang, L.; Yao, J.; Zhu, G.P.; Sun, H.; Yang, Y.F.; Huang, T. Mechanisms of water flooding characteristic curve upwarping at high water-cut stage and influencing factors. Chin. Sci. Bull. 2019, 64, 2678–2690. [Google Scholar] [CrossRef]
  17. Wang, M.N.; Cai, H.; Chen, X.Q.; Zhang, J.T.; Xie, Y. Optimization of Injection Parameters for Profile Control and Flooding in an Oilfield during High Water Cut Period. J. Geosci. Environ. Prot. 2023, 11, 73–81. [Google Scholar] [CrossRef]
  18. Julianto, C.; Tulloh, H.; Priambodo, A.; Nugroho, M.R.; Kurniawan, H. Production Forecast Studies for Oil Well Performance Prediction and Field Development Scenario Using Decline Curve Analysis in Multilayer Reservoirs: A Case Study of Field Z. In Proceedings of the NST Symposium, Surabaya, Indonesia, 25 November 2020; pp. 133–139. [Google Scholar]
  19. Zhang, M.L.; Fan, J.Y.; Zhang, Y.C.; Ren, Y.N. Study on the relationship between the water cutting rate and the remaining oil saturation of the reservoir by using the index percolating saturation formula with variable coefficients. J. Pet. Explor. Prod. Technol. 2020, 10, 2293–2305. [Google Scholar] [CrossRef]
  20. Dou, H.E.; Zhang, H.J.; Shen, S.B. Correct understanding and application of waterflooding characteristic curve. Pet. Explor. Dev. 2019, 46, 755–762. [Google Scholar] [CrossRef]
  21. Deng, S.; Wang, N.T.; Meng, L.Q.; Wu, Z.; Chen, Z.L. Establishment and application of the new two-type water-flooding characteristic curves at high water cut stage. Pet. Geol. Oilfield Dev. Daqing 2017, 36, 58–63. [Google Scholar]
  22. Liu, S.H.; Gu, J.W.; Yang, R.F. New water-flooding characteristic curve at high water-cut stage. J. Liaoning Tech. Univ. (Nat. Sci.) 2011, 30 (Suppl. 1), 158–163. [Google Scholar] [CrossRef]
  23. Song, Z.J.; Li, Z.P.; Lai, F.P.; Liu, G.; Gan, H.H. Derivation of water flooding characteristic curve for high water-cut oilfields. Pet. Explor. Dev. 2013, 40, 201–208. [Google Scholar] [CrossRef]
  24. Can, B.; Kabir, C.S. Simple tools for forecasting waterflood performance. J. Pet. Sci. Eng. 2014, 120, 111–118. [Google Scholar] [CrossRef]
  25. Zhao, L.; Zhao, Q.S.; Chen, H.; Li, Y.L.; Yang, Y.Q. Selection Method of Waterflooding Curve for Predicting Recovery in Medium and High Water Cut Period. Contemp. Chem. Ind. 2021, 50, 652–655, 660. [Google Scholar]
  26. Shao, B.X. Study on relative permeability equation adapted at ultra-high water-cut stage. J. Oil Gas Technol. 2012, 34, 118–120. [Google Scholar]
  27. Wang, H.; Shao, B.X.; Zhang, H.Y.; Yan, Z.; An, Y.S.; Sun, Z.G. A new method suitable for water-oil displacement efficiency calculation in extra-high water cut period. Fault-Block Oil Gas Field 2013, 20, 201–203. [Google Scholar]
  28. Zhu, G.P.; Yao, J.; Zhang, L.; Sun, H.; Li, A.F.; Zhang, K. Pore-scale investigation of residual oil distributions and formation mechanisms at the extra-high water-cut stage. Chin. Sci. Bull. 2017, 62, 2553–2563. [Google Scholar]
  29. Hu, H.G. Characterization of microscopic remaining oil distribution and oil displacement efficiency in ultra-high water cut period. J. Guangdong Univ. Petrochem. Technol. 2023, 33, 43–46. [Google Scholar]
  30. Guan, C.; Li, X.J.; Zhang, J. Derivation and application of a novel waterflooding type curves under different levels of water cut. Sci. Technol. Eng. 2023, 23, 9470–9475. [Google Scholar]
  31. Hou, J.; Wang, R.R.; Xia, Z.Z.; Shao, B.X.; Su, Y.H.; Wang, H. Improvement of water displacement curve for water flooded oil reservoirs at ultra-high water cut stage. J. China Univ. Pet. 2013, 37, 72–75. [Google Scholar]
  32. Liu, H.H.; Yan, Y.Q. New theory and practice of characterizing phase infiltration relationships in ultra-high water-cut period. J. Southwest Pet. Univ. (Sci. Technol. Ed.) 2019, 41, 127–136. [Google Scholar]
  33. Wang, D.Q.; Yin, D.Y.; Zhou, Y.Z. Calculation method of comprehensive relative permeability curve for ultra-low permeability reservoir with fractured-developed. Reserv. Eval. Dev. 2017, 7, 20–25. [Google Scholar]
Figure 1. Problems of waterflood characteristic curves.
Eng 06 00182 g001
Figure 2. Value constraints for oil-phase exponent and water-phase exponent.
Eng 06 00182 g002
Figure 3. Validation of the novel permeability ratio-saturation relationship.
Eng 06 00182 g003
Figure 4. Historical development performance indicators of a high water-cut block in the Daqing Oilfield.
Eng 06 00182 g004
Figure 5. Comparison of technically recoverable reserve predictions.
Eng 06 00182 g005aEng 06 00182 g005b
Table 1. Prediction of technically recoverable reserves (TRRs) by waterflood characteristic curve method.
TypeFormulaRelative Permeability Ratio and Water Saturation RelationshipCalculation Formula for
Technically Recoverable Reserves
Type A lg W p = A + B N p K r o / K r w = a e b S w N p max = 1 B lg f w 2.3 B 1 f w A B
Type B lg W O R = A + B N p K r o / K r w = a e b S w N p max = 1 B lg f w 1 f w A B
Type C L p / N p = A + B L p K r o K r w = μ o / μ w A a + b S w 2 1 N p max = 1 B 1 A 1 f w
Type D L p / N p = A + B W p K r o K r w = μ o / μ w A 1 a + b S w 2 N p max = 1 B 1 A 1 1 / f w 1
Table 2. Comparison of technically recoverable reserve predictions.
MethodABR2MAPE/%Np (fw = 95%)NPmax
Type A3.18160.00020.99986.249161.689229.19
Type B0.12220.00020.904811.947772.477839.98
Type C2.25730.00010.99984.996640.467875.24
Type D2.63220.00010.99975.497069.048174.89
New Model8.17260.00070.99980.0476119.707073.14
Disclaimer/Publisher’s Note: The statements, opinions and data contained in all publications are solely those of the individual author(s) and contributor(s) and not of MDPI and/or the editor(s). MDPI and/or the editor(s) disclaim responsibility for any injury to people or property resulting from any ideas, methods, instructions or products referred to in the content.

