Article

Hydrochemical Characteristics and Genesis Analysis of Closed Coal Mining Areas in Southwestern Shandong Province, China

1
Jiangsu Mineral Resources and Geological Design and Research Institute, China National Administration of Coal Geology, Xuzhou 221006, China
2
School of Environment and Spatial Informatics, China University of Mining and Technology, Xuzhou 221116, China
3
School of Resources and Geosciences, China University of Mining and Technology, Xuzhou 221116, China
4
Key Laboratory of Coalbed Methane Resources and Reservoir Formation Process, Ministry of Education, China University of Mining and Technology, Xuzhou 221008, China
5
School of Civil Engineering, Xuzhou University of Technology, Xuzhou 221018, China
*
Authors to whom correspondence should be addressed.
Eng 2025, 6(7), 164; https://doi.org/10.3390/eng6070164
Submission received: 30 May 2025 / Revised: 10 July 2025 / Accepted: 11 July 2025 / Published: 18 July 2025

Abstract

With the large-scale closure of coal mines leading to groundwater pollution, in order to systematically identify the sources of major chemical ions in surface water and groundwater. This study comprehensively applied methods such as Piper’s trilinear diagram, linear fitting, and correlation analysis to quantitatively analyze the hydrochemical characteristics of closed coal mining areas in southwest Shandong and to clarify the sources of geochemical components in surface water and groundwater, and the PMF model was used to analyze the sources of chemical components in mine water and karst water. The results show that the concentrations of TDS ( Total Dissolved Solids), SO42−, Fe, and Mn in the mine water of the closed coal mine area are higher than in the karst water. Both water bodies are above groundwater quality standards. Ca2+, SO42−, and HCO3 dominate the ionic components in surface water and different types of groundwater. The hydrochemical types of surface, pore, and mine waters are mainly SO4-HCO3-Ca, whereas SO4-HCO3-Ca and HCO3-SO4-Ca dominate karst waters. SO42− is the leading ion in the TDS of water bodies. The mineralization process of surface water is mainly controlled by the weathering of silicate minerals, while that of the groundwater is mainly controlled by the dissolution of carbonate minerals. The impact of mining activities on surface water and groundwater is significant, while the impact of agricultural activities on surface water and groundwater is relatively small. The degree of impact of coal mining activities on SO42− concentrations in surface water, pore water, and karst water, in descending order, is karst water, surface water, and pore water. The PMF (Positive Matrix Factorization) model analysis results indicate that dissolution of carbonate minerals with sulphate and oxidation dissolution of sulfide minerals are the main sources of chemical constituents in mine waters. Carbonate dissolution, oxidation dissolution of sulfide minerals, domestic sewage, and dissolution of carbonate minerals with sulphate are ranked as the main sources of chemical constituents in karst water from highest to lowest. These findings provide a scientific basis for the assessment and control of groundwater pollution in the areas of closed coal mines.

1. Introduction

With the transformation and upgrading of the economic development model, China has gradually formed a large number of closed coal mines with backward production capacity, resource depletion, and policy requirements [1,2]. Due to differences in coal seam mining, mining techniques, and hydrogeological conditions, there are significant differences in the chemical characteristics of groundwater in closed coal mining areas [3]. In addition, coal mining activities can connect multiple aquifers, and once the mines are closed, it is extremely easy to disrupt the balance of groundwater circulation. Surface water, groundwater from different aquifers, and old mine water in goafs will form complex recharge-discharge relationships and alternating patterns, causing significant changes in the hydrochemical environment. As a result, groundwater resources are severely polluted, and the health of surrounding residents is endangered [4].
Currently, most of the research on groundwater in southwestern Shandong focuses on the distribution and genesis of high-fluoride groundwater, as well as the hydrochemical characteristics of Ordovician limestone karst water and other types of groundwater. There are few reports on the impact of mining activities on different types of groundwater in closed coal mining areas in southwestern Shandong [5,6,7,8,9,10]. Lu et al. analyzed the hydrochemical characteristics of groundwater and the genesis of high-fluoride groundwater in southwestern Shandong by considering factors such as climate, topography, landforms, and lithology, and proposed corresponding prevention and control measures [5]. Liu et al. conducted research using methods such as statistical analysis, hydrochemical equilibrium systems, and ion ratio methods and concluded that the fluorine in high-fluoride groundwater in Shandong Province mainly comes from the dissolution of fluorine-containing minerals. Evaporation concentration, leaching, and water-rock interactions increase the concentration of F-. The mechanism determining the fluorine content in groundwater is the fluorine-calcium antagonistic effect [6]. Bian et al. analyzed the hydrochemical characteristics and formation mechanisms of Ordovician limestone groundwater in the Yanzhou Coalfield using methods such as Piper trilinear diagrams, mineral saturation index methods, and chloro-alkali index methods, but their research did not involve the impact of coal mining activities on karst water [7].
The southwestern part of Shandong Province, China, as a major coal-rich area, is an important hub of the “South to North Water Diversion” project, with the Nansihu Lake Basin (Weishan Lake, Zhaoyang Lake, Dushan Lake, and Nanyang Lake) located within the mining area. It is worth noting that the closure of coal mining areas contains a large amount of high-sulfur coal and sulfide minerals such as pyrite, which are prone to water-rock interaction with groundwater during the closure process of coal mines, producing a large amount of acidic mine water [11]. This has led to excessive concentrations of sulfate in the Nansi Lake Basin, posing a serious threat to the water quality safety of the East Route of the South to North Water Diversion Project. Based on this, the author takes the surface water, pore water, mine water, and Ordovician karst water in the closed coal mining area in southwestern Shandong as the research objects. On the basis of fully considering the conditions of groundwater recharge, runoff, and discharge, the author samples and tests the surface water and groundwater in closed coal mining areas in southwestern Shandong Province, analyzes the geochemical characteristics of surface water and groundwater, studies the sources of hydrochemical components in different water bodies, and provides a theoretical basis for the assessment and prevention of groundwater pollution in closed coal mining areas in southwestern Shandong.

2. Geologic Background

The study area is located in the Nansi Lake Basin in southwestern Shandong. The primary coal-bearing strata are the Taiyuan Formation and the Shanxi Formation of the Carboniferous-Permian (Figure 1a). Together, they contain 18 coal seams with mining levels ranging from −1000 m to 100 m [10,11]. To date, the mining areas to the east and west of the coalfield have been completely closed. The area is rich in groundwater resources, which are easily accessible and have a high degree of development and utilization. The development and utilization of groundwater is mainly from pore water and karst water, with a small proportion coming from fissure water in the bedrock. Groundwater is the most important source of water for the industrial and agricultural sectors and for domestic use in urban areas in the region. The aquifers mainly consist of the Cambrian-Ordovician Sanshanzi Formation of the Jiulong Group and the dolomite, limestone, and dolomitic limestone of the Majiagou Group, where fissure karst is well developed, and each water source has favorable conditions for recharge, discharge, and storage. The type of groundwater is mainly of the fissure-karst confined water (Figure 1b). The Panlong River and its northern and southern tributaries are the major rivers in this area. The Panlong River flows through the central and western parts of the region, divided into northern and southern upstream branches. The river is a rain-fed channel and receives not only the surface runoff from the catchment area but also industrial and domestic wastewater from the mining operations in this region. Following the closure of the coalfields, large areas of goaf have formed underground, leading to mine subsidence disasters and the accumulation of mine water. The water table in the coal-bearing strata has risen significantly. This has changed the hydrodynamic conditions of the basin. Deep confined water has been contaminated by mine water infiltrating through abandoned and broken well pipes and fault zones. This has resulted in contamination of karst groundwater. Some old mine water has overflowed into surface waters through artesian wells.

3. Materials and Methods

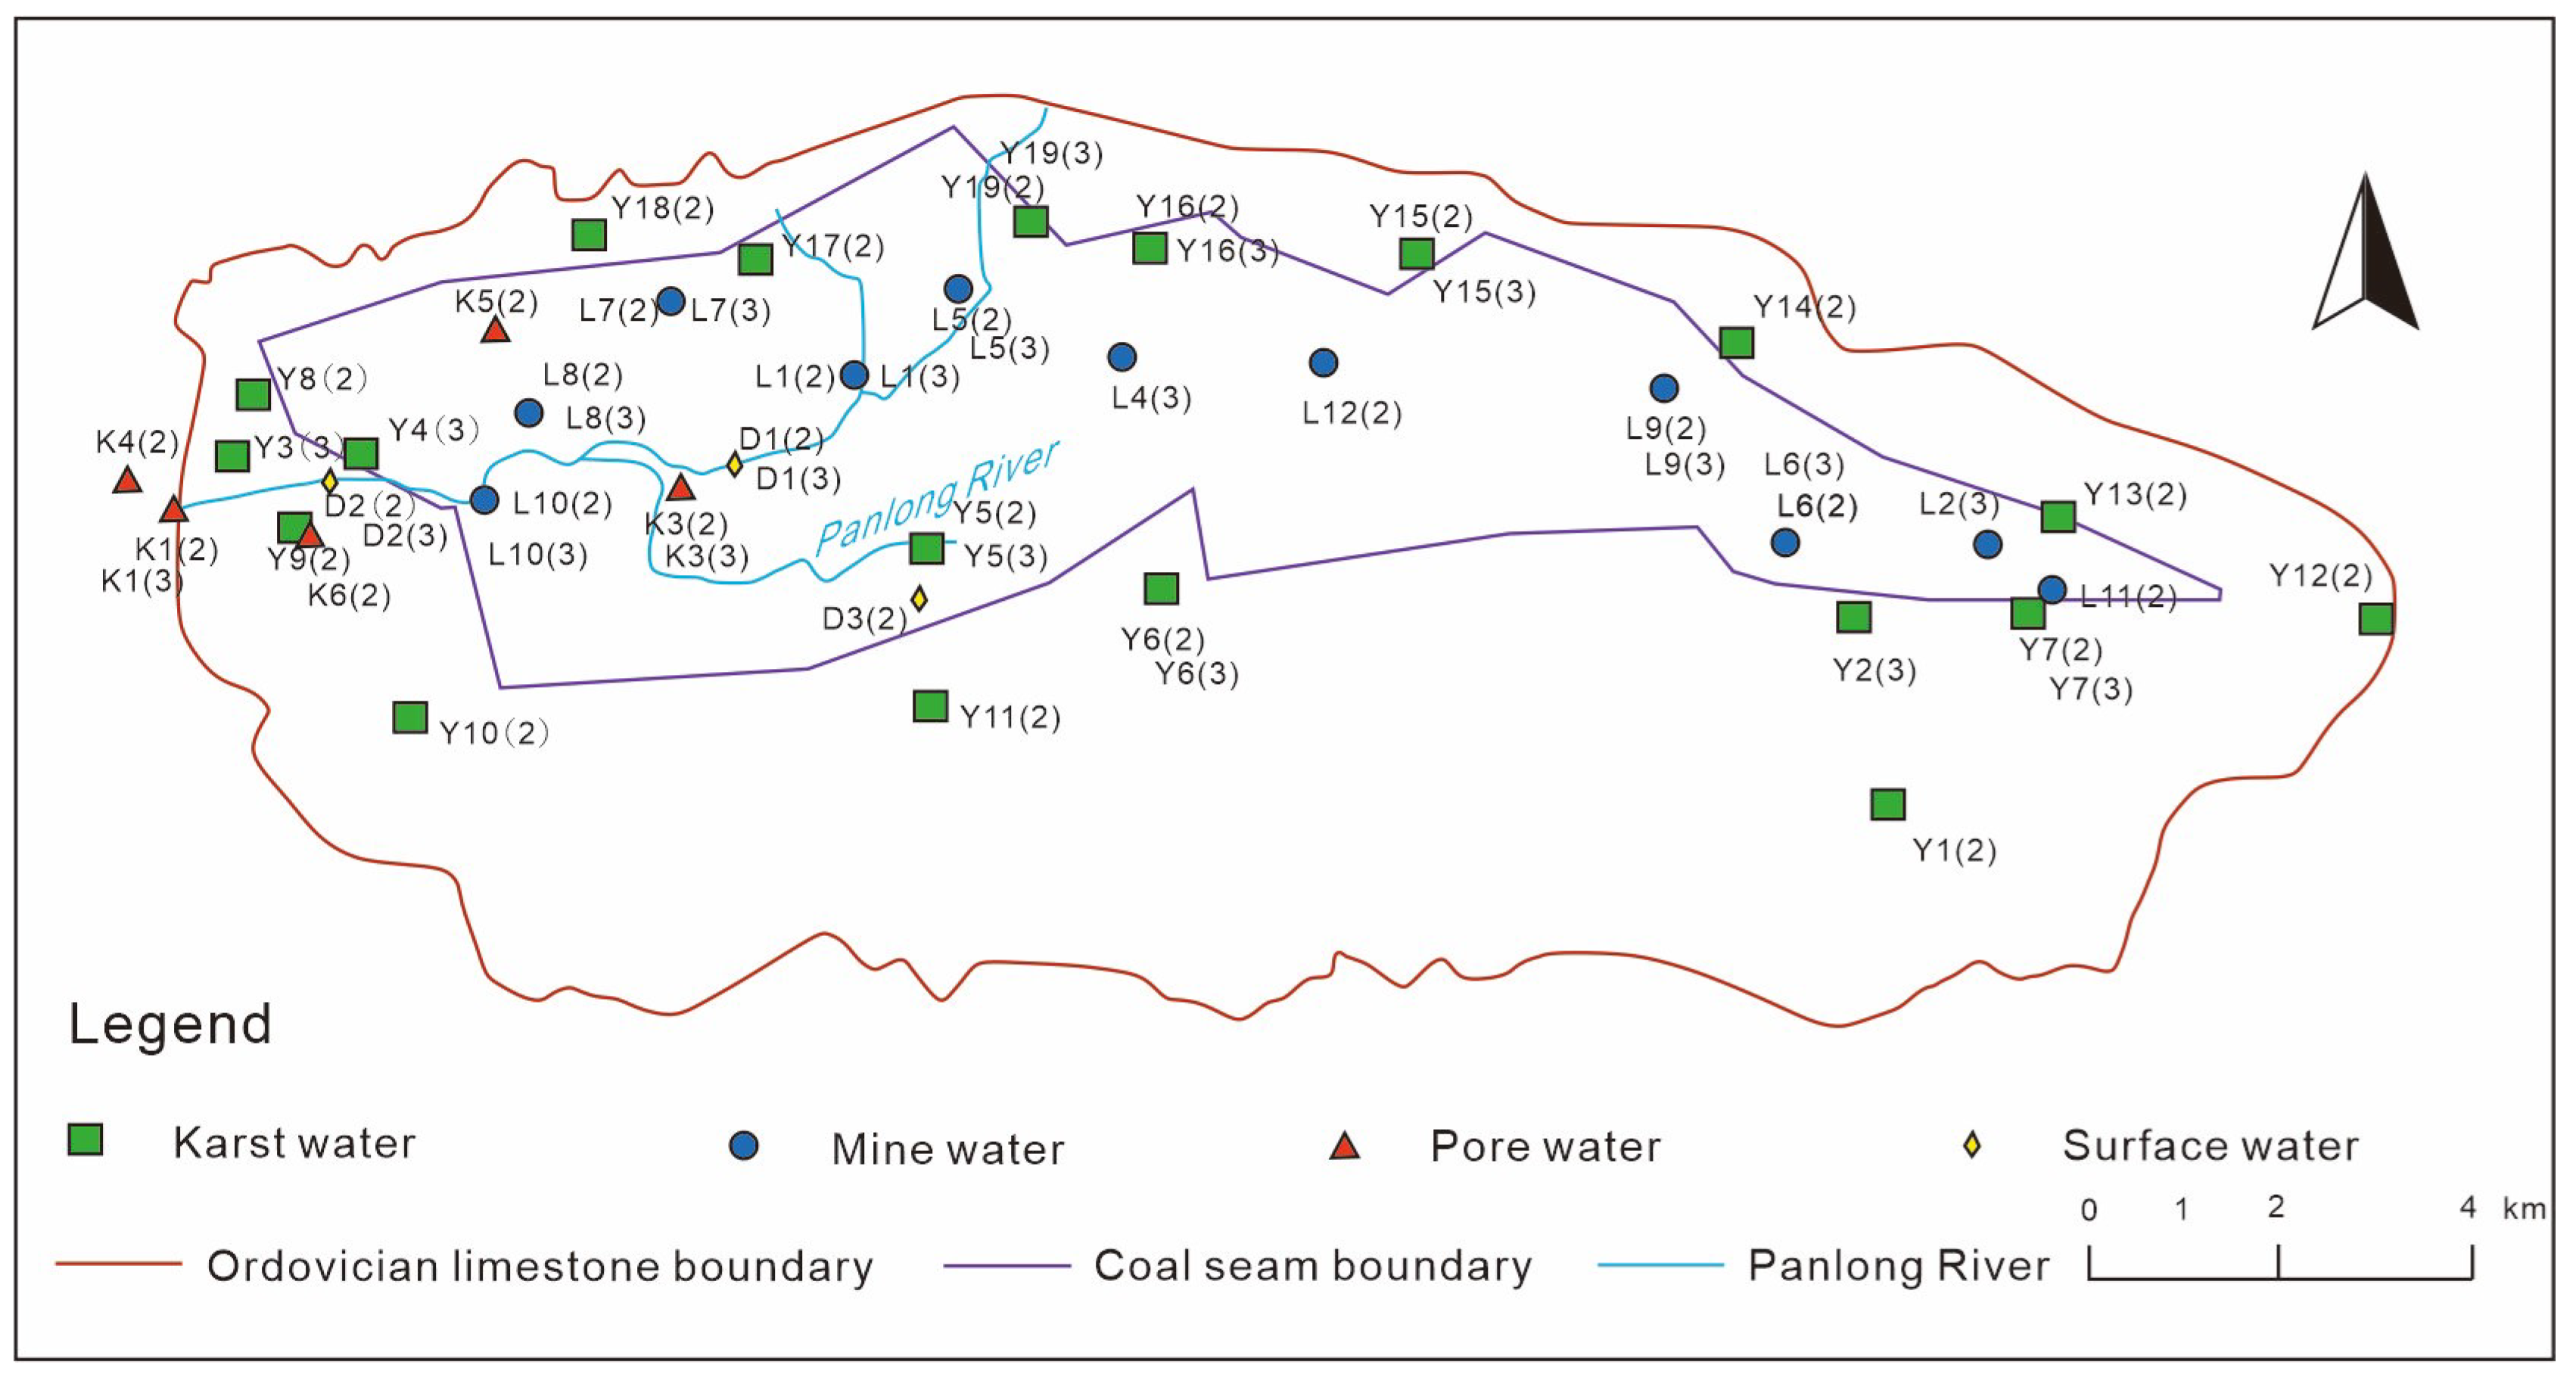
3.1. Sample Collection

The sampling points were shown in Figure 2. In 2022, the corresponding sampling points for surface water, pore water, mine water, and karst water were set at Points 3, 6, 9, and 16, respectively. In 2023, surface, pore, karst, and mine water sampling points were established at Points 2, 3, 7, and 10, respectively.

3.2. Laboratory Analysis

The sampling collection and testing were strictly conducted in accordance with the Technical Specifications for Environmental Monitoring of Groundwater (HJ 164-2020 [13]. A handheld GPS device was used to determine the coordinates of the sampling points. Field measurements were taken for pH, oxidation-reduction potential (Eh), electrical conductivity (EC), and total dissolved solids (TDS). The pH, Eh, and EC were measured using a portable water quality analyzer (HACH DS5, USA), and TDS was measured using a portable device (SX-650). The SX-650 was a Conductivity Pocket Meter used to calculate TDS based on electrical conductivity, as well as to measure resistivity and salinity.
Cl, SO42−, NO3, and F in the water were determined using an ion chromatograph (Thermo-Aquion, Waltham, MA, USA). The detection limits for Cl, SO42−, NO3, and F in water were 0.007 mg/L, 0.018 mg/L, 0.016 mg/L, and 0.006 mg/L, respectively. The collected water samples were filtered through a 0.45 μm membrane to remove particulate impurities and then diluted with high-purity water to an appropriate concentration range (0.1–10 mg/L). A Thermo Fisher IonPac AS19 column (4 × 250 mm) was used for separation. The eluent was KOH with gradient elution at a flow rate of 1.0 mL/min. An electrolytic suppressor was applied with a current of 90 mA, the column temperature was maintained at 30 °C, and the injection volume was 25 μL. Data processing was based on plotting calibration curves with ion concentration on the x-axis and peak area on the y-axis, and the correlation coefficients were calculated (all > 0.9995). Based on the peak areas of each ion in the samples and the corresponding calibration curves, the concentrations of Cl, SO42−, NO3, and F were determined. During the analysis, high-purity water was regularly injected as a procedural blank to check for background interference, ensuring that the peak area of the blank remained below the detection limit. Five replicate analyses were performed for each sample, and the relative standard deviation (RSD) was calculated (RSD < 5%) to evaluate method precision. Certified reference materials (CRMs) with known concentrations were analyzed to verify the accuracy of the method.
K+ and Na+ were determined using an atomic absorption spectrometer (Shimadzu Corporation, AA-6880, Kyoto City, Japan) and flame atomic absorption spectroscopy (FAAS), with detection limits of 0.05 mg/L and 0.01 mg/L, respectively. The relative errors of the methods were −1.63% and +0.58%, respectively. The instrument parameters included a gas mixture of C2H2 and air, an acetylene flow rate of 1.5 L/min, an air flow rate of 10 L/min, a K+ wavelength of 766.5 nm, and a slit width of 0.5 nm; for Na+, the wavelength was 589.0 nm, and the slit width was also 0.5 nm. A 1% CsCl solution was added as an ionization suppressor to reduce ionization interference of K+ and Na+.
HCO3 was determined by titration, with a detection limit of 2.49 mg/L [14]. The titrant used for HCO3 was hydrochloric acid at concentrations of 0.01 mol/L or 0.10 mol/L. Typically, 50–100 mL of the water sample was taken, and the colorimetric indicator methyl orange was used. When the pH reached approximately 4.4–4.5, the solution changed from yellow to orange, indicating the endpoint.
The titrant for Ca2+ was ethylenediaminetetraacetic acid disodium salt (EDTA) at concentrations of 0.01 mol/L or 0.1 mol/L. A 50–100 mL water sample was taken, and the pH was adjusted to 12–13 using sodium hydroxide solution. The calcium indicator formed a complex with calcium ions, resulting in a specific color. At the titration endpoint, the solution color changed from red to blue.
The titrant for Mg was ethylenediaminetetraacetic acid disodium salt (EDTA) at a concentration of 0.01 mol/L or 0.1 mol/L. Generally, 50–100 mL of water sample was taken. The indicator used was Eriochrome Black T, which formed a red complex with magnesium ions at a pH of approximately 10. When the titration reached the endpoint, the color of the solution changed from red to blue.
In the colorimetric indicator method, an ammonia-ammonium chloride buffer solution was used to adjust the pH to around 10 and maintain the pH stability of the solution. Triethanolamine was added as a masking agent to form stable complexes with iron and aluminum ions, thereby avoiding interference.
Inductively coupled plasma atomic emission spectrometry (ICP-AES) was used to determine total iron and total Mn in water, with detection limits of 0.02 mg/L and 0.004 mg/L, respectively.
The digestion procedure included five steps: sampling, acid addition, heating digestion, acid removal, and volume determination.
Sampling: Accurately measure 50 mL or 100 mL of the water sample into a digestion container (such as a PTFE digestion tank).
Acid addition: Added 10–15 mL of nitric acid (65% concentration) to the water sample, followed by 5–10 mL of hydrochloric acid (36% concentration).
Heating digestion: The digestion tank was placed on an electric heating plate, and the temperature was gradually increased to 120–150 °C and maintained for digestion. During the digestion process, organic matter in the water sample gradually decomposed, and metal elements were dissolved into the acidic solution. The digestion time was typically 1–2 h, depending on the complexity of the water sample.
Acid removal: After digestion was completed, the digestion tank was removed and cooled to room temperature. The digestion solution was then transferred to a beaker and heated on an electric heating plate to evaporate most of the acid until the solution was nearly dry.
Volume determination: After cooling, the digestion solution was transferred to a volumetric flask, diluted to the mark with deionized water, mixed thoroughly, and left for measurement.
The plasma gas flow rate was set at 12–15 L/min, and the emission lines for Fe and Mn were 259.94 nm and 257.61 nm, respectively.
Calibration curve: A series of standard solutions with known concentrations were used for calibration. Seven standard points of different concentrations were prepared, including blank solutions (without the target elements) and standard solutions with high, medium, and low concentrations close to the sample concentration range. A calibration curve was established by measuring the emission intensity of the standard solutions and plotting concentration against response value. The correlation coefficient (R2) was required to be greater than 0.999.
Calibration was performed before each sample analysis. If the instrument operated for an extended period, regular calibration checks were also conducted to ensure the stability and accuracy of the instrument calibration.
Quality control sample results included standard reference materials, spiked recovery rates, repeatability, and quality control charts. Water standard reference materials with known concentrations of Fe and Mn were digested and analyzed together with the samples, and the measured results were expected to be consistent with the certified values and within their uncertainty ranges. Known amounts of Fe and Mn standard solutions were added to some samples, which were then processed using the same digestion and analysis procedures to calculate the spiked recovery rate. The spiked recovery rate was expected to be close to 100%, generally within the range of 80–120%, indicating good method accuracy and that the sample matrix did not significantly interfere with the analytical results. Seven repeated measurements were performed on the same sample to calculate its relative standard deviation (RSD). Generally, an RSD of less than 10% was required, and for high-concentration samples, the RSD was expected to be even lower. A quality control chart was plotted, and the results of each quality control sample analysis were recorded on the chart. By observing the trends and fluctuations in the quality control chart, any systematic or random errors in the analytical process could be detected in a timely manner.
The accuracy of the test results was evaluated using the cation-anion balance error Formula (1) [15]. Samples that exceeded the acceptable error range (±3%) were required to be retested.
CBE = ce i + ce j ce i + + ce j × 100 %
where, ce i + and ce j represented the charge concentrations of specific cations and anions, respectively, in meq·L−1.

3.3. Method of Source Analysis

3.3.1. Data Analysis

Correlation analysis was conducted on the major ions in pore water, mine water, and karst water to investigate the relationships between ions based on their correlation coefficients (r) [16].

3.3.2. Mineral Saturation Index Analysis

The saturation indices (SI) of the major minerals (gypsum, halite, calcite, and dolomite) in the study area’s water bodies were calculated using the Phreeqc geochemical modeling software to indicate the hydrochemical evolution processes between groundwater and minerals [17].

3.3.3. Ion Activity Ratio Analysis

The ratios of γ(Mg2+)/γ(Na+), γ(Ca2+)/γ(Na+), γ(Mg2+)/γ(Ca2+), and γ(Na+)/γ(Ca2+) were used to determine the impact of rock weathering and dissolution on the solute composition of water [18,19,20]. The ratio of γ(Na+)/γ(Cl) was used to indicate the enrichment degree of Na+ in water [21]. The ratio of γ(Ca2+ + Mg2+-SO42−-HCO3)/γ(K+ + Na+-Cl) was used to identify whether cation exchange occurred in groundwater [22]. The chlor-alkali index (CAI) was used to characterize the direction and intensity of cation exchange adsorption [23]. The ratio of γ(NO3/Cl) was used to eliminate dilution and concentration effects, and the ratio of γ(NO3/Cl)/γ(Cl) was used to determine the source of NO3 [24,25,26]. The ratio of γ(Ca2+ + Mg2+)/γ(HCO3) reflected the dissolution of carbonates [27]. The ratio of γ(Ca2+ + Mg2+)/γ(SO42−) reflected the contribution of sulfate dissolution to Ca2+, Mg2+, and SO42− in water [28]. The relationship graph of γ(Ca2+ + Mg2+)/γ(HCO3 + SO42−) reflected the dissolution of carbonate and silicate rocks [29]. The relationship graph of γ(Ca2+) and γ(SO42−) reflected the dissolution of gypsum in water [30].

3.3.4. Positive Matrix Factorization Model

The Positive Matrix Factorization (PMF) model was based on factor analysis and used the uncertainty of each data point to quantitatively apportion the contribution rates of pollution sources through the least squares method [31]. This model did not require a pollution source fingerprint spectrum and imposed non-negative constraints on the loadings and scores of each factor, making the source apportionment results more accurate. Moreover, the uncertainty of each receptor measurement data input into the model helped reduce the parsing error. The eight major ions—Ca2+, Mg2+, Na+, K+, Cl, SO42−, HCO3, and NO3—were used to identify the natural and anthropogenic factors affecting the physicochemical properties of mine water and karst water in the study area. By seeking the minimum value of the objective function Q, the optimal residual matrix E was obtained, and the optimal number of factors was determined. The signal-to-noise ratio (S/N) of all ions was defined as “Strong,” the number of iterations was set to 200, and the Base Model was run with the number of factors set to 3, 4, 5, and 6, respectively.

4. Results

4.1. Hydrochemical Characteristics

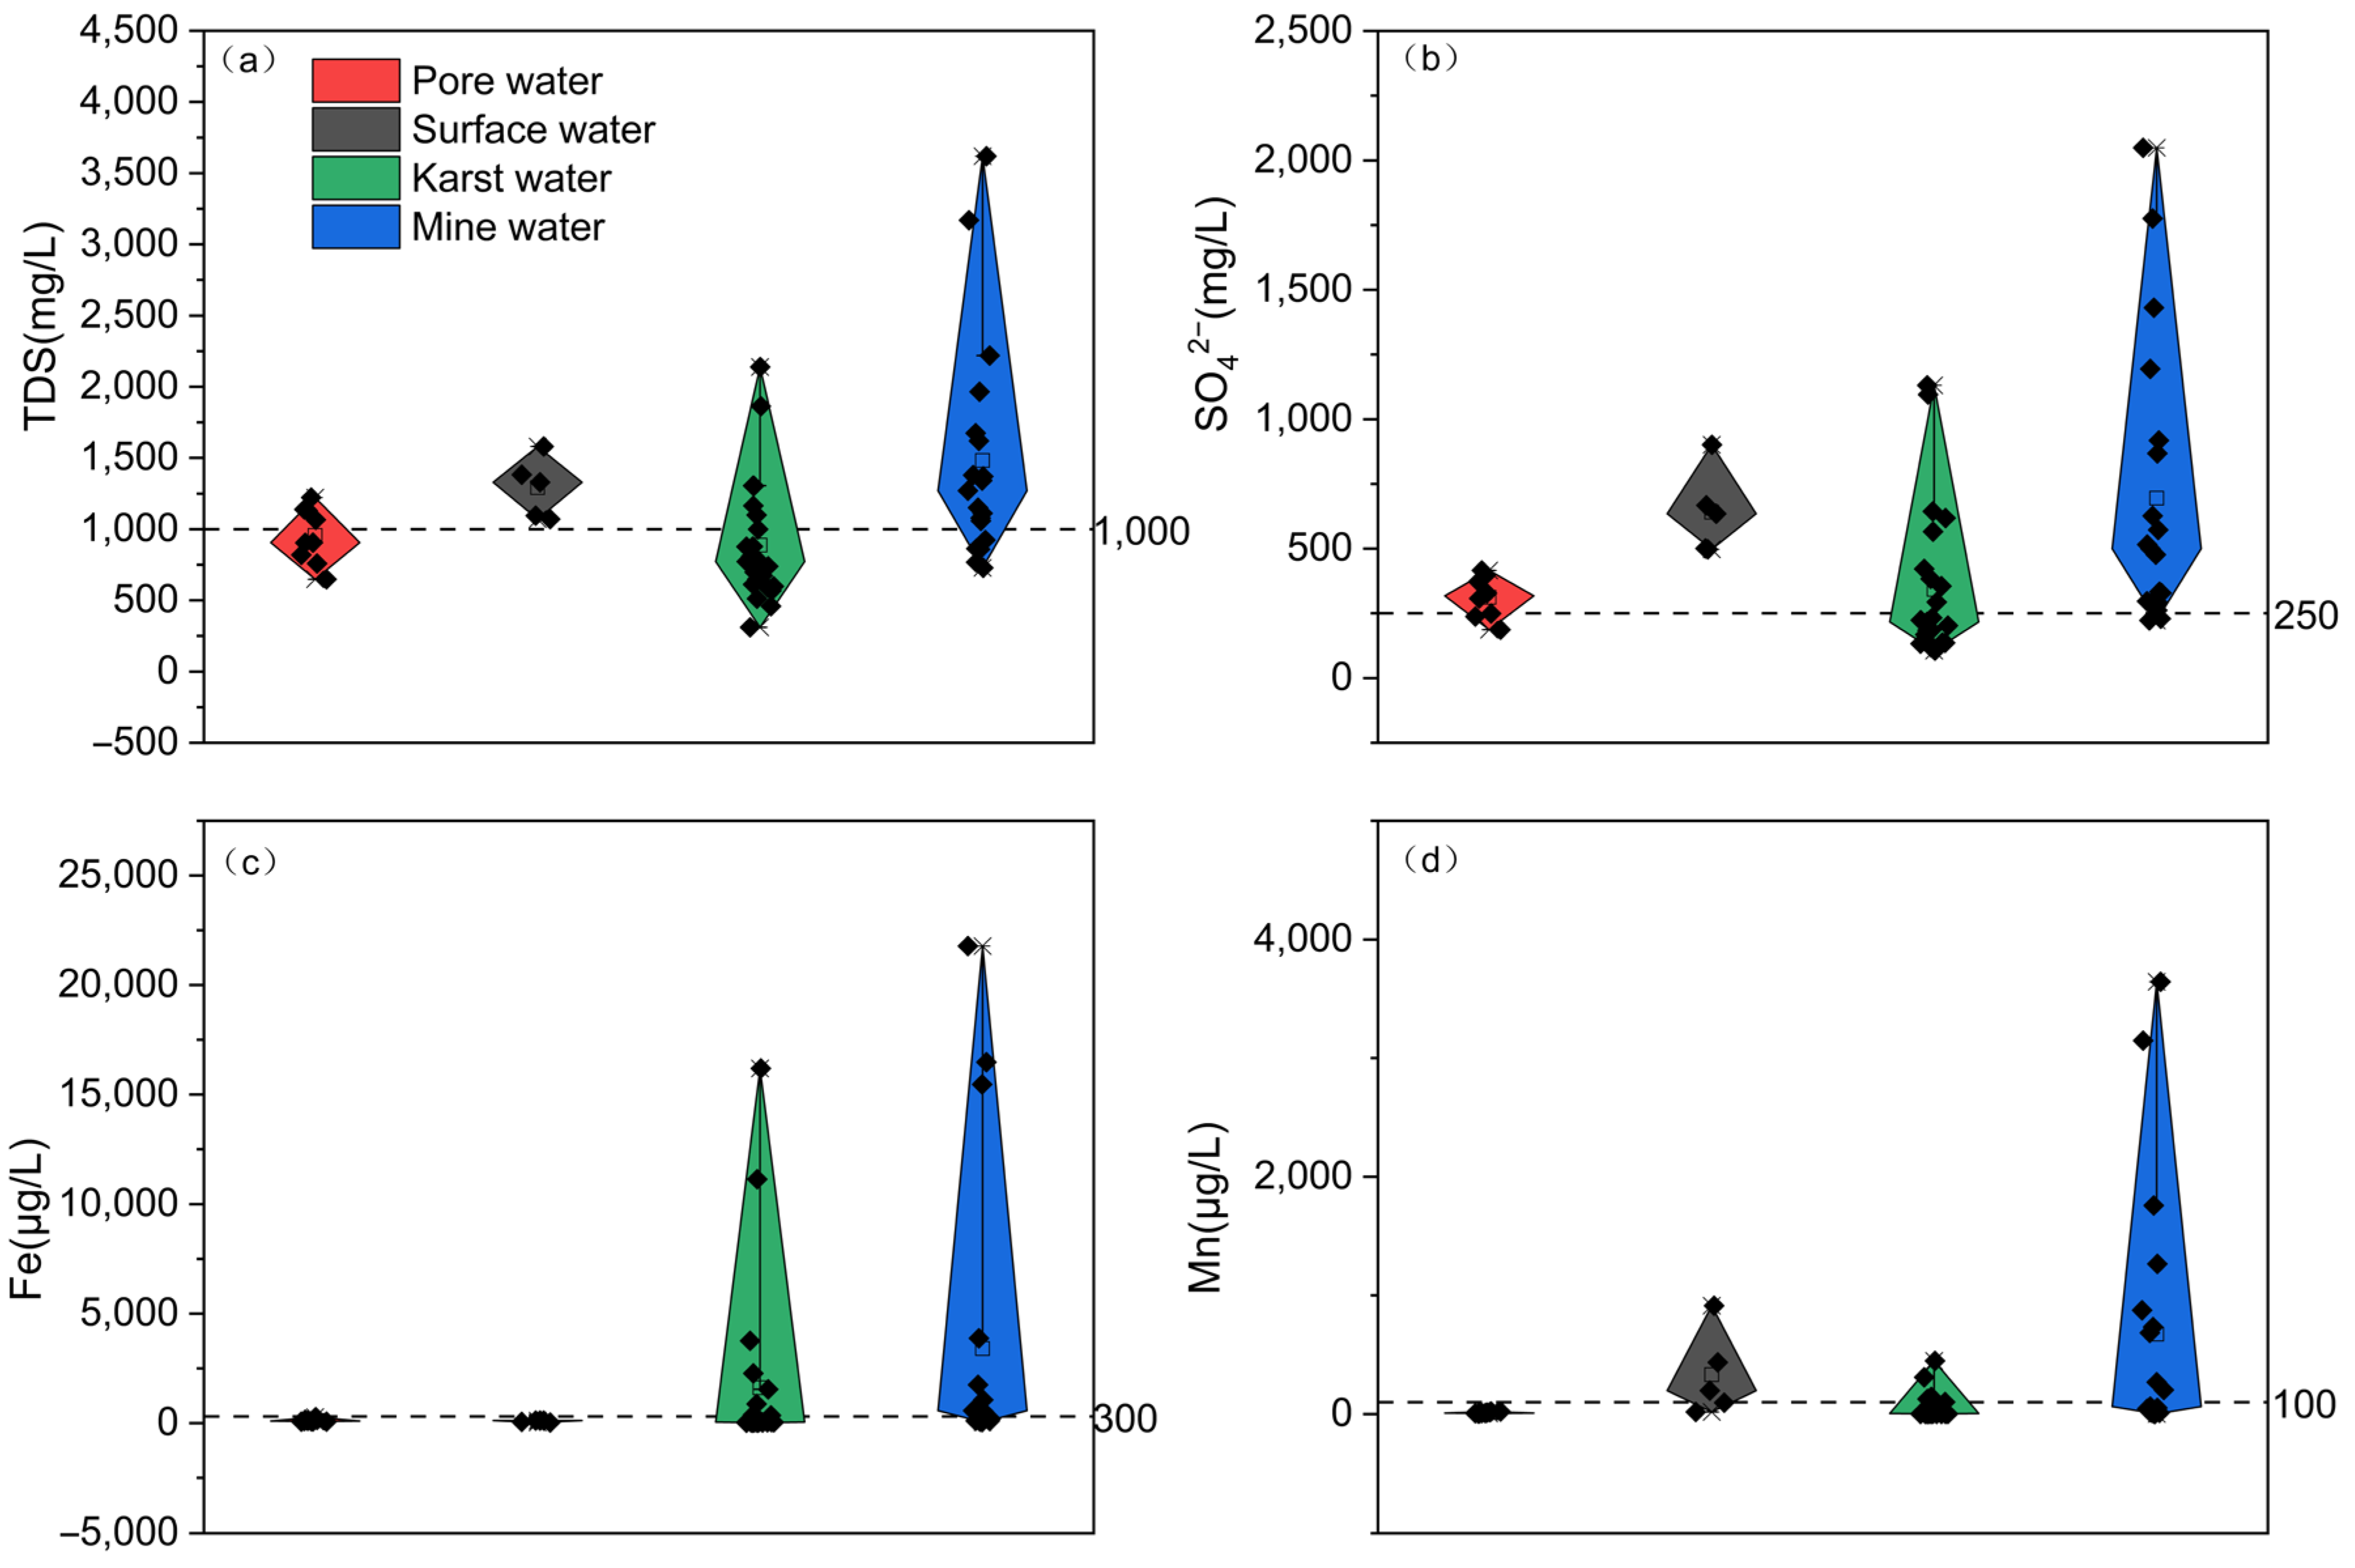
4.1.1. Water Quality Analysis

As shown in Figure 3, the highest concentrations of various indicators in surface water and pore water are: TDS 1581 mg/L, SO42− 901.62 mg/L, Fe 0.27 mg/L, and Mn 0.91 mg/L; The maximum exceedance multiple for various indicators in karst water are: TDS 1.14, SO42− 3.53, Fe 53, and Mn 3.5; The maximum exceedance multiple for various indicators in mine water are: TDS 2.62, SO42− 7.20, Fe 71.6, and Mn 35.4. There are certain sampling points in different water bodies where the indicators TDS, SO42−, Fe, and Mn are significantly higher than the class III requirements of the Standard for Groundwater Quality and the Environmental Quality Standards for Surface Water [32,33].
Mine water has significantly higher concentrations of TDS, SO42−, Fe, and Mn than the other three water types. Fe and Mn are the dominant dissolved metals in mine water [34]. This indicates that after the closure of coal mines, mine water is heavily contaminated. Karst water also has elevated concentrations of TDS, SO42−, and Fe. This is probably due to mineral dissolution and cross-layer contamination by mine water [35]. Differences in their ability to oxidize and migrate in water account for the notable differences in Fe and Mn concentrations between karst and mine waters [36]. Although surface water has lower concentrations of TDS, SO42− and Mn than mine and karst water, these values still exceed the standard limit of the Standard for Groundwater Quality and the Environmental Quality Standards for Surface Water for centralized drinking water source supplementary projects [32,33]. This suggests that the coal mining activities are polluting the groundwater but are also facilitating the hydraulic exchange between the mine water and the surface water [12]. Probably due to the adsorption capacity of pore water media to retain certain contaminants, pore water has relatively low concentrations of TDS, SO42−, Fe, and Mn, even lower than surface water [37].

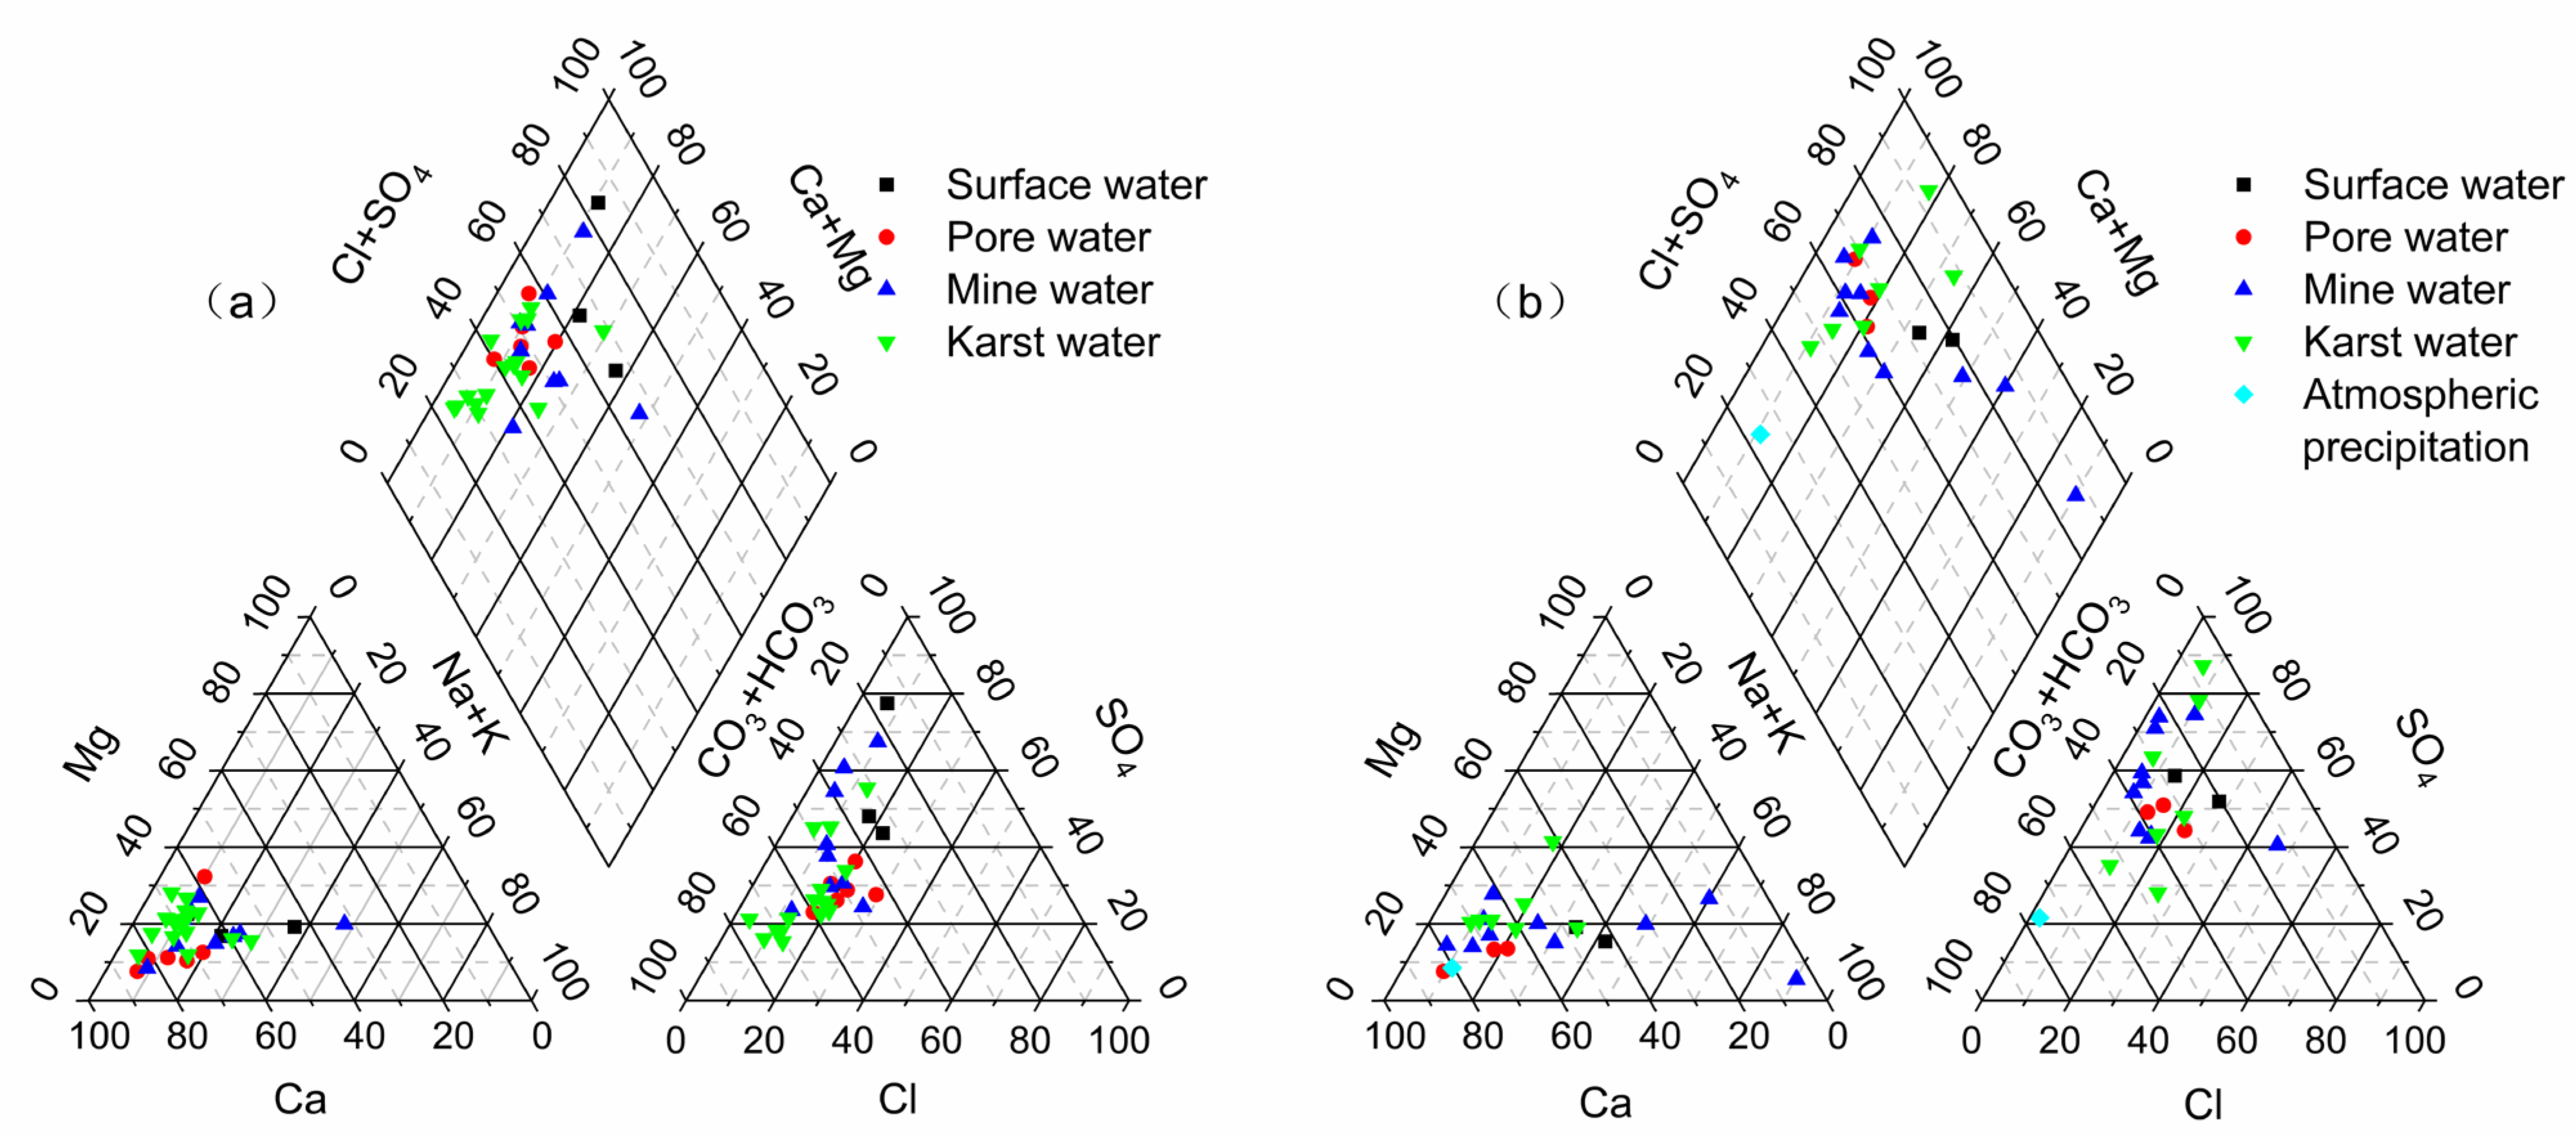
4.1.2. Hydrochemical Types

As shown in Figure 4, the hydrochemical type of atmospheric precipitation in the study area is HCO3-SO4-Ca. Surface and pore waters are predominantly SO4-HCO3-Ca, while mine water is predominantly SO4-HCO3-Ca, with a secondary type of SO4-HCO3-Na. Karst water is predominantly of the SO4-HCO3-Ca and HCO3-SO4-Ca types. The main ions in all water types are Ca2+, SO42−, and HCO3, with similar hydrochemical types, an indication that the pollution sources for these water bodies are identical or closely related. In the Mg2+ + Ca2+-K+ + Na+ diagram, the cations are mainly in the gypsum dissolution end member. In the HCO3 + CO32−-Cl + SO42− diagram, the anions are mainly between CO2 dissolution leading to carbonate weathering and sulphate-induced gypsum weathering. In the diamond diagram, all of the water bodies in the study area are close to the SO42− + Cl side, reflecting the high sulphate content. This suggests that not only carbonate and gypsum dissolution but also human activities such as coal mining are influencing the mineralisation processes in the study area. From 2022 to 2023, the hydrochemical types of the different water bodies did not show much variation, showing that the pollution conditions were relatively stable during this period.

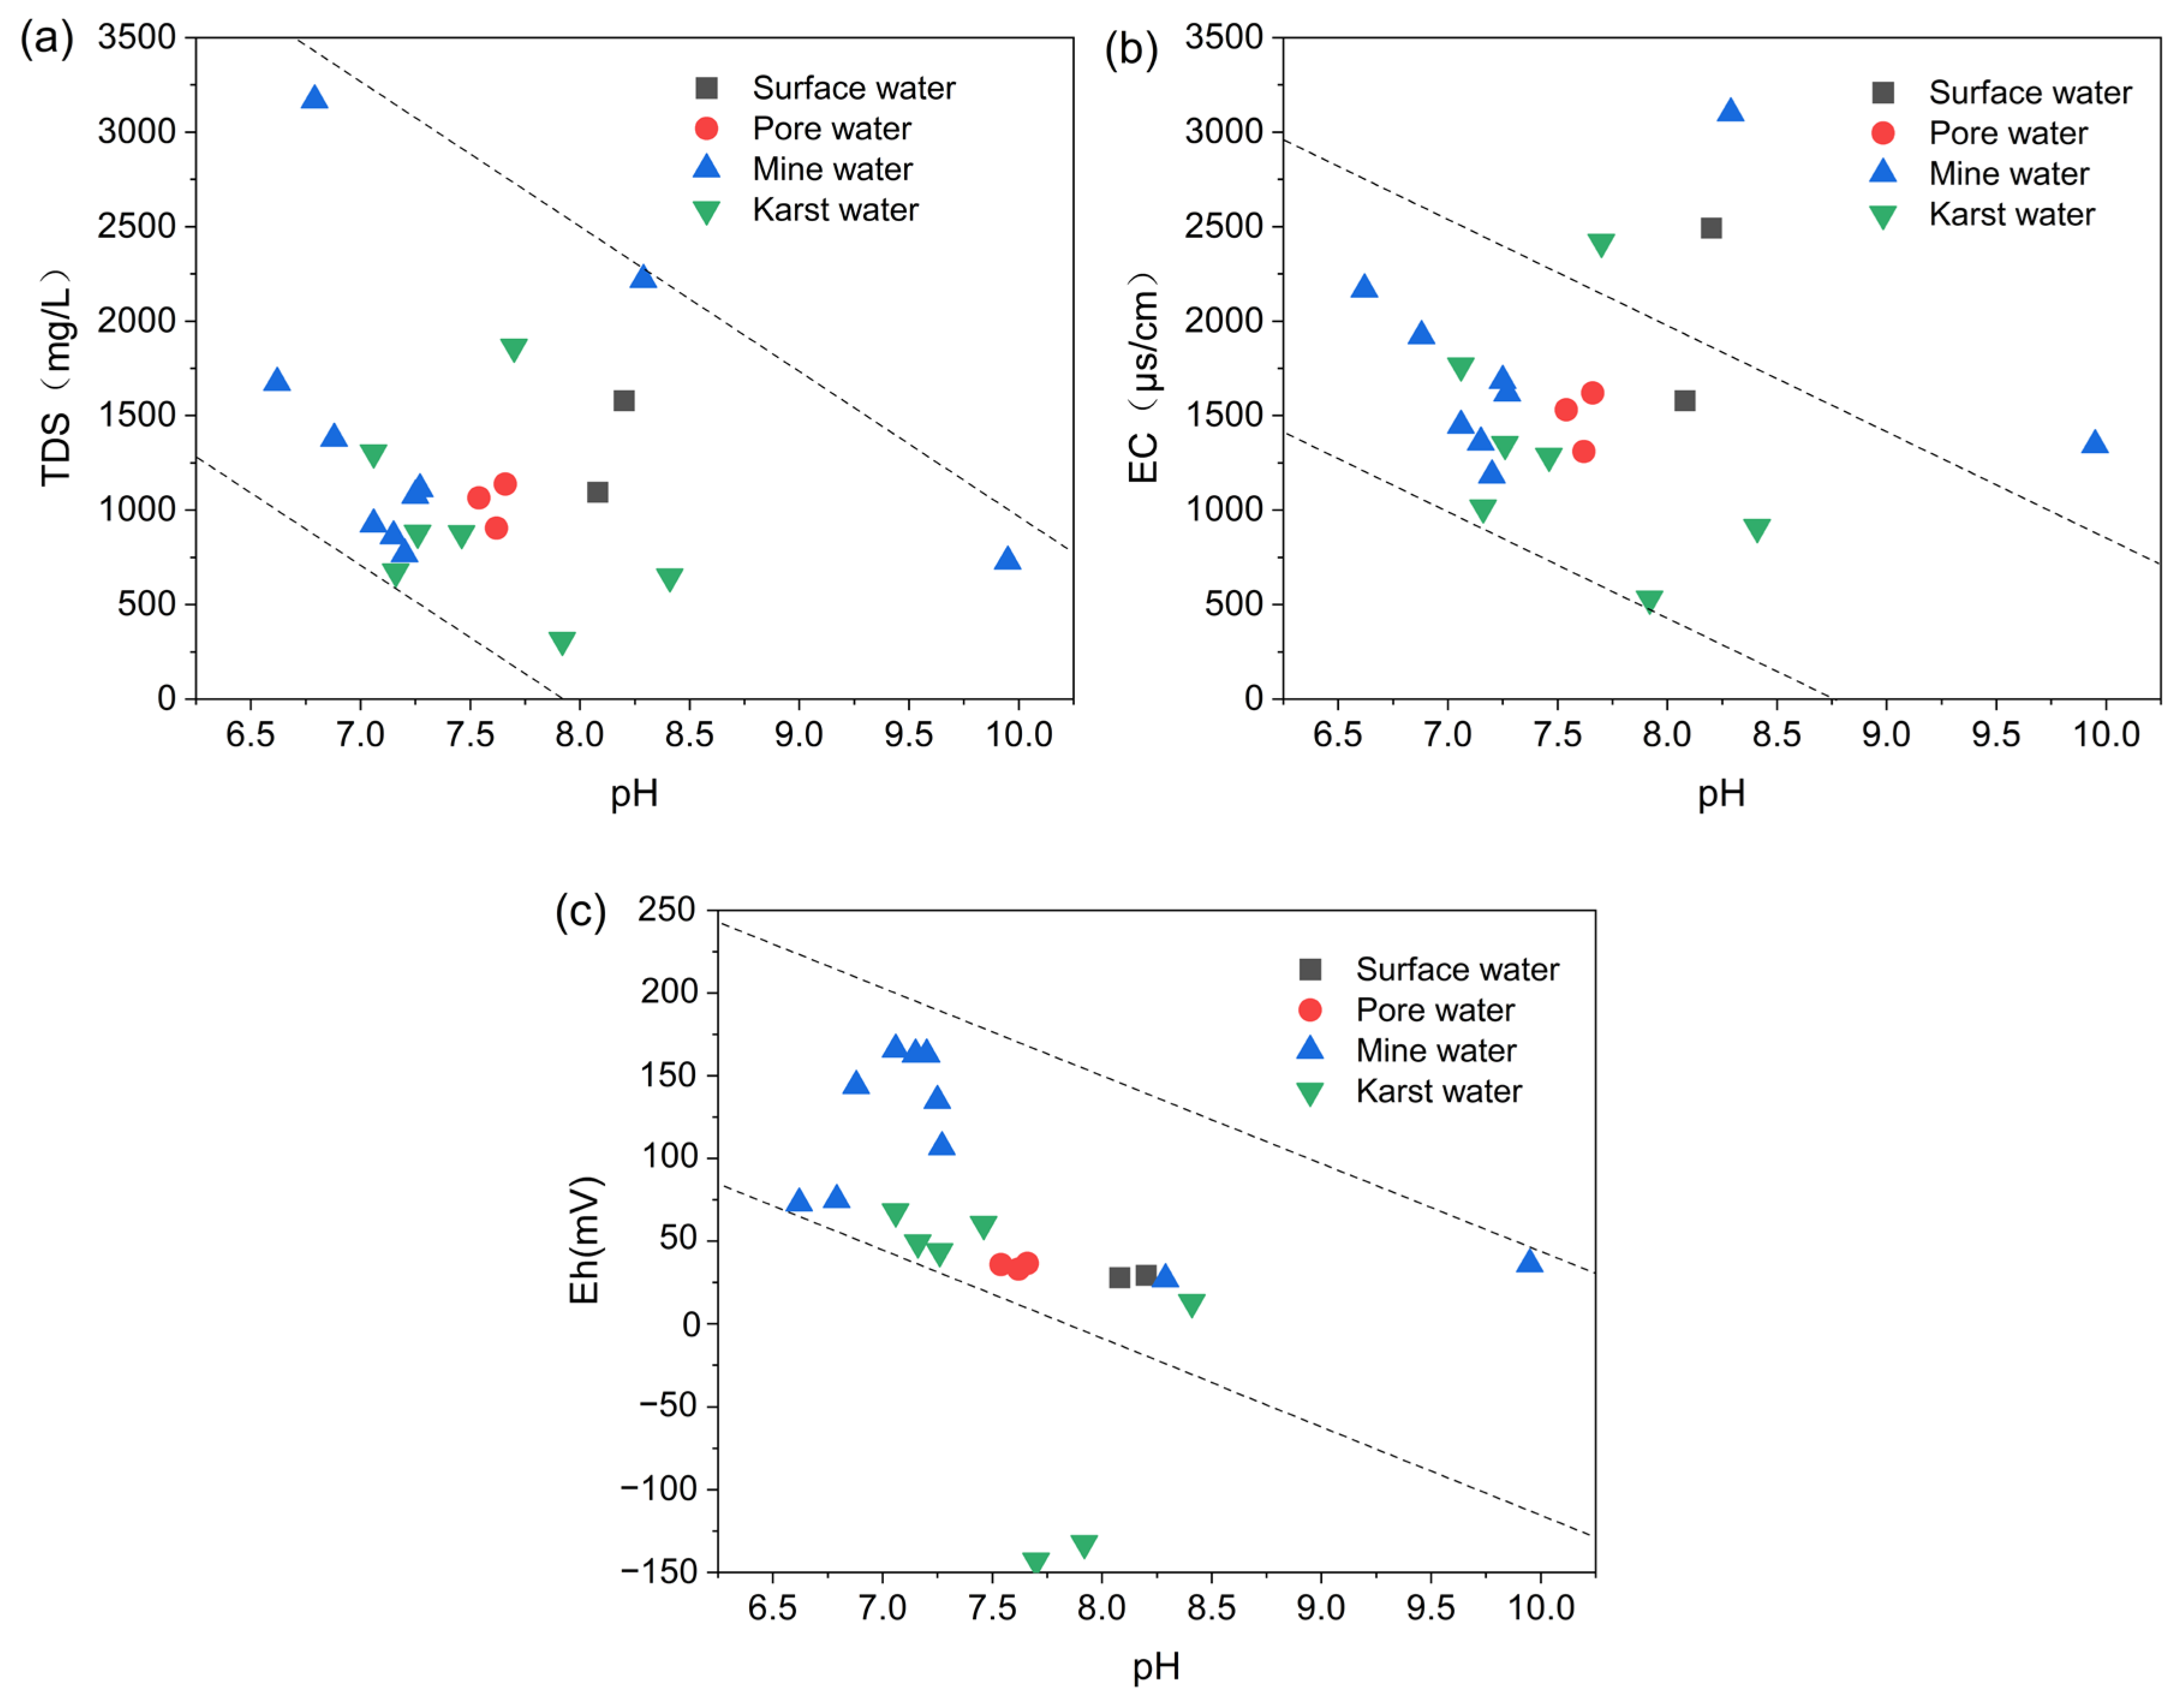
4.1.3. Physicochemical Characteristics

As shown in Figure 5, the pH of mine waters in the study area varies between 6.62 and 9.95, suggesting a neutral to slightly alkaline character due to the influence of coal mining activities. This is attributed to carbonate fracturing and karst development in the study area, where the aquifer matrix contains abundant carbonate minerals that dissolve to form neutralizing Ca2+, Mg2+, and HCO3 [38]. As pH increases, TDS, EC, and Eh generally decrease (Figure 5a–c). Studies have shown that the dissolution and release of inorganic metals in mine waters increases with decreasing pH. At higher pH, the formation of metal complexes or precipitates is promoted, leading to significant changes in TDS and EC in mine water [39,40]. In the pH range of 8.0~8.5, TDS and EC show upward fluctuations (Figure 5). This is probably due to the weakly alkaline nature of the water at these points, where cation exchange adsorption is strong, resulting in the exchange of Na+ and K+ in the water with Ca2+ and Mg2+ in the surrounding rocks, thereby increasing TDS and EC values [41]. The SO42− shows a significant positive correlation with the TDS (Figure 6), which indicates that the SO42− is a major contributor to the TDS in the water. Thus, neutral to slightly alkaline pH and high TDS, SO42−, EC, and Eh characterize the water bodies in the study area.

4.2. Analysis of Hydrochemical Genesis

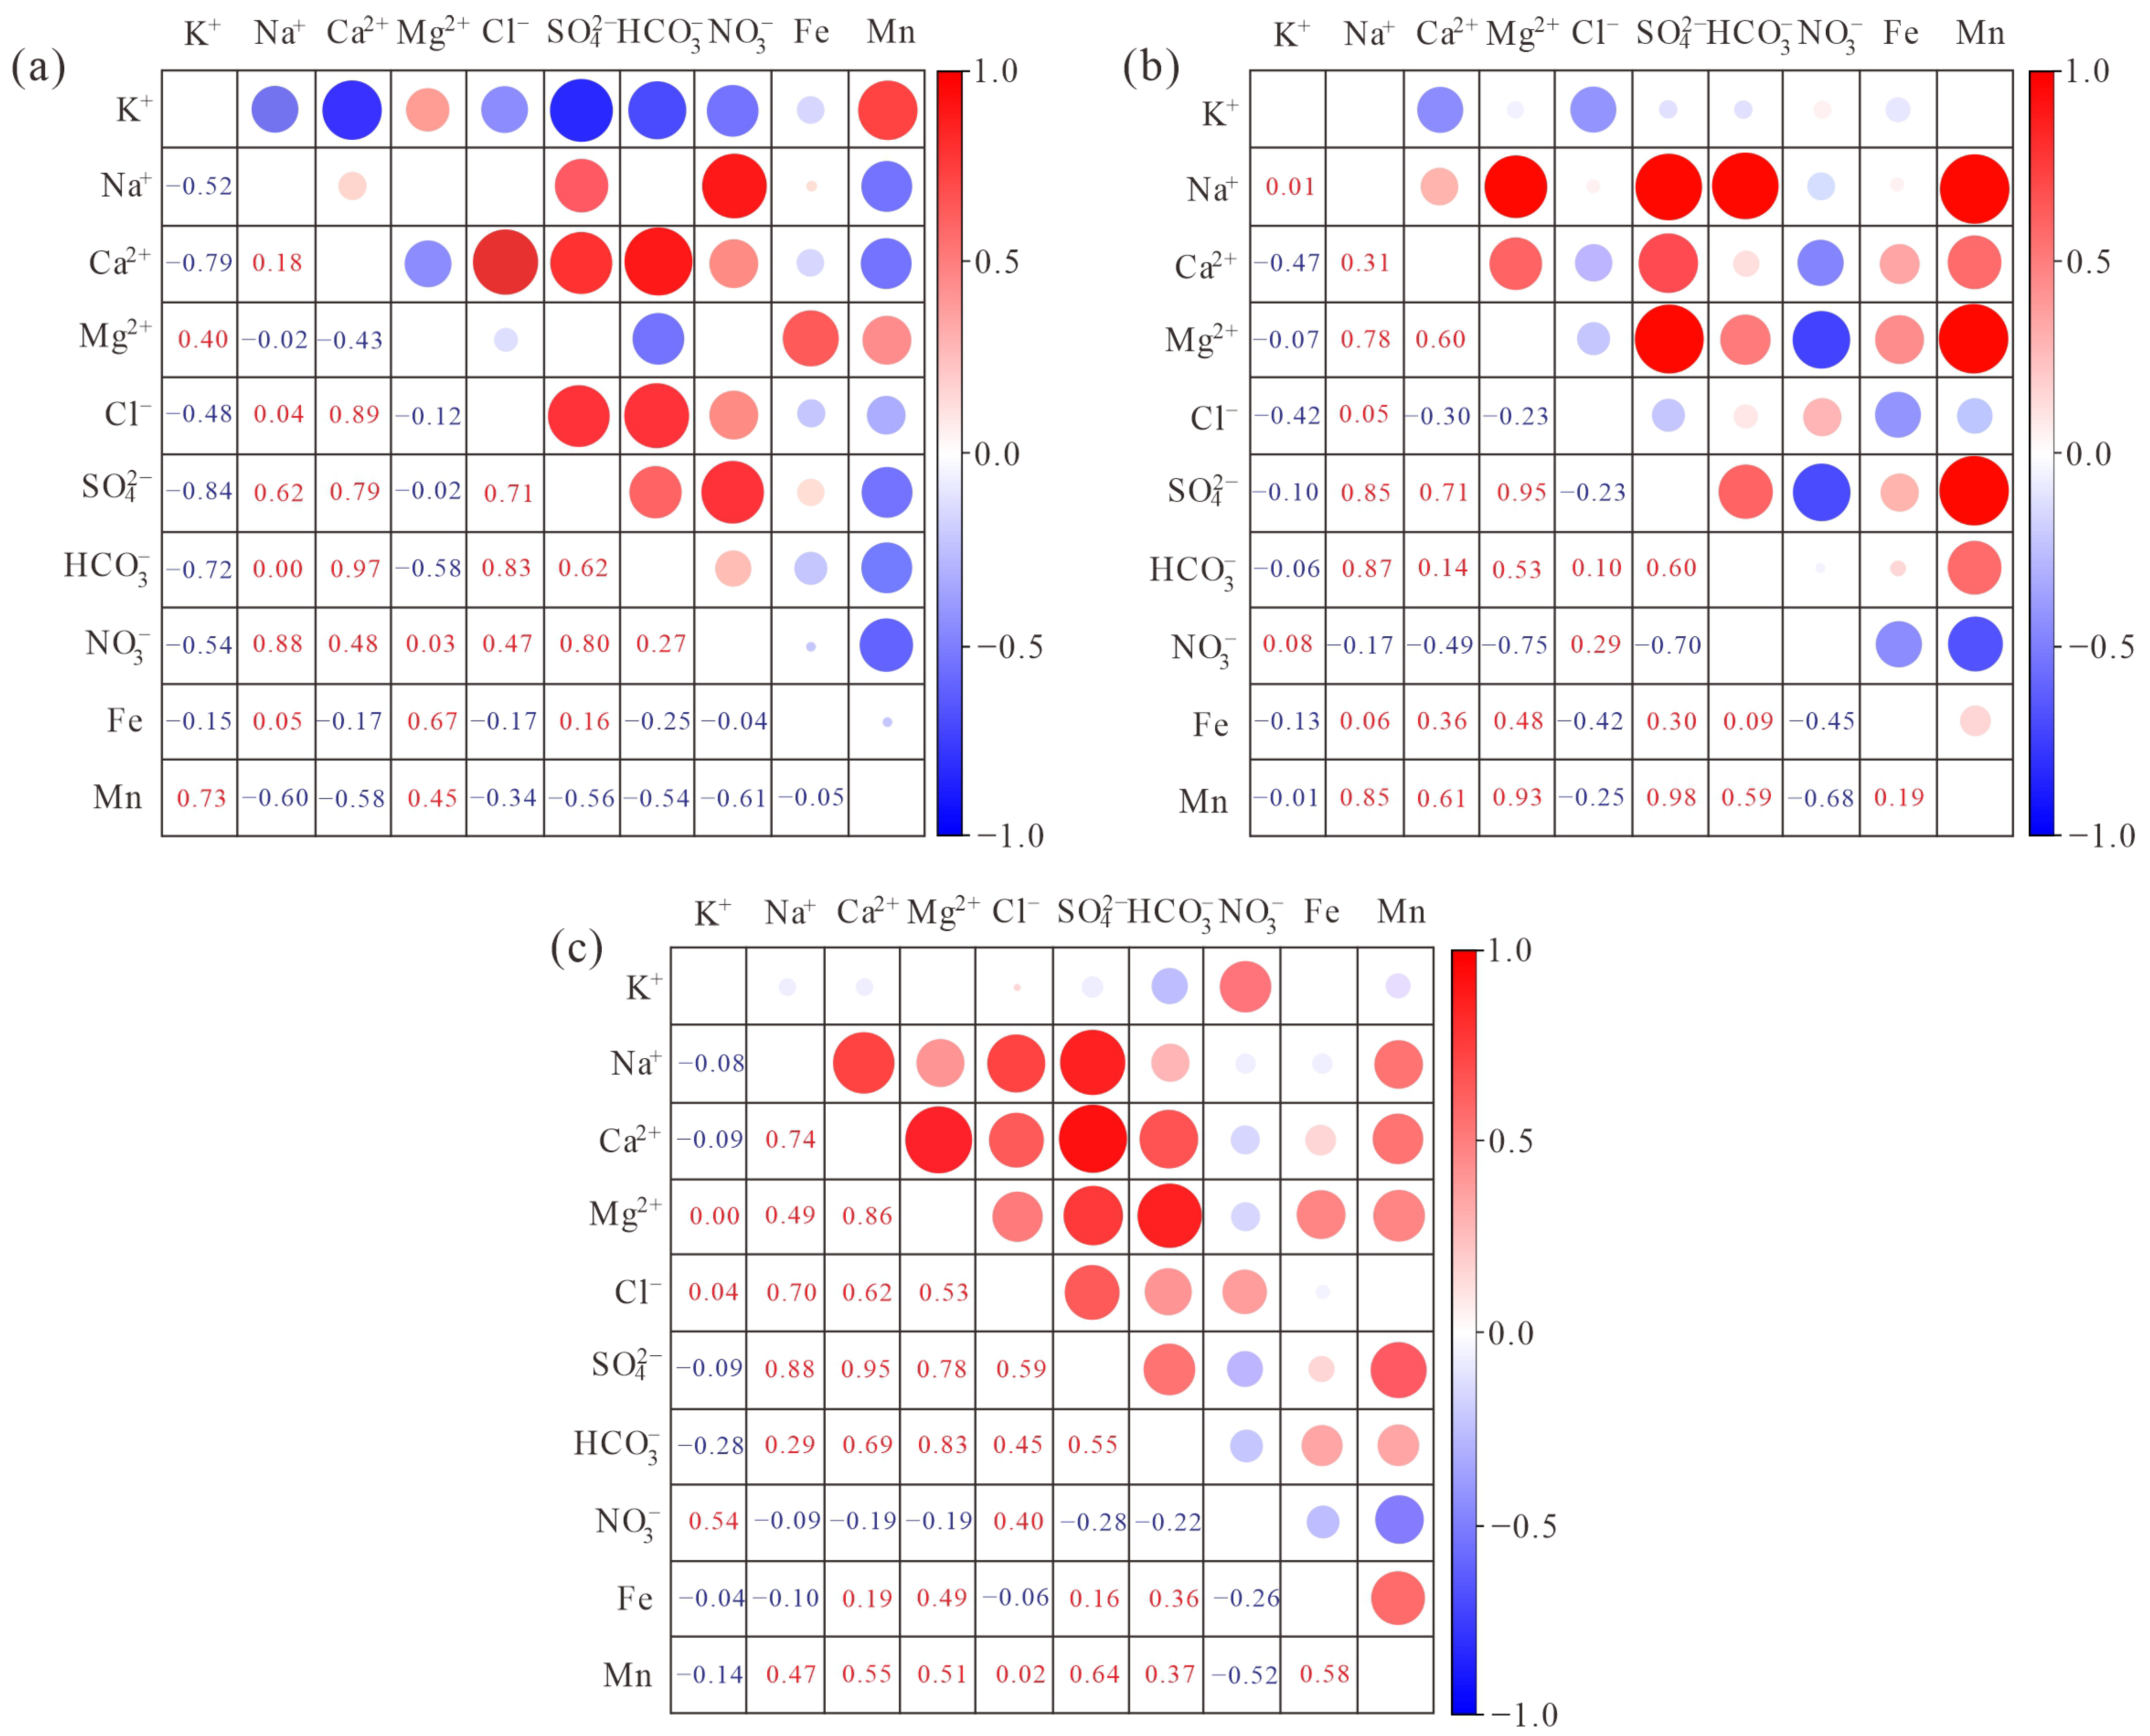
4.2.1. Correlation Analysis

As shown in Figure 7a, there is a significant positive correlation between Ca2+ and HCO3 in pore water (r = 0.97), a significant positive correlation between Na+ and NO3 (r = 0.88), and significant positive correlations between Cl and both Ca2+ (r = 0.89) and HCO3 (r = 0.83).
In mine water, SO42− shows significant positive correlations with Na+ (r = 0.85), Mg2+ (r = 0.95), and Mn (r = 0.98). Na+ also exhibits significant positive correlations with HCO3 (r = 0.87) and Mn (r = 0.85). Moreover, Ca2+ has a relatively significant positive correlation with SO42− (r = 0.71) (Figure 7b).
In karst water, Na+ shows relatively significant positive correlations with Ca2+ (r = 0.74), Cl (r = 0.70), and SO42− (r = 0.88). Ca2+ exhibits significant positive correlations with Mg2+ (r = 0.86), SO42− (r = 0.95), and HCO3 (r = 0.69). Moreover, SO42− has a relatively significant positive correlation with Mn (r = 0.65) (Figure 7c).

4.2.2. Analysis of Mineral Saturation Indices

The statistical results of the saturation indices (SI) of minerals in the water bodies of the study area are shown in Table 1. For different types of water samples, the SI of gypsum is less than 0 and increases with the increase in TDS concentration (Figure 8a). The SI of all points for rock salt (NaCl, KCl) is less than 0, and its mineral saturation index is the lowest among all minerals (Figure 8b). The saturation index of dolomite (CaMg(CO3)2) is around 0 for most points and increases with the increase in TDS (Figure 8c). The saturation index (SI) of calcite (CaCO3) is greater than 0 for all points except two mine water points and also increases with the increase in TDS concentration (Figure 8d).

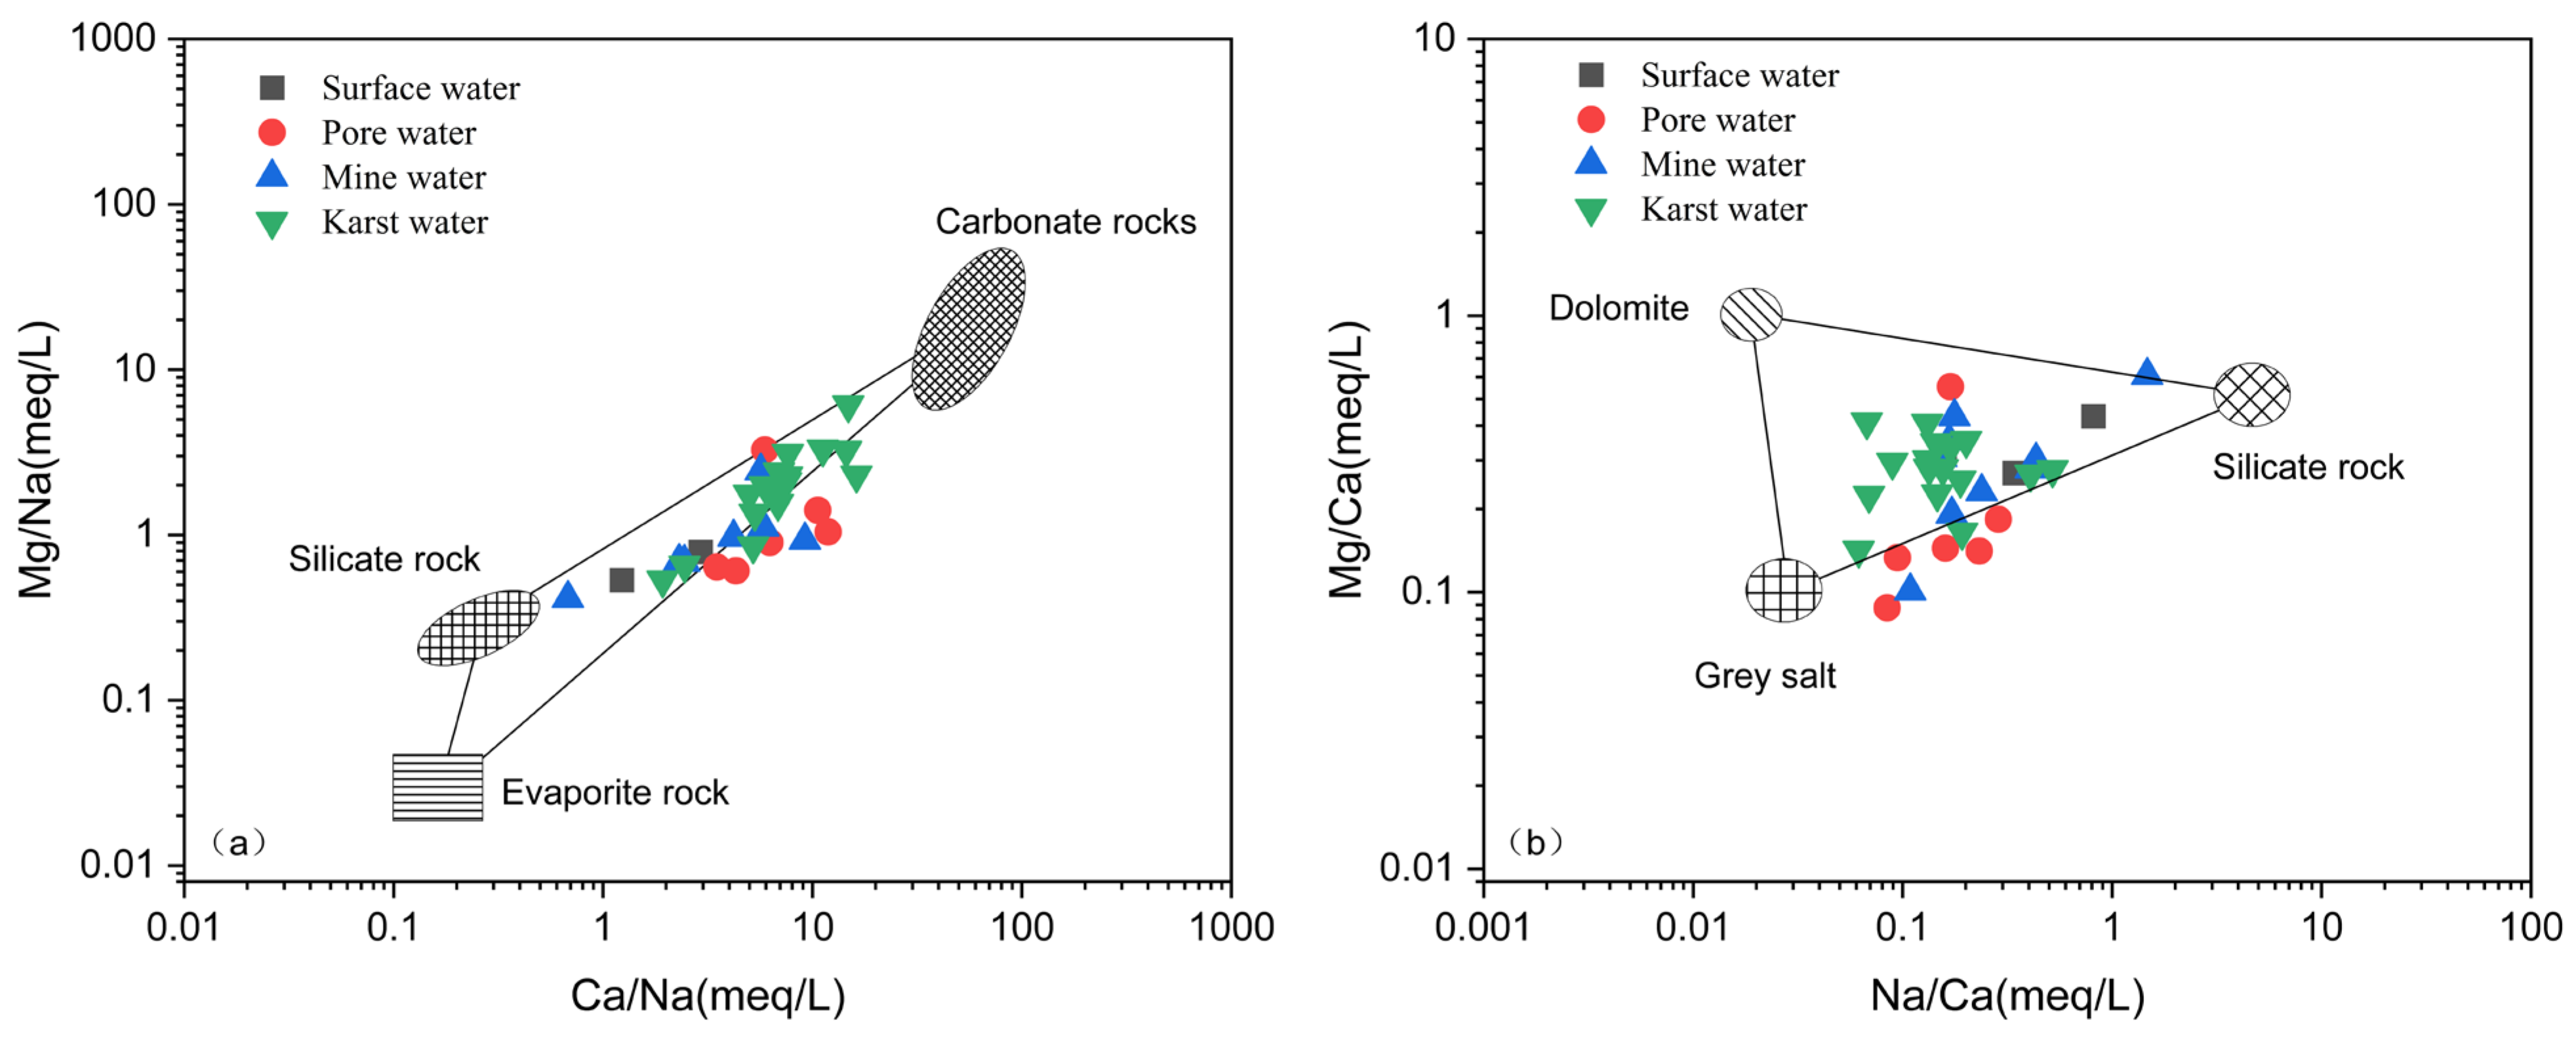
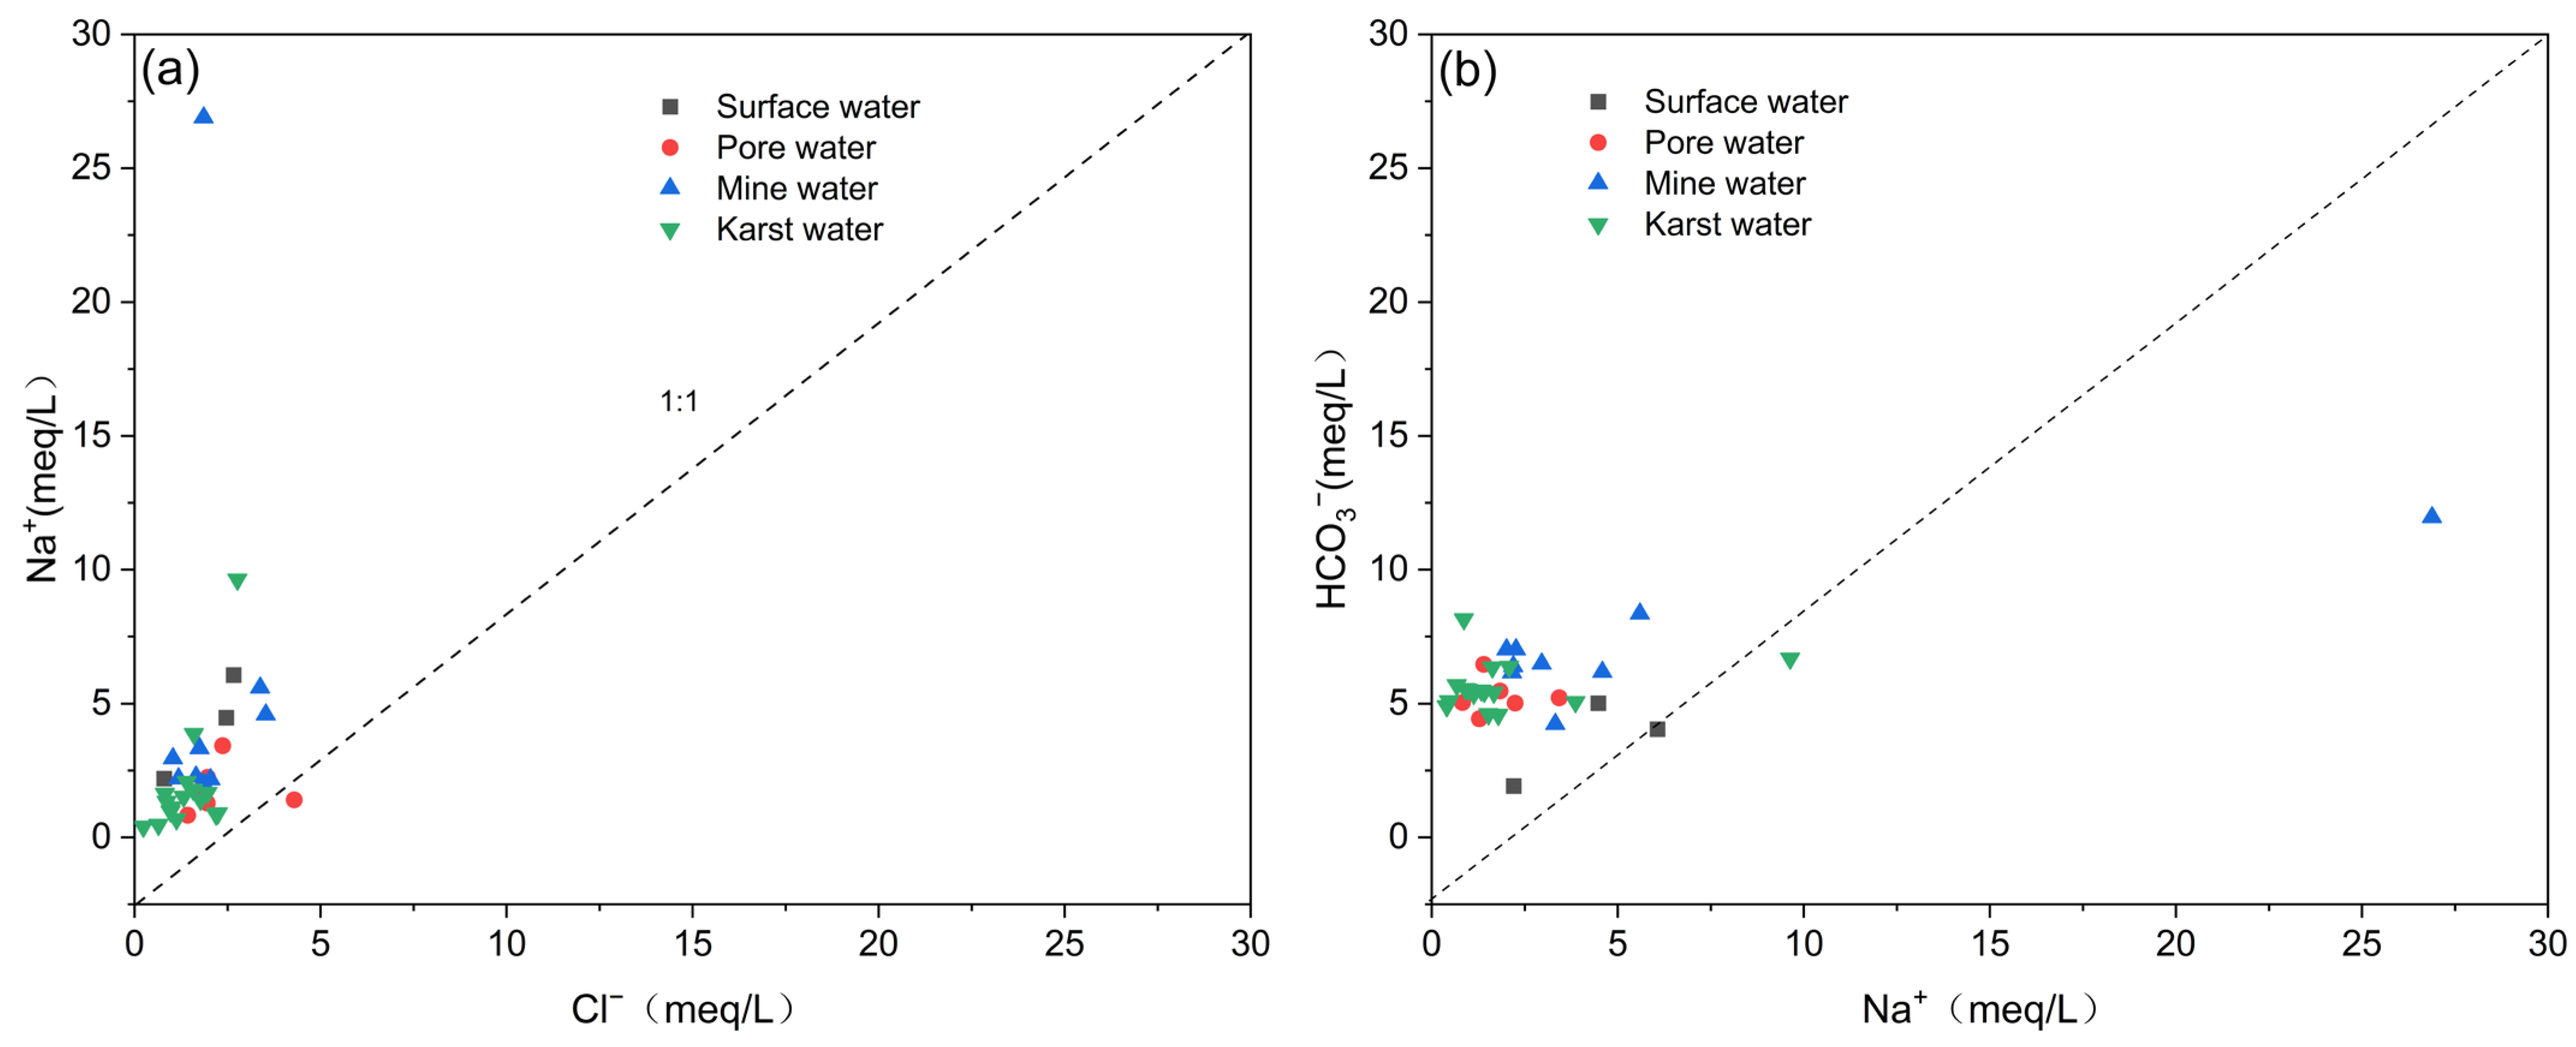
4.2.3. Analysis of Ion Ratios

The ratios of γ(Mg2+)/γ(Na+), γ(Ca2+)/γ(Na+), γ(Mg2+)/γ(Ca2+), and γ(Na+)/γ(Ca2+) indicate that most groundwater sites are close to the carbonate dissolution end—member, while a few mine water sites are located near the end—members of evaporite dissolution and silicate weathering. The surface water sites are close to the end—member of silicate mineral weathering dissolution (Figure 9a). The groundwater sites are mainly distributed near the limestone dissolution end—member, while the surface water sites are close to the silicate dissolution end—member. The sites of different types of water bodies are distributed in a concentrated manner (Figure 9b).
The locations of surface water, mine water, and karst water are distributed on the side where Na+/Cl > 1 (Figure 10a), while the locations of pore water are situated on both sides of Na+/Cl = 1. The majority of the locations are found on the side where HCO3/Na+ > 1 (Figure 10b). In Figure 11a, the ratio of γ(Ca2+ + Mg2+-SO42−-HCO3)/γ(K+ + Na+-Cl) has the vast majority of points located on or near the line with a value of −1. In Figure 11b, the chlor-alkali indices (CAI-1 and CAI-2) for surface water, mine water, and some pore water and karst water locations are negative, while the CAI-1 and CAI-2 values for some pore water and karst water locations are positive.
The correlation between NO3 and Cl in surface water and different types of groundwater in the study area is weak (Figure 12). All water sample points, especially those of surface water, are close to the end—member of human feces and domestic sewage sources in terms of the ratio of γ(NO3/Cl) to γ(Cl) (Figure 13a). The surface water and groundwater samples in the study area show extremely low γ(NO3)/γ(Ca2+) ratios, and the points of the ratios of γ(SO42−)/γ(Ca2+) to γ(NO3)/γ(Ca2+) are distributed in the upper—left area of the graph (Figure 13b).
In Figure 14a, the ratio of γ(Ca2+ + Mg2+)/γ(HCO3) is greater than 1/2 for all points. In Figure 14b, all points are located above the 1:1 line. In Figure 15a, the locations of surface water, pore water, mine water, and karst water in the study area all show a significant positive correlation between γ(Ca2+ + Mg2+) and γ(HCO3 + SO42−). All surface water locations are below the 1:1 line. All pore water locations and the majority of karst water locations are near or above the 1:1 line (Figure 15a). Most mine water locations are near the 1:1 equilibrium line, and some mine water and karst water locations are below the 1:1 line (Figure 15a).
In Figure 15b, the surface water in the study area shows a strong positive correlation between γ(Ca2+) and γ(SO42−), with the ratio of γ(Ca2+) to γ(SO42−) significantly deviating downward from 1:1. In pore water, γ(Ca2+) and γ(SO42−) have a strong correlation (R2 = 0.63), and the ratio of γ(Ca2+) to γ(SO42−) significantly deviates upward from 1:1. In mine water, γ(Ca2+) and γ(SO42−) have a moderate correlation (R2 = 0.50), with the ratio of γ(Ca2+) to γ(SO42−) gradually deviating downward from above 1:1. In karst water, γ(Ca2+) and γ(SO42−) have a significant correlation, with R2 = 0.90, and the ratio of γ(Ca2+) to γ(SO42−) gradually deviates downward from above 1:1.

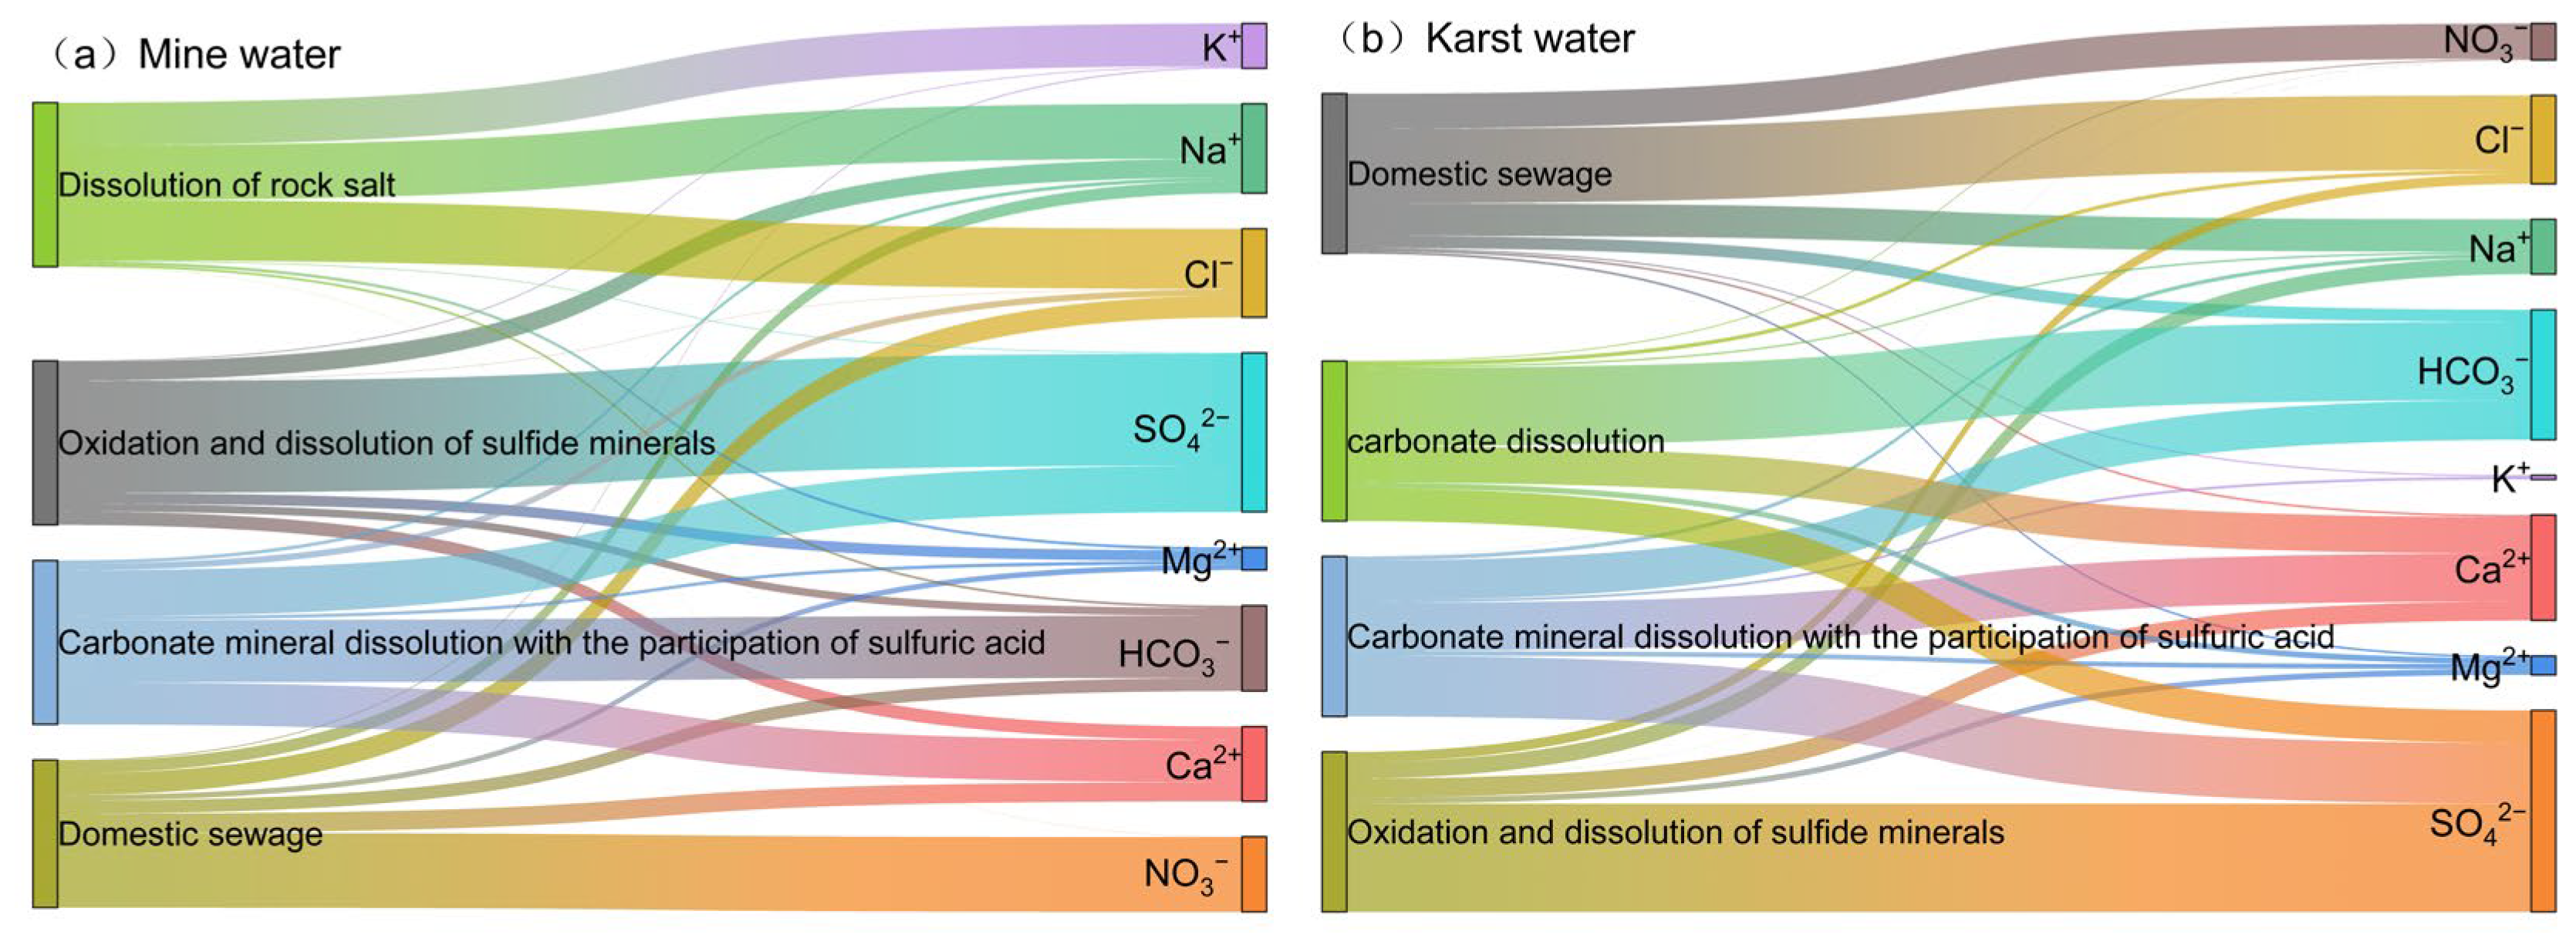
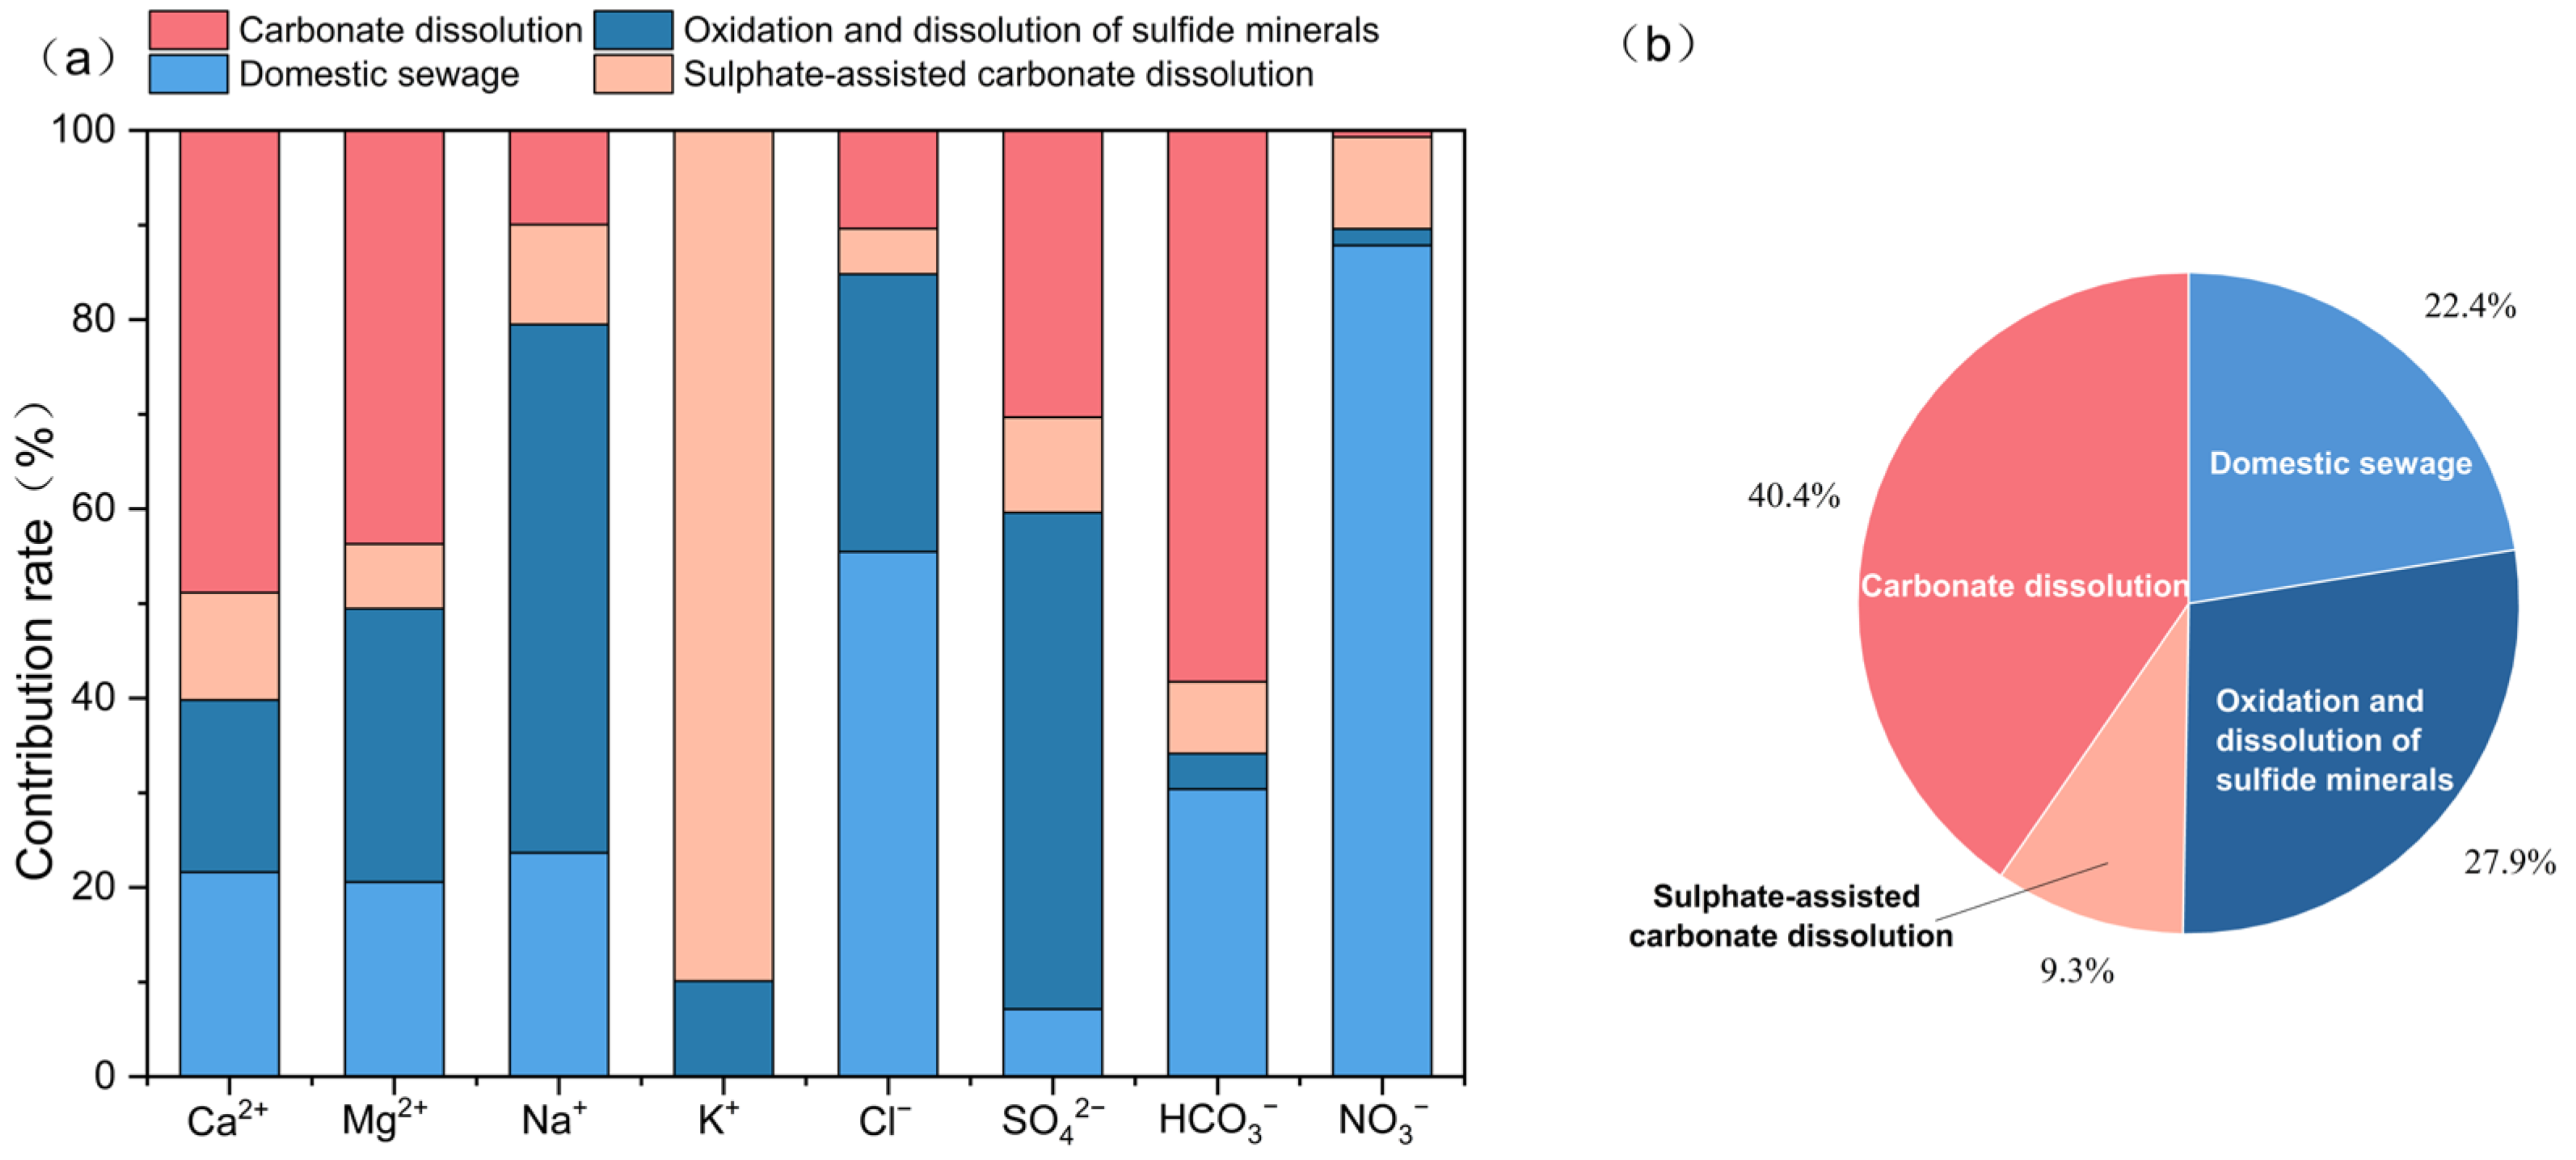
4.2.4. Quantitative Source Analysis Using PMF

The principal component loadings of the hydrochemical components of mine water and karst water are shown in Table 2. The primary sources of Ca2+ and HCO3 in mine water are carbonate dissolution. Mining activities mainly affect the concentrations of SO42−, Mg2+, and Na+. Rock salt dissolution leads to increased levels of Na+, K+, and Cl in mine water. NO3 is only influenced by domestic sewage. The dominant factors controlling the hydrochemical composition of mine water are sulfate—involved carbonate mineral dissolution and mining activities, with a relatively minor impact from domestic sewage (Table 2 and Figure 16a).
In the mine water PMF model, the ion with the highest contribution rate in Factor 1 is SO42−, followed by Na+, Ca2+, and Mg2+. The significant correlation between SO42− and these ions indicates that they may originate from the oxidation of sulfur—containing minerals and the dissolution of evaporite minerals. Therefore, Factor 1 is identified as the mining activity factor. In Factor 2, the highest contribution rates are for NO3 (45.63%), Ca2+ (13.15%), and Cl (11.63%). NO3 mainly comes from chemical fertilizers, animal husbandry, domestic sewage, soil organic nitrogen transformation, and atmospheric deposition [42]. Cl primarily originates from the dissolution of rock salt or other chlorides in sedimentary rocks, the weathering dissolution of chlorine—containing minerals in igneous rocks, the leaching of seawater and volcanic ejecta, and anthropogenic pollution from industrial and domestic sewage [43]. Therefore, Factor 2 is identified as the domestic sewage factor. The main controlling factors in Factor 3 are HCO3, SO42−, and Ca2+. HCO3 and Ca2+ mainly come from the dissolution of carbonate minerals such as dolomite and calcite, as well as gypsum [44]. SO42− mainly originates from the dissolution of gypsum or other sulfates in sedimentary rocks and the oxidation of sulfides under the influence of mining activities [12,45]. Thus, Factor 3 is considered the sulfate—involved carbonate dissolution factor. The main ions in Factor 4 are Na+, Cl, and K+. K+ is generally believed to come from natural minerals. The main component of rock salt minerals is NaCl, accompanied by a small amount of potassium. Hence, Factor 4 is identified as the rock salt dissolution factor (Table 2 and Figure 17).
In the karst water PMF model, the main loadings in Factor 1 are Cl, NO3, and Na+. This factor is identified as the domestic sewage factor. In Factor 2, the ion with the highest contribution rate is SO42− (67.63%), followed by Ca2+ and Na+. Since the contribution rates of the latter two are much lower than that of SO42−, SO42− is the dominant ion. This factor is identified as the mining activity factor. In Factor 3, the contributions of SO42−, Ca2+, and HCO3 are 37.96%, 29.98%, and 24.79%, respectively. This indicates that the karst water in the closed—mine area is a carbonate fracture karst water. Mine water with high sulfate content enters the karst aquifer through coal—bearing strata fractures and participates in the dissolution of carbonate minerals. Therefore, this factor is identified as the sulfate—involved carbonate dissolution factor. In Factor 4, the contributions of HCO3 and Ca2+ are 48.88% and 22.76%, respectively. This factor is identified as the carbonate dissolution factor (Table 2 and Figure 16b).
The primary sources of Ca2+, HCO3, Mg2+, and K+ in karst water are carbonate dissolution. SO42− and Na+ mainly come from mining activities. Cl and NO3 primarily originate from domestic sewage. The contribution rate of mining activities to SO42− is 59.86%. The contribution rates of carbonate dissolution, mining activities, domestic sewage, and sulfate—involved carbonate mineral dissolution factors to karst water are 40.4%, 27.9%, 22.4%, and 9.3%, respectively (Table 2 and Figure 18). Mining activities have a significant impact on the hydrochemical composition of karst water in the study area, and the influence of domestic sewage on karst water is greater than that on mine water.

5. Discussion

5.1. Dissolution and Weathering of Minerals

The solutes in the waters of the study area have a certain common origin [46], and the mineralization process of surface water is mainly controlled by silicate weathering [47]. Combining the previous analysis of mineral saturation indices, the saturation indices of calcite in the majority of groundwater sites and dolomite in some groundwater sites are both greater than 0 (Figure 8c,d). The mineralization process of groundwater is primarily controlled by the dissolution and weathering of carbonate minerals such as calcite, dolomite, and limestone [48]. Meanwhile, the PMF model further confirms that Ca2+ and HCO3 in mine water mainly originate from carbonate dissolution (Figure 16a and Table 2). In karst water, Ca2+, HCO3, Mg2+, and K+ are mainly derived from carbonate dissolution (Figure 16b and Table 2). The mineralization processes of surface water and groundwater in the study area are jointly controlled by carbonate dissolution and silicate weathering [26].
The ions Ca2+, Mg2+, and SO42− in mine water may also originate from the dissolution of evaporite minerals such as gypsum [49]. The strong correlation between SO42− and Mg2+, Mn in mine water (Figure 7b) indicates that the main ions primarily come from the dissolution and oxidation of sulfur—containing minerals in coal seams as well as the dissolution of evaporite minerals [49]. In particular, the sulfate content in groundwater near coalfields exceeds the groundwater quality standard (250 mg/L) [50]. According to the results of source apportionment of sulfate simulated by Bayesian stable isotope mixing models based on the R language, the average proportions of sulfide minerals, gypsum dissolution, atmospheric precipitation, and sewage sources in karst water are 64.35%, 16.00%, 12.62%, and 7.04%, respectively [51], which shows that the sulfate in karst water mainly comes from the oxidation of sulfide minerals, with the proportion of sulfide minerals reaching as high as 86% at some sites [50]. The average proportions of sulfide minerals, gypsum dissolution, atmospheric precipitation, and sewage sources in fracture water are 65.13%, 18.30%, 8.55%, and 8.00%, respectively, indicating that the sulfate in fracture water also mainly comes from the oxidation of sulfide minerals, with the proportion of sulfide minerals reaching as high as 83% at some sites [50]. In addition, Na+ in surface water, mine water, and karst water in the study area mainly comes from the dissolution of rock salt (Figure 10a). The PMF model confirms that the dissolution of rock salt leads to increased levels of Na+, K+, and Cl in mine water (Figure 10b).

5.2. Cation Exchange Action

The waters in the study area are generally weakly alkaline, which facilitates the occurrence of cation exchange [52]. As shown in Figure 11a, the vast majority of sites are located on or near the −1 ratio line, indicating that cation exchange has occurred in both surface water and groundwater in the study area. The chlor-alkali index analysis in Figure 11b shows that reverse cation exchange occurred in surface water, mine water, and a few pore water and karst water sites. The K+ and Na+ from the surrounding rocks have exchanged with the Ca2+ and Mg2+ in the water, resulting in increased concentrations of K+ and Na+ in the water [53]. In some pore water and karst water sites, cation exchange has occurred, with K+ and Na+ in the water exchanging with Ca2+ and Mg2+ in the surrounding rocks, leading to elevated concentrations of Ca2+ and Mg2+ in the water [54].

5.3. Human Activities

The significant positive correlation between Na+ and NO3 (Figure 12 and Figure 13) indicates that these ions are mainly influenced by anthropogenic pollution sources such as fertilizers, pesticides, and domestic sewage [46]. The poor correlation between NO3 and Cl in surface water and different types of groundwater in the study area (Figure 12) suggests that the sources of NO3 and Cl in the water bodies are different. This study uses the reference values of γ(NO3/Cl) reported for the Weining Plain in Ningxia (0.05–0.22) as a benchmark [55]. The NO3 in the waters of the study area mainly originates from human feces and domestic sewage (Figure 13a). Generally, mining activities are associated with relatively high γ(SO42−)/γ(Ca2+) ratios and low γ(NO3)/γ(Ca2+) ratios, while agricultural activities show the opposite trend [55]. The surface water and groundwater in the study area are significantly affected by mining activities, while agricultural activities have a relatively minor impact (Figure 13b). NO3 is only influenced by domestic sewage (Figure 17). Mining activities mainly affect the concentrations of SO42−, Mg2+, and Na+. Some mine water and karst water sites are located below the 1:1 line (Figure 15a). Combining the coal mining background of the study area with the distribution of Ca2+ and SO42− in Figure 15b, the SO42− concentrations in surface water, pore water, and karst water are affected by coal mining activities, and the degree of impact is ranked from highest to lowest as karst water, surface water, and pore water [56,57,58,59,60].
PMF model simulations show that the factors contributing to the hydrochemical composition of karst water, in descending order of contribution rate, are carbonate dissolution, mining activities, domestic sewage, and sulfate—involved carbonate mineral dissolution (Figure 17 and Figure 18). This indicates that in the hydrochemical composition of karst water, carbonate dissolution plays a dominant role, mining activities have a significant impact, and domestic sewage has a certain influence, while the impact of the sulfate—involved carbonate mineral dissolution factor is relatively minor. For mine water, the main controlling factors of its hydrochemical composition are sulfate—involved carbonate mineral dissolution and mining activities, indicating that in the hydrochemical composition of mine water, natural geological processes and mining activities play a leading role, while the impact of anthropogenic domestic sewage is relatively small. The influence of domestic sewage on karst water is greater than that on mine water, which may be related to the hydrogeological conditions of karst water and the spatial distribution of human activities.

6. Conclusions

This study has identified the hydrochemical types of surface water and groundwater in the closed coal mining area in southwestern Shandong Province, China, and elucidated the mechanisms of chemical composition formation in different types of water bodies.
(1) The statistical analysis results show that the highest concentration of SO42− in surface water and pore water is 901.62 mg/L, while the highest concentration of SO42− in karst water is 1131.35 mg/L. According to the Piper trilinear diagram, the hydrochemical types of surface water, pore water, and mine water are predominantly SO4-HCO3-Ca, whereas karst water is characterized by both SO4-HCO3-Ca and HCO3-SO4-Ca types. The methods of ion ratio coefficients, mineral saturation indices, and correlation analysis indicate that the mineralization process of surface water is primarily controlled by silicate weathering, with minor influences from the oxidation of pyrite and other sulfides, as well as the dissolution of carbonates and gypsum. In contrast, the mineralization process of groundwater is mainly controlled by the dissolution of carbonate minerals, with relatively minor impacts from silicate weathering, oxidation of pyrite and other sulfides, and dissolution of evaporite rocks.
(2) The results of the PMF (Positive Matrix Factorization) model analysis indicate that the primary source of SO42− in the karst water is the oxidation and dissolution of sulfides, with a contribution rate exceeding 50%. Moreover, the surface water and groundwater in the study area are both affected to varying degrees by coal mining activities, which may pose a potential threat to the water quality safety of the Eastern Route of the South-to-North Water Transfer Project. Additionally, to enhance water quality monitoring and pollution prevention in the water source area, it is recommended to further investigate the spatiotemporal evolution patterns of regional groundwater geochemistry.

Author Contributions

Conceptualization, X.W.; methodology, J.H. (Jianguo He); software, X.S.; validation, D.L.; investigation, H.Z.; resources and data curation, G.Z.; writing—original draft preparation, X.W.; writing—review and editing, J.H. (Jinxian He); project administration, M.W.; funding acquisition, M.W. All authors have read and agreed to the published version of the manuscript.

Funding

This research was supported by the Science and Technology Innovation Special Project for Carbon Peak and Carbon Neutrality in Jiangsu Province (BE2023855), the National Natural Science Foundation of China (42002193), the Special Science and Technology Fund of China National Administration of Coal Geology (ZMKJ-2023-JBGS02-03; ZMKJ-2025-ZX05-2-02), the Open Fund Project of Jiangsu Geological Society (JSDZXH-P2024-03; JSDZXH-P2025-03).

Institutional Review Board Statement

Not applicable.

Informed Consent Statement

Not applicable.

Data Availability Statement

The data presented in this study are available on request from the corresponding author.

Acknowledgments

We sincerely thank Ping Lu and Qiyan Feng for their assistance with sample collection, experimental design, and analytical testing. We also gratefully acknowledge the three anonymous reviewers for their insightful comments and valuable suggestions, which substantially improved the manuscript.

Conflicts of Interest

The authors declare no competing financial interest.

References

  1. Yuan, L.; Jiang, Y.; Wang, K.; Zhao, Y.; Hao, X.; Xu, C. Precision exploitation and utilization of closed/abandoned mine resources in China. J. China Coal Soc. 2018, 43, 14–20. [Google Scholar]
  2. Sun, Y.; Xu, Z.; Li, X.; Zhang, L.; Chen, G.; Zhao, X.; Gao, Y.; Liu, Q.; Zhang, S.; Wang, W.; et al. Mine water drainage pollution in China’s coal mining areas and the construction of prevention and control technical system. Coal Geol. Explor. 2021, 49, 1–16. [Google Scholar]
  3. He, X.; Wu, G.; Zhu, S.; Qiao, J.; Wang, X. The key directions research and consideration of abandoned coal mines geological work in China. China Min. Mag. 2019, 28, 80–84. [Google Scholar]
  4. Tarasenko, I.; Kholodov, A.; Zin’kov, A.; Chekryzhov, I. Chemical composition of groundwater in abandoned coal mines: Evidence of hydrogeochemical evolution. Appl. Geochem. 2022, 137, 105210. [Google Scholar] [CrossRef]
  5. Lu, M.; Wu, E.; Li, M. Study on the hydrogeochemistry genesis of high fluorine shallow-bed groundwater in southwestern Shandong Province. Coal Geol. Explor. 2001, 29, 39–42. [Google Scholar]
  6. Liu, C.; Wang, W.; Yang, L.; Zhu, H.; Guo, Y.; Ma, Y.; Guo, J.; Liu, B. Driving mechanisms of fluorine enrichment characteristics in groundwater, Shandong Province. Acta Geol. Sin. 2021, 95, 1962–1972. [Google Scholar]
  7. Bian, Y.; Zhao, D.; Han, Y. Hydrochemical characteristics and formation mechanism of ordovician limestone groundwater in the Yanzhou Coalfield. Acta Geosci. Sin. 2017, 38, 236–242. [Google Scholar]
  8. Abanyie, S.K.; Apea, O.B.; Abagale, S.A.; Amuah, E.E.Y.; Sunkari, E.D. Sources and factors influencing groundwater quality and associated health implications: A review. Emerg. Contam. 2023, 9, 100207. [Google Scholar] [CrossRef]
  9. Ojo, O.I.; Otieno, F.; Ochieng, G. Groundwater: Characteristics, qualities, pollutions and treatments: An overview. Int. J. Water Res. Environ. Eng. 2012, 4, 162–170. [Google Scholar]
  10. Deng, J.; Yang, G.; Yan, X.; Du, J.; Tang, Q.; Yu, C.; Pu, S. Quality evaluation and health risk assessment of karst groundwater in Southwest China. Sci. Total Environ. 2024, 946, 174371. [Google Scholar] [CrossRef] [PubMed]
  11. Krzemień, A.; Sánchez, A.S.; Fernández, P.R.; Zimmermann, K.; Coto, F.G. Towards sustainability in underground coal mine closure contexts: A methodology proposal for environmental risk management. J. Clean. Prod. 2016, 139, 1044–1056. [Google Scholar] [CrossRef]
  12. Zhang, G.; Mi, M. Sedimentary facies of clastic-platform carbonate sediment strata of epicontinental sea in the Daniudi Gasfield, Ordos Basin. Nat. Gas Ind. B 2021, 8, 239–251. [Google Scholar] [CrossRef]
  13. HJ 164-2020; Technical Specifications for Environmental Monitoring of Groundwater. Ministry of Ecology and Environment of the People’s Republic of China: Beijing, China, 2020.
  14. DZ/T 0064.49-2021; Geological and Mineral Industry Standards of the People’s Republic of China; Groundwater Quality Analysis Method part 49: Determination of Carbonate, Bicarbonate, and Hydroxide Ions Titration Method. Ministry of Natural Resources of the People’s Republic of China: Beijing, China, 2021.
  15. Chen, J.; Yan, B.; Xu, T.; Fan, X. Hydrochemical evolution characteristics and mechanism of groundwater funnel areas under artificial governance in Hengshui City, North China. Ecol. Indic. 2023, 148, 110059. [Google Scholar] [CrossRef]
  16. Han, X.; Pan, B.; Liu, Z.; Hou, B.; Li, D.; Li, M. Relationship among water quality and hydrochemical indices reveals nutrient dynamics and sources in the most sediment-laden river across the continent. J. Environ. Chem. Eng. 2022, 10, 107110. [Google Scholar] [CrossRef]
  17. Wang, P.; Zhang, W.; Zhu, Y.; Liu, Y.; Li, Y.; Cao, S.; Hao, Q.; Liu, S.; Kong, X.; Han, Z.; et al. Evolution of groundwater hydrochemical characteristics and formation mechanism during groundwater recharge: A case study in the Hutuo River alluvial–pluvial fan, North China Plain. Sci. Total Environ. 2024, 915, 170159. [Google Scholar] [CrossRef] [PubMed]
  18. Liu, S.; Zhang, D.; Li, Y.; Yang, J.; Zou, S.; Wang, Y.; Huang, X.; Zhang, Z.; Yang, W.; Jia, B. Water sources and factors controlling hydro-chemical compositions in the Yiluo river basin. Environ. Sci. 2020, 41, 1184–1196. [Google Scholar]
  19. Gaillardet, J.; Dupre, B.; Louvat, P.; Allegre, C. Global silicate weathering and CO2 consumption rates deduced from the chemistry of large rivers. Chem. Geol. 1999, 159, 3–30. [Google Scholar] [CrossRef]
  20. Wu, Y.; Luo, Z.; Luo, W.; Ma, T.; Wang, Y. Multiple isotope geochemistry and hydrochemical monitoring of karst water in a rapidly urbanized region. J. Contam. Hydrol. 2018, 218, 44–58. [Google Scholar] [CrossRef] [PubMed]
  21. Zhang, H.; Wu, Y.; Luo, W.; Chen, W.; Liu, H. Hydrogeochemical Investigations of Groundwater in the Lingbei Area, Leizhou Peninsula. Environ. Sci. 2020, 41, 4924–4935. [Google Scholar]
  22. Qu, S.; Shi, Z.; Liang, X.; Wang, G.; Han, J. Multiple factors control groundwater chemistry and quality of multi-layer groundwater system in Northwest China coalfield—Using self-organizing maps (SOM). J. Geochem. Explor. 2021, 227, 106795. [Google Scholar] [CrossRef]
  23. Shi, X.; Kang, X.; Xu, M.; Deng, H. Hydrochemical characteristics and evolution laws of karst groundwater in the slope zone of the canyon area, Sichuan-Yunnan Plateau. Acta Geol. Sin. 2019, 93, 2975–2984. [Google Scholar]
  24. Li, G.; Han, Z.; Shen, C.; Zeng, Z. Distribution characteristics and causes of nitrate in waters of typical small karst catchment: A case of the Houzhai river catchment. Earth Sci. 2019, 44, 2899–2908. [Google Scholar]
  25. Liu, C.; Li, S.; Lang, Y.; Xiao, H. Using δ15N-and δ18O-values to identify nitrate sources in karst ground water, Guiyang, southwest China. Environ. Sci. Technol. 2006, 40, 6928–6933. [Google Scholar] [CrossRef] [PubMed]
  26. Puig, R.; Soler, A.; Widory, D.; Mas-Pla, J.; Domenech, C.; Otero, N. Characterizing sources and natural attenuation of nitrate contamination in the Baix Ter aquifer system (NE Spain) using a multi-isotope approach. Sci. Total Environ. 2017, 580, 518–532. [Google Scholar] [CrossRef] [PubMed]
  27. Yu, X.; Liu, H.; Wang, Q.; Kou, X.; Cao, X.; Xu, Z.; Wen, L.; Zhuo, Y.; Wang, L. Hydrochemical and stable isotope characteristics of surface water and groundwater in Xiliugou and Wulagai River basin, North China. Ecohydrol. Hydrobiol. 2024, 24, 62–72. [Google Scholar] [CrossRef]
  28. Fan, L.; Ma, W.; Chang, B.; Sun, K.; Miao, Y.; Lu, B.; Tian, S.; Yang, L. Hydrochemical characteristics and formation mechanism of groundwater in Yushenfu Mining Area. Coal Sci. Technol. 2023, 51, 383–394. [Google Scholar]
  29. Zheng, T.; Jiao, T.; Hu, B.; Gong, J.; Hou, X.; Wang, H. Hydrochemical characteristics and origin of groundwater in the central Guohe river basin. Environ. Sci. 2021, 42, 766–775. [Google Scholar]
  30. Jin, D.; Wang, T.; Zhao, B.; Li, D.; Zhou, Z.; Shang, H. Distribution characteristics and formation mechanism of high salinity groundwater in northeast Ningdong Coalfield. Coal Geol. Explor. 2022, 50, 118–127. [Google Scholar]
  31. Chen, R.; Chen, H.; Song, L.; Yao, Z.; Meng, F.; Teng, Y. Characterization and source apportionment of heavy metals in the sediments of Lake Tai (China) and its surrounding soils. Sci. Total Environ. 2019, 694, 133819. [Google Scholar] [CrossRef] [PubMed]
  32. GB/T 14848-2017; Standard for Groundwater Quality. General Administration of Quality Supervision, Inspection and Quarantine of the People’s Republic of China Standardization Administration of China: Beijing, China, 2017.
  33. GB 3838-2002; Environmental Quality Standards for Surface Water. Ministry of Ecology and Environment of the People’s Republic of China: Beijing, China, 2020.
  34. Ai, Y.; Chen, H.; Chen, M.; Huang, Y.; Han, Z.; Liu, G.; Gao, X.; Yang, L.; Zhang, W.; Jia, Y.; et al. Characteristics and treatment technologies for acid mine drainage from abandoned coal mines in major coal-producing countries. J. China Coal Soc. 2023, 48, 4521–4535. [Google Scholar]
  35. Li, X.; Li, C.; Parriaux, A.; Wu, W.; Li, H.; Sun, L.; Liu, C. Multiple resources and their sustainable development in Urban Underground Space. Tunn. Undergr. Space Technol. 2016, 55, 59–66. [Google Scholar] [CrossRef]
  36. Wang, F.; Liu, C.; Liang, X.; Wei, Z.; Li, J. Acid mining drainage impacts on the separation between iron and manganese in sediments of the Aha Lake, Guizhou Province. Environ. Sci. 2005, 26, 135–140. [Google Scholar]
  37. Wang, Y.; Jiao, J.; Cherry, J.A.; Lee, C.M. Contribution of the aquitard to the regional groundwater hydrochemistry of the underlying confined aquifer in the Pearl River Delta, China. Sci. Total Environ. 2013, 461–462, 663–671. [Google Scholar] [CrossRef] [PubMed]
  38. Wang, C.; Liao, F.; Wang, G.; Qu, S.; Mao, H.; Bai, Y. Hydrogeochemical evolution induced by long-term mining activities in a multi-aquifer system in the mining area. Sci. Total Environ. 2023, 854, 158806. [Google Scholar] [CrossRef] [PubMed]
  39. Luo, C.; Routh, J.; Dario, M.; Sarkar, S.; Wei, L.; Luo, D.; Liu, Y. Distribution and mobilization of heavy metals at an acid mine drainage affected region in South China, a postremediation study. Sci. Total Environ. 2020, 724, 138122. [Google Scholar] [CrossRef] [PubMed]
  40. Li, Q.; Wu, P.; Zha, X.; Li, X.; Wu, L.; Gu, S. Effects of mining activities on evolution of water chemistry in coal-bearing aquifers in karst region of Midwestern Guizhou, China: Evidences from δ13C of dissolved inorganic carbon and δ34S of sulfate. Environ. Sci. Pollut. Res. 2018, 25, 18038–18048. [Google Scholar] [CrossRef] [PubMed]
  41. Jiang, C.; Huang, W.; Fu, X.; Zheng, L.; Cheng, S.; Shan, C. Characteristics and genetic mechanism of low sulfate in high-salt groundwater of Permian sandstone in Fudong mining area, Huainan. Coal Geol. Explor. 2023, 51, 74–82. [Google Scholar]
  42. Yu, L.; Zheng, T.; Zheng, X. Review of nitrate source apportionment and nitrogen isotope fractionation in groundwater. Geosciences 2022, 36, 563–573. [Google Scholar]
  43. He, W.; Li, F.; Yu, J.; Chen, M.; Deng, Y.; Li, J.; Tang, X.; Chen, Z.; Yan, Z. Risk assessment and source apportionment of trace elements in multiple compartments in the lower reach of the Jinsha River, China. Sci. Rep. 2021, 11, 20041. [Google Scholar] [CrossRef] [PubMed]
  44. Li, C.; Wu, X.; Sun, B.; Sui, H.; Geng, F.; Qi, H.; Ma, X. Hydrochemical characteristics and formation mechanism of geothermal water in Northern Ji’nan. Earth Sci. 2018, 43 (Suppl. 1), 313–325. [Google Scholar]
  45. Li, S.; Calmels, D.; Han, G.; Gaillardet, J.; Liu, C. Sulfuric acid as an agent of carbonate weathering constrained by δ13CDIC: Examples from Southwest China. Earth Planet. Sci. Lett. 2008, 270, 189–199. [Google Scholar] [CrossRef]
  46. Jiang, W.; Sheng, Y.; Shi, Z.; Guo, H.; Chen, X.; Mao, H.; Liu, F.; Ning, H.; Liu, N.; Wang, G. Hydrogeochemical characteristics and evolution of formation water in the continental sedimentary basin: A case study in the Qaidam Basin, China. Sci. Total Environ. 2024, 957, 177672. [Google Scholar] [CrossRef] [PubMed]
  47. Chen, K.; Liu, Q.; Liu, Y.; Peng, W.; Wang, Z.; Zhao, X. Hydrochemical characteristics and source analysis of deep groundwater in Qianyingzi Coal Mine. Coal Geol. Explor. 2022, 50, 99–106. [Google Scholar]
  48. Linghu, C.; Cun, D.; Yin, L.; Liu, Z.; Tu, C.; Pang, L. Hydrochemical characteristics and controlling Factors of surface water and groundwater in typical coal mining areas in Eastern Yunnan. Sci. Technol. Eng. 2023, 23, 13728–13740. [Google Scholar]
  49. Xia, Q.; He, J.; Li, B.; He, B.; Huang, J.; Guo, M.; Luo, D. Hydrochemical evolution characteristics and genesis of groundwater under long-term infiltration (2007–2018) of reclaimed water in Chaobai River, Beijing. Water Res. 2022, 226, 119222. [Google Scholar] [CrossRef] [PubMed]
  50. Chen, H.; Chen, H.; Zhang, F.; Han, Z.; Shi, H.; Meng, J.; Feng, Q.; Chen, D. Study on the impact of closed coal mines on groundwater in the Panlong River Basin (Shangdong Province, China) based on sulfur and oxygen isotopes. Water 2024, 16, 1634. [Google Scholar] [CrossRef]
  51. Zhang, D.; Zhu, S.; Zhao, Z.; Li, H.; Yang, J.; Duan, H.; Guo, W.; Liu, Y. The Water-Sediment Regulation Scheme at Xiaolangdi Reservoir and Its Impact on Sulfur Cycling in the Yellow River Basin. Earth Sci. 2022, 47, 589–606. [Google Scholar]
  52. Jiang, C.; Cheng, L.; Li, C.; Zheng, L. A hydrochemical and multi-isotopic study of groundwater sulfate origin and contribution in the coal mining area. Ecotoxicol. Environ. Saf. 2022, 248, 114286. [Google Scholar] [CrossRef] [PubMed]
  53. Li, P.; Tian, R.; Liu, R. Solute geochemistry and multivariate analysis of water quality in the Guohua Phosphorite Mine, Guizhou Province, China. Expos. Health 2019, 11, 81–94. [Google Scholar] [CrossRef]
  54. Wang, S.; Liu, Z.; Zhou, W.; Jiang, Y.; Ding, H.; Dong, F. Evolution of karst geothermal hydrochemical characteristics and genesis mechanism in northern Jinan, Shandong, Eastern China. ACS Omega 2024, 9, 36299–36313. [Google Scholar] [CrossRef] [PubMed]
  55. Gao, X.; Li, X.; Wang, W.; Li, C. Human activity and hydrogeochemical processes relating to groundwater quality degradation in the Yuncheng Basin, northern China. Int. J. Environ. Res. Public Health 2020, 17, 867. [Google Scholar] [CrossRef] [PubMed]
  56. Tu, C.; Yin, L.; He, C.; Cun, D.; Ma, Y.; Linghu, C. Hydrochemical composition characteristics and control factors of Xiaohuangni river basin in the upper pearl river. Environ. Sci. 2022, 43, 1885–1897. [Google Scholar]
  57. Jin, Y.; Long, J.; Ren, J.; Ni, X. Water source analysis of mine filling foundation based on hydrochemical characteristics. Coal Sci. Techno. 2022, 50, 173–180. [Google Scholar]
  58. Wang, Y.; Wang, H.; Wang, T.; Xue, J.; Shang, H.; Zhou, Z. Hydrochemical characteristics and source analysis of mine water in shallow coal seams in Shaanxi and Inner Mongolia contiguous area. Coal Geol. Explor. 2023, 51, 85–94. [Google Scholar]
  59. Zhang, F.; Wang, G.; Zhang, M.; Sun, P.; Han, X. Identification of produced water and characteristics of hydrochemistry and stable hydrogen−oxygen isotopes of contaminated groundwater. Northwest. Geol. 2023, 56, 98–108. [Google Scholar]
  60. Wang, Z.; Pei, J.; Ruan, C.; Adimalla, N.; Liu, H.; Guo, H. Hydrochemical characteristics and salinity formation mechanism of different water bodies in the southern Tibet, China. Environ. Geochem. Health 2024, 47, 7. [Google Scholar] [CrossRef] [PubMed]
Figure 1. Hydrogeological plan and profile diagram of the research area of the study area [12]. (a) Hydrogeological plan of the study area; (b) Hydrogeological cross-section of the study area.
Eng 06 00164 g001
Figure 2. Layout of surface water and groundwater sampling points. D, K, L, and Y represent surface water, pore water, mine water, and karst water, respectively. The last two digits (2, 3) indicate the sampling years 2022 and 2023.
Eng 06 00164 g002
Figure 3. Boxplots of TDS, SO42−, Fe, and Mn concentrations in different water bodies in the study area.
Eng 06 00164 g003
Figure 4. Piper trilinear diagrams of surface water and groundwater in the study area for 2022 and 2023. (a) Piper trilinear diagrams of surface-water and groundwater samples collected from the study area in 2022; (b) Piper trilinear diagrams of surface-water and groundwater samples collected from the study area in 2023.
Eng 06 00164 g004
Figure 5. Relationships between pH and TDS, pH and EC, and pH and Eh in different water bodies in the study area.
Eng 06 00164 g005
Figure 6. Relationship between SO42− and TDS in different water bodies in the study area.
Eng 06 00164 g006
Figure 7. Ion correlation coefficient matrices for pore water (a), mine water (b), and karst water (c) in the study area. The red circle represents positive correlation, and the blue circle represents negative correlation. The size of the circles indicates the strength of the correlation.
Eng 06 00164 g007
Figure 8. SI of major minerals in water bodies in the study area. (a) The correlation between gypsum SI and TDS; (b) The correlation between rock salt SI and TDS; (c) The correlation between dolomitic SI and TDS; (d) The correlation between calcite SI and TDS.
Eng 06 00164 g008
Figure 9. Relationships of Mg2+/Na+ and Ca2+/Na+ (a), Mg2+/Ca2+ and Na+/Ca2+ (b) in surface water and groundwater in the study area.
Eng 06 00164 g009
Figure 10. Relationships of Na+/Cl (a) and HCO3/Na+ (b) in surface water and groundwater in the study area.
Eng 06 00164 g010
Figure 11. Cation exchange and chlor-alkali index in surface water and groundwater in the study area.
Eng 06 00164 g011
Figure 12. Relationship of γ(NO3)/γ(Cl) in surface water and groundwater in the study area.
Eng 06 00164 g012
Figure 13. Relationships of γ(NO3/Cl)/γ(Cl) (a) and γ(SO42−/Ca2+)/γ(NO3/Ca2+) (b) in surface water and groundwater in the study area.
Eng 06 00164 g013
Figure 14. Relationships of γ(Ca2+ + Mg2+)/γ(HCO3) (a) and γ(Ca2+ + Mg2+)/γ(SO42−) (b) in surface water and groundwater of the study area.
Eng 06 00164 g014
Figure 15. Relationships of γ(Ca2+ + Mg2+)/γ(HCO3 + SO42−) (a) and γ(Ca2+)/γ(SO42−) (b) in surface water and groundwater of the study area.
Eng 06 00164 g015
Figure 16. Contribution rates of different sources to hydrochemical components in the study area.
Eng 06 00164 g016
Figure 17. Contribution rates of mine water components to factors (a) and relative factor contribution pie chart (b).
Eng 06 00164 g017
Figure 18. Contribution rates of karst water components to factors (a) and relative factor contribution pie chart (b).
Eng 06 00164 g018
Table 1. SI of major minerals in surface water and groundwater of the study area.
Type of Water BodyMineral PhaseSIProportion of Different SI Values/%
Mineral NameChemical FormulaMinMaxAvgSI > 0SI < 0
Surface waterGypsumCaSO4−0.76−0.63−0.70100
Rock saltNaCl, KCl−6.53−5.86−6.20100
DolomiteCaMg(CO3)21.331.771.551000
CalciteCaCO30.91.131.021000
Pore waterGypsumCaSO4−0.84−0.65−0.730100
Rock saltNaCl, KCl−6.95−6.81−6.890100
DolomiteCaMg(CO3)20.470.690.611000
CalciteCaCO30.610.880.721000
Mine waterGypsumCaSO4−2.15−0.27−0.8260100
Rock saltNaCl, KCl−7.42−5.93−6.8260100
DolomiteCaMg(CO3)2−5.031.11−0.4523070
CalciteCaCO3−2.570.52−0.0458020
Karst waterGypsumCaSO4−1.57−0.38−0.942860100
Rock saltNaCl, KCl−7.66−6.28−7.138570100
DolomiteCaMg(CO3)2−0.230.690.2042867129
CalciteCaCO30.050.550.3042861000
Table 2. Main component loadings of hydrochemical constituents.
Chemical IndicatorsMine WaterKarst Water
Factor 1Factor 2Factor 3Factor 4Factor 1Factor 2Factor 3Factor 4
Ca2+8.2211.6325.70.001.3211.8729.9822.76
Mg2+6.473.422.091.821.393.763.043.66
Na+11.497.482.1233.4320.3110.42.481.12
K+0.570.790.0025.970.860.111.630.00
Cl0.2313.153.9436.6946.566.190.002.49
SO42−68.260.0028.190.490.0067.6337.9620.38
HCO34.767.9137.961.477.620.0024.7948.88
NO30.0045.630.000.1321.930.040.120.71
Disclaimer/Publisher’s Note: The statements, opinions and data contained in all publications are solely those of the individual author(s) and contributor(s) and not of MDPI and/or the editor(s). MDPI and/or the editor(s) disclaim responsibility for any injury to people or property resulting from any ideas, methods, instructions or products referred to in the content.

