1. Introduction
Dementia is a neurodegenerative disease characterized by the progressive loss of cognitive functions. It is currently the seventh leading cause of death worldwide among all diseases and is one of the primary causes of disability and dependency among older adults [
1]. According to data from the World Health Organization (WHO), more than two billion people are projected to be aged 60 or older by the year 2050. Since this age group is the most affected by neuropathies, this highlights the significance of developing accurate and early detection and treatment techniques for dementia.
In this context, among the different types of dementia, Alzheimer’s disease (AD) stands out as the most common, accounting for approximately 50% to 75% of all cases [
2]. This type of dementia is marked by memory loss or impairment, along with a decline in visuospatial skills, reasoning, executive functions, and overall cognitive abilities. It is believed that AD may begin developing in the brain as early as 20 years before symptoms appear [
3]. However, in most cases, symptoms tend to manifest around the age of 60, at which point the cognitive decline becomes evident and accelerates [
2]. The progressive course of AD ultimately leads, in its final stages, to complete dependency and, eventually, death.
The convergence of dementia—particularly Alzheimer’s disease—and Artificial Intelligence (AI) has become an increasingly vital field of study. This intersection holds significant promise for advancing our understanding and management of neurodegenerative disorders. Although AI may seem like a modern innovation, its conceptual roots trace back to the 1950s, when researchers first envisioned using computers to replicate human cognitive processes [
4]. Since then, AI has evolved rapidly, positioning itself as a powerful tool in medical research and diagnostics, especially in tackling complex conditions like Alzheimer’s [
5]. From the outset, the goal was to create machines capable of imitating human behavior and, eventually, solving complex problems that could be automated. Over the decades, AI has made substantial progress, particularly in recent years, with major advances in the field of Machine Learning (ML), and more specifically, the subfield of Deep Learning (DL), which uses artificial neural networks to mimic the functioning of the human brain [
6]. This approach has proven effective in replicating complex procedures [
7,
8]. With increased computational capacity, AI and ML have been applied to an increasingly broad range of problems, including those in biology, medicine, and mental health—such as protein folding, seizure detection, and mental health assessment in children using deep neural networks [
9,
10,
11].
In view of this, AI and ML have also been employed for the early detection of dementia and Alzheimer’s disease. Multiple ML techniques have been proposed and applied for the automated diagnosis of patients with Alzheimer’s and/or dementia, using various modeling approaches depending on the type of data collected, which may include brain imaging, clinical data, and/or audio or text from interviews and language tests [
12].
Regarding ML models trained on brain MRI images for detecting these conditions, a Support Vector Machine (SVM) was used in [
13] in 2015 to identify early markers of Alzheimer’s progression. Their approach involved identifying and classifying critical brain regions—such as the hippocampus, entorhinal cortex, basal ganglia, and cerebellum—in patients with AD and mild cognitive impairment, achieving a final accuracy of 76% using k-fold cross-validation.
Also, Bidani et al. [
14] proposed a novel approach in 2019, using a Deep Convolutional Neural Network (DCNN) and transfer learning to detect dementia in the OASIS dataset (a longitudinal collection of MRIs). These images were preprocessed using a Bag-of-Features technique and classification methods to identify dementia at different stages. The DCNN model achieved a notable accuracy of 81.94% in recognizing the condition. Later, in [
15], a modified Convolutional Neural Network (CNN) with a capsule-based architecture was proposed to classify OASIS images into two groups, with and without dementia, achieving an accuracy of 92.39%. That study advanced the identification of important features in CNN-based models.
For ML models trained on clinical data, ref. [
16] in 2016 aimed to enhance automatic dementia assessment using physiological and environmental sensors. Data from wearable sensors—such as Electrodermal Activity (EDA), Photoplethysmogram (PPG), and accelerometers (ACCs)—was used to train a Random Forest (RF) model. Cognitive impairments were correlated with declining functional health in 17 older adults living in a retirement community in Baltimore, and the results were validated against clinical scoring. The study achieved 91.5% accuracy with k-fold cross-validation.
Similarly, in [
17], a feature selection model based on information gain was proposed to develop a targeted questionnaire designed to support neurologists and neuropsychologists in detecting mild cognitive impairment (MCI) and dementia. The final model, consisting of 12 questions, demonstrated high accuracy (area under the receiver operating characteristic curve, AUC, ranging from 0.94 to 0.97) in distinguishing between normal cognition, MCI, and dementia. In 2022, ref. [
18] used a K-Nearest Neighbors (KNN) model trained on spectral indices from arterial pulse waveform data to detect early cognitive impairment. Significant differences were found between AD patients and controls, achieving 70.32% accuracy via a 3-fold cross-validation. Additionally, a correlation (with a coefficient of determination
) was established between the model’s predicted disease probability and patients’ Mini-Mental State Examination (MMSE) scores.
Regarding ML models trained on audio or textual data from interviews and language assessments, ref. [
19] in 2017 proposed an automatic speech analysis system for early Alzheimer’s diagnosis. Using acoustic and linguistic features extracted from 72 recordings in which participants described a picture, they achieved 91.7% discrimination accuracy between Alzheimer’s patients and controls using a multilayer perceptron neural network as a binary classifier.
Furthermore, Ilias and Askounis [
20] addressed the lack of interpretability in transformer-based models for AD diagnosis in 2022. Several transformer models were applied to the ADReSS dataset, which includes 156 speech samples and corresponding transcripts from English-speaking participants, divided into two equal groups: with AD (N = 78) and without AD (N = 78). Bidirectional Encoder Representations from Transformers (BERT) [
21] achieved the highest accuracy, reaching 87.50%. The study also introduced methods to identify linguistic patterns in AD and non-AD patients, revealing significant differences through detailed language analyses and explainability techniques such as LIME.
There are also methodologies for early dementia detection using sentence embeddings generated by Siamese BERT networks. Santander-Cruz et al. [
22] trained various ML models (SVM, KNN, RF, and NN) using 17 demographic, lexical, syntactic, and semantic features extracted from 550 speech samples from elderly controls and AD patients in the DementiaBank PittCorpus database [
23]. The relevance of these features was assessed through mutual information scores, showing a strong association with MMSE scores. Results indicated superior performance (77% accuracy) compared to syntax-based and BERT-based approaches using linguistic features alone (74% accuracy). In particular, the SBERT+SVM and SBERT+NN combinations yielded the best results.
In this context, this study aimed to explore and compare the performance of different techniques for generating vector representations (embeddings) from audio transcriptions, focused on the early detection of dementia, specifically, AD. The primary objective was to identify the most effective technique among those evaluated, thereby advancing the development of robust and accurate models for early-stage dementia detection. Furthermore, this research aimed to contribute to the identification of practical and scalable solutions that can be seamlessly integrated into digital platforms, such as software systems or mobile health applications, to support real-world clinical and non-clinical deployment. In this way, this could ideally avoid the need for an in-person medical consultation for an initial assessment of the condition—something particularly useful in rural areas or settings where specialized medical care remains severely limited. Hence, the previous discussion raised the question of whether more complex, semantically rich embeddings—such as those derived from Transformer-based models (e.g., BERT; Gemma, a decoder model recently introduced by Google DeepMind [
24]; and the state-of-the-art Linq-Embed-Mistral model, optimized specifically for embedding tasks [
25])—indeed provide a significant advantage over simpler statistical approaches (like Tf–Idf) or non-contextual embeddings—such as Global Vectors for Word Representation (GloVe) [
26]—in this diagnostic context, considering both the predictive performance and practicality of the implementation.
2. Materials and Methods
2.1. Software and Hardware
This study was conducted using the Python programming language, version 3.11.11, via the Google Colab platform. A dedicated high-performance computing server was also used specifically for obtaining the Linq-Embed-Mistral embeddings. The code used to run the experiments is openly available at GitHub (
https://github.com/Placanbero/dementia-embeddings (accessed on 3 July 2025)). Key libraries included
torch,
transformers,
nltk, and
sklearn for downloading and manipulating the language model embeddings, as well as
re for data cleaning and preprocessing. Common Python libraries for numerical and graphical processing were also used, such as
numpy,
pandas,
matplotlib, and
seaborn.
2.2. Methodology
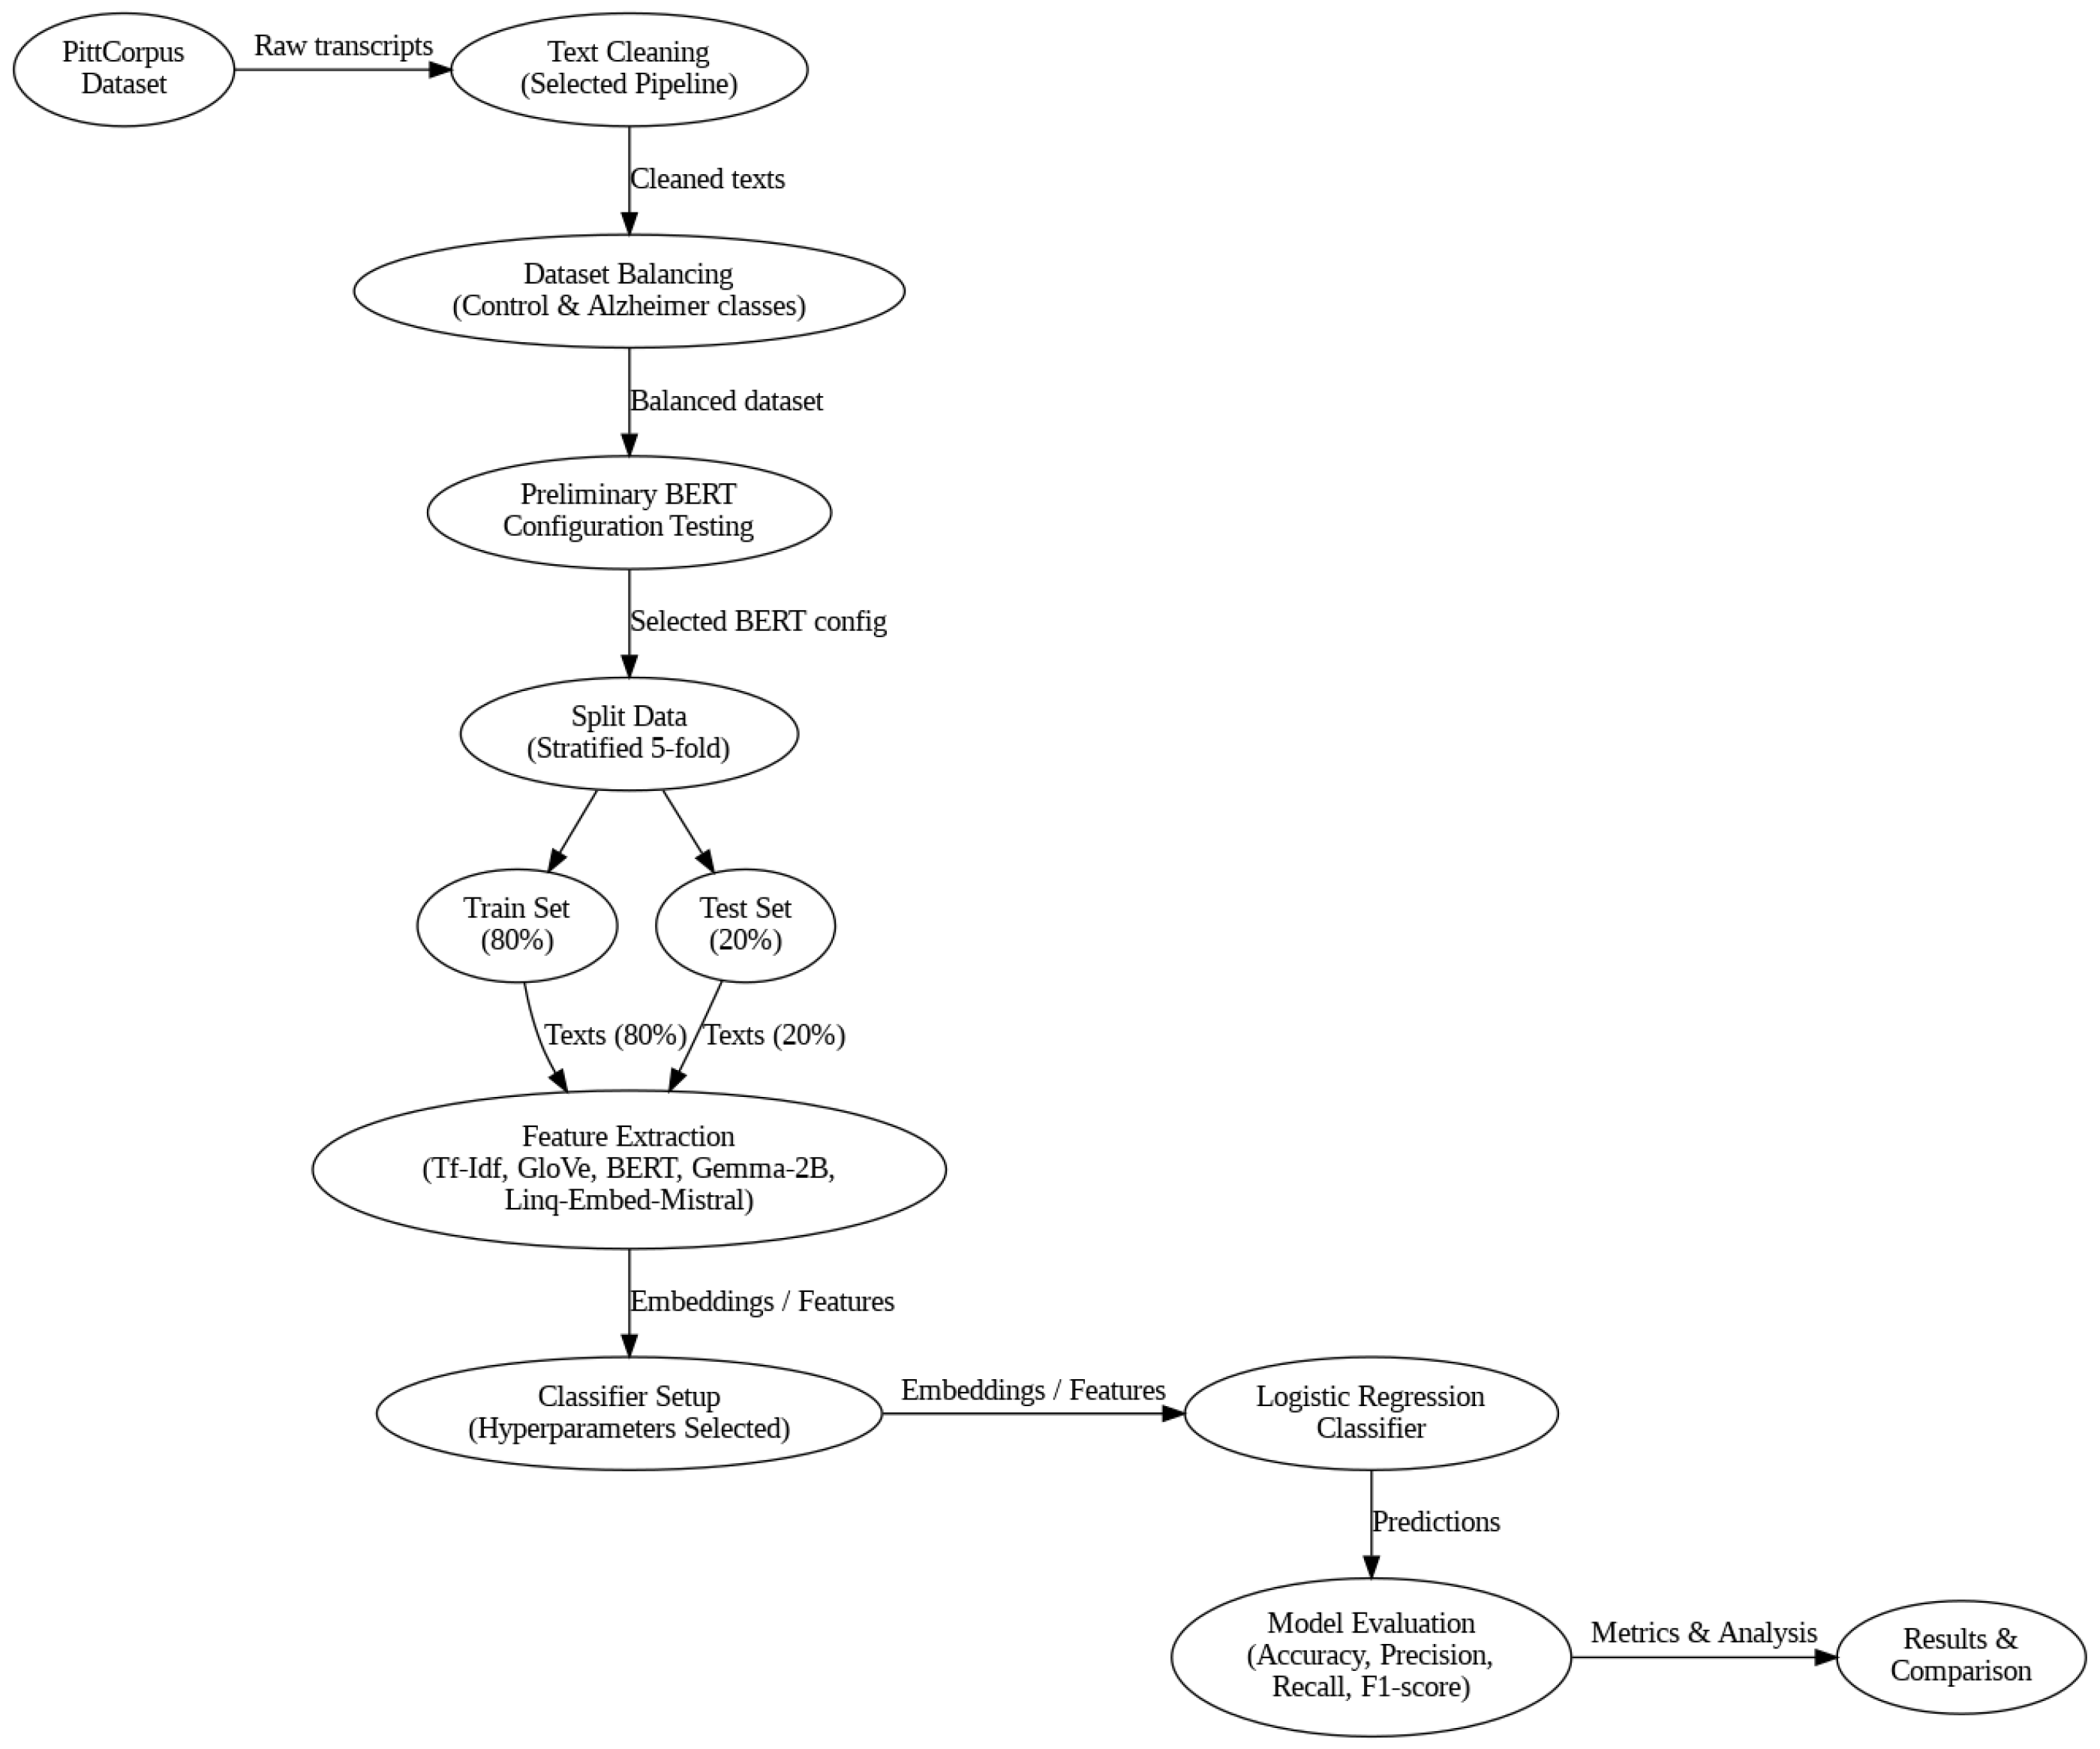
The methodology followed in this study consisted of the following series of steps, which are described in more detail below. A diagram of the detailed steps is also provided (
Figure 1).
Preprocessing of the audio transcriptions from the PittCorpus dementia database.
Generation of large language model (LLM) embeddings for the selected transcriptions and feeding these features into a logistic regression classifier to differentiate between positive and negative dementia indicators.
Comparison of the performance of these techniques in the detection of Alzheimer’s disease indicators with each other, and against the Tf–Idf approach.
Analysis of the obtained results and conclusions.
2.3. Dataset Preparation
This research was conducted utilizing the PittCorpus dementia database, an English-language database containing multiple language assessments conducted on a group of healthy controls and patients diagnosed with various types of dementia, compiled by researchers from the University of Pittsburgh [
27].
The corpus includes a compilation of oral language productions, manual transcriptions of these productions, demographic data, and cognitive test results (Mini-Mental State Examination), collected through a series of successive clinical visits involving healthy control participants (108 total), patients diagnosed with dementia (208), and patients with an undefined diagnosis (85) [
23].
For the purposes of this study, the focus was specifically on the transcriptions of the Cookie Theft Picture task from the Boston Diagnostic Aphasia Examination [
28]. During this task, participants are asked to describe everything they observe happening in a provided image, a detailed black-and-white drawing depicting two children stealing cookies from a jar, while their mother, standing at the sink, is distracted by overflowing water. The image contains prominent visual elements that a healthy individual typically does not overlook.
In total, the database includes 549 clinical visit records with their respective Cookie Theft task transcriptions, classified according to their diagnosis as follows: 243 transcriptions from healthy controls (“Control”), 234 from patients diagnosed with probable Alzheimer’s disease (“ProbableAD”), 42 from patients with mild cognitive impairment (“MCI”), 21 from patients with possible Alzheimer’s (“PossibleAD”), 5 from patients with vascular dementia (“Vascular”), and 3 from patients with memory problems (“Memory”), plus one entry from a patient with an undefined diagnosis (“Other”).
To focus specifically on detecting Alzheimer’s disease—the most common form of dementia—and to ensure class balance, the data were filtered accordingly. Records labeled as “ProbableAD” and “PossibleAD” were merged into a single “Alzheimer’s indicator” category, and those labeled as “Control” were used to represent healthy individuals. Hence, the final set of transcriptions consisted of two balanced classes: 255 Alzheimer’s patients (234 “ProbableAD” and 21 “PossibleAD”) and 243 healthy controls.
This dataset of transcriptions was then evaluated using a 5-fold cross-validation (
Table 1). In each fold, 80% of the data were used for training and the remaining 20% for testing. On average, each training set included 204 transcriptions from patients with signs of Alzheimer’s and 194 from control patients, while each test set included approximately 51 Alzheimer’s cases and 49 control cases. Note that the splits were not speaker-independent. This decision was intentional, as all embedding methods were evaluated on the same folds, ensuring fair comparison. Additionally, multiple transcripts from a given participant were recorded at different time points (sometimes under different diagnostic labels), thus introducing useful variability rather than redundancy.
Additionally, since the files containing the clinical visit transcripts were in the CHAT transcription format—which includes both metadata and the audio transcription by the researcher who conducted the interview, as well as annotation symbols added by the researchers to indicate features of the patient’s speech (such as pauses, self-corrections, pronunciation errors, etc.)—a comprehensive cleaning and preprocessing procedure was carried out before using these transcripts in the models. After cleaning, the entire transcripts were used, rather than just fragments of them.
First, both the metadata and the researcher’s speech were removed, so that only the patient’s transcription remained. From there, various preprocessing pipelines were explored with the aim of assessing the impact of different levels of removal and retention of linguistic elements present in the transcripts. In particular, different cleaning variants were evaluated, including the complete removal of special annotations (like grammatical errors), phonetic reformulations, self-corrections, and pauses, as well as an approach where these elements were replaced with explicit English linguistic descriptors (for example, replacing [//] with “self-correction” or [+ gram] with “grammatical error”).
After multiple tests, a cleaning function was selected that preserved potentially useful information in the transcripts for a natural language analysis related to dementia. Specifically, pause symbols (&-uh), reformulations and self-corrections ([/] and [//]), self-interruptions (< … >), and grammatical errors ([+ gram]) were preserved. This selection was empirically supported by tests that showed overall better performance in terms of metrics obtained from the different approaches used.
2.4. Generation of Embeddings and Logistic Classifier
To carry out the identification of patients with indicators of Alzheimer’s disease, vector representations of the transcripts (embeddings) were generated using different approaches: a classical statistical method based on word frequency (Tf–Idf), and more recent methods based on large language models. Specifically, both non-contextual embeddings (GloVe) and contextual embeddings derived from Transformer-based architectures were included. Among the latter, an encoder architecture (BERT), a decoder architecture (Gemma-2B), as well as a decoder architecture fine-tuned specifically for embedding tasks (Linq-Embed-Mistral) were used. These embeddings were subsequently used to feed a logistic regression classifier, aiming for a balance between the representational potential of the embeddings and the speed and efficiency of a logistic classification model. A point of interest is that the fine-tuning of the evaluated models was deliberately avoided for two main reasons: to ensure a controlled and reproducible evaluation without fine-tuning variability (e.g., model-specific hyperparameters) and to assess lightweight methods suitable for integration in resource-limited environments (avoiding the computational costs typically associated with model or domain adaptation).
To better illustrate the conceptual differences among the embedding approaches analyzed in this study,
Figure 2 presents a schematic comparison of the Tf–Idf method and the embedding methods based on GloVe, BERT, Gemma-2B, and Linq-Embed-Mistral.
2.4.1. Tf–Idf Approach
The first approach evaluated was Term Frequency–Inverse Document Frequency (Tf–Idf), which involves constructing a numerical matrix that quantifies the relative significance of each word within individual transcripts in relation to the entire corpus. This method assigns a weight to each term based on two components: its frequency within a specific transcript (Term Frequency, Tf) and the inverse of its frequency across all transcripts in the dataset (Inverse Document Frequency, Idf). Formally, the weight of a term
t in a document
d, given a corpus
D, is computed as follows:
where Tf(
) represents the frequency of the term
t in the document (transcript, in this context)
d,
N is the total number of documents in the corpus, and Df(
t) is the number of documents (transcripts) in which the term
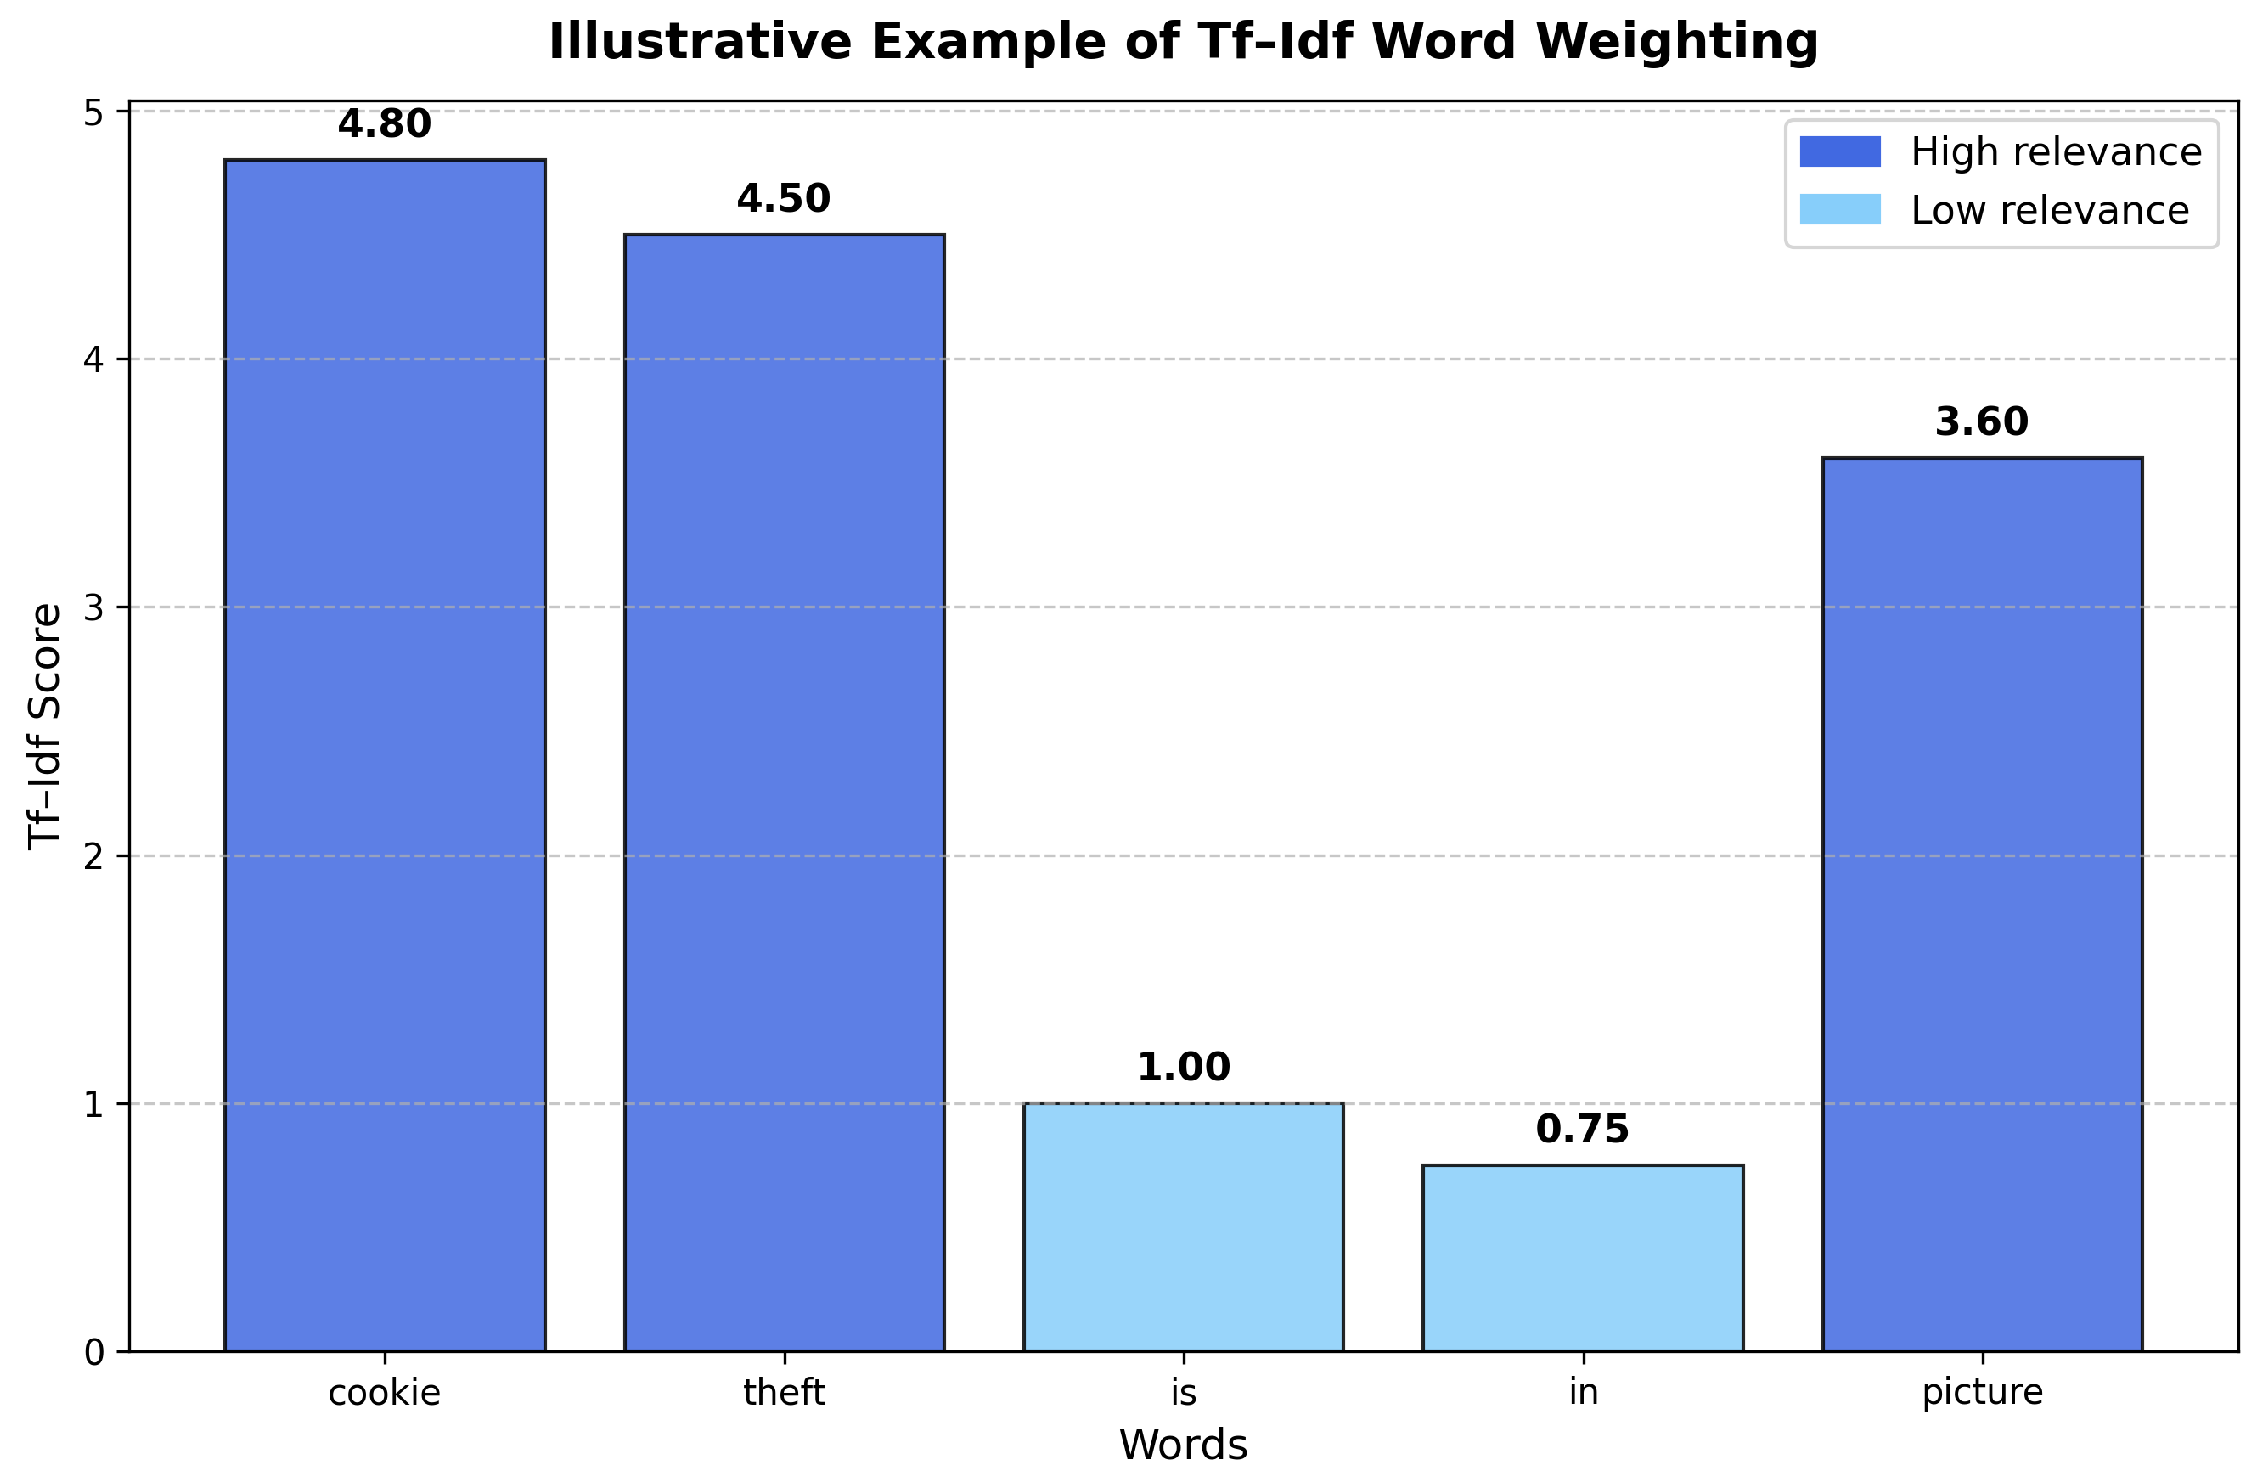
t appears. In this way, the approach seeks to penalize those terms that appear with high frequency across all documents (such as connectors or articles), as they are considered uninformative, and to give greater importance to terms that are characteristic of specific documents, that appear with less frequency. In order to facilitate a clearer understanding of how the Tf–Idf method assigns numerical weights to words based on their frequency across documents,
Figure 3 presents an illustrative graphic of the weighting mechanism applied to a simplified, synthetically generated yet contextually plausible document corpus. The plot highlights how Tf–Idf reduces the relative importance of frequently occurring terms across documents, while simultaneously emphasizing distinctive terms within individual documents.
This approach has been widely used as a base for information retrieval and text classification tasks, due to its simplicity and effectiveness in contexts where the presence or absence of key words can be decisive [
29,
30]. In this sense, the technique was used in this work to explore the impact of the use (or non-use) of specific words in the context of the Cookie Theft task, in order to determine whether a person showed signs of dementia, and to compare its performance with more advanced NLP techniques.
2.4.2. GloVe Embedding Approach
Regarding non-contextual embeddings, this study employed 300-dimensional pretrained vectors from the GloVe model (Global Vectors for Word Representation) [
31], specifically the version trained on the Wikipedia 2014 and Gigaword 5 corpora (6B tokens, 400K vocabulary, uncased). This approach allowed for the comparison of the representational capacity and performance of this non-contextual model versus contextual models for this specific task.
The GloVe model—trained on data from Wikipedia 2014, Gigaword 5 archive of newswire text data, and the Common Crawl web pages dataset—is based on a co-occurrence matrix constructed from a large text corpus, which captures how frequently pairs of words appear together within the same context [
26]. In this sense, GloVe is trained using the information contained in this matrix, optimizing a loss function over an implicit factorization of the co-occurrence matrix, which allows each word to be represented as a vector in a continuous semantic space [
26]. In this way, the model learns vector representations of words capable of ideally preserving “proportional” semantic relationships among them (although it is unable to distinguish different contexts for the same word). For instance,
king − man + woman ≈ queen corresponds to a typical example of the kind of semantic relationships that naturally emerge in the embedding space generated by GloVe; this relationship is illustrated in a schematic three-dimensional representation in
Figure 4. Nonetheless, GloVe is not capable of differentiating homographic words, such as
bank (as in a financial institution) and
bank (as in the side of a river), since it always assigns the same vector representation for a given word regardless of the context. For this project, transcripts were lowercased, tokenized, and stop words were removed prior to generating their embeddings using GloVe. The final embeddings for each transcript were obtained by averaging the individual word vectors contained in the transcript and normalizing the result.
2.4.3. BERT Embedding Approach
In the case of BERT contextual embeddings, implementations of the bert-base-uncased and bert-large-uncased models available in the transformers library were used. Each transcript was tokenized using the corresponding tokenizer, limiting the sequence length to the model’s maximum input size to handle long texts appropriately (512 tokens or subwords). Contextual embeddings were then obtained for each token from the hidden states of the model’s final layer. Finally, embeddings for each transcript were generated by taking the arithmetic mean of the individual token embeddings, although tests were also conducted using the special CLS token as the vector representation of the entire transcript, as well as a third configuration based on concatenating the last four hidden layers’ states for each token, and then taking again the arithmetic mean of the individual token embeddings, as is discussed later.
The BERT model (Bidirectional Encoder Representations from Transformers) was introduced in 2019 [
21] as a model based on the Transformer encoder architecture. It was trained on two large corpora, the English Wikipedia and the BookCorpus dataset, using two main tasks: masked word prediction within a sentence (Masked Language Modeling, which consists in training the model to predict a missing word within a given sequence rather than simply predicting the next word of the sequence) and the prediction of coherence between pairs of adjacent sentences (Next Sentence Prediction) [
21]. Due to this particular training process, unlike previously developed unidirectional models, BERT is characterized by its bidirectional training, which enables it to incorporate information from both the preceding and following context of each word.
As for its architecture, BERT consists exclusively of Transformer encoder blocks, which allows it to build hierarchical representations of meaning across multiple layers [
21]. In this study, two variants of the model were used:
bert-base-uncased, with 12 layers and 110 million parameters (which generates 768-dimensional embeddings), and
bert-large-uncased, with 24 layers and 340 million parameters (which generates 1024-dimensional embeddings) [
21]. Both variants generate, for each token, a contextualized numerical representation (embedding) that directly depends on the words to its right and left. Additionally, BERT introduces a special
CLS token at the beginning of each sequence, whose associated vector in the model’s final layer is designed to capture an overall representation of the sequence’s content; for this reason, it is commonly used as the standard method for generating numerical representations of sentences in classification tasks [
32]. Accordingly, in this study, three approaches were compared to generate BERT sentence embeddings: the exclusive use of the
CLS token embedding, the arithmetic mean of all token embeddings in the transcript, and the concatenation of the last four hidden layers’ embeddings (this last one was proposed in the original BERT paper [
21]).
2.4.4. Gemma Embedding Approach
For the contextual embeddings based on Google DeepMind’s Gemma model, the gemma-2b model available through the transformers library was used. The embedding generation process followed a procedure analogous to that used for BERT, averaging the representations from the model’s final hidden layer and adjusting the maximum tokenization length according to the limits specified for this particular model.
The Gemma model represents a state-of-the-art family of open-source language models introduced in 2024, built upon Transformer decoder architectures [
24]. These models were developed to perform a wide range of natural language understanding and generation tasks. In this study, the Gemma-2B variant was employed, which comprises approximately 2 billion parameters. This model was trained using an autoregressive objective, where the task was to predict the next token in a sequence based solely on preceding context. It supports a context window of up to 8192 tokens and utilizes an embedding dimension of 2048 [
24]. Unlike models such as BERT—which rely exclusively on encoder blocks and are optimized through a masked language modeling objective that integrates both preceding and succeeding token information—Gemma adopts a causal language modeling strategy. This approach is probabilistically grounded in prior context and aligns with the training paradigm used in models such as GPT.
However, the choice of an autoregressive (and thus unidirectional) architecture implies that the representations obtained for each token depend only on its preceding context in the sequence. This may affect its ability to capture bidirectional semantic relationships (unlike BERT), although this approach can offer advantages in tasks where generative fluency and forward semantic continuity are relevant (e.g., in text generation). This is the reason why the performance of Gemma was compared with that of BERT and GloVe (in addition to the classical Tf–Idf approach and the recent Linq-Embed-Mistral model) in this study: on one hand, to contrast the performance of contextual embeddings (BERT and Gemma) versus non-contextual ones (GloVe) in the task of detecting indicators of Alzheimer’s disease based on audio transcription from image description tests, and on the other hand, to conduct a comparative analysis between two types of Transformer architectures in this task, a Transformer encoder model with bidirectional context (BERT) versus a state-of-the-art GPT-type model (which has proven to be multifunctional in NLP tasks [
24]) such as Gemma, based on a Transformer decoder architecture with a unidirectional autoregressive context, with the ultimate goal of evaluating why one approach performs better (or worse) than the other for this specific task.
2.4.5. Linq-Embed-Mistral Embedding Approach
In addition to the previous models, this study also evaluated embeddings derived from the recently released, open-access model Linq-Embed-Mistral, available through the
transformers library under the name
Linq-AI-Research/Linq-Embed-Mistral [
33]. This model was selected for inclusion due to its state-of-the-art performance in the Massive Text Embedding Benchmark (MTEB) [
34], where it ranked as the top-performing open-access model and second overall across a wide range of embedding tasks (as of 14 May 2025), as can be seen in
Table 2.
The MTEB benchmark offers an integral assessment suite for sentence-embedding models, encompassing over 100 tasks across nine categories, including retrieval, classification, clustering, pair classification and semantic similarity (STS) [
35]. It has become a widely used standard for assessing the generalization ability of sentence-embedding models across a diverse set of applications [
34]. The high placement of Linq-Embed-Mistral in this benchmark provides strong motivation to test its applicability to clinical language classification tasks, such as the detection of dementia indicators from audio transcriptions.
Technically, Linq-Embed-Mistral is based on a Transformer decoder architecture derived from Mistral-7B [
36], a decoder model designed to efficiently handle long-context inputs with high semantic precision. The model was optimized for text retrieval using advanced data refinement methods [
33] and fine-tuned specifically for generating high-quality sentence-level embeddings; it employs a training methodology that includes contrastive learning with hard negative mining, as well as an extensive data filtering process, which enables it to generate sentence embeddings that are semantically rich but also robust across diverse embedding tasks [
25]. This fine-tuning approach allows the model to outperform previous LLM-based embedding models in multiple practical uses.
Due to the model’s high computational requirements for inference, embeddings were not generated on standard platforms such as Google Colab. Instead, a dedicated high-performance computing server equipped with four NVIDIA RTX 3060 GPUs (NVIDIA Corporation, Santa Clara, CA, USA; 24 GB each) was used, located at the Centro de Investigaciones en Óptica (CIO) in Leon, Mexico. This computational setup enabled the efficient and complete processing of all transcriptions using the Linq-Embed-Mistral model. Transcript embeddings were obtained by pooling the token-level representations from the model’s final layer and normalizing, as recommended in its official documentation [
33], and finally used as input features for the logistic regression classifier.
2.4.6. Logistic Classifier
Once the vector representations corresponding to each approach were generated (embeddings for the language models and feature vectors for the Tf–Idf technique), they were used to train a classification model based on logistic regression. The logistic regression classifier was utilized as a consistent comparative tool across embeddings, rather than as an optimized predictive model. In this sense, it was implemented using the sklearn library with the default recommended hyperparameters, except for the following, which were explicitly set in order to appropriately handle multiple features (derived from the high-dimensional embeddings), class imbalance (although this aspect was addressed during data preprocessing in this study), and ensure model convergence during training: solver=’lbfgs’, class_weight=’balanced’, max_iter=1000.
Logistic regression is a widely used linear model for binary classification tasks [
37]. In this study, the goal is to distinguish between two possible classes: patients with indicators of Alzheimer’s disease (“ProbableAD” or “PossibleAD”, coded as 1) and healthy patients (“Control”, coded as 0). For this purpose, the sigmoid function was used to estimate the probability
that a given transcript
, represented by its feature vectors or embeddings, belonged to the positive class (indicator of Alzheimer’s), as follows:
where
is the feature vector (embeddings or Tf–Idf vector),
is the weight vector or coefficients learned by the model, and
b is the bias term of the logistic model. In order to provide an intuitive understanding of how logistic regression models perform binary classification,
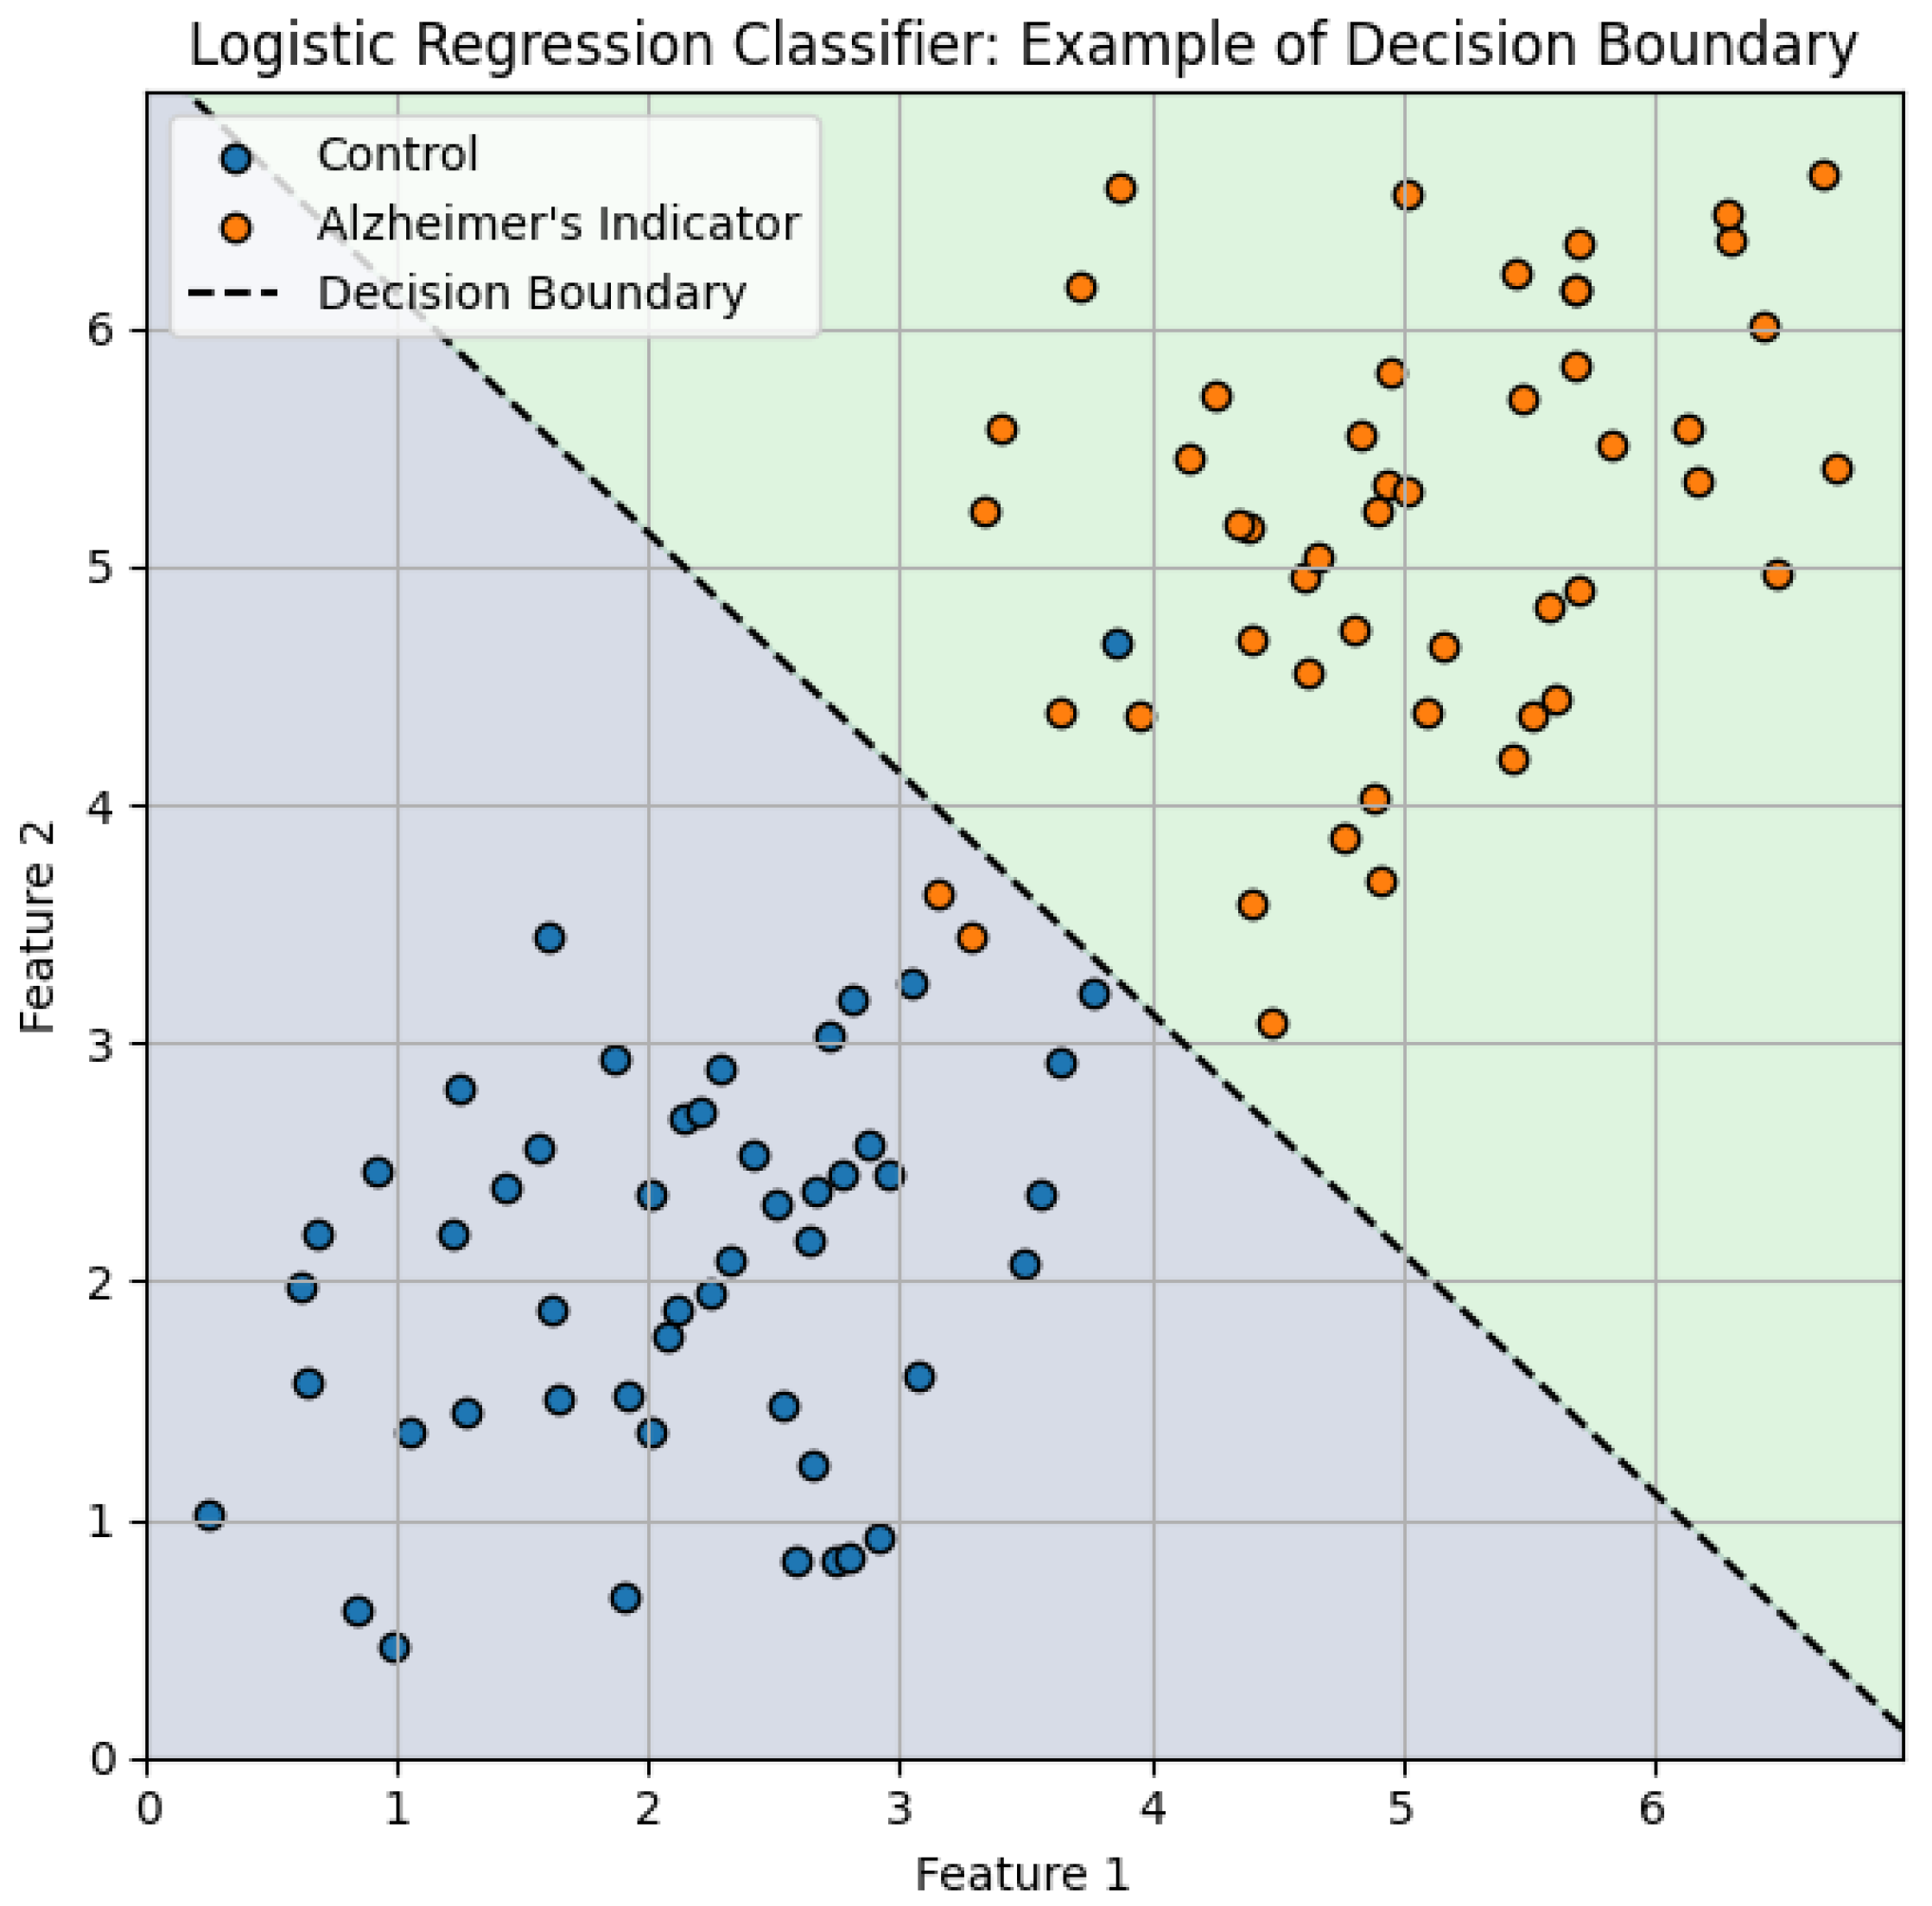
Figure 5 conceptually illustrates the decision boundary learned by the classifier in a simplified two-dimensional embedding space. Although in practice the embedding spaces generated in this study are high-dimensional, this graphic serves as a useful visualization that effectively reproduces how the logistic regression classifier separates the Alzheimer’s indicator cases from Control cases.
2.4.7. Performance Comparison of the Different Approaches
To appropriately compare the performance of the five approaches considered for generating the vectorial representations of the transcripts, a stratified 5-fold cross-validation was conducted. In this context, stratified means that each fold maintained a balanced distribution of Alzheimer’s indicator and Control cases; this reduced sampling bias, thereby reducing the bias on the results. The data splits generated for each fold were kept constant across all comparisons, in order to ensure a fair and replicable evaluation among the different methods.
Each method was evaluated using a standard set of performance metrics, including accuracy, precision, recall, and F1-score, along with an analysis of confusion matrices for each individual fold. These metrics were averaged and reported with their corresponding standard deviation to provide a reliable overview of the overall performance and robustness of each technique.
4. Discussion
These results indicate that, although bidirectional contextual embeddings from LLMs such as BERT offer a slight predictive advantage, the difference compared to the traditional Tf–Idf method does not appear to be significant for this particular task. This finding strongly suggests that, within the specific context of Alzheimer’s disease detection through the analysis of transcripts from the Cookie Theft picture description task, factors such as word frequency and the specific choice of words may be as or more decisive for detecting indicators of dementia than the semantic or contextual information captured by more complex embedding models.
Regarding the potential causes of this phenomenon, the following hypothesis can be advanced. As noted earlier, the Cookie Theft picture description task is part of the Boston Diagnostic Aphasia Examination [
39] and was originally included to reveal word-finding difficulties—an impairment that is typical of aphasia but also of dementia [
28]. It is therefore reasonable to expect this task to remark lexical-retrieval problems and the relative frequency with which certain words are used in a patient’s discourse—exactly the information that Tf–Idf quantifies. This provides a plausible explanation for the unexpectedly strong performance of this classical technique in the present study: Tf–Idf focuses on word frequency and relevance, and it is applied here to a test explicitly designed to expose word-finding issues, allowing it to rival bidirectional contextual or semantically enriched embeddings.
In line with the above, the performance obtained by the Linq-Embed-Mistral model—comparable to both BERT and Tf–Idf—offers further evidence supporting this conclusion. Although Linq-Embed-Mistral is ranked as one of the top-performing sentence-embedding models in the Massive Text Embedding Benchmark (MTEB), its evaluation metrics in the present study were not significantly higher than those of Tf–Idf. This suggests that, while models like Linq-Embed-Mistral offer strong generalization capabilities across a wide range of embedding tasks, their additional semantic richness may not necessarily translate into major advantages in specialized clinical classification settings. From a practical point of view, this finding emphasizes the value of simpler and computationally lightweight models, such as Tf–Idf, in real-world diagnostic applications.
The comparatively lower performance of the Gemma-2B model relative to BERT suggests that BERT’s bidirectional architecture may have conferred a distinct advantage, likely attributable to its pretraining objectives. Notably, one of BERT’s key training tasks—Next Sentence Prediction—involves learning to assess the coherence between pairs of adjacent sentences, as previously discussed. This objective may have enhanced BERT’s capacity to detect linguistic indicators associated with dementia, such as short-term memory deficits, reduced lexical richness, and attentional disturbances. These impairments often manifest in disrupted sentence coherence, a feature that BERT is inherently better equipped to evaluate due to its bidirectional contextual encoding.
A further insight is that the three models, BERT-large, Gemma-2B, and Linq-Embed-Mistral, despite their higher embedding dimensionality—1024, 2048, and 4096 features, respectively—did not demonstrate a superior embedding performance in this particular task compared to that shown by the BERT-base model, which generates 768-dimensional embeddings. In fact, the three higher-dimensional models obtained overall inferior results in the evaluation metrics than BERT-base (see
Table 3 and
Table 4), contrary to the common belief that the higher the number of dimensions of the vector, the greater its representational capacity and, therefore, the better the model’s performance. As seen, this is not always the case. To illustrate, consider a sphere
S in
: fitting it with a six-dimensional model leaves three redundant coordinates, introducing a small approximation error, whereas a three-dimensional model avoids those redundant dimensions and offers a closer fit. Thus, perhaps one of the reasons why the BERT-base model performs better for this particular task is that it provides a more appropriate embedding dimensionality for representing these transcripts, compared to BERT-large, Gemma-2B, and Linq-Embed-Mistral. In other words, since these audio transcripts are all from the same picture description, spoken by subjects diagnosed with dementia or of advanced age, it is possible that they do not require the higher-dimensional embeddings provided by some large models. Further research is needed to test this hypothesis.
Likewise, the fact that the approach using embeddings generated by GloVe yielded the lowest relative performance seems to indicate that in this particular task, the context in which words are spoken by the patient carries significant weight in generating an adequate vector representation—both of the individual words and of the transcript as a whole. For example, it can be inferred that the word “steal”, most likely mentioned in some form by the patient while describing the Cookie Theft picture, generally has a strongly negative connotation, which in the specific context of the image of the Cookie Theft is not necessarily the case. This is information that GloVe fails to capture. This lack of contextual awareness therefore gives it a somewhat distorted (noisy) view of the transcript, which presumably affects the ability of the logistic classifier—using these embeddings as features—to make accurate predictions.
Taken together, these results open up possibilities for future work aimed at deepening the understanding of specific linguistic features that effectively differentiate healthy patients from those with possible indicators of Alzheimer’s disease. They also broaden the landscape of useful techniques for analyzing language-based assessments—techniques that are not only accurate (rivaling state-of-the-art methods) but also easy to compute and relatively low in computational cost—as demonstrated by Tf–Idf in this study. These characteristics possibly make Tf–Idf—and similar statistical approaches—a promising candidate for integration into software or mobile applications aimed at the early detection of dementia indicators.
5. Conclusions
The results of this study represent a preliminary step toward the hypothesis that the Tf–Idf approach is, in general, comparable in performance—and in some cases superior—to the performance of LLM embeddings when used as features for a logistic classifier in the task of detecting Alzheimer’s disease from audio transcriptions of English-speaking patients. From this, a particularly interesting conclusion can be drawn: the findings suggest that, at least in certain contexts, word choice and frequency may be just as important—if not more so—than semantic or contextual information for identifying types of dementia, especially in the case of Alzheimer’s detection. This is a somewhat surprising result, as Alzheimer’s disease is known to degrade not only vocabulary but also the overall structure and coherence of speech.
This outcome is both unexpected and encouraging, as the Tf–Idf technique is generally far less computationally expensive and quicker to apply compared to the demands of training—or even just downloading and using—large-scale language models, especially the latest state-of-the-art ones, such as Linq-Embed-Mistral and Gemma. This could lead to the easier integration of this approach into a future mobile application, device, or software system aimed at providing an initial indicator of Alzheimer’s disease, potentially without requiring attending a first in-person clinical visit, particularly valuable in contexts where medical care is still absent or practically absent.
Further to this, the present study demonstrates that, in general, the techniques explored here are effective methods for detecting Alzheimer’s disease (achieving around 80% and 85% accuracy) in transcriptions of the Cookie Theft task audio from English-speaking patients. The simplicity of this language task makes these methods particularly attractive as a non-invasive, efficient, and rapid screening tool—especially the Tf–Idf approach—for identifying early indicators of dementia. In principle, only a transcription of the patient’s audio is needed.
Future research could explore other embedding generation approaches, as well as other ML techniques for the final classifier implemented, such as an NN or an SVM approach. Fine-tuning the last layers of LLMs, such as BERT or Linq-Embed-Mistral, also emerges as a promising path to follow. In the same line, transfer-learning techniques aimed at learning more efficient and specific representations from the transcripts of this task seem valuable for future study. Dataset expansion to improve both training and evaluation phases also remains desirable—possibly through collaboration with medical institutions or specialists to acquire additional data (including research in other languages) and establish clinical partnerships for developing user-friendly and accessible initial diagnostic systems.
Additionally, future work could explore recent advances such as synthetic transcript generation to mitigate sample scarcity [
40]. Furthermore, although the dataset in this study was balanced by design, generative data augmentation methods (e.g., Conditional Tabular Generative Adversarial Networks, CTGAN), which have shown promise for improving classification performance in rare neurological conditions [
41], may still be valuable for enhancing model robustness or simulating underrepresented clinical presentations, including Alzheimer’s disease and other types of dementia. In addition, future applications could integrate model-agnostic explainability techniques such as SHapley Additive exPlanations (SHAP) [
42,
43] or Local Interpretable Model-agnostic Explanations (LIME) [
43,
44] to enhance clinical trust and interpretability of NLP-based predictions. To support clinical translation, future experiments should adopt speaker-independent cross-validation to safeguard against subject leakage. Moreover, incorporating additional data modalities, such as clinical records or cognitive-function examinations (e.g., the Mini-Mental State Examination, MMSE, or the Montreal Cognitive Assessment, MoCA), could potentially enhance both the accuracy and robustness of the models. Similarly, multimodal approaches involving acoustic or prosodic features may emerge as a potential strategy to further enhance model robustness.


 ,
, 


