Article

Preliminary Experimental Comparison of Plunge Milling and Face Milling: Influences of Cutting Parameters on Cutting Force and Surface Roughness

Institute of Manufacturing Science, University of Miskolc, H-3515 Miskolc, Hungary
*
Author to whom correspondence should be addressed.
Eng 2025, 6(6), 128; https://doi.org/10.3390/eng6060128
Submission received: 14 May 2025 / Revised: 11 June 2025 / Accepted: 12 June 2025 / Published: 15 June 2025

Abstract

:
The increasing demand for precision-engineered machined components across diverse sectors highlights the importance of optimizing machining procedures. The improvement of milling strategies is significant in the production of flat surfaces and slots of different sizes. The choice between milling techniques can significantly impact the final product quality and production efficiency. This study provides a detailed examination of the relative effectiveness of plunge milling (axial feed) versus face milling (radial feed) techniques, concentrating on critical performance metrics such as cutting force and surface roughness. In our systematic approach, we varied key milling parameters (feed per tooth, depth of cut, and cutting speed). We conducted a series of experiments to quantify the resulting cutting forces and surface finish quality employed under different conditions. The analysis reveals notable performance differences between the two milling methods at various parameter settings. Through statistical and graphical analysis, we clarify the relationships between milling parameters and the resultant outputs, offering a deeper understanding of the factors influencing machining efficiency. The results reveal significant differences between plunge milling and face milling, with plunge milling exhibiting lower cutting forces, while face milling demonstrated superior surface quality. The insights granted from this research have implications for optimizing milling operations.

1. Introduction

In manufacturing technology, the efficiency and precision of machining processes are vital for enhancing productivity and reducing operational costs [1]. This has led to the ongoing exploration of various milling techniques and their influencing factors [2], particularly in roughing operations [3]. Consequently, there is a growing interest in improving milling strategies to meet the changing demands of modern manufacturing [4]. This emphasis on improvement has resulted in advancements in milling operations, making them increasingly effective [5]. Among the many milling techniques used in contemporary machining, plunge milling and face milling are two primary methods [6]. They serve distinct purposes and applications across various industries, including motors, pumps, automotive, and aerospace [7,8]. Each method has unique advantages and limitations [9], highlighting the need for a detailed understanding of their performance characteristics under different cutting conditions [10,11], making it challenging for manufacturers, who strive for better performance while minimizing waste and downtime, to determine the optimal method for specific applications.
Plunge milling, a high-efficiency, deep shoulder process, maintains a constant axial depth of cut during vertical tool descent, inherently reducing radial forces. This principle is explored via toolpath strategies for cutter life [12], optimal parameter identification [13,14], chatter stability investigations [15], automation for sculptured surfaces [16], and multitool approaches for complex parts [16,17]. Consequently, it has emerged as a promising alternative to conventional milling, evidenced by comparative studies on impeller roughing by Dong and Chen [7], general strategy comparisons by Varga et al. [18], and parameter identification by Al-Ahmad et al. [13].
Its advantages are pronounced in specific applications: machining deep cavities with limited access, as optimized by Fnides et al. [19] for vibration minimization; working with hard-to-cut materials, discussed by Cui [20]. Utility with specialized tooling, like ceramic end mills studied by Zhang et al. [21], and enhanced productivity, per Silva et al. [22], further underscore its benefits. However, plunge milling faces challenges, notably increased tool wear due to higher axial forces and heat. This wear aspect was investigated by Cheng et al. [2] for grooving; Niu et al. [23] analyzed tool deformation; Ventura and Hassui [24] explored its unique cutting forces; and Chen et al. [25] examined carbide tool life on GH4169, highlighting thermomechanical stresses.
Conversely, face milling, a conventional technique, involves horizontal cutting movements. Its engagement kinematics and vibrations were explored by Jin et al. [26] for involute gears, and Tapoglou and Antoniadis [27] provided 3D kinematic simulations; Usubamatov et al. [28] optimized its productivity. Face milling is often preferred for shallow cavities, offering high material removal rates (MRRs) and excellent surface finishes. Arizmendi and Jiménez [29] modeled its surface topography; Lin et al. [30] simulated high-speed cutter surface morphology; Wang et al. [31] developed 3D topography models; and Borysenko et al. [32] investigated residual stresses in high-feed face milling.
However, face milling typically generates higher radial forces than axially fed methods, potentially increasing tool wear and workpiece damage. These aspects were examined via cutting force modeling by Kulenovic et al. [33,34] and force models for complex geometries by Tang and Zhang [35]. Its extensive study is well documented: Liu et al. [36] performed FEM modal analysis of cutters; Usubamatov et al. [28] optimized operations; Carvalho et al. [37] analyzed vibration/energy efficiency in interrupted milling; and Roshan et al. [38] and Tibakh et al. [39] addressed sustainable machining and multiresponse optimization, respectively.
Divergent perspectives exist on the relative efficacy of plunge and face milling. Proponents highlight plunge milling’s efficiency in high load conditions due to axial engagement, supported by Al-Ahmad et al. [13] through parameter optimization, Płodzień et al. [9] in high-performance milling contexts, and Huang et al. [40] via tool orientation planning. Ren et al. [41] reported that plunge milling can reduce cutting forces by up to 60% and more than double rough machining efficiency over conventional methods. Silva et al. [22] also documented a plunge strategy yielding an approximate 3.3-fold efficiency increase compared to layer milling. Conversely, substantial research supports face milling’s superiority for surface quality and dimensional accuracy. El Mehtedi et al. [42] (3D-printed composites), Raza et al. [43] (general surface roughness), and Simunovic et al. [44] (modeling/simulation) provide measurable evidence, often reporting significant Ra reductions, high R2 values in predictive models, and better burr/dimensional control. Nuancing this, Reznicek and Horava [45] and Silva et al. [22] advocate for plunge milling’s effectiveness in deep cuts without compromising surface finish. Others posit face milling’s versatility for general tasks due to superior chip evacuation, an advantage discussed by Abbas et al. [46] for maraging steel, Malea et al. [47] for hard steels, and contextualized by Viswanathan et al. [48] regarding efficient process characteristics.
The debate on plunge versus face milling superiority involves diverging hypotheses. Regarding surface finish, some argue plunge milling’s inherent step-over marks yield inferior results, a view supported by Bey et al. [16] (sculptured surfaces), Al-Ahmad et al. [13] (parameter comparison), and implicitly by Soori et al. [49] (scallop height control). Al-Ahmad et al. [13] found plunge milling scallop heights up to 40% greater. Conversely, others suggest that optimized plunge milling can achieve comparable or superior finishes, with Wang [50] exploring NC parameter optimization, Bey and Tchantchane [17] optimum tool combinations, Cafieri et al. [51] time optimization, and Liang et al. [52] tool orientation for open blisks. The discussion extends to material removal rates (MRRs) and process reliability. Some assert plunge milling’s superior MRR, with Wakaoka et al. [11] demonstrating its high speed potential. Others highlight face milling’s established reliability, contextualized by Reznicek and Horava [45] (strategy choice), Cheng et al. [53] (plunge blisk optimization), Dong and Chen [7] (impeller roughing comparison), and Pala et al. [54] (HSM/HEM of Ti6Al4V). Dinh et al. [55] found that optimized plunge milling can improve MRR by 30–40%, yet also stressed face milling’s superior stability and reliability for precision critical applications. These contrasting findings underscore an ongoing debate on optimal strategy selection based on specific requirements.
Considering the divergent perspectives and identified knowledge gaps in the comparative efficacy of plunge and face milling—particularly concerning the nuanced interplay of cutting parameters with resultant cutting forces and surface roughness under directly comparable conditions—this study was undertaken. The primary objective was to experimentally investigate and directly compare the performance of plunge milling (axial feed) versus face milling (radial feed) by systematically varying key machining parameters: cutting speed v c , feed per tooth f z , and depth of cut a p . For each distinct milling strategy, these parameters were methodically altered, and their consequential effects on critical performance metrics, namely cutting forces (Fx, Fy, and Fz) and arithmetically mean surface roughness ( R a ), were quantified and evaluated using rigorous data acquisition and statistical analysis techniques.
This research specifically sought to elucidate the inherent trade offs between these two predominant milling approaches. By meticulously identifying how different parametric configurations influence these crucial performance outputs for both plunge and face milling, the study aimed to provide a clearer understanding of their respective strengths and limitations. In doing so, this investigation contributes critical empirical data to the ongoing discourse in machining technology, as previously outlined. Furthermore, by highlighting the specific parameter sensitivities and interaction effects unique to each strategy, this work offers valuable, actionable insights for the optimization of milling operations. Ultimately, this research endeavors to facilitate more informed, evidence-based decision making in selecting and tailoring manufacturing practices to meet specific application requirements, material characteristics, and operational constraints, thereby addressing the call for more direct comparative studies in this domain.

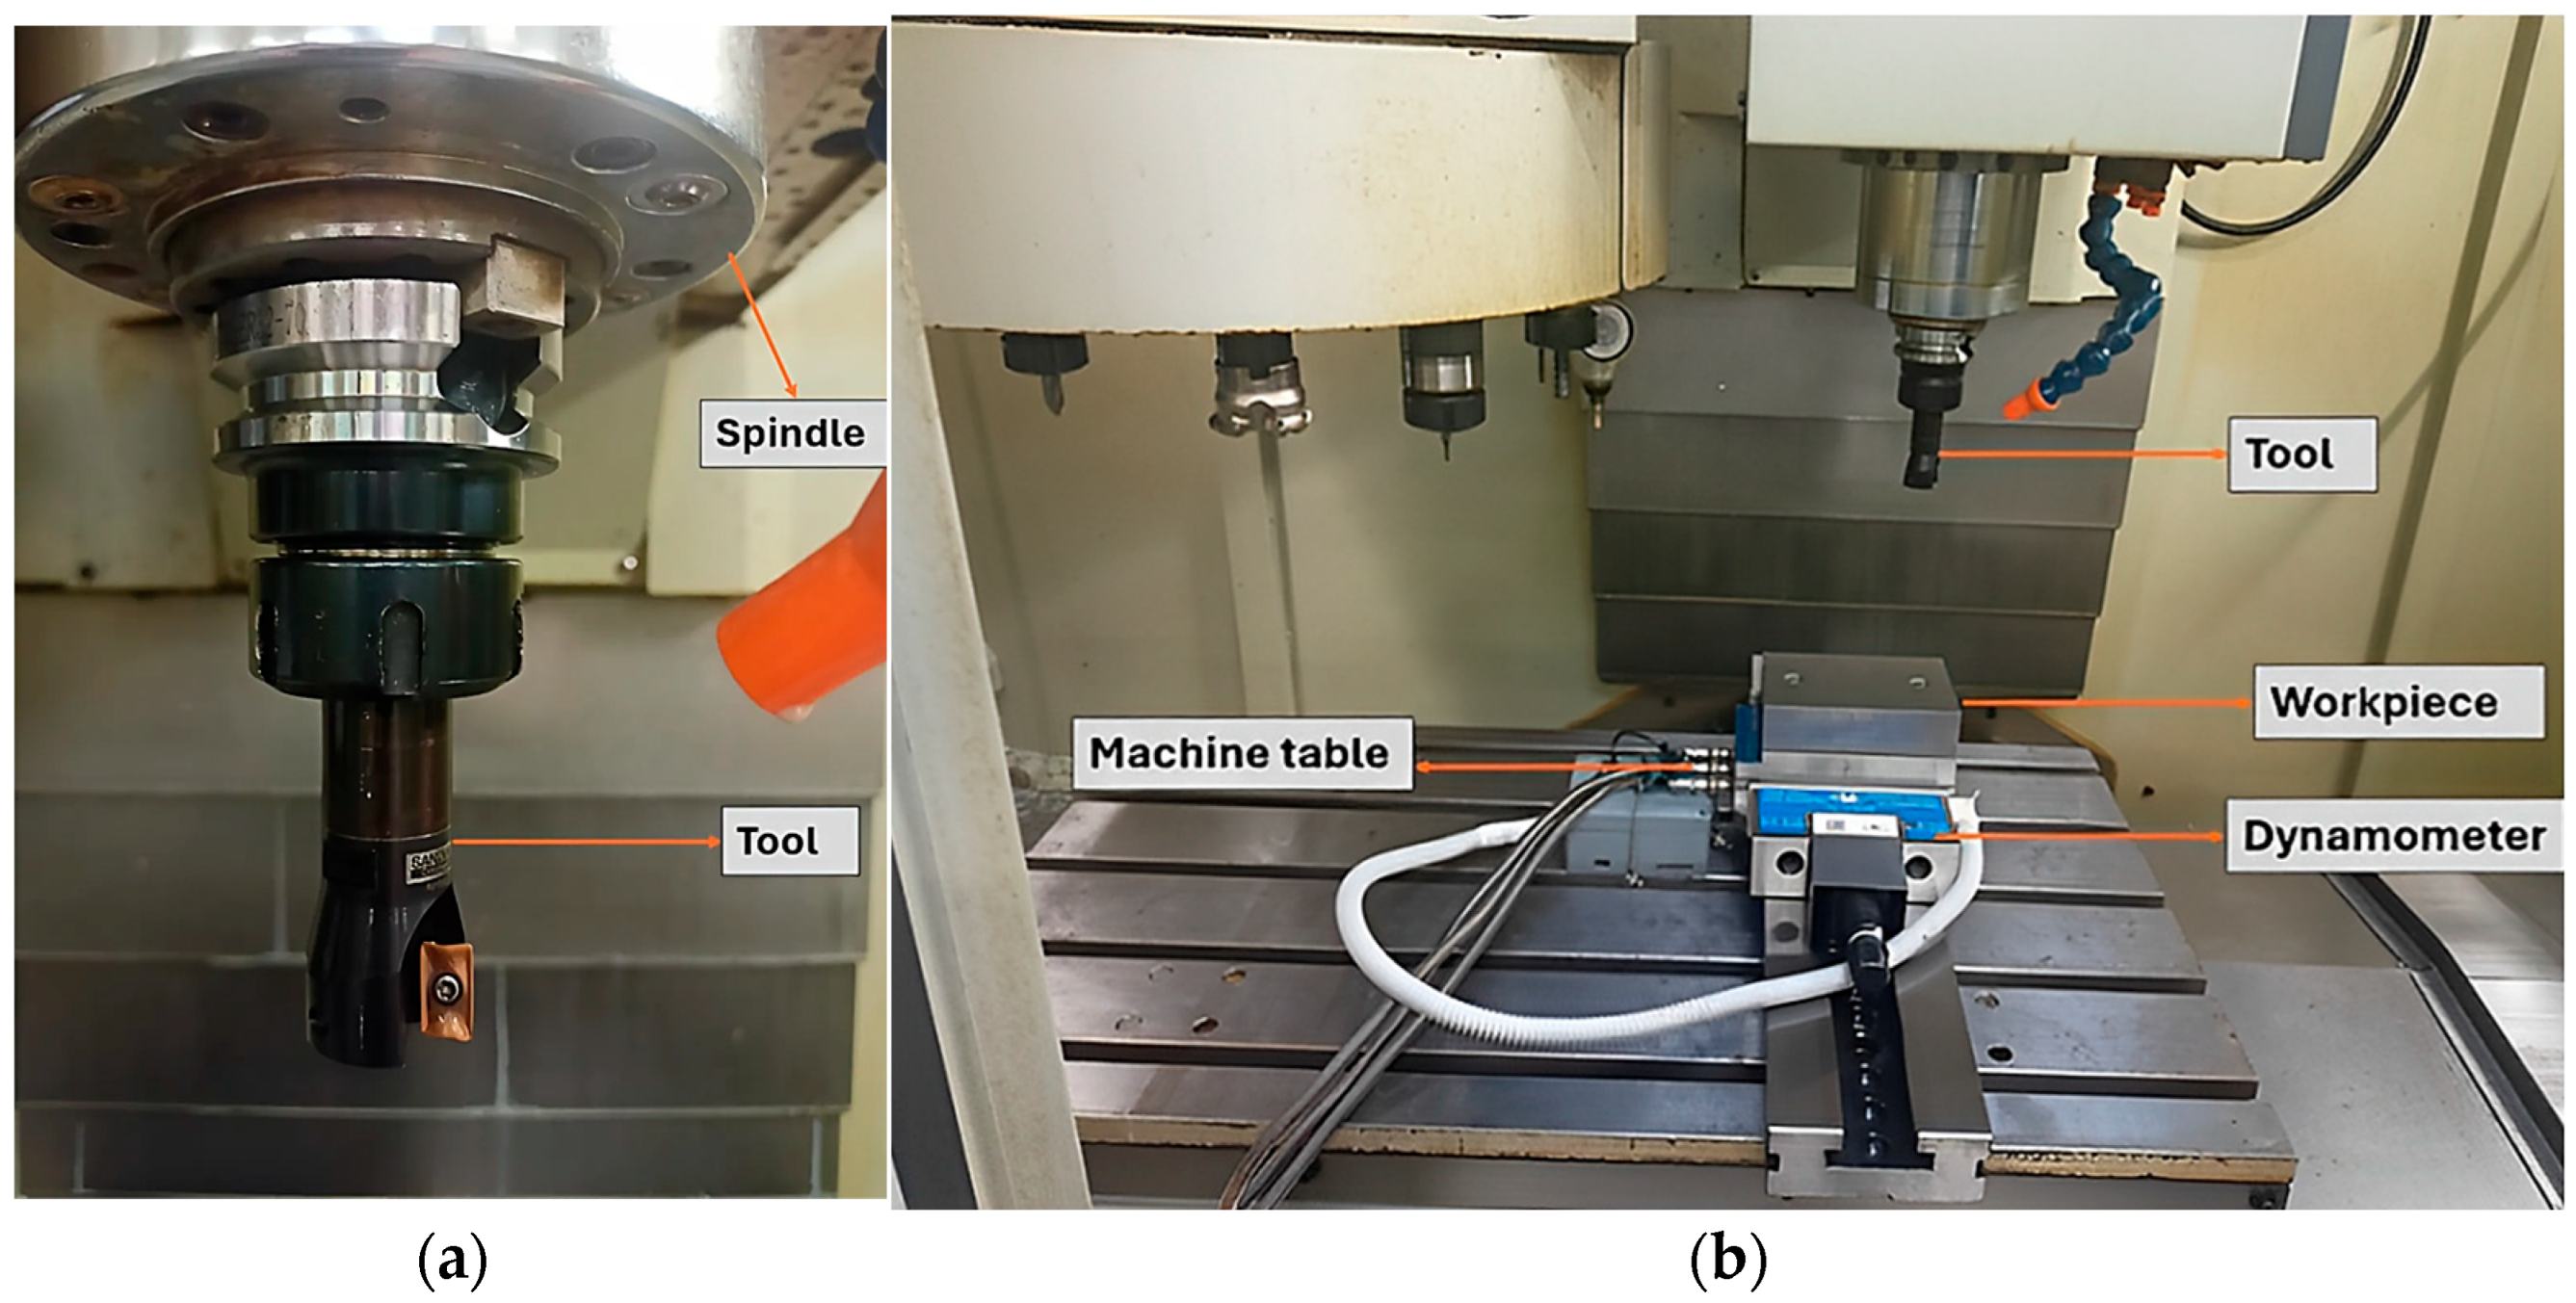
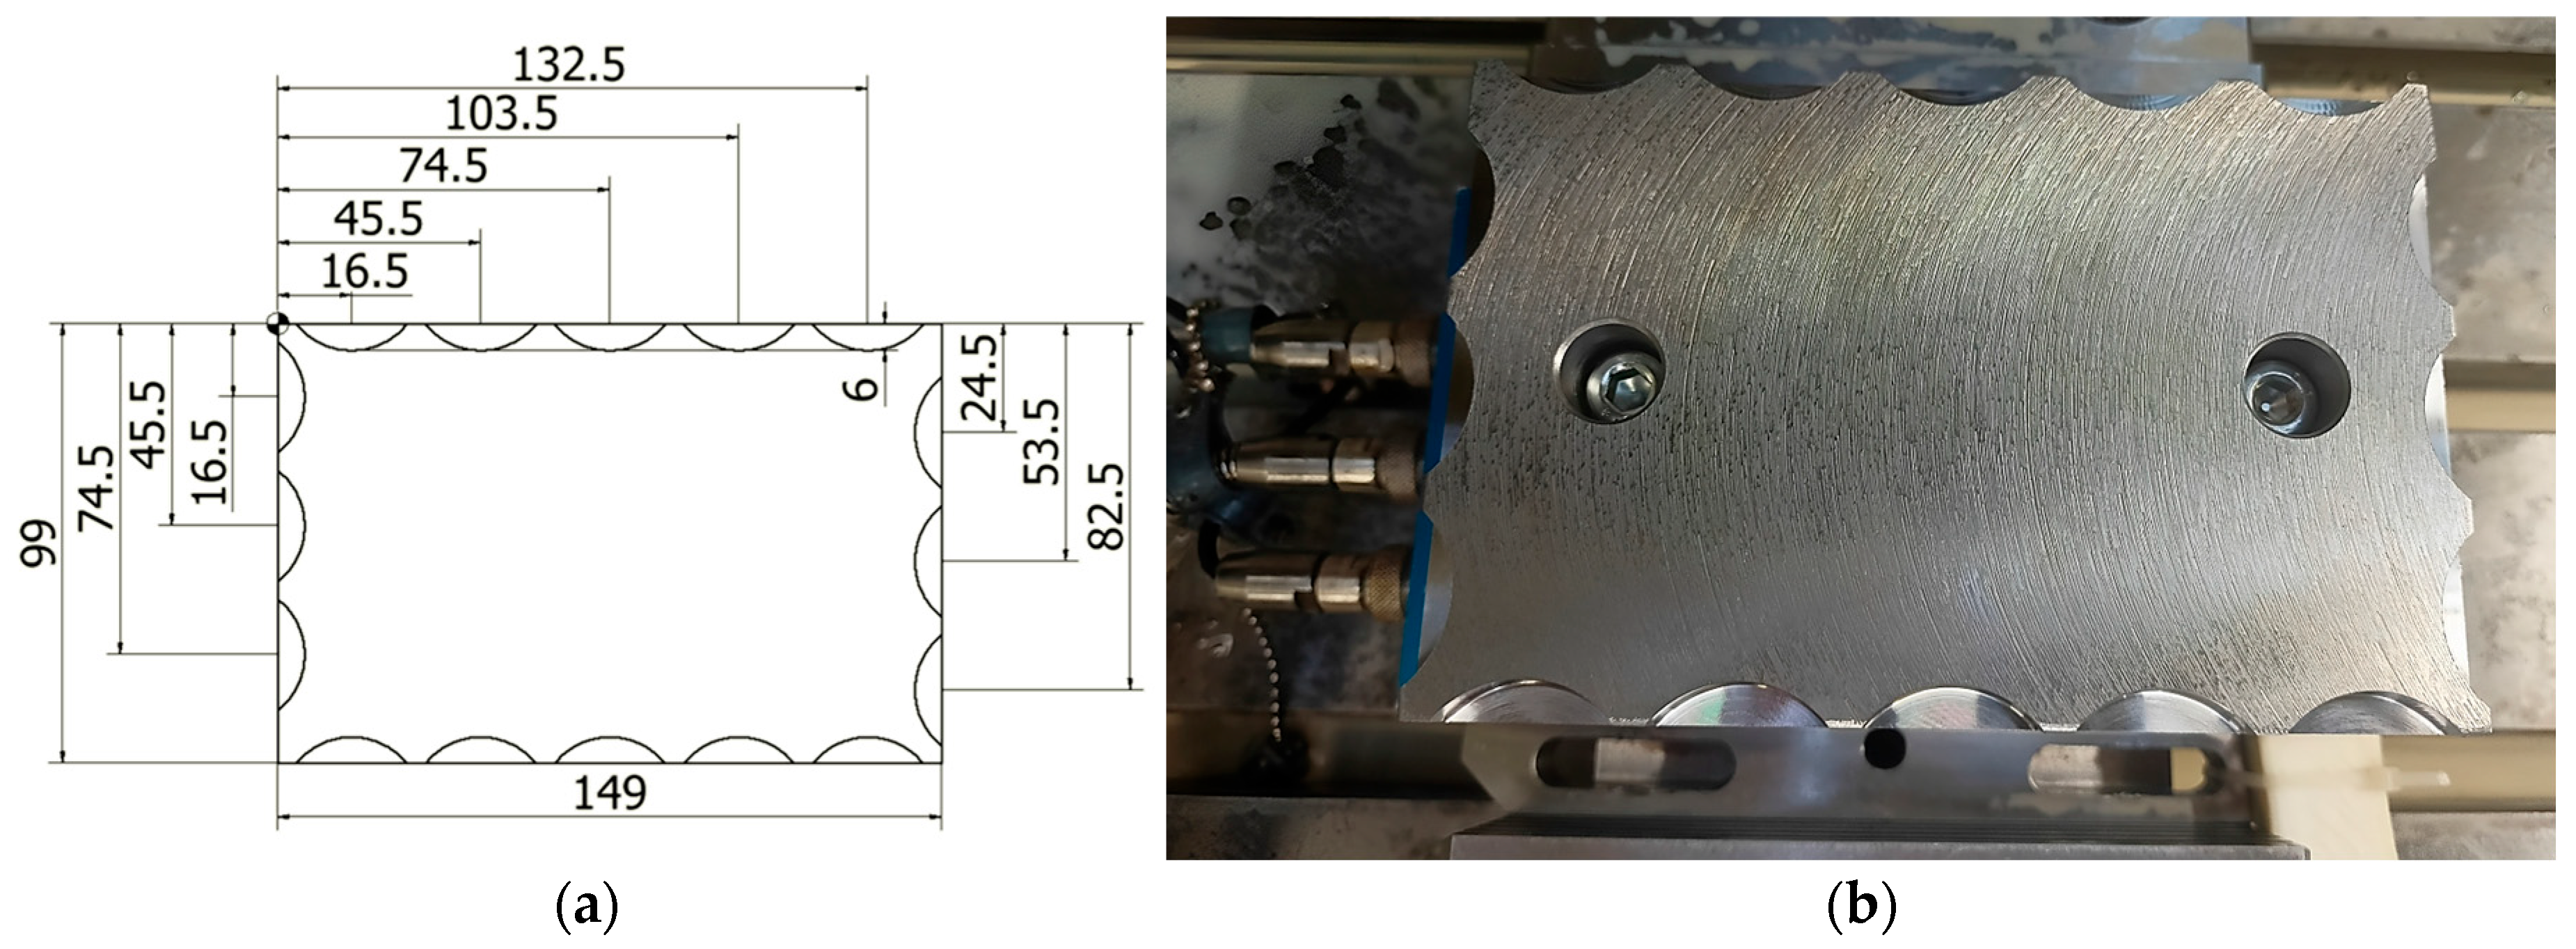
2. Materials and Methods

This study presents a comparative experimental investigation of plunge versus face milling, emphasizing cutting forces and surface roughness under controlled machining conditions. Standardized equipment and a structured variation in process parameters were applied to ensure repeatability and accuracy across all trials.
All the experiments were conducted at the Institute of Manufacturing Science, University of Miskolc, Hungary, using Perfect Jet MCV-M8 machining center, a high-precision CNC (Computer Numerical Control) platform produced by Ping Jeng Machinery Industry Co., Ltd., Taichung City, Taiwan. This machine is equipped with a BT40 spindle taper, delivering a maximum speed of 10,000 rpm, offering excellent stability during high-speed machining. The spindle motor power is rated at 7.5/11 kW, enabling sufficient torque for both the plunge and face milling operations. Rapid feed rates are 36 m/min along the X and Y axes and 30 m/min along Z. The machine has a positioning accuracy of ±0.005 mm and a repeatability of ±0.005 mm. It contains an automatic lubrication system and RS-232 communication for program uploads. The control unit supports standard CNC protocol with options for user-defined macros.
A Sandvik Coromant CoroMill 390 end mill (R390-032EH25-17L) with the R390-032EH25-17L tool holder and R390-17 04 08E-PL 1030 inserts, manufactured by Sandvik Coromant (Sandviken, Sweden), was used for both the face milling, a modular EH25 interface, and plunge milling operations as shown in Figure 1a. This cutter has a 32 mm diameter and an arbor size of 25 mm. It is designed for shoulder milling and ramping applications, including internal coolant channels, to assist chip evacuation and thermal stability. The inserts have a corner radius of 0.8 mm and are grade 1030, suitable for machining steel. The inserts were secured using the manufacturer’s recommended torque settings, per Sandvik Coromant’s recommendations for this specific tool. It accommodates two cutting edges simultaneously and is engineered for high feeding, 90° shoulder milling, and plunge operations. The inserts (double-sided, rhombic carbide type) are designed to minimize cutting forces while maximizing edge strength and wear resistance, especially effective under variable load conditions. New inserts were used for each set of experiments to ensure consistent cutting conditions. It is important to note that using a larger diameter face mill for plunge milling may lead to different cutting forces and surface roughness characteristics than using a smaller diameter end mill designed explicitly for plunge milling. The tool was specifically chosen because it is a versatile tool designed for both shoulder milling (kinematically similar to the face milling conducted) and ramping/plunge milling operations, as stated by the manufacturer. Using the same tool and inserts for both the plunge and face milling strategies was a deliberate choice to ensure a direct and fair comparison of the milling strategies themselves, minimizing the influence of differing tool geometries. This approach allows us to isolate the effects of the kinematic differences between plunge and face milling. Figure 1b is shown all experimental setup for the measurements.
The workpiece material used in this study was C45 medium carbon steel, prepared in rectangular blocks with dimensions of 100 mm × 50 mm × 25 mm. C45 is widely used in industrial machining applications due to its balanced mechanical properties and good machinability. The material has a Brinell hardness of approximately 170–210 HBW, an ultimate tensile strength ranging from 600 to 800 MPa, and a yield strength of about 340–460 MPa depending on the heat treatment condition. Its thermal conductivity is approximately 49.8 W/m·K at room temperature. These characteristics make C45 an appropriate representative material for evaluating the performance of milling strategies under realistic industrial conditions. Prior to machining, all the samples were degreased with isopropyl alcohol and dried to ensure uniform surface conditions and avoid contamination during cutting.
In this study, a complete factorial design of experiments was implemented to investigate the influence of three key machining parameters—cutting speed ( v c ), feed per tooth ( f z ), and axial depth of cut ( a p )—on machining performance. Each parameter varied at two levels to allow for an in-depth understanding of their main and interaction effects on cutting force and surface roughness. The two-level factorial design is effective for several reasons. First, it offers efficiency by allowing the evaluation of main effects and two-factor interactions while minimizing the number of experimental runs needed. Additionally, this design helps identify which parameters have the most significant impact on performance metrics. Lastly, it enables the detection of essential interactions between parameters.
The spindle speed (n) values were held constant for each corresponding cutting speed ( v c ) level across different axial depths of cut ( a p ) to isolate the effect of depth on cutting force and surface finish. Specifically, spindle speeds (n) of 1989 rpm and 2984 rpm were used for v c = 200 m/min and v c = 300 m/min, respectively, based on the tool diameter (D = 32 mm) using the standard equation:
n = 1000 · v c π · D .
The feed rate ( v f ) were calculated based on the standard relation using a tool diameter (D) of 32 mm and the number of cutting edges (z = 1):
v f = n · f z · z
Although the cutting load naturally increases with greater depth of cut (due to larger material removal volume), the feed per tooth ( f z ) and cutting speed ( v c ) were kept constant in each comparison set. This ensured that any observed variation in cutting forces or surface roughness could be attributed solely to the change in a p while maintaining a consistent spindle load index for each cutting speed. The cutting tool’s robust design and the machine’s torque reserve ensured stable operation at both a p levels without spindle overload or chatter, as verified in preliminary trials.
This setup resulted in eight experimental combinations, The parameter ranges were selected based on preliminary experiments and recommendations from tool manufacturers to ensure stable cutting conditions and avoid excessive tool wear. As presented in Table 1, the machining parameters were varied systematically for both face milling and plunge milling. This setup resulted in eight experimental combinations as shown in Table 2. the machining parameters were varied systematically for both face milling and plunge milling. A complete factorial design was not utilized; instead, parameter combinations were chosen to allow for the independent assessment of the impact of each parameter.
Each machining condition was applied to both face and plunge milling operations using identical setups to ensure comparability. The cutting tools, tool holders, inserts, and machining environment remained constant across all the trials. The same cutting conditions were applied to both the plunge and face milling trials. Cutting inserts were indexed (rotated to a fresh edge) after each method to ensure consistent performance and tracking. This structured layout accurately compared milling strategies without overlapping toolpaths or cumulative tool wear effects. Furthermore, it supported collecting reliable and repeatable data for each parameter set, facilitating robust statistical analysis and interpretation.
To clearly outline the structure of this investigation, Figure 2 schematically summarizes the experimental plan, encompassing the machining strategies, variable parameters, experimental design, and subsequent performance metrics evaluated. As illustrated in Figure 3, the workpiece geometry is a rectangular part with scalloped edges. The overall dimensions of the part are 132.50 mm in length and 82.50 mm in width. The scalloped edges are created by a series of semicircular cuts, each with a radius of 6.00 mm. The depth of the scallop cuts is approximately 16.50 mm. The finished rectangular area in the middle is 103.5 × 53.5. The workpiece was designed with distinct zones for each milling strategy to ensure spatial separation and measurement clarity based on the schematic in Figure 3a. The face milling toolpaths were programmed along the side of one of the 90-degree angles of the rectangular part. In contrast, the plunge milling ones were positioned along the sides of the opposite angle, ensuring full tool engagement and isolation of each experiment. The position of the sites for both the plunge and face milling operations is shown in the attached image, where the blue and red dots represent the respective milling sites.
To ensure a direct comparison, each of the eight experimental conditions outlined in Table 2 was executed once for plunge milling and once for face milling, maintaining identical setups where applicable. The workpiece was securely clamped in the vise on the machine table. The cutting tool was installed in the spindle’s face or plunge mill. The machining parameters (N, f z , a p , and ae/so) were set according to the experimental design. The toolpath in face milling was a series of parallel passes across the workpiece surface, with the direction of cutting down milling. Plunge milling was used to create the scalloped edges. The plunge milling tool was fed axially into the material at specific locations along the edge, creating a series of overlapping semicircular pockets. The plunge milling operations were performed after the initial face milling operations to define the overall dimensions of the part. Cutting forces and surface roughness were measured, complied with ISO standards, and conducted under controlled laboratory conditions (20 ± 1 °C). Finally, the workpiece was removed. This procedure was consistently applied across all the experimental setups to ensure reliability and accuracy in the results.
The cutting forces during machining were recorded as continuous data streams throughout the entire duration of each machining pass using a Kistler 9257A three-component piezoelectric dynamometer (Kistler Instrumente AG, Winterthur, Switzerland) mounted between the machine table and the workpiece fixture. This device simultaneously measured forces along three orthogonal axes: radial cutting force (Fx), tangential cutting force (Fy) (parallel to the machine table), and Fz (perpendicular to the table and aligned with the tool and workpiece symmetry axes). All the measured cutting force components were transformed into a unified coordinate system during data processing to ensure consistency and accurate interpretation. In this system, the following components are defined as shown in Figure 4:
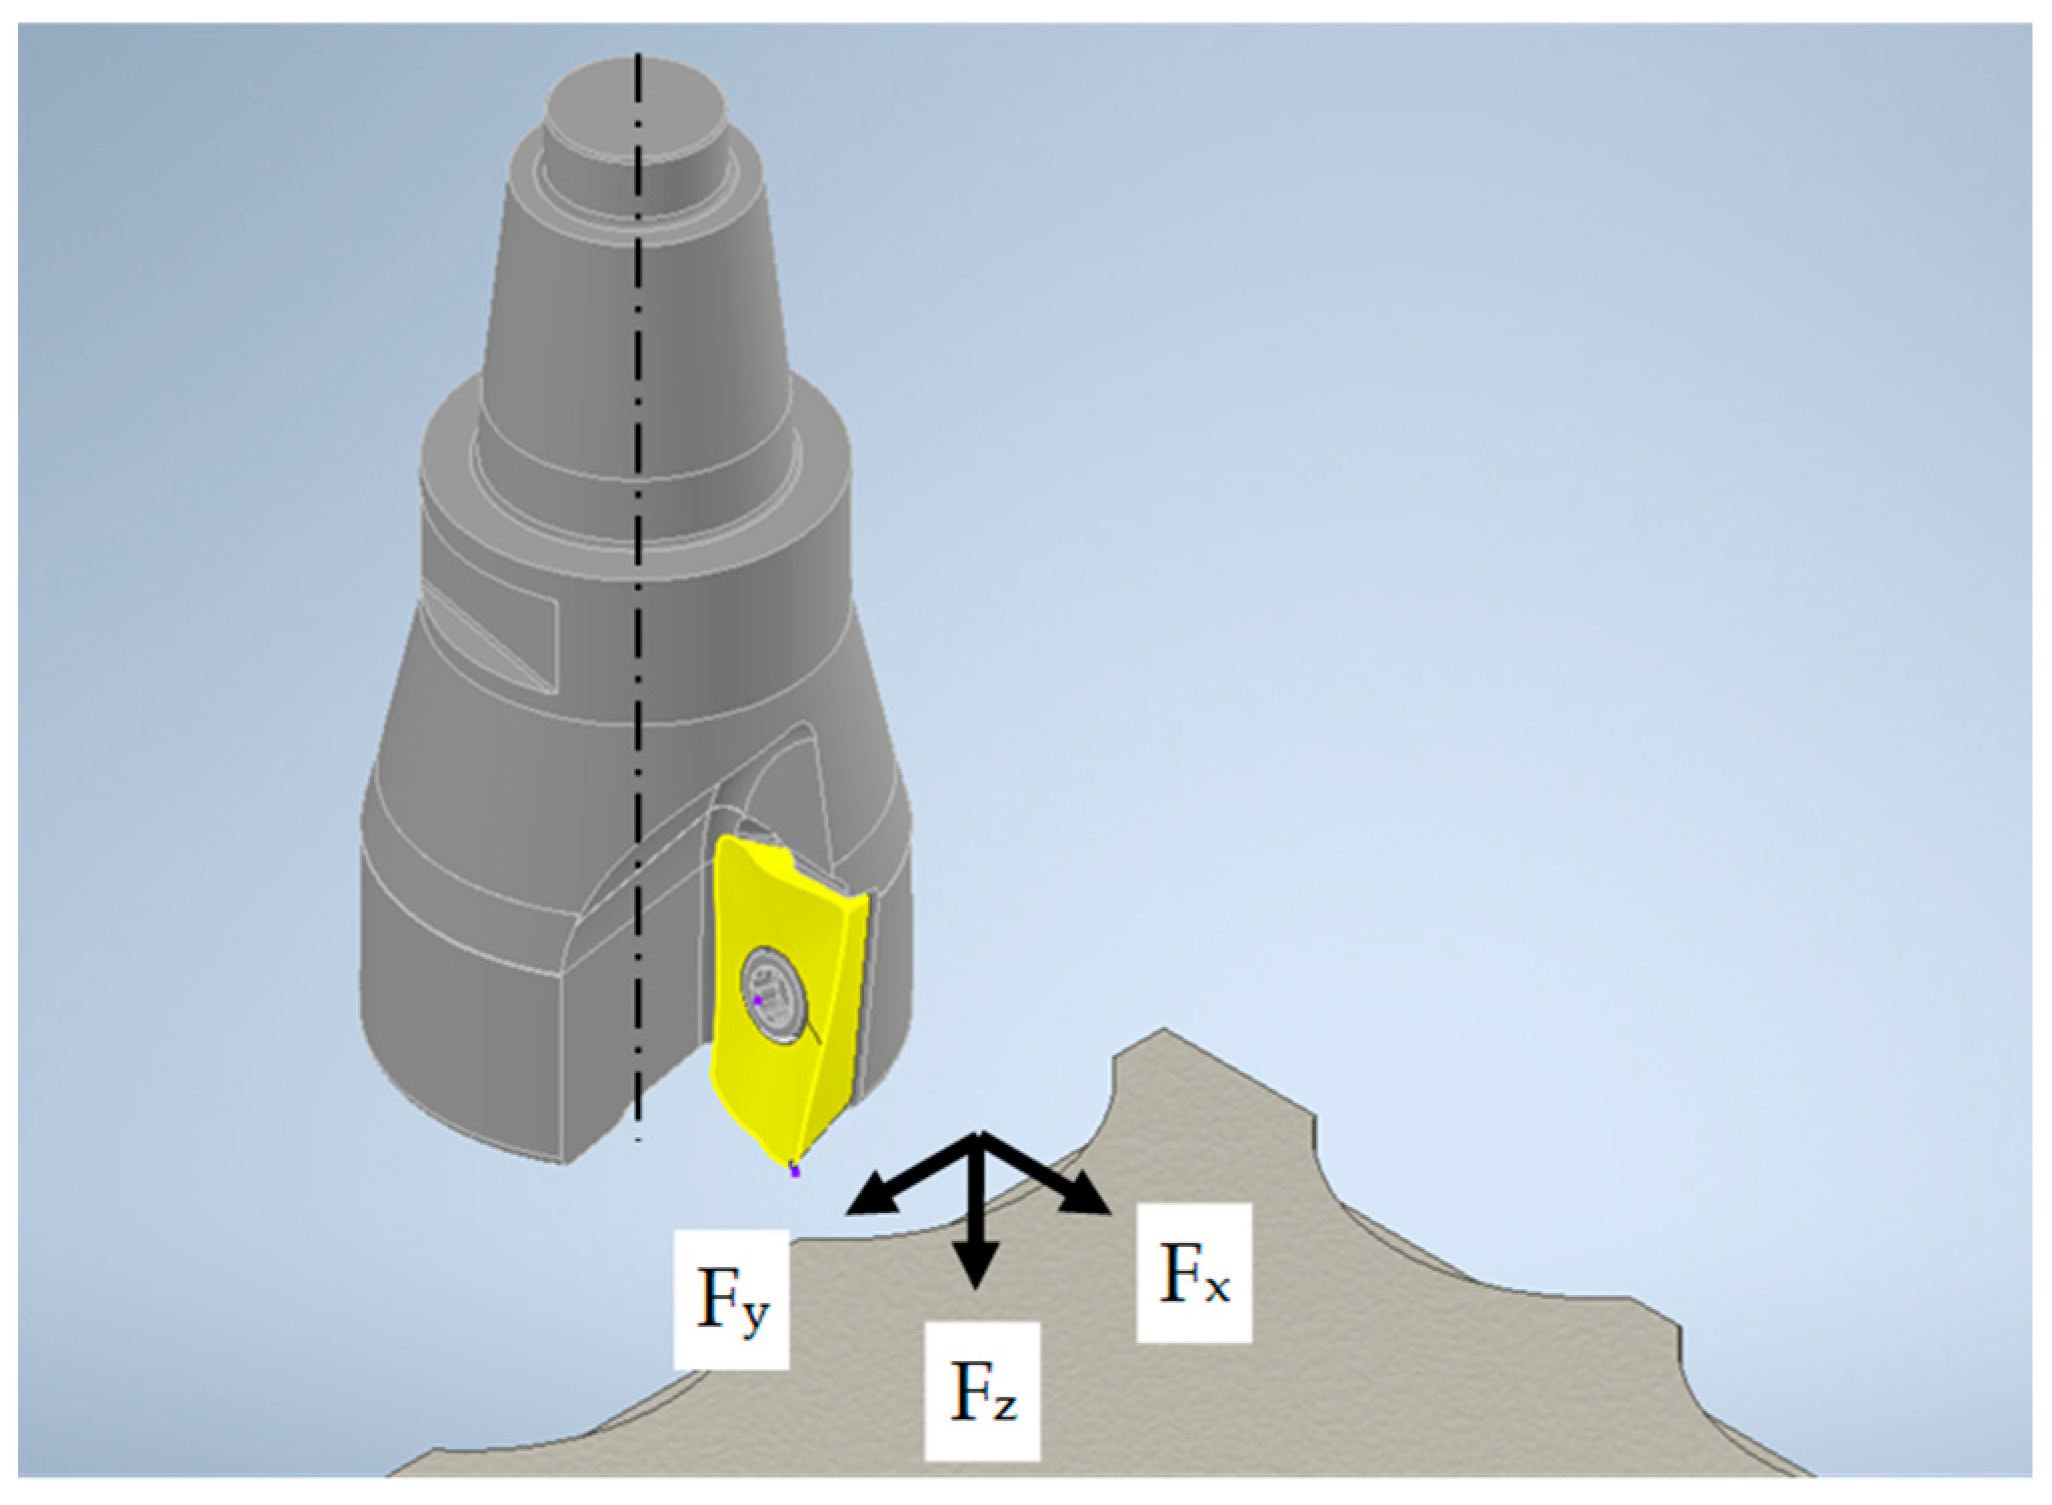
  • X-directional force (Fx) is defined as perpendicular to the side surface of the workpiece, oriented from the tool toward the workpiece (radial cutting force).
  • The Y-directional force (Fy) is aligned parallel to the machined edge and follows the direction of the cutting speed (tangential cutting force).
  • The Z-directional force (Fz) is considered positive when acting downward, in the same direction as the axial feed of the tool (axial cutting force).
The dynamometer generated electrical charges proportional to the applied forces in each direction. These signals were converted into voltage outputs through three Kistler 5011 charge amplifiers (Kistler Instrumente AG, Winterthur, Switzerland). Subsequently, the amplified signals were captured using a NI-9215 data acquisition unit integrated into an NI cDAQ-9171 chassis (National Instruments (NI) Corporation, Austin, TX, USA) and processed by a custom-developed program in NI LabVIEW software (version 2018 SP1) (National Instruments (NI) Corporation, Austin, TX, USA). The system operated with a sampling frequency of 1000 Hz, allowing the real-time visualization and storage of the force data for later analysis.
To ensure high measurement accuracy and data reliability, several measures were taken. The dynamometer setup was carefully calibrated against a mechanical force standard provided by the Institute of Manufacturing Science. Furthermore, the Kistler 9257A dynamometer and 5011 associated charge amplifiers were calibrated according to manufacturer specifications, and feature a manufacturer-specified linearity error of less than ±1%, ensuring high-fidelity force data acquisition. The AltiSurf 520 confocal chromatic probe (Altimet, Thonon-les-Bains, France) has a specified vertical resolution of 2 nm, enabling the precise characterization of the surface topography. These specifications are traceable to relevant national and international standards (e.g., similar to principles outlined in ISO 7500-1 for static force proving instruments, though dynamic force calibration for machining is an inherently more complex, multifaceted process). The data acquisition and processing protocols adhered to established best practices for dynamic force measurement in machining, ensuring the fidelity of the collected data. Recognizing that factors such as thermal drift, structural vibrations, and tool–workpiece misalignment could introduce errors, the system was rigidly installed to minimize vibrations, and all the electrical connections were thoroughly checked to reduce signal noise. The system successfully captured dynamic changes in cutting forces by applying a high sampling rate, ensuring that the recorded data accurately represented the actual machining conditions. These precautions provided a robust foundation for analyzing the magnitude and behavior of cutting forces in all three directions. Before each machining operation, the workpiece was mounted on a precision machined fixture plate using parallel supports and secured with clamps to ensure stability. To eliminate the effects of geometric runout or tilt, the top surface of the workpiece was leveled with a dial test indicator mounted on the spindle. Flatness deviation was checked at multiple points and adjusted until the maximum tilt was below 0.01 mm, a value significantly smaller than the variations observed in surface roughness, ensuring that setup error did not confound the results.
Following the completion of the cutting trials, precise surface measurements were carried out on the machined samples. Surface characterization was performed using an AltiSurf 520 3D topography measurement system equipped with a high-precision confocal chromatic probe. This setup provided detailed and highly accurate topographical data on the machined surfaces. To comprehensively assess surface roughness, measurements were taken along three distinct generatrix lines distributed over each cylindrical surface with the arithmetic mean of these three measurements utilized for the final Ra value of that trial. Recording profiles along multiple generatrix lines allowed for a representative evaluation of the surface condition across various sections of each shaft.
The surface roughness profiles were subsequently processed and evaluated using the AltiMap Premium 6.2.7487 software, which offers advanced analytical tools for surface metrology. Combining the AltiSurf 520 system with the AltiMap Premium software ensured the reliability and precision of the roughness data. This methodology enabled a deep and accurate assessment of the surface characteristics resulting from the tangential turning operations. Each experimental setup was assigned a unique code based on the combination of those parameters to systematically represent the variation in machining parameters. The coding scheme is outlined as follows:
During the experiment, it was observed that each scallop feature generated on the workpiece exhibited two distinct surfaces: one located at the bottom of the machined pocket and another along the circumferential side wall of the same feature as shown in Figure 5. Given the evident geometrical differences and potential variation in cutting dynamics at these two surfaces, surface roughness measurements were conducted independently on both regions.

3. Results

This section presents the experimental results of the comparative study between milling methods, focusing on two key performance indicators: cutting force and surface roughness. The tests were conducted under controlled variations in cutting speed ( v c ), feed per tooth ( f z ), and axial depth of cut ( a p ), with measurements collected to evaluate the machining behavior under both strategies. Surface roughness was assessed using quantitative parameters measured at two locations on the machined pockets. Cutting force was also recorded in three orthogonal directions using the earlier dynamometer. A two-way ANOVA (analysis of variance) was performed to determine the statistical significance of each factor and its interaction with others. Additionally, the data was visualized using boxplots and 3D surface plots generated in the Origin 2025 SR1 (Version 10.2.0.196) software to illustrate the distribution and relationships among variables. The following subsections report the results of these analyses, highlighting significant trends without interpretation, which is provided in the subsequent discussion section.

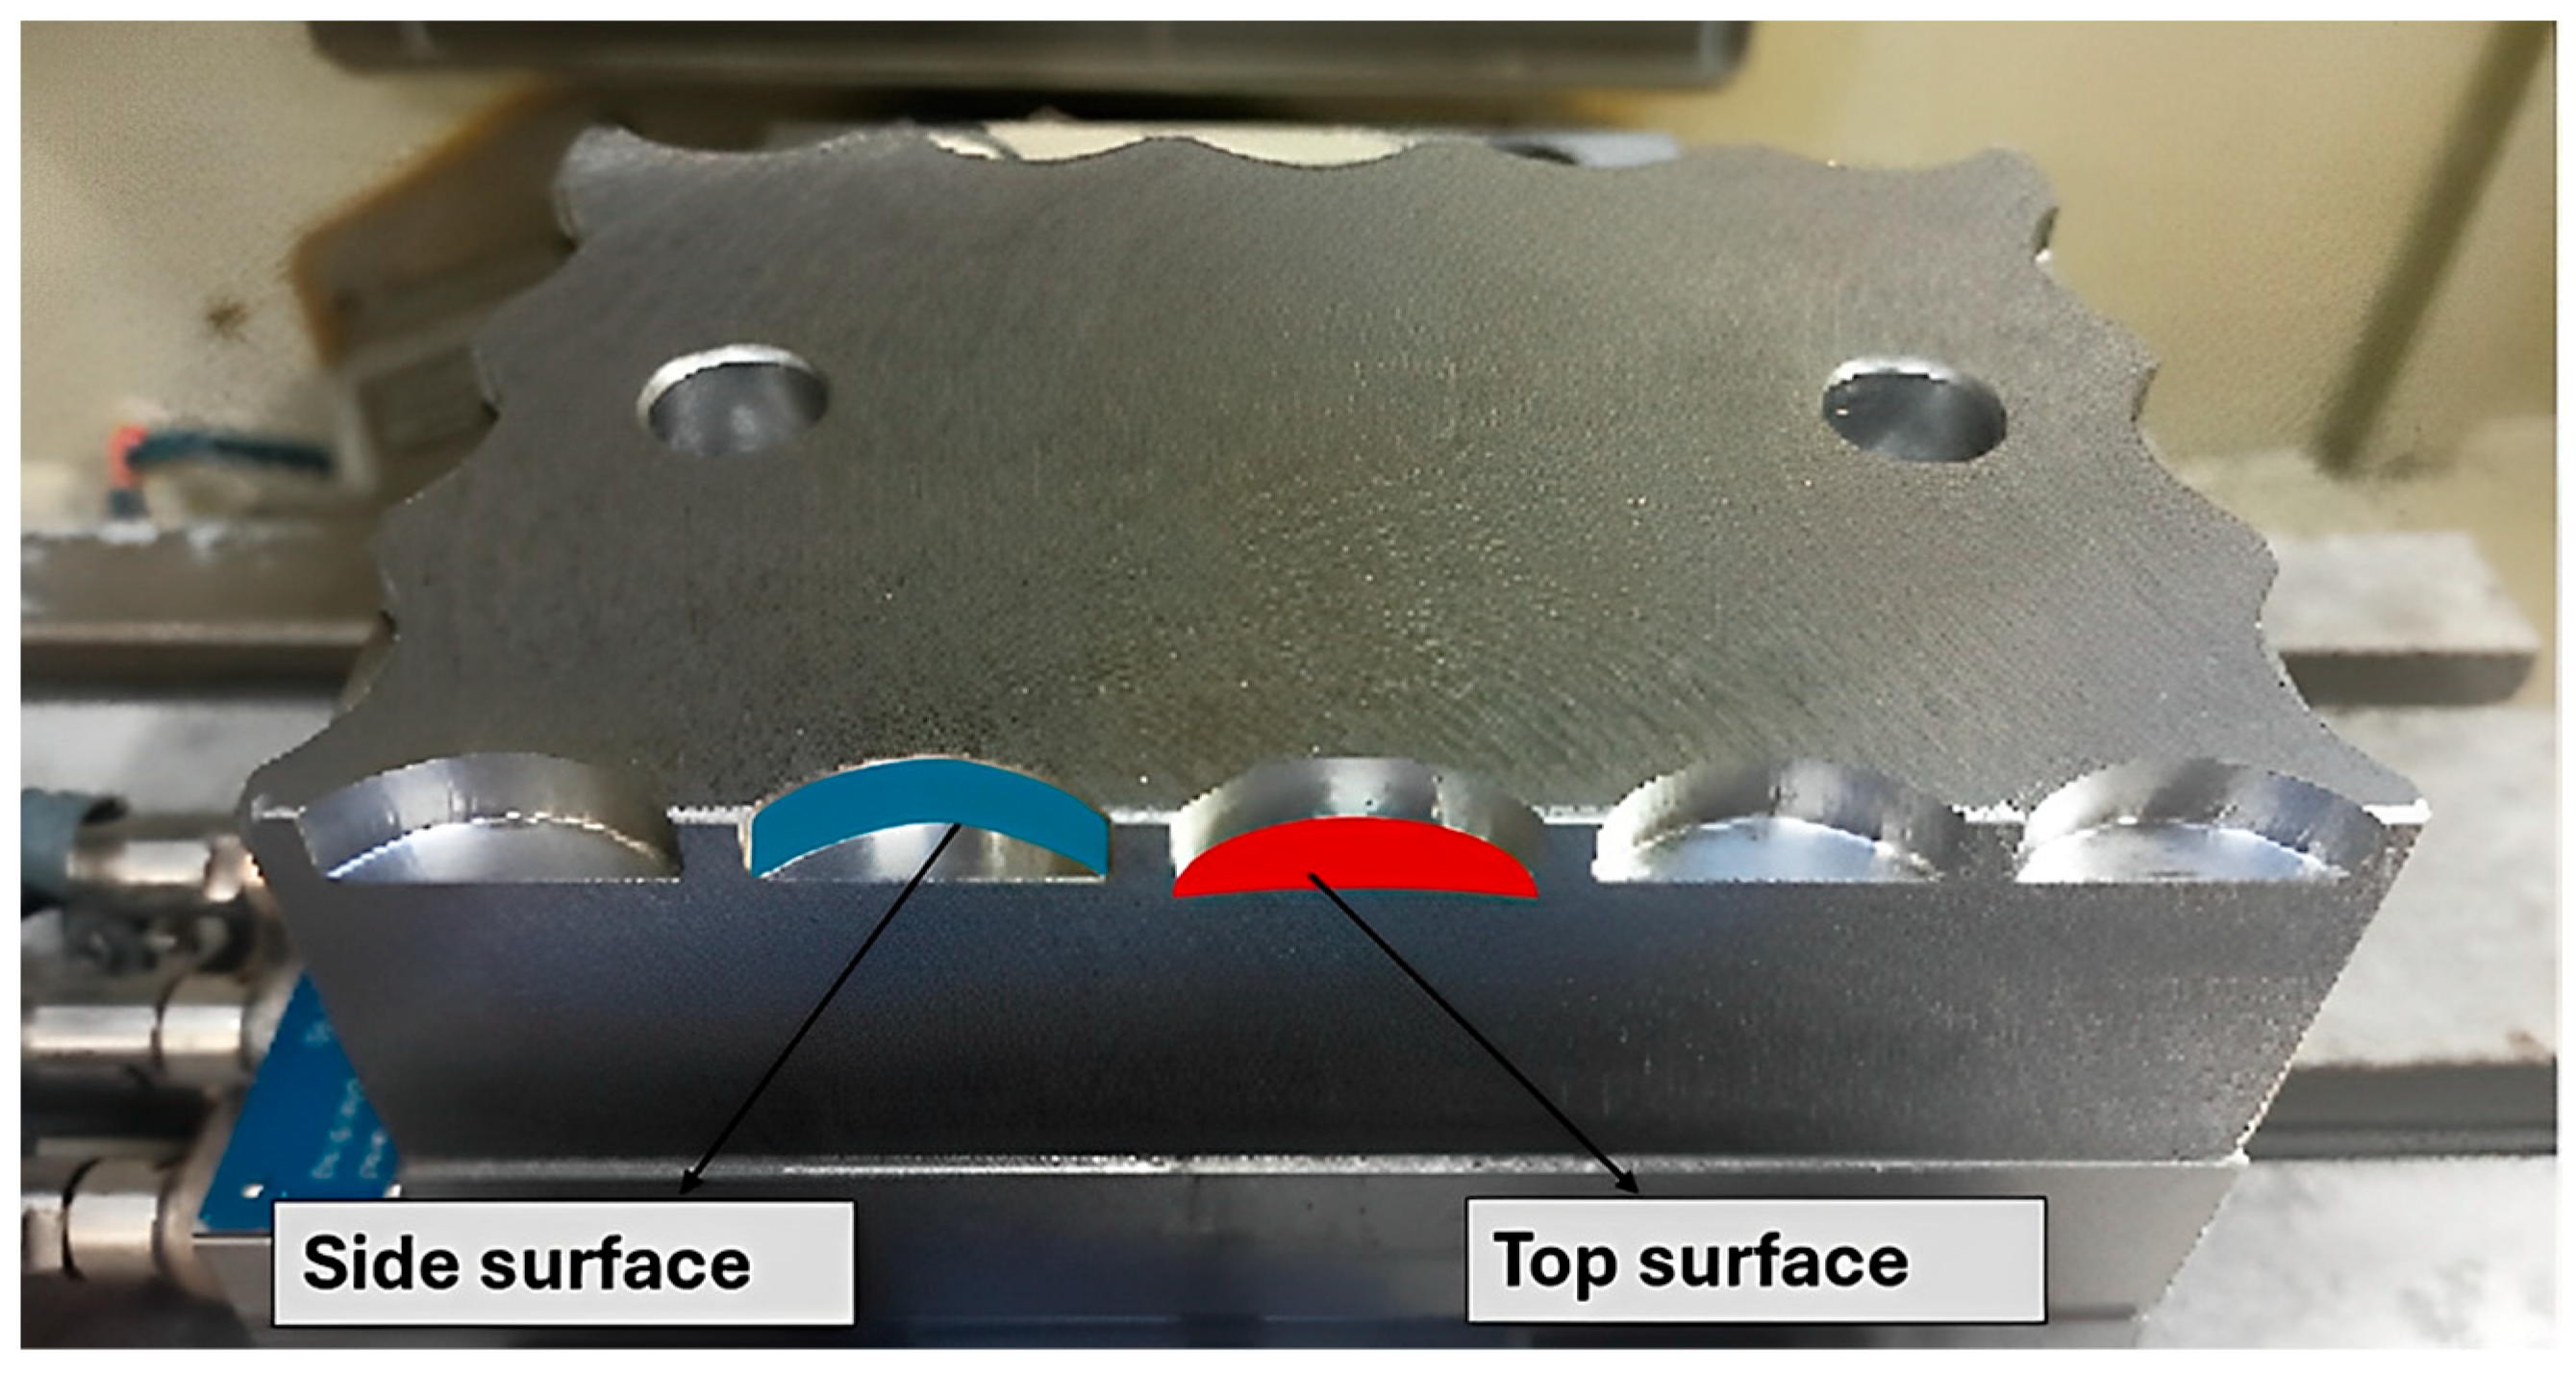
3.1. Surface Roughness

Surface Quality Characterization

The surface roughness parameter Ra (arithmetical mean roughness) of the different milling methods were measured under all the experimental conditions to evaluate and compare the surface quality. To ensure the reliability of the measurements and assess process repeatability, three distinct, parallel profiles were measured for each condition. Table 3 presents the individual measurements and their arithmetic mean. The standard deviation across these triplicate measurements was consistently low, typically below 0.1 μm, indicating good process repeatability under the tested conditions. Ra represents the arithmetical mean of the absolute deviations of the surface profile from the mean line in Table 3. It provides a general assessment of surface roughness and is widely used as a standard parameter for evaluating overall surface quality [56], particularly when comparing different machining processes. Ra was selected for analysis due to its broad acceptance and reliability in reflecting the average surface condition.

3.2. Cutting Forces

Cutting forces were continuously recorded during the milling experiments to evaluate the mechanical load behavior along the cutting path for both the plunge and face milling strategies. Forces were measured along three orthogonal directions: Fx (radial force), Fy (feed force), and Fz (axial force) using a high-precision dynamometer. The force data were recorded relative to the cutting distance (X-axis), enabling a detailed analysis of how forces varied as the tool progressed through the material. This approach identified tool engagement behavior, cutting stability, and differences in force development between plunge and face milling techniques. The recorded force data provided insight into the dynamic variations in force components throughout the cutting process, capturing characteristic fluctuations related to the tool’s periodic engagement and disengagement with the material, typical of plunge milling operations.

4. Discussion

4.1. Evaluation of the Surface Topography

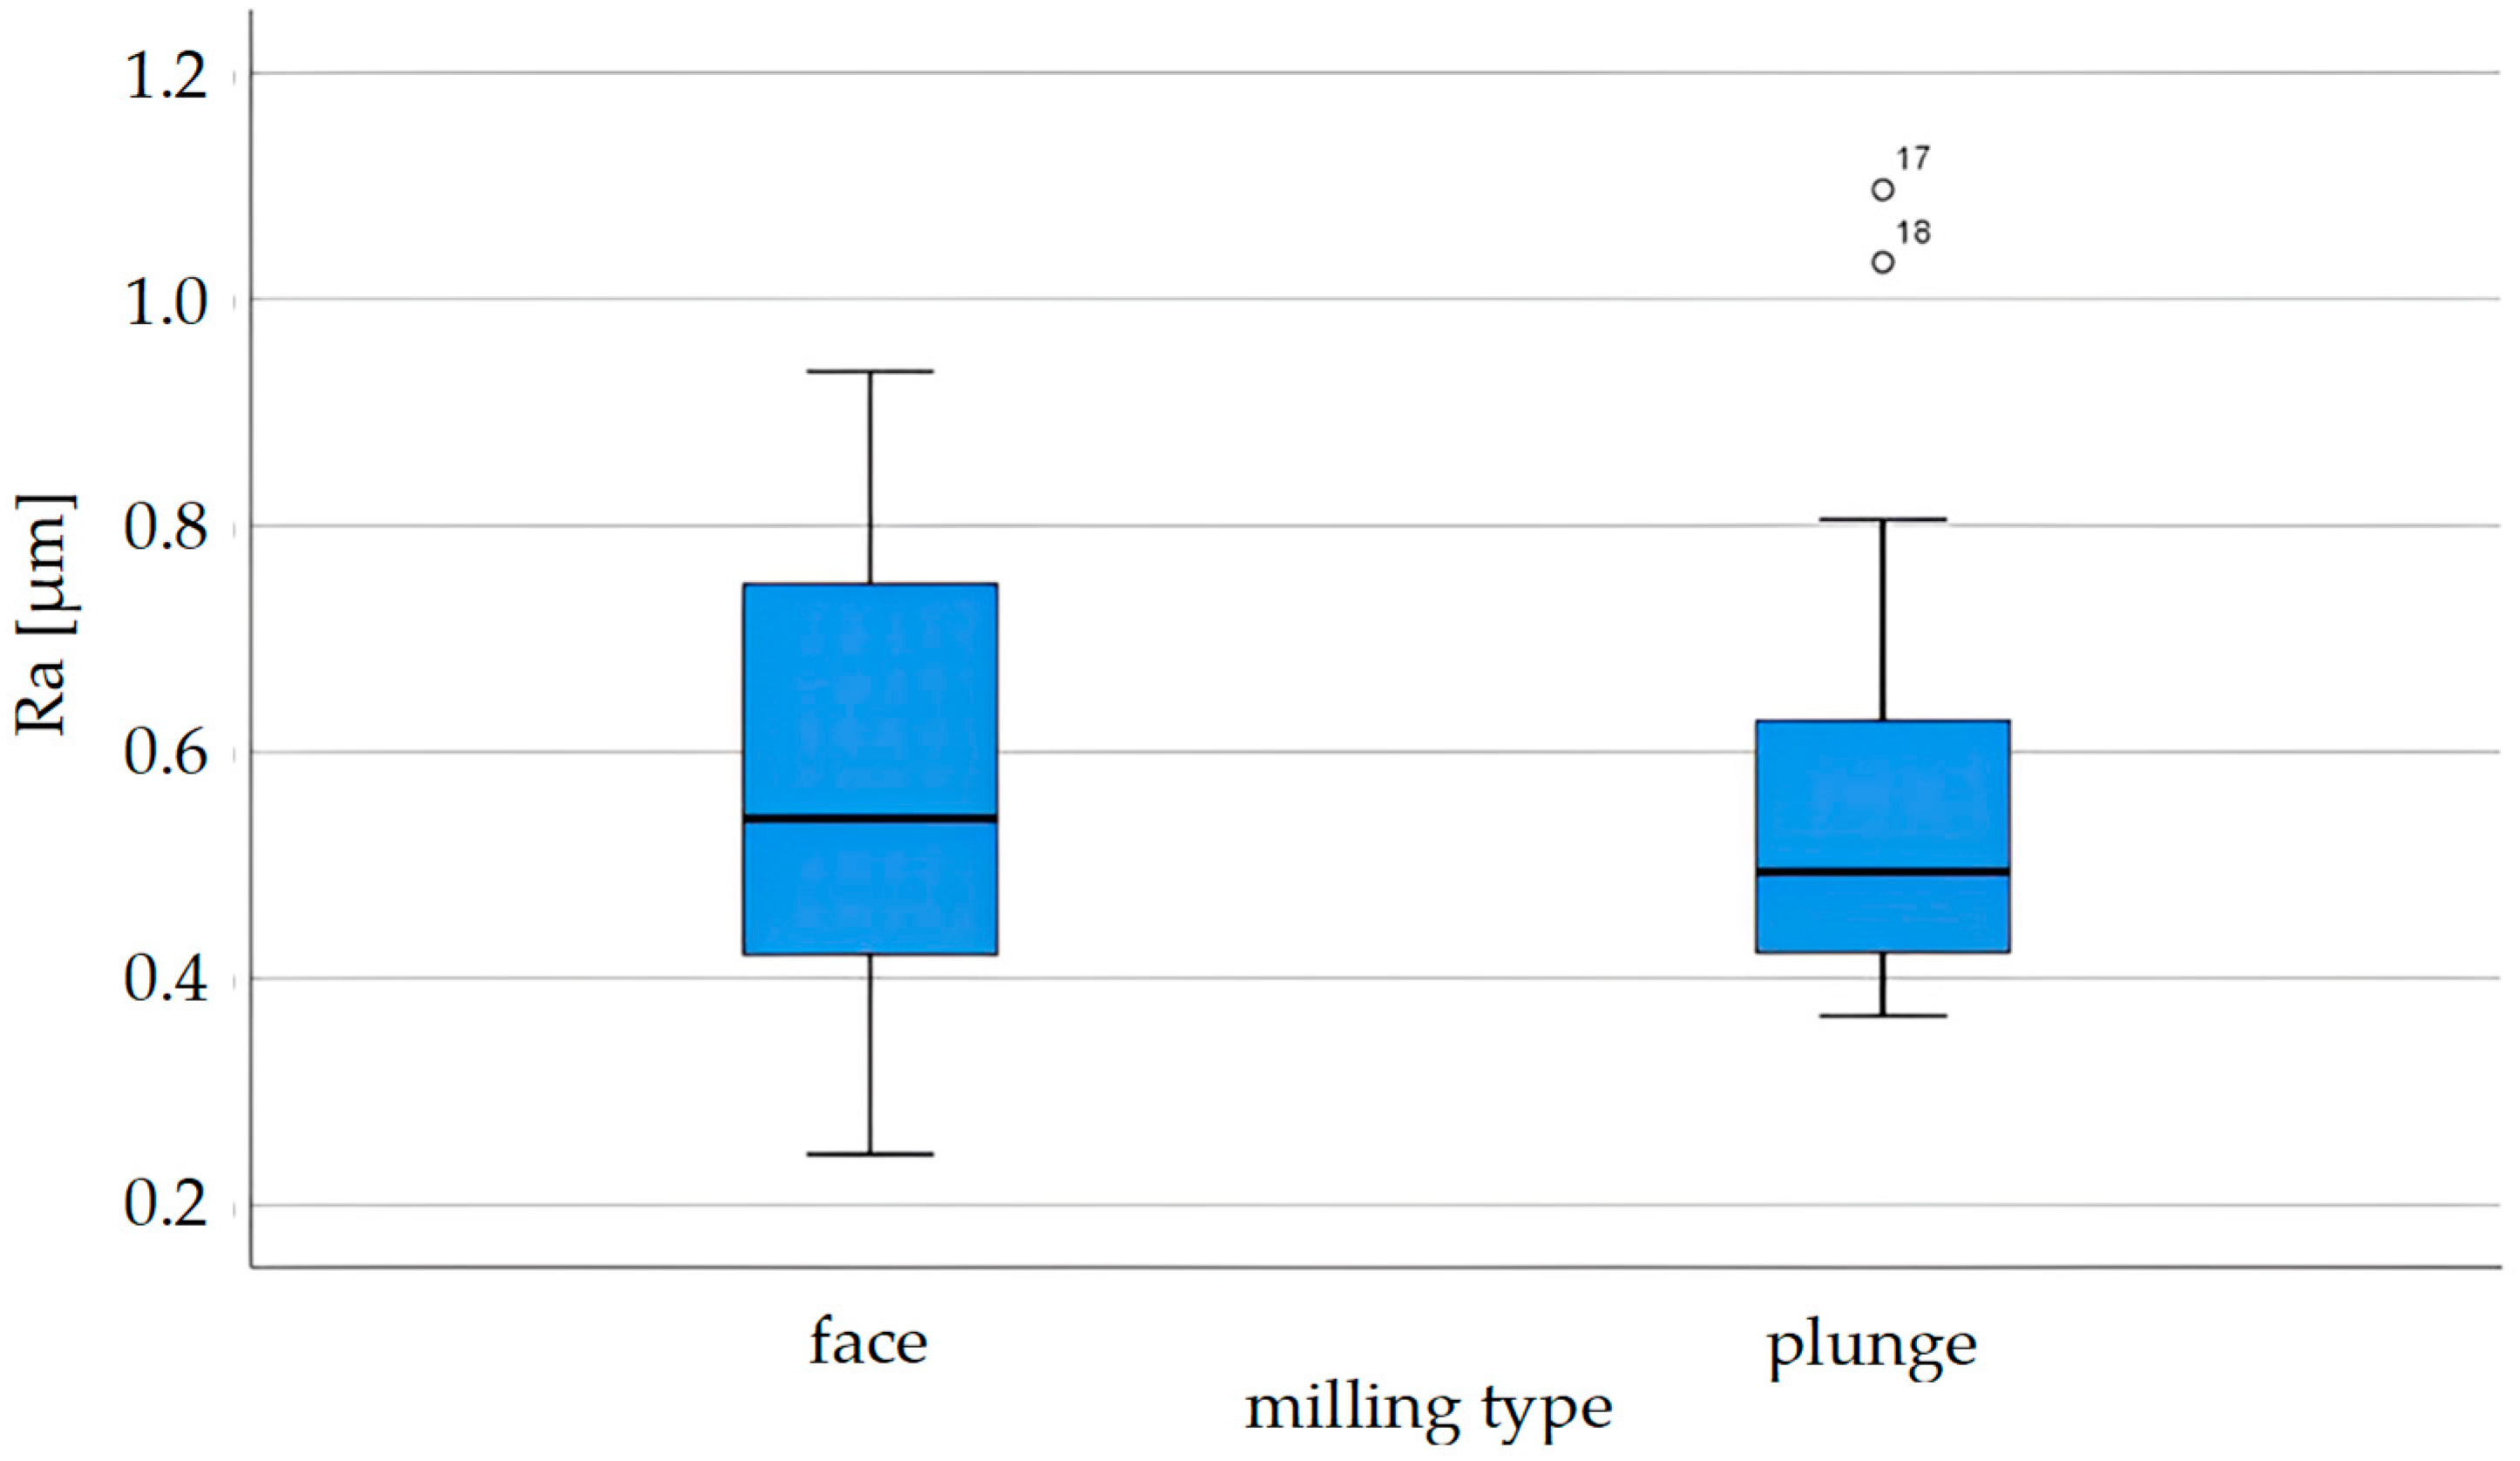
4.1.1. Statistical Analysis of the Surface Roughness

To statistically validate the relevance and independence of these parameters, a Pearson correlation analysis was performed using the SPSS software (version 25), following verification that all the variables adhered to a normal distribution. The correlation matrix revealed which parameters were strongly interrelated and which behaved independently. This approach ensured that the selected metrics capture both unique and nonredundant aspects of surface roughness, supporting a more nuanced interpretation of machining effects.
Boxplots were generated for the measured R a values to compare the statistical distribution and variability of the surface roughness between plunge and face milling. Boxplots are statistical tools that display the median, interquartile range (IQR), and potential outliers of a dataset, making them particularly useful for assessing the spread and consistency of values between different groups. This analysis highlights how the R a parameter behaves under different milling strategies, providing insight into the consistency and reliability of the resulting surface quality.

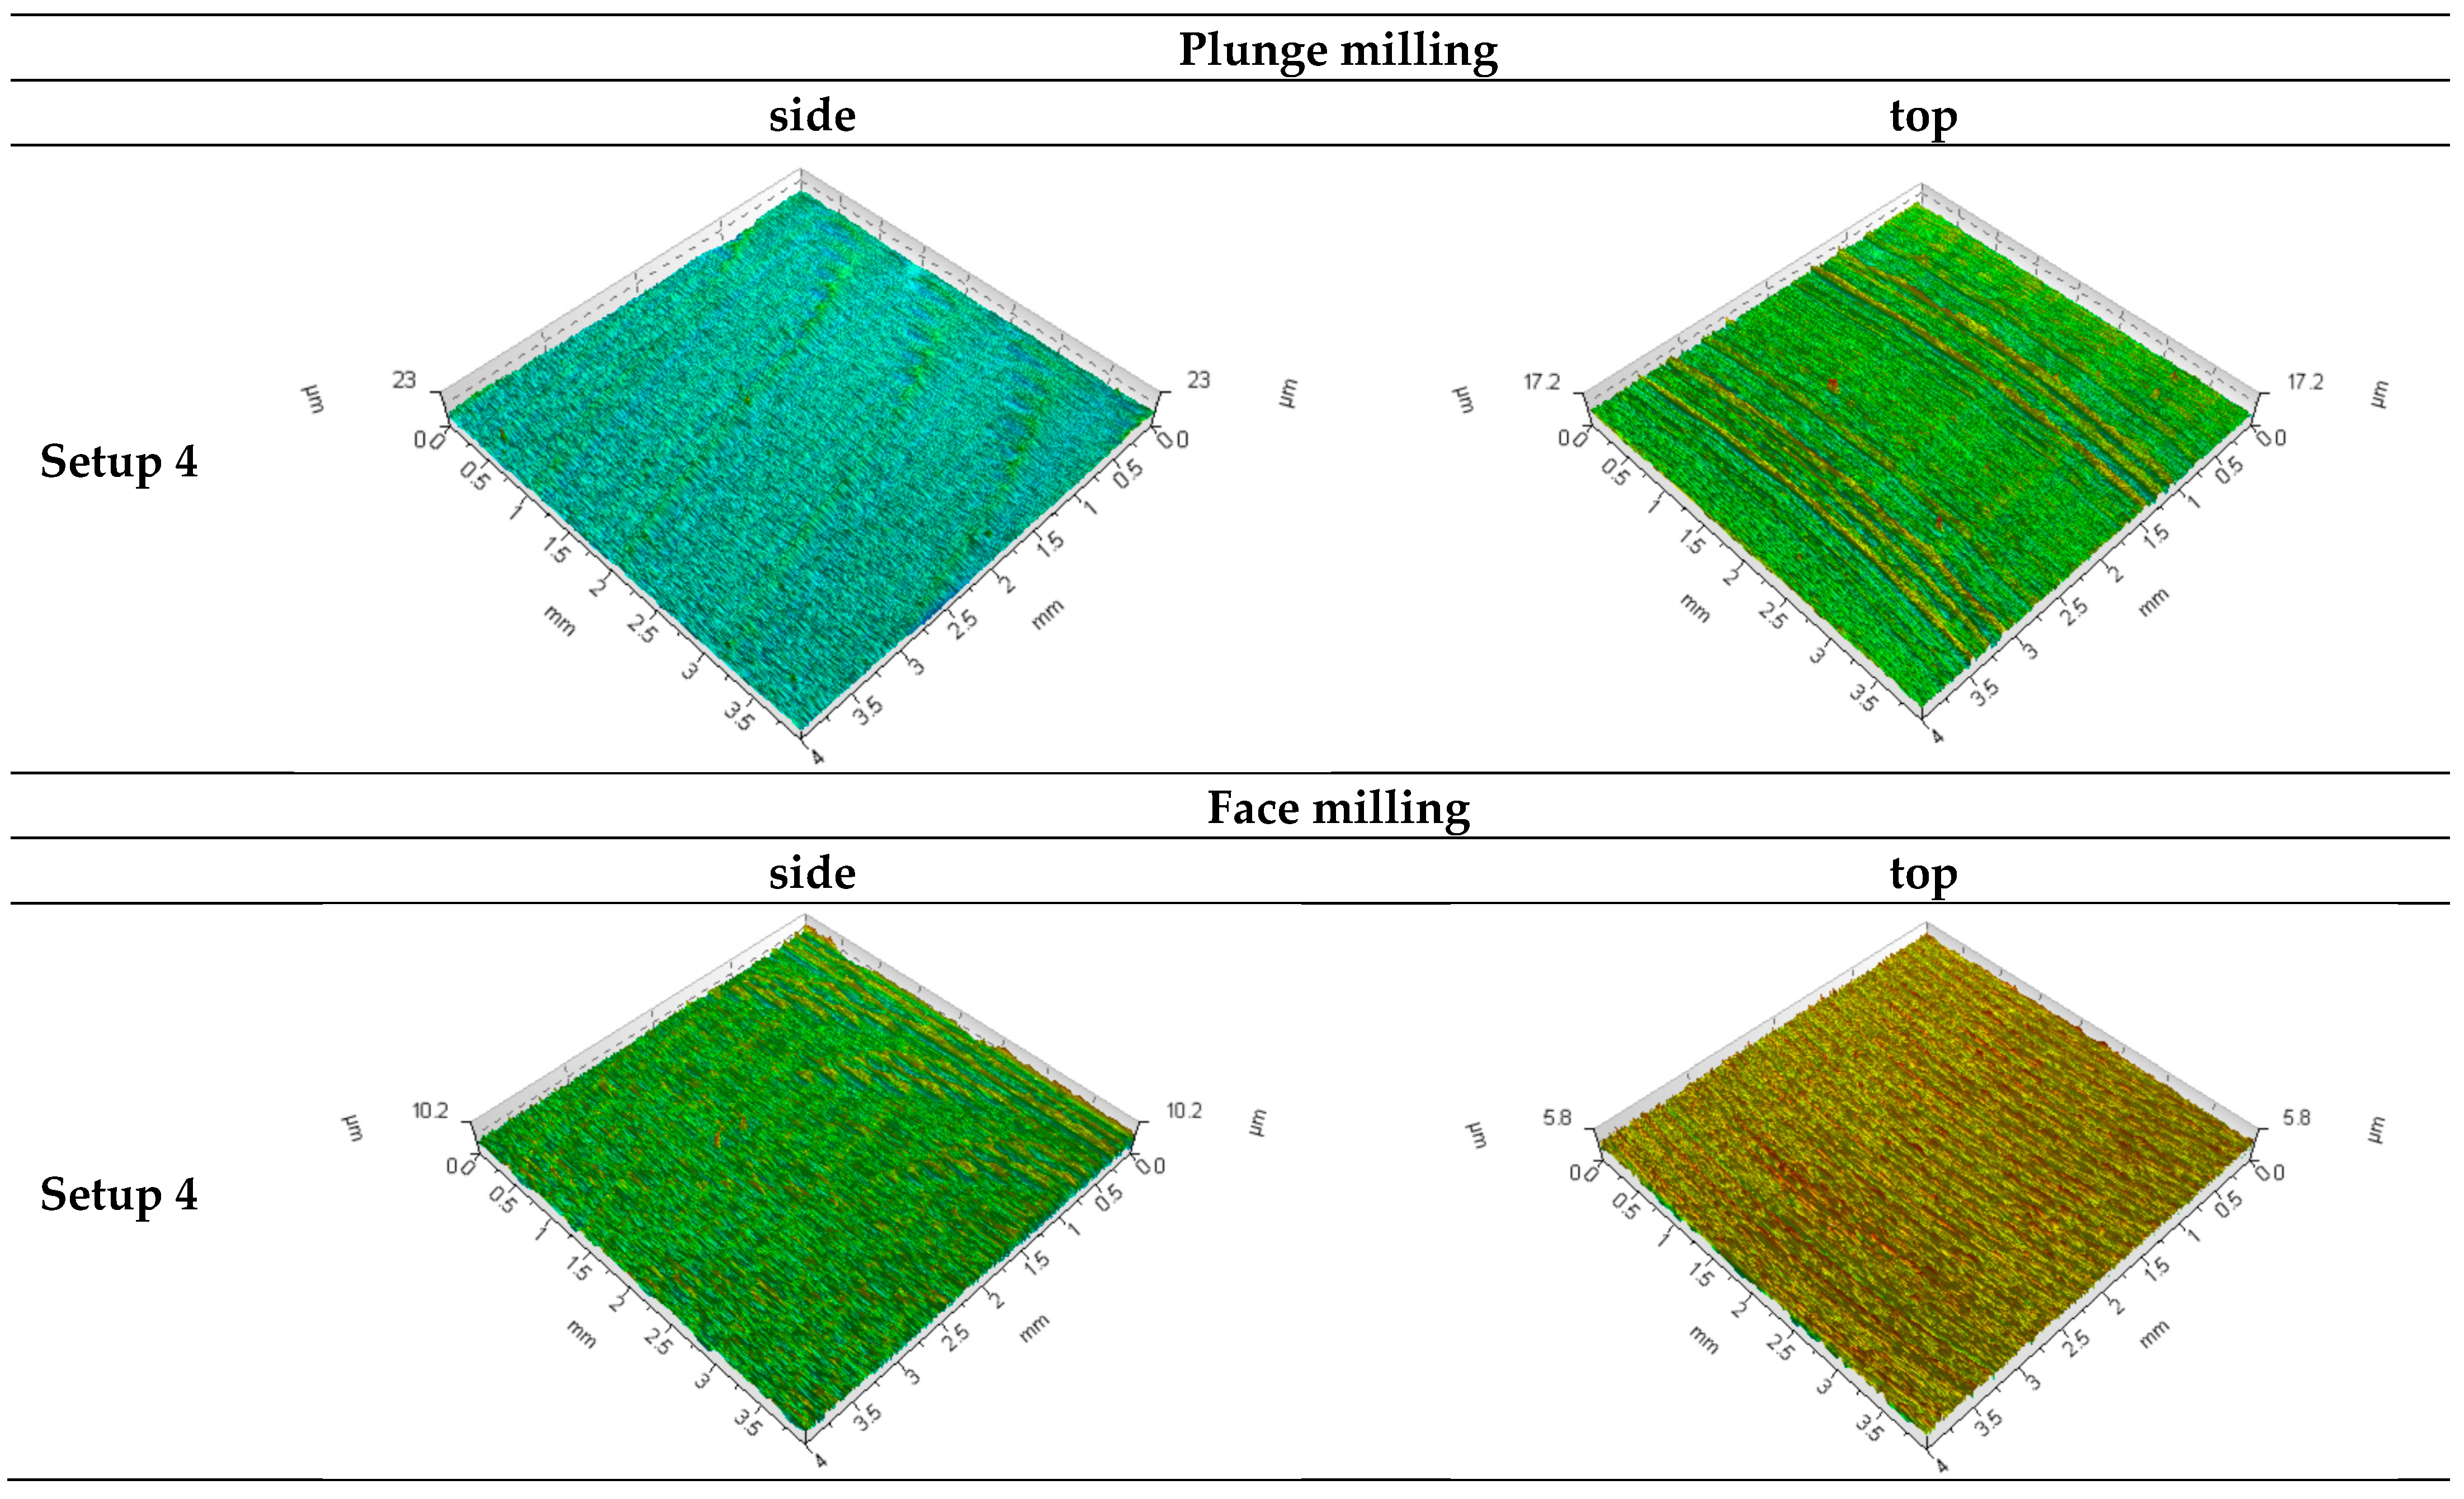
4.1.2. Detailed Analysis of the Side Wall Roughness

A two-way analysis of variance (ANOVA) was performed focusing on the surface roughness parameter R a to determine the influence of machining parameters on surface texture. The study considered the main effects of cutting speed ( v c ), feed per tooth ( f z ), depth of cut ( a p ), type of milling (face or plunge), and measurement location, as well as their two-factor interaction effects on R a . The analysis was conducted using SPSS, and all the variables were confirmed to meet the assumptions of normality (Shapiro–Wilk test) and homogeneity of variances (Levene’s test). All the datasets passed the Shapiro–Wilk test for normality (p > 0.05). The analysis specifically examined how these factors—individually and in interaction—influenced R a , supporting the primary goal of assessing surface quality outcomes under different machining conditions.
For face milling, the median R a is around 550 (units not specified, likely µm or nm). The interquartile range (IQR, the box) spans roughly 400 to 750. The overall spread (whiskers) is relatively wide, from about 250 to 950. In plunge milling, the median R a is slightly lower, around 500. The IQR is narrower, spanning roughly from 400 to 650 as shown in Figure 6. The primary distribution (box and whiskers) is tighter than face milling, but there are three significant outliers with much higher R a values (around 1050–1100). Plunge milling tends to produce surfaces with a slightly lower average roughness (median R a ) than face milling, but it is also prone to occasionally significantly rougher results (outliers). Face milling, while showing a broader typical range of Ra values (Figure 6), exhibits fewer extreme outliers compared to plunge milling. This initially suggests that plunge milling might offer smoother surfaces on average (lower median Ra), but potentially at the cost of less predictable results due to the presence of significant outliers. From a process control perspective, the presence of significant high-Ra outliers in plunge milling (Figure 6) suggests lower predictability. For manufacturing critical components where 100% of parts must meet a surface finish specification, the higher consistency of face milling—even if its median Ra is slightly higher—presents a lower-risk, more reliable strategy to avoid costly scrap or rework.
To numerically assess this predictability, the coefficient of variation (CV) for the Ra values was calculated (Table 4). Plunge milling showed a CV of 35.0%, whereas face milling had a slightly higher CV of 38.8%. This indicates that within the main distribution of results (excluding extreme outliers), plunge milling yielded slightly more consistent and predictable roughness outcomes in this study. While face milling’s median Ra was marginally higher, the presence of significant high-Ra outliers in plunge milling (Figure 6) should be considered when selecting a strategy for applications demanding tight surface quality control and high predictability across all instances.
To visually complement the Ra data, Figure 7 presents 3D surface topography images from Setup 4 (Vc = 200 m/min, fz = 0.15 mm/tooth, and ap = 1.5 mm), comparing side and top surfaces for both plunge and face milling. The plunge-milled side surface (Figure 7), with a measured Ra of 0.512 µm, exhibits a relatively irregular topography with notable peak-to-valley variations. The corresponding plunge milled top surface (Figure 7), having an Ra of 0.698 µm, shows more defined feed marks, though it presents a higher average roughness under these conditions.
In contrast, the face-milled side surface (Figure 7), with an Ra of 0.609 µm, appears more uniform than its plunge-milled counterpart, although its average roughness is comparable to the plunge-milled side surface. The face-milled top surface (Figure 7), with the lowest Ra of 0.349 µm, displays the most regular and smoothest texture, characterized by consistent, parallel tool marks, and lower peak-to-valley heights. These visual characteristics align well with the quantitative Ra measurements, with the face-milled top surface clearly demonstrating a superior finish under these specific conditions. The differences in topography can be attributed to the distinct tool engagement kinematics and material removal mechanisms of each milling process, particularly the axial feed in plunge milling versus the radial sweeping action in face milling.
The two milling types produce surfaces with distinct average roughness characteristics. While plunge milling typically offers a slightly lower R a value, it tends to be less consistent in surface quality. In contrast, face milling generally results in slightly higher R a values but with greater consistency across measurements. The choice between these methods may depend on the functional requirements of the surface—such as whether uniformity or a lower average roughness is more critical for the intended application. Beyond the average roughness (Ra), the topography generated by the two methods has different functional characteristics. As seen in Figure 7, plunge milling tends to produce a ‘peak-rich’ surface, which may have poorer tribological performance and wear more quickly in sliding contact applications. In contrast, face milling creates a smoother, ‘valley-dominated’ surface. This type of texture is often preferred for retaining lubricants, providing a better substrate for coatings, and ensuring consistent sealing performance.
When considering the roughness parameter measured on the side wall surface of a shoulder milling rather than a standard planar surface, additional complexities arise due to tool dynamics and material engagement.
The interaction between the cutting tool and the confined geometry significantly affects the R a values, leading to distinct trends. To better understand the influence of milling strategy, measurement location, and cutting speed on R a , 3D surface plots were generated using the Origin 2025 software. The presented 3D surface plots in Figure 8 and Figure 9 illustrate the influence of cutting speed ( v c ) and feed per tooth ( f z ) on average surface roughness ( R a ) generated on the side wall of a shoulder milling feature at a constant axial depth of cut ( a p = 1 mm). A comparative analysis between plunge and face milling under these conditions reveals notable differences in surface roughness behavior.
The average roughness Ra (Figure 8) during plunge milling exhibits a clear positive correlation with both cutting speed ( v c ) and feed per tooth ( f z ) within the investigated parameter space. Ra values range from approximately 0.1–0.2 µm at lower v c (200 mm/min) and f z (0.10 mm/rev) to a maximum of around 0.6 µm at the highest v c (300 mm/min) and f z (0.15 mm/rev). The increase appears monotonic across the plotted surface, suggesting the combined detrimental effects of higher speeds and feeds on the side wall finish during plunge milling under these conditions.
In contrast to plunge milling, Ra generated during face milling on the side wall is predominantly influenced by the feed per tooth ( f z ). Ra (Figure 9) values increase significantly with higher f z , ranging from approximately 0.15–0.20 µm at f z = 0.10 mm/rev to around 0.60 µm at f z = 0.15 mm/rev. The cutting speed ( v c ) demonstrates a comparatively minor effect on R a within the tested range (200–300 mm/min).
While both processes can produce similar maximum Ra values (≈0.6 µm) under certain conditions, the controlling parameters differ. Plunge milling Ra is sensitive to both v c and f z , whereas face milling Ra on the side wall is overwhelmingly dictated by f z .
Increasing the axial depth of the cut ( a p ) can significantly alter tool engagement conditions and the resulting surface topography in milling operations. This section compares the influence of plunge milling (Figure 10) and face milling (Figure 11) strategies on side wall surface roughness, specifically the Ra parameter, at an increased depth of cut ( a p = 1.5 mm). Understanding these differences is crucial for process optimization, particularly when deeper features are required.
Ra (Figure 10): At a p = 1.5 mm, plunge milling exhibits a complex, non-monotonic relationship between Ra and the cutting parameters ( v c and f z ) on the side wall. Ra is minimized (≈0.2 µm) under conditions of intermediate cutting speed ( v c ≈ 240–260 mm/min) combined with high feed ( f z ≈ 0.15 mm/rev). Ra increases from this minimum towards both extremes, reaching a maximum of ≈0.6 µm at low v c (200 mm/min)/low f z (0.10 mm/rev) and increasing to ≈0.4 µm at high v c (300 mm/min)/low f z (0.10 mm/rev).
Ra (Figure 11): In contrast to plunge milling, face milling at a p = 1.5 mm demonstrates an apparent monotonic increase in the side wall Ra with both increasing cutting speed ( v c ) and increasing feed ( f z ). Ra ranges from a minimum of ≈0.16–0.20 µm at low v c (200 mm/min)/low f z (0.10 mm/rev) to a significantly higher maximum of ≈0.96 µm at high v c (300 mm/min)/high f z (0.15 mm/rev).
The fundamental behavior of Ra concerning v c and f z differs significantly between the two processes at this depth of cut. Plunge milling shows a complex response with an optimal region for minimal Ra, while face milling exhibits a straightforward positive correlation with both v c and f z . Face milling produces considerably higher maximum Ra values (≈0.96 µm) than plunge milling (≈0.6 µm) under the tested conditions.

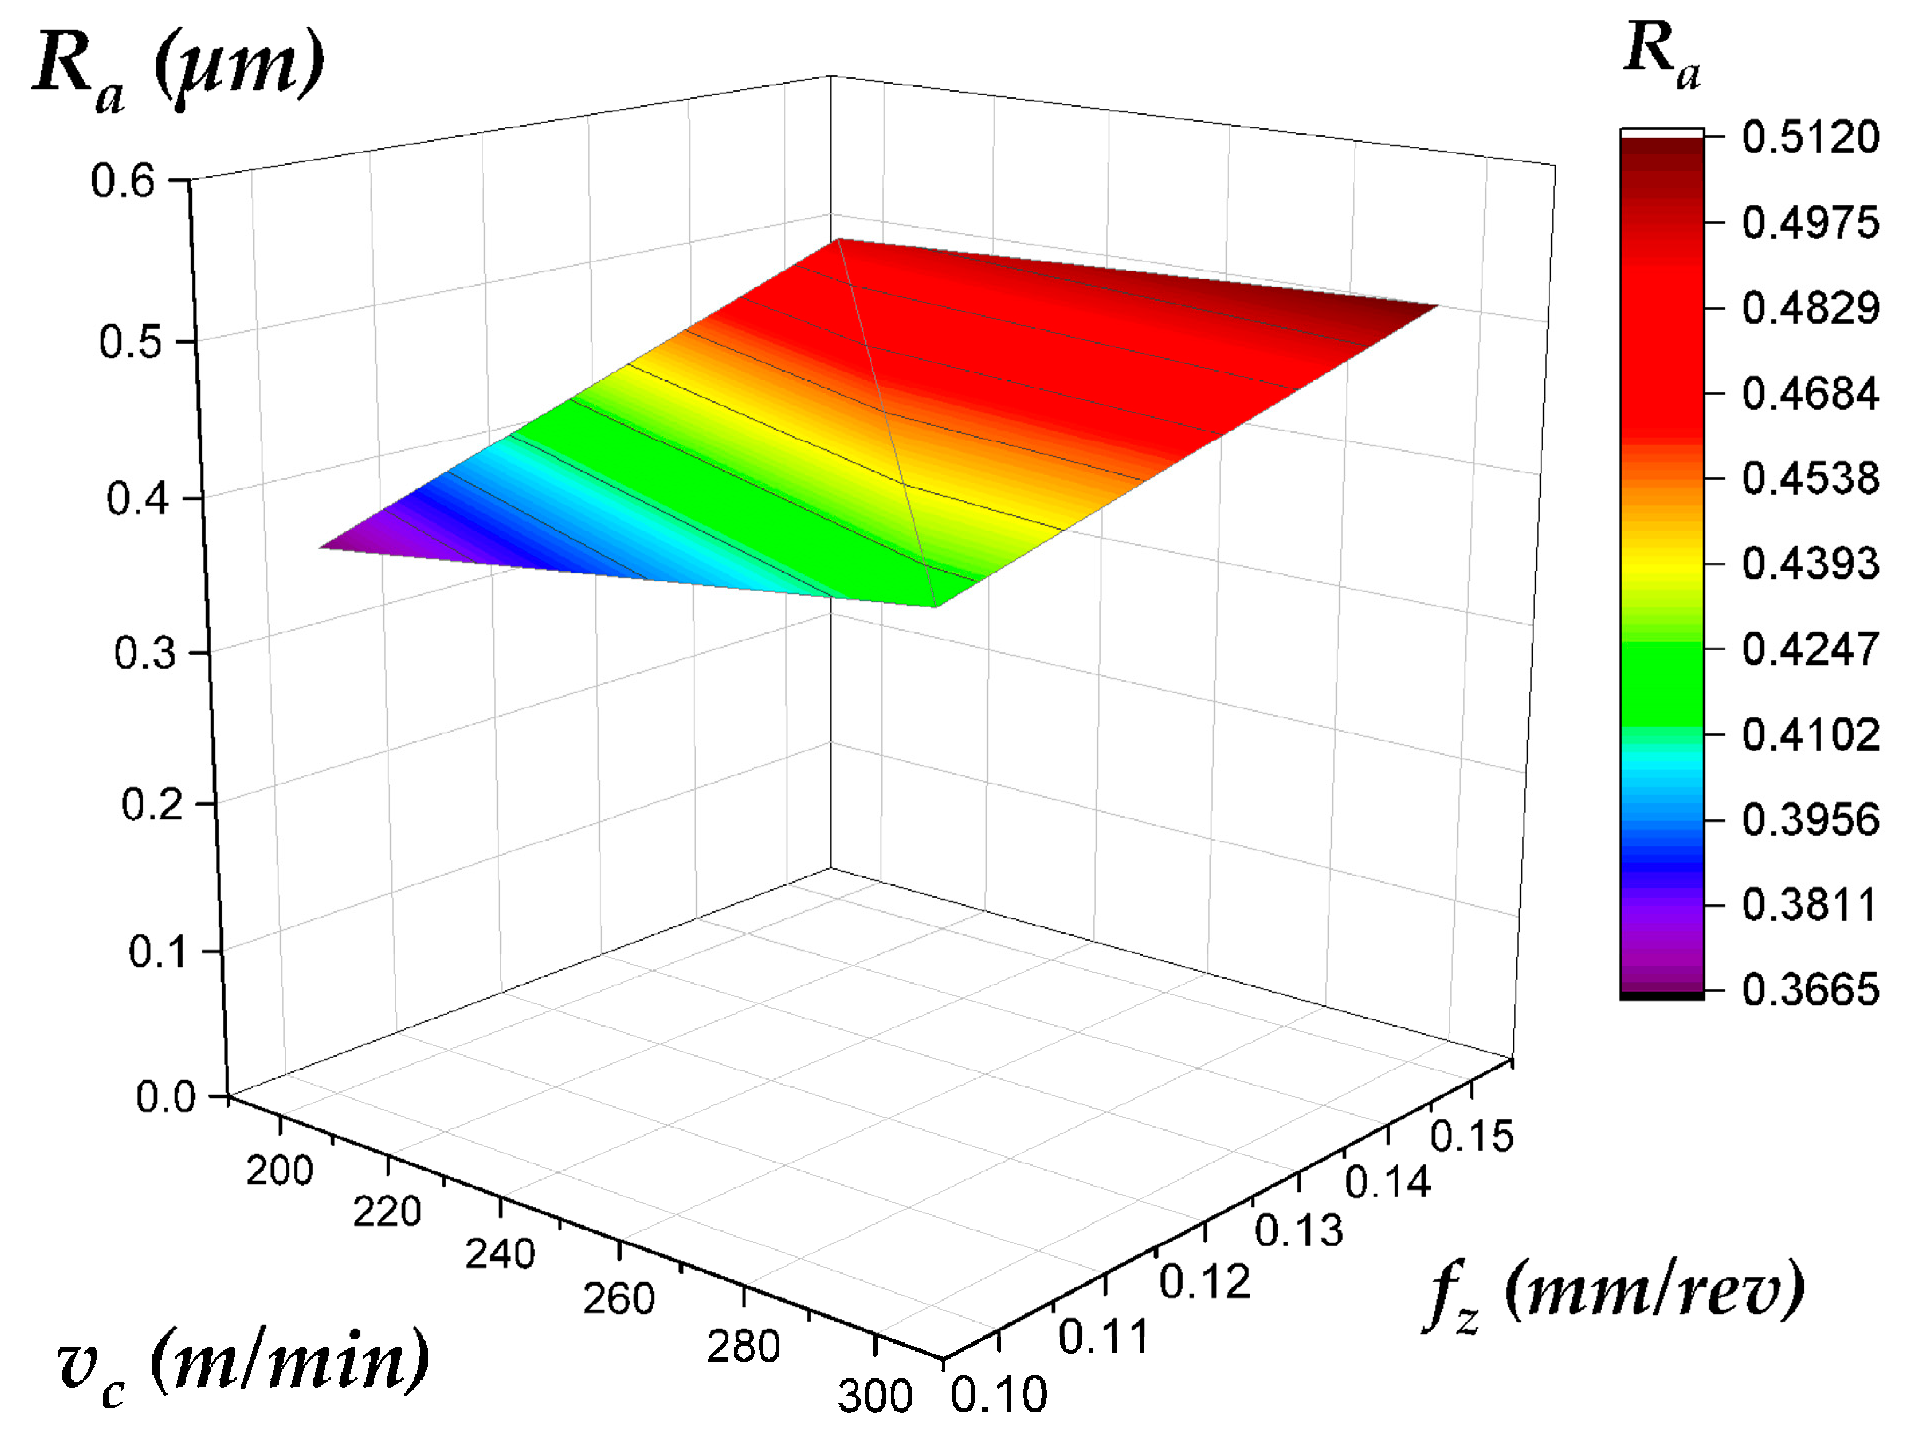
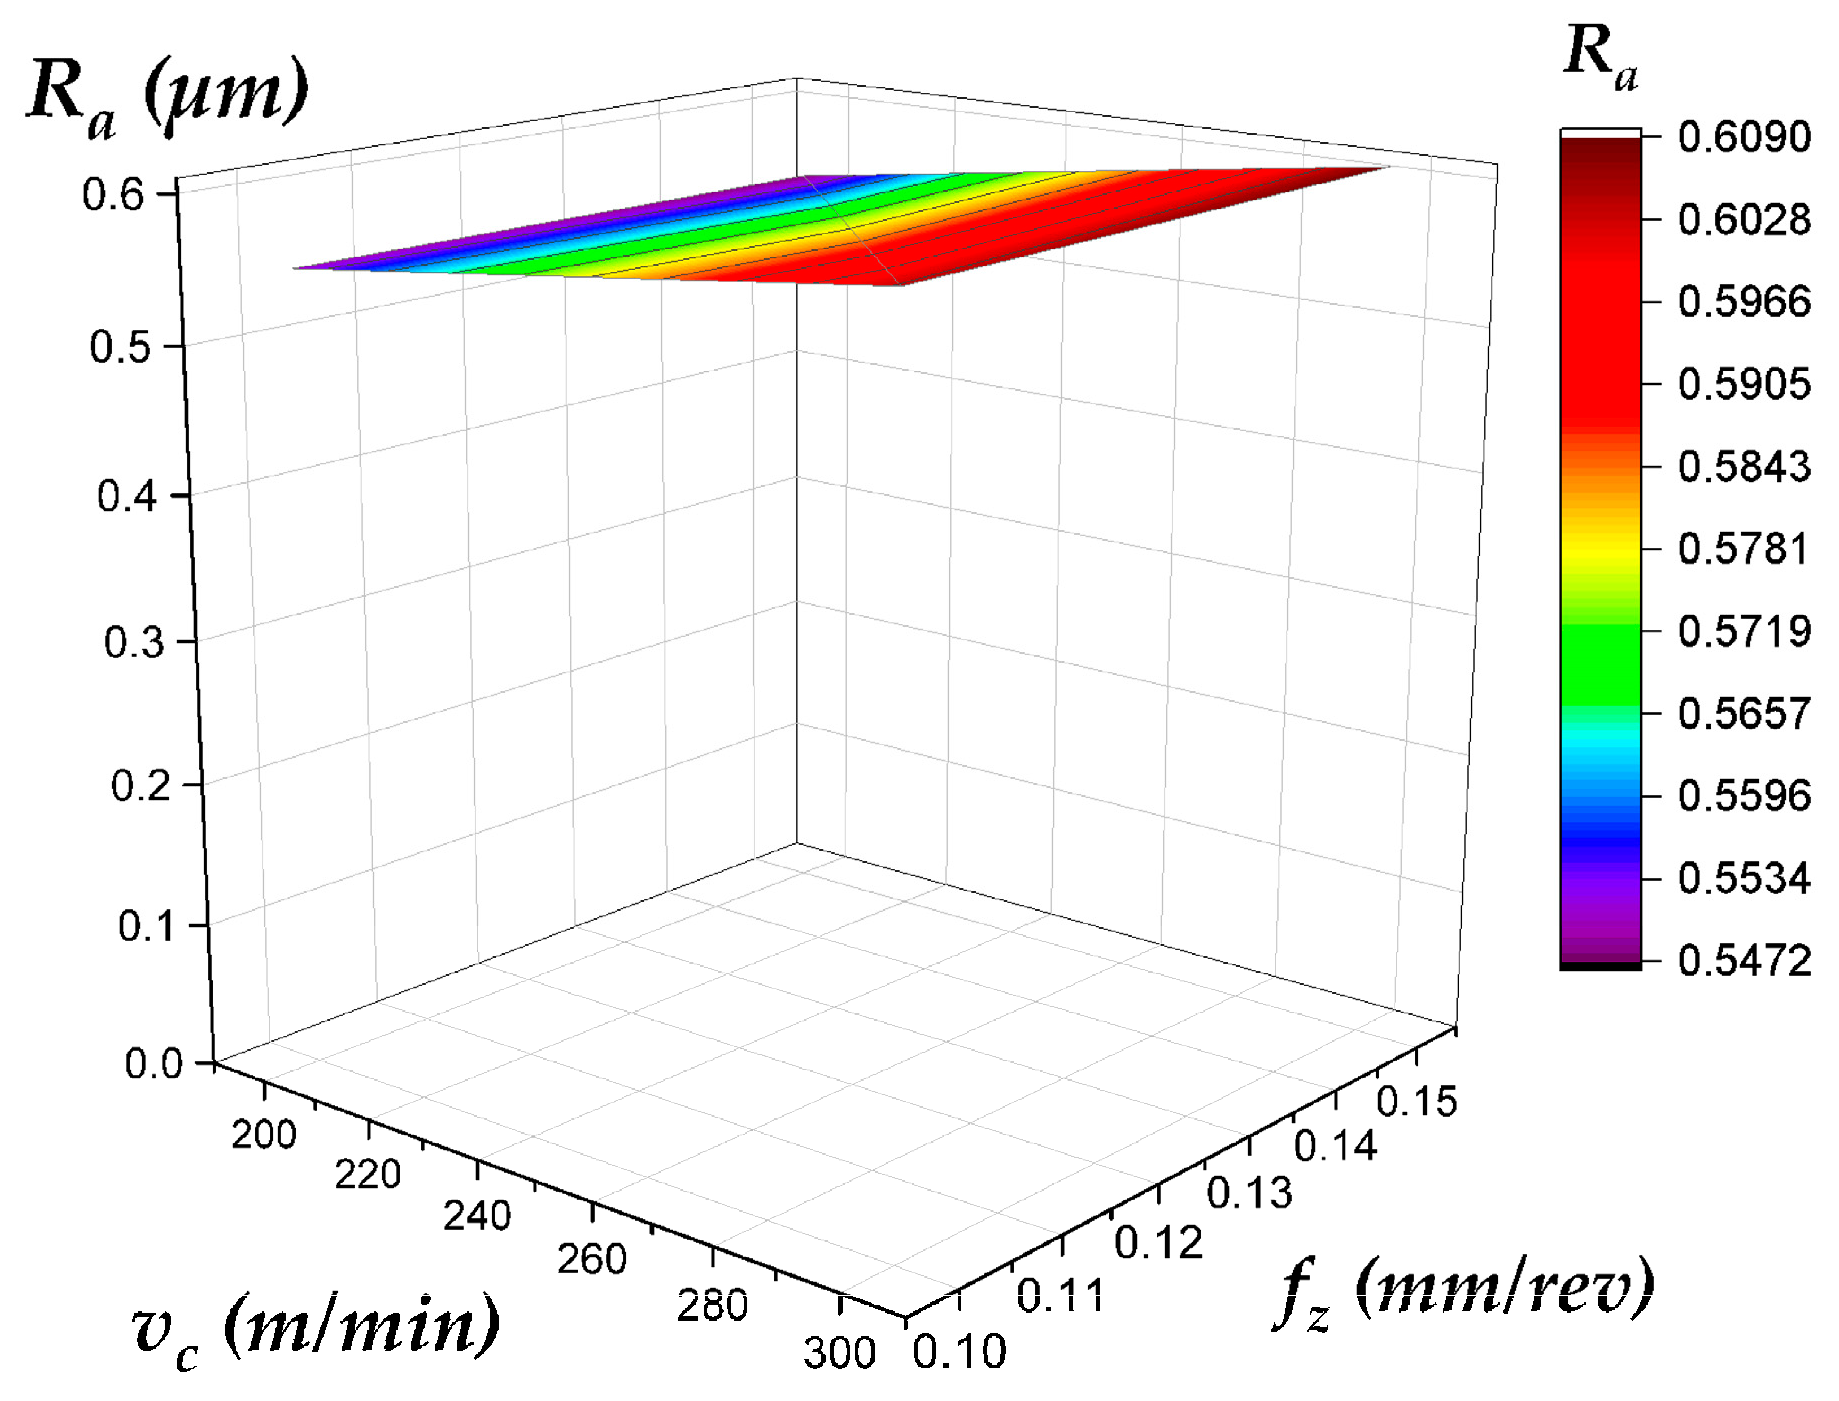
4.1.3. Study of the Top Surface Roughness

The following Figure 12 and Figure 13 present 3D surface plots detailing the evolution of surface roughness parameter (Ra) on the top surface adjacent to the machined feature. They compare plunge milling (top row) and face milling (bottom row) strategies at a constant axial depth of cut ( a p = 1 mm). The analysis reveals distinct topographical signatures from the interaction between cutting parameters ( v c , f z , and the specific milling process).
The average roughness R a (Figure 12) on the top surface during plunge milling demonstrates a strong inverse relationship with cutting speed ( v c ) and a positive relationship with feed per tooth ( f z ). R a values are minimized (≈0.1–0.2 µm) at high v c (300 mm/min) combined with low f z (0.10 mm/rev). Conversely, R a increases substantially, reaching maxima of approximately 1.0–1.2 µm under low v c (200 mm/min) and high f z (0.15 mm/rev) conditions.
In stark contrast to plunge milling, R a (Figure 13) on the top surface during face milling exhibits a positive correlation with cutting speed ( v c ) and an inverse correlation with feed per tooth ( f z ). The lowest R a values (≈0.1–0.2 µm) occur at low v c (200 mm/min) and high f z (0.15 mm/rev), while the highest values (≈0.7–0.78 µm) are observed at high v c (300 mm/min) and low f z (0.10 mm/rev). This counter-intuitive trend, particularly regarding f z , likely reflects complex interactions at the tool edge/corner that interface with the top surface during face milling kinematics.
It is worth noting that the observed differences in Ra on the top surface between plunge and face milling reflect distinct tool engagement mechanics inherent to each strategy. In plunge milling, the tool moves axially into the material, which promotes end cutting and results in more prominent entry marks and scallop formations on the top surface—particularly under lower cutting speeds and higher feed rates. In contrast, face milling predominantly involves peripheral engagement, generating a smoother, sweeping motion across the surface. To ensure that these differences were not caused by tool positioning or setup inconsistencies, rigorous alignment procedures were followed before each trial. Tool runout was measured and minimized using a dial indicator, and the tool length offset was calibrated using a high-precision tool setter. The workpiece was clamped using vibration-dampening pads, and its positioning was verified with a touch probe. These measures helped eliminate misalignment artifacts, ensuring that the measured roughness values are primarily attributable to the distinct tool–workpiece interaction mechanics of each milling strategy. Therefore, the comparative behavior of Ra is interpreted as a result of intrinsic kinematic differences rather than mechanical setup discrepancies.
The influence of cutting parameters on R a is opposed between the two methods for the top surface. Plunge milling R a increases with lower v c and higher f z , while face milling R a increases with higher v c and lower f z . Plunge milling produces a higher maximum R a (≈1.2 µm) than face milling (≈0.78 µm) under the tested conditions.
The stark contrasts observed in the evolution of R a between plunge and face milling—and between the side wall and top surfaces for each process—underscore the fundamental differences in their respective tool engagement kinematics and chip formation mechanisms at a p = 1 mm. Plunge milling, characterized by axial feed, causes the tool’s periphery and end cutting edges to interact differently with the side wall and top surface. The results suggest that interaction with the top surface at lower speeds and higher feeds leads to significant material removal or peak formation, reflected in elevated R a values. Side wall roughness appears influenced by both cutting speed ( v c ) and feed per tooth ( f z ), likely related to the cutting action of the peripheral tool edges. In contrast, face milling primarily involves radial engagement, where the tool corners and peripheral edges dominate the cutting action. The strong dependence of side wall R a on f z is consistent with classical milling theory. Meanwhile, the observed inverse relationship between the top surface R a and f z may result from specific tool corner geometry effects, wiping actions, or chip flow behavior associated with face milling on flat surfaces.
The interaction between the cutting tool and the adjacent top surface during milling is critical, influencing residual stresses, part aesthetics, and potential stress concentration sites. This analysis compares the topographical characteristics, specifically the R a parameter, generated on the top surface by plunge milling (Figure 14) and face milling (Figure 15) strategies when operating at an increased axial depth of cut ( a p = 1.5 mm). Understanding these effects is essential for controlling surface quality in features involving both axial and radial cutting actions.
Consistent with observations at lower depths, R a (Figure 14) on the top surface during plunge milling exhibits an inverse relationship with cutting speed ( v c ) and a positive relationship with feed per tooth ( f z ). R a decreases as v c increases and increases as f z increases. Values range from a minimum of ≈0.13 µm at high v c (300 mm/min)/low f z (0.10 mm/rev) to a maximum of ≈0.78 µm at low v c (200 mm/min)/high f z (0.15 mm/rev). Like the behavior observed at a p = 1 mm, face milling R a (Figure 15) on the top surface at a p = 1.5 mm shows a positive correlation with cutting speed ( v c ) and an inverse correlation with feed ( f z ). R a increases as v c increases and decreases as f z increases. The minimum R a (≈0.13 µm) occurs at low v c /high f z , while the maximum (≈0.78 µm) occurs at high v c /low f z . Notably, the range of R a values is very similar to that produced by plunge milling, but the controlling parameter effects are reversed.
Although both plunge and face milling produce a similar range of R a values (≈0.13–0.78 µm) on the top surface at this depth in Figure 15, the underlying parametric dependencies are opposite. Plunge milling R a is minimized at high v c /low f z , while face milling R a is minimized at low v c /high f z . Achieving a smooth top surface requires fundamentally different parameter strategies depending on the chosen milling process.
As a result, the comparative analysis at a p = 1.5 mm underscores that increasing the depth of cut accentuates the inherent differences between the plunge and face milling strategies regarding surface generation. The complex behavior of plunge milling on the side wall suggests intricate tool engagement dynamics involving both peripheral and end cutting edges under increased axial load. The monotonic trends in face milling for side wall roughness ( R a ) indicate more predictable and potentially less favorable outcomes at higher parameters due to the dominant peripheral cutting action. The persistent dichotomy on the top surface (opposing R a trends) highlights fundamental differences in how the tool interacts with the adjacent material plane. Plunge milling’s interaction appears dominated by effects linked to axial feed ( f z ) and speed ( v c ), leading to peak formation. Face milling’s interaction consistently produces valleys, potentially due to tool corner geometry, wiping effects, or chip evacuation mechanisms becoming more pronounced at greater depths while maintaining a stable surface roughness profile.

4.1.4. Comparative Analysis of Plunge and Face Milling

The analysis reveals distinct and often contrasting influences of depth of cut ( a p ), cutting speed ( v c ), and feed per tooth ( f z ) on surface topography ( R a ) when comparing plunge and face milling strategies.
1.
Effect of Depth of Cut (ap):
Increasing the depth of cut in plunge milling significantly altered the side wall response, transitioning R a dependencies on cutting speed ( v c ) and feed per tooth ( f z ) from relatively simple (at a p = 1 mm) to complex/non-monotonic (at a p = 1.5 mm). On the top surface, increasing a p did not change the qualitative inverse relationship of R a with v c or the positive relationship with f z . The increased depth intensified the side wall roughness generation, making R a strongly dependent on both v c and f z (monotonically growing). This led to a significantly higher maximum R a compared to a p = 1 mm. Like plunge milling, increasing a p did not alter the fundamental relationships observed on the top surface: R a increased with v c and decreased with f z . As a result, increasing the depth of cut had a more complexifying effect on the side wall generation in plunge milling compared to face milling. In contrast, face milling side walls became significantly rougher under high v c / f z conditions at greater depths. Top surface characteristic trends remained robust to the change in both processes, maintaining their distinct R a signatures.
2.
Effect of Cutting Speed (vc):
Starting with plunge milling, the top surface R a generally decreased (indicating an improved finish and fewer peaks) at both depths. Its effect on the side wall R a was positive at a p = 1 mm but more complex at a p = 1.5 mm. Higher cutting speed ( v c ) tended to decrease side wall R a , producing more rounded profiles. In contrast, the top surface R a in face milling increased at both depths. The effect on the side wall R a shifted from minor at a p = 1 mm to strongly positive at a p = 1.5 mm. Higher v c tended to decrease side wall R a . On the top surface, R a was generally insensitive to changes in v c . Thus, the effect of v c on top surface R a differed between plunge milling (+ v c decreases R a ) and face milling (+ v c increases R a ). Its influence on the side wall R a also varied significantly, especially as the depth of cut increased.
3.
Effect of Feed per tooth (fz):
In plunge milling, R a consistently increased on the top surface (indicating a poorer finish, more peaks, and a spikier profile) at both depths. Its effect on the side wall R a was positive at a p = 1 mm but more complex at a p = 1.5 mm. However, in face milling, the top surface R a consistently decreased at both depths (counter-intuitive). The side wall R a increased significantly in face milling, especially at a p = 1 mm. The effect of feed per tooth ( f z ) on the top surface R a differed between the two processes: in plunge milling, higher f z increased R a , while in face milling, higher f z decreased R a . Feed per tooth is a primary driver for increasing side wall roughness in face milling and increasing all the surface roughness parameters on the top surface in plunge milling.

4.2. Evaluation of the Cutting Force

4.2.1. Statistical Analysis of the Cutting Forces

The effect of varying operational parameters (such as depth of cut, speed, and feed rate) on the three-dimensional cutting force components (Fx, Fy, and Fz) was analyzed using nonparametric statistical tests. The nonparametric statistical Kruskal–Wallis (H) (Table 5) test was used to determine whether there were significant differences in cutting forces across different parameter levels.
All three cutting parameters—depth of cut ( a p ), cutting speed ( v c ), and feed per tooth ( f z )—significantly influenced the radial cutting force (Fx) in both plunge and face milling, indicating robust sensitivity to operational conditions. However, radial cutting force (Fx) variations were more pronounced in plunge milling due to greater tool–workpiece engagement. For the tangential cutting force (Fy), both milling methods were sensitive to a p and f z . Still, only plunge milling showed a significant dependence on v c , reflecting its dynamic lateral tool engagement, while face milling maintained a more stable force profile. Axial cutting force (Fz) in plunge milling showed significant effects from f z and v c , with no impact from a p , suggesting that axial forces depend more on feed and speed. Conversely, only cutting speed significantly affects axial cutting force (Fz) in face milling, highlighting a fundamental difference in how each strategy distributes mechanical loads.

4.2.2. Alterations of the Radial Cutting Force

To illustrate the complex relationships between cutting parameters and force components in plunge and face milling, 3D surface plots were generated using Origin 2025. These visualizations show how the depth of cut, cutting speed, and feed per tooth affect the magnitude and distribution of forces (Fx, Fy, and Fz). By varying two inputs while holding the third constant, dominant effects and interactions become easier to interpret in Figure 16. This approach enhances the clarity of statistical findings and supports more practical insights for process optimization and predictive modeling.
Accurately predicting cutting forces is key to optimizing machining performance and preventing tool or machine damage. This section analyzes the radial cutting force (Fx) component under different cutting speeds, feeds, and depths of cut ( a p = 1 mm and 1.5 mm), comparing plunge and face milling as shown in Figure 16. Though the exact interpretation of radial cutting force (Fx) depends on the setup, examining its behavior offers valuable insights into tool engagement and cutting mechanics.
A striking difference is the overall magnitude of radial cutting force (Fx). Under comparable cutting conditions ( v c , f z , and a p ), plunge milling consistently generates significantly higher radial cutting force (Fx) values than face milling. For example, at a = 1.5 mm, the maximum radial cutting force (Fx) in plunge milling (≈91 N) is considerably larger than the maximum in face milling (≈69 N). This difference is even more pronounced at a = 1 mm. Both processes clearly show that feed per tooth ( f z ) is the dominant factor influencing radial cutting force (Fx), which is directly related to the undeformed chip thickness. The effect of v c on radial cutting force (Fx) is subtle but qualitatively different between the two processes. Plunge milling shows a slight decrease in radial cutting force (Fx) with increasing v c , potentially attributable to thermal softening effects at higher speeds, reducing material resistance. Face milling shows a negligible to moderate increase in radial cutting force (Fx) with increasing v c , which might be linked to strain rate effects or frictional characteristics specific to the face milling engagement kinematics dominating over thermal softening concerning this force component. Both processes exhibit a strong positive correlation between radial cutting force (Fx) and the depth of cut ( a p ), as expected due to the increased material removal volume and tool engagement. The relative increase in radial cutting force (Fx) when doubling a p appears substantial for both, perhaps slightly more pronounced in face milling in relative terms but starting from a lower base.
The higher radial cutting force (Fx) in plunge milling likely results from the combined engagement of end and peripheral edges, producing strong radial forces due to axial feeding. Radial cutting force (Fx) may reflect outward tool pressure against the bore. Its strong dependence on f z is expected, as f z controls chip load. The slight radial cutting force (Fx) decrease with v c aligns with thermal softening effects at higher speeds. In face milling, cutting is mainly radial via peripheral edges and tool corners, yielding lower radial cutting force (Fx) values. Again, radial cutting force (Fx) correlates strongly with f z . The slight radial cutting force (Fx) increase with v c may stem from friction or strain rate hardening, outweighing softening effects. The significant rise in radial cutting force (Fx) with increasing depth of cut ( a p ) in both methods reflects greater material removal per tooth and larger tool–workpiece contact.

4.2.3. Study of the Tangential Cutting Force

Continuing the investigation of cutting force components, this section focuses on the tangential cutting force (Fy) force, typically representing the force component perpendicular to radial cutting force (Fx) in the machining plane (often aligned with the feed direction in conventional milling or tangential force, depending on coordinate system definition). Analyzing tangential cutting force (Fy) is crucial as it directly relates to the power required for cutting and influences surface generation and tool wear. Figure 17 presents the behavior of tangential cutting force (Fy) during plunge milling and face milling under varying cutting speeds ( v c ), feeds per tooth ( f z ), and axial depths of cut ( a p = 1 mm and 1.5 mm) in Figure 17. At a p = 1 mm, plunge milling generates substantially higher tangential cutting force (Fy) forces (45–120 N) than face milling (41–52 N). However, due to the anomalous decrease in plunge milling tangential cutting force (Fy) and the increase in face milling tangential cutting force (Fy) with depth, the situation at a = 1.5 mm becomes more complex: face milling tangential cutting force (Fy) (26–71 N) is generally higher than plunge milling tangential cutting force (Fy) (25–90 N) at lower feeds, but plunge milling reaches a higher peak of tangential cutting force (Fy) at the highest feed. Feed per tooth ( f z ) appears to be the dominant factor increasing tangential cutting force (Fy) for both processes, though the sensitivity seems higher in plunge milling at a p = 1 mm.
Both processes exhibit a similar, relatively weak decreasing trend in tangential cutting force (Fy) with increasing v c . This consistency suggests that mechanisms like thermal softening might similarly affect this force component regardless of the overall kinematic strategy.
Tangential cutting force (Fy), closely linked to tangential cutting force and cutting power, is primarily influenced by feed per tooth ( f z ) due to its direct impact on chip thickness. Its slight decline with increasing speed ( v c ) in both milling types likely reflects thermal softening effects. Higher tangential cutting force (Fy) in plunge milling at a p = 1 mm may result from the combined end and peripheral cutting. However, the unexpected drop in tangential cutting force (Fy) with increased depth in plunge milling is unusual and may stem from chip flow changes, tool geometry, or even experimental errors. In contrast, the rise in tangential cutting force (Fy) for face milling with depth aligns with expectations due to greater material removal and tool engagement, with increased variability at a p = 1.5 mm, suggesting a higher sensitivity to parameters.

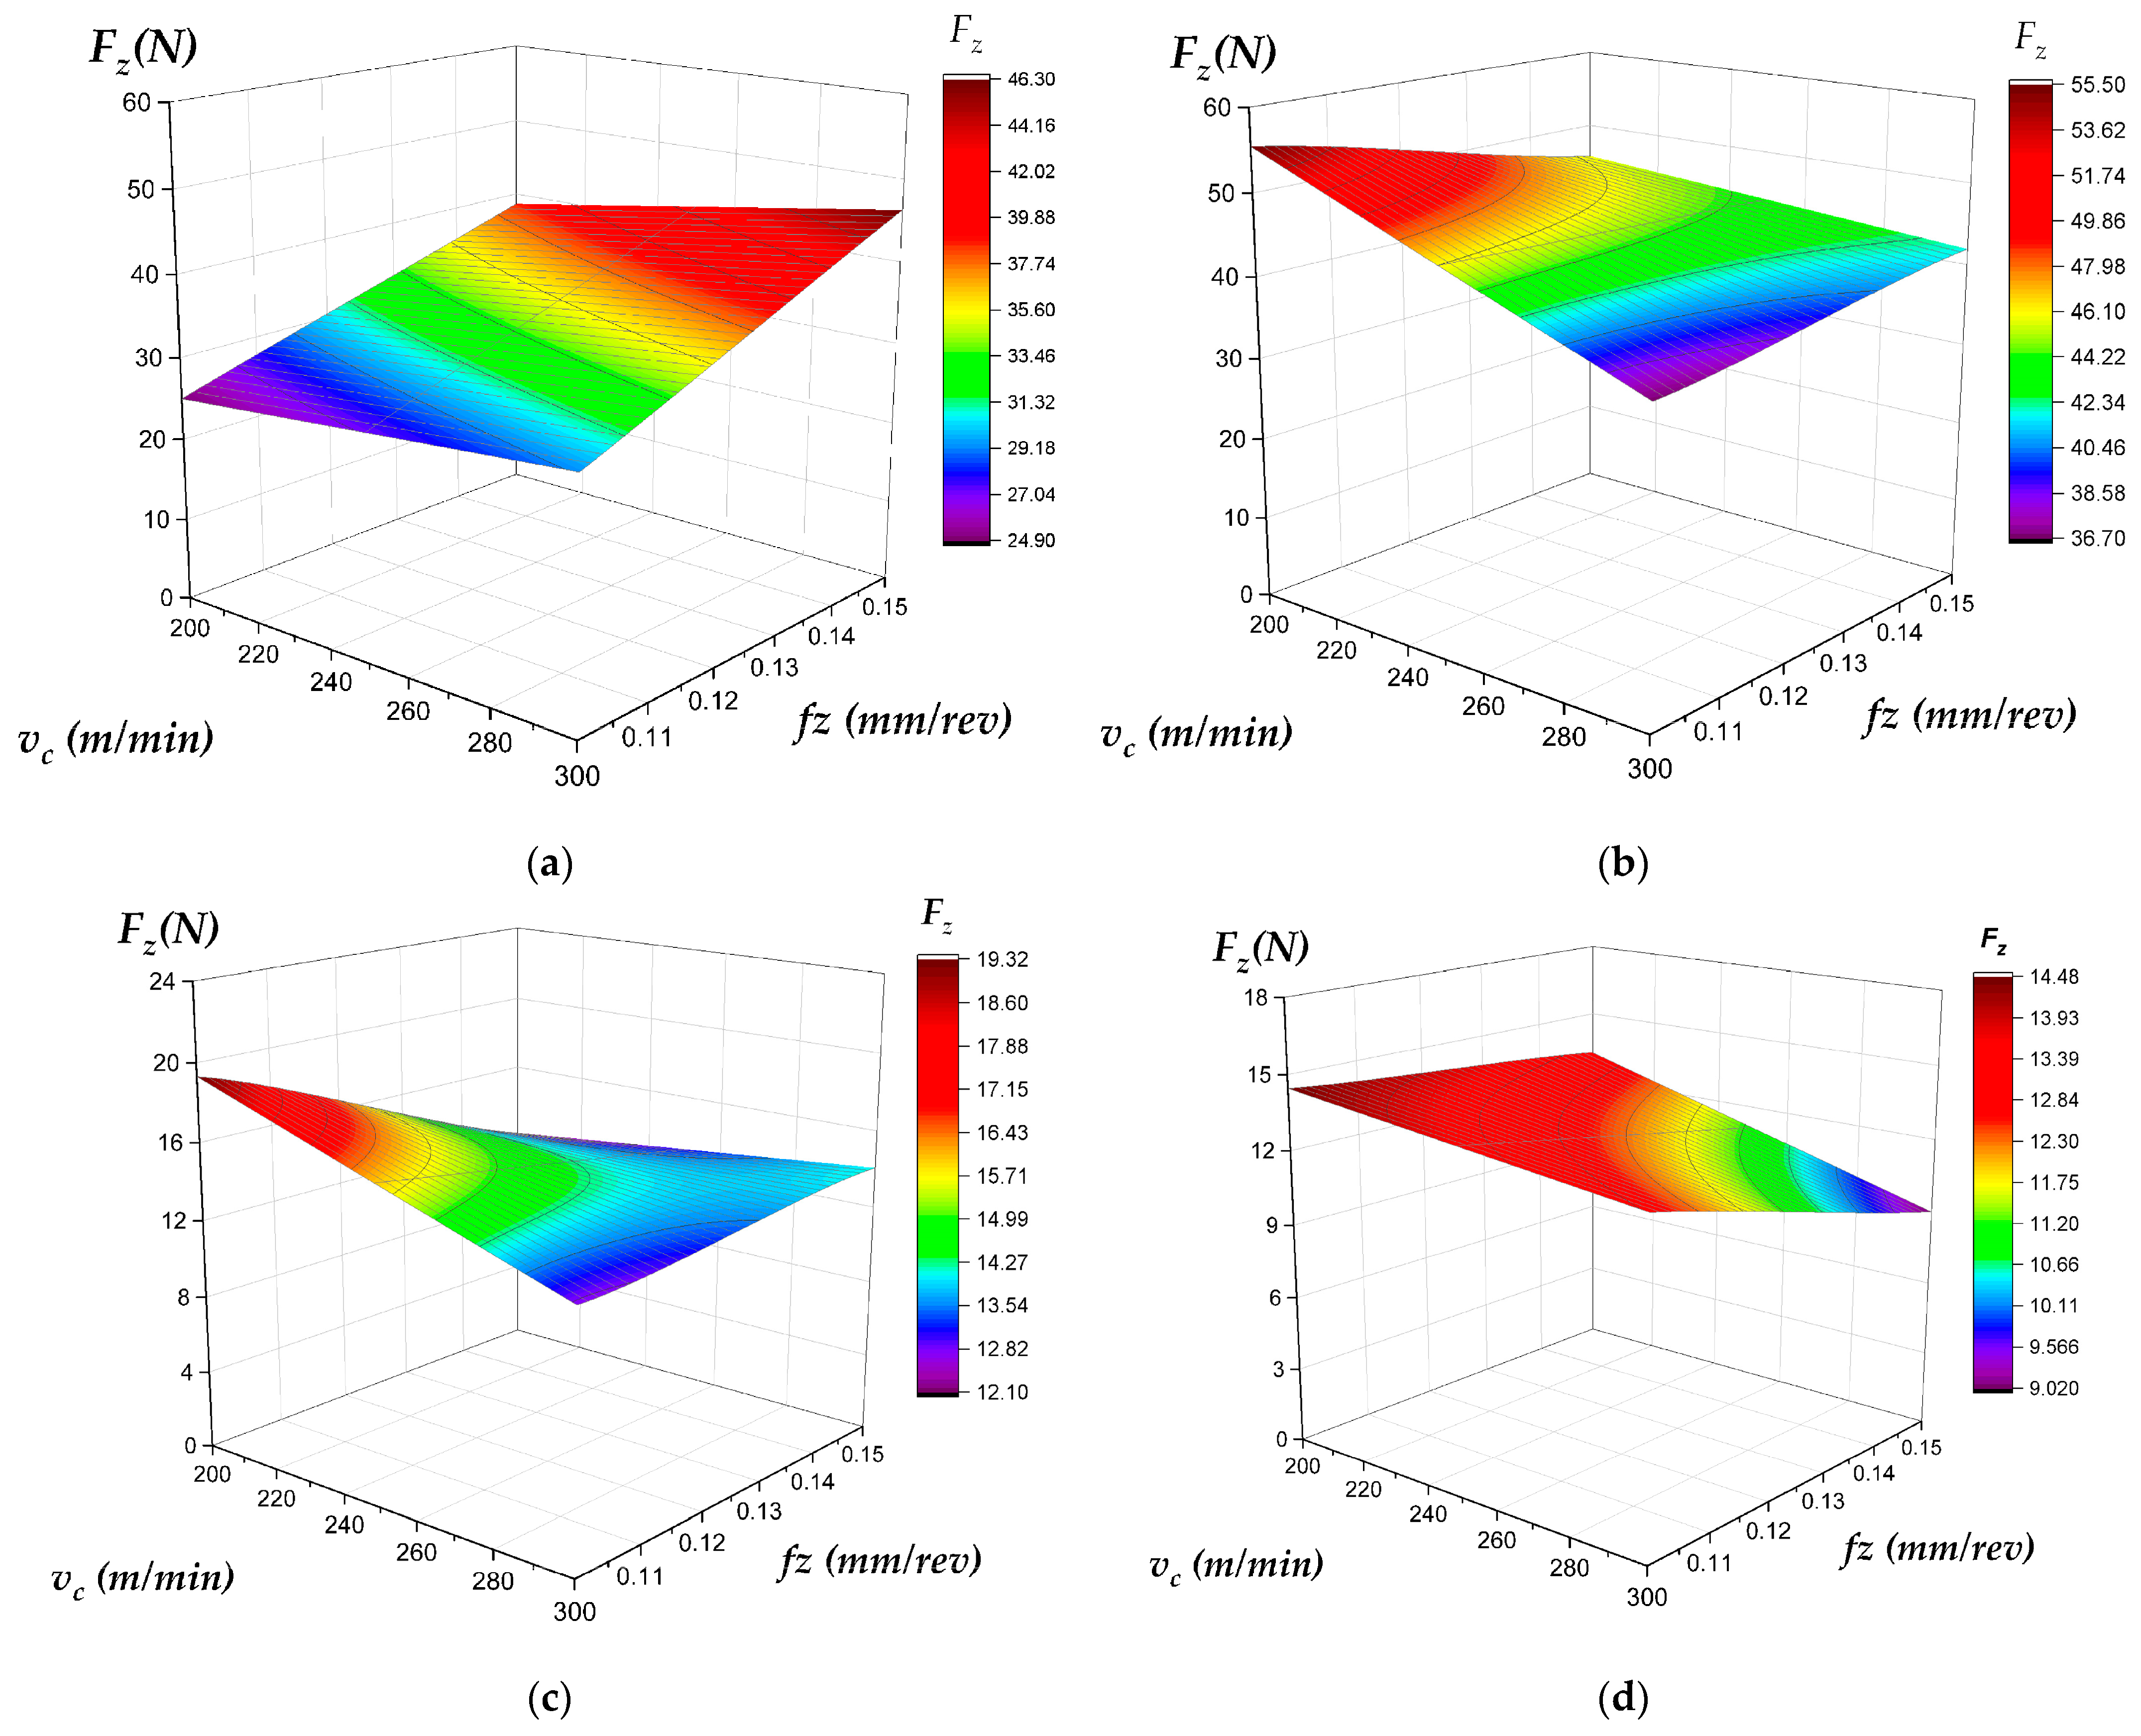
4.2.4. Analysis of the Axial Cutting Force

The axial cutting force (Fz) acting parallel to the tool’s rotational axis is a critical parameter in milling operations. It governs the thrust load on spindle bearings, influences the potential for tool deflection or workpiece bending (especially in thin sections), and can affect process stability. This section analyzes the behavior of axial cutting force (Fz), as presented in Figure 18, comparing plunge milling and face milling strategies under varying cutting speeds ( v c ), feeds per tooth ( f z ), and axial depths of cut ( a p = 1 mm and 1.5 mm).
Plunge milling consistently generates significantly higher axial cutting forces (Fz) (overall range ≈ 25–56 N) than face milling (overall range ≈ 9–19 N) across all the tested conditions. This difference is substantial, often by a factor of 2–3. Feed per tooth ( f z ) is the primary factor increasing axial cutting force (Fz) in both processes, though the sensitivity appears greater in plunge milling. The effect of v c is relatively subtle but qualitatively different: slightly increasing axial cutting force (Fz) in plunge milling versus distinctly decreasing axial cutting force (Fz) in face milling. The most striking contrast of the depth of cut lies here. Increasing a p leads to the expected increase in axial cutting force (Fz) for plunge milling but an anomalous decrease in axial cutting force (Fz) for face milling according to Figure 18c,d. The significantly higher axial cutting force (Fz) in plunge milling aligns with its axial feed direction and active end-edge engagement, with increases in f z and logically boosting axial force. A slight rise in speed ( v c ) may relate to tool geometry or material interactions. In face milling, axial forces are secondary and generally lower, likely due to helix angles, tool runout, or chip interference.
Axial cutting force (Fz) increases with f z but typically decreases with v c , possibly due to thermal effects. However, the observed drop in axial cutting force (Fz) with greater depth ( a p ) in face milling is counter-intuitive and may reflect an anomaly in data collection or figure representation. The significantly higher axial cutting force (Fz) in plunge milling is not merely a numerical difference; it has direct practical implications. This high thrust load requires a machine tool with high spindle bearing stiffness and a robust workpiece clamping system. Consequently, plunge milling may be unsuitable for machining thin-walled components, where it could cause part deflection and dimensional inaccuracies, or for use on older, less rigid machines where it could accelerate spindle wear.

5. Conclusions

To better understand how milling strategies affect surface integrity, surface roughness (Ra) was analyzed on shoulder milling side walls and top surfaces at two depths of cut using plunge and face milling. The results showed that Ra varied notably with milling type and surface location, even under identical conditions. These differences stem from variations in tool engagement, chip evacuation, and loading dynamics, highlighting the need for surface- and strategy-specific parameter optimization in precision machining. The comparative analysis of Ra is shown below:
  • Plunge and face milling generate fundamentally distinct surface roughness characteristics, with differences often accentuated by increasing the cutting depth. Key contrasts include the following:
  • Parameter Control: Achieving minimum Ra requires opposing parameter strategies on the top surface and different approaches on the side wall (as observed in Figure 8, Figure 9, Figure 10, Figure 11, Figure 12, Figure 13, Figure 14 and Figure 15), both of which change with increasing depth of cut.
  • Topography Variation: Even under identical cutting conditions, plunge and face milling produce different Ra trends (Figure 7) due to variations in tool engagement mechanics, chip evacuation, and dynamic load behavior.
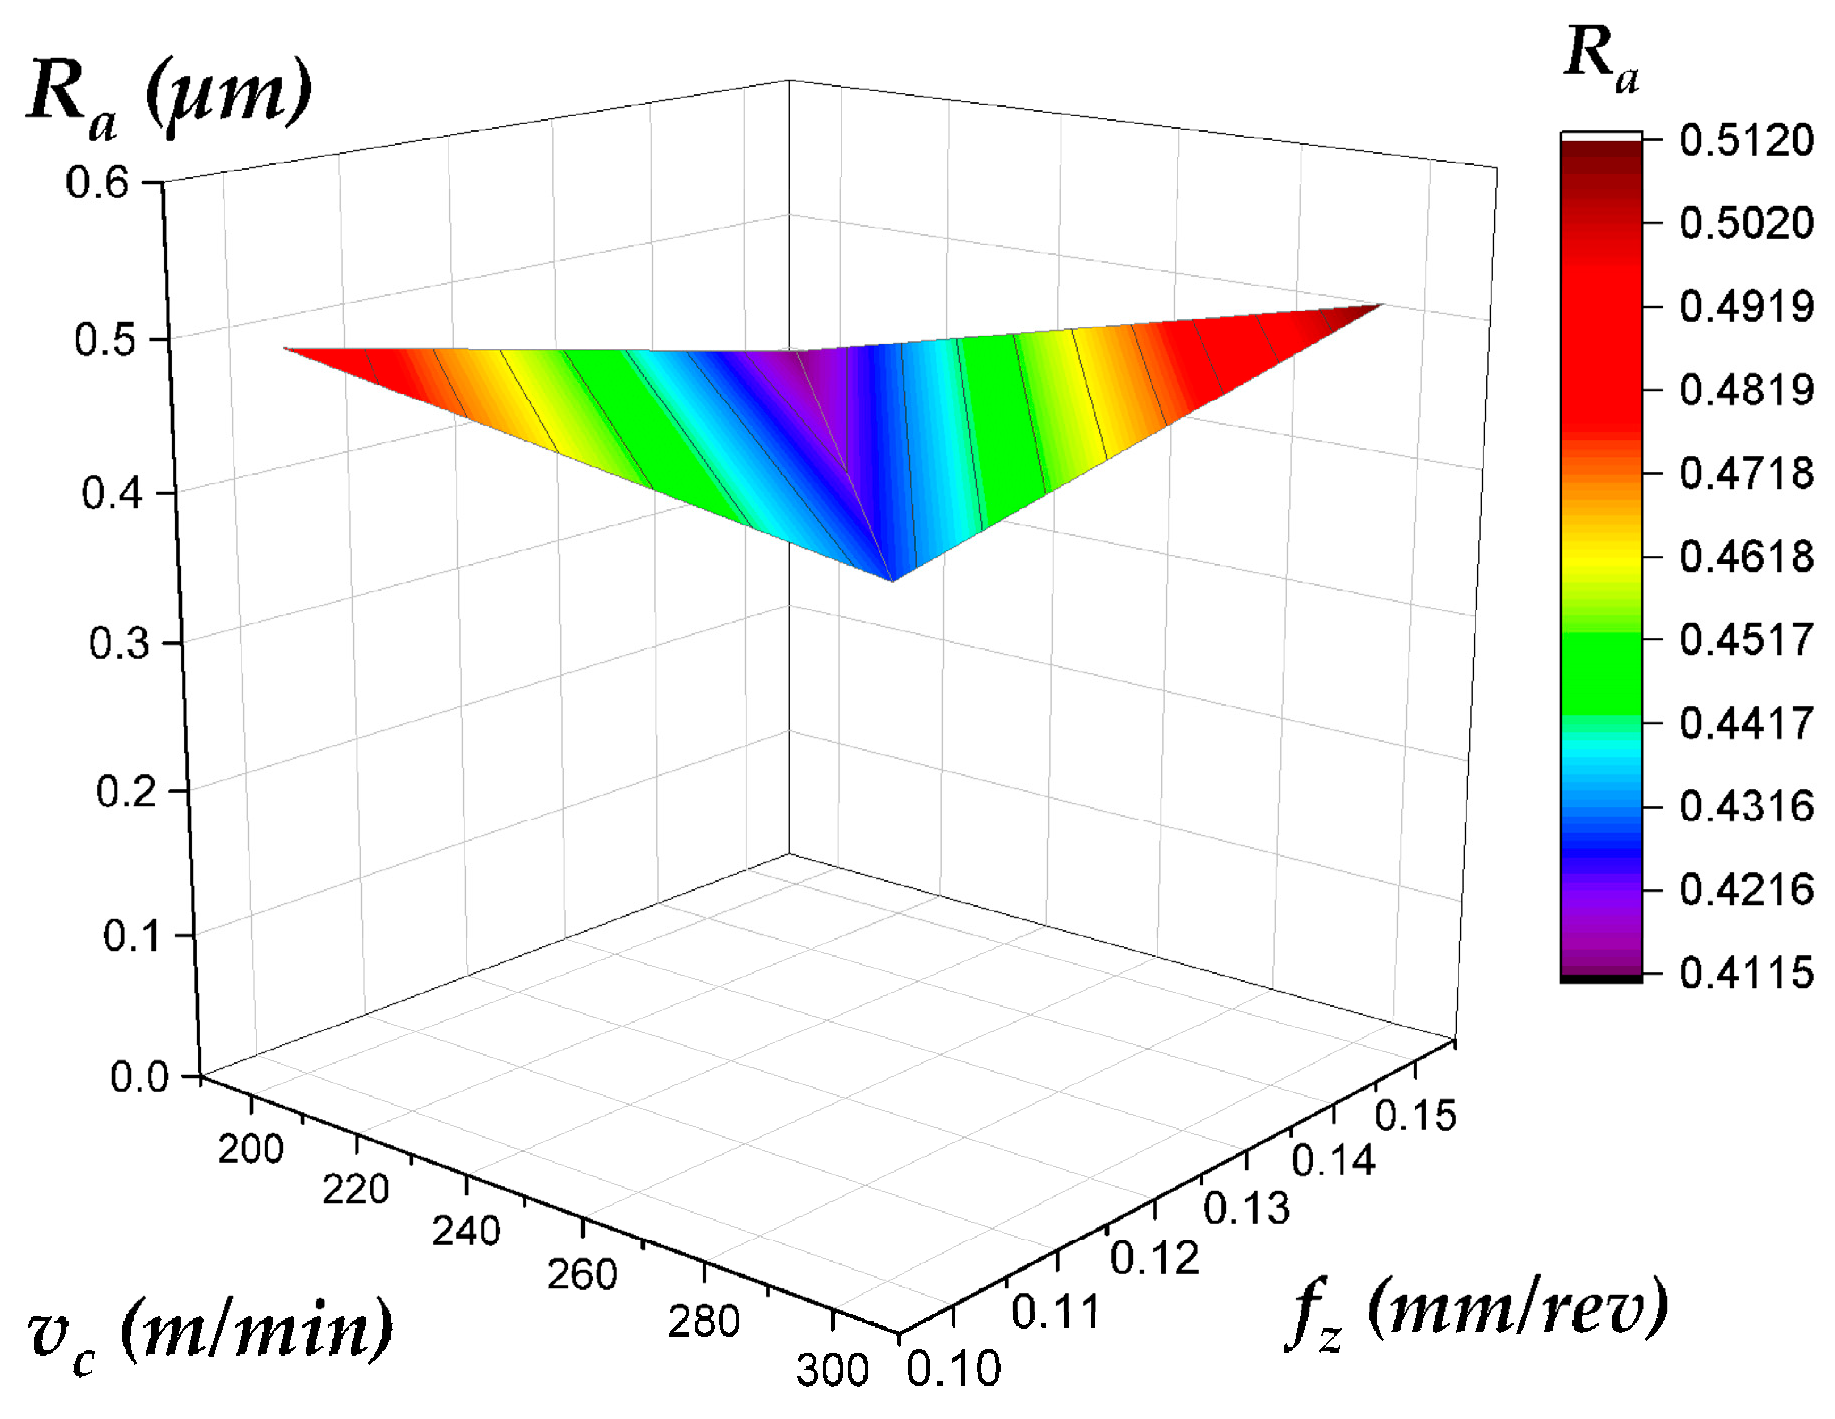
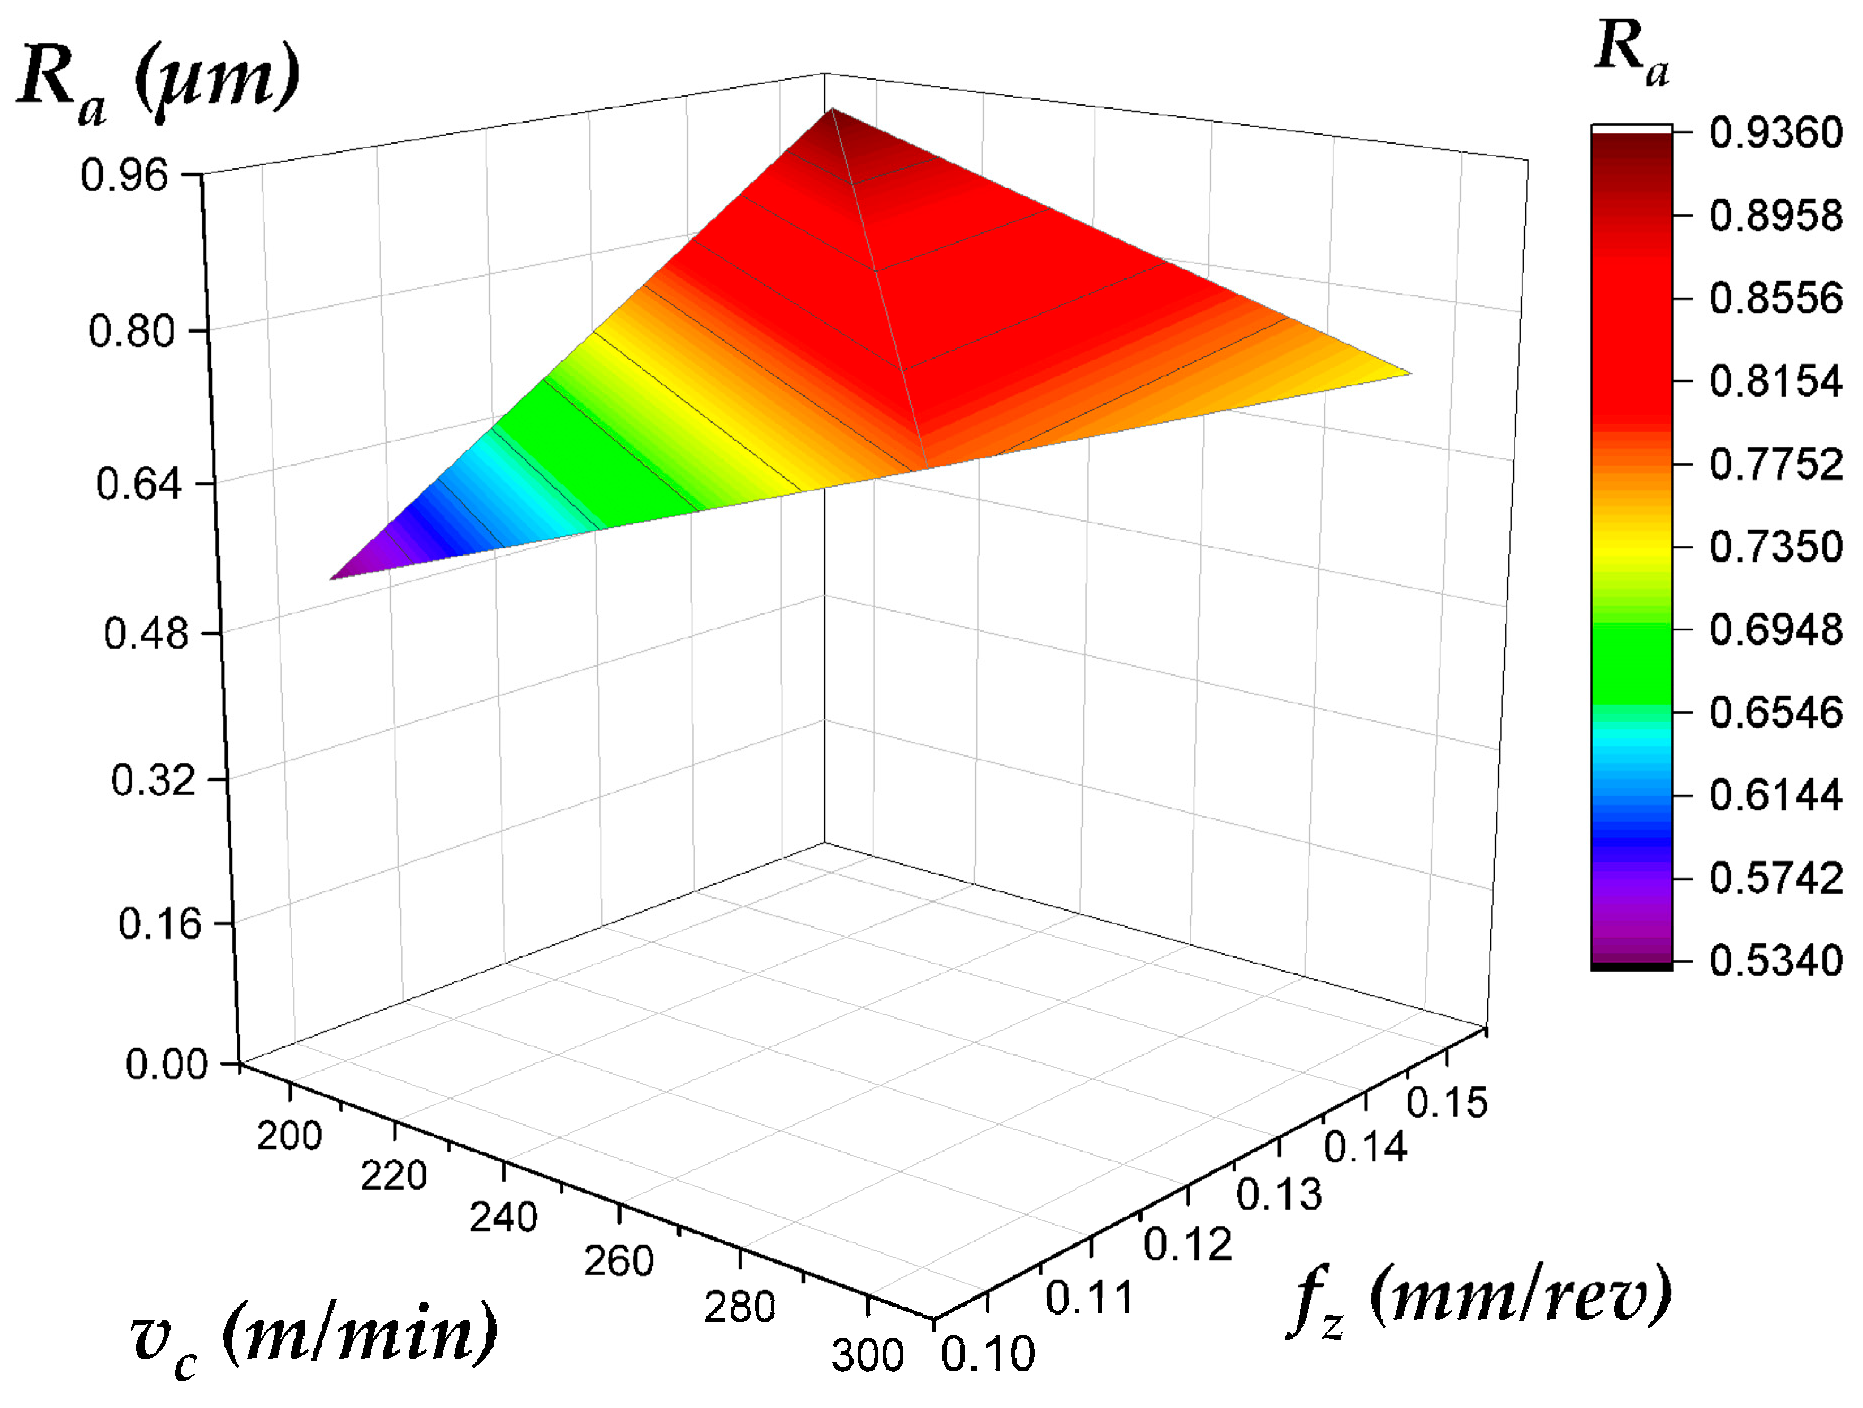
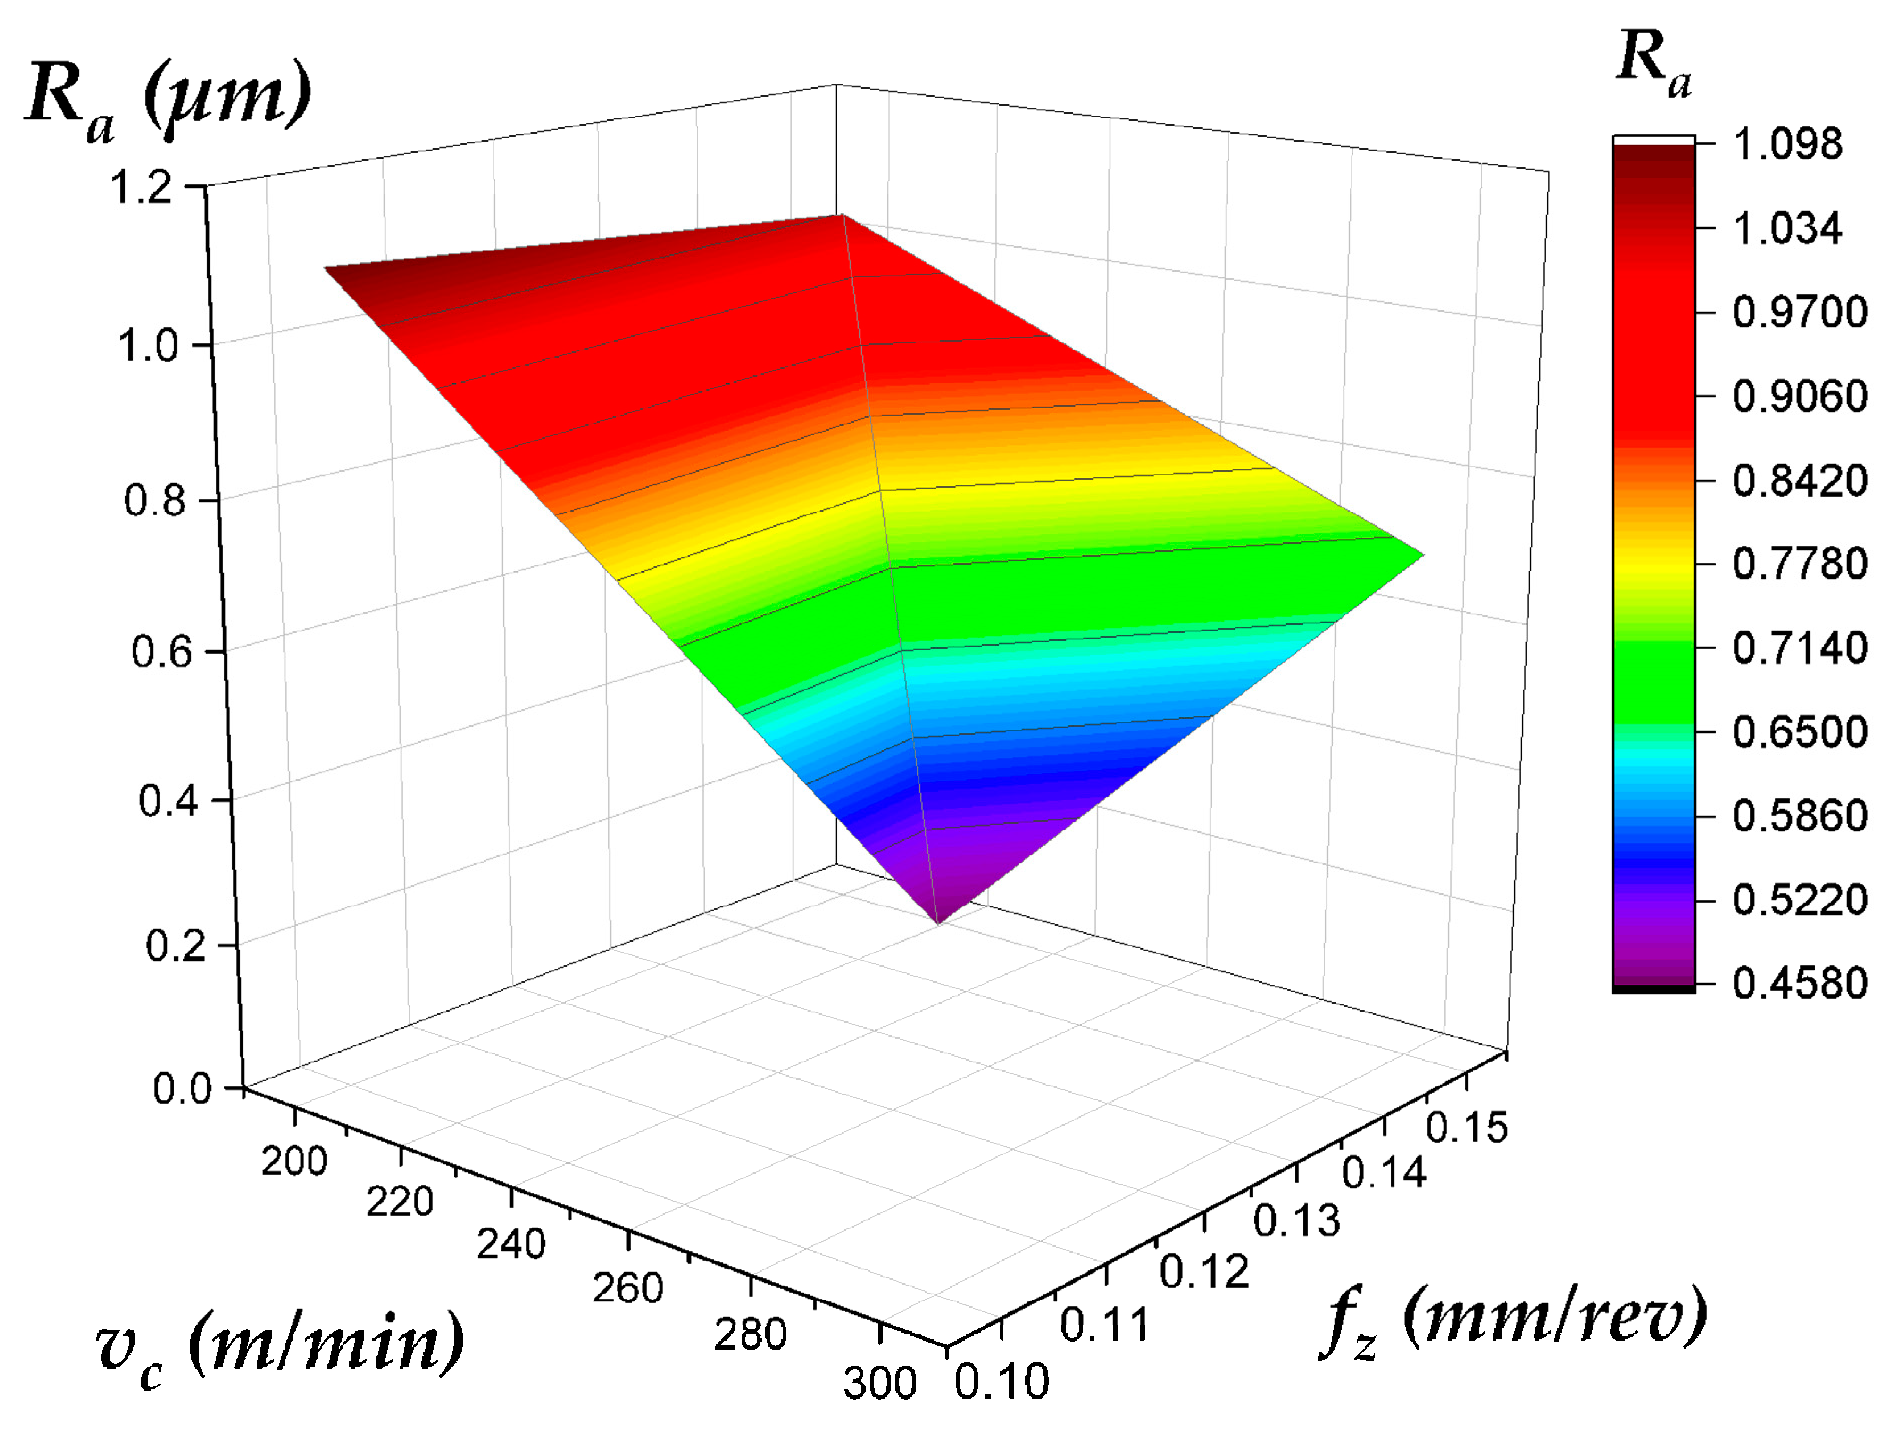
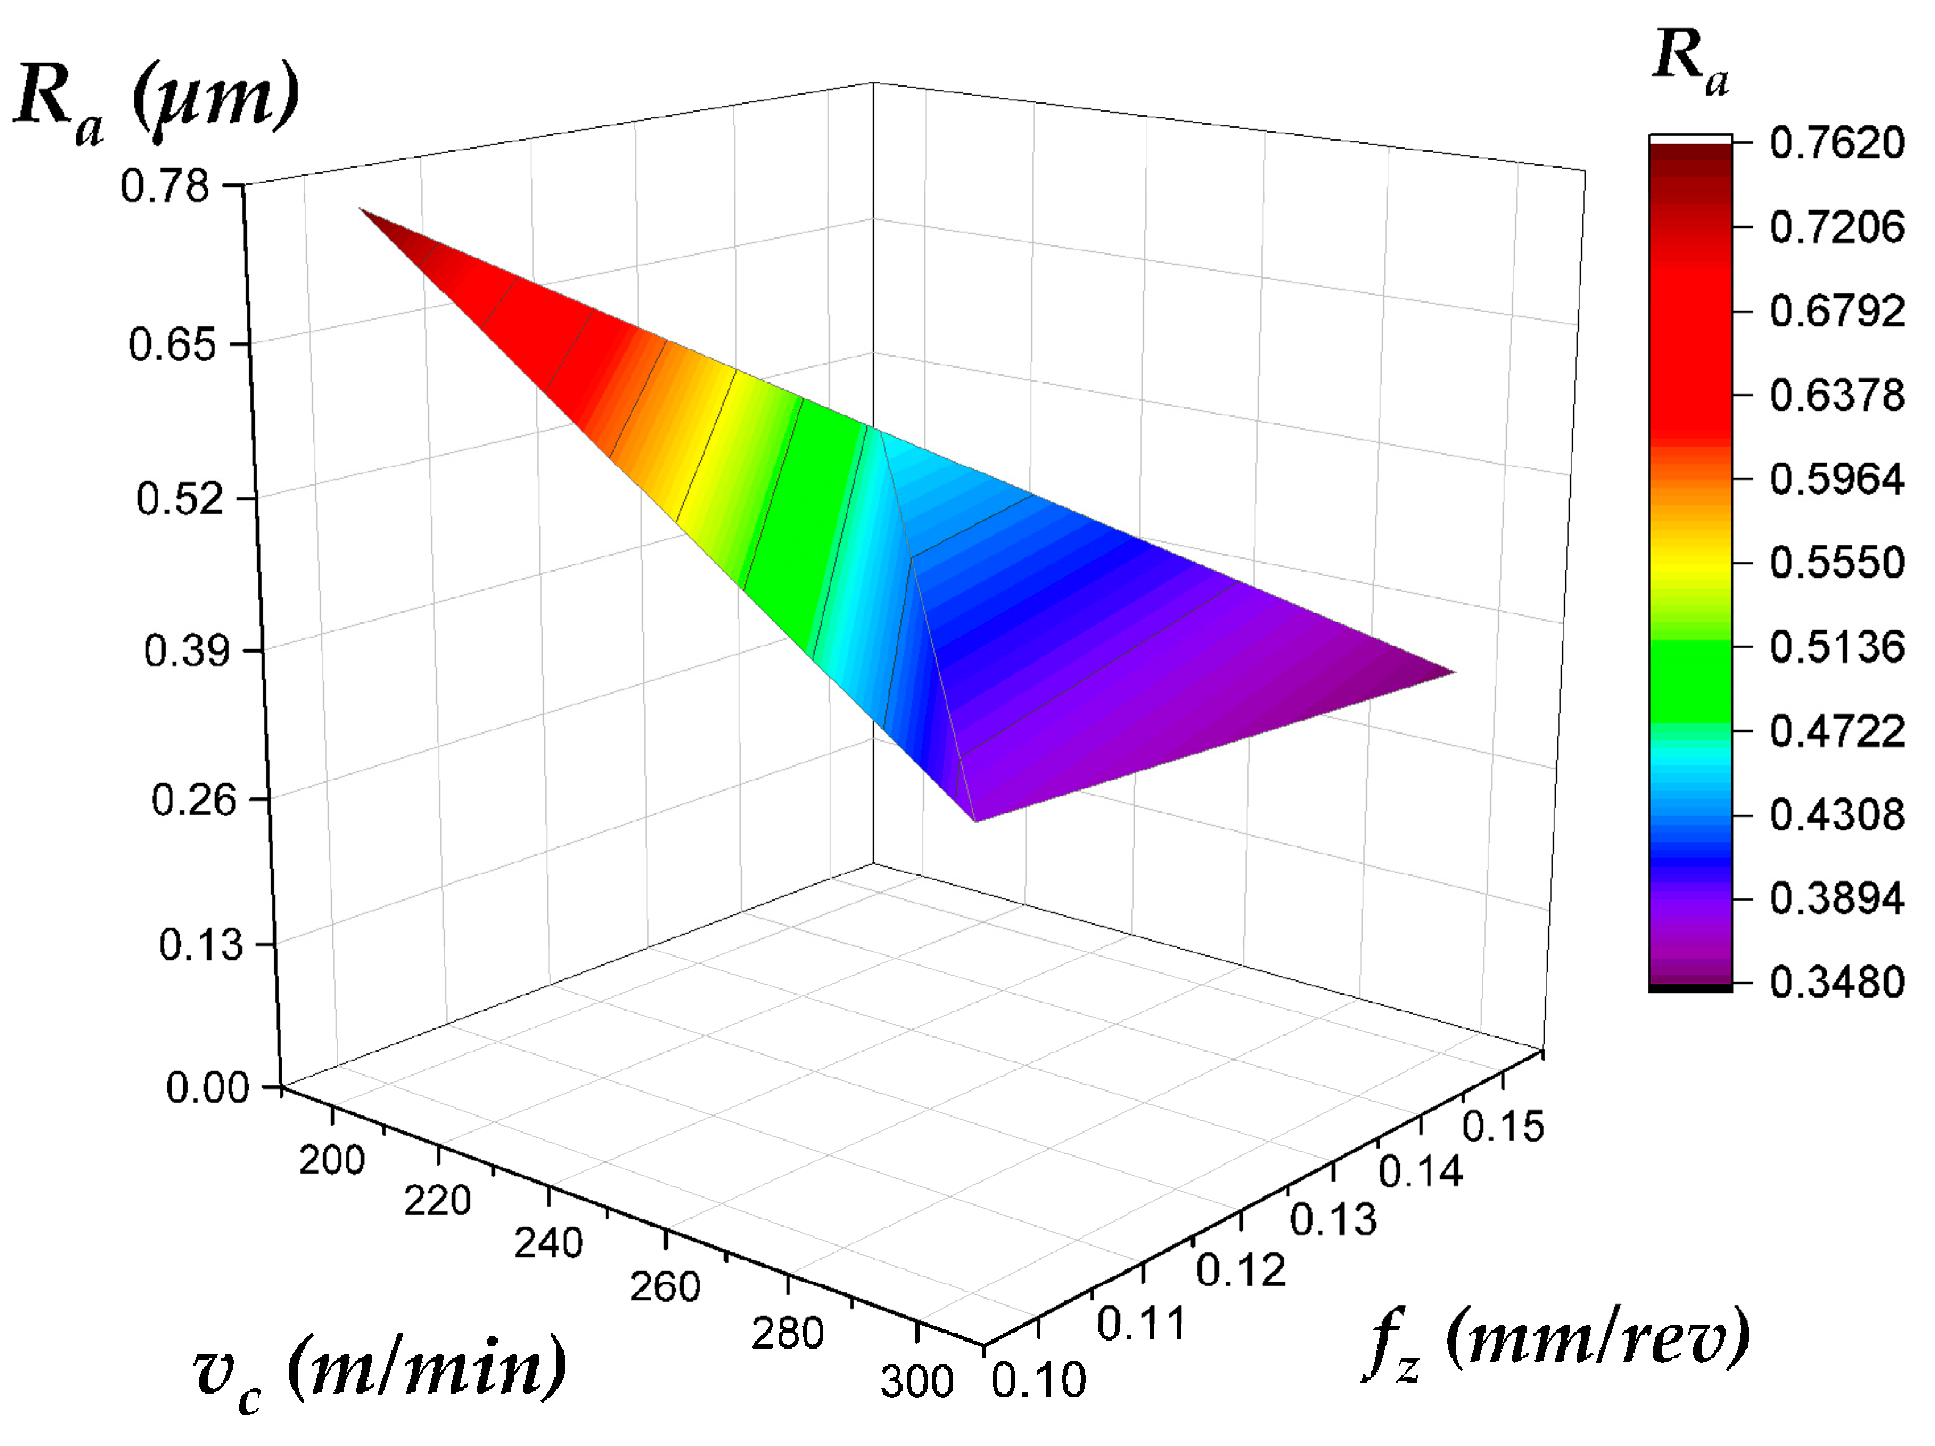
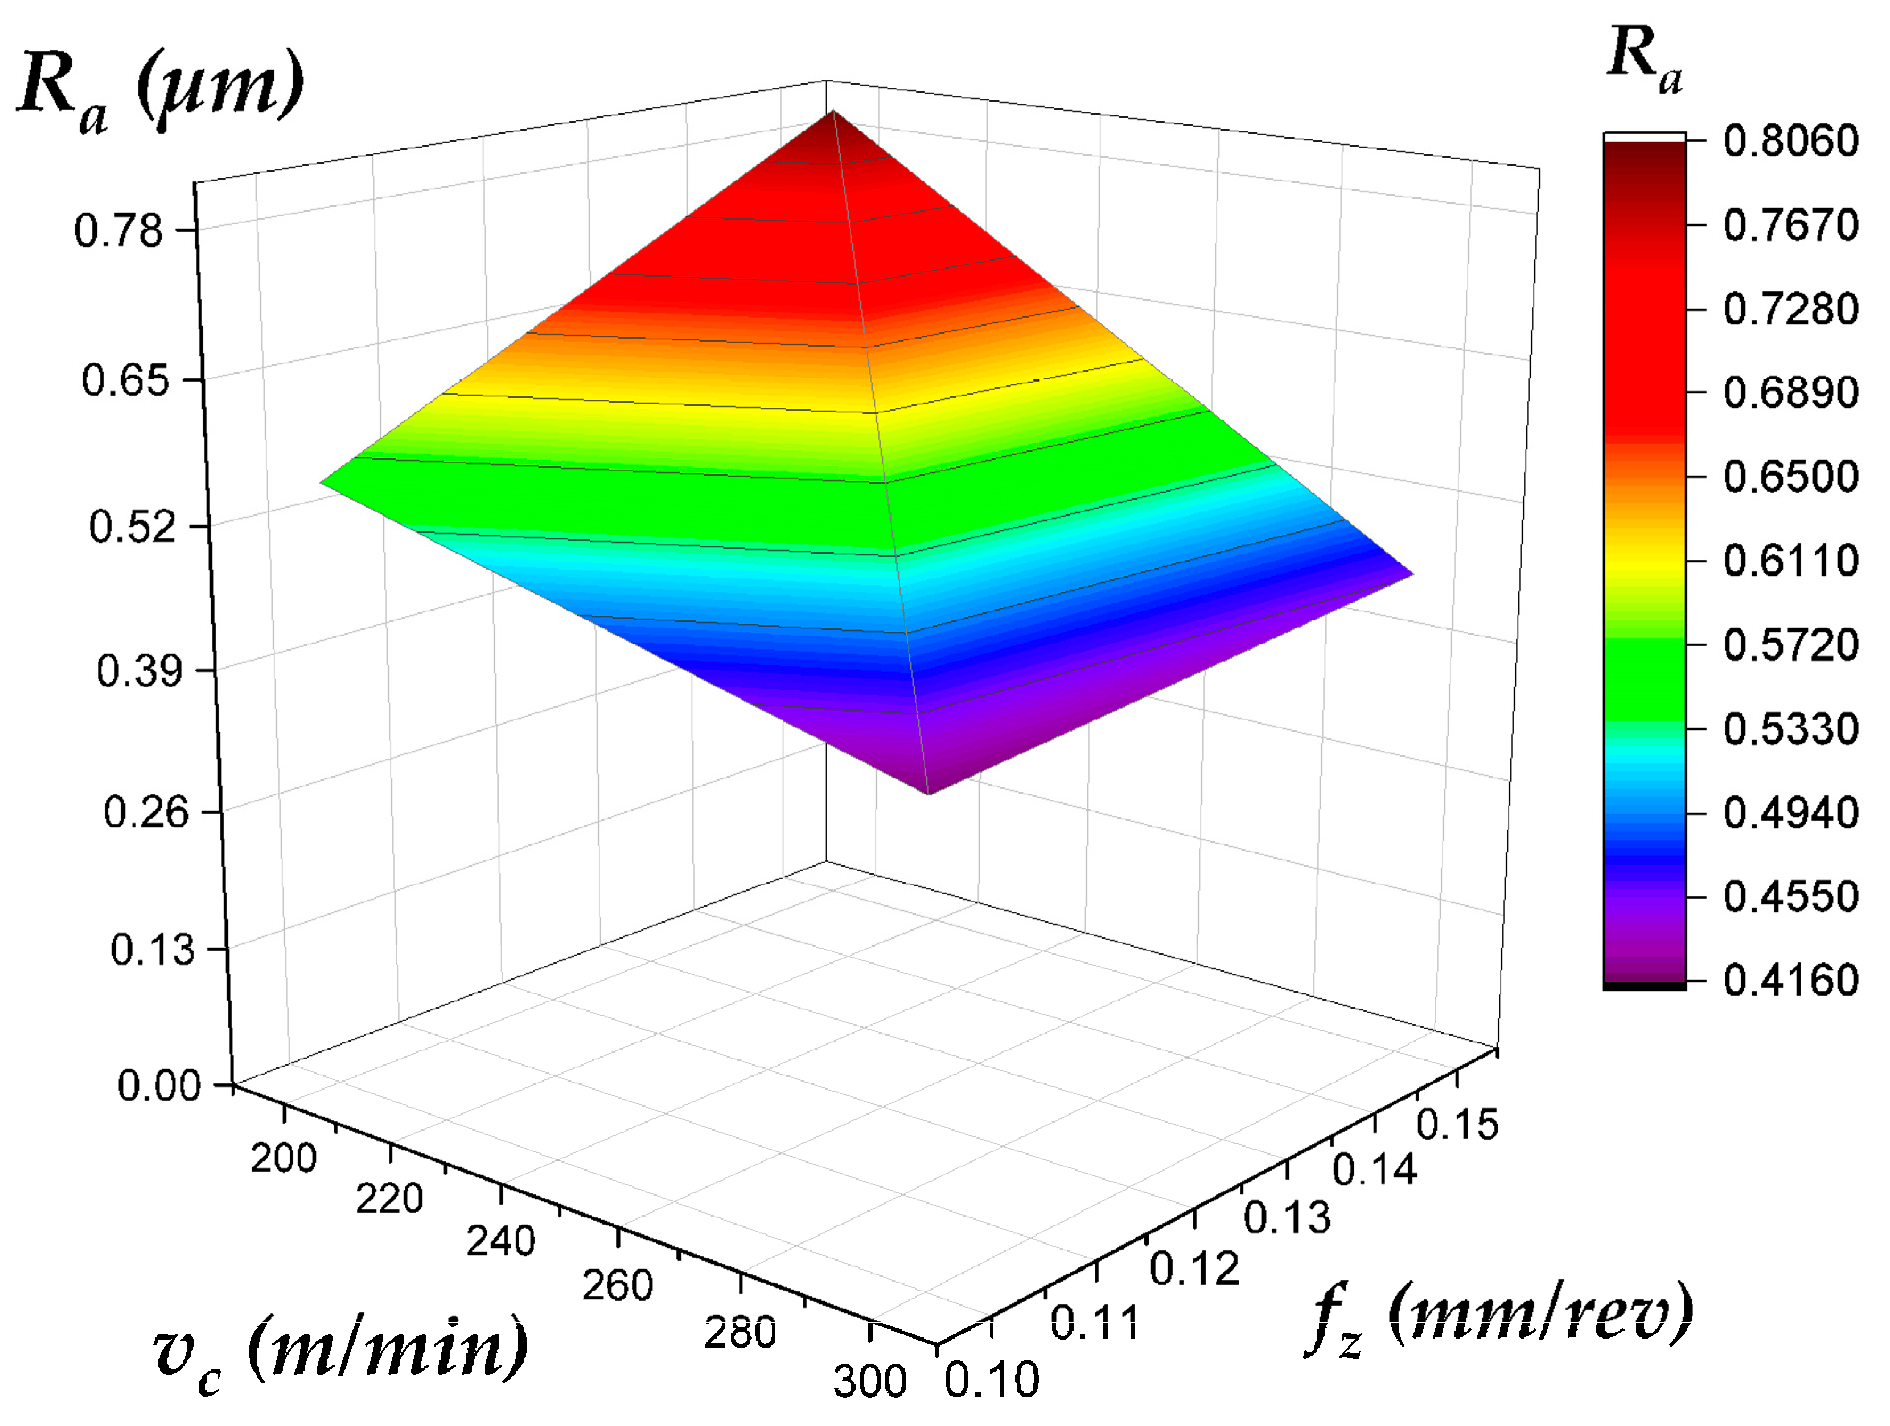
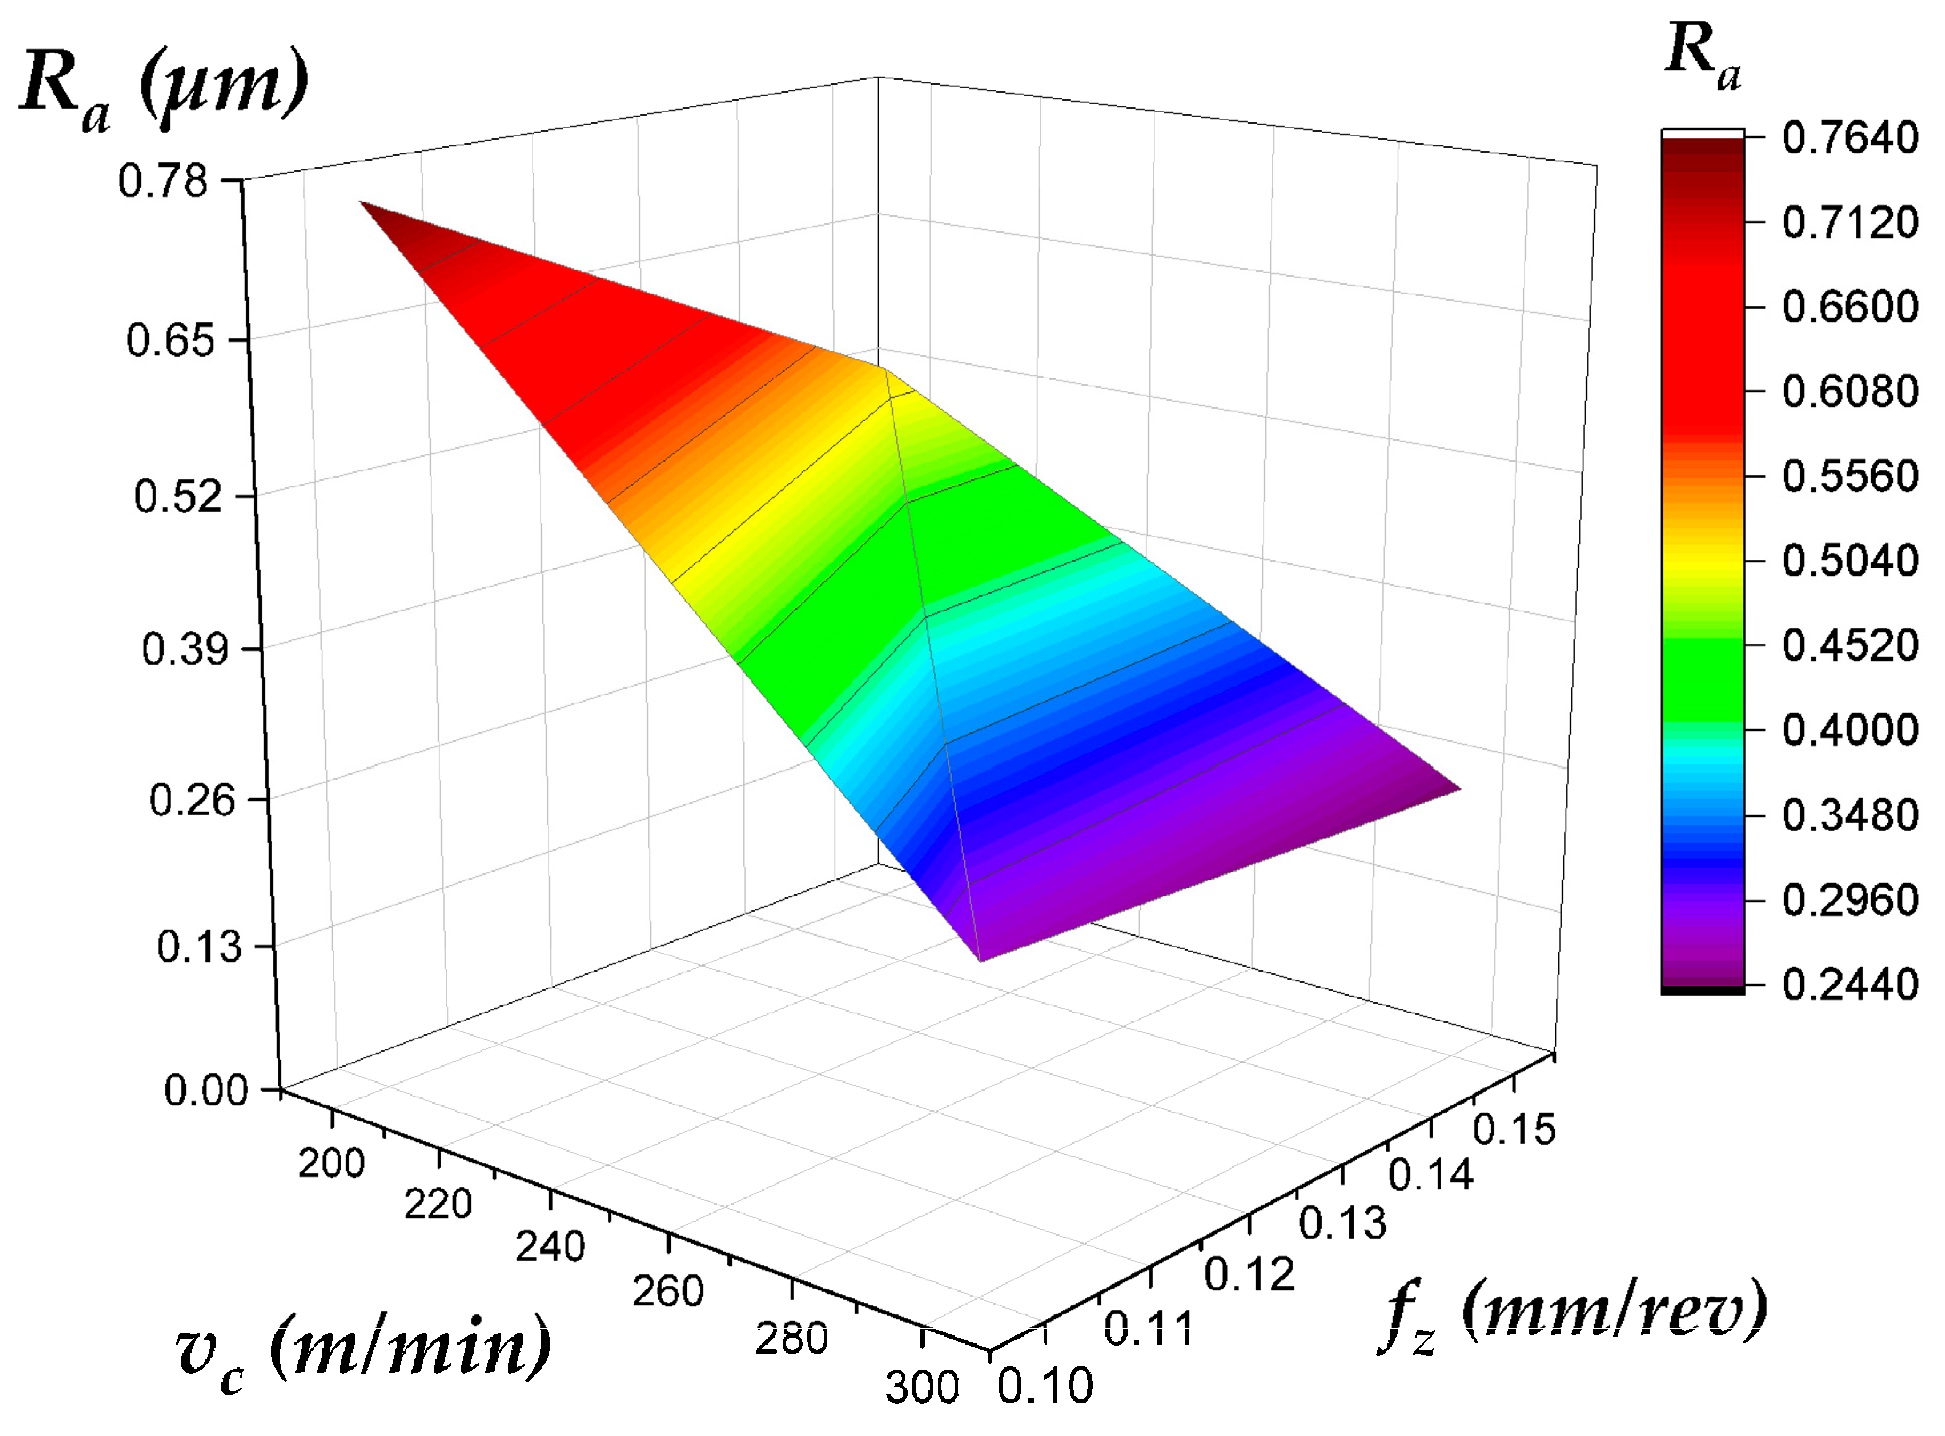
  • Depth-Dependent Behavior: Ra values on the side wall and top surface evolve differently with increasing depth of cut (compare Figure 8 and Figure 10 with Figure 9 and Figure 11 for the side wall, and Figure 12 and Figure 14 with Figure 13 and Figure 15 for the top surface), highlighting the complex interaction between process parameters and geometric location.
These findings highlight that surface roughness prediction and control depend on the milling strategy, surface geometry, and depth of cut, making broad extrapolations unreliable. Strategy-specific, depth-aware parameter optimization is essential for precision machining.
The cutting force analysis showed that plunge milling generates higher forces—especially in the (axial cutting force) (Fz) (Table 5, Figure 18)—due to vertical engagement, while face milling yields lower forces typical of radial cutting. Feed per tooth ( f z ) was the most influential factor (Table 5, evident across Figure 16, Figure 17 and Figure 18) while cutting speed ( v c ) and depth of cut ( a p ) had complex effects, including unexpected force drops (tangential cutting force (Fy) in plunge (Figure 17a vs. Figure 17b) and Fz in face milling (Figure 18c vs. Figure 18d)), likely due to chip interference or force redistribution. These anomalies, particularly the counter-intuitive trends with depth of cut, warrant further investigation and careful verification:
  • Complex changes in chip flow dynamics or interference at greater depths.
  • Dominance of specific tool geometry features (e.g., helix angle effects changing nonlinearly with engagement length).
Plunge and face milling exhibit distinct cutting force signatures driven by their differing kinematics and tool engagement modes. Key comparative points are as follows:
  • Magnitude: Plunge milling generally imposes higher overall loads and significantly higher axial cutting force (Fz) (Table 5, Figure 18) than face milling.
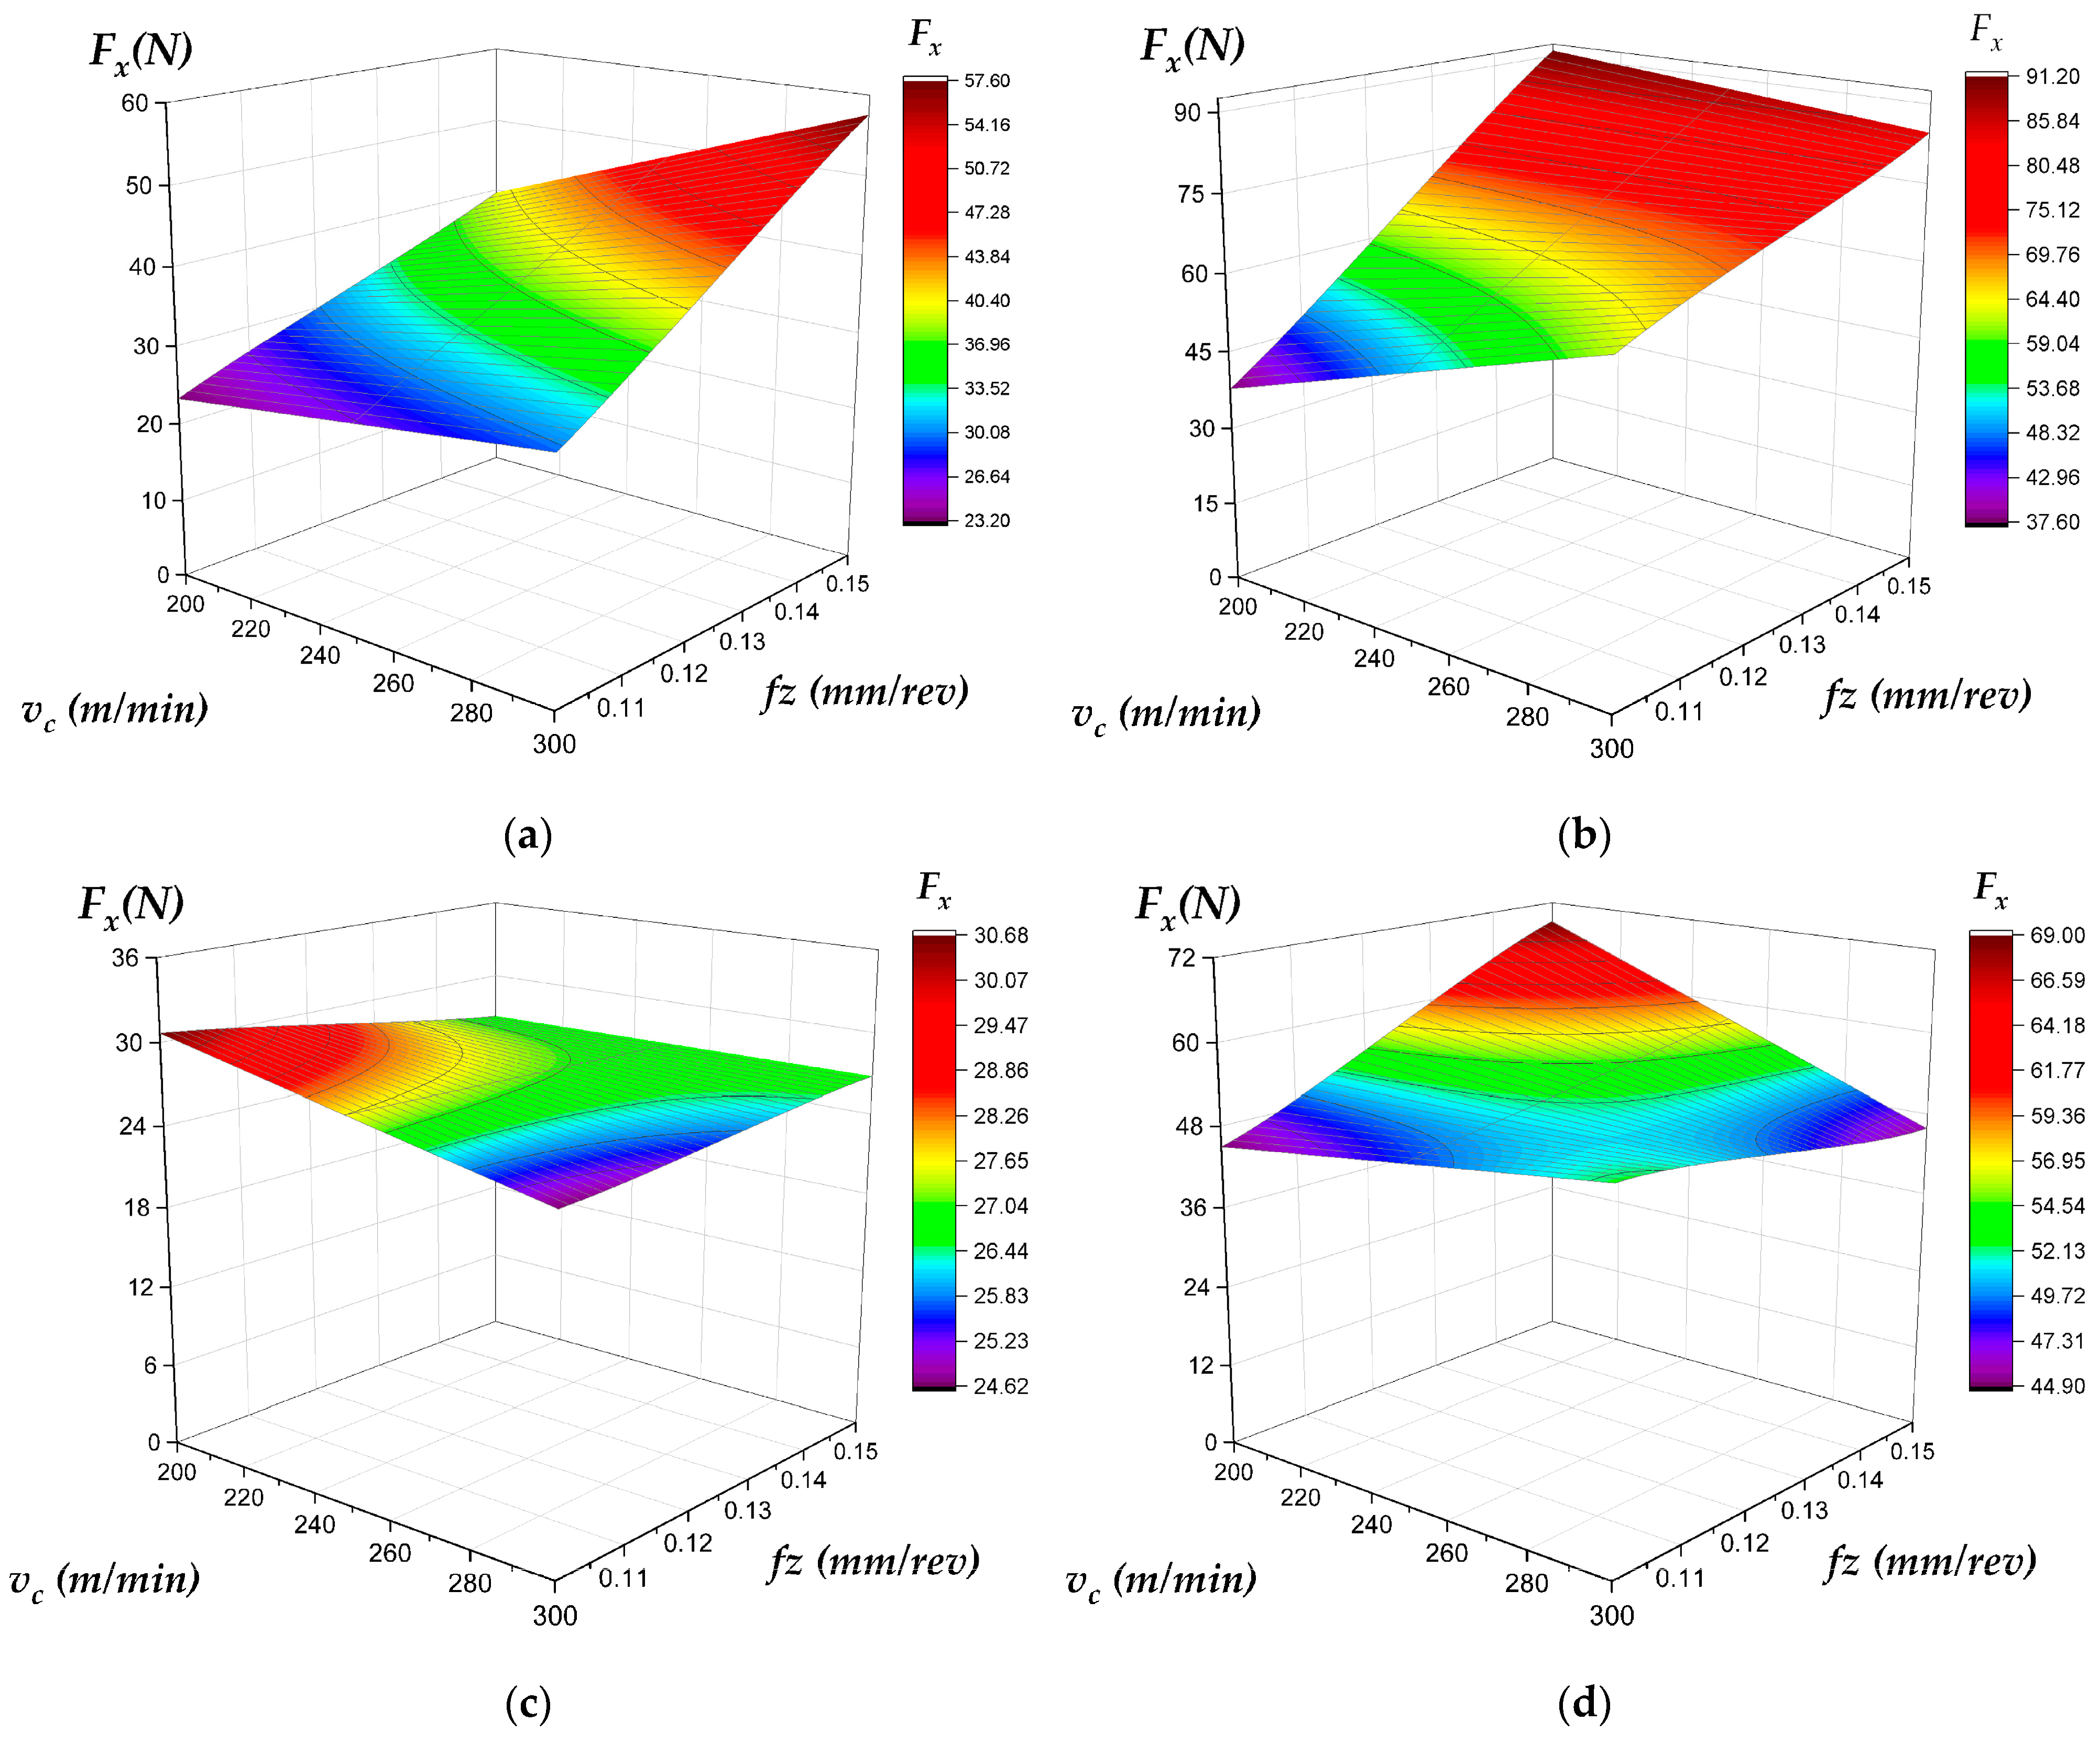
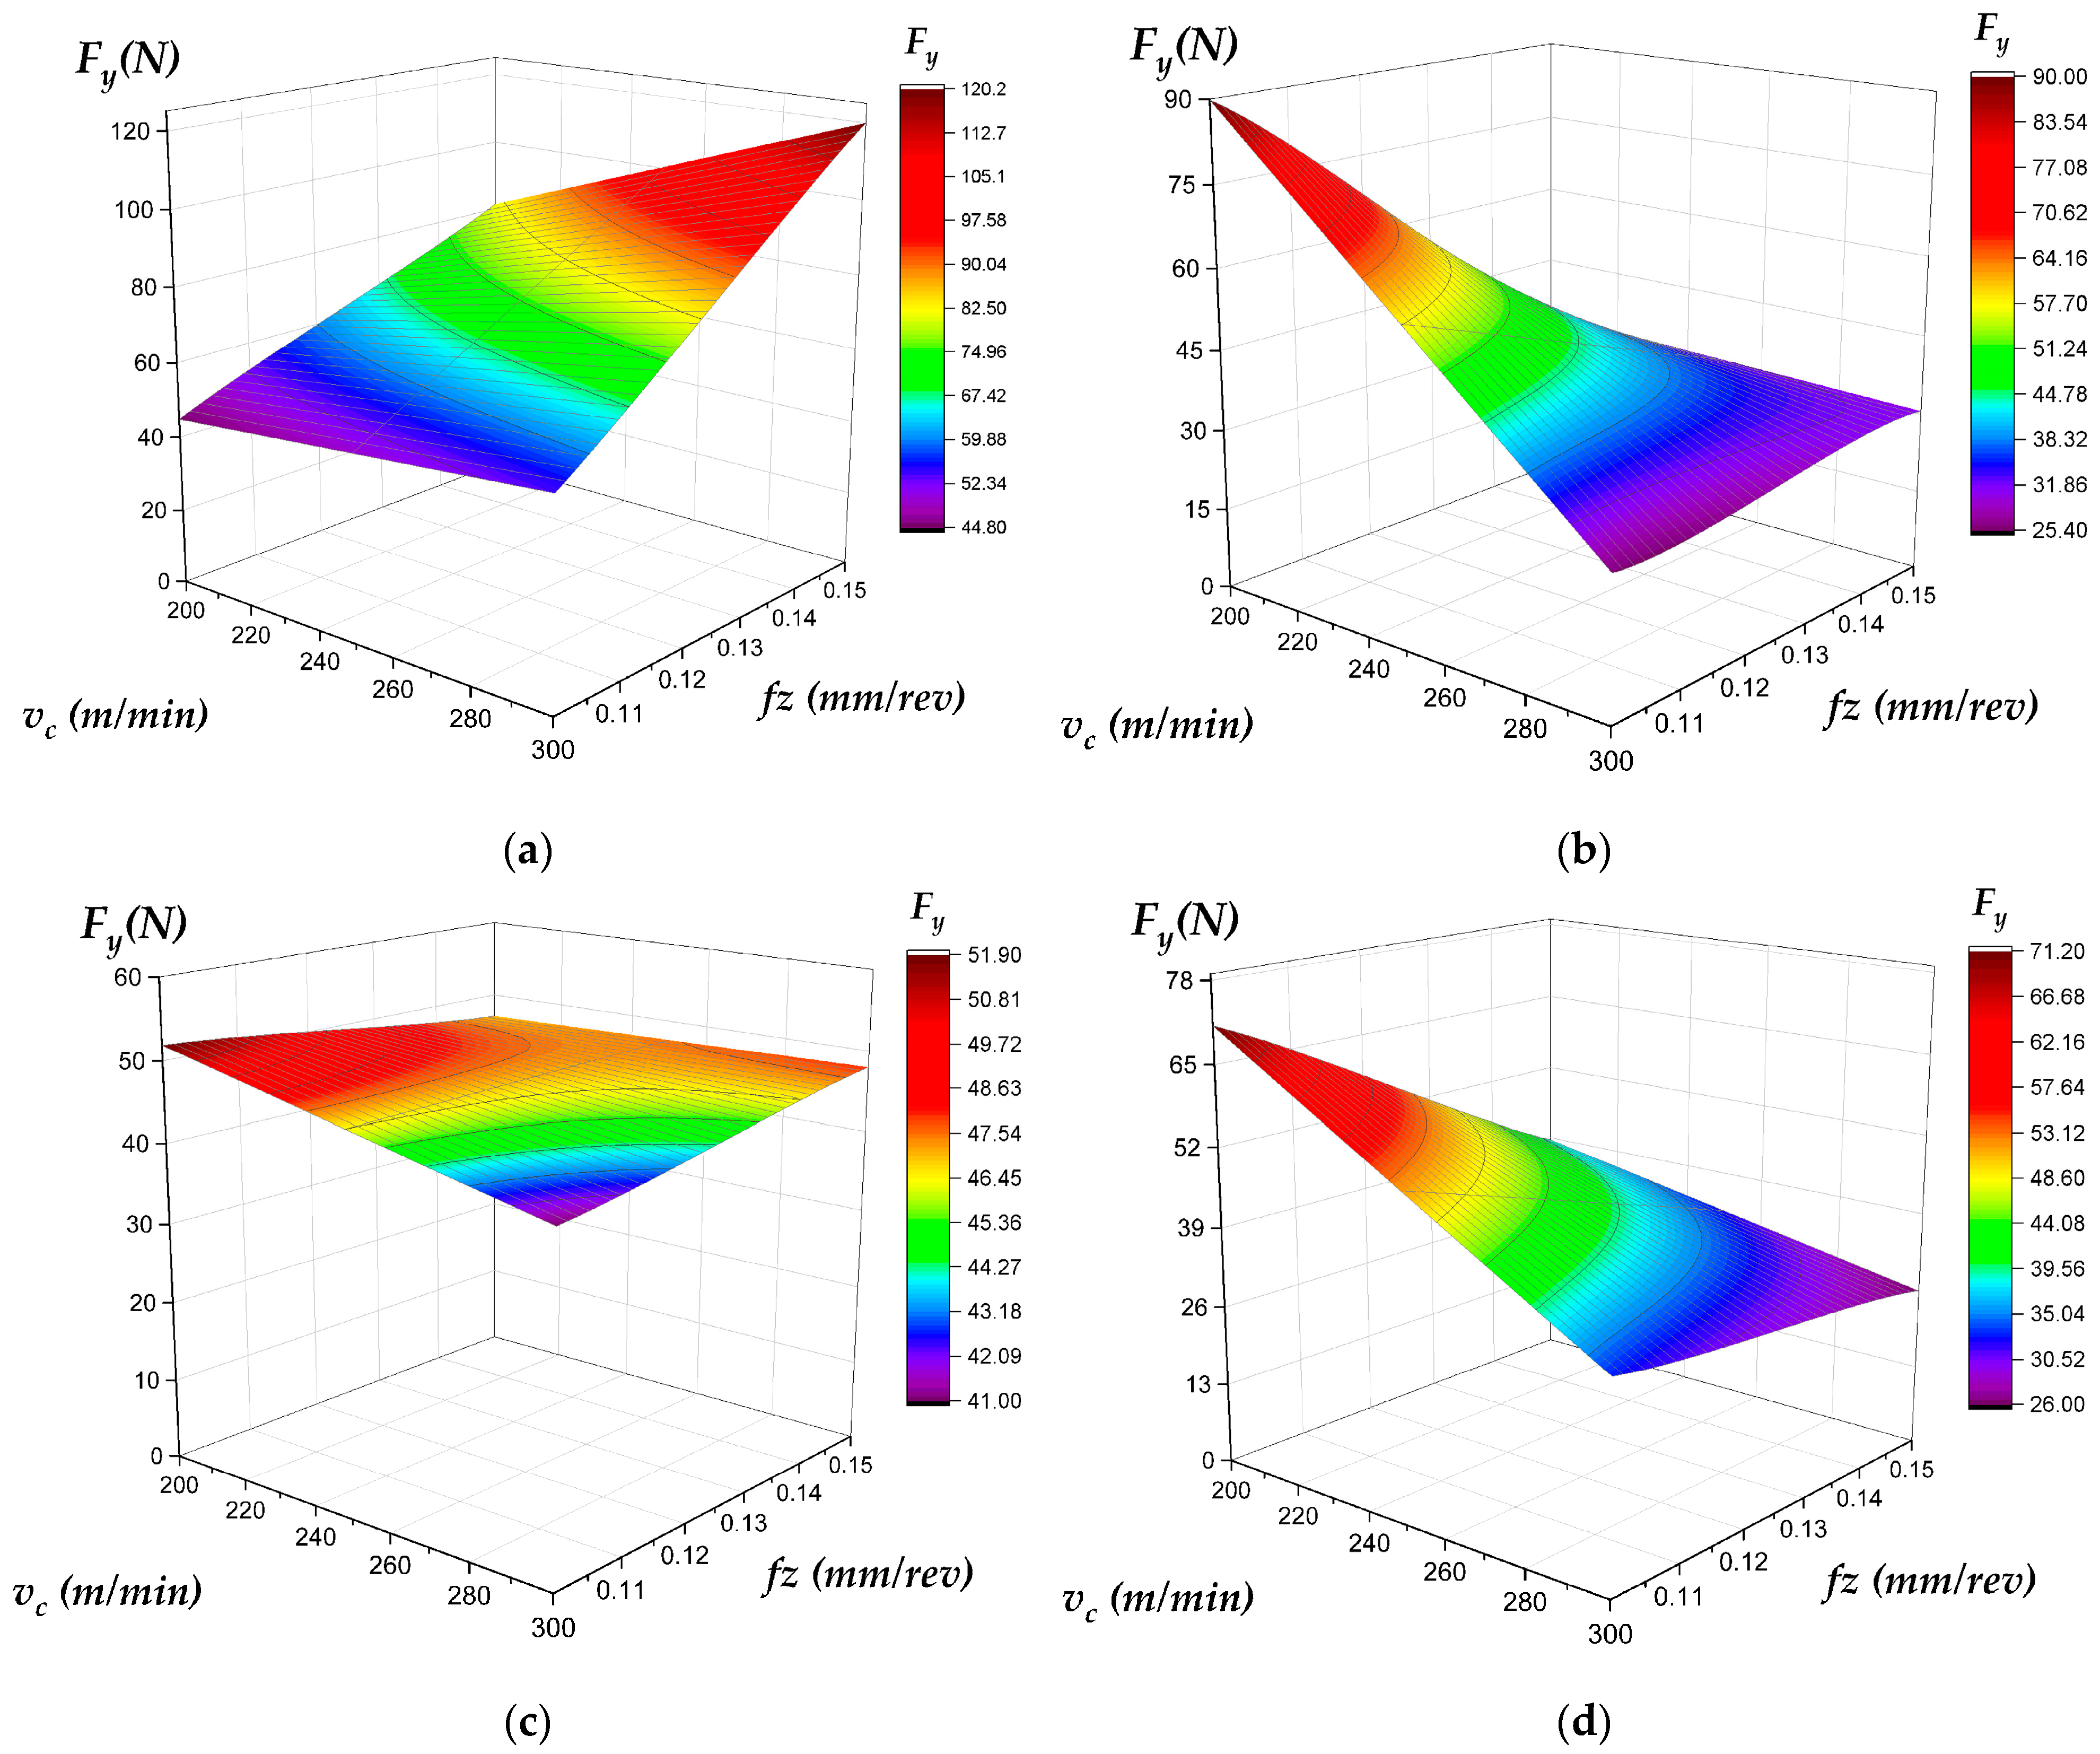
  • Feed (fz): Universally, the dominant factor, increasing all the force components for both strategies.
  • Speed (vc): Exerts subtle and often contrasting influences on individual force components (Fx and Fz) (Table 5, Figure 16 and Figure 18) between the two processes while showing a slight decreasing trend for tangential cutting force (Fy) (Table 5, Figure 17).
  • Depth of Cut (ap): While generally increasing forces as expected (e.g., Fx for both (Figure 16), axial cutting force (Fz) for plunge (Figure 18a vs. Figure 18b), and Fy for face milling (Figure 17c vs. Figure 17d)), the presented data reveals highly anomalous behavior where increasing ‘a’ decreases tangential cutting force (Fy) in plunge milling and axial cutting force (Fz) in face milling (Figure 18c vs. Figure 18d).
This study confirms that plunge and face milling produce distinct surface and force characteristics shaped by cutting parameters and depth of cut. Plunge milling leads to higher axial forces (Figure 18) and peak-rich surfaces, while face milling yields smoother, valley-dominated profiles with lower axial loads. Feed per tooth ( f z ) emerged as the dominant factor (Table 5), while cutting speed ( v c ) and depth ( a p ) showed complex or anomalous effects. These findings highlight the need for strategy-specific optimization. The anomalies observed at greater depth (e.g., Figure 17a vs. Figure 17b, Figure 18c vs. Figure 18d) suggest further research using expanded tests, real-time monitoring, and advanced simulations to improve predictive control in multiaxis milling. For applications—as shown in Table 6—where minimizing cutting forces is paramount (e.g., machining thin-walled components or on less rigid setups), plunge milling, particularly at (lower f z and moderate v c ), may be preferred. Conversely, if achieving a superior and more consistent surface finish on the primary machined surface is the main goal, face milling, especially with (lower f z ), demonstrated better performance. The choice will depend on the specific component requirements and manufacturing constraints. We will also reiterate that the observed anomalies at greater depths warrant caution and further investigation before broadly applying these specific high-depth parameters.
While this study provides valuable preliminary insights into the comparative performance of plunge and face milling concerning cutting forces and surface roughness, certain limitations in its experimental design warrant acknowledgment. Firstly, the investigation was conducted using a single tool diameter (32 mm Sandvik Coromant CoroMill 390) for both milling strategies. Consequently, the observed trends may not be directly generalizable to scenarios employing different tool diameters, such as smaller end mills designed explicitly for plunge milling or larger diameter face mills, which could yield different comparative outcomes. Secondly, the experimental work was confined to a single workpiece material, steel C45. Although chosen for its industrial relevance and well-characterized machinability, the material-specific response to cutting parameters is critical. The relative efficacy of plunge versus face milling could differ substantially for materials with distinct hardness, ductility, or thermal properties.
Furthermore, the cutting parameters (cutting speed, feed per tooth, and depth of cut) were investigated at only two discrete levels. While this factorial approach is practical for identifying primary effects and interactions within the tested range, it may not fully capture nonlinear relationships or pinpoint optimal parameter settings that might exist between or outside these levels. Therefore, it is emphasized that the present research is considered preliminary. The knowledge obtained, particularly concerning the contrasting sensitivities of each milling strategy to the investigated parameters and the identified anomalies (e.g., unexpected force trends with increasing depth of cut under certain conditions), forms a crucial foundation. These limitations will be systematically addressed in subsequent, more comprehensive investigations. Future studies will aim to expand the experimental matrix to include a broader range of these determinants.

Author Contributions

Conceptualization, A.K., C.F., and I.S.; methodology, C.F. and I.S.; formal analysis, A.K., C.F., and I.S.; investigation, A.K.; resources, C.F.; data curation, I.S.; writing—original draft preparation, A.K., C.F., and I.S.; writing—review and editing, A.K. and I.S.; visualization, A.K.; supervision, C.F.; project administration, A.K., C.F., and I.S. All authors have read and agreed to the published version of the manuscript.

Funding

This research received no funding.

Institutional Review Board Statement

Not applicable.

Informed Consent Statement

Not applicable.

Data Availability Statement

The original contributions presented in this study are included in the article. Further inquiries can be directed to the corresponding author.

Acknowledgments

The authors fully acknowledge and greatly appreciate the support of the University of Miskolc in the preparation of this work.

Conflicts of Interest

The authors declare no conflicts of interest.

References

  1. Chen, D.C.; Chen, T.W. Surface roughness analysis of high speed milling in grooving. J. Phys. Conf. Ser. 2021, 2020, 012034. [Google Scholar] [CrossRef]
  2. Cheng, Q.; Wang, S.; Xin, H.; Zhang, J.; Yao, C.; Cui, M.; Li, G. Study on tool wear for efficient grooving blisk with disc milling cutter. J. Mech. Sci. Technol. 2023, 37, 5335–5348. [Google Scholar] [CrossRef]
  3. Gómez, G.; De Lucio, P.F.; Del Olmo, A.; De Pissón, G.M.; Jimeno, A.; González, H.; De Lacalle, L.L. Comparison between milling roughing operations in full slotting manufacturing: Trochoidal, plunge and conventional milling. IOP Conf. Ser. Mater. Sci. Eng. 2021, 1193, 012003. [Google Scholar] [CrossRef]
  4. Woodrum, R.B.; Barnett, D.H.; Dickens, J.C.; Neuber, A.A. Developing Safe Lathing Parameters for PBX 9501. Propellants Explos. Pyrotech. 2018, 43, 779–788. [Google Scholar] [CrossRef]
  5. Xin, H.; Shi, Y.; Zhao, T. Compound efficient and powerful milling machine tool of blisk. Int. J. Adv. Manuf. Technol. 2018, 98, 1745–1753. [Google Scholar] [CrossRef]
  6. Danis, I.; Monies, F.; Lagarrigue, P.; Wojtowicz, N. Cutting forces and their modelling in plunge milling of magnesium-rare earth alloys. Int. J. Adv. Manuf. Technol. 2016, 84, 1801–1820. [Google Scholar] [CrossRef]
  7. Dong, L.; Chen, M. A comparative experimental study on the rough machining methods of centrifugal three-dimensional impellers. Adv. Mech. Eng. 2024, 16, 16878132241244923. [Google Scholar] [CrossRef]
  8. Hanzl, P.; Zetková, I. Benefits of a New Approach to Designing Milling Cutter Using Metal Additive Manufacturing. Manuf. Technol. 2019, 19, 385–390. [Google Scholar] [CrossRef]
  9. Płodzień, M.; Żyłka, Ł.; Sułkowicz, P.; Żak, K.; Wojciechowski, S. High-Performance Face Milling of 42CrMo4 Steel: Influence of Entering Angle on the Measured Surface Roughness, Cutting Force and Vibration Amplitude. Materials 2021, 14, 2196. [Google Scholar] [CrossRef]
  10. Pelayo, G.U.; Olvera-Trejo, D.; Luo, M.; Tang, K.; De Lacalle, L.N.L.; Elías-Zuñiga, A. A model-based sustainable productivity concept for the best decision-making in rough milling operations. Measurement 2021, 186, 110120. [Google Scholar] [CrossRef]
  11. Wakaoka, S.; Yamane, Y.; Sekiya, K.; Narutaki, N. High-speed and high-accuracy plunge cutting for vertical walls. J. Mater. Process. Technol. 2002, 127, 246–250. [Google Scholar] [CrossRef]
  12. Adesta, E.Y.T.; Avicenna; Hilmy, I.; Daud, M.R.H.C. Toolpath strategy for cutter life improvement in plunge milling of AISI H13 tool steel. IOP Conf. Ser. Mater. Sci. Eng. 2018, 290, 012040. [Google Scholar] [CrossRef]
  13. Al-Ahmad, M.; d’Acunto, A.; Martin, P. Identification of Plunge Milling Parameters to Compare with Conventional Milling. In Advances in Integrated Design and Manufacturing in Mechanical Engineering II; Tichkiewitch, S., Tollenaere, M., Ray, P., Eds.; Springer: Dordrecht, The Netherlands, 2007; pp. 461–474. [Google Scholar] [CrossRef]
  14. Al-Ahmad, M.; D’Acunto, A.; Lescalier, C.; Bomont, O. Modeling of Cutting Forces in Plunge Milling. In AMST’05 Advanced Manufacturing Systems and Technology; CISM International Centre for Mechanical Sciences; Kuljanic, E., Ed.; Springer: Vienna, Austria, 2005; Volume 486, pp. 155–164. [Google Scholar] [CrossRef]
  15. Ko, J.H.; Altintas, Y. Dynamics and Stability of Plunge Milling Operations. J. Manuf. Sci. Eng. 2007, 129, 32–40. [Google Scholar] [CrossRef]
  16. Bey, M.; Tchantchane, Z.; Kheidri, L.; Benhenda, N. Toward the automation of the plunge milling strategy for roughing sculptured surfaces from stl models. In Proceedings of the 15th International Research/Expert Conference “Trends in the Development of Machinery and Associated Technology”, TMT, Prague, Czech Republic, 12–18 September 2011. [Google Scholar]
  17. Bey, M.; Tchantchane, Z. Optimum Combination of Cutting Tools for Roughing Complex Parts Using Plunge Milling Machining Strategy. Available online: https://www.researchgate.net/profile/Mohamed-Bey/publication/321429431_Optimum_Combination_of_Cutting_Tools_for_Roughing_Complex_Parts_Using_Plunge_Milling_Machining_Strategy/links/5a2182feaca2727dd87aa137/Optimum-Combination-of-Cutting-Tools-for-Roughing-Complex-Parts-Using-Plunge-Milling-Machining-Strategy.pdf (accessed on 11 June 2025).
  18. Varga, J.; Spišák, E.; Gajdoš, I.; Mulidrán, P. Comparison of Milling Strategies in the Production of Shaped Surfaces. Adv. Sci. Technol. Res. J. 2022, 16, 267–274. [Google Scholar] [CrossRef]
  19. Fnides, M.; Amroune, S.; Slamani, M.; Elhadi, A.; Arslane, M.; Jawaid, M. Optimization of Manufacturing Parameters for Minimizing Vibrations and Surface Roughness in Milling Using Box–Behnken Design. J. Vib. Eng. Technol. 2025, 13, 22. [Google Scholar] [CrossRef]
  20. Cui, T. Precision Machining of Hard-to-Cut Materials: Current Status and Future Directions. Int. J. Adv. Comput. Sci. Appl. 2024, 15, 861–871. Available online: https://www.webofscience.com/wos/woscc/full-record/WOS:001348288600001 (accessed on 26 November 2024). [CrossRef]
  21. Zhang, Z.; Liu, Y.; Han, Q.; Zhong, S.; Wang, Y.; Liu, H. The design and cutting performance of variable pitch solid ceramic end milling tools. Int. J. Refract. Met. Hard Mater. 2024, 120, 106579. [Google Scholar] [CrossRef]
  22. Silva, F.J.; Martinho, R.P.; Magalhães, L.L.; Fernandes, F.; Sales-Contini, R.C.; Durão, L.M.; Casais, R.C.; Sousa, V.F. A Comparative Study of Different Milling Strategies on Productivity, Tool Wear, Surface Roughness, and Vibration. J. Manuf. Mater. Process. 2024, 8, 115. [Google Scholar] [CrossRef]
  23. Niu, X.H.; Cui, L.Q.; Hao, B.C.; Liu, S.Y.; Zhang, Z.T.; Meng, X.L. Analysis of Plunge Milling Force and Tool Deformation on Cr12. Adv. Mater. Res. 2013, 652–654, 2173–2177. [Google Scholar] [CrossRef]
  24. Ventura, C.E.; Hassui, A. Analysis of the cutting forces in plunge milling. Proc. Inst. Mech. Eng. Part B J. Eng. Manuf. 2013, 227, 1808–1818. [Google Scholar] [CrossRef]
  25. Chen, H.; Chen, Z.; Li, L. Wear and Life of K40 Carbide Tool for Plunge Milling GH4169. J. Phys. Conf. Ser. 2023, 2566, 012058. [Google Scholar] [CrossRef]
  26. Jin, C.; Guo, C.; Gao, Y. Research on cutting vibration characteristics of face-milling involute gear. Def. Technol. 2017, 13, 380–384. [Google Scholar] [CrossRef]
  27. Tapoglou, N.; Antoniadis, A. 3-Dimensional kinematics simulation of face milling. Measurement 2012, 45, 1396–1405. [Google Scholar] [CrossRef]
  28. Usubamatov, R.; Bayalieva, C.; Kapayeva, S.; Sartov, T.; Riza, G. Optimization of the face milling operations by the criterion of the maximal productivity rate. Prod. Eng. Res. Dev. 2024, 18, 525–531. [Google Scholar] [CrossRef]
  29. Jiménez, M.; Romero, L.; Domínguez, I.A.; Espinosa, M.D.M.; Domínguez, M. Additive Manufacturing Technologies: An Overview about 3D Printing Methods and Future Prospects. Complexity 2019, 2019, 9656938. [Google Scholar] [CrossRef]
  30. Lin, A.Q.; Zheng, M.L.; Fan, C.G.; Yang, L. Surface Morphology Simulation of High Speed Milled of Face Milling Cutters. Adv. Mater. Res. 2011, 305, 225–229. [Google Scholar] [CrossRef]
  31. Wang, J.; Qi, X.; Ma, W.; Zhang, S. A high efficiency 3D surface topography model for face milling processes. J. Manuf. Process. 2023, 107, 74–87. [Google Scholar] [CrossRef]
  32. Borysenko, D.; Kundrák, J.; Karpuschewski, B.; Welzel, F.; Maros, Z.; Felhő, C. Surface Residual Stresses in High-Feed Face Milling of Carbon Steel. In Vehicle and Automotive Engineering 4; Jármai, K., Cservenák, Á., Eds.; Lecture Notes in Mechanical Engineering; Springer International Publishing: Cham, Switzerland, 2023; pp. 648–653. [Google Scholar] [CrossRef]
  33. Kulenovic, M.; Halilagic, D.; Cekic, A. Model for cutting forces in high speed face milling. In Annals of DAAAM for 2005 & Proceedings of the 16th International DAAAM Symposium: Intelligent Manufacturing & Automation: Focus on Young Researches and Scientists; Katalinic, B., Ed.; DAAAM International Vienna: Wien, Austria, 2005; pp. 213–214. [Google Scholar]
  34. Kulenovic, M.; Cekic, A.; Halilagic, D. Characteristics of cutting forces in high speed face milling. In Annals of DAAAM for 2004 & Proceedings of the 15th International DAAAM Symposium: Intellignet Manufacturing & Automation: Globalisation—Technology—Men—Nature; Katalinic, B., Ed.; DAAAM International Vienna: Wien, Austria, 2004; pp. 239–240. [Google Scholar]
  35. Tang, D.; Zhang, G. A Study on Face Milling Force Model Based on Complex Surface Geometry. In Proceedings of the 2009 IEEE 10th International Conference on Computer-Aided Industrial Design & Conceptual Design, Wenzhou, China, 26–29 November 2009; pp. 826–830. [Google Scholar]
  36. Liu, L.N.; Shi, Z.Y.; Liu, Z.Q. Finite Element Modal Analysis for Face-Milling Cutter. Key Eng. Mater. 2013, 589–590, 19–22. [Google Scholar] [CrossRef]
  37. Carvalho, H.M.B.D.; Gomes, J.D.O.; Schmidt, M.A.; Brandão, V.L.C. Vibration Analysis and Energy Efficiency in Interrupted Face Milling Processes. Procedia CIRP 2015, 29, 245–250. [Google Scholar] [CrossRef]
  38. Roshan, M.V.; Sumesh, C.S.; Balaji, S.S.; Manchi, M.V.E.; Reddy, M.U.; Baghad, A. Sustainable Machining: A Case Study on Face Milling of AISI 1045 Steel Using a Multi-Objective Optimization Approach. Int. J. Interact. Des. Manuf. 2024. [Google Scholar] [CrossRef]
  39. Tibakh, I.; Yallese, M.A.; Belhadi, S.; Kaddeche, M. Multi-response optimisation during face milling of polyoxymethylene copolymer using grey relational analysis and data envelopment analysis based ranking coupled with the Taguchi approach. Adv. Mater. Process. Technol. 2024, 11, 681–706. [Google Scholar] [CrossRef]
  40. Huang, T.; Zhang, X.-M.; Leopold, J.; Ding, H. Tool Orientation Planning in Milling With Process Dynamic Constraints: A Minimax Optimization Approach. J. Manuf. Sci. Eng. 2018, 140, 111002. [Google Scholar] [CrossRef]
  41. Ren, J.X.; Yao, C.F.; Zhang, D.H.; Xue, Y.L.; Liang, Y.S. Research on tool path planning method of four-axis high-efficiency slot plunge milling for open blisk. Int. J. Adv. Manuf. Technol. 2009, 45, 101–109. [Google Scholar] [CrossRef]
  42. El Mehtedi, M.; Buonadonna, P.; Loi, G.; El Mohtadi, R.; Carta, M.; Aymerich, F. Surface Quality Related to Face Milling Parameters in 3D Printed Carbon Fiber-Reinforced PETG. J. Compos. Sci. 2024, 8, 128. [Google Scholar] [CrossRef]
  43. Raza, M.H.; Hafeez, F.; Zhong, R.Y.; Imran, A. Investigation of surface roughness in face milling processes. Int. J. Adv. Manuf. Technol. 2020, 111, 2589–2599. [Google Scholar] [CrossRef]
  44. Simunovic, G.; Simunovic, K.; Saric, T. Modelling and Simulation of Surface Roughness in Face Milling. Int. J. Simul. Model. 2013, 12, 141–153. [Google Scholar] [CrossRef]
  45. Reznicek, M.; Horava, C. The Influence of the Choice of Machining Strategy on Production Technology. Manuf. Technol. 2024, 24, 117–130. [Google Scholar] [CrossRef]
  46. Abbas, A.T.; Helmy, M.O.; Alqosaibi, K.F.; Parvez, S.; Hasan, A.S.; Elkaseer, A. Improving Maraging Steel 350 Machinability via Wiper Insert-Enhanced Face Milling. Metals 2024, 14, 514. [Google Scholar] [CrossRef]
  47. Malea, C.I.; Niţu, E.L.; Iordache, D.M.; Tabacu, Ş.L.; Negrea, A.D.; Bădulescu, C. Analysis of Face Milling of Hard Steel 55NiCrMoV7 by Studying Rough and Semi-Finished Machining and the Influence of Cutting Parameters on Macroscopic Chip Dimensions. Materials 2024, 17, 3434. [Google Scholar] [CrossRef]
  48. Viswanathan, V.; Mongird, K.; Franks, R.; Li, X.; Sprenkle, V. 2022 Grid Energy Storage Technology Cost and Performance Assessment. Energy 2022, 2022, 1–151. [Google Scholar]
  49. Soori, M.; Jough, F.K.G.; Arezoo, B. Surface quality enhancement by constant scallop-height in three-axis milling operations. Results Surf. Interfaces 2024, 14, 100208. [Google Scholar] [CrossRef]
  50. Wang, Z. The milling parameters of mechanical parts are optimized by NC machining technology. Front. Mech. Eng. 2024, 10, 1367009. [Google Scholar] [CrossRef]
  51. Cafieri, S.; Monies, F.; Mongeau, M.; Bes, C. Plunge milling time optimization via mixed-integer nonlinear programming. Comput. Ind. Eng. 2016, 98, 434–445. [Google Scholar] [CrossRef]
  52. Liang, Y.; Zhang, D.; Chen, Z.C.; Ren, J.; Li, X. Tool orientation optimization and location determination for four-axis plunge milling of open blisks. Int. J. Adv. Manuf. Technol. 2014, 70, 2249–2261. [Google Scholar] [CrossRef]
  53. Cheng, Y.; Yang, J.; Zuo, D.; Song, X.; Feng, X. Tool design and cutting parameters optimisation for plunge milling blisk. Int. J. Manuf. Res. 2020, 15, 266–284. [Google Scholar] [CrossRef]
  54. Pala, M.; Sarma, K.V.; Biswal, S.; Amudhavel, V.; Rao, D.V.G. Investigation of High-Speed Milling and High Efficiency Milling of Ti6Al4V. Int. J. Adv. Eng. Res. Sci. 2021, 8, 22–28. [Google Scholar] [CrossRef]
  55. Dinh, D.-H.; Do, P.; Iung, B. Maintenance optimisation for multi-component system with structural dependence: Application to machine tool sub-system. CIRP Ann. 2020, 69, 417–420. [Google Scholar] [CrossRef]
  56. ISO 21920-2:2021; Geometrical Product Specifications (GPS)—Surface Texture: Profile—Part 2: Terms, Definitions and Surface Texture Parameters. International Organization for Standardization: Geneva, Switzerland, 2021.
Figure 1. (a) Sandvik CoroMill 390 tool assembly mounted in the CNC spindle; (b) experimental setup for cutting force measurement during milling.
Eng 06 00128 g001
Figure 2. Schematic representation of the full factorial experimental design.
Eng 06 00128 g002
Figure 3. (a) Schematic drawing of the workpiece with machining zones for face and plunge milling; (b) experimental workpiece following machining with slot geometry and entry points.
Eng 06 00128 g003
Figure 4. Cutting force coordinate system used in data processing.
Eng 06 00128 g004
Figure 5. Identification of the top and side surfaces on the machined part.
Eng 06 00128 g005
Figure 6. Boxplots of average surface roughness (Ra) for plunge and face milling.
Eng 06 00128 g006
Figure 7. Comparative 3D surface topography of plunge and face milled surfaces for Setup 4 (Vc = 200 m/min, fz = 0.15 mm/tooth, and ap = 1.5 mm).
Eng 06 00128 g007
Figure 8. Three-dimensional surface plot of average surface roughness (Ra) during plunge milling on the side surface at the measurement location where the depth of cut is ap = 1 mm.
Eng 06 00128 g008
Figure 9. Three-dimensional surface plot of average surface roughness (Ra) during face milling on the side surface at the measurement location where the depth of cut is ap = 1 mm.
Eng 06 00128 g009
Figure 10. Three-dimensional surface plot of average surface roughness (Ra) during plunge milling on the side surface at the measurement location where the depth of cut is ap = 1.5 mm.
Eng 06 00128 g010
Figure 11. Three-dimensional surface plot of average surface roughness (Ra) during face milling on the side surface at the measurement location where the depth of cut is ap = 1.5 mm.
Eng 06 00128 g011
Figure 12. Three-dimensional surface plot of average surface roughness (Ra) during plunge milling on the top surface at the measurement location where the depth of cut is ap = 1 mm.
Eng 06 00128 g012
Figure 13. Three-dimensional surface plot of average surface roughness (Ra) during face milling on the top surface at the measurement location where the depth of cut is ap = 1 mm.
Eng 06 00128 g013
Figure 14. Three-dimensional surface plot of average surface roughness (Ra) during plunge milling on the top surface at the measurement location where the depth of cut is ap = 1.5 mm.
Eng 06 00128 g014
Figure 15. Three-dimensional surface plot of average surface roughness (Ra) during face milling on the top surface at the measurement location where the depth of cut is ap = 1.5 mm.
Eng 06 00128 g015
Figure 16. Three-dimensional surface plot of radial cutting force (Fx) according to the changing of the depth of cut: (a) ap = 1 mm and (b) ap = 1.5 mm in the case of plunge milling; (c) ap = 1 mm and (d) ap = 1.5 mm in the case of face milling.
Eng 06 00128 g016
Figure 17. Three-dimensional surface plot of tangential cutting force (Fy), according to the changing of the depth of cut: (a) ap = 1 mm and (b) ap = 1.5 mm, both in the case of plunge milling; (c) ap = 1 mm and (d) ap = 1.5 mm, both in the case of face milling.
Eng 06 00128 g017
Figure 18. Three-dimensional surface plot of axial cutting force (Fz) according to the changing of the depth of cut: (a) ap = 1 mm and (b) ap = 1.5 mm, both in the case of plunge milling; (c) ap = 1 mm and (d) ap = 1.5 mm, both in the case of face milling.
Eng 06 00128 g018
Table 1. Experimental justification of machining parameter level selection.
ParameterSymbolLevel 1Level 2UnitRationale
Cutting speedvc200300m/minCovers moderate to high speeds for tool wear and force analysis.
Feed per toothfz0.100.15mm/revRepresents typical industrial ranges for semi-finish operations.
Depth of cutap1.01.5mmTests axial engagement limits for plunge milling stability.
Table 2. Machining parameter settings for each experimental setup.
Setupvc
(m/min)
fz (mm/tooth)ap (mm)n (rpm)vf
(mm/min)
12000.101.01989397.9
22000.101.51989397.9
32000.151.01989596.6
42000.151.51989596.6
53000.101.02984596.8
63000.101.52984596.8
73000.151.02984894.8
83000.151.52984894.8
Table 3. Surface roughness parameter settings (Ra (µm)).
Plunge MillingFace Milling
TypeSample123Mean123Mean
Side
surface
10.3340.380.3890.3670.5230.5060.6220.550
20.4880.5110.4860.4950.5540.5310.5570.547
30.3990.4510.4030.4180.6270.6440.540.604
40.5150.5240.4970.5120.6390.6280.560.609
50.4550.5220.5030.4930.4690.5470.5880.535
60.4590.3850.3920.4120.9140.9590.9350.936
70.4030.4220.4590.4280.7270.7830.8320.781
80.490.5850.460.5120.5860.8260.7960.736
Top
surface
10.9381.1451.2071.0970.7920.7350.7550.761
21.0011.0731.0241.0330.5070.4550.4290.464
30.4560.4790.4410.4590.3890.3770.3680.378
40.6630.6840.7470.6980.3520.3670.3280.349
50.5330.5640.5740.5570.8890.8030.5960.763
60.8280.8260.7620.8050.5940.5010.4640.520
70.3020.4280.5230.4180.2660.2830.260.270
80.40.4990.4690.4560.2650.2350.2330.244
Table 4. Summary statistics and coefficient of variation (CV) for surface roughness (Ra) in plunge and face milling strategies.
Mean MedianVarianceStd. DeviationCV
Plunge milling0.572400.494170.0490.22208535.0
Face milling 0.560690.541000.0390.19635238.8
Table 5. p-values results for Kruskal–Wallis test (H).
Plunge MillingFace Milling
FxFyFzFxFyFz
MHMHMHMHMHMH
ap0.0000.0000.0000.0000.0000.5840.0000.0000.0000.0000.0000.584
vc0.0000.0000.6770.0040.000.0000.0000.0000.6770.0040.000.000
fz0.0000.0000.240.0000.0170.1390.0000.0000.240.0000.0170.139
Table 6. Practical recommendations for strategy selection based on machining goals.
Machining GoalRecommended StrategyOptimal Parameter Range (from This Study)Justification and Practical Considerations
Best Surface Finish (Top Surface)Face MillingLow vc (200 m/min) and High fz (0.15 mm/rev)Consistently produces a smooth, valley-dominated surface. The counter-intuitive benefit of higher feed (fz) likely relates to a more stable chip formation and wiping effect (Figure 13 and Figure 15).
Best Surface Finish (Side Wall)Face Milling (for predictability)Low fz (<0.10 mm/rev)Face milling provides a more predictable and monotonically worsening Ra with increasing fz. Plunge milling can achieve lower Ra but is less stable and prone to high-Ra outliers, making it a higher-risk choice for critical surfaces (Figure 6, Figure 8, Figure 9, Figure 10 and Figure 11).
Lowest Cutting ForcesFace MillingLow fz (0.10 mm/rev) and Low ap (1 mm)Face milling generates significantly lower forces, especially axial force (fz). This is critical for machining thin-walled components, using less rigid machine setups, or minimizing tool/workpiece deflection to maintain dimensional accuracy (Figure 16, Figure 17 and Figure 18).
High Material Removal (Roughing)Plunge Milling Moderate vc and High fz (to maximize MRR)While plunge milling results in much higher axial forces, it is designed for deep cavity roughing. The strategy should be used on a rigid, high-power machine. The high axial force (fz) must be managed to avoid spindle damage or tool failure (Figure 18).
Disclaimer/Publisher’s Note: The statements, opinions and data contained in all publications are solely those of the individual author(s) and contributor(s) and not of MDPI and/or the editor(s). MDPI and/or the editor(s) disclaim responsibility for any injury to people or property resulting from any ideas, methods, instructions or products referred to in the content.

