

Characterization of Oil Well Cement–Formation Sheath Bond Strength


Abstract
1. Introduction
- Carrying the dead weight of the casing string and supporting it in place.
- Isolating the casing string from formation-corrosive fluids.
- Preventing wellbore collapse and providing a reasonable mud weigh window.
- Restricting fluid movement between permeable formations (zones).
- Protecting freshwater aquifers.
- The stability of cement slurry (a mixture of Portland cement, water, and additives)—non-settling under dynamic and static conditions.
- Minimal filtration loss.
- Static gel strength development.
- Low permeability.
- Minimal shrinkage during the transition period from slurry to final set.
- Thickening time. The time taken to thicken the cement slurry must be long enough for the well annuls to be filled. The thickening time determines the length of time the slurry can be pumped or the time necessary for the consistency to reach 100 poises under stimulated bottom hole pressure and temperature. The thickening time is measured in a laboratory using an API cement consistometer apparatus.
- Density. To minimize the risk of blowouts or lost circulation, the cement slurry density should be slightly higher than the drilling mud density.
- Filtration loss. The cement slurry filtration loss should be low to avoid the filtration of cement water into the formation, resulting in incomplete cement hydration. Filtration can be measured in the laboratory under room-temperature conditions and HT-HP conditions using the API HT-HP Filter Press.
- Permeability of the hard-set cement. The permeability of hard-set cement should be as low as possible. Bentonite cements are known to be very permeable. A high water/cement ratio increases the set cement permeability, while downhole high pressure and confinement due to their compacting effects decrease the set cement permeability.
- Perforating quality. When ordinary cements are completely hardened, they fracture excessively when perforated. Low-strength cements are usually less brittle and have less tendency to shatter upon perforating.
- Compressive and tensile strength of the set cement. The cement in oil wells is exposed to static and dynamic stresses. Static stress is induced by the dead weight of the casing pipe; compressive stresses are generated due to the action of fluid and formations; and dynamic stresses are induced by drilling operations, particularly the vibration of the drill string. To withstand these stresses, a cement compressive strength of 500 psi after a period of 24 h is necessary [6]. High-early-strength cement has a strength higher than ordinary-strength cement in the first 30 h. Density reduction additives decrease the cement strength, while retarders reduce both early and late strength. Fine sand increases the final hard-set cement strength and mitigates the effects of temperature.
- Corrosion resistance. Hard-set cement can be penetrated by formation-corrosive fluids, especially those containing CO3 or SO4 irons. Cement corrosion decreases the final compressive strength of hard-set cement and increases its permeability. A reduction in the wait-on-cement (hardening) time improves the cement’s resistance to corrosion.
- Bond requirements. For clean surfaces (rock or casing), the bond increases with time and under moderate temperatures. Mud cake and dirty casing surfaces significantly reduce the bond between casing or rock and cement.
- Surface roughness of the formation: The roughness of the rock surface plays a significant role in the bond strength. A rough surface provides better mechanical interlocking between the cement and the formation, enhancing the bond strength.
- Formation type: The type of rock surrounding the wellbore (e.g., sandstone, limestone, and shale) affects how well the cement adheres to the formation. Sandstone and carbonate rocks may form better bonds with cement due to their rougher texture and higher porosity compared to more impermeable rocks such as shale.
- Cement composition: The composition and the quantity and type of added water have a crucial effect on the cement’s properties and strength.
- Contamination of the formation face: Contamination during the cementing process significantly impacts the cement–rock bond strength and, consequently, the integrity and long-term stability of the wellbore. Drilling mud, oil, gas, and other contaminants can interfere with cement hydration, alter formation surface properties, and introduce gas pockets or voids within the cement sheath. To mitigate these effects, proper wellbore cleaning, the use of contamination-resistant cement, pre-cementing treatments, and thorough monitoring are essential to ensuring a strong and reliable cement–rock bond. Addressing contamination effectively is key to maintaining well integrity and preventing gas migration, fluid leakage, and well failure [7].
2. Objectives of This Study
- To review the fundamental principles of oil and gas well cementing procedures.
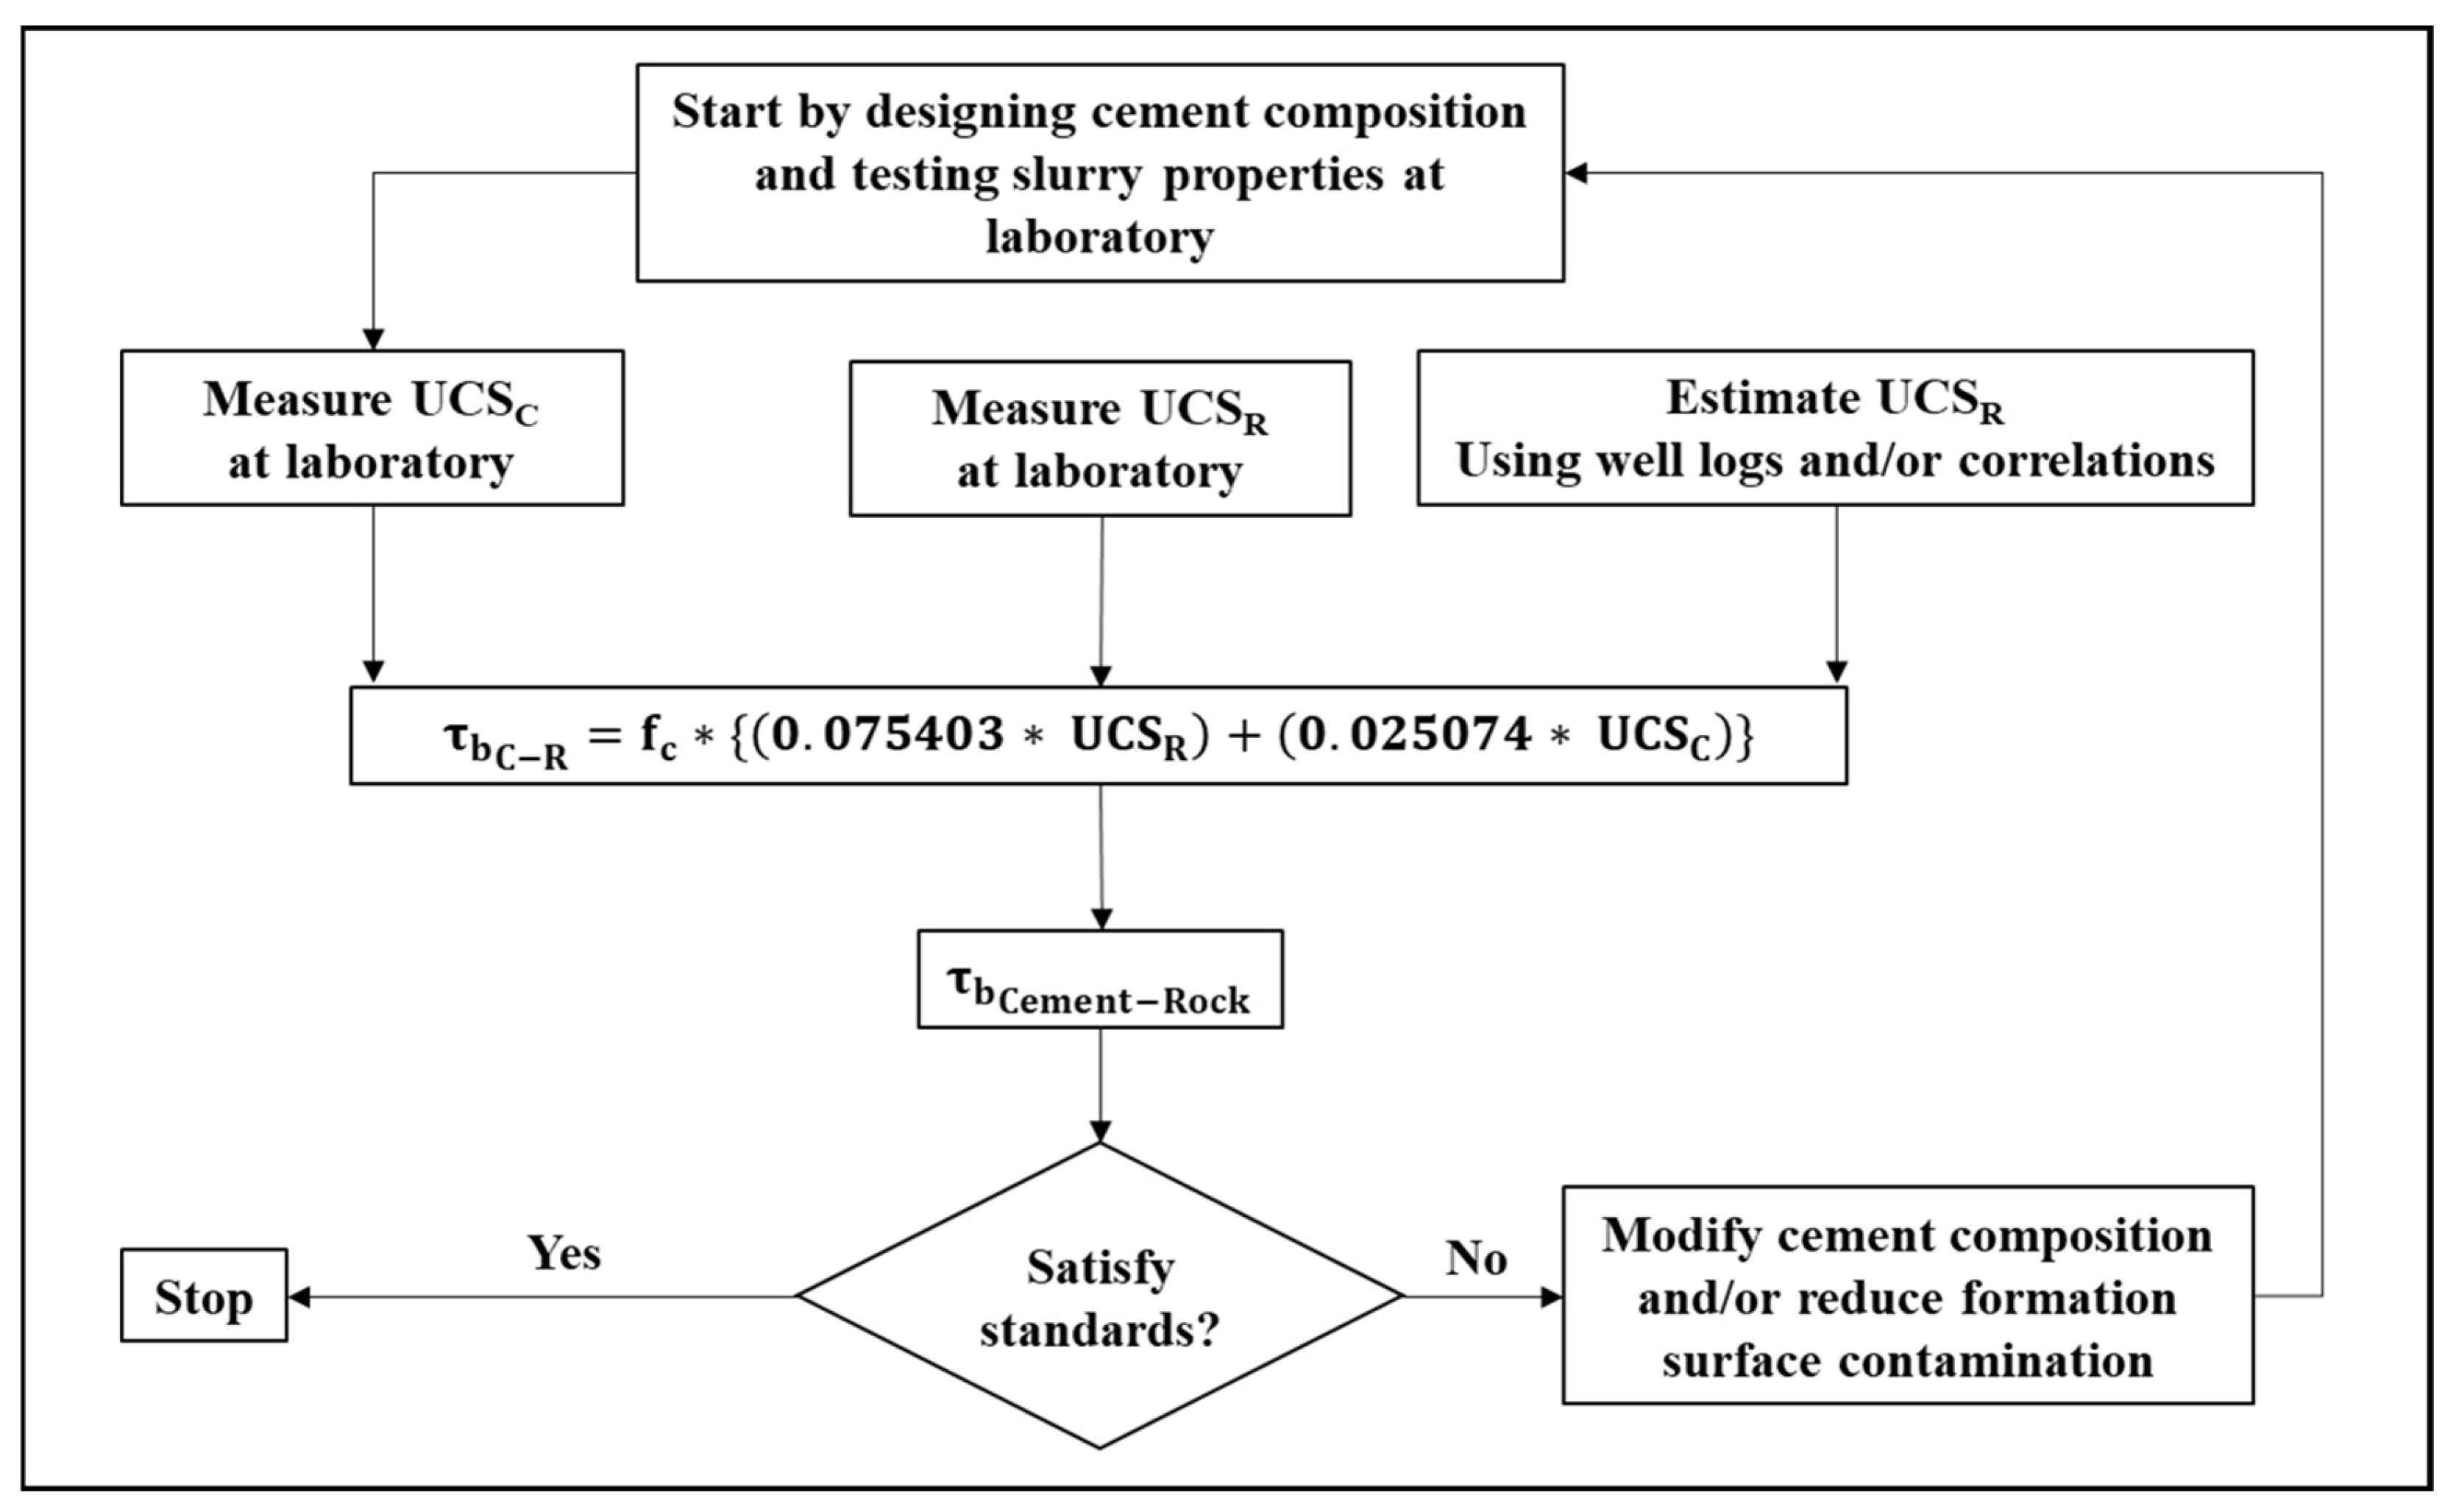
- To develop simple and reliable laboratory testing methods for evaluating the cement–formation sheath bond strength.
- To explore potential reliable correlations for predicting the cement–formation sheath bond strength using the conventional mechanical properties of rock and cement, such as tensile and compressive strength.
3. Raw Materials
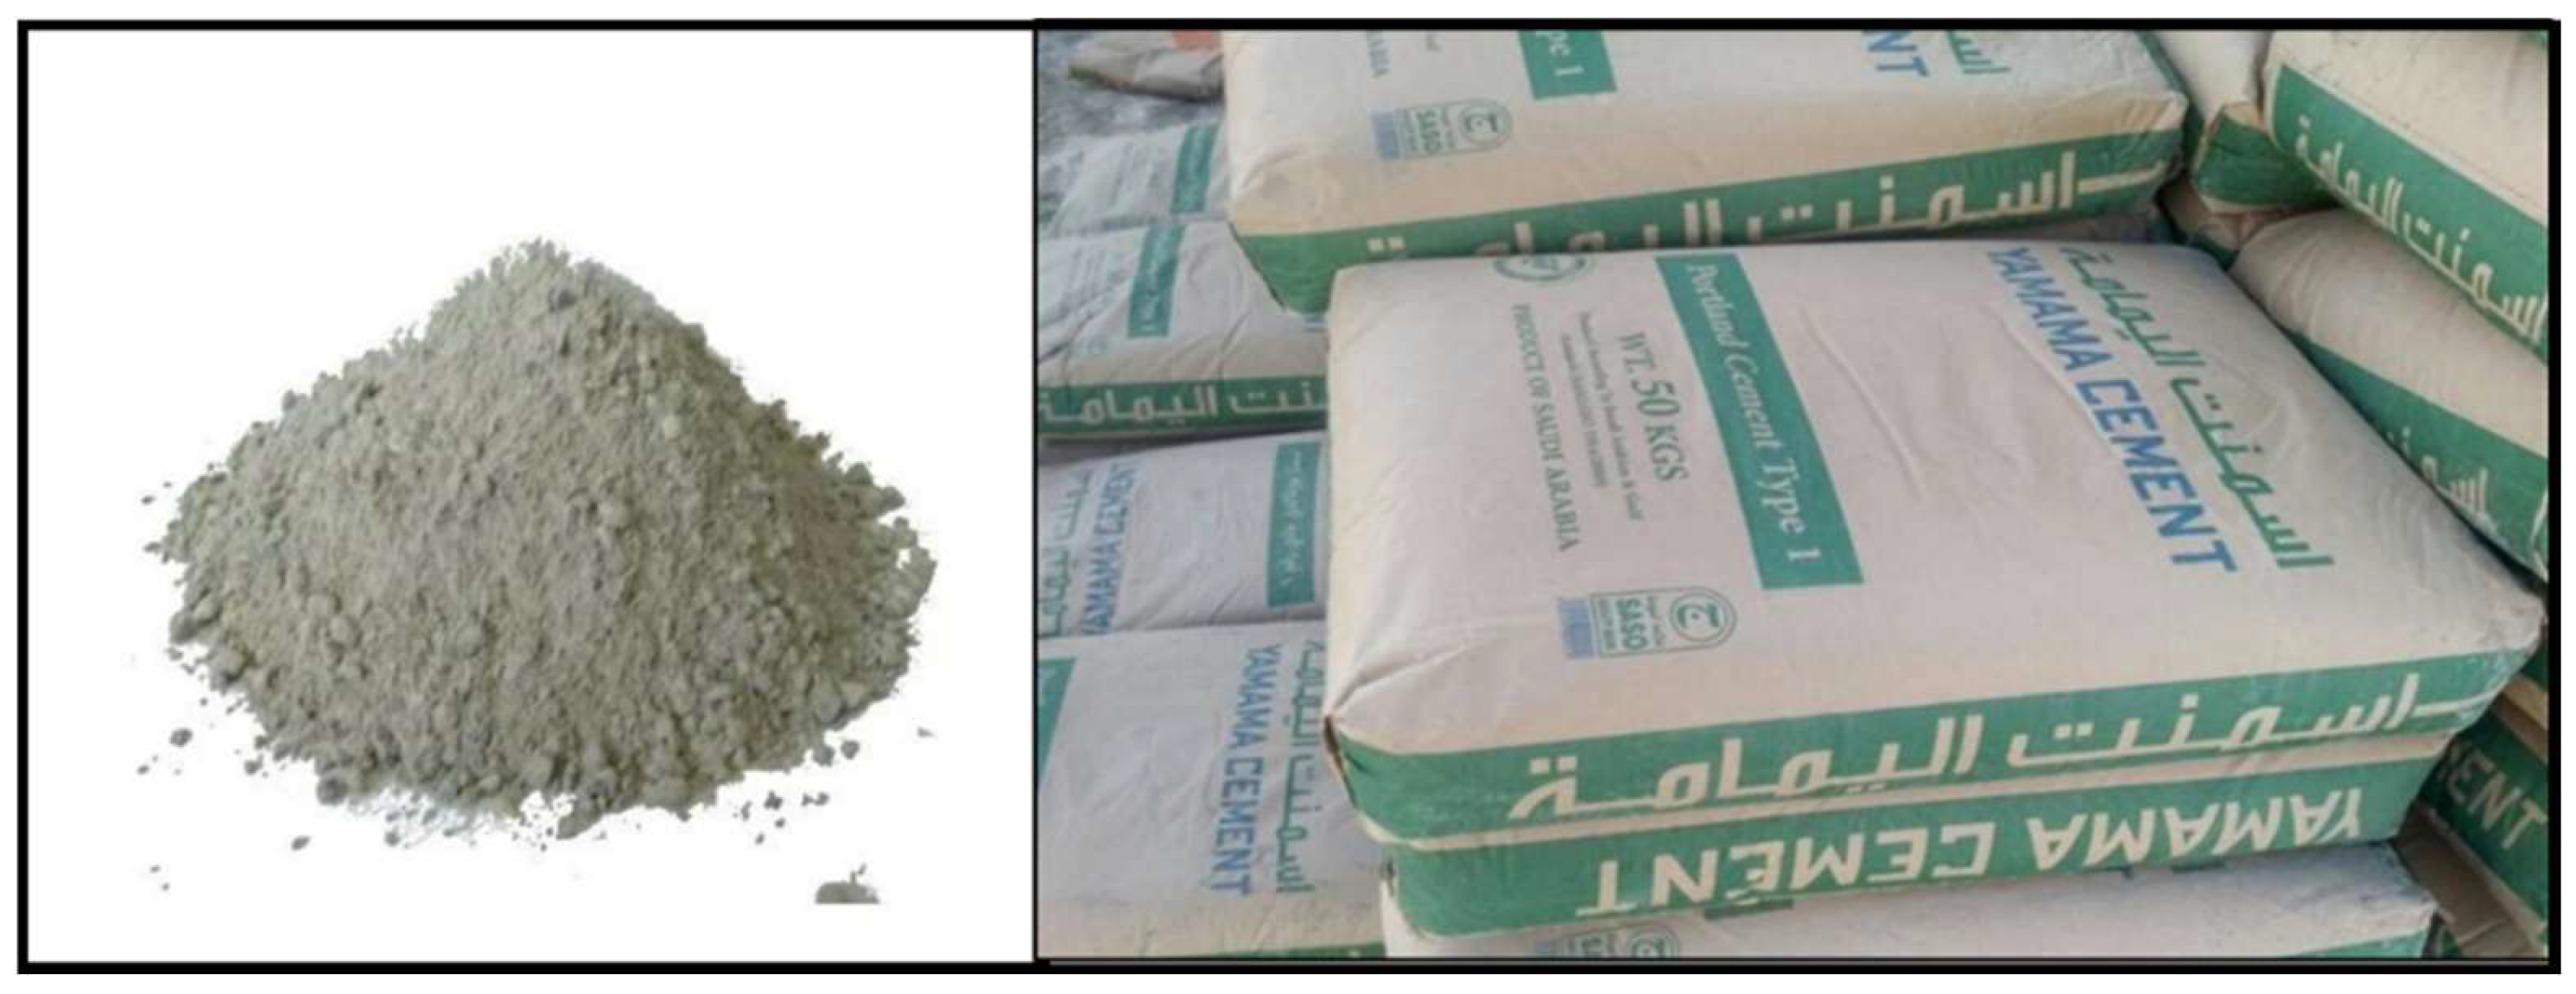
3.1. Cement Powder
3.2. Local Saudi Sand Mixture
3.3. Cement Curing Conditions
3.4. Test Sample Dimensions
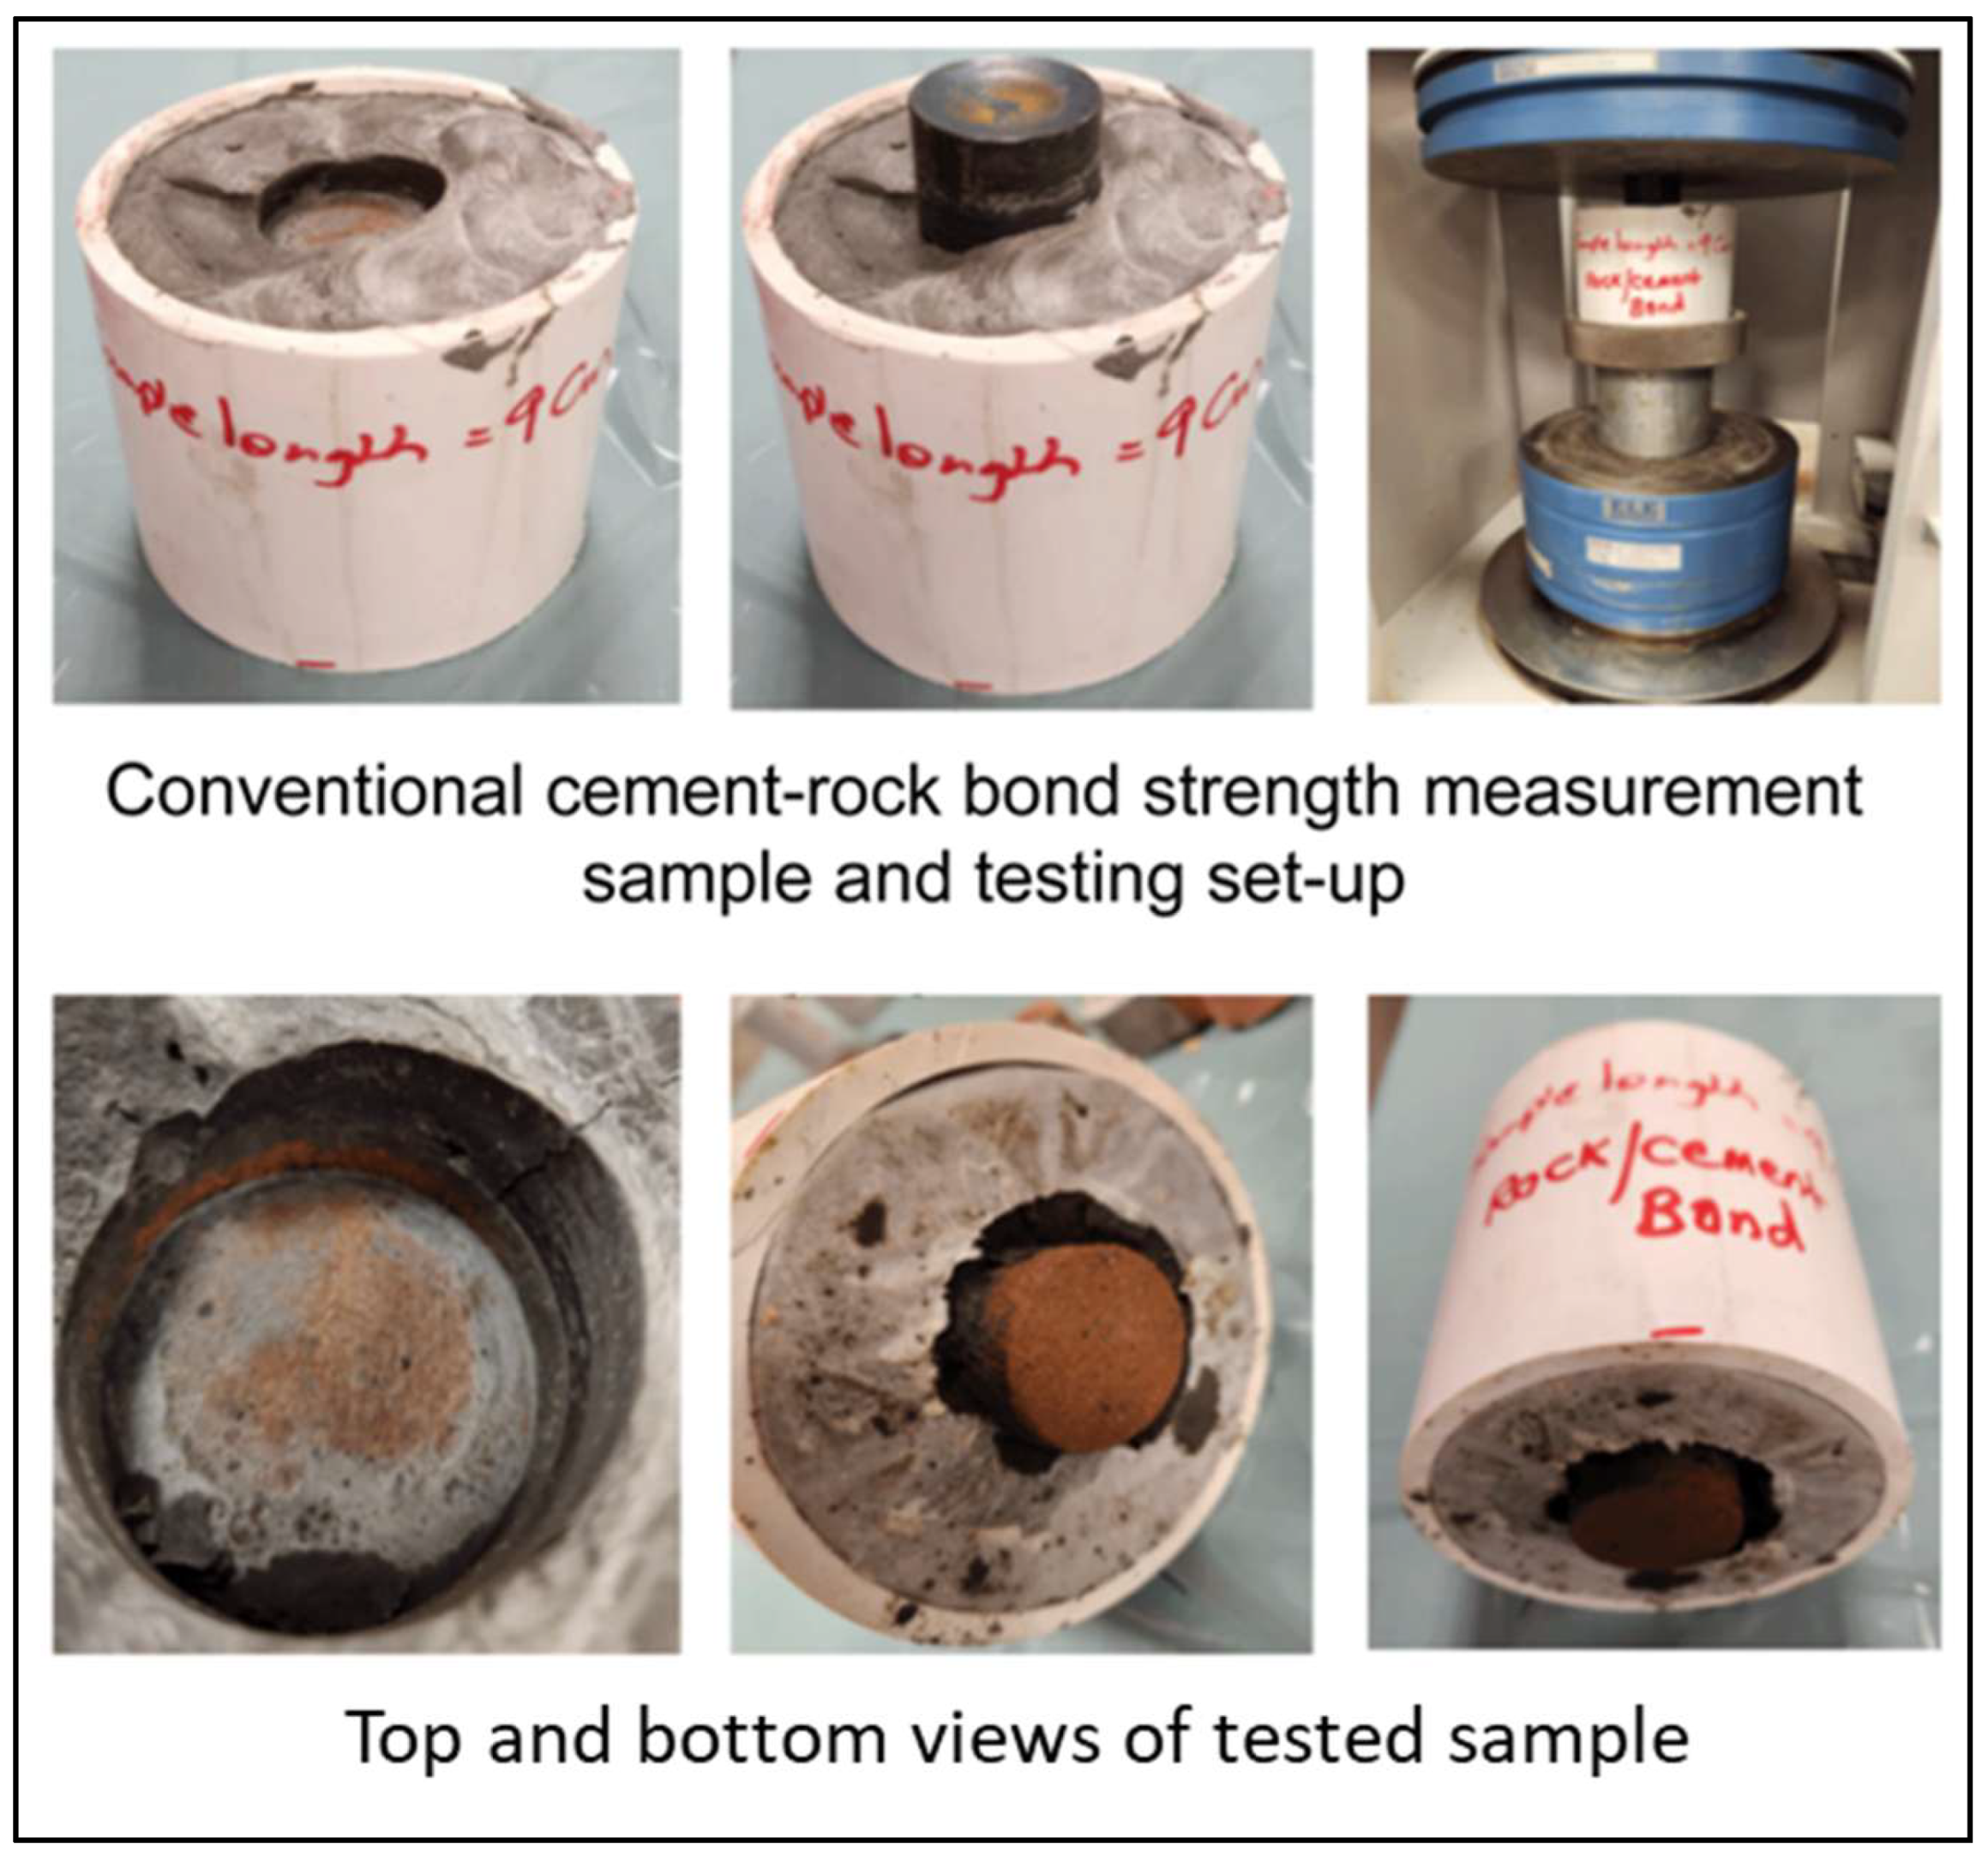
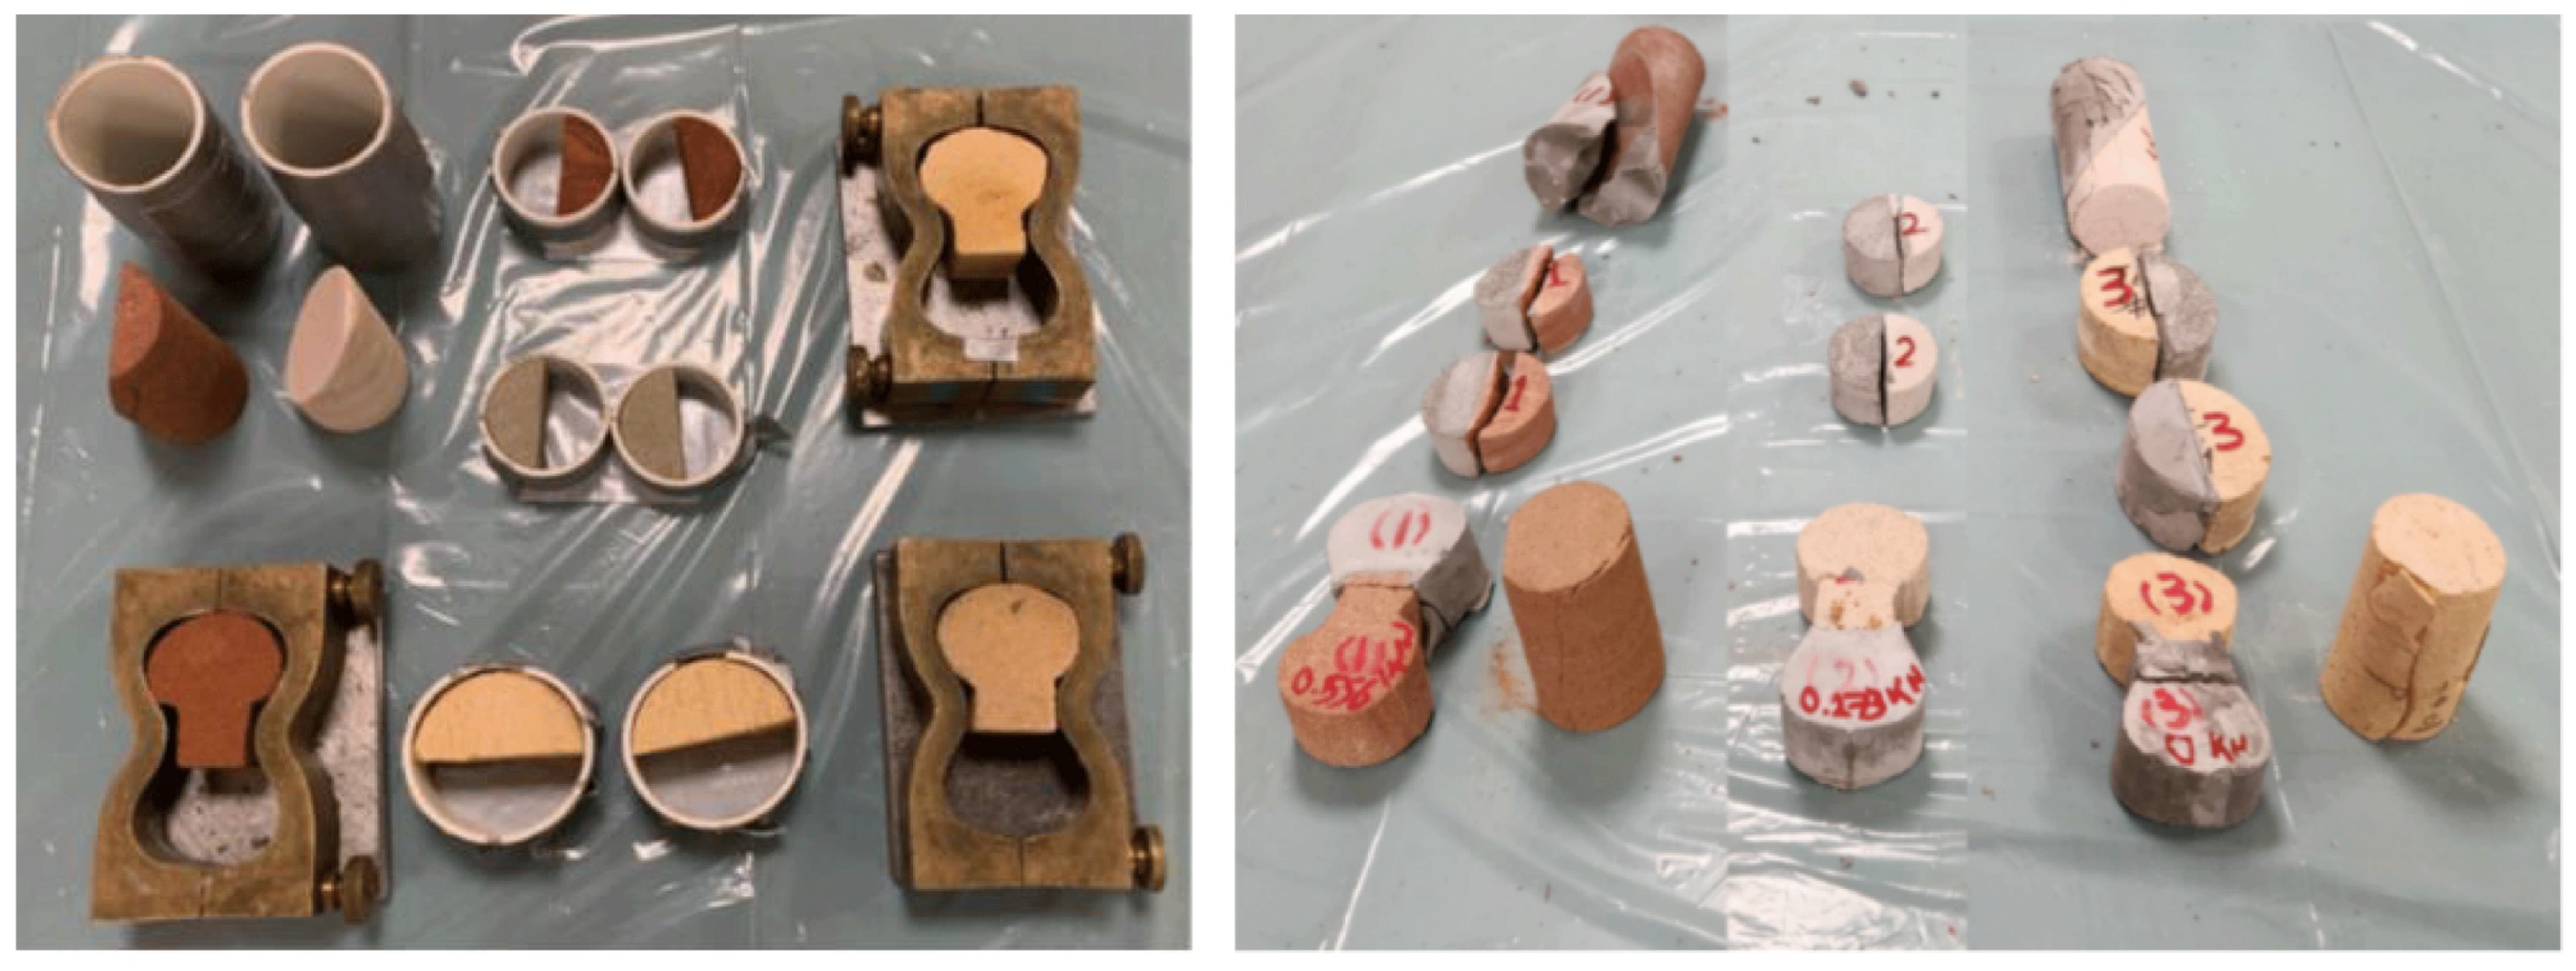
4. Testing Methodologies
4.1. Simulated Cement–Formation Sheath
4.2. Adaption of Conventional Rock Mechanical Tests
4.3. Testing Equipment, Test Sample Preparation, and Test Replication
- Compression test samples: Samples were prepared according to the ISRM Suggested Methods for Rock Characterization, Testing and Monitoring: 2007–2014 [10]. The samples measured 1.5 inches in diameter with a length-to-diameter ratio equal to 2.0.
- Indirect tensile test (Brazilian) samples: Samples were prepared according to the ISRM Suggested Methods for Rock Characterization, Testing and Monitoring: 2007–2014 [10]. The samples measured 1.5 inches in diameter with a thickness-to-diameter ratio equal to 0.5.
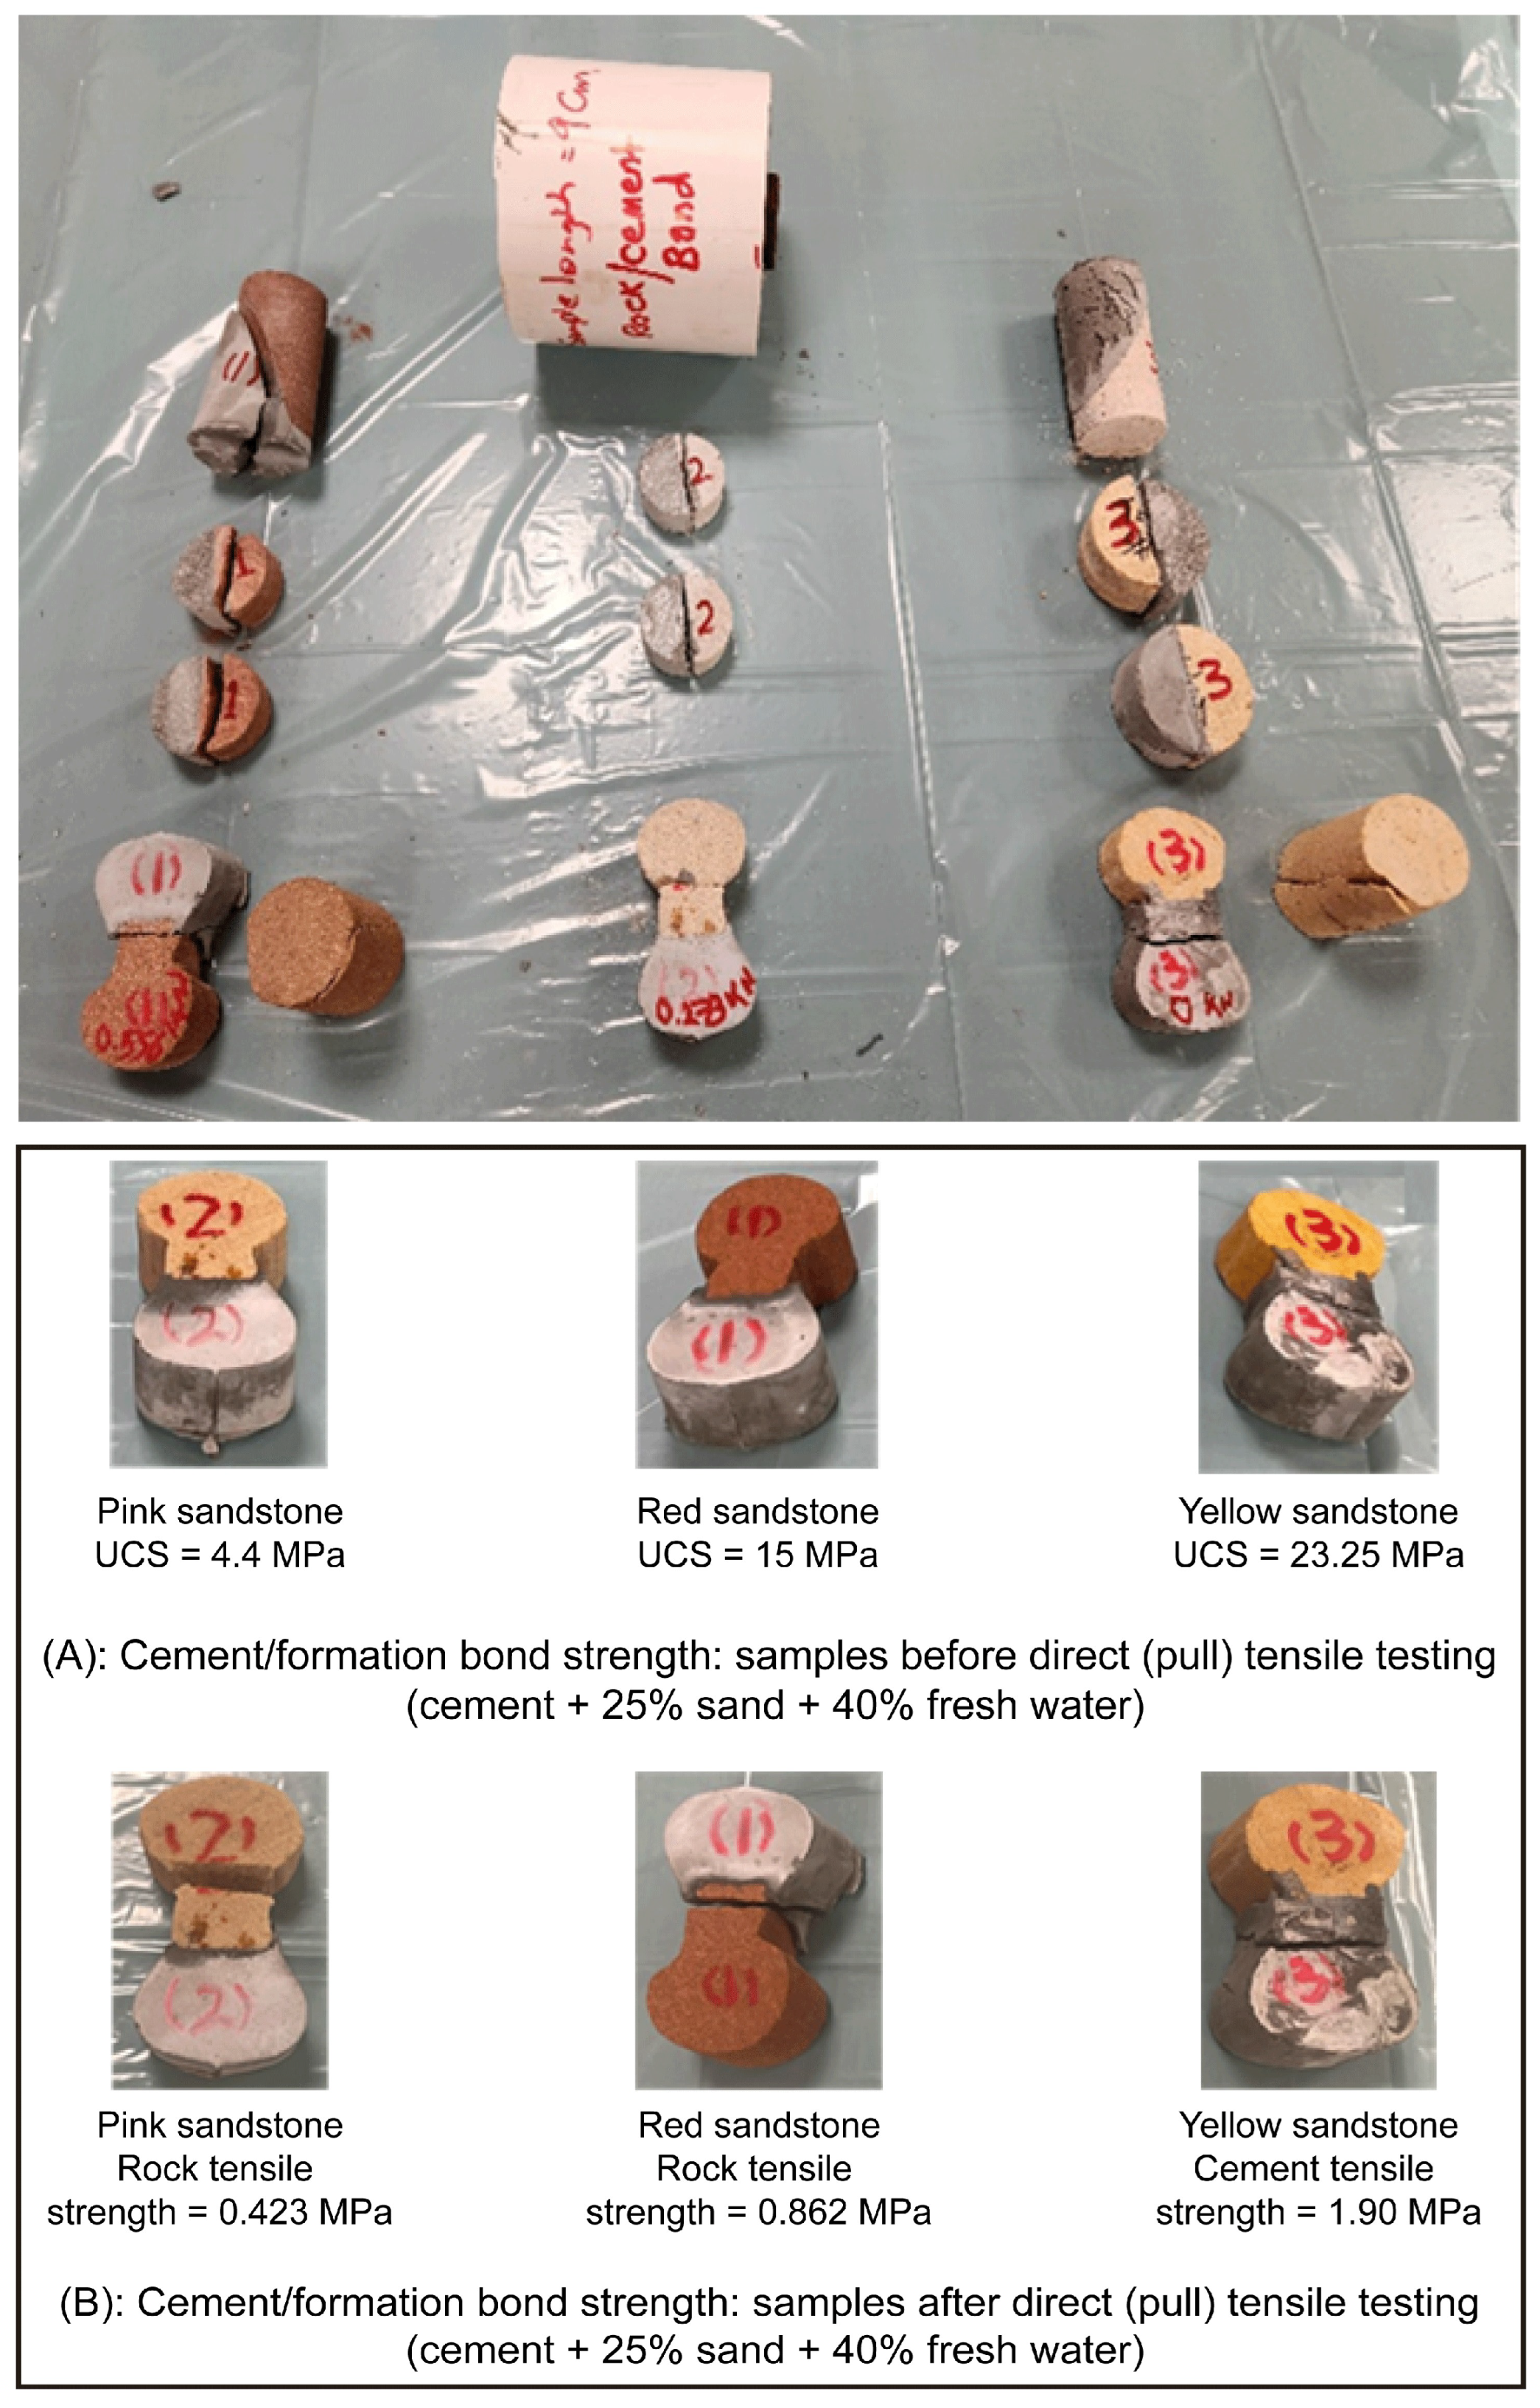
- Direct tensile (Pull) test samples: An automated MATEST tensile tester (MATEST, Treviolo, Italy) was used with tensile briquette molds (1.0 inch × 1.0 inch × 1.7 inches × 2.5 inches) according to ASTM specification C307 [13].
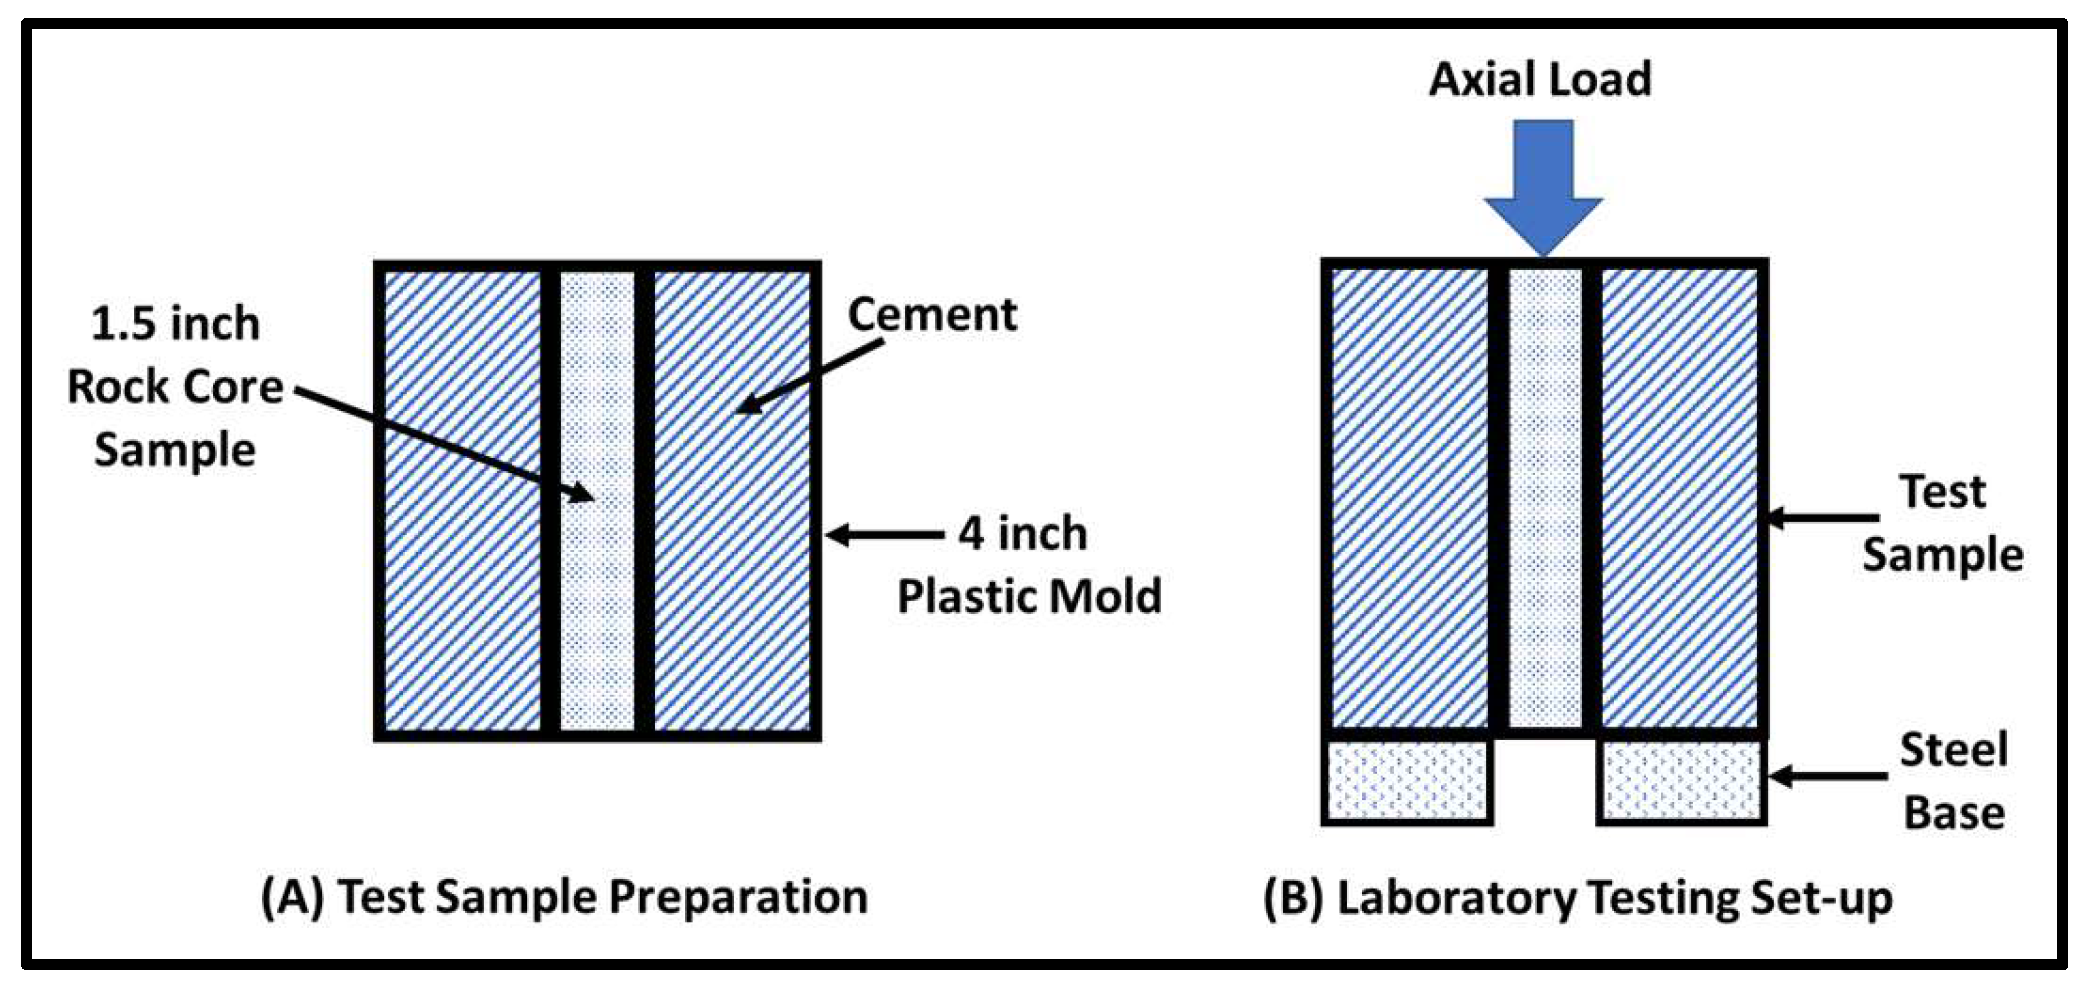
- Cement–rock shear bond strength test samples: Designed by the authors—4.0 inches × 4.7 inches plastic pipe + 1.5 inches × 3.5 inches rock sample.
- Test repeatability: At least two replications per test.
5. Testing Results and Discussion
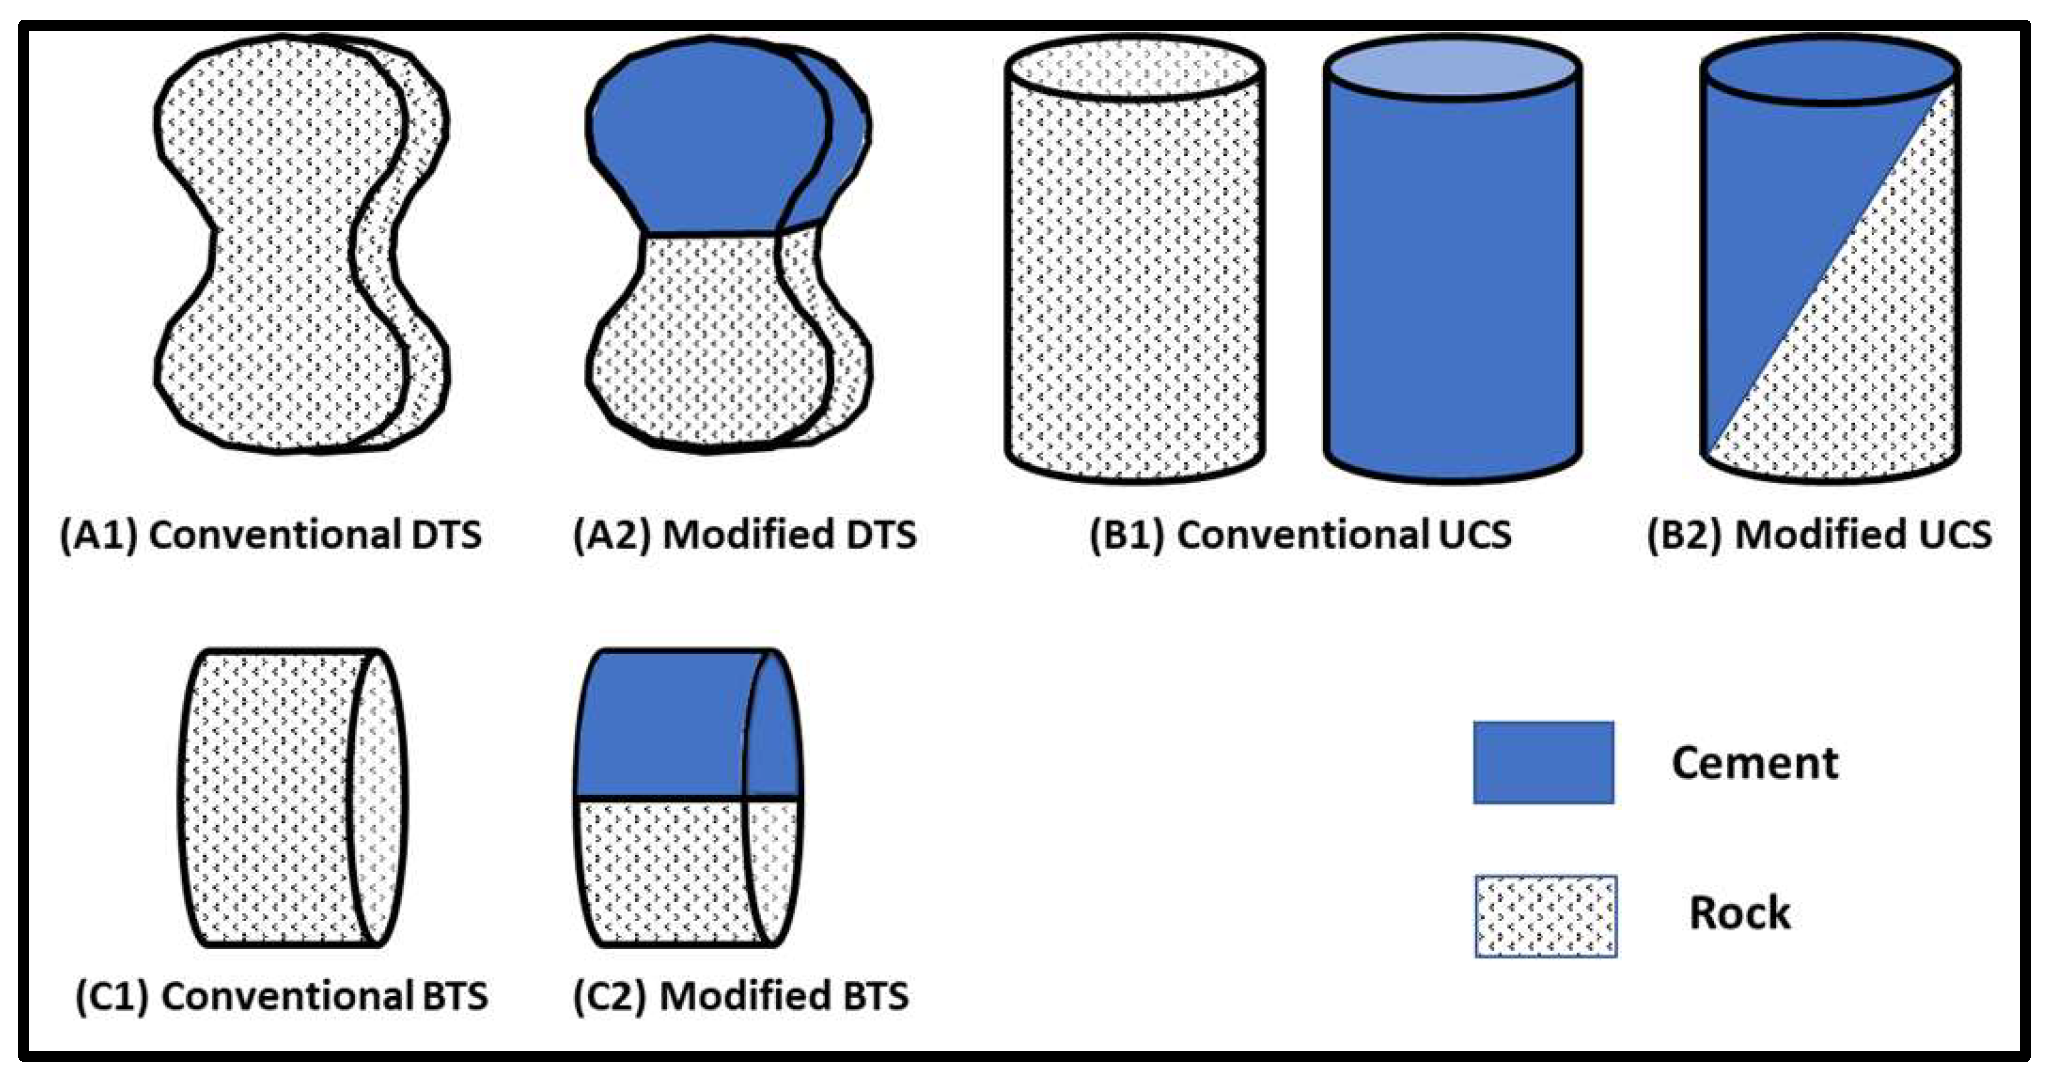
- It is clear that the modified uniaxial compression test, using a cylindrical sample composed of identical halves of cement and rock, provided the best prediction values compared to the modified direct and indirect tensile strength methods, as shown in Table 4.
- The cylindrical rock or cement samples used in the standard conventional uniaxial compression tests are much easier to prepare than those used in the direct and indirect tensile strength tests.
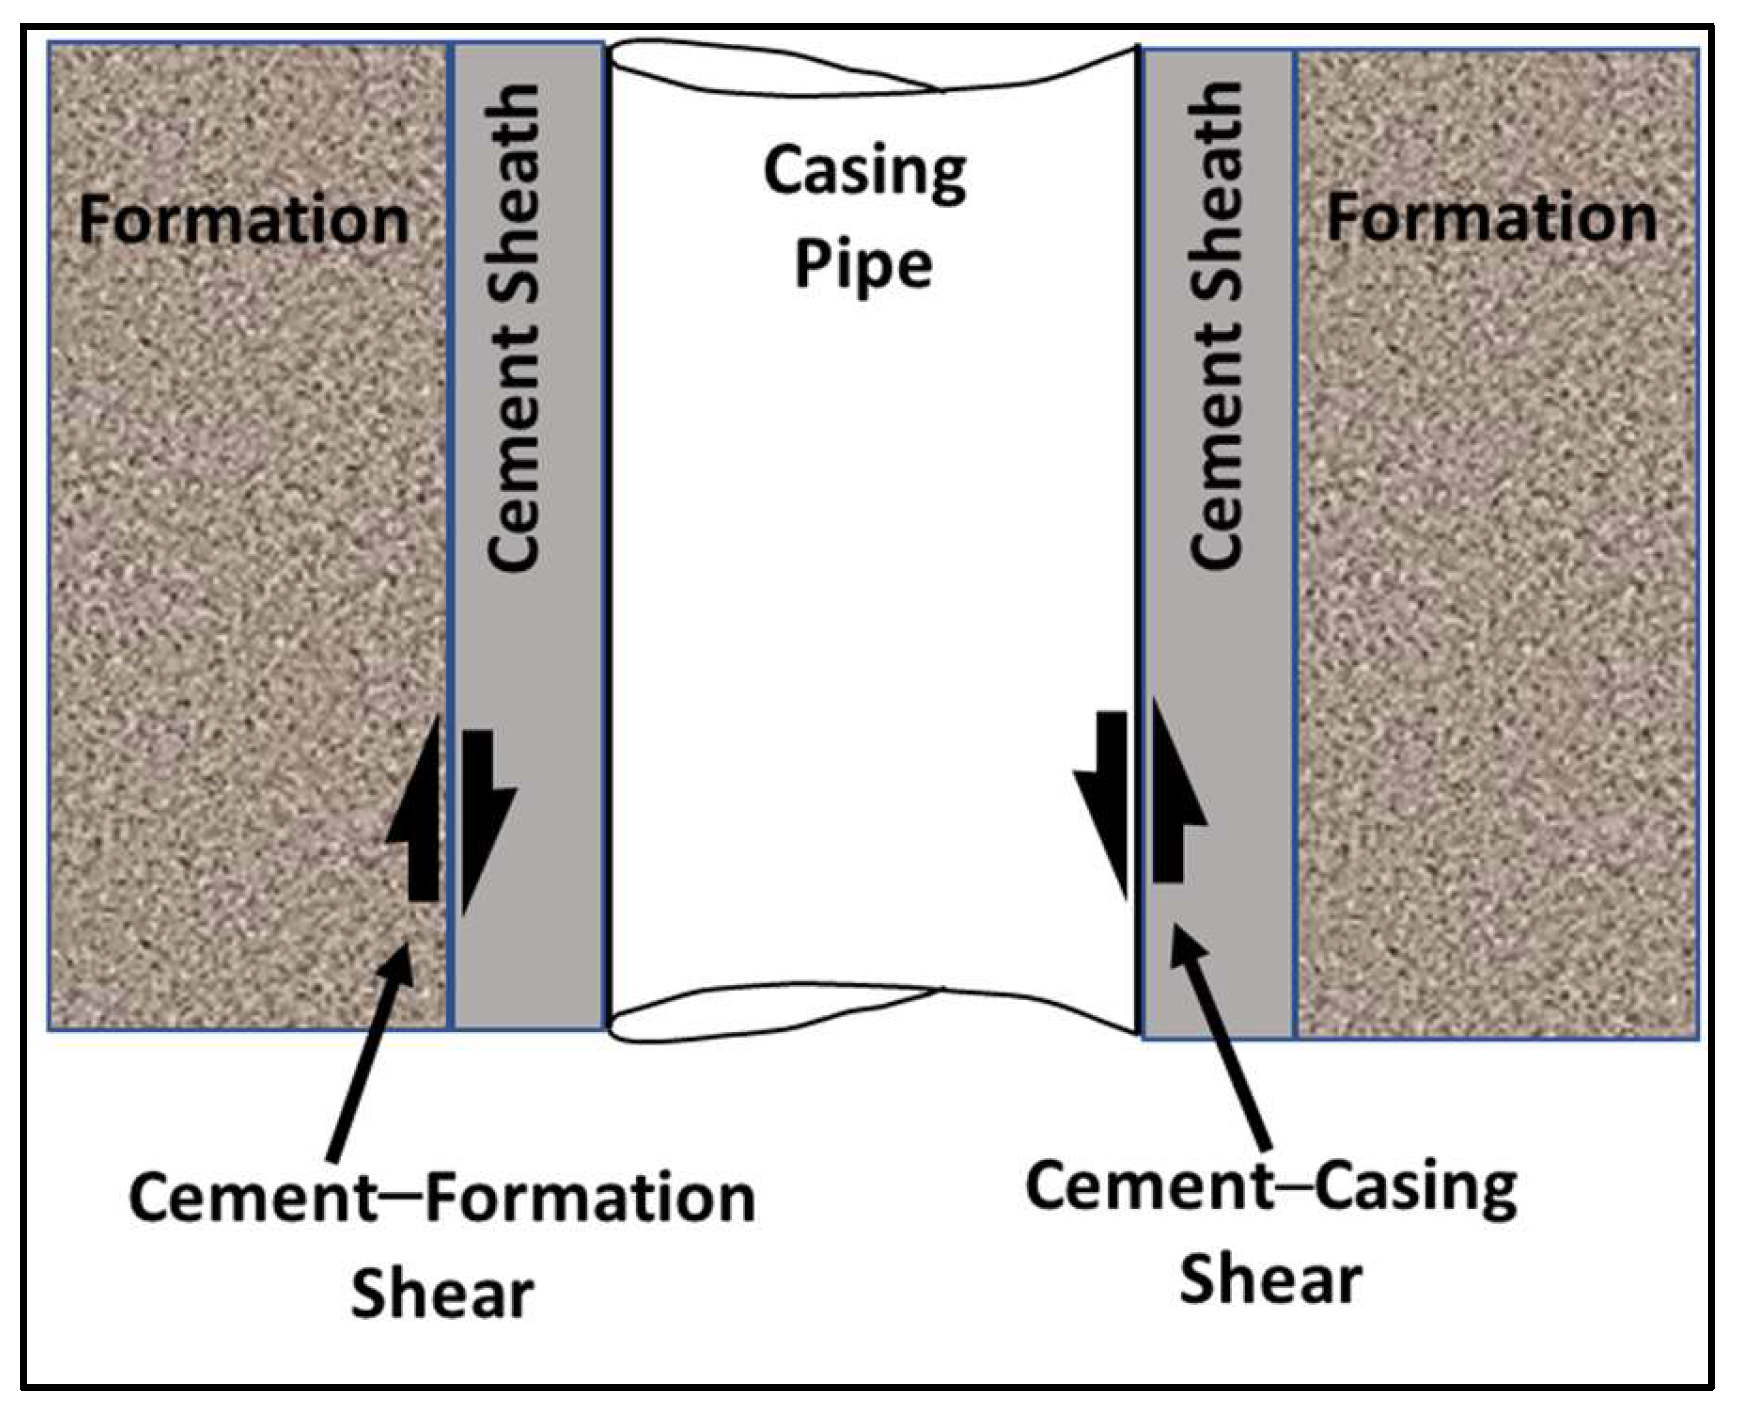
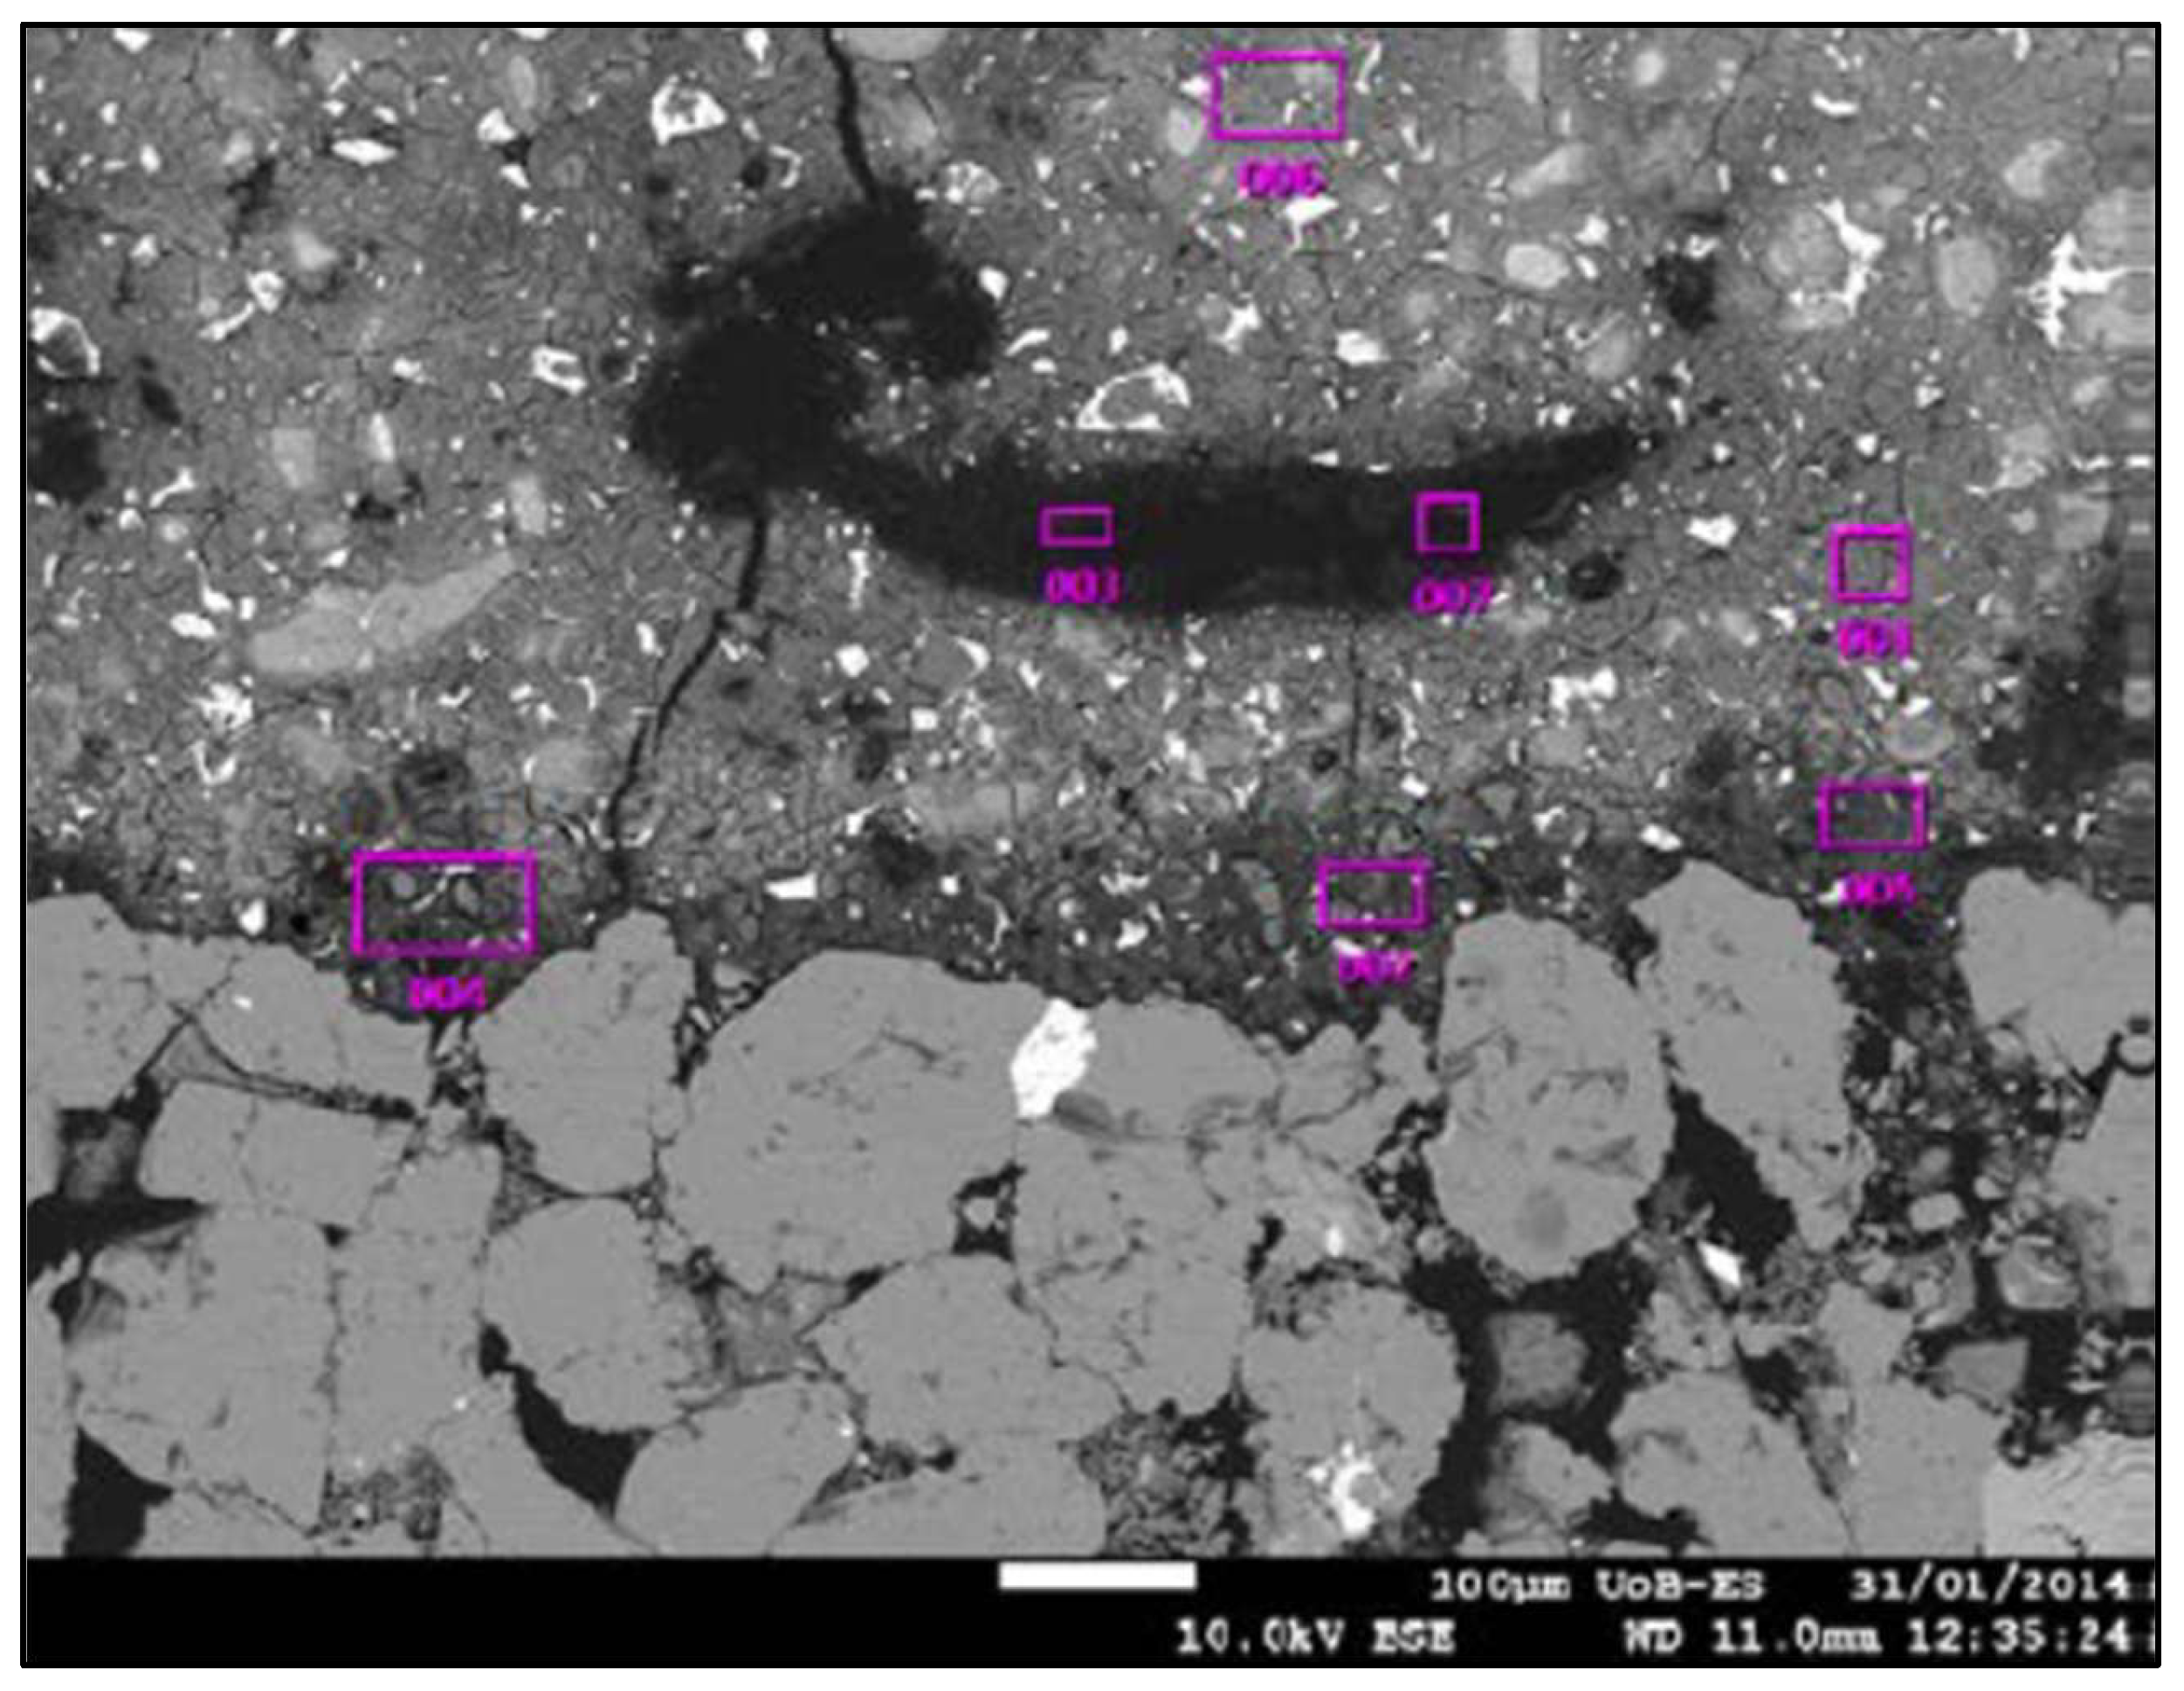
- In this method, the acting effective shear stress is similar to the real situation in an oil well (see Figure 1), while tensile stress is dominant in the other two methods.
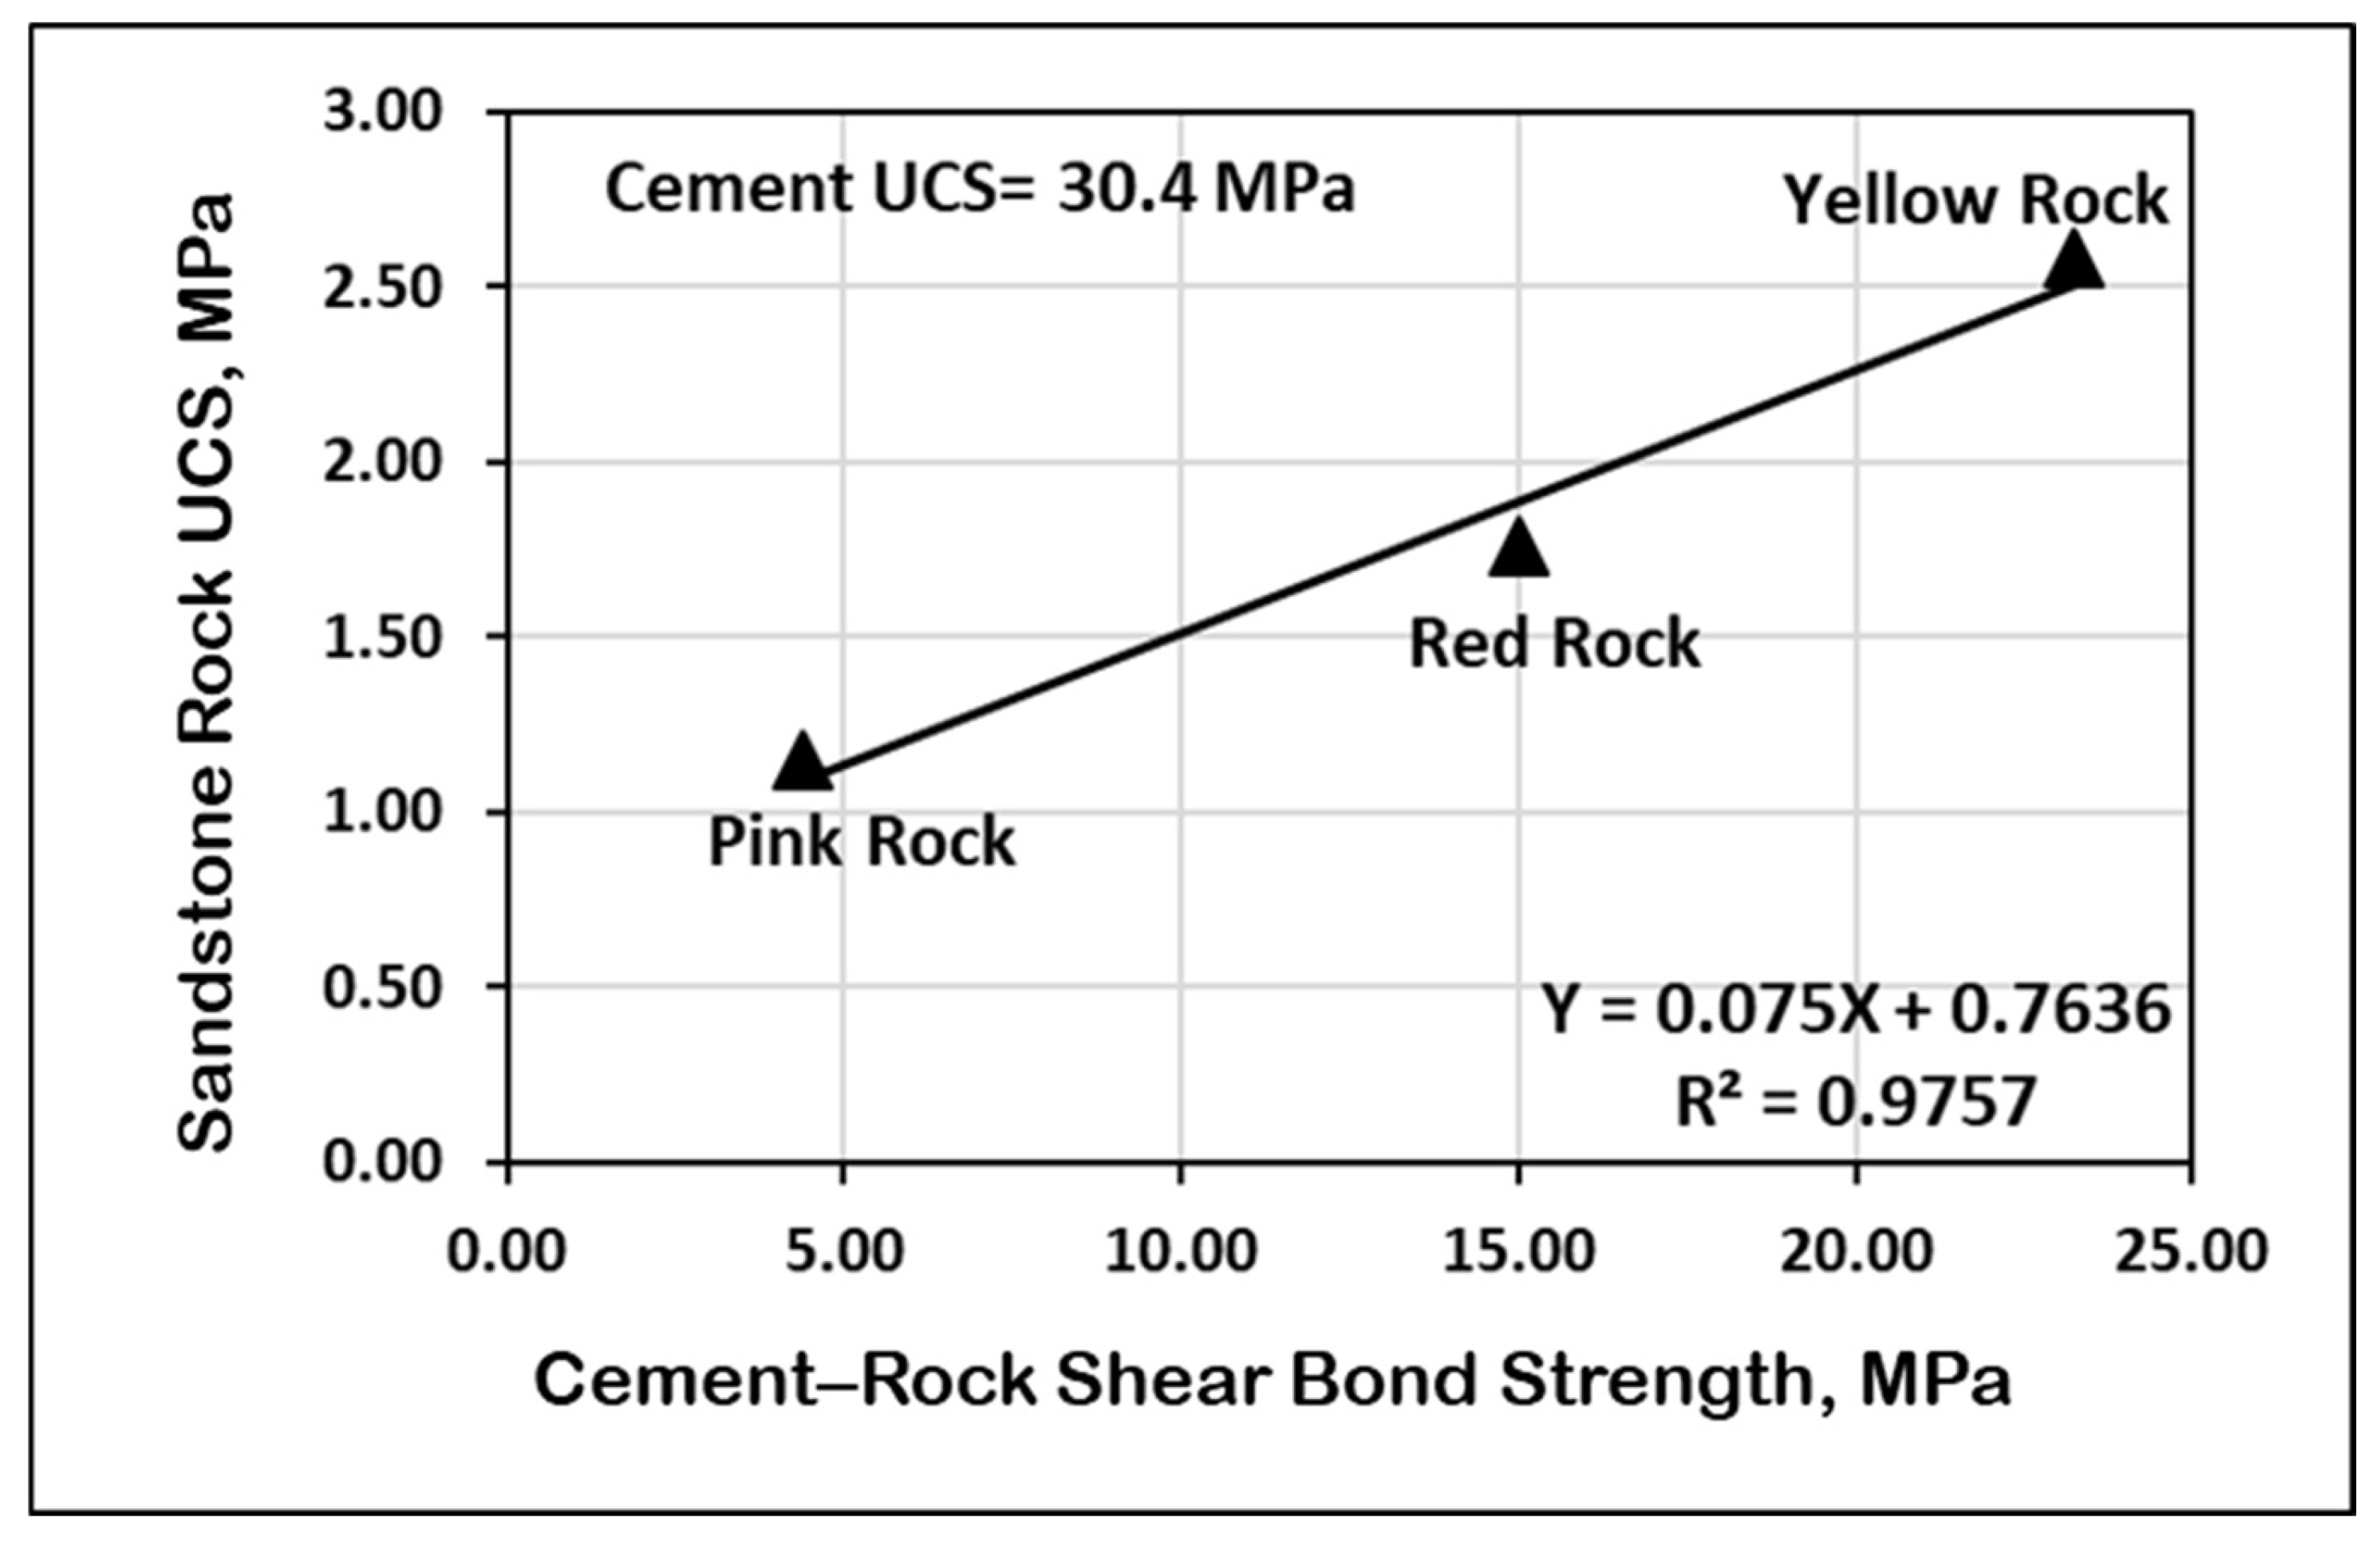
- It is clear that the sandstone rock uniaxial compressive strength is directly proportional to the cement–rock sheath bond strength for the given cement slurry, as shown in Figure 9.
6. Conclusions
- The use of the modified uniaxial compression test to evaluate cement–formation shear bond strength using rock–cement composite specimens provided excellent predictions with an average error of less than 5%.
- The experimental results showed that there is a direct and strong relationship between cement uniaxial compressive strength and cement–formation sheath bond strength.
- The empirical correlation developed in this study can be used for the simple and reliable prediction of cement–rock sheath bond strength (with an average error of 5%) using cement and rock conventional uniaxial compressive strength values.
- The modified uniaxial compression test using cement–rock composite samples can be standardized for cement–rock sheath bond strength laboratory tests after further extensive studies have been conducted using other types of cement, additives, and rocks.
Author Contributions
Funding
Institutional Review Board Statement
Informed Consent Statement
Data Availability Statement
Acknowledgments
Conflicts of Interest
Nomenclature
| UCSC | hard-set cement conventional uniaxial compressive strength, MPa |
| UCSR | formation rock conventional uniaxial compressive strength, MPa |
| cement–rock sheath bond strength using conventional test, MPa | |
| ()C-R | cement–rock sheath bond strength for composite samples, MPa |
| UCSC-R | cement–rock uniaxial compressive strength for composite samples, MPa |
| BTSC-R | cement–rock Brazilian tensile strength for composite samples, MPa |
| DTSC-R | cement–rock direct pull tensile strength for composite samples, MPa |
| rock surface contamination factor, fraction between 0 and 1.0 |
References
- Wojtanowicx, K.; Gahan, A.; Newman, B. Improving Gas Well Cement Jobs with Cement Pulsation. GasTIPS 2001, 2, 29–33. [Google Scholar]
- Jafariesfad, N.; Geiker, M.; Jianying, H. Cement sheath modification using nanomaterials for long-term zonal isolation of oil wells: Review. J. Pet. Sci. Eng. 2017, 156, 662–672. [Google Scholar] [CrossRef]
- Ladva, H.K.J.; Craster, B.; Jones, T.G.J.; Goldsmith, G.; Scott, D. The cement-to-formation interface in zonal isolation. SPE Drill. Complet. 2005, 20, 186–197. [Google Scholar] [CrossRef]
- Slav, I. The Complete Guide to Cementing. Oilprice.com. 23 December 2019. Available online: https://oilprice.com/Energy/Energy-General/The-Complete-Guide-To-Cementing.html (accessed on 24 March 2025).
- Available online: https://www.arab-oil-naturalgas.com/oil-well-cementing-functions-classes-and-equipment/ (accessed on 24 March 2025).
- API RP 10 B-2; Recommended Practice for Testing Well Cements, 2nd ed. American Petroleum Institute: Washington, DC, USA, 2013.
- Nelson, E.B. Well Cementing, 1st ed.; Elsevier: Amsterdam, The Netherlands, 1990; Volume 28, ISBN 9780080868868. Available online: https://shop.elsevier.com/books/well-cementing/nelson/978-0-444-88751-1 (accessed on 24 March 2025).
- Todorovic, J.; Stroisz, A.M.; Bhuiyan, M.H.; Agofack, N.; Integrity, L.; Edvarsen, P.C.; Opedal, N. Cement Bond to Rock and Steel: The Achilles Heel of Well. December 2021. Available online: https://blog.sintef.com/energy/cement-bond-to-rock-and-steel-the-achilles-heel-of-well-integrity/ (accessed on 24 March 2025).
- Yamama Cement, Riyadh, Saudi Arabia. Available online: https://www.yamamacement.com/en/YamamaCement/Pages/NewFactory.aspx (accessed on 24 March 2025).
- Ulusay, R. The ISRM Suggested Methods for Rock Characterization, Testing and Monitoring: 2007–2014. Available online: https://link.springer.com/book/10.1007/978-3-319-07713-0 (accessed on 24 March 2025).
- ISO EN 7500-1; Part 1: Tension/Compression Testing Machines—Calibration and Verification of the Force-Measuring System, 5th ed. The International Organization for Standardization (ISO): Geneva, Switzerland, 2018.
- ASTM E4-10; Standard Practices for Force Verification of Testing Machines. ASTM International: West Conshohocken, PA, USA, 2010.
- ASTM C307-18; Standard Test Method for Tensile Strength of Chemical-Resistant Mortar, Grouts, and Monolithic Surfacings. ASTM International: West Conshohocken, PA, USA, 2023.
- Oyibo, A.; Radonjic, M. Impact of Physical and Chemical Mud Contamination on Wellbore Cement Formation Shear Bond Strength. In Proceedings of the 2014 AADE Fluids Technical Conference and Exhibition, Houston, TX, USA, 15–16 April 2014; Available online: https://www.aade.org/application/files/7015/7260/3857/AADE-14-FTCE-19.pdf (accessed on 24 March 2025).
- Cao, Y.; Zhang, Y.; Wang, Y. The effect of temperature on the mechanical properties of oil well cement. Mater. Sci. Energy Technol. 2022, 5, 100–106. [Google Scholar] [CrossRef]
- Prasetyo, A.M.A.; Lisantono, A. Compressive and Shear Bond Strength of Oil Well Cement with Calcium Carbonate and Silica Fume. J. Tek. Sipil 2016, 13, 255–259. [Google Scholar] [CrossRef]
- Gao, Y.; Zhang, Y. The effect of high temperature on the mechanical properties of oil well cement. J. Pet. Sci. Eng. 2022, 208, 109408. [Google Scholar] [CrossRef]
- Huang, C.; Zhang, Y. The influence of temperature and pressure on the mechanical properties of oil well cement. Energy Rep. 2021, 7, 123–130. [Google Scholar] [CrossRef]
- Wang, L.; Liu, B.; Guo, Y.; Li, J.; Yang, H.; Liu, H.; Heng, S. Experimental Investigation of The Cementation and Tensile Properties of Cement to Formation Interface Considering Surface Irregularity and Drilling Mud Residue. J. Pet. Explor. Prod. Technol. 2023, 13, 705–721. [Google Scholar] [CrossRef]
- Lichingaa, K.N.; Maagia, M.T.; Ntawangaa, A.C.; Haoa, H.; Gua, J. A Novel Preflush to Improve Shear Bond Strength at Cement-Formation Interface and Zonal Isolation. J. Pet. Sci. Eng. 2020, 195, 107821. [Google Scholar] [CrossRef]
- Bathija, A.P.; Boul, P.J. An Integration Approach to Study Cement-To-Formation Bonding. Energies 2022, 15, 5949. [Google Scholar] [CrossRef]
- Radonjic, M.; Oyibo, A.E. Comparative Experimental Evaluation of Drilling Fluid Contamination on Shear Bond Strength at Wellbore Cement Interfaces. World J. Eng. 2014, 2, 597–604. [Google Scholar] [CrossRef]
- Bai, Y.; Zhang, Y.; Zhang, Y. Effects of silica fume on the properties of oil well cement. Constr. Build. Mater. 2021, 272, 121999. [Google Scholar] [CrossRef]
- Bai, Y.; Zhang, Y.; Zhang, Y. Experimental study on the mechanical properties of oil well cement with different additives. J. Pet. Sci. Eng. 2020, 184, 106570. [Google Scholar] [CrossRef]
- Elkatatny, S.; Mahmoud, A.A. The effect of nanoparticles on the properties of oil well cement. Materials 2020, 13, 646. [Google Scholar] [CrossRef]
- Radonjic, M.; Oyibo, A. Experimental Evaluation of Wellbore Cement-Formation Shear Bond Strength in Presence of Drilling Fluid Contamination. In Proceedings of the 5th International Conference on Porous Media and Their Applications in Science, Engineering and Industry, Kona, HI, USA, 22–27 June 2014; Available online: http://dc.engconfintl.org/porous_media_V/17 (accessed on 24 March 2025).
- Guo, S.; Bu, Y. The effect of different additives on the properties of oil well cement. Constr. Build. Mater. 2020, 261, 120000. [Google Scholar] [CrossRef]
- Oyibo, A.; Radonjic, M. Impact of Physical and Chemical Mud Contamination on Cement-Formation Shear Bond Strength. In Proceedings of the ASME 2014 33rd International Conference on Ocean, Offshore and Arctic Engineering, Materials Technology, Petroleum Technology, San Francisco, CA, USA, 8–13 June 2014; Volume 5. V005T11A023. [Google Scholar] [CrossRef]
- Jun, G.; Baolin, Y.; Yijun, Y.; Chao, M.; Jibiao, H.; Ke, L. Impact Evaluation of Mud Cake Thickness on Shearing Strength at Cement-Formation Interface. Appl. Mech. Mater. 2012, 166–169, 1337–1340. [Google Scholar]
- Chen, Y.; Zhang, Y.; Wang, H. Influence of polymer additives on the properties of oil well cement. J. Nat. Gas Sci. Eng. 2023, 104, 104706. [Google Scholar] [CrossRef]
- Arbad, N.; Teodoriu, C. A Review of Recent Research on Contamination of Oil Well Cement with Oil-based Drilling Fluid and the Need of New and Accurate Correlations. ChemEngineering 2020, 4, 28. [Google Scholar] [CrossRef]


| API Class | Description | Depth Range, ft | Temperature Range, °F |
|---|---|---|---|
| A | Up to 6000 feet | 80–170 | |
| B | High sulfate resistance | Up to 6000 feet | 111–200 |
| C | High temperature and sulfate resistance | Up to 6000 feet | 80–170 |
| D | Moderate to high sulfate resistance, high pressure resistance, and high hydration heat | 6000–10,000 | 80–290 |
| E | Moderate to high sulfate resistance, high pressure resistance, and high hydration heat | 10,000–14,000 | 200–290 |
| F | Can withstand the highest pressure and temperatures | Up to 10,000 | 160–320 |
| G | Used with additives, called accelerators and retarders, to either shorten or lengthen setting times | Up to 8000 | 111–230 |
| H | Coarser than Class G cement | Up to 8000 | 80–350 |
| J | Class J cement is used in deep, high-temperature wells where conventional cements may not be suitable | Up to 16,000 | Up to 400 |
| ASTM Type | Applications | |
|---|---|---|
| I | Ordinary cement | Used at low pressure, temperature, and depth |
| II | Modified cement | Used for low-shrinkage applications |
| III | Fast-setting cement | Used in high early setting applications |
| IV | Low-heat-hydration cement | Used in deep thermal applications |
| V | Highly sulfate-resistant cement | Used in corrosive environments |
| Chemical Component | Weight % | |
|---|---|---|
| 1 | Lime (CaO) | 60–67 |
| 2 | Silica (SiO2) | 17–25 |
| 3 | Alumina (Al2O3) | 3–8 |
| 4 | Iron oxide (Fe2O3) | 0.5–6 |
| 5 | Magnesia (MgO) | 0.1–4 |
| 6 | Sulfur trioxide (SO3) | 1–3 |
| 7 | Soda and/or Potash (Na2O + K2O) | 0.5–1.3 |
| Rock Properties | Cement–Rock Bond Strength Evaluation Methods | |||||
|---|---|---|---|---|---|---|
| Sandstone Rock Type | (Cement + 40% Fresh Water + 25% Sand) Measured Cement Uniaxial Compressive Strength, MPa | Measured Rock Uniaxial Compressive Strength, MPa | Conventional | Unconventional | ||
| Cement–Rock Shear Bond Strength, MPa | Uniaxial Compressive Strength of Cement–Rock Composite Sample, MPa | Brazilian Tensile Strength of Cement–Rock Composite Sample, MPa | Direct Pull Tensile Strength of Cement–Rock Composite Sample, MPa | |||
| UCSC | UCSR | (τb)C-R | UCSC-R | BTSC-R | DTSC-R | |
| Pink | 30.40 | 4.40 | 1.15 | 6.72 | 1.40 | 0.43 |
| Red | 30.40 | 15.0 | 1.76 | 11.58 | 2.33 | 0.86 |
| Yellow | 30.40 | 23.25 | 2.58 | 16.32 | 2.72 | 1.90 |
| Average Values | 1.830 | 11.54 | 2.15 | 1.063 | ||
| Cement–Rock Contact Area, in2 | 16.7 | 5.0 | 1.25 | 1.0 | ||
| Rock Type | Cement–Rock Bond Strength Evaluation Methods | ||||||
|---|---|---|---|---|---|---|---|
| Measured τb, MPa (Conventional Test, Figure 7) | Predicted (τb)C-R, MPa (Cement–Rock Composite Samples, Figure 8) | ||||||
Using Equation (6) | Using Equation (7) | Using Equation (8) | |||||
| Value | Error, % | Value | Error, % | Value | Absolute Error, % | ||
| Pink Sandstone | 1.15 | 1.069 | 7.04 | 1.191 | 3.56 | 0.741 | 35.57 |
| Red Sandstone | 1.76 | 1.841 | 4.60 | 1.982 | 12.61 | 1.481 | 15.85 |
| Yellow Sandstone | 2.58 | 2.595 | 0.58 | 2.315 | 10.27 | 3.272 | 26.82 |
| Average Error, % | - | - | 4.1 | - | 8.8 | - | 26.1 |
| Sandstone Rock Type | Measured at Laboratory | Predicted Using Equation (9) | Absolute Error, % | ||
|---|---|---|---|---|---|
| UCS Rock, MPa | UCS Cement, MPa | Cement–Rock Bond Strength, MPa | Cement–Rock Bond Strength, MPa | ||
| Pink | 4.4 | 30.4 | 1.15 | 1.104 | 4.0 |
| Red | 15.0 | 30.4 | 1.76 | 1.893 | 7.6 |
| Yellow | 23.25 | 30.4 | 2.58 | 2.515 | 2.52 |
| Test Type | Methodology | Advantages and Disadvantages |
| Conventional cement–rock shear bond strength test (Figure 4 and Figure 6) | Provides direct evaluation of cement–rock sheath bond strength using critically tedious laboratory testing set-up |
|
| Uniaxial compressive strength test using cement–rock composite samples (Equation (6)) | Provides indirect evaluation of cement–rock sheath bond strength using the evaluation of the laboratory modified uniaxial compressive strength using cement–rock composite samples |
|
| Predicted cement–rock shear bond strength using the developed empirical correlation (Equation (10)) | Provides indirect evaluation of cement–rock sheath bond strength using the evaluation of the laboratory conventional uniaxial compressive strength for cement and for formation rock separately |
|
| Test Specimen | Laboratory–Measured | Predicted Cement–Rock Shear Bond Strength Using Equation (10), MPa | Ref. | |||
|---|---|---|---|---|---|---|
| UCS, MPa | Cement–Rock Bond Shear Strength, MPa | |||||
| Absolute Error, % | ||||||
| Class H Cement | 20 | - | - | - | - | [30] |
| Mancos Shale | 10 | - | - | - | - | |
| Cement–Shale | - | 1.71 | 1.0 | 1.73 | 1.2 | |
| Portland Cement | 50 | - | - | - | - | [31] |
| Cement–Berea | 58 | - | - | - | - | |
| Cement–Berea | - | 5.1 | 1.0 | 4.71 | 7.7 | |
| Portland Cement | 30.4 | - | - | - | - | This Study |
| Pink Sandstone | 4.4 | - | - | - | - | |
| Cement–Pink Sandstone | - | 1.15 | 1.0 | 1.104 | 4.0 | |
| Portland Cement | 30.4 | - | - | - | - | This Study |
| Red Sandstone | 15 | - | - | - | - | |
| Cement–Red Sandstone | - | 1.76 | 1.0 | 1.893 | 7.6 | |
| Portland Cement | 30.4 | - | - | - | - | This Study |
| Yellow Sandstone | 23.5 | - | - | - | - | |
| Cement–Yellow Sandstone | - | 2.58 | 1.0 | 2.515 | 2.52 | |
| Overall Average Absolute Error | 4.6% | |||||
| Parameters | Name | Description | Sensitivity |
|---|---|---|---|
| Formation rock surface contamination factor |
| Increase and decrease | |
| Increase and decrease | ||
| Decrease and increase | ||
| Formation rock uniaxial compressive strength |
| Constant | |
| Decrease and decrease | ||
| Cement rock uniaxial compressive strength |
| Increase and increase | |
| Variable | ||
| Optimum cement/water ratio provides optimum strength for cement and for sheath bond strength | ||
| Decrease and decrease | ||
| Increase and increase | ||
| Increase and increase | ||
| Decrease and decrease |
Disclaimer/Publisher’s Note: The statements, opinions and data contained in all publications are solely those of the individual author(s) and contributor(s) and not of MDPI and/or the editor(s). MDPI and/or the editor(s) disclaim responsibility for any injury to people or property resulting from any ideas, methods, instructions or products referred to in the content. |
© 2025 by the authors. Licensee MDPI, Basel, Switzerland. This article is an open access article distributed under the terms and conditions of the Creative Commons Attribution (CC BY) license (https://creativecommons.org/licenses/by/4.0/).
Share and Cite
AlAwad, M.N.J.; Fattah, K.A. Characterization of Oil Well Cement–Formation Sheath Bond Strength. Eng 2025, 6, 117. https://doi.org/10.3390/eng6060117
AlAwad MNJ, Fattah KA. Characterization of Oil Well Cement–Formation Sheath Bond Strength. Eng. 2025; 6(6):117. https://doi.org/10.3390/eng6060117
Chicago/Turabian StyleAlAwad, Musaed N. J., and Khalid A. Fattah. 2025. "Characterization of Oil Well Cement–Formation Sheath Bond Strength" Eng 6, no. 6: 117. https://doi.org/10.3390/eng6060117
APA StyleAlAwad, M. N. J., & Fattah, K. A. (2025). Characterization of Oil Well Cement–Formation Sheath Bond Strength. Eng, 6(6), 117. https://doi.org/10.3390/eng6060117