Abstract
Soil compaction significantly affects crop growth and yield. Traditional methods for assessing soil density are labor-intensive, time-consuming, and provide limited coverage of the entire field. This study aims to evaluate an alternative method for measuring soil density in real time during standard cultivation operations. The proposed approach involves measuring the elastic deformation of the cultivator shank using strain gauges mounted on the working element. Simultaneous measurement of two separate working elements was tested. Data were recorded in real time and used to generate a soil compaction map of the test field. Soil density measurements obtained using a vertical cone penetrometer served as a reference for comparison. Analysis of the collected data revealed a strong correlation between shank deformation and measured soil density, with a Multiple R = 0.814 and R2 = 0.662. The results demonstrate that elastic deformation of the cultivator shank can reliably indicate soil compaction. The tested methodology provides a practical, real-time assessment of soil density during cultivation. It can be integrated into various plows or cultivators, enabling continuous monitoring of soil compaction without the labor and fuel demands of traditional mechanical tests. This approach offers a promising tool for precision soil management and optimizing field operations.
1. Introduction
Soil bulk density is one of the key parameters in precision agriculture. As the primary medium for crop development, soil structure and compaction across different horizons critically influence root penetration and overall plant growth. The foundation of precision agriculture relies on the integration of advanced sensor systems and the acquisition of real-time data. Various measurement methodologies have been developed, all aimed at optimizing management practices and facilitating decision-making based on essential environmental and crop-specific parameters [1,2,3,4].
Soil compaction represents a major indicator of soil quality, as it directly affects fertility, water infiltration, and root system development, thereby influencing plant growth and ultimately crop yield [5,6]. This highlights the necessity for accurate real-time assessment of soil compaction across depth layers and spatial locations throughout the entire growing season.
A wide range of techniques have been designed for the mechanical determination of spatial bulk density. This parameter significantly impacts cutting resistance and the opposing mechanical forces encountered during tillage operations [7]. Mechanical resistance is intrinsically linked to compaction conditions, and its precise quantification enables more effective planning of agronomic practices. Optimizing these practices can mitigate adverse environmental impacts, thereby supporting sustainable agriculture [8]. Furthermore, reducing the intensity of tillage contributes to the economic efficiency of agricultural production.
Conventional mechanical instruments, such as vertical cone penetrometers, involve labor-intensive procedures, require considerable time for data collection, and provide only discrete values (representative samples) rather than continuous field-scale assessments. To address these limitations, numerous sensors have been developed that employ instrumented ploughs and load cells to measure cutting resistance at one or multiple depths [9,10,11,12,13,14]. Although these methods provide reliable information for the studied areas, their major drawback lies in the need for additional tillage operations, which are time-consuming, fuel-intensive, and alter soil density due to the passage of the working implement. An alternative approach was proposed by [15], involving the integration of sensors mounted on cutting blades that record mechanical resistance forces both within and outside the wheel track.
Soil moisture content, together with soil type, directly influences the susceptibility of soil to compaction. Maps of mechanical resistance across different soil layers are essential for planning agricultural operations, as they identify field areas prone to compaction and potentially restricting root growth. Both soil compaction and factors such as low water content, clay fraction, particle size distribution, and the presence of stones can theoretically increase soil strength and reduce root penetration capacity. Determining the appropriate timing of soil mapping, or employing sensors capable of measuring soil moisture, allows the delineation of specific zones that require targeted management practices.
An innovative non-invasive method for remote soil monitoring, based on the principle of electromagnetic induction (EMI), has been presented in several studies [16,17,18,19]. These methods enable comprehensive evaluations of soil condition at various depths, simultaneously accounting for multiple key parameters such as compaction, pH, nutrient content, and water availability. They are characterized by high performance over large areas. However, a significant limitation is their reliance on expensive equipment and the requirement for specialized operator training, which restricts large-scale application.
On the other hand, mechanical sensors provide high measurement accuracy but require additional tillage operations. Integrating them with conventional agricultural implements could allow data collection on compacted zones during routine field operations, thereby improving efficiency. For example, compaction information can be obtained by measuring tractor draft force, although the resolution of this approach is constrained by the working width of ploughs or cultivators. More precise measurements can be achieved by equipping ploughs or cultivators with additional sensors. In this case, accuracy is proportional to the width of the individual working element. At the same time, the system must demonstrate sufficient mechanical durability to withstand the high forces generated during tillage, which implies that sensors should be mounted above the soil–tool contact zone. Furthermore, the system must be capable of modular expansion, enabling sensors to be installed on each working element, with all data collected in real time.
Although significant progress has been achieved in the development of both invasive and non-invasive methods for soil compaction assessment, existing approaches still face important limitations. Non-invasive technologies provide comprehensive evaluations but are cost-prohibitive and require specialized operation. Invasive mechanical sensors, while accurate, often demand additional field operations that alter soil density and increase fuel consumption and labor requirements. Moreover, many of the currently available systems fail to provide real-time measurements directly during standard tillage operations.
Therefore, the aim of the present study is to develop and evaluate a method for estimating soil density based on the measurement of linear deformation in the cultivator shank during standard agrotechnical operations. This approach seeks to integrate soil compaction monitoring into routine field activities without requiring additional passes or specialized equipment, thereby improving the efficiency and practicality of soil condition assessment in precision agriculture.
The scientific novelty of this work lies in the use of the cultivator shank as a structural sensing element for continuous soil density estimation during real tillage operations. Unlike conventional penetrometric or traction-based methods, the proposed approach allows the acquisition of real-time data on soil mechanical resistance directly during field work, without disturbing the natural compaction state of the soil. This study contributes to the development of cost-effective and implementation-integrated sensing technologies that enhance data-driven decision-making and support sustainable agricultural management practices.
2. Materials and Methods
2.1. Experimental Area
The tests were conducted at the experimental field of the Dobruja Technological College, Dobrich, Bulgaria, located in the historical and geographical region of Dobruja, which is predominantly a plateau covering over 23,000 km2. The soils in this region are mainly weakly leached, carbonate chernozems, characterized by a thick (80–100 cm) dark-colored humus horizon overlying a transitional horizon 40–50 cm thick. Carbonates are leached to a depth of 60–80 cm. These soils exhibit high humus content (3–5%) and a favorable supply of essential macroelements. They have a heavy texture, high bulk density, and low porosity, which influence their physical and mechanical properties. The field covers an area of 100 m2 and consists of chernozem soil with a very high stone content, ranging in diameter from 1 cm to 10 cm. The soil has a mechanical composition consisting of aggregates of various sizes. Its organic matter includes undecomposed residues, such as post-harvest plant material from the previous crop and dead animal species, as well as semi-decomposed and fully decomposed organic matter, a large portion of which contributes to humus. During the tests, the soil moisture was 12.3%. The strong heterogeneity of the experimental field limits the predictability of the results.
The average penetration resistance for this soil type is in the range of 0.16–0.20 MPa at a moisture content of 20%. The measurements reported in this study were conducted under standard pre-sowing field preparation conditions.
2.2. Measurement Methodology
The methodology applied in this study relies on fundamental principles of mechanics, with soil penetration resistance quantified using a standard cone penetrometer according to the following relation:
where Ppen is the penetration resistance; n—is the number of impacts; m—is the mass of the impactor; h1—is the drop height of the impactor; S—is the cross-sectional area of the cone embedded in the soil; and h2—is the penetration depth of the rod.
Ppen = n mgh1/Sh2, (kg/cm2)
The main drawback of this method is the labor-intensive measurement procedure and the generation of only representative samples, rather than a complete spatial map of the tested field.
During plowing with a moldboard plow, soil bulk density can alternatively be estimated as a function of the tractor’s traction force, calculated as follows:
where k is the specific soil resistance (kN·m−1); is the operating speed of the machine (m·s−1) [20]. The value of k is obtained from the relation:
This method does not allow for the detection of small, compacted zones or the precise determination of their boundaries. Furthermore, it is not possible to obtain the value for compacted areas smaller than the working width of the implements. An alternative approach is to determine the resistance value for each individual working element; however, in practice, this is difficult to implement.
In the traction force equation, the value of Pt varies depending on soil compaction, and the measurement frequency is critical for achieving accurate results. Real-time determination of the resistance force acting on each cultivator shank enables the construction of a map with spatial resolution corresponding to both the working width of the element and the chosen sampling frequency.
As the implement moves through the soil, bending stresses are generated in the cultivator shank. These stresses can be calculated according to the following expression [21]:
where
σx = (Mzy)/Iz = Mz/Wz
- σx is the bending stress;
- Mz—the moment about the neutral axis;
- y—the perpendicular distance to the neutral axis;
- Iz—the second moment of area about the neutral axis z;
- Wz—the moment of resistance about the neutral axis z. Wz = Iz/y.
2.3. Sensor Position
The planned measurements aim to determine soil density by recording the mechanical deformations occurring in the cultivator shank during a scheduled agrotechnical operation. The measurements were carried out using a strain gauge system mounted on the cultivator. The section of the shank selected for measurement had dimensions of 7 cm × 2 cm. Measurements were performed in the area adjacent to the support beam, which is positioned at the maximum distance from the soil during operation, in order to minimize the influence of direct soil contact on the readings. The strain sensor was installed on the side opposite to the contact zone between the soil and the working tool. This configuration ensures that the recorded deformations reflect the overall load on the shank rather than local surface stresses.
During cultivation, the forces acting on the working body are shown in Figure 1.
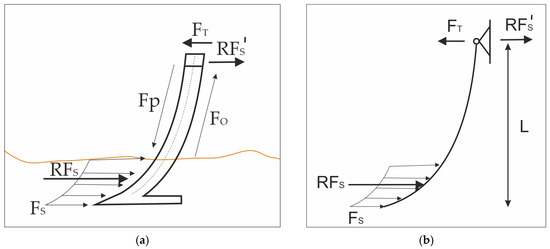
Figure 1.
Forces acting on the cultivator during operation, with the orange line showing the variability of the soil layer (a) and support reactions (b).
During tractor operation, a traction force FT is generated in the direction of motion, which drives the cultivator forward (Figure 1). The working elements penetrate the soil layer to depths between 10 and 20 cm, depending on the operational requirements. As the tools pass through the soil under the action of the traction force, they cut the soil layer, producing friction with slip along the heterogeneous soil–tool interface due to the composite structure of the soil aggregates.
As a result, a non-uniformly distributed resistance force (FS) acts on the frontal surface of the cultivator. This force depends on soil composition and directly reflects soil bulk density. Since it is not feasible to measure each individual component of this resistance, it is represented by a single resultant force, RFS. This resultant force tends to deform the cultivator shank, generating elastic stresses that can be expressed as two components: FP and FO (Figure 1).
The component FP tends to elongate (tensile stress) the material on the left side of the neutral axis (Figure 2), while the component FO tends to compress the material on the right side of the axis. Both forces are directly related to the resultant resistance force RFS, and their measurement provides an indirect means of estimating soil density. Ideally, the magnitudes of FP and FO are equal but opposite in sign; therefore, simultaneous measurement of both values eliminates systematic errors in the instrumentation.
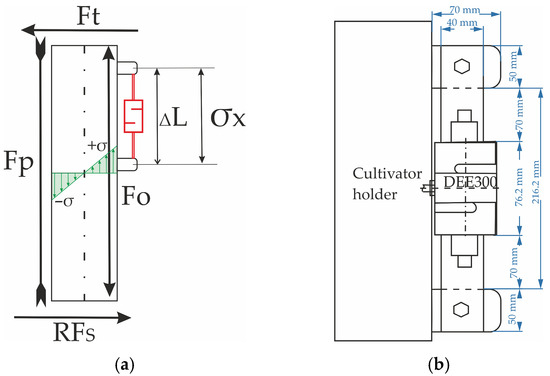
Figure 2.
Strain gauge mounting position, force diagram (a), and installation dimensions (b).
The strain gauge was mounted by welding additional plates to the rear side of the cultivator shank at a right angle, following the scheme presented in Figure 2b. As shown in the figure, the force measurement was performed over a section of 216.2 mm (ΔL).
A sufficiently accurate result can be obtained from only one of the two forces, provided that the deformation of the cultivator shank remains within the elastic range. From a practical standpoint, the strain gauge should be mounted on a less vulnerable surface, i.e., the side less likely to come into direct contact with the soil. For this reason, the rear side of the shank was selected, and the compressive force FO was measured.
Recording the elastic deformation in a single section is sufficient. The strain gauge mounting location is shown in Figure 2. By determining the change in length (ΔL), the corresponding normal stress (σx) is obtained, which directly corresponds to the resultant resistance force RFS and thus provides an indirect measure of soil bulk density.
Figure 3 presents a schematic diagram of the test system composition, illustrating the connections and functional relationships between core components.
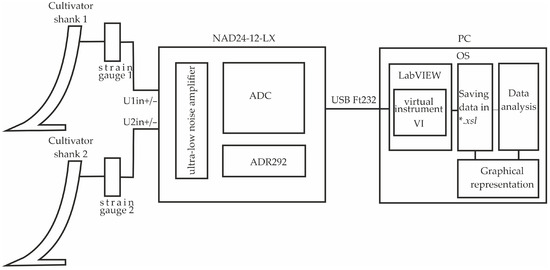
Figure 3.
Schematic diagram of the test system composition.
The analog-to-digital converter (ADC) sequentially acquires the input signals U1 and U2, each connected to a strain gauge measuring the mechanical deformation forces in the holder of the cultivator’s working body. The data acquisition rate is 57,600 bit·s−1, with a sampling interval of 1 s. The ADC measures the differential voltage between the positive and negative inputs of each channel.
A precision ADR292 voltage reference from Analog Devices (Wilmington, MA, USA) [22] is employed, featuring an accuracy of 0.07% and intrinsic noise not exceeding 4 μV RMS. The same reference serves as the ADC input source, thereby minimizing the influence of internal noise during measurement.
Signal transmission to a personal computer is carried out via a USB interface using an FT232 module from Future Technology Devices International (FTDI). The transmission parameters are as follows: baud rate—57,600 bit·s−1, data length—8 bits.
Data acquisition and analysis are implemented in LabVIEW (National Instruments, Austin, TX, USA) [23], through a custom virtual instrument (VI) developed for this purpose. The software allows configuration of several parameters, including data port selection, transmission rate, sampling interval, gain factor, measurement duration, number of ports, and transformation coefficient. Additional functions include bridge zero-offset correction and error-code display for each channel.
The measurement results are recorded in both mV and MPa and are simultaneously visualized in real time as graphical plots. Data are saved in .xsl format and further processed in Excel, where linear regression analysis is performed using the Data Analysis module. The final results are presented in graphical form for interpretation and comparison.
The mounted sensor is illustrated in Figure 4. It records the compressive force acting on this side of the shank by registering the deformation ΔL.
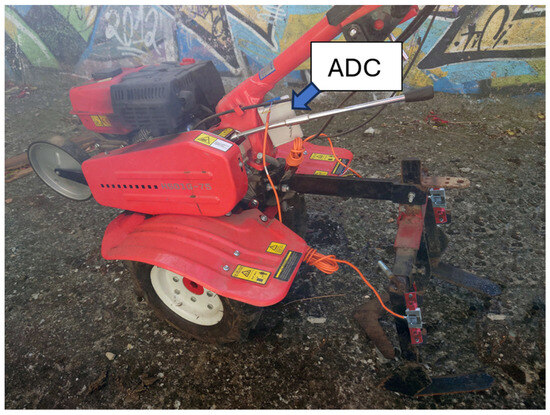
Figure 4.
Experimental setup.
Figure 4 presents the experimental setup with two strain gauges installed. The photograph also shows the orange cable connecting the sensors to the analog-to-digital converter (ADC). The connection between the ADC and the computer was established via a USB cable, which was carried out by an assistant operator during the experiments to ensure stable data transmission.
The motor-block employed in the experiments was model HSD1G-75 (Garden Max, Veliko Tarnovo, Bulgaria) [24]. Its main technical specifications are as follows:
- Maximum power: 6.5 hp at 3000 min−1;
- Engine type: four-stroke, single-cylinder, air-cooled;
- Transmission: 2 forward gears and 1 reverse gear;
- Drive type: belt-driven;
- Starting system: manual recoil starter;
- Oil sump capacity: 0.6 L;
- Fuel tank capacity: 3 L;
- Fuel consumption: 1.6 L·h−1;
- Displacement: 208 cm3;
- Working width: 750–830 mm;
- Working depth: 25 cm;
- Total weight: 73 kg.
A triple cultivator for combined soil treatment was mounted to the experimental setup. Owing to the limitation of the measuring equipment to two channels, the load cells were installed on the end arms of the implement. This arrangement minimizes potential measurement bias caused by soil loosening from adjacent working elements.
An S-shaped load cell (model DEE300, KELI Sensing Technology, Ningbo, China) [25], with a maximum rated capacity of 300 kg, was selected. The load cell has an internal strain-gauge resistance of 350 Ω and an accuracy of 1%. The devices are certified in compliance with GB/T 7551-2008 and ISO 9001:2008 standards. Two load cells were mounted as illustrated in Figure 3, using additional plates fixed to the rear side of the stem. A schematic representation of the strain gauge and its wiring diagram is shown in Figure 5. The technical specifications of the strain gauge are provided in Table 1.
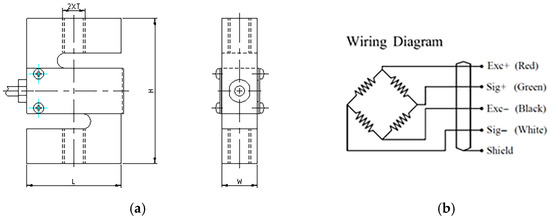
Figure 5.
Dimensions of the DEE300 strain gauge: L = 51 mm, H = 76.2 mm, W = 19.1 mm, and T = M12 × 1.75 (a); wiring diagram (b).

Table 1.
Parameters DEE300.
The technical specifications of the selected strain gauge are provided in Table 1.
Signal acquisition from the Wheatstone bridges was performed using a 24-bit dual-channel analog-to-digital converter (ADC), model NAD24-12-LX module (FTDI Chip, Glasgow, UK) [26]. The converter sequentially samples both input channels and provides adjustable amplifier gain. The amplifier is direct-current-coupled, ultra-low-noise, and powered via the USB port of a laptop computer.
The NAD24-12-LX device is designed for high-precision measurement of slowly varying quantities. The analog-to-digital converter (ADC) processes the signal received from a differential amplifier, which amplifies the difference between the positive and negative inputs of the corresponding channel and converts it into a digital code. Both channels are sampled sequentially, and the results are provided as 24-bit digital output.
The ADC supplies excitation voltage to the Wheatstone bridges, sourced directly from the USB port. An ADR292 voltage reference (Analog Devices, Wilmington, MA, USA) is integrated into the device. This reference features an intrinsic noise level not exceeding 4 μV RMS and an accuracy of 0.07%. In addition to stabilizing the power supply, the ADR292 is also employed as the reference source for the ADC. This configuration reduces the influence of internal noise during measurements, thereby improving accuracy. The main parameters of NAD24-12-LX are presented in Table 2.
Table 2.
Parameters of the NAD24-12-LX device [24].
Data acquisition from the ADC to the computer during measurements was performed using custom software developed in LabVIEW [23]. The graphical user interface is shown in Figure 6. From the window, it can be seen that the data transmission rate was set to 57,600 bit·s−1, with a sampling interval of 1000 ms (1 s). The communication was established through a virtual USB port emulating COM4. The recorded data were stored in .xsl format, with the measured values expressed in MPa.
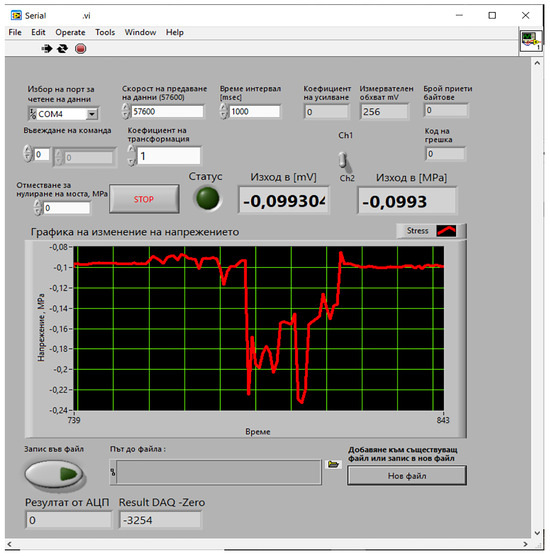
Figure 6.
Interface of the custom-developed LabVIEW virtual instrument used for data acquisition and processing.
2.4. Statistical Analysis
The results obtained were analyzed using MS Excel [27]. A linear regression analysis was conducted to determine the relationship between the investigated variables Y (field measurements with the penetrometer) and X (measurements obtained from the strain gauge), and to calculate the linear correlation coefficient. This method was selected to mathematically describe the relationship between the dependent variable Y and the independent variable X, and to determine the regression coefficients b(0) and b(1) of the single-factor linear regression model of the form:
Yi = b(0) +b(1) × X(i)
The model represents the relationship between measurements obtained with the vertical cone penetrometer and data acquired from the cultivator-mounted strain gauge, which records the tensile/compressive forces acting on the shank of the working element. The results of this analysis are presented in the following section.
2.5. Sensor Calibration
With the working width of the cultivator, seven passes were required to cover the entire field. The operating speed of the motor-cultivator during soil preparation was 1 km·h−1. The actual measurement interval of the strain gauge was 0.3 s, corresponding to a distance of 0.08 m (8 cm) between consecutive readings. The strain gauge readings were zeroed after installation, and the software display was calibrated to 0.
To verify the accuracy of the measurements, a calibration procedure was performed, as shown in Table 3. Calibration was conducted by applying tensile forces of 1–10 kg to the measured working element. This procedure allowed the determination of the software output corresponding to the applied force distributed over the entire surface of the working element. The test range was limited to 10 kg, yielding a maximum measured stress of 0.237 MPa, which corresponds approximately to the maximum expected load on the working element at a soil moisture content of 20%.
Table 3.
Results of the calibration.
In this case, the surface area of the working element is 0.2 m2. Therefore, to obtain the value corresponding to 1 m2, the measured value must be divided by 5. Otherwise, the reading would be five times higher, reflecting the larger surface area of the working element rather than the actual stress per unit area.
3. Results
To verify the results, soil bulk density measurements were performed on the experimental plot using a standard cone penetrometer AG-BS-70 (Bioevibul EOOD, Sofia, Bulgaria) [28], with an operating range of 0–400 PSI (0–3500 kPa or kN·m−2). The measured soil bulk density values are presented in Table 4. Measurements were taken at 2 m intervals along the length of the plot, corresponding to the path of the first cultivator pass. The device is calibrated in PSI, and the recorded values were converted to MPa for consistency with the data obtained from the strain gauge measurements. The first measurement position with the penetrometer is 2 m from the beginning. Due to the specifics of the cultivation process, it is not possible to obtain accurate information about the starting position.
Table 4.
Soil bulk density measurements obtained using a cone penetrometer.
The cultivator passes along the length of the experimental plot and the corresponding readings from the two strain gauges are shown in Figure 7. The obtained values are time-dependent and do not need to be interpolated along the field length. The reading interval of the strain gauges was set to 8 cm along the plot, which corresponds to an average of 250 measurements per single pass. The discrete values obtained during the measurements were connected with straight lines to produce a continuous curve, as shown in Figure 6. The sensor reading interval is smaller than the spatial resolution limit of the method. Although the measurements are capable of millimeter-level accuracy, such precision is not meaningful due to the inherent mechanical properties of the soil.
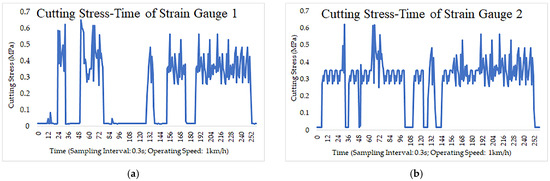
Figure 7.
Real-time Cutting Stress–Time Curves of Strain Gauge 1 (a) and Strain Gauge 2 (b) During the First Cultivator Operation (Sampling Interval: 0.3 s; Operating Speed: 1 km/h).
In Figure 7, the horizontal axis shows the individual measurements over time. The time interval between readings is 0.3 s, resulting in a total measurement period of 77 s. The vertical axis represents the measured cutting stress on the working element. The plots from the left (first, Figure 7a) and right (second, Figure 7b) strain gauges clearly reflect the heterogeneous composition of the soil. It is evident that the two plots exhibit different measurement trends, indicating that the system operates reliably.
The shear strength of a soil aggregate represents the limiting contact resistance between the particles of the soil skeleton. It is related to their relative displacement (skeleton kinematics) and depends on the frictional and adhesive interactions between soil particles. The characteristics of shear strength, including friction and cohesion, are influenced by the stress state within the particulate matter and are adequately described by Coulomb’s law (1773). Shear strength is directly correlated with soil density [29].
Comparison of the strain gauge data with the penetrometer measurements is inherently imprecise due to the different measurement methods. Nevertheless, at a distance of 2 m from the start, corresponding to approximately 25 measurement intervals in Figure 7a, the strain gauge recorded a value exceeding 0.6 MPa, while the penetrometer measured 1.0342 MPa. A similar trend was observed for the second measurement at interval 50, approximately 4 m from the start, where the penetrometer recorded 0.82 MPa and the strain gauge 0.7 MPa. The uncertainty in these comparisons arises from the fundamental difference between the vertical penetration test and the horizontal resistance encountered during tillage.
The results from the seven cultivator passes, during which both sensors were monitored, are presented in Figure 8. Based on the conducted tests, a soil bulk density map was generated. The two strain gauges are labeled as 1 and 2. Since the field was traversed seven times for complete cultivation, each sensor was recorded seven times, which is indicated in the figure by repeated labels. The vertical axis of the graph represents the variation in soil bulk density, ranging from 0 to 1 MPa. The figure provides a visual assessment of the performance of the two sensors and also presents a 3D density map of the tested field. Using different colors, the figure allows tracking the performance of each sensor across the entire surface.
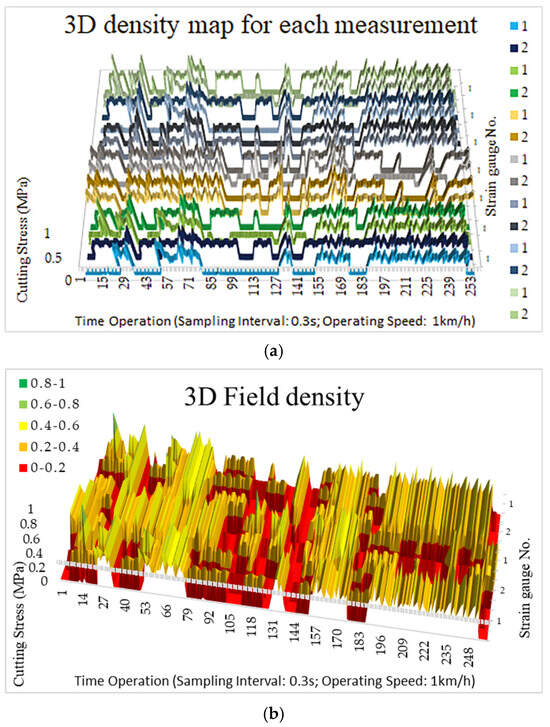
Figure 8.
Field density diagram obtained from the strain gauges. The horizontal axis represents the sequential ADC reading number (time), and the vertical axis (Z) shows the soil bulk density ranging from 0 to 1 MPa. Gauge 1 and Gauge 2 are labeled, and repeated lines indicate measurements from subsequent passes. Colors represent relative density trends for each gauge. (a) Shows the resistance of each strain gauge. (b) The 3D density map.
Based on the measured soil bulk density values, a two-dimensional compaction map was created, as shown in Figure 9. In this map, lower-density areas are indicated in green, while higher-density zones are shown in red. The map clearly highlights regions of low bulk density. Areas with medium density (yellow lines) are likely associated with compaction from previous passes of machinery. Very small red zones, located in the left section (indicated by an arrow) and in the center of the field, are probably caused by impact with stones.
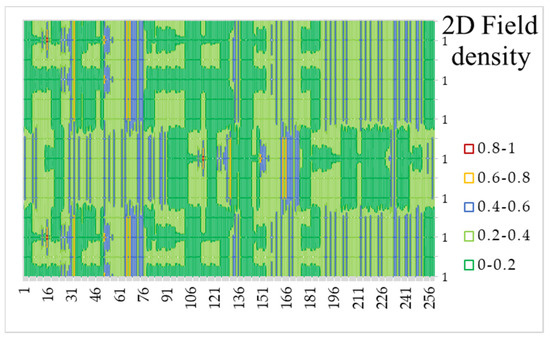
Figure 9.
Distribution map of soil compaction in the experimental field. (Color corresponds to compaction ranges: values from 0.8 to 1 MPa are indicated in red, 0.6 to 0.8 MPa in orange, 0.4 to 0.6 MPa in yellow, 0.2 to 0.4 MPa in light green, and values below 0.2 MPa in dark green. The horizontal axis represents the serial number of the readings from the ADC, while the vertical axis corresponds to the measurements from strain gauges 1 and 2 during all passes).
Analysis of Dependencies
For the analysis of data obtained from the strain gauge in the test area, the values corresponding to the positions of the penetrometer measurements were extracted. A linear regression analysis was performed according to Equation (5) using the data analysis module in MS Excel. The results of the analysis are summarized in Table 5. The position of each penetrometer measurement was recorded as the distance from the starting point, while the corresponding position from the strain gauge was calculated based on the measurement time intervals.
Table 5.
Statistics from the linear regression analysis.
The linear regression analysis of the relationship between the strain gauge measurements over 25 sensor intervals (Y) and the soil bulk density measured with a vertical cone penetrometer at a depth of 20 cm (X) yielded the following results:
The regression statistics are presented in Table 5. It can be observed that the multiple correlation coefficient is Multiple R = 0.814 and the coefficient of determination is R2 = 0.662. This indicates an 81.4% correlation between the two measurement methods, with 66.2% of the variance in the strain gauge measurements explained by the penetrometer data. The standard error of 0.252 represents the average deviation of the observed values from the regression line.
The results of the ANOVA for the linear regression are shown in Table 6.
Table 6.
ANOVA for the linear regression.
The residuals indicate a deviation from the predicted regression line of 0.389. Based on these results, a strong correlation between the two methods can be confirmed. The remaining uncertainty is attributed to the fundamentally different measurement methodologies employed. Table 7 presents the residual output for the linear regression.
Table 7.
Residual output for the linear regression.
These regression results provide quantitative confirmation of the relationship between the strain gauge measurements and the penetrometer-derived soil bulk density. To further illustrate the spatial variation and practical implications of these findings, the sensor-based measurements have been visualized in the form of density maps and graphs.
Figure 5, Figure 6 and Figure 7 present the temporal and spatial distribution of soil bulk density along the experimental plot, including single-pass measurements, cumulative results from seven cultivator passes, and the two-dimensional compaction maps. These visualizations allow direct comparison of local variations captured by the strain gauges with the reference penetrometer measurements, highlighting zones of low, medium, and high compaction, as well as heterogeneities caused by stones or previous passes.
The combination of regression analysis and graphical representation demonstrates the reliability of the sensor-based approach for high-resolution monitoring of soil compaction, and provides a foundation for practical applications in precision agriculture.
More advanced spatial interpolation methods, such as Kriging or inverse distance weighting, were not applied because the strain gauge measurements were densely and regularly spaced (~0.08 m) across the 100 m2 plot. Linear interpolation provides a sufficiently accurate and computationally simple representation of soil compaction for this scale, while avoiding artificial gradients or overfitting. This approach is adequate to demonstrate the feasibility and reliability of the proposed measurement method.
The main difference between the two measurement methods is in their mode of operation. The vertical cone penetrometer measures soil resistance by pressing a cone with an area of 0.039 m2 into the soil, while the cultivator’s working body moves horizontally with a frontal area of 0.2 m2. As a result, a certain measurement uncertainty may occur, which in this case is 4 Pa.
4. Discussion
The proposed methodology for measuring soil bulk density during cultivator operation using strain gauges mounted on the working element offers significant advantages over conventional methods. Traditional techniques, such as vertical cone penetrometers and mechanical sensors, are labor-intensive, energy-consuming, and require additional field passes [30,31]. Moreover, they generally provide only discrete measurements, which do not allow dynamic monitoring of spatial and temporal variability in soil structure [32]. In the context of Dobruja, where soils are predominantly leached chernozems with relatively low stone content, conventional methods may still be limited due to heterogeneity and variations in compaction.
The presented method addresses these limitations by enabling continuous measurement of elastic deformation in real time. This capability provides a more accurate and dynamic assessment of soil bulk density, particularly valuable in heterogeneous soils with variable structure. Additionally, the method is cost-effective and can be seamlessly integrated into existing tillage equipment, making it a practical solution for farmers in the region. Real-time monitoring of soil compaction directly during cultivation reduces the need for additional operations, thereby lowering fuel consumption and labor requirements, while at the same time contributing to environmental sustainability [33,34].
Previous studies, such as those by Andrade et al. [35,36], Chung et al. [37], and Verschoore et al. [38], have proposed a range of approaches for assessing soil mechanical resistance. These include the use of load cells, cutting elements, and instrumented blades. While these technologies provide valuable data, they often involve complex constructions, expensive materials, or specialized designs, which limit their adaptability under diverse field conditions. Other research highlights the potential of combining mechanical, proximal, and geophysical sensors to delineate site-specific management zones and support precision agriculture practices [39].
The method presented in this study builds upon and extends these earlier approaches by offering a simpler, more accessible, and more adaptable solution for soil bulk density measurement. Unlike many invasive or remote sensing techniques, the strain gauge–based approach does not require additional field passes and delivers real-time data at the scale of individual working elements. This feature enhances its spatial resolution, while its low maintenance requirements make it suitable for large-scale agricultural applications in Dobruja and comparable agroecological regions. Furthermore, the system’s modularity allows integration with multiple working elements, thereby increasing measurement accuracy without reducing efficiency. Comparable case studies demonstrate the practical benefits of such sensor systems for monitoring soil compaction and improving soil health management [40,41,42].
A mechanical sensor for soil density measurement was proposed by [43]. The device consists of eight independent load cells designed to measure the soil cutting force acting on eight cutting elements spaced 5 cm apart. These elements are evenly distributed across a working depth of up to 61 cm. Although the sensor provides accurate information, its operation is both labor- and energy-intensive, as it requires a separate field pass.
Another example is the Soil Compaction Sensor (SCPS) [36], which operates similarly to a chisel positioned at a 90° angle to the soil surface, facilitating self-penetration into the ground. Force sensing is achieved through five octagonal sensors, each equipped with four strain gauges. The sensing elements are 6.4 cm high and 2.7 cm wide, with a vertical spacing of 1.3 cm between them. The system includes a built-in spring mechanism for overload protection and is connected to a GPS receiver for georeferencing. However, as with other mechanical systems, an additional pass is required to cut through the soil layer before measurement.
Both examples illustrate mechanical sensors designed to determine soil aggregate density. While such sensors provide accurate and reliable data, their use necessitates additional field operations (e.g., plowing or sensor passes), which increase operational costs and contribute to higher environmental emissions. Moreover, current mechanical soil sensors generally lack a modular or multi-element design, requiring multiple passes to generate a comprehensive map of the studied field.
5. Limitations and Perspectives for Future Research
While the present study demonstrates the feasibility of using strain-gauge-based measurements to estimate soil density, several limitations should be acknowledged. First, the experiments were conducted on a single 100 m2 plot of chernozem soil, containing 1–10 cm stones, with a soil moisture content of 12.3% and standard pre-sowing field preparation. Consequently, the results reflect the performance of the method under specific and controlled conditions, and the universality of the approach across different soil types, moisture levels, and tillage depths remains to be verified.
Second, the method measures cutting resistance over the entire contact area between the soil and the working tool. Therefore, it does not capture compaction variations in zones smaller than the cultivator’s contact area, nor does it provide information about vertical soil horizons. Soil heterogeneity, including variations in aggregate size and organic matter composition, as well as local differences in moisture, contributes to deviations between strain gauge measurements and reference cone penetrometer data. While an overall strong correlation (R = 0.814) was observed, further quantitative error analyses, such as mean absolute error or relative error, are necessary to fully characterize measurement discrepancies.
Future research will focus on extending the experimental campaign to include a variety of soil types (clay, sandy, and loamy soils), a wider range of moisture contents, and multiple tillage depths. The use of an increased number of simultaneously operating sensors and multi-depth measurements will enable a more comprehensive assessment of soil compaction distribution across the profile. Additionally, validation using alternative measurement methods is planned to further verify the accuracy and robustness of the strain-gauge-based approach. These efforts will improve the generalizability of the method and its potential applicability in precision agriculture.
It is planned to install 37 sensors on a cultivator with a working width of 9.2 m. This configuration would enable data collection across the entire working width with a spatial resolution of approximately 0.25 m in a single pass. The measurements are performed during a scheduled agrotechnical operation, using a standard working body moving at a speed of 10–12 km/h.
6. Conclusions
This study successfully achieved its main objective—to develop and evaluate a method for estimating soil bulk density based on the elastic deformation of the cultivator shank during standard tillage operations. The results demonstrate a strong correlation (R = 0.814) between the strain gauge data and cone penetrometer measurements, confirming the reliability and accuracy of the proposed approach. This method enables real-time assessment of soil compaction without additional field passes or complex instrumentation, offering a cost-effective and practical alternative for precision agriculture. Its integration into existing tillage equipment provides a solid foundation for developing intelligent, sensor-based systems for soil monitoring and management.
From a practical perspective, the proposed method can be readily implemented in conventional agricultural machinery, supporting adaptive tillage strategies, reducing fuel consumption, and preventing excessive soil compaction. The obtained results contribute to the development of data-driven, energy-efficient technologies in precision agriculture, bridging the gap between mechanical soil sensing and intelligent field management systems.
Author Contributions
Conceptualization, A.I.A.; methodology, A.I.A.; software, A.I.A.; validation, A.Z.A.; formal analysis, A.I.A. and A.Z.A.; investigation, A.I.A.; resources, A.I.A. and A.Z.A.; data curation, A.I.A.; writing—original draft preparation, A.I.A.; writing—review and editing, A.Z.A.; visualization, A.I.A.; supervision, A.Z.A.; project administration, A.Z.A.; funding acquisition, A.Z.A. All authors have read and agreed to the published version of the manuscript.
Funding
This study was financed by the European Union—NextGenerationEU—through the National Recovery and Resilience Plan of the Republic of Bulgaria, project № BG-RRP-2.013-0001.
Institutional Review Board Statement
Not applicable.
Informed Consent Statement
Not applicable.
Data Availability Statement
The data presented in this study are available on request from the corresponding author.
Acknowledgments
The authors are very grateful to the anonymous reviewers whose valuable comments and suggestions improved the quality of the paper.
Conflicts of Interest
The authors declare no conflicts of interest.
Abbreviations
The following abbreviations are used in this manuscript:
| ADC | Analog-to-digital converter |
References
- Deng, Y.; Zhang, W.; Qi, B.; Wang, Y.; Ding, Y.; Zhang, H. Research Progress and Prospects of Intelligent Measurement and Control Technology for Tillage Depth in Subsoiling Operations. Sensors 2025, 25, 3821. [Google Scholar] [CrossRef] [PubMed]
- Sui, Y.; Jiang, R.; Liu, Y.; Zhang, X.; Lin, N.; Zheng, X.; Li, B.; Yu, H. Predicting the Spatial Distribution of Soil Salinity Based on Multi-Temporal Multispectral Images and Environmental Covariates. Comput. Electron. Agric. 2025, 209, 109970. [Google Scholar] [CrossRef]
- Qi, J.; Bao, Z.; Zhang, W.; Guo, H. Research on Quantitative Methods for Measuring the Spatial Distribution of Straw after Rotary Tillage in Straw Return. Soil Use Manag. 2025, 41, e70107. [Google Scholar] [CrossRef]
- Guo, L.; Gao, Q.; Zhang, M.; Cheng, P.; He, P.; Li, L.; Ding, D.; Liu, C.; Muga, F.C.; Kamal, M.; et al. Soil Organic Matter Content Prediction Using Multi-Input Convolutional Neural Network Based on Multi-Source Information Fusion. Agriculture 2025, 15, 1313. [Google Scholar] [CrossRef]
- Shaheb, M.R.; Venkatesh, R.; Shearer, S.A. A review on the effect of soil compaction and its management for sustainable crop production. J. Biosyst. Eng. 2021, 46, 417–439. [Google Scholar] [CrossRef]
- Lucas, L.; Ogorek, P.; Gao, Y.; Farrar, E.; Pandey, B.K. Soil compaction sensing mechanisms and root responses. Trends Plant Sci. 2025, 30, 565–575. [Google Scholar] [CrossRef]
- Brune, P.F.; Ryan, B.J.; Technow, F.; Myers, D.B. Relating Planter Downforce and Soil Strength. Soil Tillage Res. 2018, 184, 243–252. [Google Scholar] [CrossRef]
- Li, Q.; Li, M.; Yang, W.; Sun, H.; Zhang, Y. Research progress on the rapid detection of soil components using Raman spectroscopy: A review. Trans. Chin. Soc. Agric. Eng. 2023, 39, 1–9. [Google Scholar]
- Sirjacobs, D.; Hanquet, B.; Lebeau, F.; Destain, M.F. On-Line Soil Mechanical Resistance Mapping and Correlation with Soil Physical Properties for Precision Agriculture. Soil Tillage Res. 2002, 64, 231–242. [Google Scholar] [CrossRef]
- Xia, Y.; Ding, W. Measurement of Soil Mechanical Resistance On-the-go and Analysis of Its Spatial Variability. J. Agric. Mach. 2006, 37, 70–73, 79. [Google Scholar]
- Abbaspour-Gilandeh, Y.; Rahimi-Ajdadi, F. Design, construction and field evaluation of a multiple blade soil mechanical resistance sensor. Soil Tillage Res. 2016, 157, 93–100. [Google Scholar] [CrossRef]
- Meng, C.; Yang, W.; Zhang, M.; Han, Y.; Li, M. Development of Real-time Measurement System for Vehicle mounted Soil Conductivity and Mechanical Resistance. J. Agric. Mach. 2019, 50, 102–107. [Google Scholar]
- Zeng, Z.; Chen, Y.; Zhang, X. Modelling the Interaction of a Deep Tillage Tool with Heterogeneous Soil. Comput. Electron. Agric. 2017, 143, 130–138. [Google Scholar] [CrossRef]
- Cho, Y.; Sudduth, K.A.; Chung, S.O. Soil Physical Property Estimation from Soil Strength and Apparent Electrical Conductivity Sensor Data. Biosyst. Eng. 2016, 152, 68–78. [Google Scholar] [CrossRef]
- Cviklovič, V.; Mojžiš, M.; Majdan, R.; Kollárová, K.; Tkáč, Z.; Abrahám, R.; Masarovičová, S. Data Acquisition System for On-the-Go Soil Resistance Force Sensor Using Soil Cutting Blades. Sensors 2022, 22, 5301. [Google Scholar] [CrossRef]
- Hossain, M.B.; Lamb, D.W.; Lockwood, P.V.; Frazier, P. EM38 for volumetric soil water content estimation in the root-zone of deep vertosol soils. Comput. Electron. Agric. 2010, 74, 100–109. [Google Scholar] [CrossRef]
- Brogi, C.; Huisman, J.A.; Pätzold, S.; von Hebel, C.; Weihermüller, L.; Kaufmann, M.S.; van der Kruk, J.; Vereecken, H. Large-scale soil mapping using multi-configuration EMI and supervised image classification. Geoderma 2019, 335, 133–148. [Google Scholar] [CrossRef]
- Atanasov, A.Z.; Nikolova, P.D.; Evstatiev, B.I. Monitoring and Evaluation of the Moisture Retention of Leached Chernozem Under Different Types of Tillage. In Farm Machinery and Processes Management in Sustainable Agriculture; Lecture Notes in Civil Engineering; Springer: Cham, Switzerland, 2024; Volume 609, pp. 23–36. [Google Scholar] [CrossRef]
- Bratoev, K.; Georgiev, I. Digital technologies in agriculture. scanfield-5s smart system with integrated digital soil cube for innovative solutions in agriculture. INMATEH Agric. Eng. 2025, 76, 541–552. [Google Scholar] [CrossRef]
- Irinchev, D.N. Power of an agricultural tractor during traction operations. Agric. Sci. 2013, 4, 109–111. (In Bulgarian) [Google Scholar]
- Gere, J.; Timoshenko, S. Mechanics of Materials, 4th ed.; PWS: Boston, MA, USA, 1997; p. 549. [Google Scholar] [CrossRef]
- Analog. Available online: https://www.analog.com/en/products/adr292.html (accessed on 6 September 2025).
- Ni. Available online: https://www.ni.com/en/shop/labview.html?srsltid=AfmBOoqx5AR3cp9Iai8y5l4ubRyedlEuBFxXdclcW--s9POsdmHc3Wb8 (accessed on 6 September 2025).
- Garden. Available online: https://garden-max.eu/bg/pregled-na-artikul/GardenMAX1G-75-0 (accessed on 6 September 2025).
- Kelisensing. Available online: https://www.kelisensing.com/our-team (accessed on 6 September 2025).
- Ftdichip. Available online: https://ftdichip.com/ (accessed on 6 September 2025).
- Excel. Available online: https://www.microsoft.com/bg-bg/microsoft-365/excel (accessed on 6 September 2025).
- Bioevibul. Available online: https://bioevibul.com/5007-ag-bs-70-penetrometar-(kompaktometar)-za-pochva (accessed on 6 September 2025).
- Todorov, M.; Kostov, V. Earth Mechanics; UACEG: Sofia, Bulgaria, 2015. (In Bulgarian) [Google Scholar]
- Adamchuk, V.I.; Morgan, M.T.; Lowenberg-DeBoer, J.M. A model for agro-economic analysis of soil pH mapping. Precis. Agric. 2004, 5, 109–127. [Google Scholar] [CrossRef]
- ASABE S313.3; Soil Cone Penetrometer. American Society of Agricultural and Biological Engineers: St. Joseph, MI, USA, 2011.
- Vaz, C.M.P.; Manieri, J.M.; de Maria, I.C.; Tuller, M. Modeling and Correction of Soil Penetration Resistance for Varying Soil Water Content. Geoderma 2011, 166, 92–101. [Google Scholar] [CrossRef]
- Adamchuk, V.I.; Hummel, J.W.; Morgan, M.T.; Upadhyaya, S.K. On-the-Go Soil Sensors for Precision Agriculture. Comput. Electron. Agric. 2004, 44, 71–91. [Google Scholar] [CrossRef]
- Gebbers, R.; Adamchuk, V.I. Precision Agriculture and Food Security. Science 2010, 327, 828–831. [Google Scholar] [CrossRef]
- Andrade, P.; Rosa, U.A.; Upadhyaya, S.K.; Jenkins, B.M.; Aguera, J.; Josiah, M. Soil profile force measurements using an instrumented tine. In Proceedings of the 2001 ASAE Annual Meeting, Philadelphia, PA, USA, 4–7 August 2001; ASAE: St. Joseph, MI, USA, 2001. [Google Scholar]
- Andrade, P.; Upadhyaya, S.K.; Jenkins, B.M.; Filho, A.G.S. Evaluation of UC Davis Compaction Profile Sensor, 49th ed.; ASAE Standards; ASAE: St. Joseph, MI, USA, 2002. [Google Scholar]
- Chung, S.; Sudduth, K.A.; Hummel, J.W. On-the-go soil strength profile sensor using a load cell array. In Proceedings of the 2003 ASAE Annual Meeting, Las Vegas, NV, USA, 27–30 July 2003; ASAE: St. Joseph, MI, USA, 2003. [Google Scholar]
- Verschoore, R.; Pieters, J.G.; Seps, T.; Spriet, Y.; Vangeyte, J. Development of a sensor for continuous soil resistance measurement. In Precision Agriculture; Stafford, J., Werner, A., Eds.; Wageningen Academic Publishers: Wageningen, The Netherlands, 2003; pp. 689–695. [Google Scholar]
- Becker, S.M.; Franz, T.E.; Abimbola, O.; Steele, D.D.; Flores, J.P.; Jia, X.; Scherer, T.F.; Rudnick, D.R.; Neale, C.M.U. Feasibility Assessment on Use of Proximal Geophysical Sensors to Support Precision Management. Vadose Zone J. 2022, 21, e20228. [Google Scholar] [CrossRef]
- Lee, S.; Sharafat, A.; Kim, I.S.; Seo, J. Development and Assessment of an Intelligent Compaction System for Compaction Quality Monitoring, Assurance, and Management. Appl. Sci. 2022, 12, 6855. [Google Scholar] [CrossRef]
- Janbazialamdari, S.; Flippo, D.; Ridder, E.; Brokesh, E. Soil Compaction Prediction in Precision Agriculture Using Cultivator Shank Vibration and Soil Moisture Data. Agriculture 2025, 15, 1896. [Google Scholar] [CrossRef]
- Atanasov, A.; Bankova, A. Method for Measuring Soil Density by Assessing the Surface Tension in the Plough Stem. Eng. Proc. 2025, 104, 67. [Google Scholar] [CrossRef]
- Sudduth, K.; Chung, S.; Andrade-Sanchez, P.; Upadhyaya, S. Field comparison of two prototype soil strength profile sensors. Comput. Electron. Agric. 2008, 6, 20–31. [Google Scholar] [CrossRef]
Disclaimer/Publisher’s Note: The statements, opinions and data contained in all publications are solely those of the individual author(s) and contributor(s) and not of MDPI and/or the editor(s). MDPI and/or the editor(s) disclaim responsibility for any injury to people or property resulting from any ideas, methods, instructions or products referred to in the content. |
© 2025 by the authors. Licensee MDPI, Basel, Switzerland. This article is an open access article distributed under the terms and conditions of the Creative Commons Attribution (CC BY) license (https://creativecommons.org/licenses/by/4.0/).