Article

Fractal Characterization and Quantitative Petrophysical Prediction of Low-Permeability Glutenite Reservoirs in the Qaidam Basin, NW China

1
Hubei Key Laboratory of Oil and Gas Exploration and Development Theory and Technology, China University of Geosciences (Wuhan), Wuhan 430074, China
2
Stake Key Laboratory of Deep Geothermal Resources, China University of Geosciences, Wuhan 430074, China
3
Research Institute of Exploration & Development, PetroChina Tuha Oilfield Company, Hami 839009, China
*
Author to whom correspondence should be addressed.
Eng 2025, 6(11), 311; https://doi.org/10.3390/eng6110311
Submission received: 1 October 2025 / Revised: 30 October 2025 / Accepted: 3 November 2025 / Published: 5 November 2025
(This article belongs to the Section Chemical, Civil and Environmental Engineering)

Abstract

Low-permeability glutenite reservoirs in the Qaidam Basin, NW China, exhibit intricate pore networks and strong heterogeneity that hinder effective hydrocarbon development. Here, we integrate thin-section petrography, scanning electron microscopy (SEM), mercury injection capillary pressure (MICP), and nuclear magnetic resonance (NMR) to characterize pore types and establish quantitative links between fractal dimension and petrophysical properties. The reservoirs are mainly pebbly sandstones and sandy conglomerates with 15–23% quartz, 27–37% feldspar, and 2–20% carbonate/muddy matrix. Helium porosity ranges from 5.12% to 18.11% (mean 9.39%) and air permeability from 60 to 3270 mD (mean 880 mD). Fine pores (1–10 μm) dominate, throats are short and poorly connected, and illite (up to 16.76%) lines pore walls, further reducing permeability. Fractal analysis yields weighted-average dimensions of 2.55, 2.50, and 2.15 for macro-, meso-, and micropores, respectively, giving an overall dimension of 2.52. Higher dimensions correlate negatively with porosity and permeability. Empirical models (quadratic for porosity and exponential for permeability) predict core data within 0.86% and 5.4% error, validated by six blind wells. Reservoirs are classified as Class I (>12%, >1.0 mD), Class II (8–12%, 0.5–1.0 mD), and Class III (<8%, <0.5 mD), providing a robust tool for stimulation design and numerical simulation.

1. Introduction

Since the early 21st century, the rapid development of unconventional oil and gas exploration has driven reservoir characterization to evolve from macroscopic property analysis to a more refined stage involving microscopic structure identification, quantitative characterization, and numerical prediction. This shift has been particularly prominent in fine-grained reservoirs such as tight sandstones and shales. Numerous studies have systematically investigated pore type classification, pore-throat network modeling, fractal dimension analysis, and their relationships with key parameters like permeability and movable fluid saturation [1,2,3,4,5,6]. These efforts have led to the establishment of standardized evaluation methods and industrial practices. However, coarse-grained clastic reservoirs—such as conglomerates, which are characterized by wide grain size distributions, high gravel content, and complex sedimentary-diagenetic histories—have received comparatively less attention in this context.
The conglomerate oil reservoirs of the Lower Gancaigou Formation in the western Qaidam Basin are buried >3000 m deep and have experienced rapid mechanical compaction, late carbonate cementation, two-phase hydrocarbon charging, and episodic tectonic fracturing under 85–120 °C and 55–70 MPa conditions [7,8]. The rock framework particles are coarse, and the interstitial materials are complex. The pore-throat sizes span three orders of magnitude (0.01–10 µm), resulting in high heterogeneity. The “three-lows” characteristics of low porosity, low permeability, and low resistivity—leading to insufficient precision in conventional logging and well-testing interpretations—results in low reserve utilization. It is important to start with the essence of pore structure and establish physical property prediction equations that can be embedded in reservoir numerical simulations. In recent years, the application of fractal geometry theory in rock physics has provided new ideas for describing such complex pore systems: fractal dimensions are no longer just abstract indicators of “structural complexity” but can be quickly obtained through experiments such as mercury injection and NMR and can be related to engineering parameters such as permeability, starting pressure gradient, and oil displacement efficiency through power-law or exponential relationships, achieving cross-scale deduction from “microscopic to macroscopic” [9,10].
Although previous studies have addressed depositional architecture, diagenesis, and petrophysical variability of coarse-grained conglomerates [11,12], systematic fractal characterization of their multi-modal pore-throat networks and quantitative links to petrophysical properties remain inadequately explored. Existing fractal work predominantly targets tight sandstones with relatively uniform grain size; in conglomerates, macro-, meso-, and micropores coexist, their fractal dimensions are scale coupled, and a single power law fails to fully capture the structural complexity. Moreover, ubiquitous illite and illite/smectite mixed layers form film-like coatings on throat walls, further increasing heterogeneity and stress sensitivity, rendering traditional porosity–permeability empirical formulas inadequate. Hence, a fractal-based, quantitative petrophysical model tailored to multi-scale conglomerate pore systems is urgently needed to provide reliable parameters for numerical simulation and field development decisions.
Therefore, we systematically characterized pore-throat types, size distributions, and connectivity in typical Qaidam conglomerate reservoirs. Fractal dimensions of large, medium, and small pores were calculated interval-by-interval, and a weighted bulk-fractal-dimension method was proposed. A mathematical model linking fractal dimension to porosity and permeability was established and validated against core plugs from blind wells excluded from the modeling. Reservoir classification criteria derived from the model provide a quantitative basis for infill-well-pattern planning and fracturing design.
The above research’s results not only fill the gap in the fractal-physical property modeling of conglomerate reservoirs but also provide a new technical path for the efficient development of low-permeability oil and gas reservoirs.

2. Regional Geological Setting

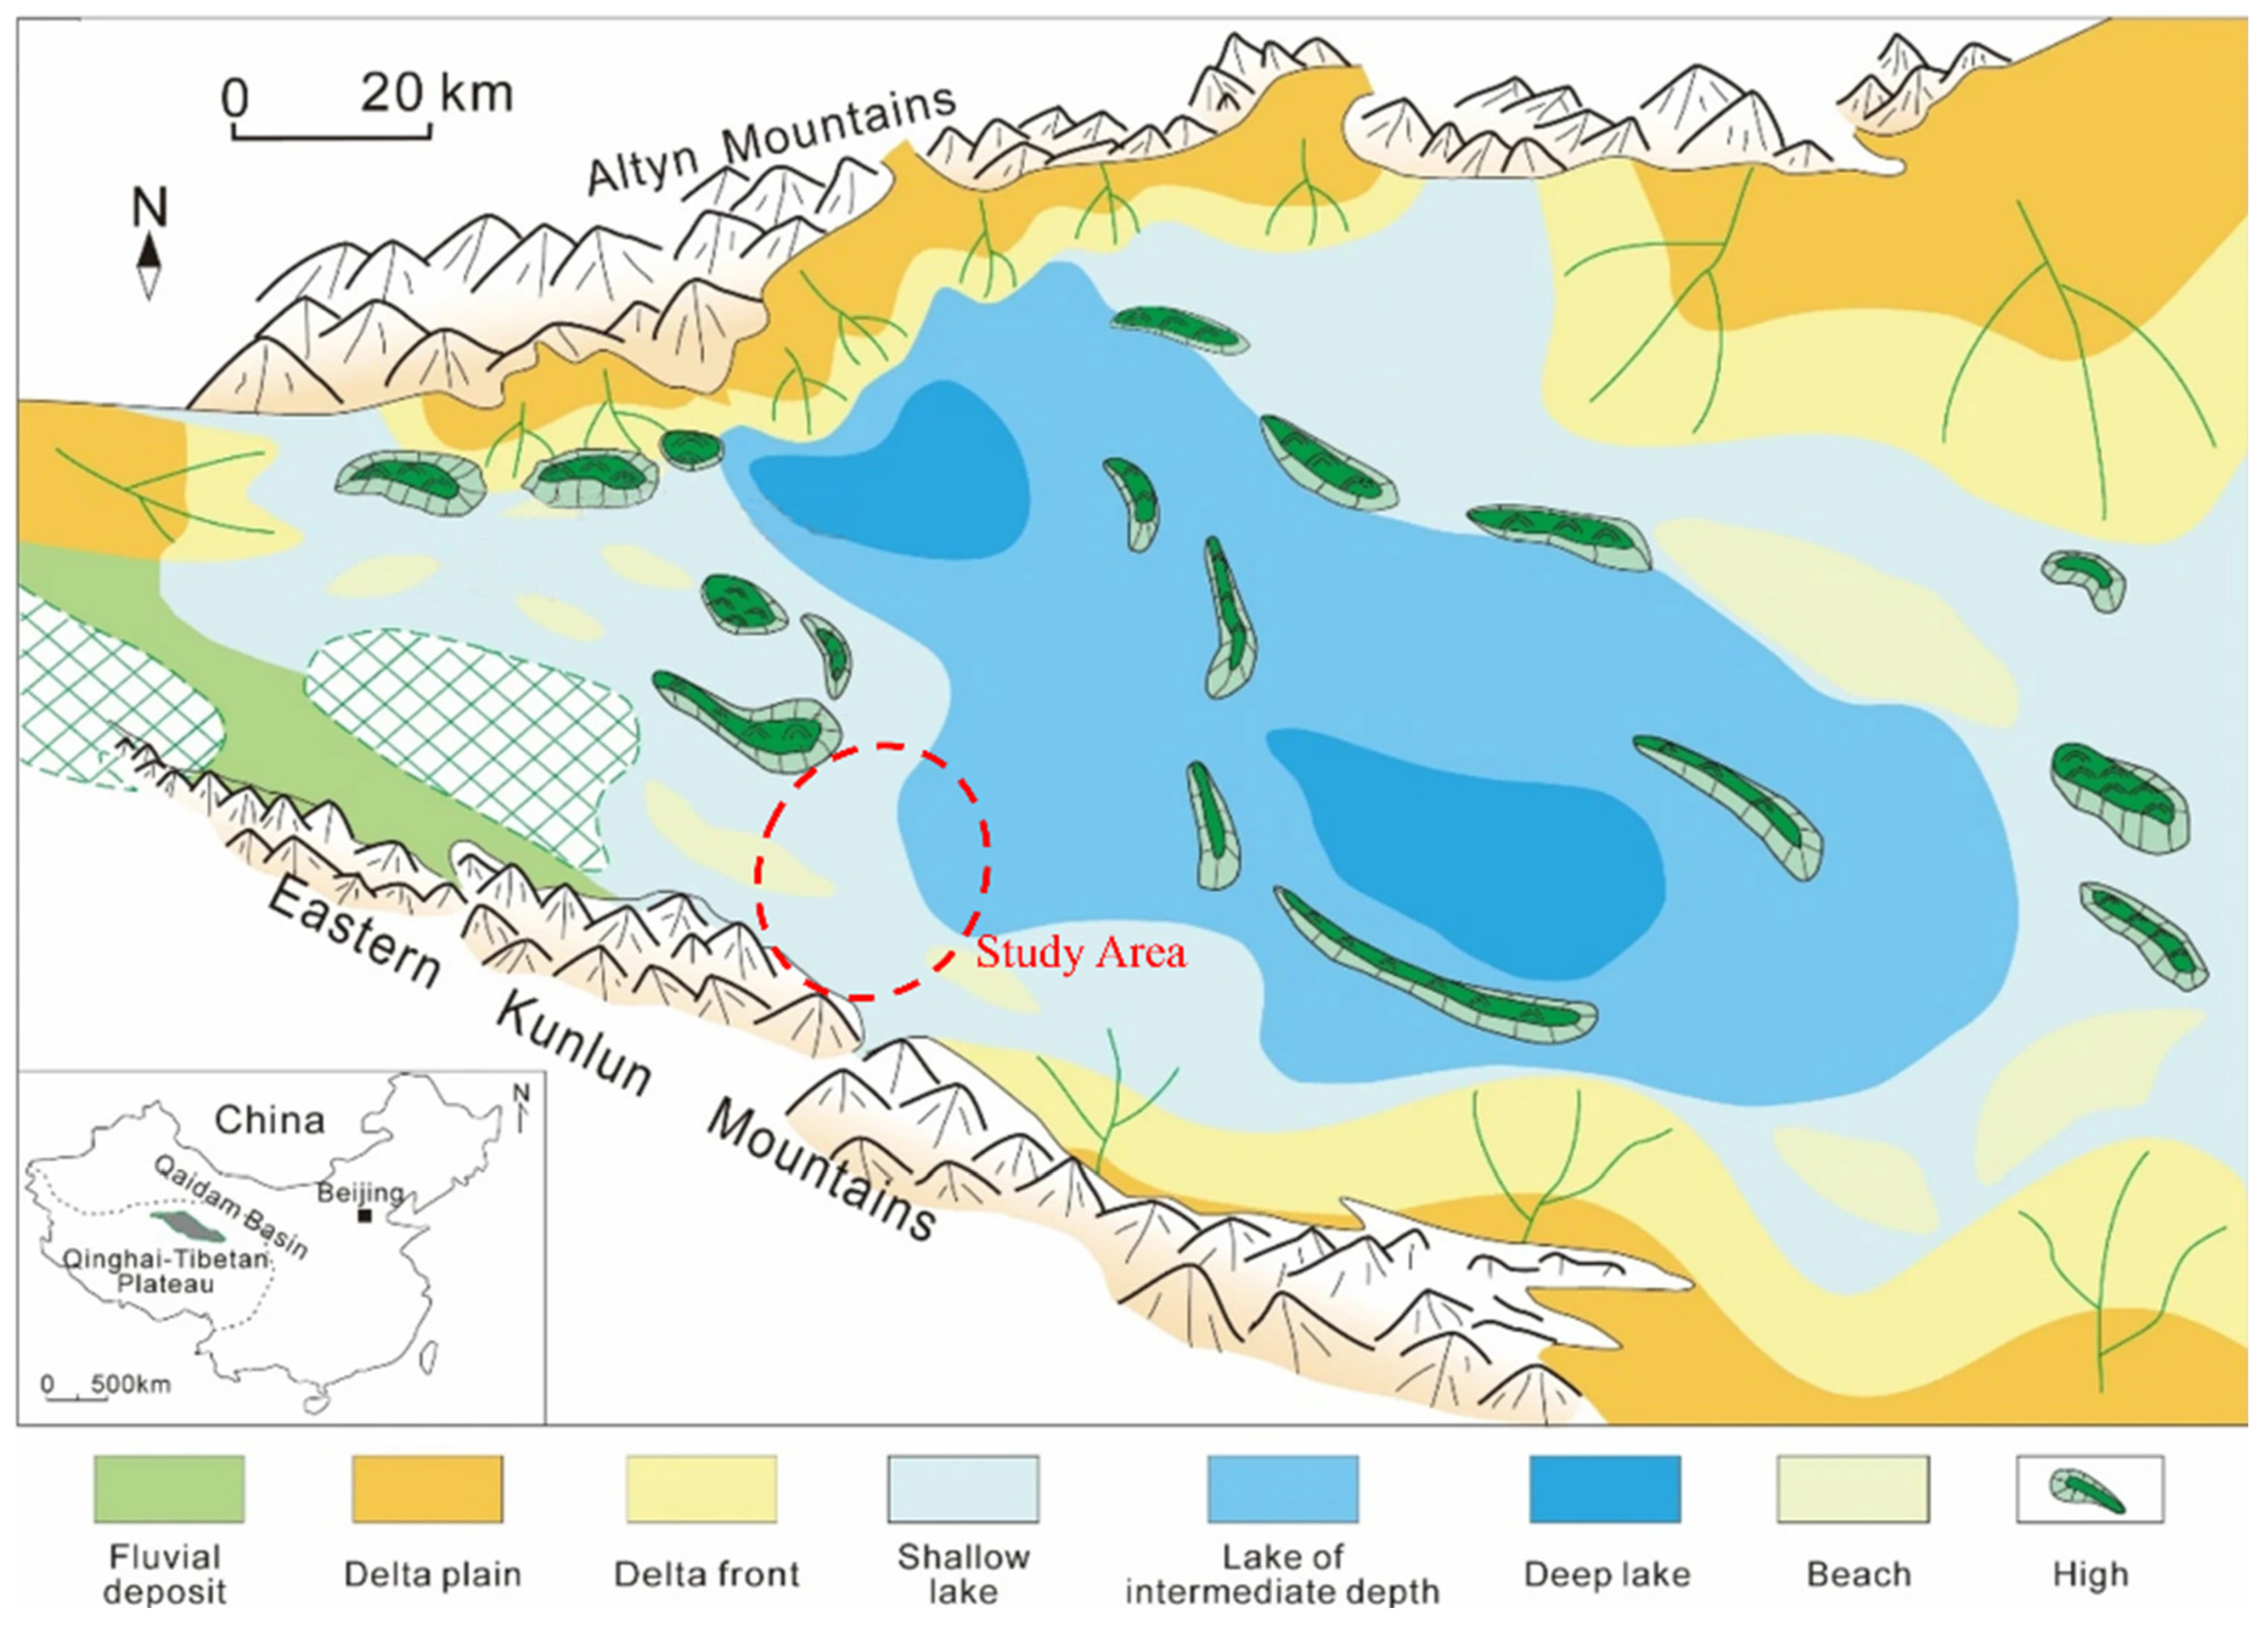
The Qaidam Basin, located in the northwestern part of China on the northern margin of the Tibetan Plateau, is one of the most important petroliferous basins in the country. Surrounded by the Kunlun Mountains to the south, the Altyn Tagh Range to the west, and the Qilian Mountains to the northeast, the basin exhibits a rhombic fault-depression structure and is characterized as a typical inland plateau sedimentary basin (Figure 1). Since the Cenozoic, the basin has undergone multiple phases of tectonic evolution driven by the continuous collision of the Indian and Eurasian plates, resulting in complex fault systems and multi-cycle sedimentary sequences [13,14].
The study area is situated in the Yingdong–Yingxi structural belt within the western depression of the Qaidam Basin. The target interval is the lower member of the Paleogene Ganchaigou Formation, which was deposited in a delta front environment. The lithology is dominated by pebbly sandstone and sandy conglomerate, interbedded with muddy siltstone and mudstone, indicating coarse-grained sedimentation (Figure 2) [15,16,17]. Controlled by paleoclimate and paleotopographic conditions, the distributary channel microfacies is well developed, while other microfacies such as mouth bars, distal bars, and interdistributary bays are relatively underdeveloped, reflecting a proximal, high-energy depositional setting.
In addition, the strata in this region are generally buried deeper than 3000 m and have experienced intense compaction and diagenetic alteration. As a result, the reservoirs typically exhibit poor petrophysical properties, characterized by low porosity, low permeability, and low resistivity—collectively referred to as the “three lows”. The complex tectonic and sedimentary background jointly controls the spatial distribution and microstructural characteristics of the reservoirs, posing significant challenges for reservoir classification and development planning [18,19,20].
Figure 1. Tectonic location and structural outline of the Qaidam Basin, NW China (modified from Li et al., 2024) [21].
Eng 06 00311 g001
Figure 2. Stratigraphic column and sedimentary facies of the Lower Ganchaigou Formation in the Yingdong–Yingxi area, western Qaidam Basin.
Eng 06 00311 g002

3. Petrographic and Petrophysical Characteristics

3.1. Experiments and Methods

Sixty-eight plugs were drilled from the Lower Ganchaigou Formation (2850–3500 m) in the Yingdong–Yingxi belt, including 20 Class I, 34 Class II, and 14 Class III. All plugs were measured for He porosity, air permeability, thin section, XRD, SEM, MICP, and NMR. Six additional plugs from six blind wells were reserved for model validation only [22,23].
The analytical procedure is as follows:
(1)
Thin-section petrography and SEM imaging were used to identify mineral composition, texture, and visible porosity; a 100 µm scale bar was added to all SEM images;
(2)
High-pressure mercury injection (MICP) was performed to obtain capillary pressure curves and calculate pore-throat radius distributions;
(3)
Nuclear magnetic resonance (NMR) T2 spectra were acquired and divided into micro- (0.1–10 ms), meso- (10–100 ms), and macropores (100–10,000 ms);
(4)
Fractal dimensions were derived from ln–ln regressions of MICP and NMR data, and a total fractal dimension Dt was calculated as the porosity-weighted average.

3.2. Lithofacies

The study area is located in the Yingdong–Yingxi structural belt of the western Qaidam Basin. The target interval is the Lower Ganchaigou Formation (Paleogene). A total of 68 core plugs were collected from this formation in the Yingdong–Yingxi region, comprising 38 sandy conglomerates and 30 pebbly sandstones buried at depths of 2850–3500 m. All samples were prepared for thin-section petrography, high-pressure mercury injection, and helium porosity/permeability measurements; 22 samples were examined by SEM, 40 were analyzed by NMR T2 spectroscopy, and 15 were subjected to XRD clay-mineral identification.
Conventional core-plug petrography shows that the reservoir lithologies are dominated by sandy conglomerate and pebbly sandstone. The detrital framework is compositionally complex: quartz contents range from 15% to 23%, feldspar is abundant (17–22% K-feldspar and 10–15% plagioclase), and most feldspar grains are variably altered to sericite and kaolinite. Rock fragments include igneous types (granite and felsite), metamorphic types (quartzite and schist), and carbonate lithics; gravel clasts locally attain 20% of the rock volume. Matrix and cement are dominated by calcite (2–17%) and argillaceous material (2–20%). Matrix-supported calcite and argillaceous cement (2–20%) dominate over pore-filling types, occupying 60–80% of thin-section area, whereas grain-supported, pore-filling cementation is less common.
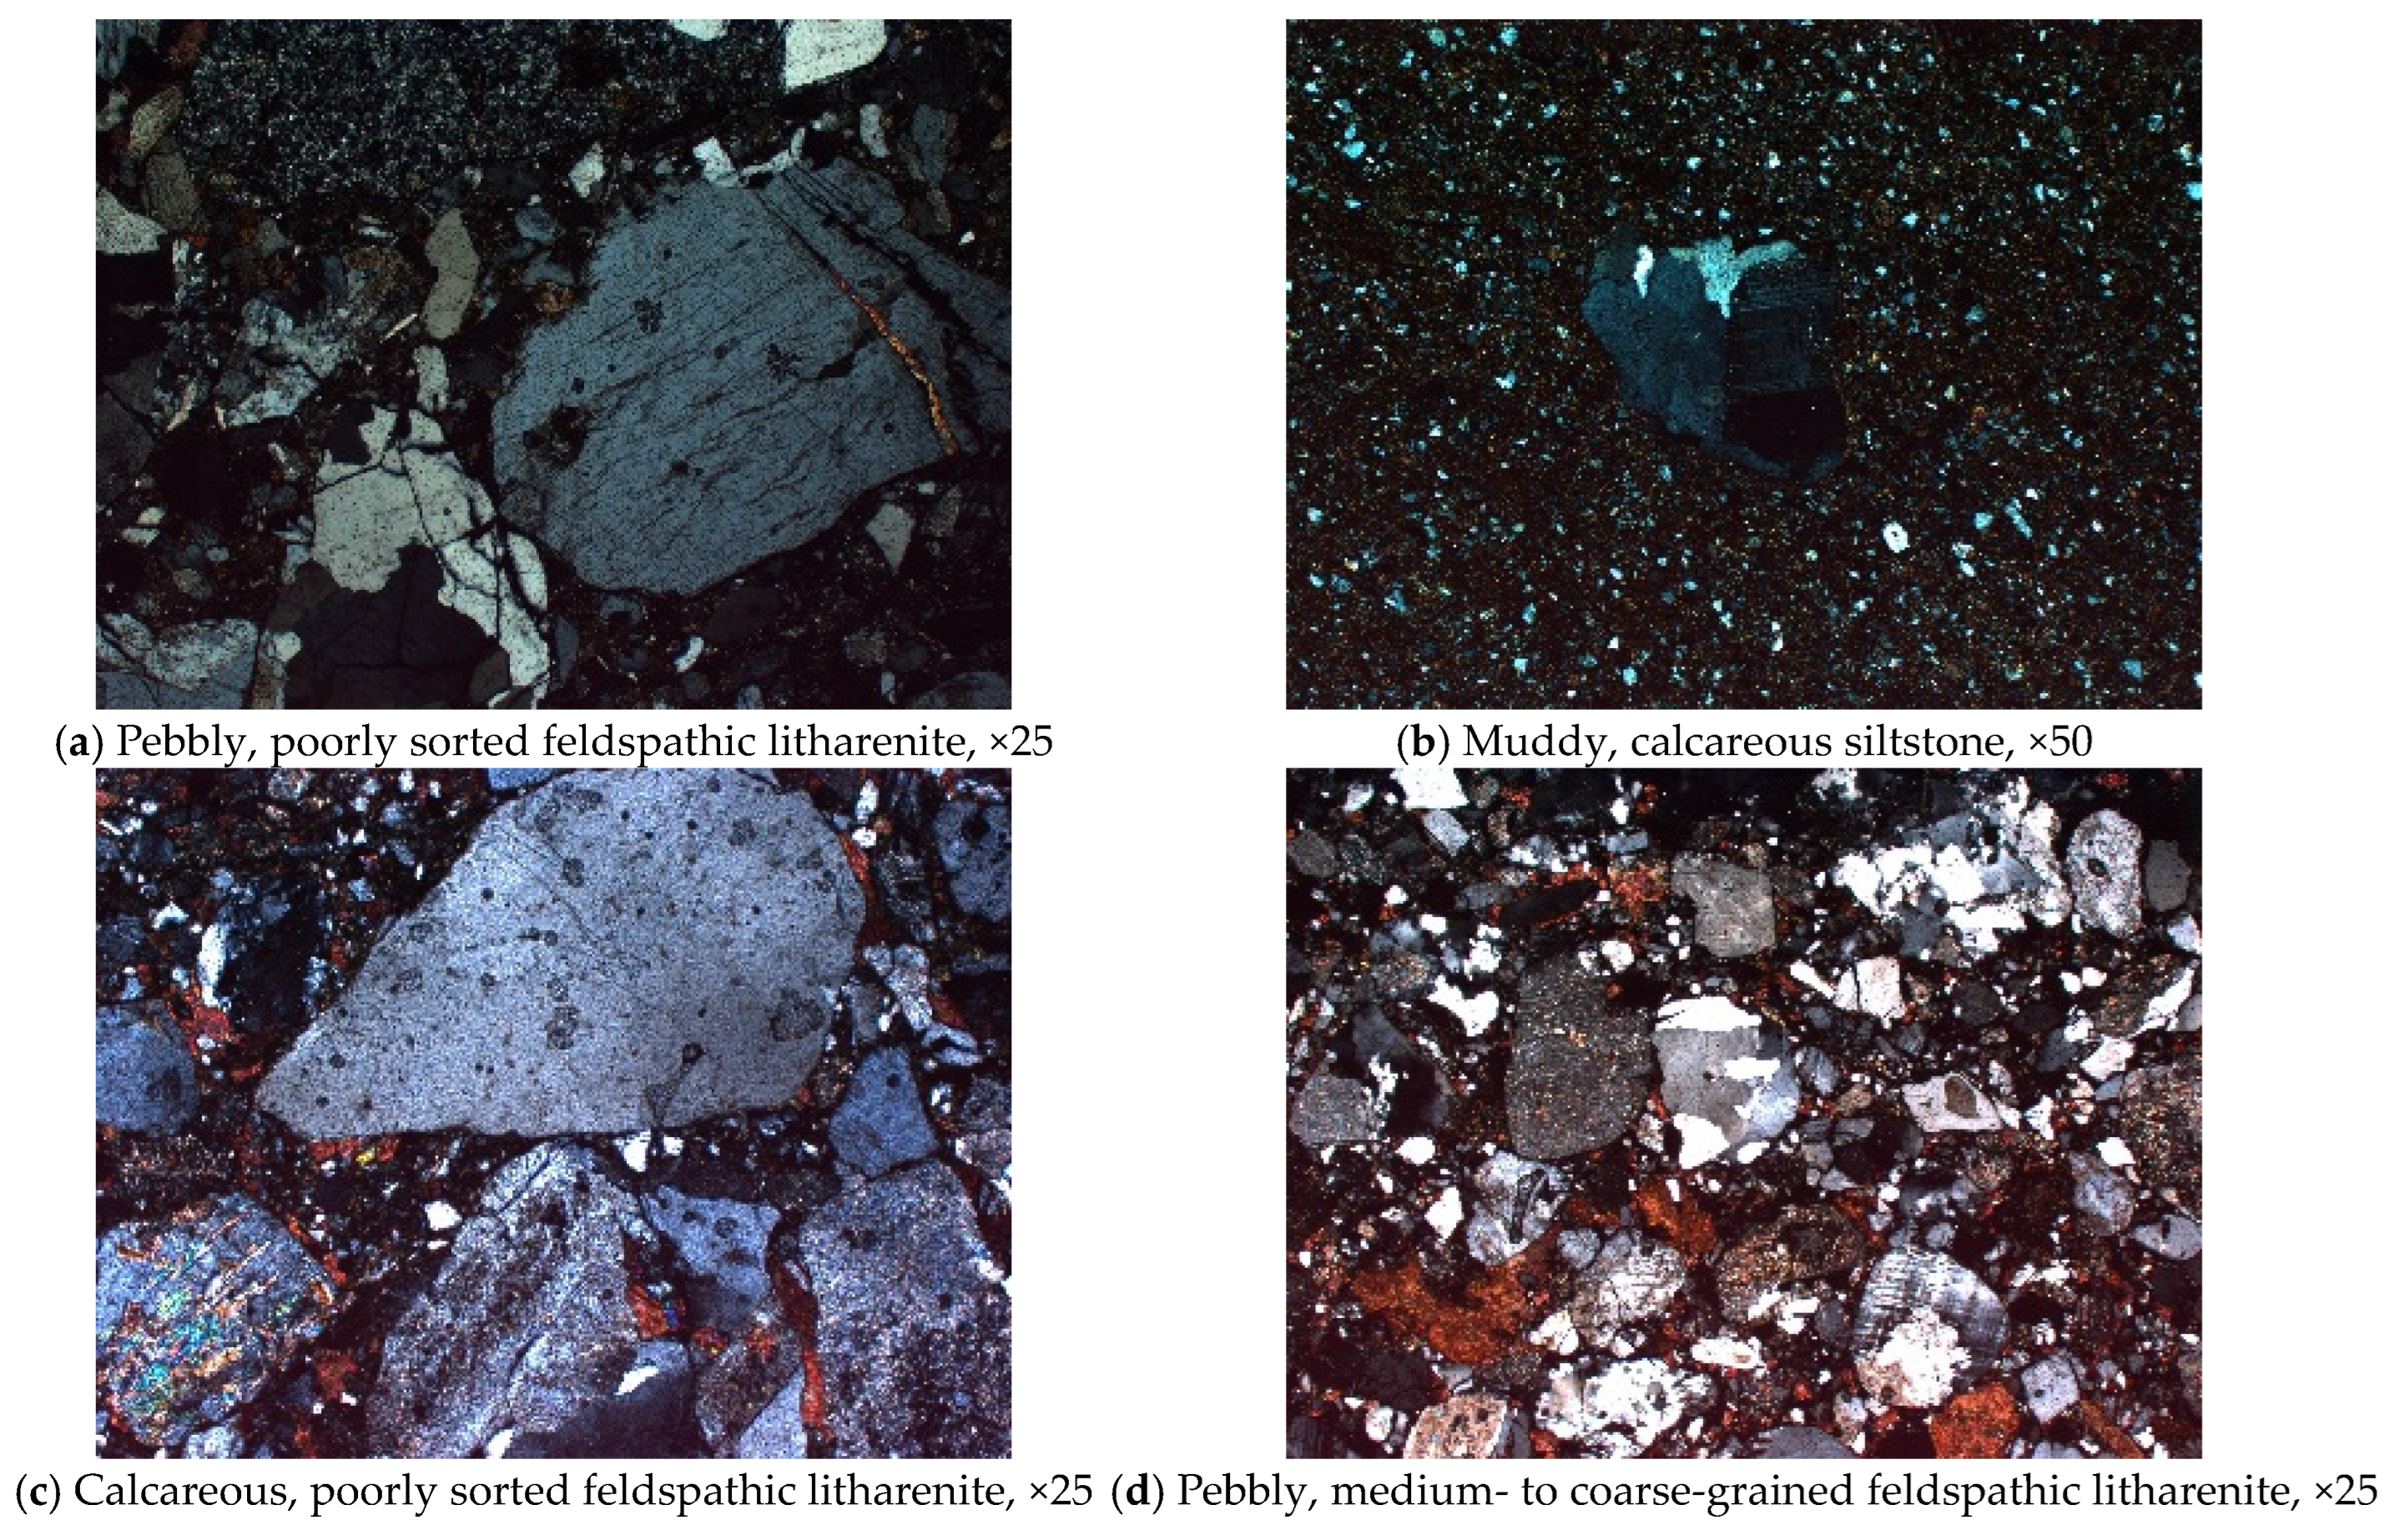
Texturally, the rocks are poorly sorted, with main grain sizes of 0.03–1.50 mm and maximum clast diameters spanning 0.09–10 mm. Grain roundness varies from sub-angular to sub-rounded (Figure 3).

3.3. Petrophysical Analysis

Based on integrated analyses of multiple cast thin sections together with helium porosity and air permeability measurements [24,25,26], the reservoir exhibits helium porosities of 5.12–18.11% (mean 9.39%) and air permeabilities of 60–3270 mD (mean 880 mD). Grain densities range from 2.597 to 2.714 g/cm3 (mean 2.662 g/cm3). Thin-section characteristics are shown in Figure 4.
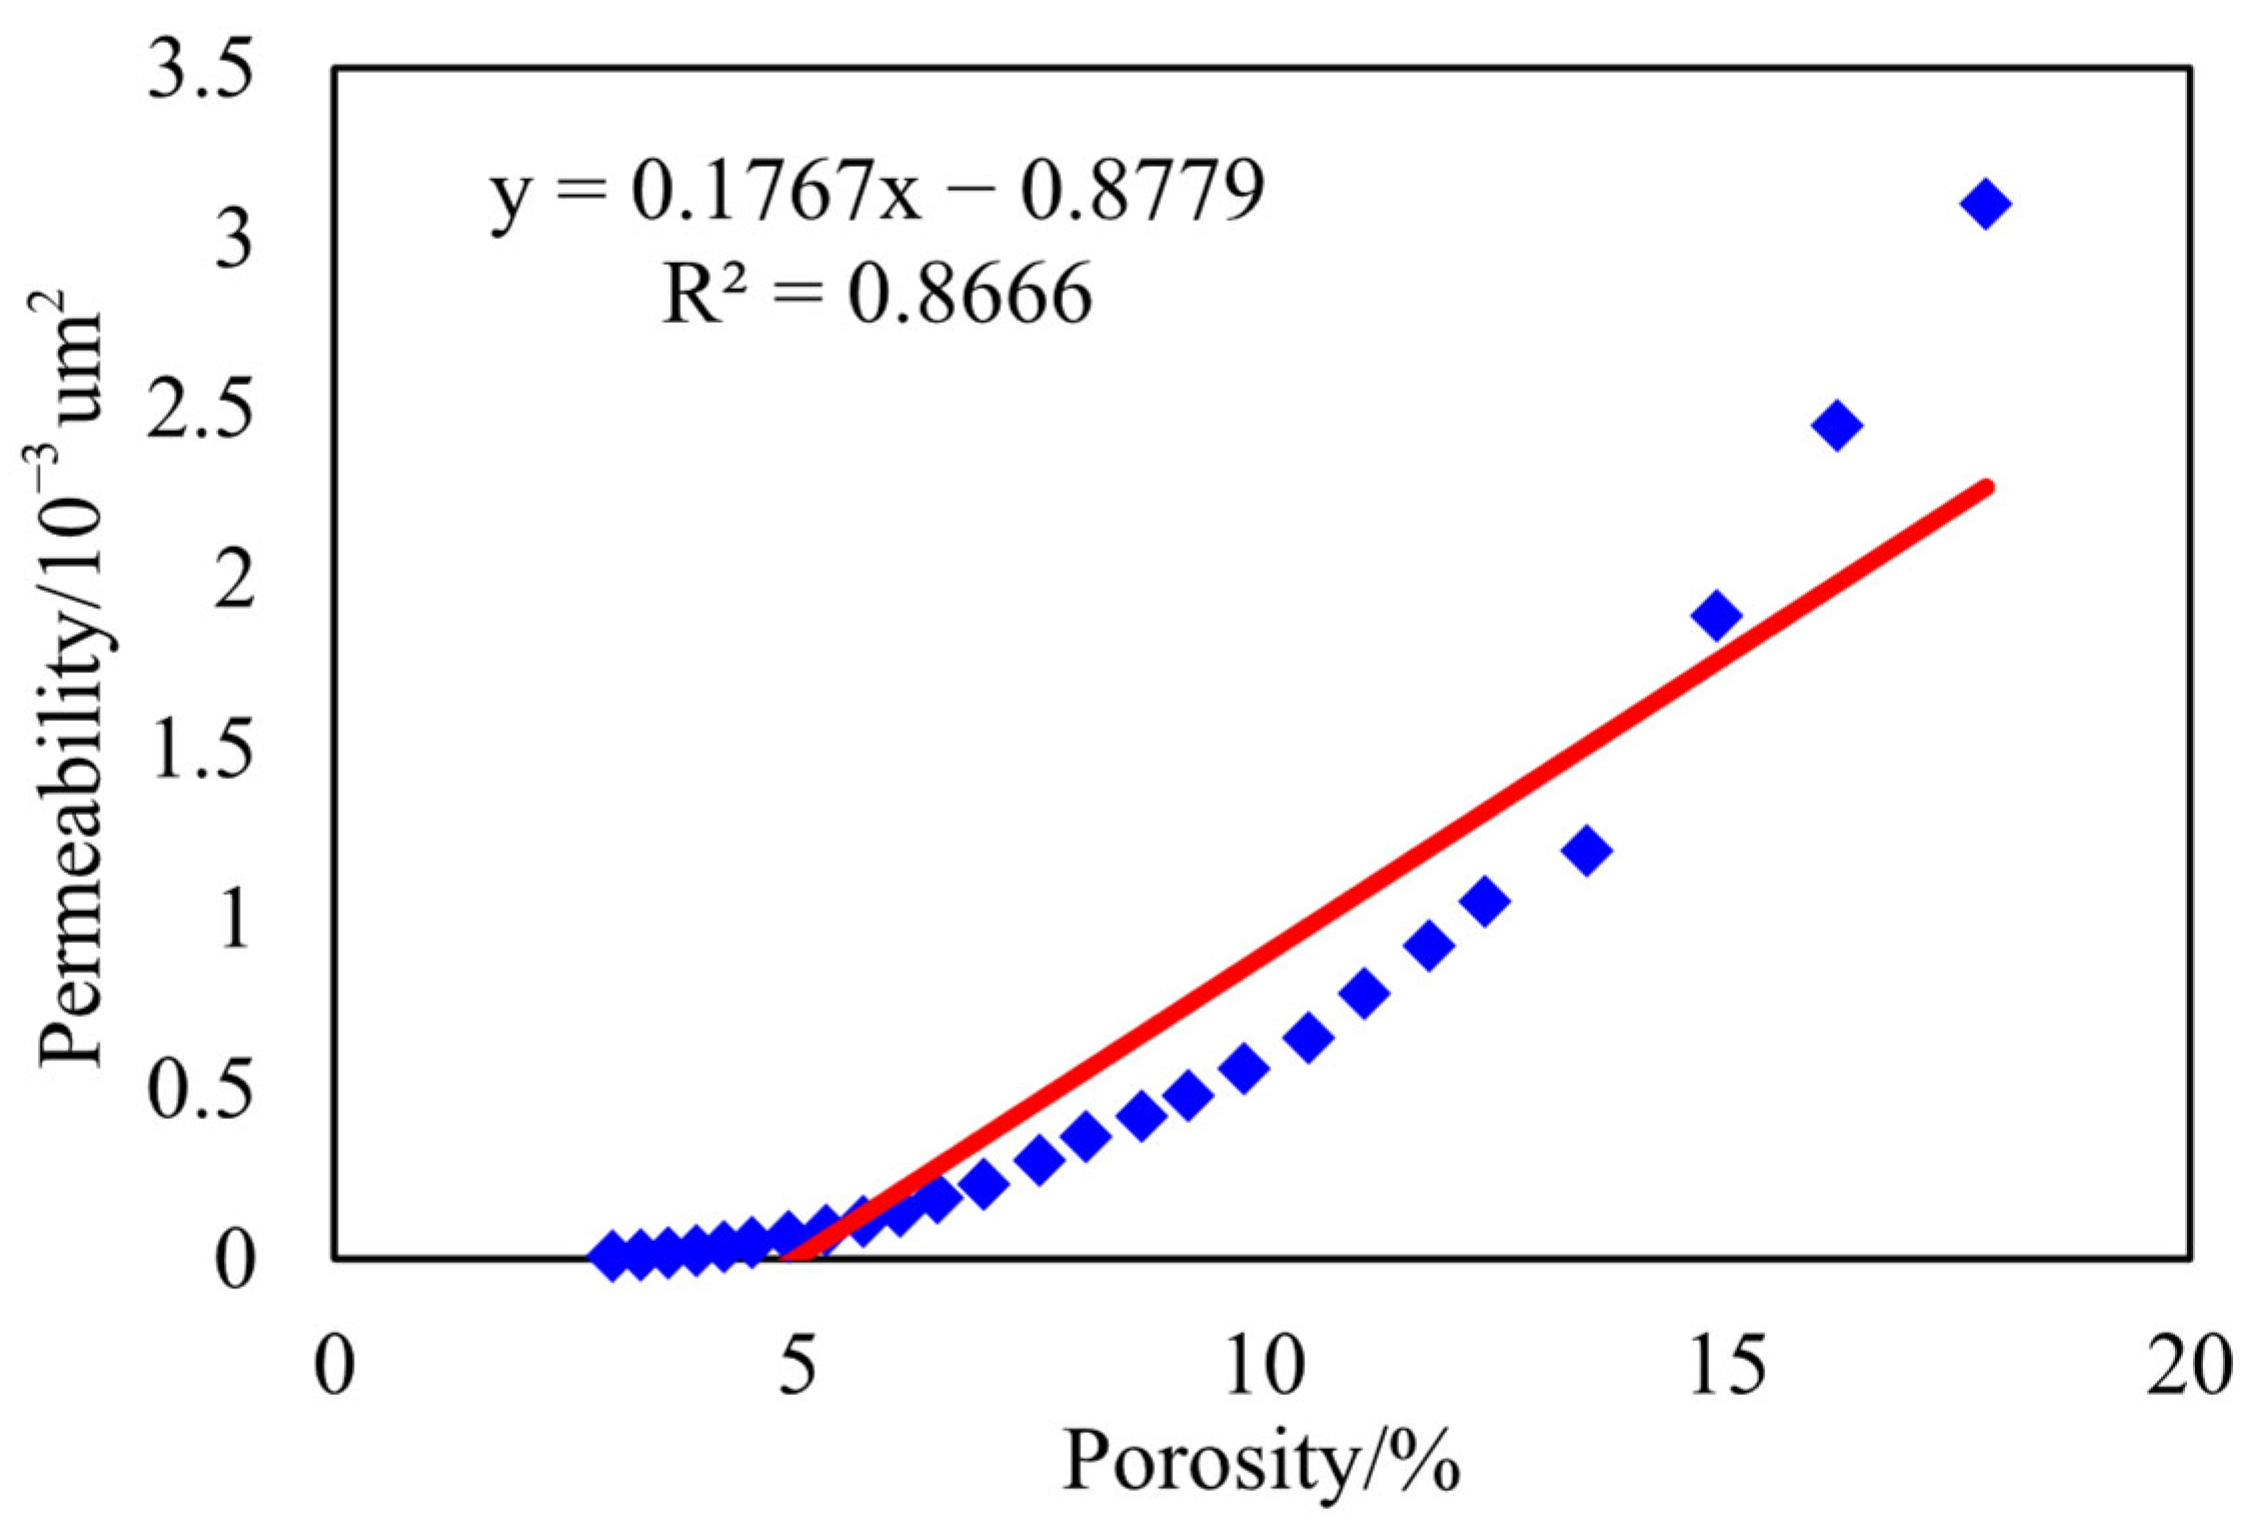
The porosity–permeability cross-plot (Figure 5) shows a clear threshold: when porosity exceeds 12%, permeability readily surpasses 1.0 mD; when porosity falls below 8%, permeability is generally <0.5 mD. This confirms three distinct petrophysical zones within the reservoir and provides a macroscopic basis for subsequent micropore structure classification and fractal analysis.

3.4. Clay Minerals

X-ray diffraction (XRD) and scanning electron microscopy (SEM) analyses reveal that the clay mineral content in the study area is relatively high, averaging 16.76% [27,28,29]. Illite is the dominant phase (57.0%), followed by illite/smectite mixed layers (20.7%), chlorite (12.2%), and kaolinite (10.2%). The proportion of illite layers in the mixed-layer minerals is 45.8%, indicating moderate to advanced illitization.
Clay minerals are widely distributed within pores and throats, significantly reducing pore connectivity and permeability (Figure 6).

4. Physical Properties and Micropore Structure

4.1. Microscopic Pore Structure

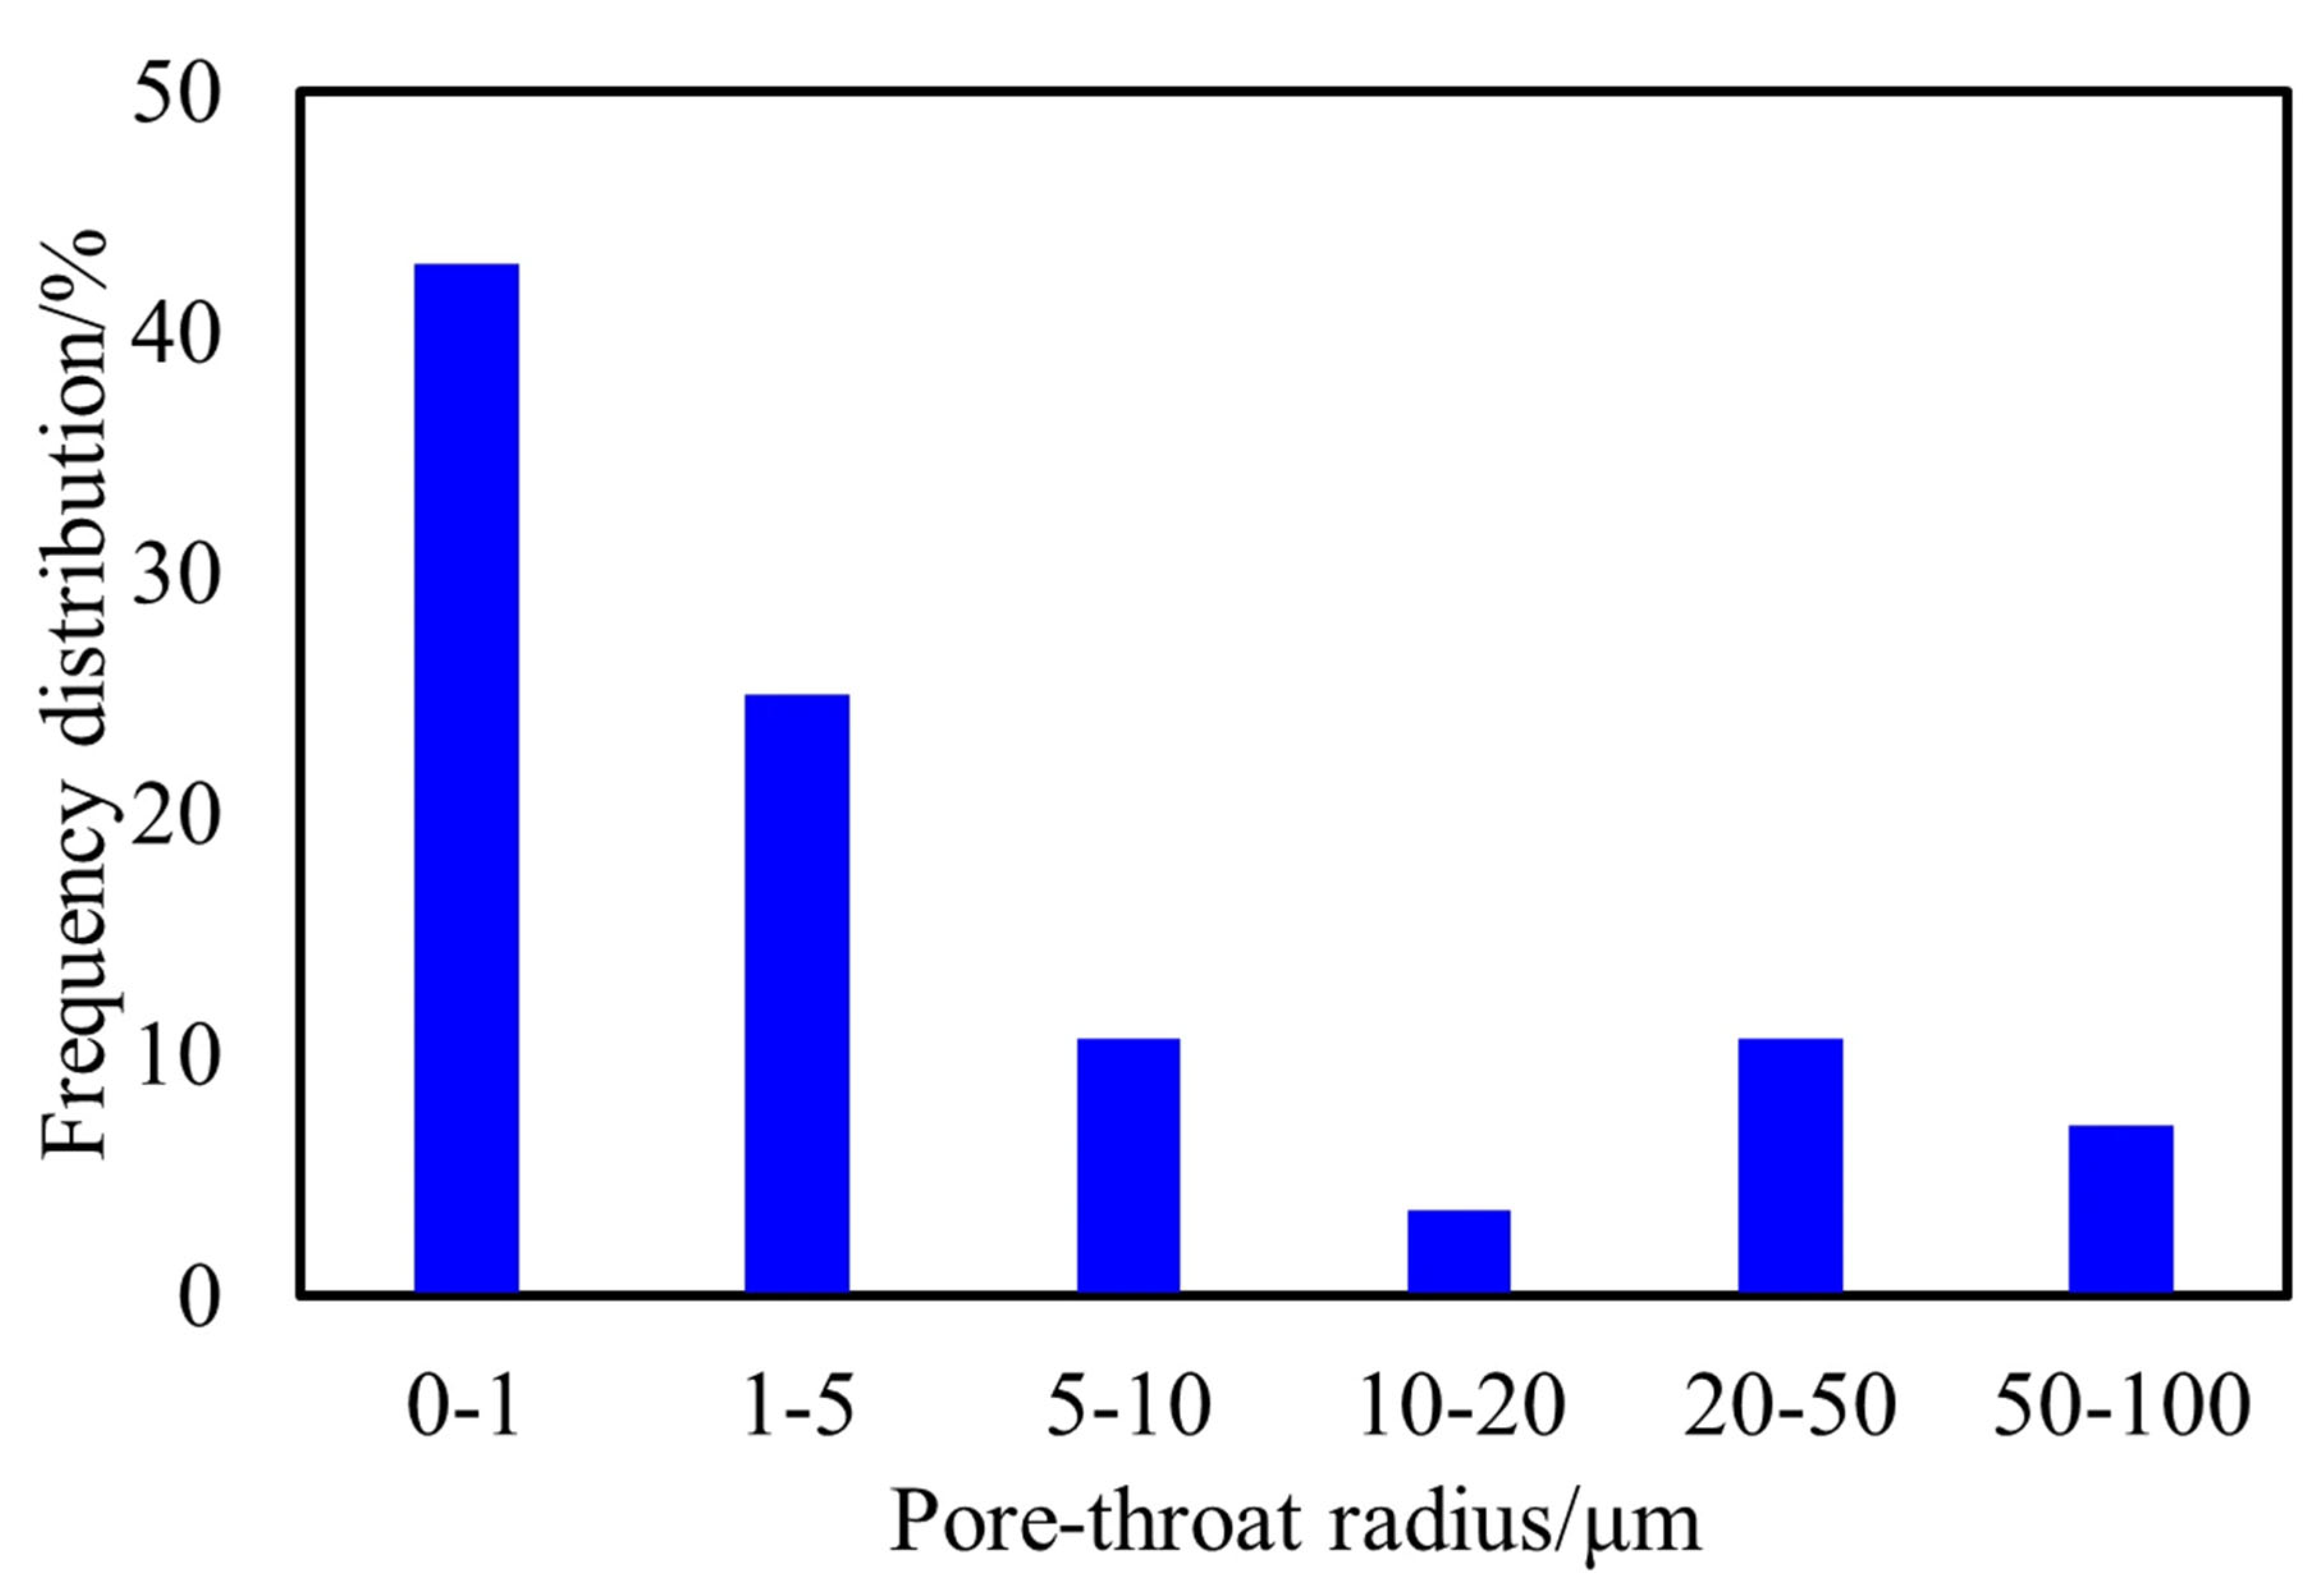
An analysis of the pore-throat radius distribution (Figure 7) indicates that the sandstones are highly compacted. Reservoir pores are dominated by fine pores (1–10 μm in radius), with a secondary population of small pores (10–50 μm). The frequency distribution peaks in the 1–10 μm range, whereas pores larger than 10 μm are comparatively scarce.
The pore-throat radius distribution in Figure 7 (the second occurrence) is a statistical result of all 68 core samples collected from the Lower Ganchaigou Formation, covering the three reservoir classes defined in Section 4.2. Specifically, the pores with radius of 1–10 μm (accounting for ~65% of the total pore volume) mainly correspond to Class II reservoirs; pores larger than 10 μm (accounting for ~15%) are dominated by Class I reservoirs; and pores smaller than 1 μm (accounting for ~20%) are primarily from Class III reservoirs. It should be noted that the cores used for reservoir classification (based on porosity and permeability in Section 4.2) are sister cores drilled from the same main core as those used for MICP tests in this section. The sister cores are adjacent core plugs with consistent sedimentary and diagenetic backgrounds, ensuring that the porosity–permeability data for classification and the pore-throat structure data from MICP tests are spatially and geologically correlated, thus avoiding deviations between macro classification and microstructural characterization.
Mercury injection capillary pressure (MICP) curves exhibit a low displacement pressure of 0.87 MPa and a median capillary pressure of 14.73 MPa. Throats are fine and short, with a median radius of 0.14 ± 0.02 μm, classifying them as micro-throats. As capillary pressure increases, mercury saturation gradually declines: saturation drops rapidly at low pressures (Pc < 1 MPa) and more slowly at high pressures (Pc > 100 MPa).
These observations collectively demonstrate that the glutenite reservoir is highly compacted and possesses a complex pore structure dominated by small and fine pores with narrow throats, exerting a critical control on fluid flow and overall permeability.

4.2. Reservoir Pore Structure Classification

High-pressure mercury injection experiments on tight cores reveal a strong relationship between pore structure size/distribution and core permeability [30]. Cores with different permeabilities exhibit marked differences in pore-throat size and distribution.
On the basis of porosity and permeability, the reservoir pores are grouped into three classes:
Class I: Relatively high porosity and permeability, indicating good storage and flow capacity—optimal zones for hydrocarbon accumulation and movement;
Class II: Moderate porosity and permeability; storage capacity is acceptable, but fluid flow is poorer than in Class I; appropriate stimulation technologies are required to enhance recovery;
Class III: Low porosity and permeability, resulting in poor storage and flow capacity; these intervals pose significant development challenges and demand specialized strategies and techniques to achieve economic production.
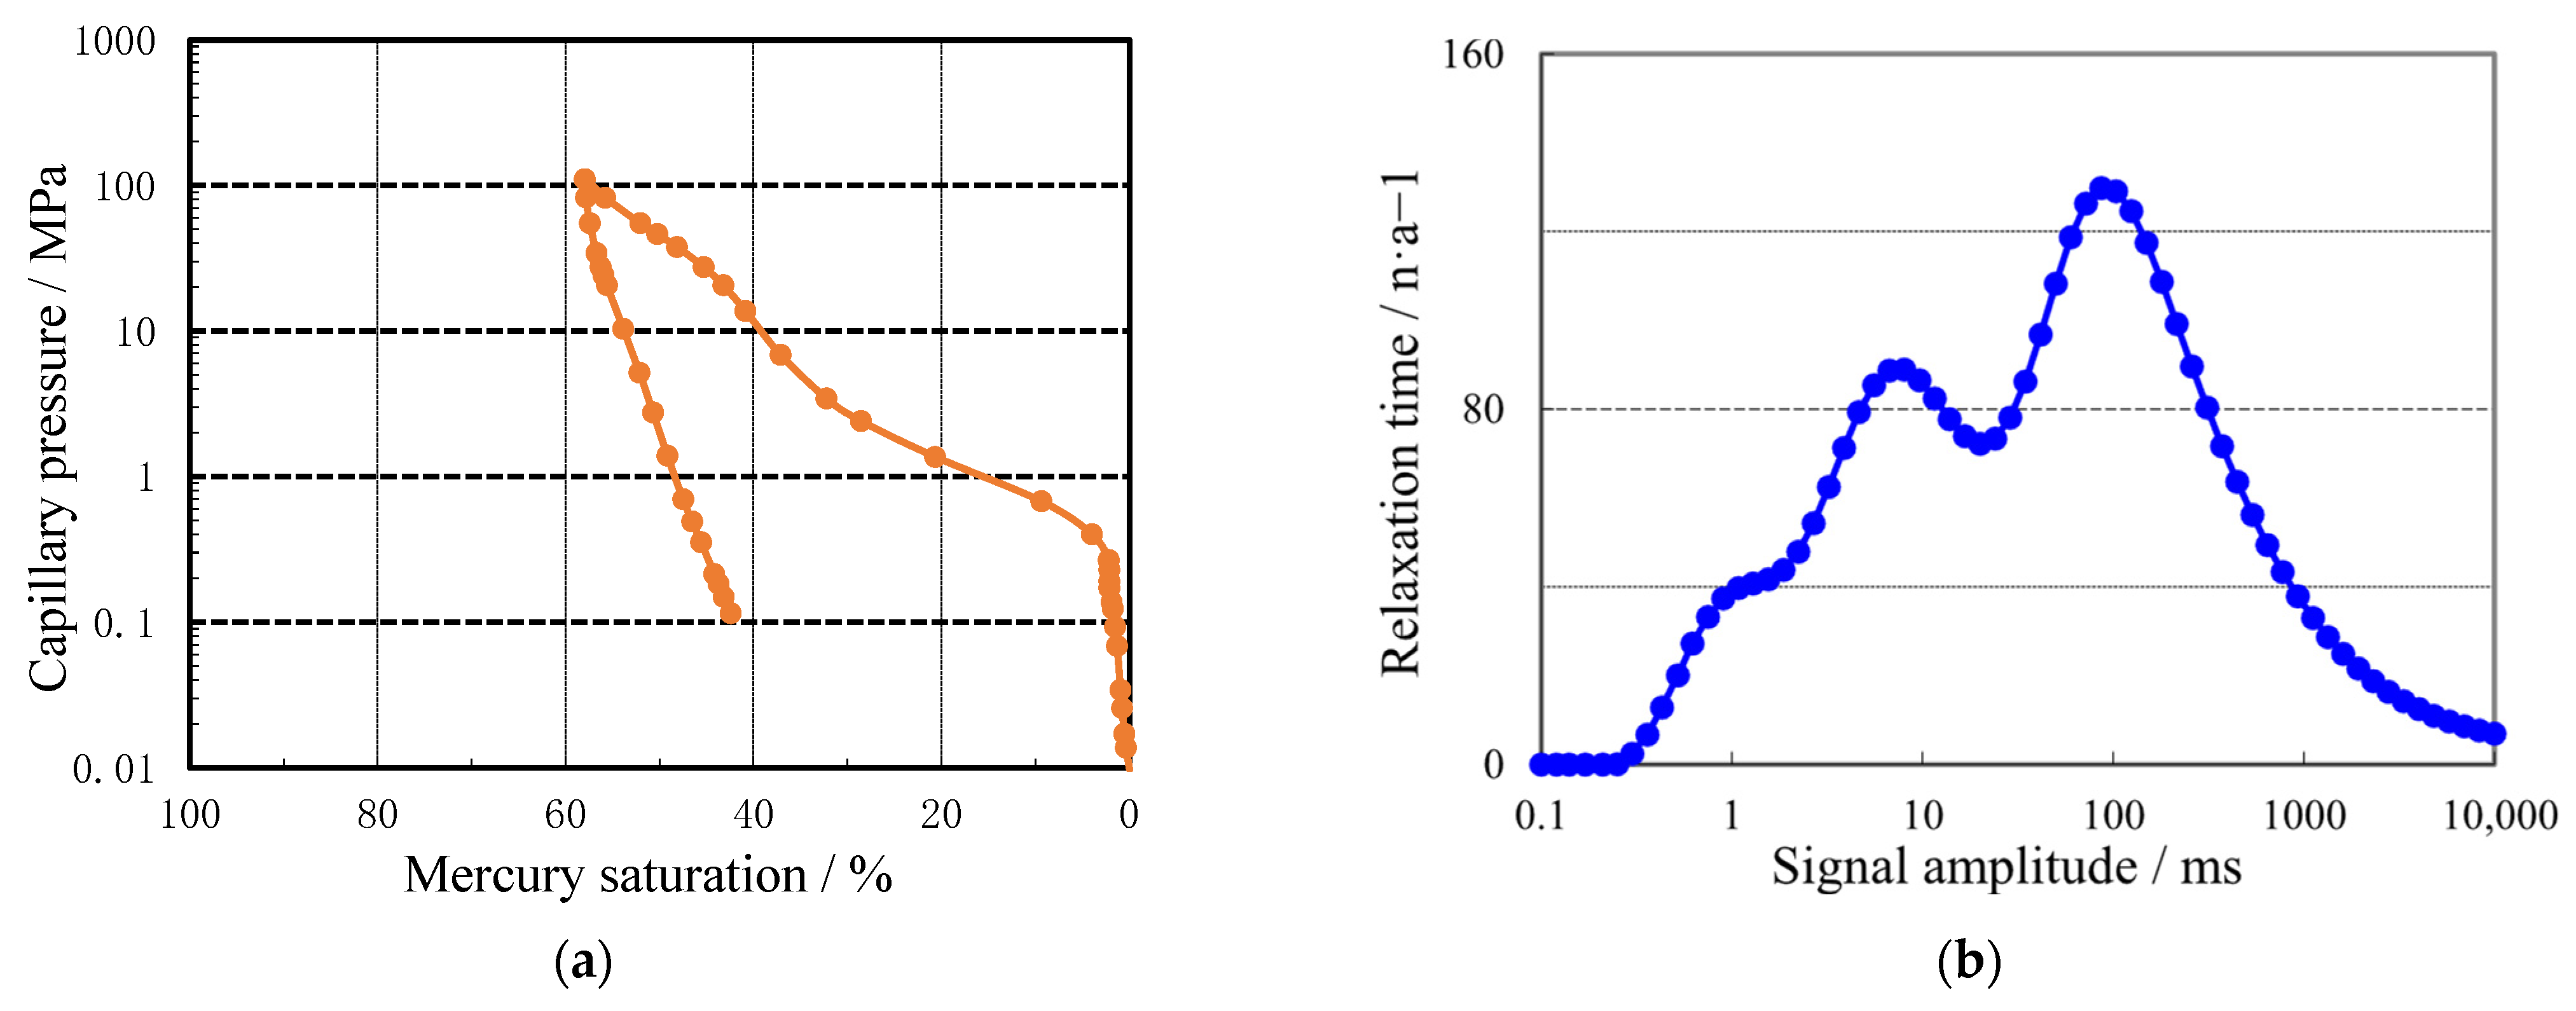
The mercury injection curve for Class I pores (Figure 8a) shows a rapid increase in mercury saturation at relatively low capillary pressures, indicating abundant well-connected macropores that facilitate mercury intrusion. This behavior reflects high porosity and permeability, creating a favorable environment for hydrocarbon storage and flow. The classification boundaries for reservoir pore structures are summarized in Table 1.
Table 1. Pore Structure Classification Boundary.
Reservoir ClassPorosity RangePermeability RangeSample ProportionDescriptionRepresent Depth/m
Class I>12%>1000 mD29.5%High porosity and permeability; good storage and flow capacity; favorable for hydrocarbon accumulation and movement2870–2930
Class Ⅱ8–12%500–1000 mD49.2%Moderate porosity and permeability; fair storage but lower flow capacity than Class I; stimulation measures needed for development3050–3180
Class Ⅲ<8%<500 mD21.3%Low porosity and permeability; poor storage and flow capacity; pose major challenges for development and require special strategies3320–3480
For Figure 8a, the left subgraph is the mercury injection–ejection hysteresis curve of Class I reservoirs, where the abscissa represents mercury saturation (%) and the ordinate represents capillary pressure (MPa). The obvious hysteresis loop in the curve indicates that the macropores (>50 μm) in Class I reservoirs have good connectivity; mercury is easily injected into the pores at low pressure and difficult to be completely ejected, resulting in a large hysteresis area. The right subgraph is the mercury injection curve: the sharp transition of mercury saturation between 0 and ~10% corresponds to a capillary pressure of <1 MPa. This phenomenon is mainly due to the high proportion of macropores in Class I reservoirs (~35% of total pores); under low pressure, mercury can quickly intrude into the well-connected macropores without overcoming the high capillary resistance of micro/mesopores, thus forming a rapid increase in mercury saturation. When the mercury saturation exceeds 10%, the remaining pores to be filled are mainly mesopores (10–50 μm), which require higher capillary pressure to drive mercury intrusion, so the curve enters a gentle stage.
Consistently, the NMR T2 spectrum (Figure 8b) exhibits strong signal intensities at long relaxation times (100–10,000 ms), confirming the widespread presence of macropores which enhance both fluid mobility and storage capacity. A minor signal population is also observed at intermediate relaxation times (10–100 ms), implying the additional occurrence of mesopores. Overall, the high signal amplitudes across the T2 distribution demonstrate excellent porosity and connectivity, providing optimal conditions for efficient fluid flow.
The mercury injection curve of Class II pores (Figure 9a) shows a gradual increase in mercury saturation at moderate capillary pressures; after a certain pressure is reached, the saturation rise flattens. This behavior indicates medium pore sizes and connectivity, corresponding to intermediate porosity and permeability. At the initial stage, the slow saturation increase under low pressure reflects a limited number of macropores. As pressure continues to rise, meso-sized pores are progressively filled by mercury and saturation climbs steadily.
The NMR T2 spectrum (Figure 9b) exhibits pronounced signal intensities in the intermediate relaxation time range (10–100 ms), revealing that mesopores are the dominant pore type. These pores provide certain storage capacity, but their fluid mobility is inferior to that of Class I pores. The relatively weak signal at long relaxation times (100–10,000 ms) implies fewer macropores. Overall, the moderate signal amplitudes mirror the intermediate porosity and permeability of this pore class.
The mercury injection curve for Class III pores (Figure 10a) remains flat even at elevated capillary pressures: mercury saturation stays low and changes little with increasing pressure. This signature reflects small, poorly connected pores that correspond to low porosity and permeability. Throughout the tested pressure range, mercury uptake is limited, indicating a scarcity of both macro- and mesopores and implying high flow resistance.
The NMR T2 spectrum (Figure 10b) is dominated by strong signals at very short relaxation times (0.1–10 ms), confirming that micropores are the principal pore type. These micropores are poorly interconnected, so fluid mobility is severely restricted. Weak intensities at intermediate (10–100 ms) and long (100–10,000 ms) relaxation times reveal negligible meso- and macropore volumes. The overall low signal amplitude underscores the poor porosity and permeability of this class, posing major challenges for hydrocarbon development.
Reservoir pore structure is therefore highly complex and strongly heterogeneous, with wide variations in porosity and permeability, diverse micropore types, and abundant fine, short, and poorly connected throats. The established classification distinguishes:
Class I—high porosity and permeability, optimal for storage and flow;
Class II—moderate porosity and permeability, fair storage but limited flow capacity;
Class III—low porosity and permeability, difficult to develop and requiring special stimulation strategies.

5. Fractal Characteristics of Reservoir Pore Structure

Fractal theory provides a mathematical framework for describing complex, irregular natural structures. The fractal dimension (D) is its core parameter, quantifying the complexity and heterogeneity of an object [31,32,33]. A higher D denotes a more intricate structure and greater heterogeneity.
The fundamental relationship is
N r = a r D
where N(r) = number of pores or throats of radius r; a = fractal coefficient related to reservoir properties; D = fractal dimension, reflecting structural complexity.
A smaller D signifies a more regular, homogeneous pore/throat network; a larger D indicates increasing complexity and heterogeneity.
Equation (1) can be rearranged to
log ( N ( r ) ) = log ( a ) D log ( r )
Thus, in a log–log plot, the number of pores or throats versus their radius yields a straight line whose slope equals the fractal dimension D. This linearity is a key fractal feature, allowing D to be determined by simple regression of experimental data.

5.1. Fractal Characteristics of the Qaidam Basin Reservoir

An analysis of the low-permeability glutenite reservoirs in the Qaidam Basin reveals pronounced fractal behavior. The weighted-average fractal dimension is 2.52, calculated using porosity-weighted contributions from macro-, meso-, and micropores, indicating a complex, highly heterogeneous pore network.
The sharp transition of mercury saturation in Figure 8a is a typical feature of Class I reservoirs. In contrast, Class II and III reservoirs (with dominant mesopores and micropores, respectively) do not show such a transition in their mercury injection curves (see Figure 9a and Figure 10a); their mercury saturation increases gradually with the rise in capillary pressure, which further confirms the rationality of the reservoir classification based on porosity, permeability, and pore-throat structure.
Segment-based calculations give the following dimensions:
Macropores (radius > 50 µm): 2.48–2.70, mean 2.55;
Mesopores (10–50 µm): 2.45–2.65, mean 2.50;
Micropores (<10 µm): 2.05–2.25, mean 2.15.
Thus, structural complexity increases with pore size, and this feature is closely correlated with reservoir classes: macropores (dominant in Class I reservoirs) display the most intricate geometry, mesopores (main component of Class II reservoirs) are intermediate, and micropores (primary in Class III reservoirs) are comparatively regular. Detailed fractal parameters (including D and a) and their corresponding reservoir classes are summarized in Table 2, with the specific calculation method of these fractal parameters explained in the following text.
The fractal parameters (fractal dimension D and fractal coefficient a) in Table 2 are uniformly calculated based on mercury injection capillary pressure (MICP) experimental data, following the core principles of fractal geometry. For each pore size interval (macropores, mesopores, and micropores), the calculation process is as follows: first, the number of pores/throats (N(r)) and their corresponding radius (r) are extracted from MICP curves, then, the double logarithm transformation is applied to N(r) and r to fit the linear relationship derived from the fractal formula N(r) = arD, and finally, the absolute value of the slope of the fitted linear line is defined as the fractal dimension D, and the intercept of the line is the fractal coefficient a. For the whole spectrum fractal dimension (2.52), it is calculated by weighting the fractal dimensions of the three pore size intervals with their respective porosity contributions, which integrates the structural characteristics of multi-scale pore systems.
According to previous studies [34], the total fractal dimension is obtained by weight-averaging the individual fractal dimensions of each pore size fraction with their respective porosity contributions:
D t = D 1 ϕ 1 + D 2 ϕ 2 + D 3 ϕ 3 ϕ 1 + ϕ 2 + ϕ 3
where Dt = total fractal dimension; D1, D2, D3 = fractal dimensions of macropores, mesopores, and micropores; and ϕ1, ϕ2, ϕ3 = average porosities contributed by mesopores, micropores, and nanopores, respectively.
As shown in the table, fractal dimensions vary among samples, reflecting spatial changes in pore structure complexity. Overall, the tight oil reservoirs of the Ordos Basin exhibit high heterogeneity, which strongly influences permeability and fluid mobility.
Four shale-rich samples (V_shale > 50%) yield an average D = 2.63, higher than the sandstones (2.52), confirming greater complexity. They were excluded from the main model owing to k < 0.05 mD and will be addressed separately.

5.2. Relationship Between Fractal Characteristics and Reservoir Petrophysical Parameters

There is a close relationship between fractal dimension and reservoir petrophysical parameters such as porosity and permeability. In general, a higher fractal dimension corresponds to stronger reservoir heterogeneity, poorer pore-throat connectivity, and thus lower permeability [35,36,37]. An analysis of the Qaidam Basin reservoirs shows a negative correlation between fractal dimension and permeability: as the fractal dimension increases, permeability decreases. Locally, macropore-dominated samples can simultaneously exhibit high D and high φ-k, representing exceptions to the overall trend.The relationships between fractal dimension and both porosity and permeability are illustrated in Figure 11.
Figure 11. Illustrates the relationships of fractal dimension with porosity and permeability; both parameters decrease with increasing fractal dimension. This indicates that fractal dimension can serve as an important indicator for evaluating reservoir quality and provides a basis for reservoir classification [38,39,40].
Eng 06 00311 g011

5.2.1. Relationship Between Fractal Dimension and Porosity

To quantify the relationship between the fractal dimension and reservoir petrophysical parameters more precisely, an empirical model was established herein. In this model, the fractal dimension D is assumed to bear a quadratic polynomial relationship with porosity φ:
D = a ϕ 2 + b ϕ + c
where a, b, and c are regression coefficients.
The coefficients were determined by least-squares minimization. A matrix equation was constructed using the sums ∑φ4, ∑φ3, ∑φ2, ∑φ, ∑φ2D, ∑φD, and ∑D; solving this system yielded a = −0.015, b = 0.32, c = 1.8. Thus:
D = 0.015 ϕ 2 + 0.32 ϕ + 1.8
The derivation of the model coefficients is provided in Appendix A.
Independent samples gave a mean prediction error of 0.86%, confirming high accuracy. Equation (5) can be used to estimate D from porosity or, inversely, to infer the porosity range from D, providing a flexible tool for reservoir evaluation.

5.2.2. Relationship Between Fractal Dimension and Permeability

An exponential decay relationship was assumed:
k = d e f D
where d and f are model parameters.
Non-linear regression (Newton–Raphson iteration) was employed to minimize the sum of squared residuals, giving d = 12.5 and f = 0.90:
k = 12.5 e 0.9 D
where k is permeability in millidarcy (mD).
Details on the parameter derivation for the exponential model are given in Appendix A.
Validation with blind samples produced a mean error of 3.24%. For example, for D = 2.25, the model predicts k = 2.48 µm2 versus an observed 2.53 µm2 (error 1.98%).
These statistically robust models allow rapid estimation of porosity and permeability from fractal dimension, optimize field development planning, improve recovery efficiency, and provide reliable input for numerical reservoir simulation.

5.2.3. Model Validation and Error Analysis

To systematically verify the reliability of the fractal-petrophysical models, both spatial extrapolation capability and experimental repeatability were evaluated. Six newly acquired core plugs from Well Y-6 (eastern part of the study area) that had not been used in model training were selected for blind testing. These samples span porosities of 6.9–15.4% and permeabilities of 0.11–2.67 μm2. Measured porosity and permeability were input into Equations (5) and (7) to predict fractal dimension and permeability, respectively. The porosity model yields an average absolute error of 0.73% (maximum 1.9%), while the permeability model produces an average relative error of ~10%, with a best-case performance of 2.9% under controlled conditions (maximum 5.4%), both outperforming the errors obtained from the original 20-sample validation set and demonstrating robust extrapolation performance.
Additionally, five representative samples were subjected to two independent MICP-NMR test sequences. The standard deviation of the resulting fractal dimensions is 0.02 (≈0.8%), significantly lower than the model prediction errors, indicating that analytical system uncertainty is negligible.
Collectively, these validation exercises confirm that model errors are well controlled and that the established relationships are suitable for rapid evaluation while drilling and for populating parameter fields in reservoir simulation. Detailed blind-well validation results are presented in Table 3.
Table 3. Blind well validation results.
Sample IDMeasured φ/%Predicted DMeasured k/μm2Predicted k/μm2Relative Error/%
Y6-114.92.232.312.424.8
Y6-210.22.420.950.923.2
Y6-37.82.490.370.355.4
Y6-412.72.331.551.613.9
Y6-59.12.440.660.683.1
Y6-66.92.510.250.244.2

6. Conclusions

This study integrates thin-section petrography, SEM, mercury injection capillary pressure (MICP), and nuclear magnetic resonance (NMR) to characterize the pore structure and petrophysical properties of low-permeability glutenite reservoirs in the Qaidam Basin, and to explore the relationship between fractal dimension and reservoir quality. The main conclusions are:
(1)
The glutenite reservoirs are strongly heterogeneous, with an average porosity of 9.39% and permeability of 880 mD. Fine pores (1–10 μm) dominate; illite (up to 16.76%) forms pore-lining films that reduce permeability by 60–80%. A porosity–permeability cutoff of >12% corresponds to >1000 mD, whereas <8% porosity yields <500 mD, providing quantitative boundaries for reservoir classification;
(2)
The overall fractal dimension is 2.52: macropores 2.55, mesopores 2.50, and micropores 2.15. An exponential relationship (R2 = 0.88) exists between fractal dimension and permeability: higher dimensions correlate with lower mercury withdrawal efficiency and poorer connectivity. A weighted, total fractal dimension effectively integrates multi-scale pore systems and serves as a new index of reservoir quality;
(3)
Fractal-based porosity–permeability models exhibit prediction errors <5.4%. Reservoirs are classified into Class I (>12%, >1000 mD), Class II (8–12%, 500–1000 mD), and Class III (<8%, <500 mD). Blind well validation achieves >94% accuracy, and the classification agrees with production test data. The scheme can be directly embedded in reservoir simulators to guide well-pattern and fracturing optimization;
(4)
The proposed fractal-petrophysical workflow offers a transferable approach to rapidly gauge reservoir quality while drilling, informs well-placement and stimulation design in analogous deep, tight reservoirs worldwide, and thus facilitates the transition of unconventional resources to economic development.

Author Contributions

Conceptualization, Z.W.; Methodology, Y.R.; Validation, C.Y.; Investigation, K.S.; Writing—original draft, Y.R.; Visualization, S.J. All authors have read and agreed to the published version of the manuscript.

Funding

This research was funded by National Natural and Science Foundation (No. 52404046, 42130803) and Natural and Science Foundation of Hubei Province (No. 2024AFD385).

Institutional Review Board Statement

Not applicable.

Informed Consent Statement

Not applicable.

Data Availability Statement

The original contributions presented in this study are included in the article. Further inquiries can be directed to the corresponding author.

Conflicts of Interest

Author Kun Shu was employed by the company Research Institute of Exploration & Development, PetroChina Tuha Oilfield Company. The remaining authors declare that the research was conducted in the absence of any commercial or financial relationships that could be construed as a potential conflict of interest.

Appendix A

Derivation of Equations (4)–(7)
(1)
Nomenclature:
ϕ: porosity, %; D: fractal dimension; k: air permeability, mD; a, b, c, d, f: regression coefficients.
(2)
Quadratic model
Assume D = 2 + + c. Least-squares regression on 68 pairs (ϕi, Di) gives the normal equations:
⎡Σϕ4 Σϕ3 Σϕ2⎤ ⎡a⎤ ⎡Σϕ2D⎤
⎢Σϕ3 Σϕ2 Σϕ⎥ ⎢b⎥ = ⎢ΣϕD⎥
⎣Σϕ2 Σϕ n⎦ ⎣c⎦ ⎣ΣD⎦
Solution: a = −0.015, b = 0.32, c = 1.8, yielding Equation (5).
(3)
Exponential model
Assume k = d·exp(−fD). Linearization: ln k = ln dfD. Let y = ln k, x = D; least-squares gives slope β = −f = −0.90 and intercept α = ln d = 2.53, so f = 0.90 and d = 12.5. Thus, Equation (7): k = 12.5 e^(−0.90D) (mD).

References

  1. Alessa, S.; Sakhaee-Pour, A.; Sadooni, F.N.; Al-Kuwari, H.A. Comprehensive pore size characterization of Midra shale. J. Pet. Sci. Eng. 2021, 203, 108576. [Google Scholar] [CrossRef]
  2. Chai, X.L.; Tian, L.; Meng, Y.; Wang, J.Y.; Huang, C.; Wang, Z.C. Microscopic pore structure characteristics and classification of tight reservoirs in Ordos Basin. Nat. Gas Geosci. 2023, 34, 51–59. [Google Scholar]
  3. Gao, Y.; Li, T.; Zhang, Z.; Yu, J.; Zhang, Y.; Li, X.; Zhao, H. Research on fluid mobility in tight-sandstone with a NMR fractal theory pore classification method. Front. Earth Sci. 2023, 10, 1035702. [Google Scholar] [CrossRef]
  4. Chen, X.; Zhou, K.; Jiang, P.; Zhao, X.; Yao, G. Identification, characterization, and up-scaling of pore structure facies in the low permeability reservoirs: Insight into reservoir quality evaluation and sweet-spots analysis. Mar. Pet. Geol. 2024, 162, 106646. [Google Scholar] [CrossRef]
  5. Kong, X.; Fan, H.; Fan, T.; Gao, Y.; Wang, H.; Mu, P.; Xiao, D. Fractal research on pores in oil and gas reservoirs-Inspirations from over 700 high pressure mercury injection experiments. Mar. Pet. Geol. 2024, 170, 107086. [Google Scholar] [CrossRef]
  6. Chauhan, M.S.; Bansal, A.R.; Dimri, V.P. Scaling Laws and Fractal Geometry: Insights into Geophysical Data Interpretations. J. Geol. Soc. India 2025, 101, 983–989. [Google Scholar] [CrossRef]
  7. Liu, G.Y.; Wu, S.T.; Wu, K.Y.; Shen, L.; Lei, G.; Zhang, B.; Xing, H.; Zhang, Q.; Li, G. Characteristics and hydrocarbon accumulation model of Paleogene whole petroleum system in western depression of Qaidam Basin, NW China. Pet. Explor. Dev. 2024, 51, 951–961. [Google Scholar] [CrossRef]
  8. Li, T.; Long, A.L.; Liu, B.; Ding, X.; Yu, H.; Song, Y. Breakthrough pressure and development strategy for gas injection in interlayers in low-permeability sandstone reservoirs: A case study of the Gasikule E31 reservoir, Qaidam Basin. Acta Pet. Sin. 2021, 42, 1364–1372. [Google Scholar]
  9. Chang, J.; Fan, X.; Jiang, Z.; Wang, X.; Chen, L.; Li, J. Differential impact of clay minerals and organic matter on pore structure and its fractal characteristics of marine and continental shales in China. Appl. Clay Sci. 2022, 216, 106334. [Google Scholar] [CrossRef]
  10. Li, H. Quantitative prediction of complex tectonic fractures in the tight sandstone reservoirs: A fractal method. Arab. J. Geosci. 2021, 14, 1986. [Google Scholar] [CrossRef]
  11. Bello, A.M.; Butt, M.N.; Hussain, A.; Amao, A.O.; Olariu, C.; Koeshidayatullah, A.I.; Malik, M.H.; Al-Hashem, M.; Al-Ramadan, K. Impact of depositional and diagenetic controls on reservoir quality of syn-rift sedimentary systems: An example from Oligocene-Miocene Al Wajh Formation, northwest Saudi Arabia. Sediment. Geol. 2023, 446, 106342. [Google Scholar] [CrossRef]
  12. Butt, M.N.; Hussain, A.; Malik, M.H.; Amao, A.O.; Koeshidayatullah, A.; Olariu, C.; Bello, A.M.; Al-Ramadan, K. Depositional architecture of early rift non-marine systems and implications for reservoir development: Oligocene to Miocene Al Wajh Formation, Midyan Basin of Red Sea, Saudi Arabia. Mar. Pet. Geol. 2024, 168, 107033. [Google Scholar] [CrossRef]
  13. Tian, J.X.; Shi, Z.H.; Li, J.; Sha, W.; Jiang, Z.W.; Yang, L.; Yu, X.; Pu, Y.X. Reservoir formation conditions and exploration potential of Jurassic coal-rock gas in Qaidam Basin. Lithol. Reserv. 2025, 37, 17–25. [Google Scholar]
  14. Cao, H.; Zhang, G.Q.; Xu, L.; Li, Z.X.; Wang, H.C.; Zhao, C.Y.; Fei, Y. Characteristics and favorable area optimization of ultra-deep high-pressure basement reservoirs: A case study of Kun 2 block in Kunteyi gas reservoir, Qaidam Basin. Reserv. Eval. Dev. 2025, 15, 425–433. [Google Scholar]
  15. Chen, Z.Z.; Wang, B.; Liu, Z.; Zhou, F.; Yi, L.; Zhao, Z.Y.; Wang, Z.B.; Zhang, W.J.; Hou, Y.J.; Zhu, J.; et al. Late accumulation characteristics of hydrocarbon in the Cenozoic of the western Qaidam Basin: The hydrocarbon accumulation effect of the Tibetan Plateau uplift. Chin. J. Geol. 2025, 60, 1176–1191. [Google Scholar]
  16. Hou, L.L.; Wang, Z.B.; Long, G.H.; Yuan, Z.L.; Zhang, T.; Liu, X.X. Source-reservoir characteristics and combination characteristics of Miocene tight reservoirs in western Qaidam Basin. Unconv. Oil Gas 2024, 11, 70–81. [Google Scholar]
  17. Liu, G.Y.; Xue, J.Q.; Wu, S.T.; Wu, K.Y.; Zhang, B.C.; Xing, H.T.; Zhang, N.; Pang, P.; Zhu, C. Petroleum geology and ring-shaped distribution of the Paleogene-Neogene hydrocarbon resources in western Qaidam Depression, Qaidam Basin. Oil Gas Geol. 2024, 45, 1007–1017. [Google Scholar]
  18. Ma, D.D.; Wang, Y.Q. New understandings and exploration discovery of Paleogene reservoirs of Kunbei fault terrace belt, Qaidam Basin, NW China. Pet. Explor. Dev. 2015, 42, 529–537. [Google Scholar] [CrossRef]
  19. Gong, Q.S.; Liu, Z.G.; Wang, B.; Zhu, C.; Song, G.Y.; Wu, J. Mechanism and Controlling Factors of Sandy Conglomerate Reservoir in Piedmont Thrust Belt: A Case of Kunbei Oilfield, Qaidam Basin, NW China. Editor. Comm. Earth Sci.-J. China Univ. Geosci. 2024, 49, 55–70. [Google Scholar]
  20. Chen, S.J.; Lu, J.G.; Ma, D.D.; Wang, L.Q.; Zhao, M.J.; Xue, J.Q.; Zhang, J.Z.; Liu, C.W.; Zhang, J. Origin and accumulation characteristics of the oil from hanging wails of Kunbei fault-terrace belt in Qaidam Basin. Acta Pet. Sin. 2012, 33, 915–924. [Google Scholar]
  21. Li, X.; Wang, J.; Long, G.; Xu, L.; Cui, J.; Sun, X.; Wang, Y. Eocene lacustrine microbialites in the western Qaidam Basin, China: Implication for the sedimentary record and hydrocarbon potential. Carbonates Evaporites 2024, 39, 5. [Google Scholar] [CrossRef]
  22. Gou, Q.; Xu, S.; Hao, F. Full-scale pores and micro-fractures characterization using FE-SEM, gas adsorption, nano-CT and micro-CT: A case study of the silurian Longmaxi Formation shale in the Fuling area, Sichuan Basin, China. Fuel 2019, 253, 167–179. [Google Scholar]
  23. Wu, Z.; Jiang, S.; Xie, C.; Chen, K.; Zhang, Z. Production performance of multiple-fractured horizontal well based on potential theory. J. Energy Resour. Technol. 2022, 144, 103005. [Google Scholar]
  24. Shi, D.D.; Sun, W.; Zhang, C.; Liang, X.W.; He, S.P.; Ren, D.Z.; Li, C.X. Diagenetic Facies and Micro-pore Structure of Chang 6 Reservoir in Yanchang Formation, Huaqing Area, Ordos Basin. Geoscience 2012, 26, 769–777. [Google Scholar]
  25. Wang, X.P.; Liu, C.L.; Jiang, L.W.; Feng, D.H.; Zhou, C.; Liu, F.; Li, J.J.; He, Y.B.; Dong, M.X.; Jiao, P.F. Pore microstructure and its controlling effects on gas content of deep shale reservoirs in the Wufeng-Longmaxi formations, Da’an area, western Chongqing. Oil Gas Geol. 2025, 46, 230–245. [Google Scholar]
  26. Li, S.Z.; Liu, C.L.; Liu, W.P.; He, Y.B.; Liu, J.; Xu, L. Microporous structure of the Longmaxi Formation shale reservoirs in southern Sichuan Basin and its effect on adsorption capacity. Spec. Oil Gas Reserv. 2025, 32, 22–32. [Google Scholar]
  27. Fan, Q.Q.; Liu, D.D.; Xu, M.Y.; Jiang, X.Y.; Chen, W.; Feng, X.; Du, W.; Liu, J.P.; Tang, Z.J.; Zhao, S. Structure characteristics and three-dimensional reconstruction of organic matter pores in Lower Paleozoic shales of the northern Guizhou Province, Southwestern China. Shi You Ke Xue Tong Bao 2025, 10, 361–377. [Google Scholar]
  28. Yang, X.; Sun, Z.Y.; Tian, Y.Y.; Yang, H.; Zhang, B.; Liu, B.; Yang, T.; Huang, Q.; Li, H.L.; Tang, M.; et al. Differential evolution model of wide/narrow channel tight sandstone reservoir: A case study of tight sandstone in the Sha 1 Member of the Zitong area, Sichuan Basin. Nat. Gas Geosci. 2025, 36, 1446–1458. [Google Scholar]
  29. Li, Q.; Chen, R.Q.; Shang, F.; Li, L.; Bai, X. Pore structure and fractal characteristics of shale reservoirs in Jurassic Lianggaoshan Formation, northeastern Sichuan Basin. Pet. Geol. Exp. 2025, 47, 323–335. [Google Scholar]
  30. Ning, B.; Ren, D.Z.; Wang, H.; Zhang, H.P.; Guo, J.L.; Fu, N.H.; Li, J.J.; Li, T.; Li, Q.H. Multi-scale combination characterization of micropore structure of tight sandstone gas reservoirs. Fault-Block Oil Gas Field 2024, 31, 34–41. [Google Scholar]
  31. Li, X.M.; Wang, Y.R.; Lin, W.; Ma, L.; Liu, D.; Liu, J.; Zhang, Y. Micro-pore structure and fractal characteristics of deep shale from Wufeng Formation to Longmaxi Formation in Jingmen exploration area, Hubei Province. Nat. Gas Geosci. 2022, 33, 629–641. [Google Scholar] [CrossRef]
  32. Gao, Y.L.; Li, G.Y.; Liu, X.P.; Ma, Q.; Meng, L.J.; Wang, J.W.; Wei, Y.Q.; Zhuang, D.Z. Fractal Characteristics of Shale Pore Throats at Various Scales and Their Dominant Controlling Factors in the First Member of the Shahejie Formation in the Linque Sub-sag of the Nanpu Depression. Spec. Oil Gas Reserv. 2024, 31, 39–48. [Google Scholar]
  33. Zhao, H.; Luo, T.Y.; He, P.; Sun, J.F.; Li, T. Fractal characteristics and influencing factors of tight reservoirs in Shanxi Formation in southern Ordos Basin. Unconv. Oil Gas 2024, 11, 37–45. [Google Scholar]
  34. Zhu, W.B.; Zhang, X.H.; Zhou, D.R.; Fang, C.G.; Li, J.Q.; Huang, Z.Q. New cognition on pore structure characteristics of Permian marine shale in the Lower Yangtze Region and its implications for shale gas exploration. Nat. Gas Ind. 2021, 41, 41–55. [Google Scholar] [CrossRef]
  35. Cui, C.Z.; Sui, Y.F.; Wang, Y.D.; Wu, Z.W.; Li, J. Relative permeability model of polymer particle dispersed phase for oil displacement based on fractal theory. Reserv. Eval. Dev. 2025, 15, 88–95. [Google Scholar]
  36. Zeng, L.B.; Jin, Z.J.; Li, J.C.; Tang, L.J.; You, F.B.; Lei, B.Z. Fractal Characteristics of Fractural Structures and Its Relation to Oil-Gas Distribution in North Qaidam Basin. Chin. J. Geol. 2001, 36, 241–247. [Google Scholar]
  37. He, C.C.; Zhao, Y.Q.; Yu, L.J.; Lu, L.F.; Liu, X.W.; Pang, A.Y.; Li, C.X. Pore structure and fractal characteristics of deep shale gas reservoirs in the Permian Dalong Formation, northeastern Sichuan Basin. Pet. Geol. Exp. 2024, 46, 263–277. [Google Scholar]
  38. Yang, D.; Zhao, W.W.; Wu, J.; Li, H.; Xiao, Y. Pore structure and fractal characteristics of lacustrine shale in Chang 7 Member of Yanchang Formation, Yan’an area. Lujing Gongcheng 2025, 36, 137–145. [Google Scholar]
  39. Cao, M.Y.; Tan, C.; Shu, Z.M.; Wang, X.; Long, L.H. Mechanisms of supercritical CO2-water-rock interactions on shale micropores across sedimentary facies. Nat. Gas Geosci. 2025, 36, 1316–1329. [Google Scholar]
  40. Wu, X.B.; Du, Z.W.; Qiang, X.L.; Lei, T.; Jiang, T.T.; Wang, W.; Zhu, Y.S. Binary pore structure and fractal characteristics of tight sandstone:A case study of Chang 7 Member of Triassic Yanchang Formation in Ordos Basin. Pet. Geol. Recov. Eff. 2024, 31, 45–56. [Google Scholar]
Figure 3. Core photomicrographs (crossed polars). (a) Pebbly, medium- to coarse-grained feldspathic litharenite with ~20% gravel clasts; calcite matrix (2–17%) and sericitized feldspar are abundant. (b) Poorly sorted sandstone (0.03–1.5 mm) with carbonate and argillaceous cement. Scale bar = 1 mm.
Eng 06 00311 g003
Figure 4. Impregnated thin-section photomicrographs (blue-dye epoxy shows pore space). (a) Pebbly, poorly sorted feldspathic litharenite; gravel clasts ≈ 20%, intergranular pores partially filled by calcite and clay. (b) Muddy, calcareous siltstone; grain size < 0.06 mm, matrix-supported cementation, porosity < 5%. (c) Calcareous, poorly sorted feldspathic litharenite; carbonate cement (2–17%) blocks throats, visible micropores < 10 µm. (d) Pebbly, medium- to coarse-grained feldspathic litharenite; sub-angular to sub-rounded grains, pore connectivity fair, scale bar = 1 mm.
Eng 06 00311 g004
Figure 5. Porosity–Permeability Cross-plot.
Eng 06 00311 g005
Figure 6. SEM images showing the impact of clay minerals on pore structure. (a) Intergranular pores partially filled with calcite and illite/smectite mixed-layer clays, indicating moderate pore development. (b) Micropore-dominated sandstone with pore-filling calcite and clay minerals, resulting in poor connectivity. (c) Gypsum and illitic clay within poorly developed pores, leading to a dense and nearly ineffective pore structure. (d) Intergranular fractures associated with fibrous minerals, possibly formed under tectonic stress or diagenetic processes.
Eng 06 00311 g006
Figure 7. Pore-Throat Radius Distribution Diagram.
Eng 06 00311 g007
Figure 8. Class Ⅰ Pore Mercury Injection Curve (a) and T2 Distribution Curve (b).
Eng 06 00311 g008
Figure 9. Class Ⅱ Pore Mercury Injection Curve (a) and T2 Distribution Curve (b).
Eng 06 00311 g009
Figure 10. Class Ⅲ Pore Mercury Injection Curve (a) and T2 Distribution Curve (b).
Eng 06 00311 g010
Table 2. Pore Fractal Dimension Statistics Table of Reservoir Full Aperture.
Reservoir ClassPore Size IntervalFractal-Dimension RangeMean Fractal DimensionFractal Coefficient aAssociated Petrophysical Character
Class IMacropores
(>50 µm)
2.48–2.702.550.85High porosity and permeability,
good connectivity
Class IIMesopores
(10–50 µm)
2.45–2.652.500.62Moderate porosity and permeability,
fair connectivity
Class IIIMicropores
(<10 µm)
2.05–2.252.150.41Low porosity and permeability,
poor connectivity
 Whole spectrum2.05–2.702.52 Strongly heterogeneous,
complex pore structure
Disclaimer/Publisher’s Note: The statements, opinions and data contained in all publications are solely those of the individual author(s) and contributor(s) and not of MDPI and/or the editor(s). MDPI and/or the editor(s) disclaim responsibility for any injury to people or property resulting from any ideas, methods, instructions or products referred to in the content.