Article

Fatigue Endurance of Continuous Fiber-Reinforced Polymer Matrix Composites Manufactured by 3D Printing

by
Jorge Guillermo Díaz-Rodríguez
1,*,
Alberto David Pertuz-Comas
2 and
Oscar Rodolfo Bohorquez-Becerra
3
1
Tecnologico de Monterrey, School of Engineering and Sciences, Av. General Ramon Corona 2514, Guadalajara 45138, Jalisco, Mexico
2
GIEMA, Escuela de Ingeniería Mecánica, Universidad Industrial de Santander, Carrera 27 Calle 9, Bucaramanga 680002, Colombia
3
DIMA, Escuela de Ingeniería Mecánica, Universidad Industrial de Santander, Carrera 27 Calle 9, Bucaramanga 680002, Colombia
*
Author to whom correspondence should be addressed.
Eng 2025, 6(10), 277; https://doi.org/10.3390/eng6100277
Submission received: 10 August 2025 / Revised: 25 September 2025 / Accepted: 10 October 2025 / Published: 16 October 2025

Abstract

The article presents the results of uniaxial fatigue tests for the high-cycle regime on a polymer matrix composite material reinforced with Kevlar and carbon fibers, fabricated with material extrusion (MEX) technology. The samples were manufactured according to the ASTM D638 type-I standard, and the tests were performed under a load inversion factor of 0.1 at room temperature, measuring the number of cycles to failure. Based on previous results, in which different configurations were tested, tests were carried out on specimens subjected to loads ranging from 40% to 91% of the rupture stress for Kevlar and 25.5% to 80.7% for carbon, obtaining a maximum life of 2.5 M cycles for Kevlar and 4.06 M cycles for carbon. The observed failure modes included fiber tearing, matrix cracking, and fiber–matrix pull-out.

1. Introduction

The widespread use of 3D-printed composite materials in real-loading scenarios requires an understanding of their fatigue behavior [1,2]. Under cyclic loads, they undergo progressive degradation in stiffness and strength [3,4], which can lead to failure at load levels below their static strength [5]. This failure is due to crack initiation and propagation, and loss of adhesion and fiber breakage, which reduce component lifespan [2]. Besides providing design freedom, flexibility, and a wide range of fabrication materials [6], 3D printing introduces anisotropy in the material (often producing a staircase surface [6]) in addition to that inherent in composites [7], making it necessary to evaluate its fatigue behavior and fatigue endurance to guarantee the safety, durability, and optimization of component design in engineering applications [8]. A literature search did not reveal results on fatigue endurance of these composites; therefore, this manuscript presents how such results were obtained.
Additive manufacturing (AM) has revolutionized manufacturing by allowing the fabrication of geometrically complex parts without the need for post-processing. This technique is characterized by excellent compatibility with different materials and allows the construction of highly complex structures [9]; however, some techniques require supporting structures during printing [10], which must later be removed in post-processing. AM can be a bridge between topological optimization and final product manufacturing, delivering optimized geometries without additional post-processing. Moreover, printing costs remain practically constant even for those of parts [11]. Furthermore, manufacturing processes in industries such as aeronautics or medicine can be complex and expensive when performed using conventional technologies. Therefore, alternative manufacturing methods that combine reduced post-processing requirements with adaptability have been developed [12]. The fused deposition modeling method (FDM) is currently the most used AM technique [13]. The use of continuous fiber-reinforced composites printed by AM can give a static performance similar to that of some aluminum alloys [1]. However, many components experience both static and fluctuating loads during service.
Moreover, fatigue is a common failure mechanism responsible for up to 90% of industrial failures [14], and it is more critical in composites than in isotropic materials [4,15]. Therefore, it is necessary to properly characterize these materials. There are three methods for characterizing the behavior of a material under time-varying loads. Stress versus life (σ–N) is applied for loads below the elastic limit, leading to an accumulation of dislocations in crystalline solids. Strain versus life (Ɛ–N) is applied for loads above the elastic limit but below the maximum stress, resulting in crack nucleation. Finally, the da/dN versus ΔK method is applied when measurable cracks are present, using Paris’ law to describe crack growth [14]. Therefore, it is imperative to establish mechanical properties for designing components capable of withstanding fluctuating load conditions. Extensive details regarding composites: modeling fatigue and failure modes were recently reviewed by Alamry et al. [15].
In addition, composite materials have immense applications in areas such as prototypes, fixtures, control arms, joysticks, brackets, clamps, and mounts [16,17]. In the automotive and aerospace industries, they reduce weight [15]. However, their detailed and intricate features are often unsuitable for traditional manufacturing methods, yet their ability to withstand repetitive loads can offset this limitation. This is where the fusion of composites and 3D printing has come into play. However, no one type of printing is right for every requirement [10,16], highlighting the importance of understanding the fatigue limits of composites in the context of 3D printing [1].
Fatigue studies for AM polymer matrix composites are limited [18]. Pertuz et al. [19] tested several configurations of volume fiber content, infill type, and fiber orientation, but only for short lives. Harber [20] tested UV photopolymer matrix composites for up to 200 k cycles. Vidrih [21] tested Nylon matrix composites reinforced with short and woven carbon fibers. Pertuz [22] tested Kevlar-reinforced composites under alternating bending. Rabbi et al. [18] tested ABS reinforced with carbon fiber. A recent review of the fatigue performance of continuous carbon fiber reinforcement composites is readily available [4], but all studies revisited, not one reported a fatigue endurance limit.
Although recent studies have been conducted, to the best of our knowledge, there have been no reports on the fatigue endurance of AM Nylon matrix composites reinforced with continuous fibers. This work presents a fatigue characterization and stress-life (σ–N) analysis of two polymer matrix composite materials reinforced with continuous Kevlar and carbon fibers, fabricated using novel material extrusion (MEX) technology.

2. Background

This section contains the necessary foundations to provide readers with the background knowledge applied in this article.

2.1. Additive Manufacturing

AM is a relatively new manufacturing technology that started with stereolithography and later evolved into focused deposition modeling (FDM), nowadays defined as Material Extrusion (MEX) by ASTM/ISO 52900 [23]. After the expiration of the Stratasys patent in 2010, the MEX technique was significantly developed. In 2015, Markforged generated a patent [24] for the manufacturing of composite materials reinforced with continuous fibers and printed by MEX.
MEX is a technique in which a topology is reconstructed layer by layer [25] from a CAD file previously converted into STL format. This process is executed using the cloud software Eiger®. The polymer filament, nylon in this case, is fed into an extruder, heated above its melting point (260 °C, approx.), and deposited on a platform that remains stationary during printing despite its mobility, where it cools to form the desired part. The movement of the extruder is controlled by software that optimizes the movements and alternates matrix deposition and continuous reinforcement [8]. A schematic of the printing process is shown in Figure 1.
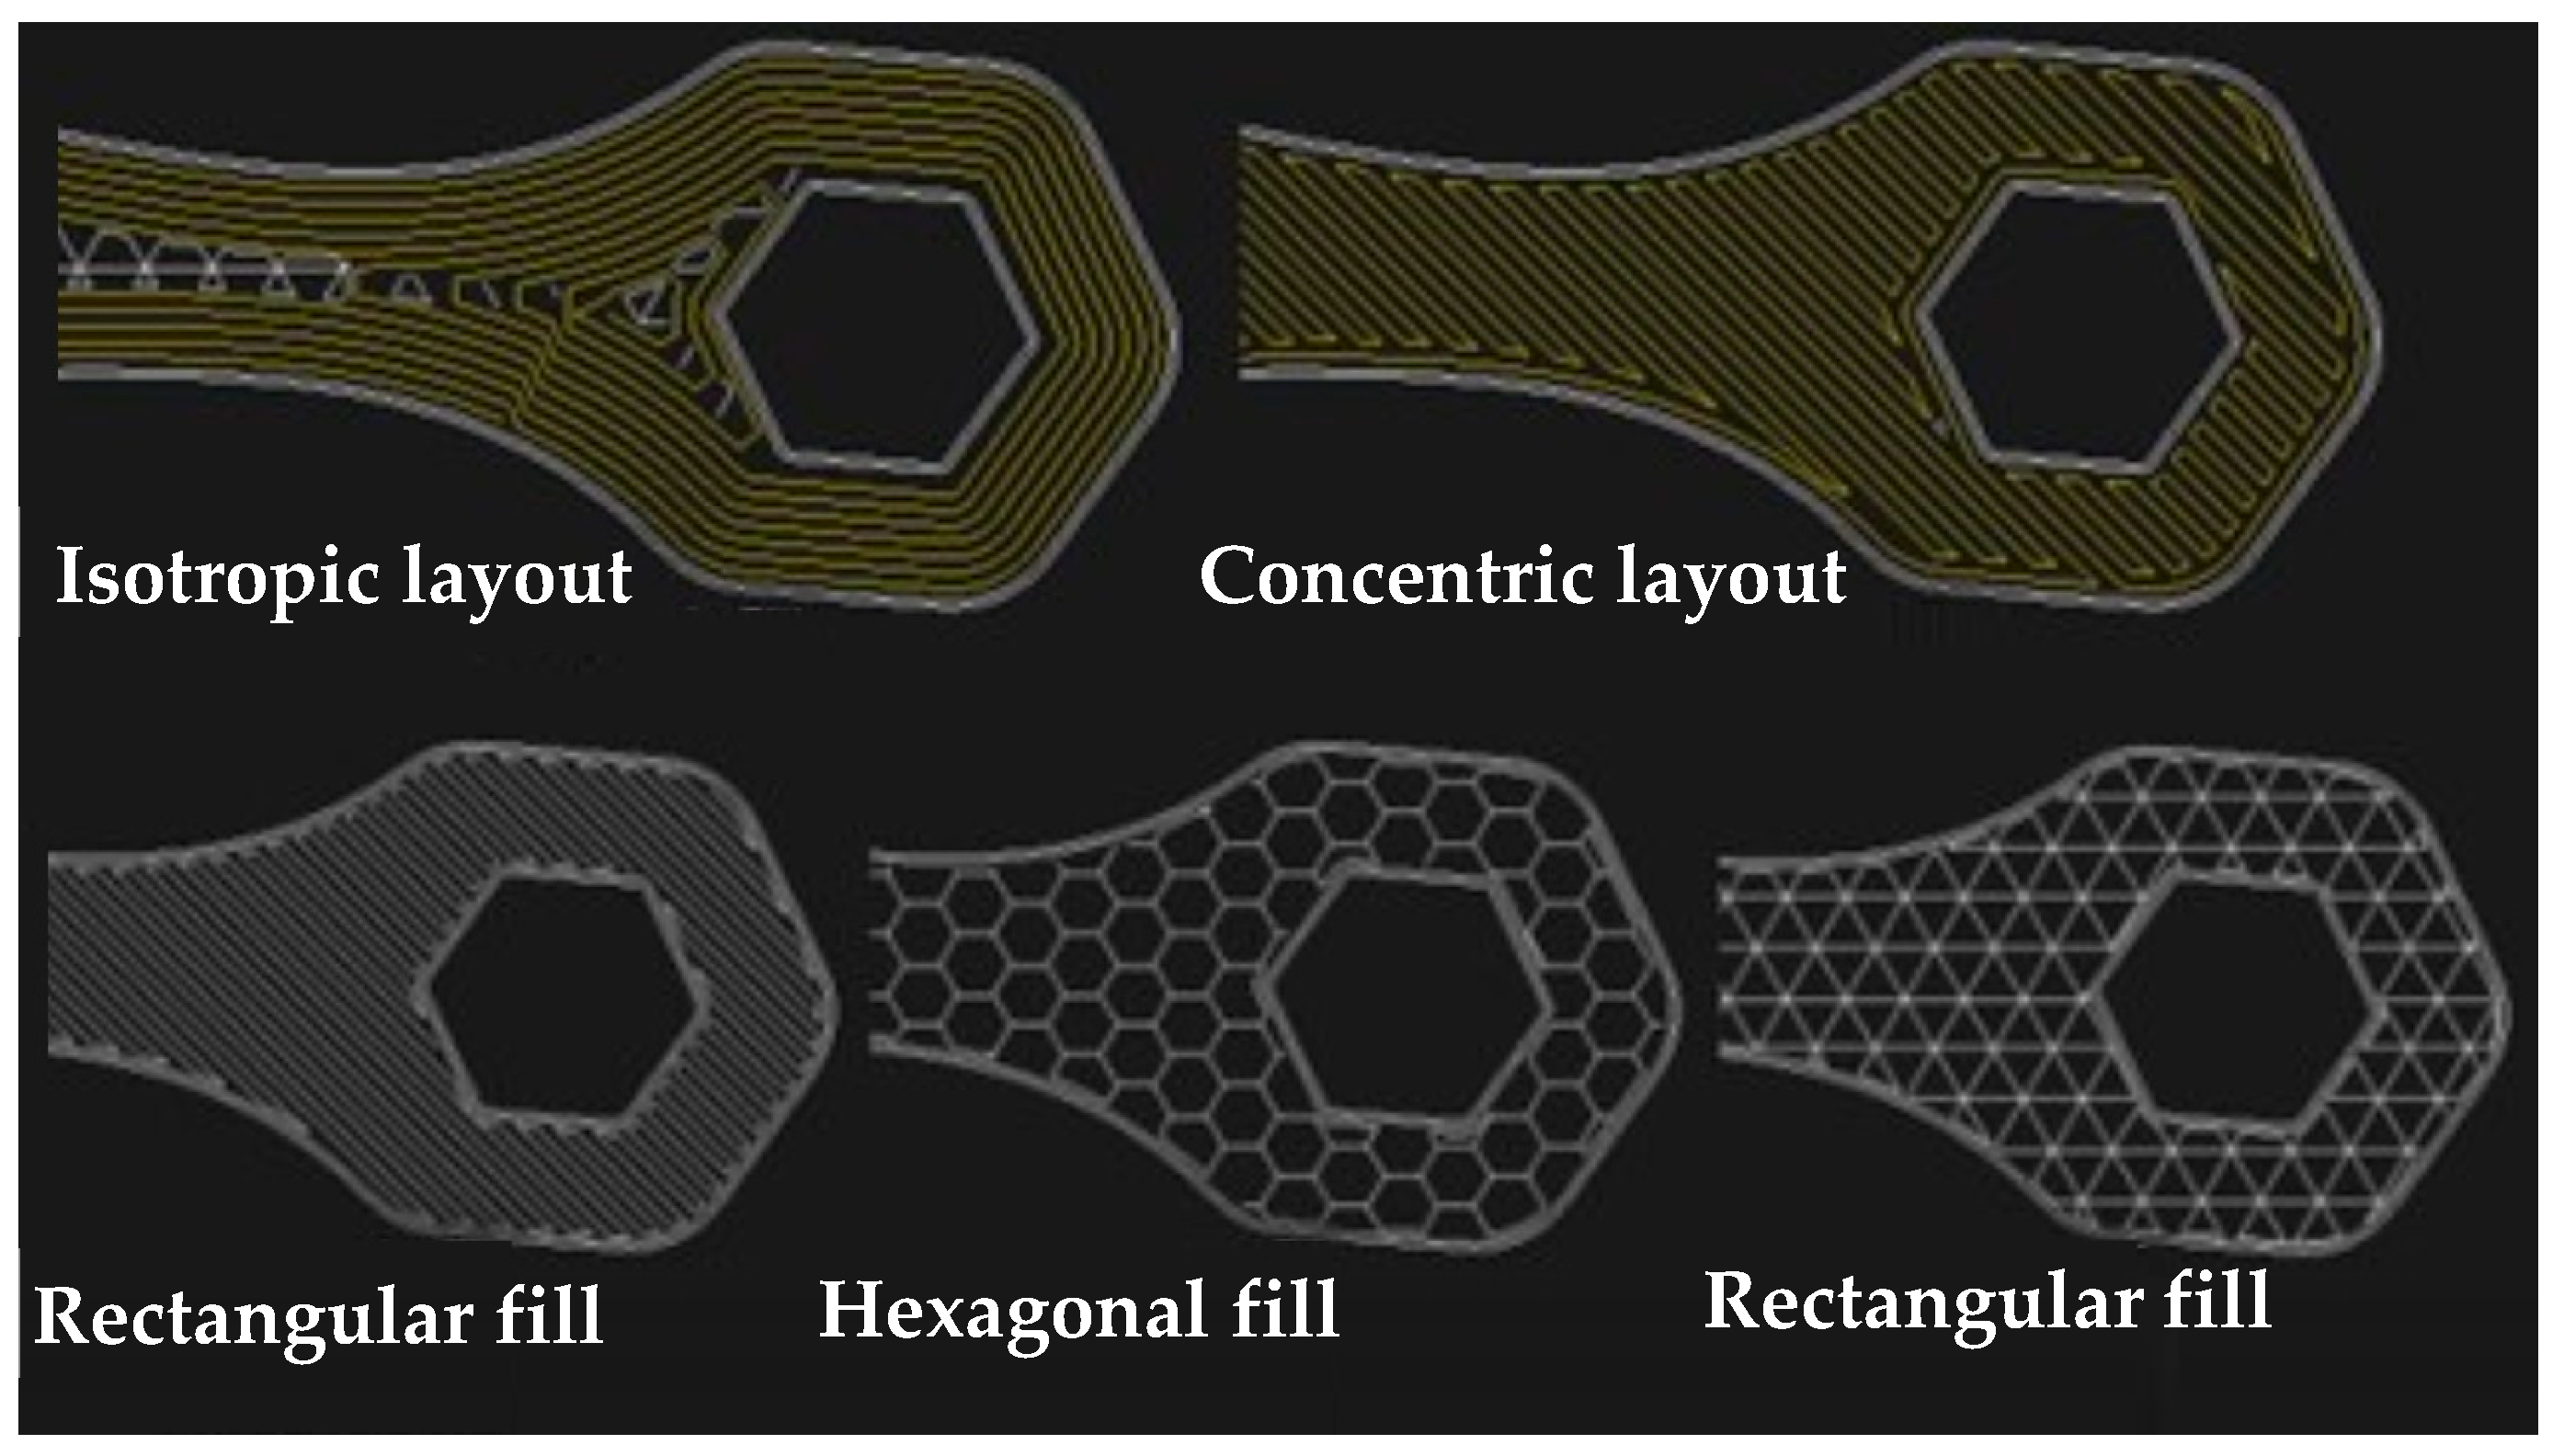
When printing a part, several process parameters must be selected in the Eiger® software to choose from on the Markforged Two® printer (Markforged, Watertown, MA, USA) [26], such as fiber type (carbon, Kevlar, glass fiber, and high-temperature glass fiber), fiber volume fraction, fiber layout type (concentric and isotropic, as shown in Figure 2), matrix filling pattern (rectangular, hexagonal, triangular, as shown in Figure 2, and solid filling), matrix filling density, matrix deposition angle, and fiber deposition angle [27]. Recently, Kargar et al. [27] found that while reducing the raster width and raster angle produced greater strength, increasing the nozzle diameter and infill density produced similar effects.
As with traditionally produced composite designs, the properties of AM-produced parts depend on the fiber volume fraction, fiber arrangement and angle, and the mechanical properties of the reinforcement and matrix materials [28]. Additionally, FDM creates an intrinsic anisotropy in AM processes that goes beyond that exhibited by fiber-reinforced composites [27,29]. Therefore, it is common to represent their mechanical behavior with a model such as the rule of mixtures or a more complex model such as Melenka’s volume-average stiffness [26].

2.2. Fatigue

It is commonly accepted that mechanical failure begins with crack nucleation [14]. In composites, cracks generally propagate perpendicular to the loading direction [30]. In other words, cracks advance along the tensile direction, producing separation, rather than along compressed or laterally displaced regions. Cracks in the matrix are usually the first form of damage in composites and act as precursors to further macroscopic damage [31].
When a structural component is subjected to repetitive loading well below the elastic limit, the recommended design method is the stress-life (σ–N) approach, also referred to as high-cycle fatigue. Basquin’s rule describes this phenomenon [14], as shown in Equation (1).
σ = A N f b
where σ is the fatigue stress, Nf is the number of failure cycles, and A and b are constants that are adjusted depending on the material. Although the Basquin rule is an empirical relation, constant A indicates the fatigue stress at failure, whereas b represents the rate at which stress decreases as the number of cycles increases. A straight line is obtained by plotting Equation (1) on a bilogarithmic plane (Nf, σ). Uniaxial fatigue tests are typically conducted with a load inversion factor R = −1, as defined in Equation (2). However, compressive loads in slender samples may induce unintended failure mechanisms, such as buckling [14].
R = σ min / σ M a x
Regarding fatigue studies on FDM-printed composite materials with a nylon matrix, two studies have been conducted under axial loading. The data [19,32] referred to here correspond to a 20% matrix fill, with a triangular pattern and fiber at 0° to the load axis, which showed the best results, whereas the data in [8] correspond to samples with six and 12 fiber layers oriented parallel to the applied stress. In [19,32], the Basquin combined with the Weibull distribution as recommended by [14] was applied, whereas in [8], the results were fitted using an ANOVA test to extract the average value. A probable reason for the difference between the two studies is likely the mean stress value used. Specifically, [19,32] performed tests at R = −1, while [8] used R = 0.1. Evidence shows [31,33,34] that fatigue can induce fiber buckling in composites, even under a positive load ratio.
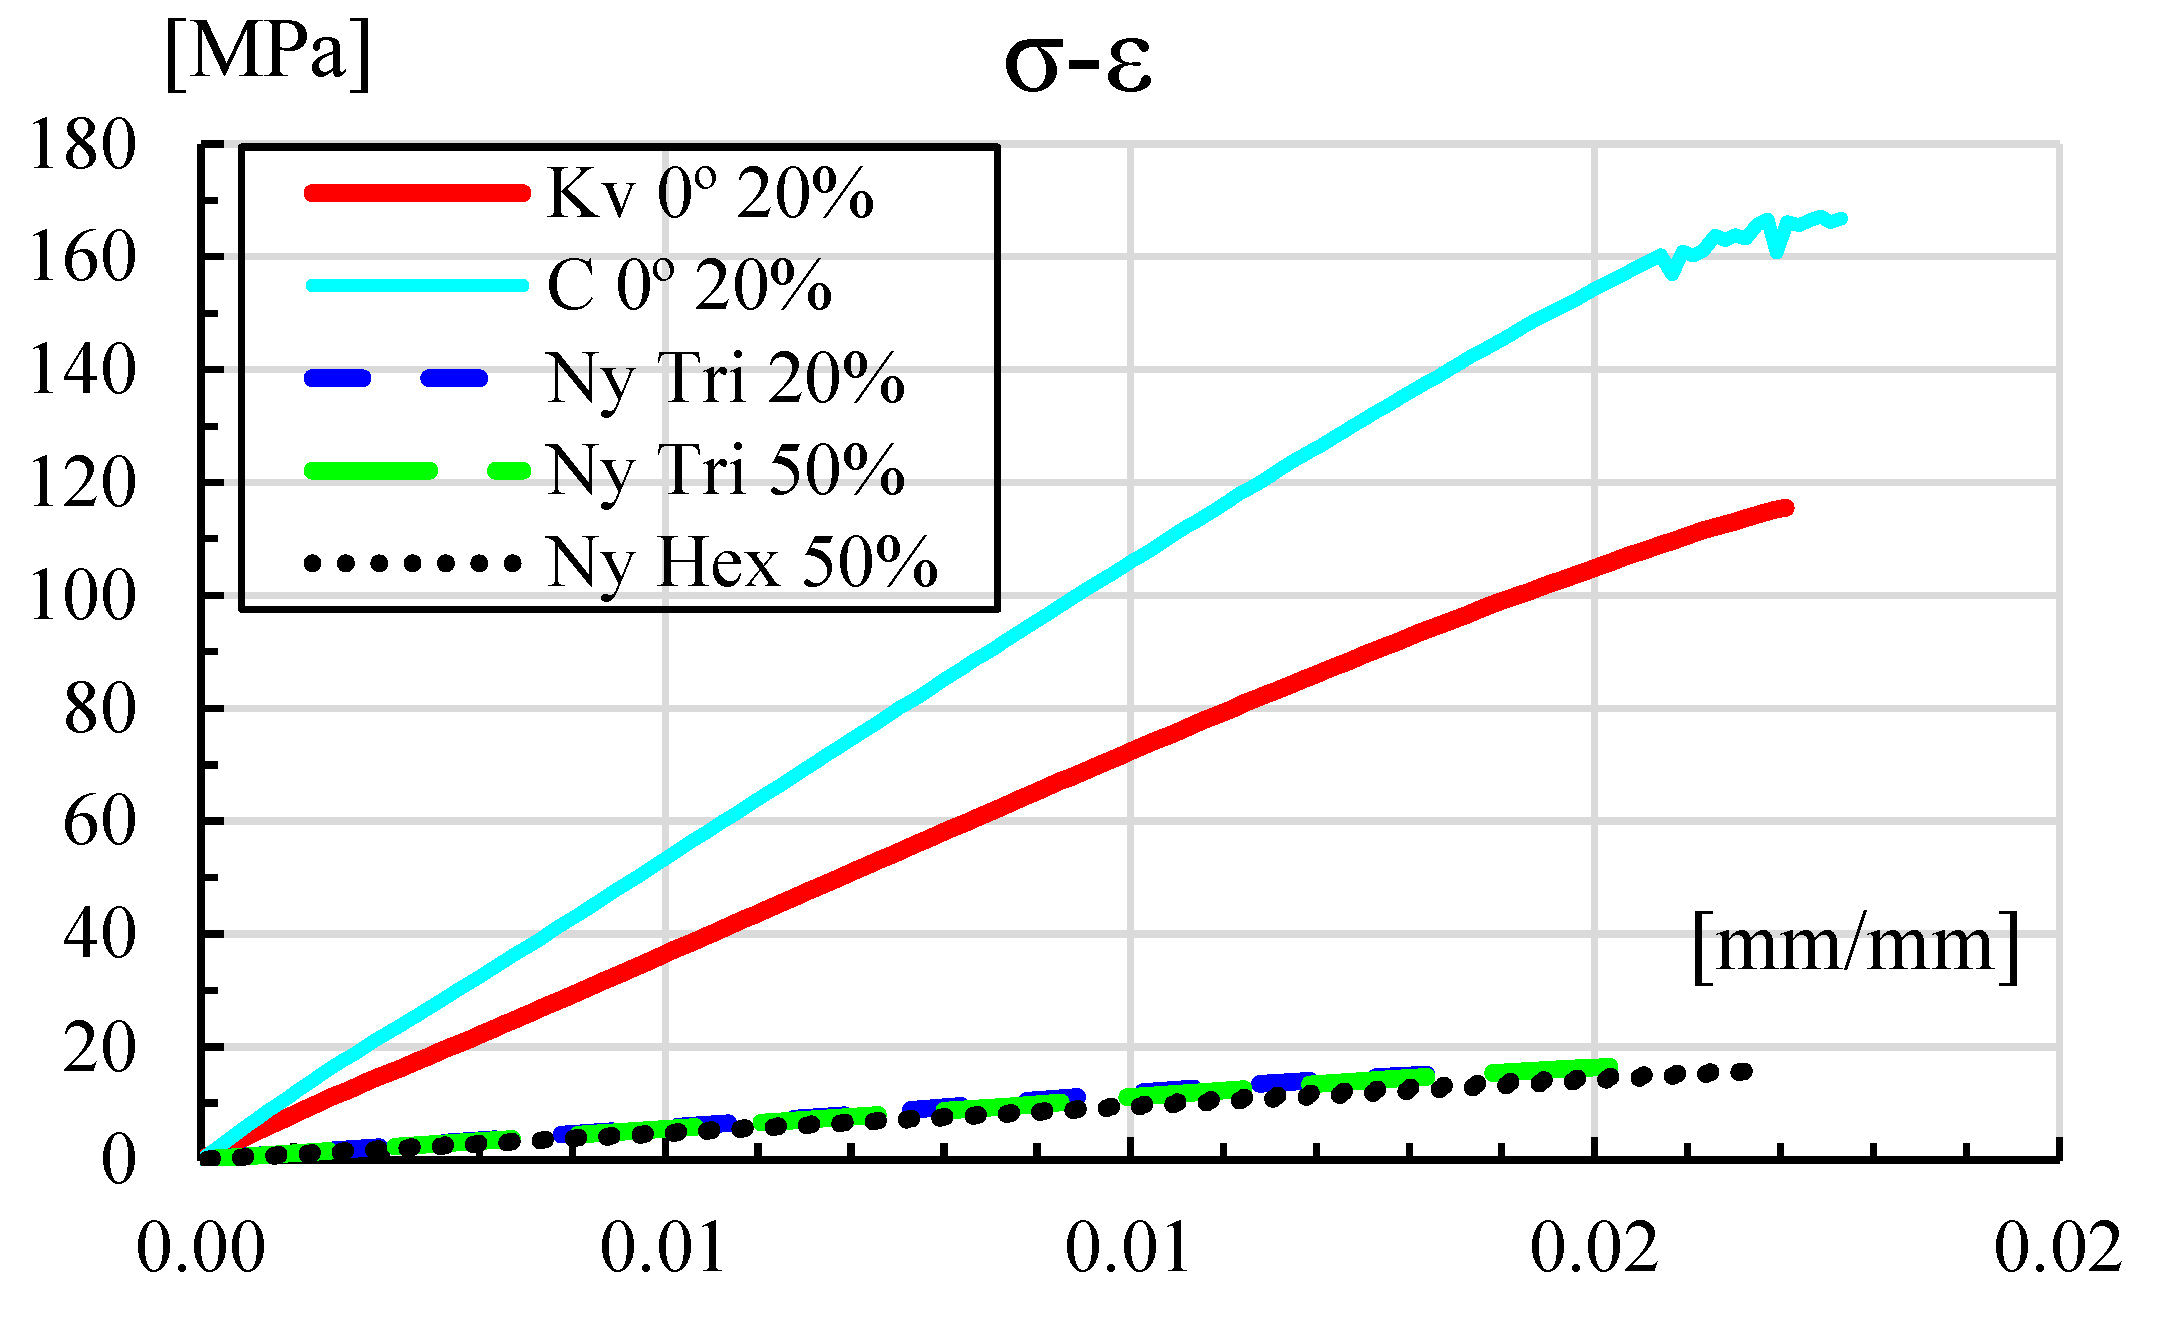
Static test data for different filling patterns, orientations, and fiber types were reported in [19,32]. Figure 3 shows the σ-ε curves for specimens following ASTM D638-14 [35] using Nylon with triangular infill at 20% and 50%, and hexagonal infill at 50%. It can be observed that increasing the infill percentage from 20% to 50% produces no appreciable gain in strength but does reduce strain to failure from 0.15 to 0.20%. On the other hand, the advantage of adding continuous fibers is clearly seen, showing an ultimate tensile strength of 166 MPa for carbon and 115 MPa for Kevlar.
On the other hand, the axial strain is estimated using the elastic relationship shown in Equation (2) [14], representing the linear region shown in Figure 3.
ε = P A s E
where P is the applied axial force, As is the cross-sectional area, and E is the modulus of elasticity calculated in the proportional region of the stress versus strain curve, as shown in Figure 3.

2.3. Data Adjustment

The least squares method (LSM) is commonly used to fit experimental data into an arbitrary model. LSM is an optimization algorithm that seeks to find a constant value that approximates a set of measured data to the selected model. In the case of a linear model such as Y(x) = kx + Yo, a set of p data pairs can be fitted using Equation (4).
k = i = 1 p ( Y i Y m ) ( X i X m ) ( X i X m ) 2  
where k is the slope, Ym and Xm are the averages of the number p of data pairs to be fitted, and Yo is the cutoff point on the vertical axis.

3. Materials and Methods

The samples were drafted in SolidWorks®2023 (Concord, MA, USA),exported to an STL file, and then loaded into the Eiger® platform, where the printing parameters corresponding to the best static performance were those previously reported [32]. Subsequently, 4 mm thick samples, following the ASTM D638-14 type I standard [35], were printed on a Markforged Two printer® (Markforged, Watertown, MA, USA). The nylon for the matrix and the Kevlar and carbon fibers used as continuous reinforcement were provided by Markforged. The mechanical properties of the individual materials used in this study [36] are shown in Table 1. Furthermore, the fiber volume content was 16% for carbon and 20% for Kevlar.
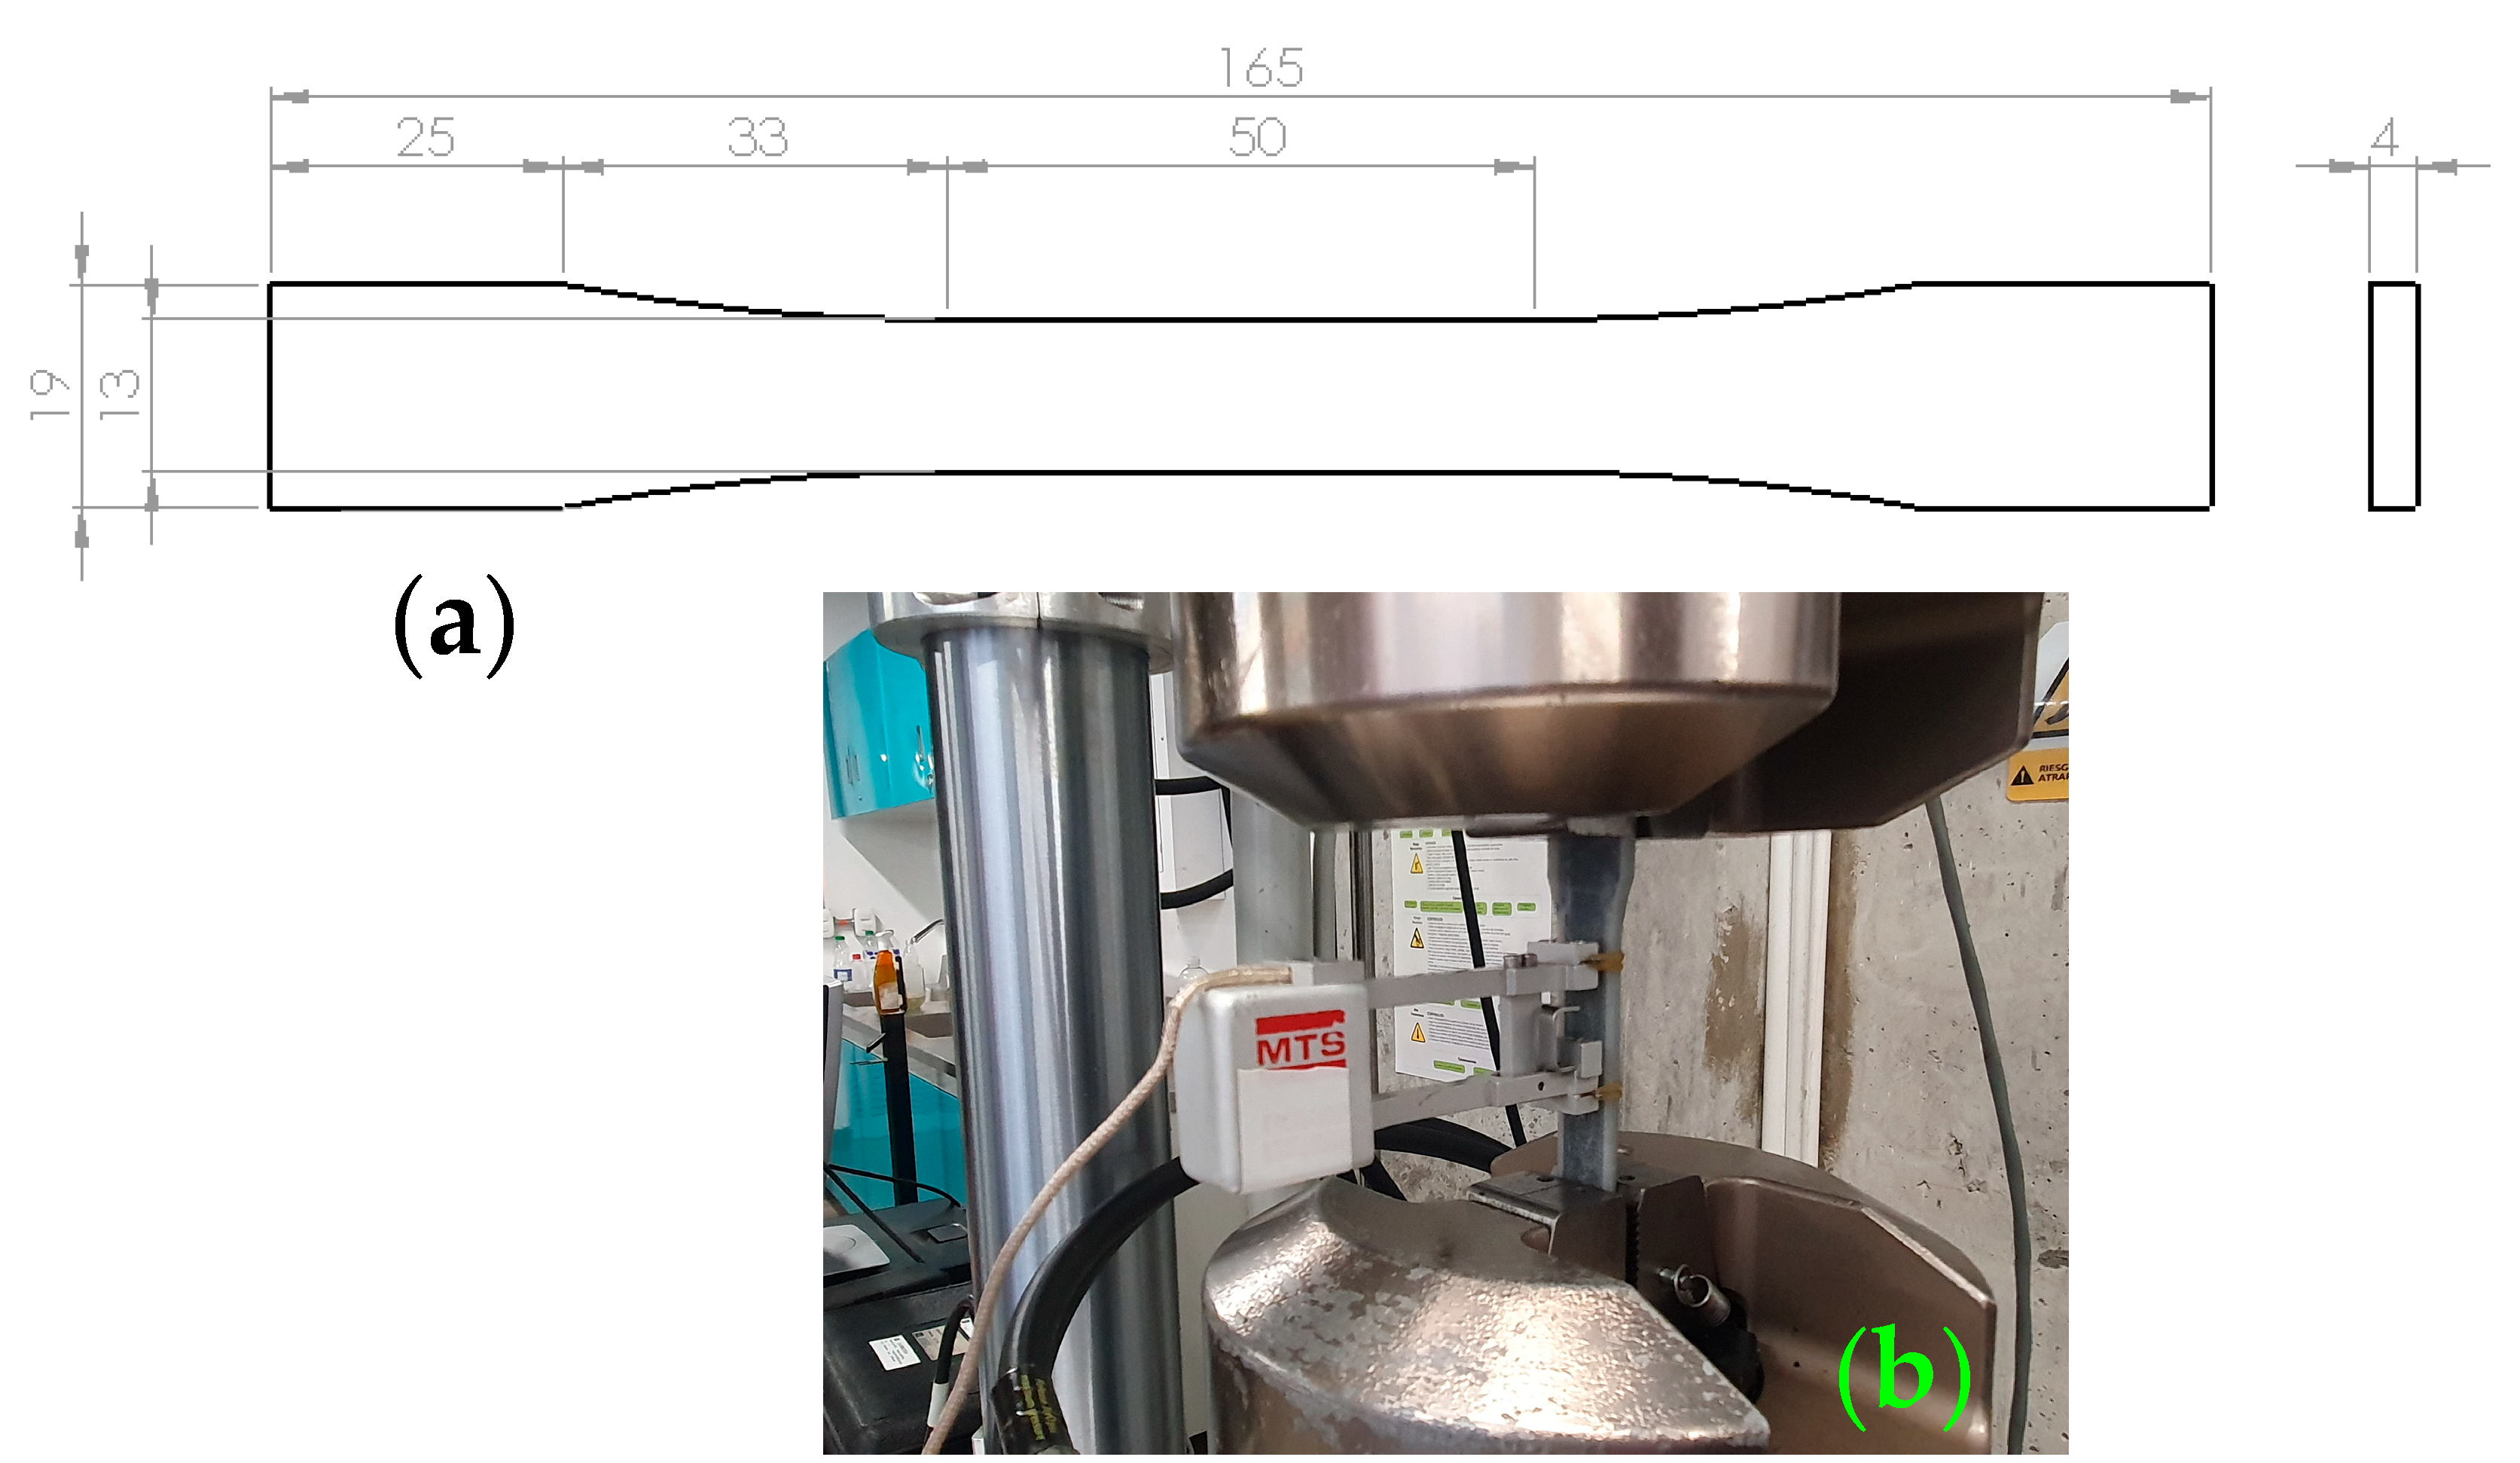
Figure 4a shows the shape and dimensions of the specimens with a thickness of 4 mm, whereas Figure 4b shows a carbon fiber-reinforced sample being tested. The tests were performed at 5 Hz, and data were acquired at 40 Hz. According to [38], test frequencies up to 8 Hz do not affect the results because excessive self-heating is not induced by the stretching and contraction of polymer chains. A total of 8 carbon-reinforced samples and 13 Kevlar-reinforced composites were successfully tested.
To estimate the strain value required to obtain the stress values for each test, Equation (3) was used with the E and σMax values reported in [19,33]. It is important to highlight that although the material used was a composite, the properties shown in Figure 3 are bulk material properties. In the case of classic composite materials [39], if the percentages of matrix or fiber vary, the rule of mixtures or a more advanced method is used to predict mechanical properties [26] based on the independent properties illustrated in Figure 3. In the case of composite materials printed by MEX, it is even more complex because there are more variables to configure a part, as shown in Figure 2. However, the sample configurations used in this study were the same as those reported in [19,32]. Therefore, it is valid to use Equation (3) to relate elasticity, force, and displacement.
Figure 5 shows an example of the PID controller command and feedback signals. The results show that the amplitude and frequency responses of the machine adjust according to the fine-tuning of the PID constants supplied, providing the appropriate mean and amplitude values for the applied fatigue load.
Finally, the failed samples were broken under liquid N2 to preserve the surface, and pictures were taken using a scanning electron microscope (SEM). To ensure conductivity, the samples were gold-plated and then placed in a Vega 3 Tescan SEM (Brno, Czech Republic) operating between 5 and 10 keV equipped with a tungsten filament.

4. Results

4.1. Mechanical Results

Figure 6 shows an example of the stress–strain loop for a Kevlar sample subjected to 64.7% of the static load. It shows the evolution of stress–strain hysteresis after 10 k, 81 k, 157 k, and 402 k cycles. The results show that the loading and unloading paths are different and that the sample needs more stress to produce the same strain by the cycle. This could be attributed to energy dissipation through matrix–fiber pull-out, matrix plastic deformation, and possibly fiber cracking. The sample ultimately endured 405 k cycles.
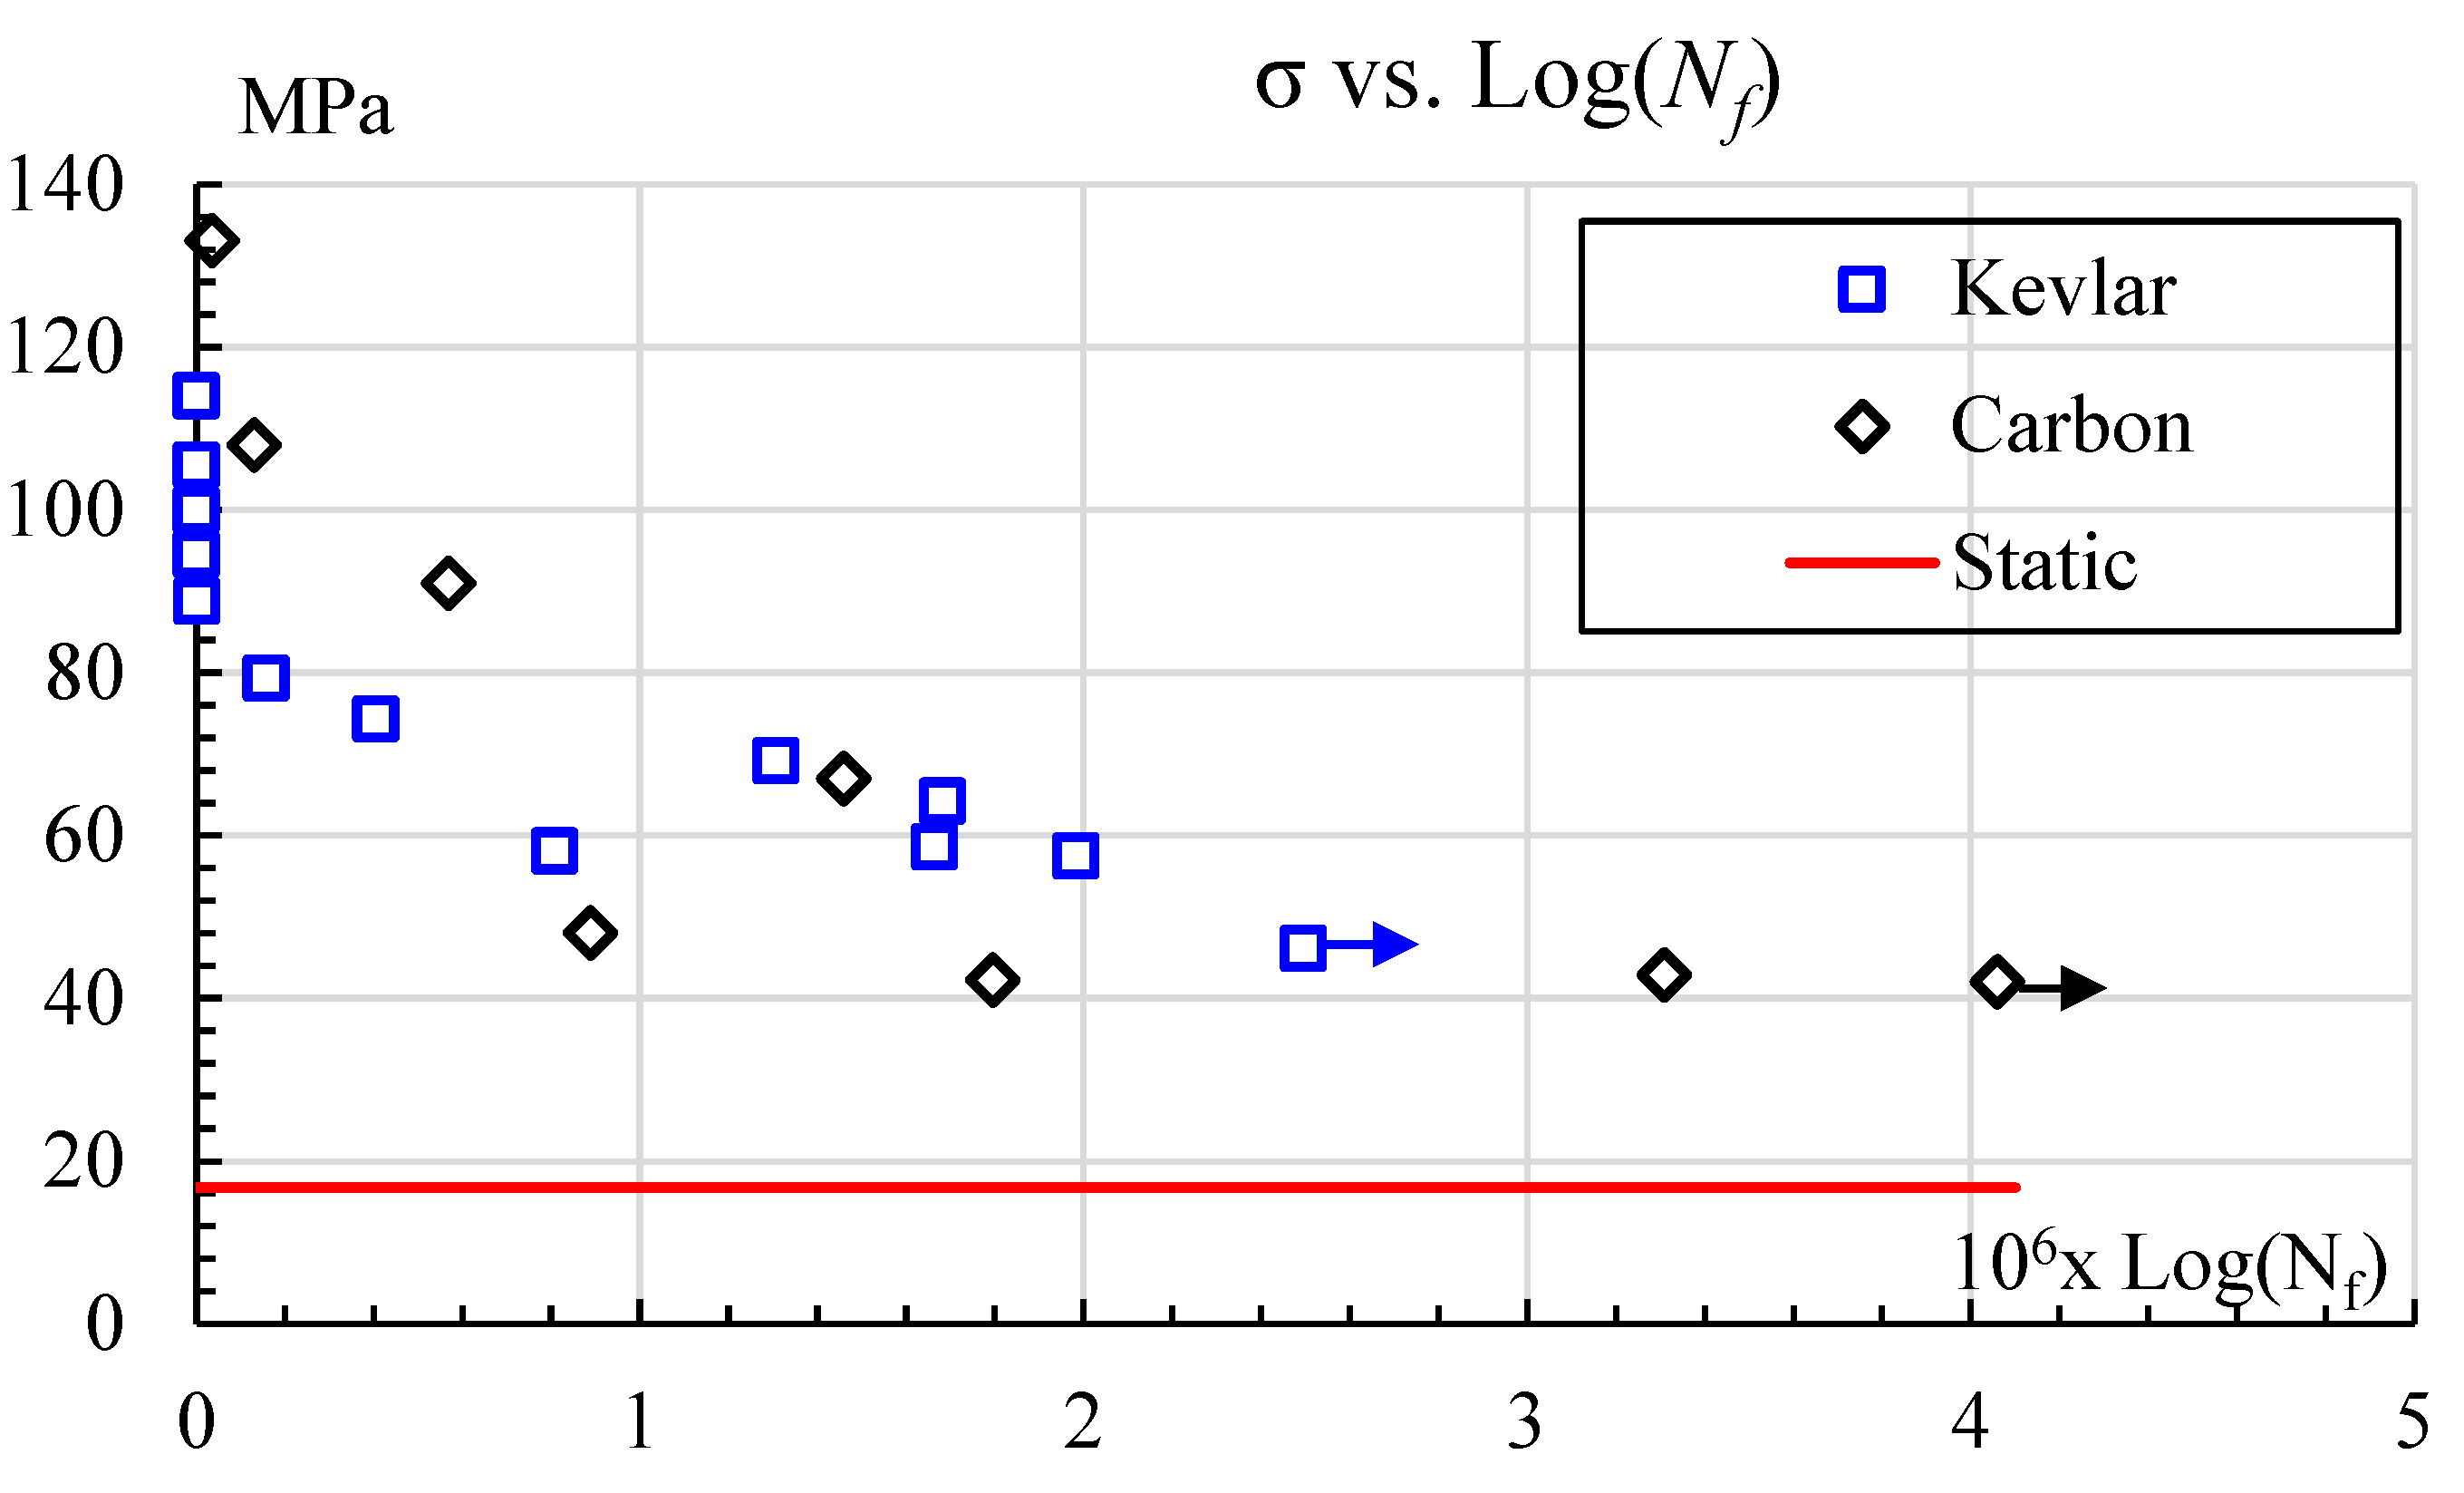
Figure 7 shows the result of the applied stress versus life displayed at failure in a semi-logarithmic graph. The data obtained in this study were unified with previously published fatigue data for the same type of specimen [19,33]. As the stress decreased, the number of failure cycles tended to stabilize, as expected. The lowest stress applied to the samples was 49.4 MPa, resulting in 2.5 M cycles for Kevlar, and 40.9 MPa lasting 4.06 M cycles for carbon. The arrows indicate when the tests were stopped. The fatigue endurance limits for the carbon- and Kevlar-reinforced samples delivered stress values above static strength (16.8 MPa for triangular infill at 50% of density), as shown in Figure 3 for the non-reinforced samples and superimposed in Figure 7. It is confirmed that the addition of continuous fibers improves strength.
By performing a linear fit to the unified data, as described in Equation (4), according to Basquin’s rule [14], the constants for Equation (1) were obtained, as shown in Table 2, together with the coefficients of determination (R2) and the fatigue endurance limits. Guo et al. [4] showed that carbon composite materials with a higher elastic modulus exhibit higher fatigue strength. In this case, the carbon composite has a higher stiffness than the Kevlar (Figure 3), and this difference is observed up to 500 k cycles. After this number of cycles, the results show an overlap.

4.2. Failure Modes

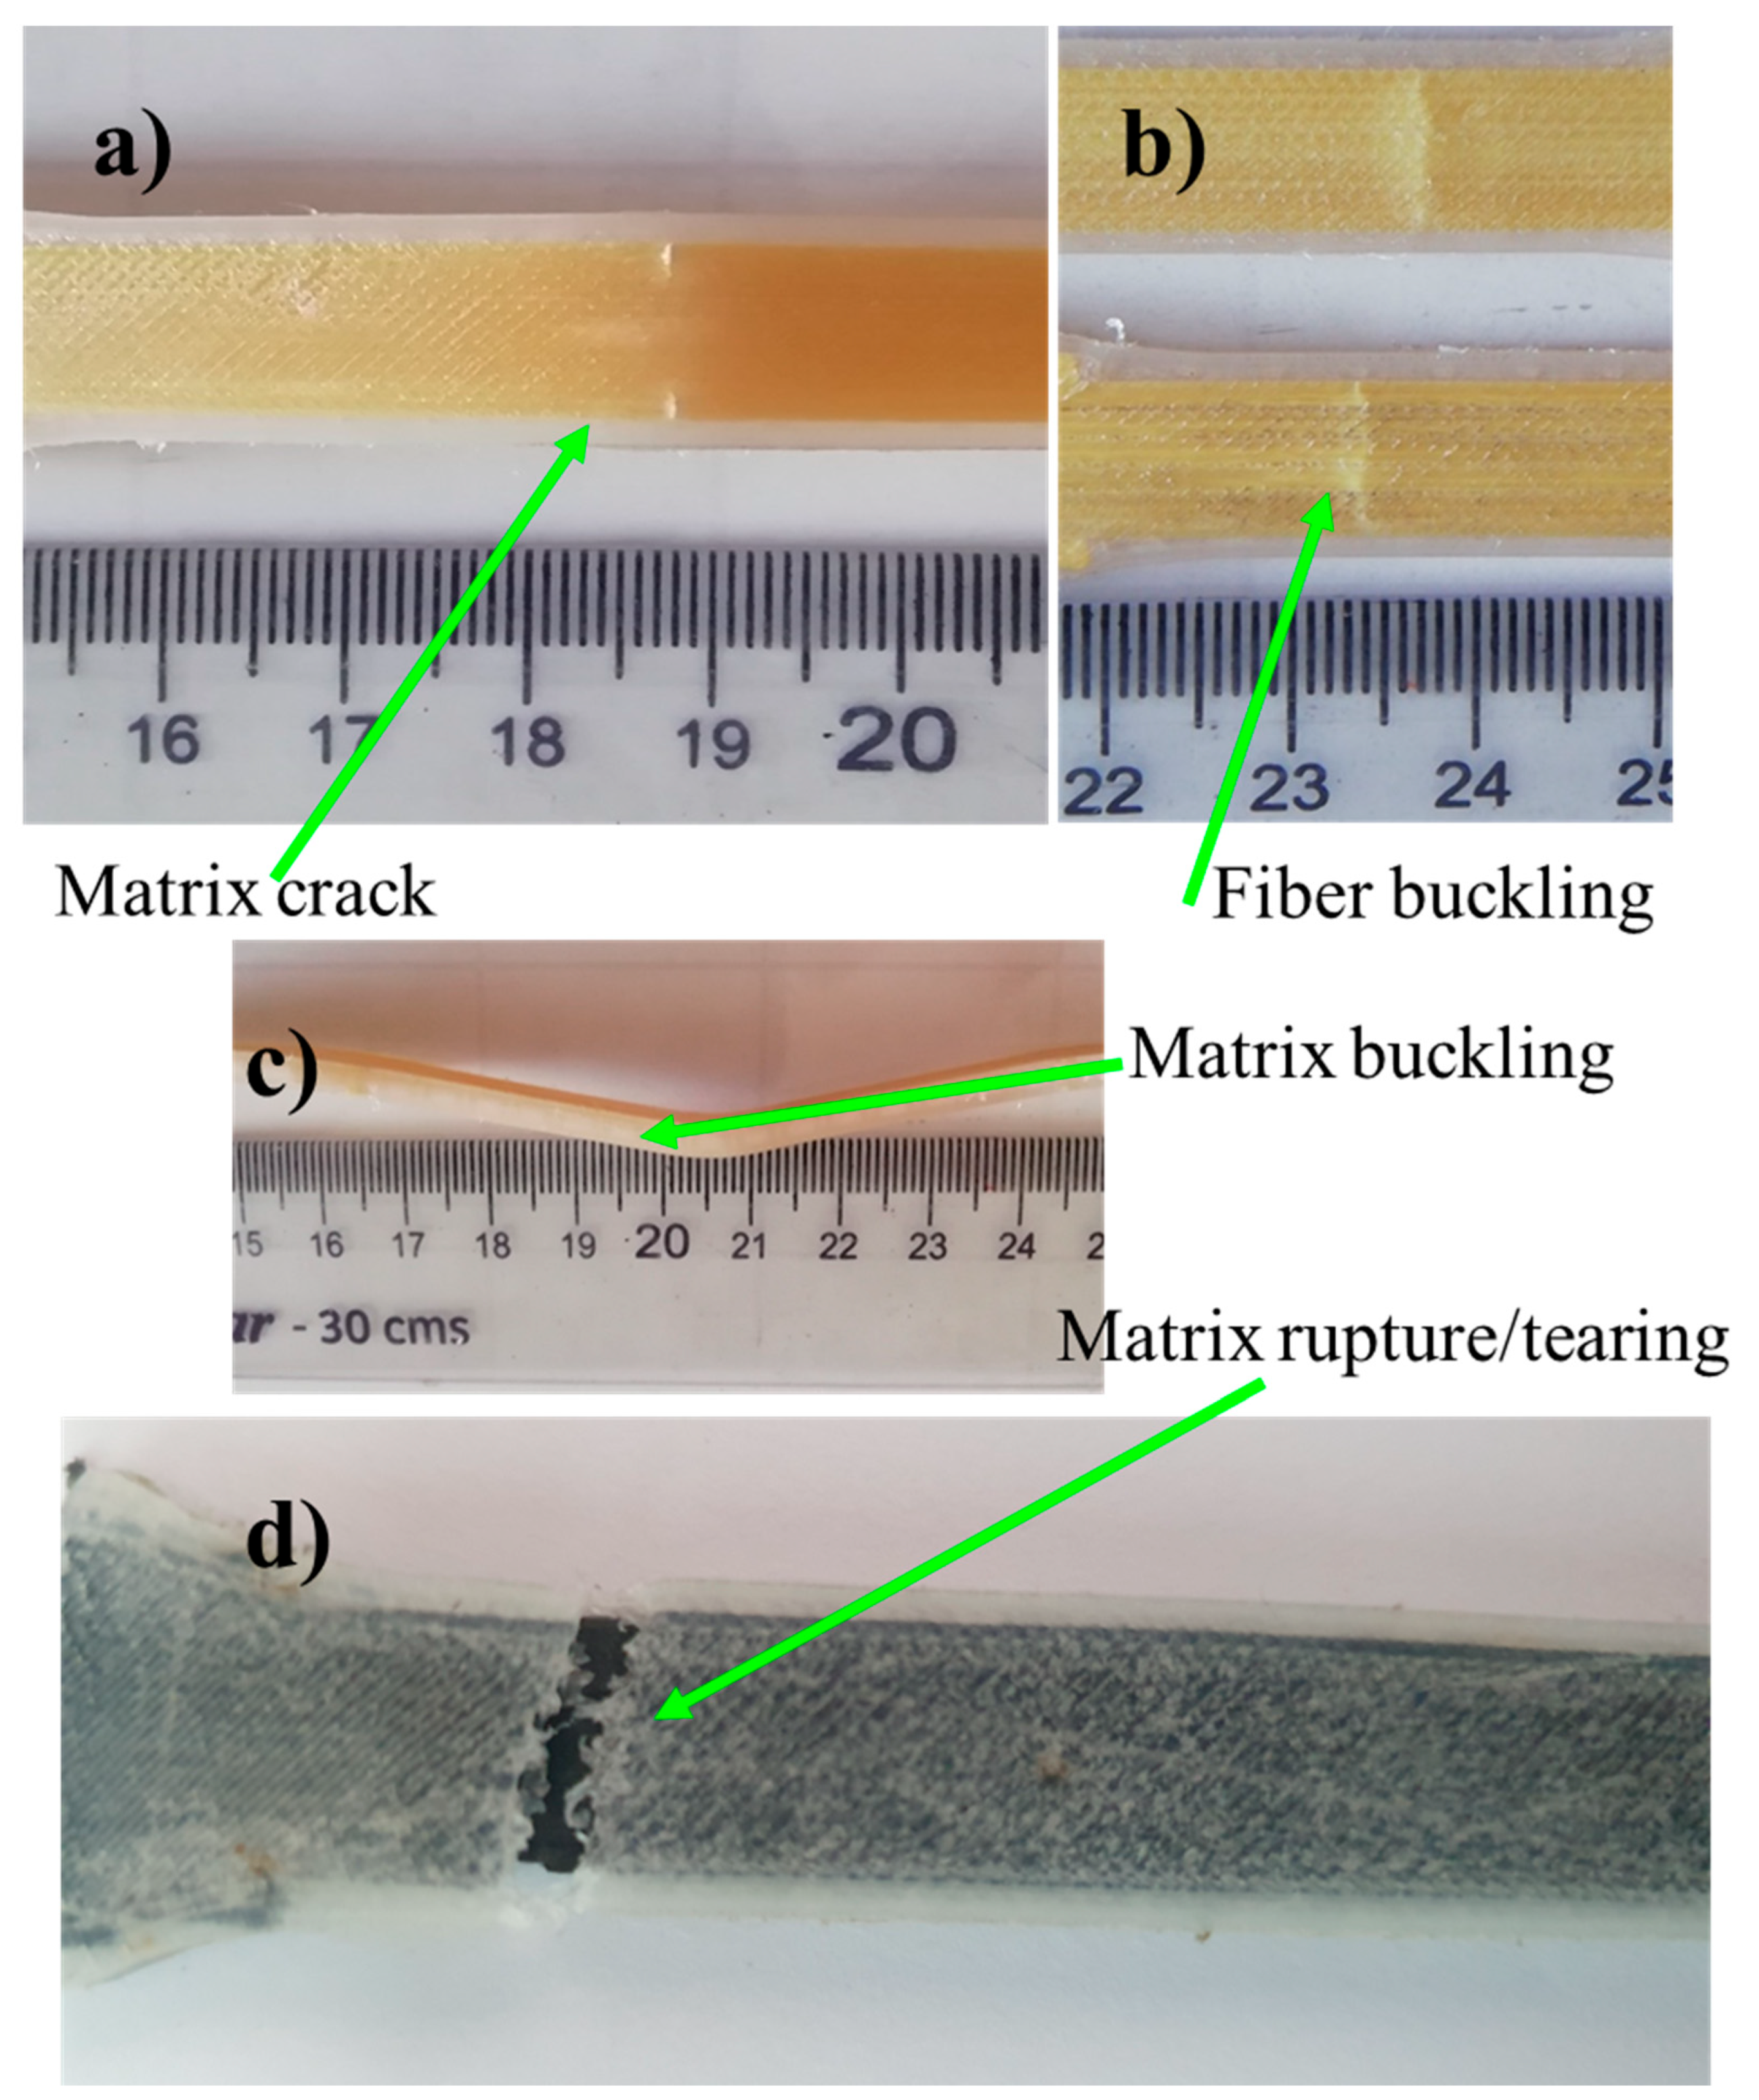
Figure 8 shows an example of cracks in the polymer matrix. Although the specimens could continue to support the load, the tests were stopped at that point due to a drop in the applied load caused by the presence of a crack in the matrix. As described by Nairn [30], composite materials begin to fail in the matrix, which is generally the least resistant component. The initial crack propagates through the matrix until it encounters a fiber, from which it can either cross the fiber if the load is sufficiently high or follow a path parallel to the fiber. The second mechanism is the most common and is visualized as fiber–matrix detachment [34]. Figure 8a shows a crack in the matrix, whereas Figure 8b shows a wrinkle in the matrix with no apparent rupture, which could be an indication of fiber buckling. Such wrinkles have been previously reported [18]. This latter phenomenon can be explained by the high slenderness ratio of the fiber, which has a diameter of 0.4 mm. Although the tests in this study used a positive axial load, the fibers acted as columns when the hydraulic actuator cylinder moved in the return stroke, and the fibers experienced a compression load. If that compression produces buckling, it could force a crack in the surrounding matrix, as shown in Figure 8a. These wrinkles have been reported before during fatigue bending [22]. When the component loses its original stiffness, it is usually due to matrix cracking [4], and the life prediction method changes from the σ–N method, used in this study, to the da/dN versus ΔK method, which seeks to establish the remaining life to avoid sudden failure. Furthermore, Figure 8c shows a lateral view where matrix buckling can be observed. The matrix collapses during the compression part of the load, causing buckling. Failure mechanisms, such as initial cracks in the matrix and continuous fiber buckling, have been explained in more detail elsewhere [4,31] and are consistent with the damage mechanisms observed in this study. Finally, Figure 8d shows that the matrix can be seen completely cracked, but the fibers are still holding the load.
After the tests were stopped, samples were broken in liquid N2 and observed under SEM. Figure 9 shows a close-up of a carbon-reinforced sample after 108 k cycles. On the top right-hand side, one can see matrix tearing, which likely started as a wrinkle; at the bottom left-hand side, fiber–matrix pull-out is visible, probably following matrix cracking, and finally, broken fibers appear at the bottom left corner as the last stage. Carbon fiber is known to be a strong but brittle material. Hence, the fibers were expected to break. Moreover, this observation aligns with [2], who documented the presence of matrix cracks between neighboring fibers, which ultimately caused the fibers to split and break.
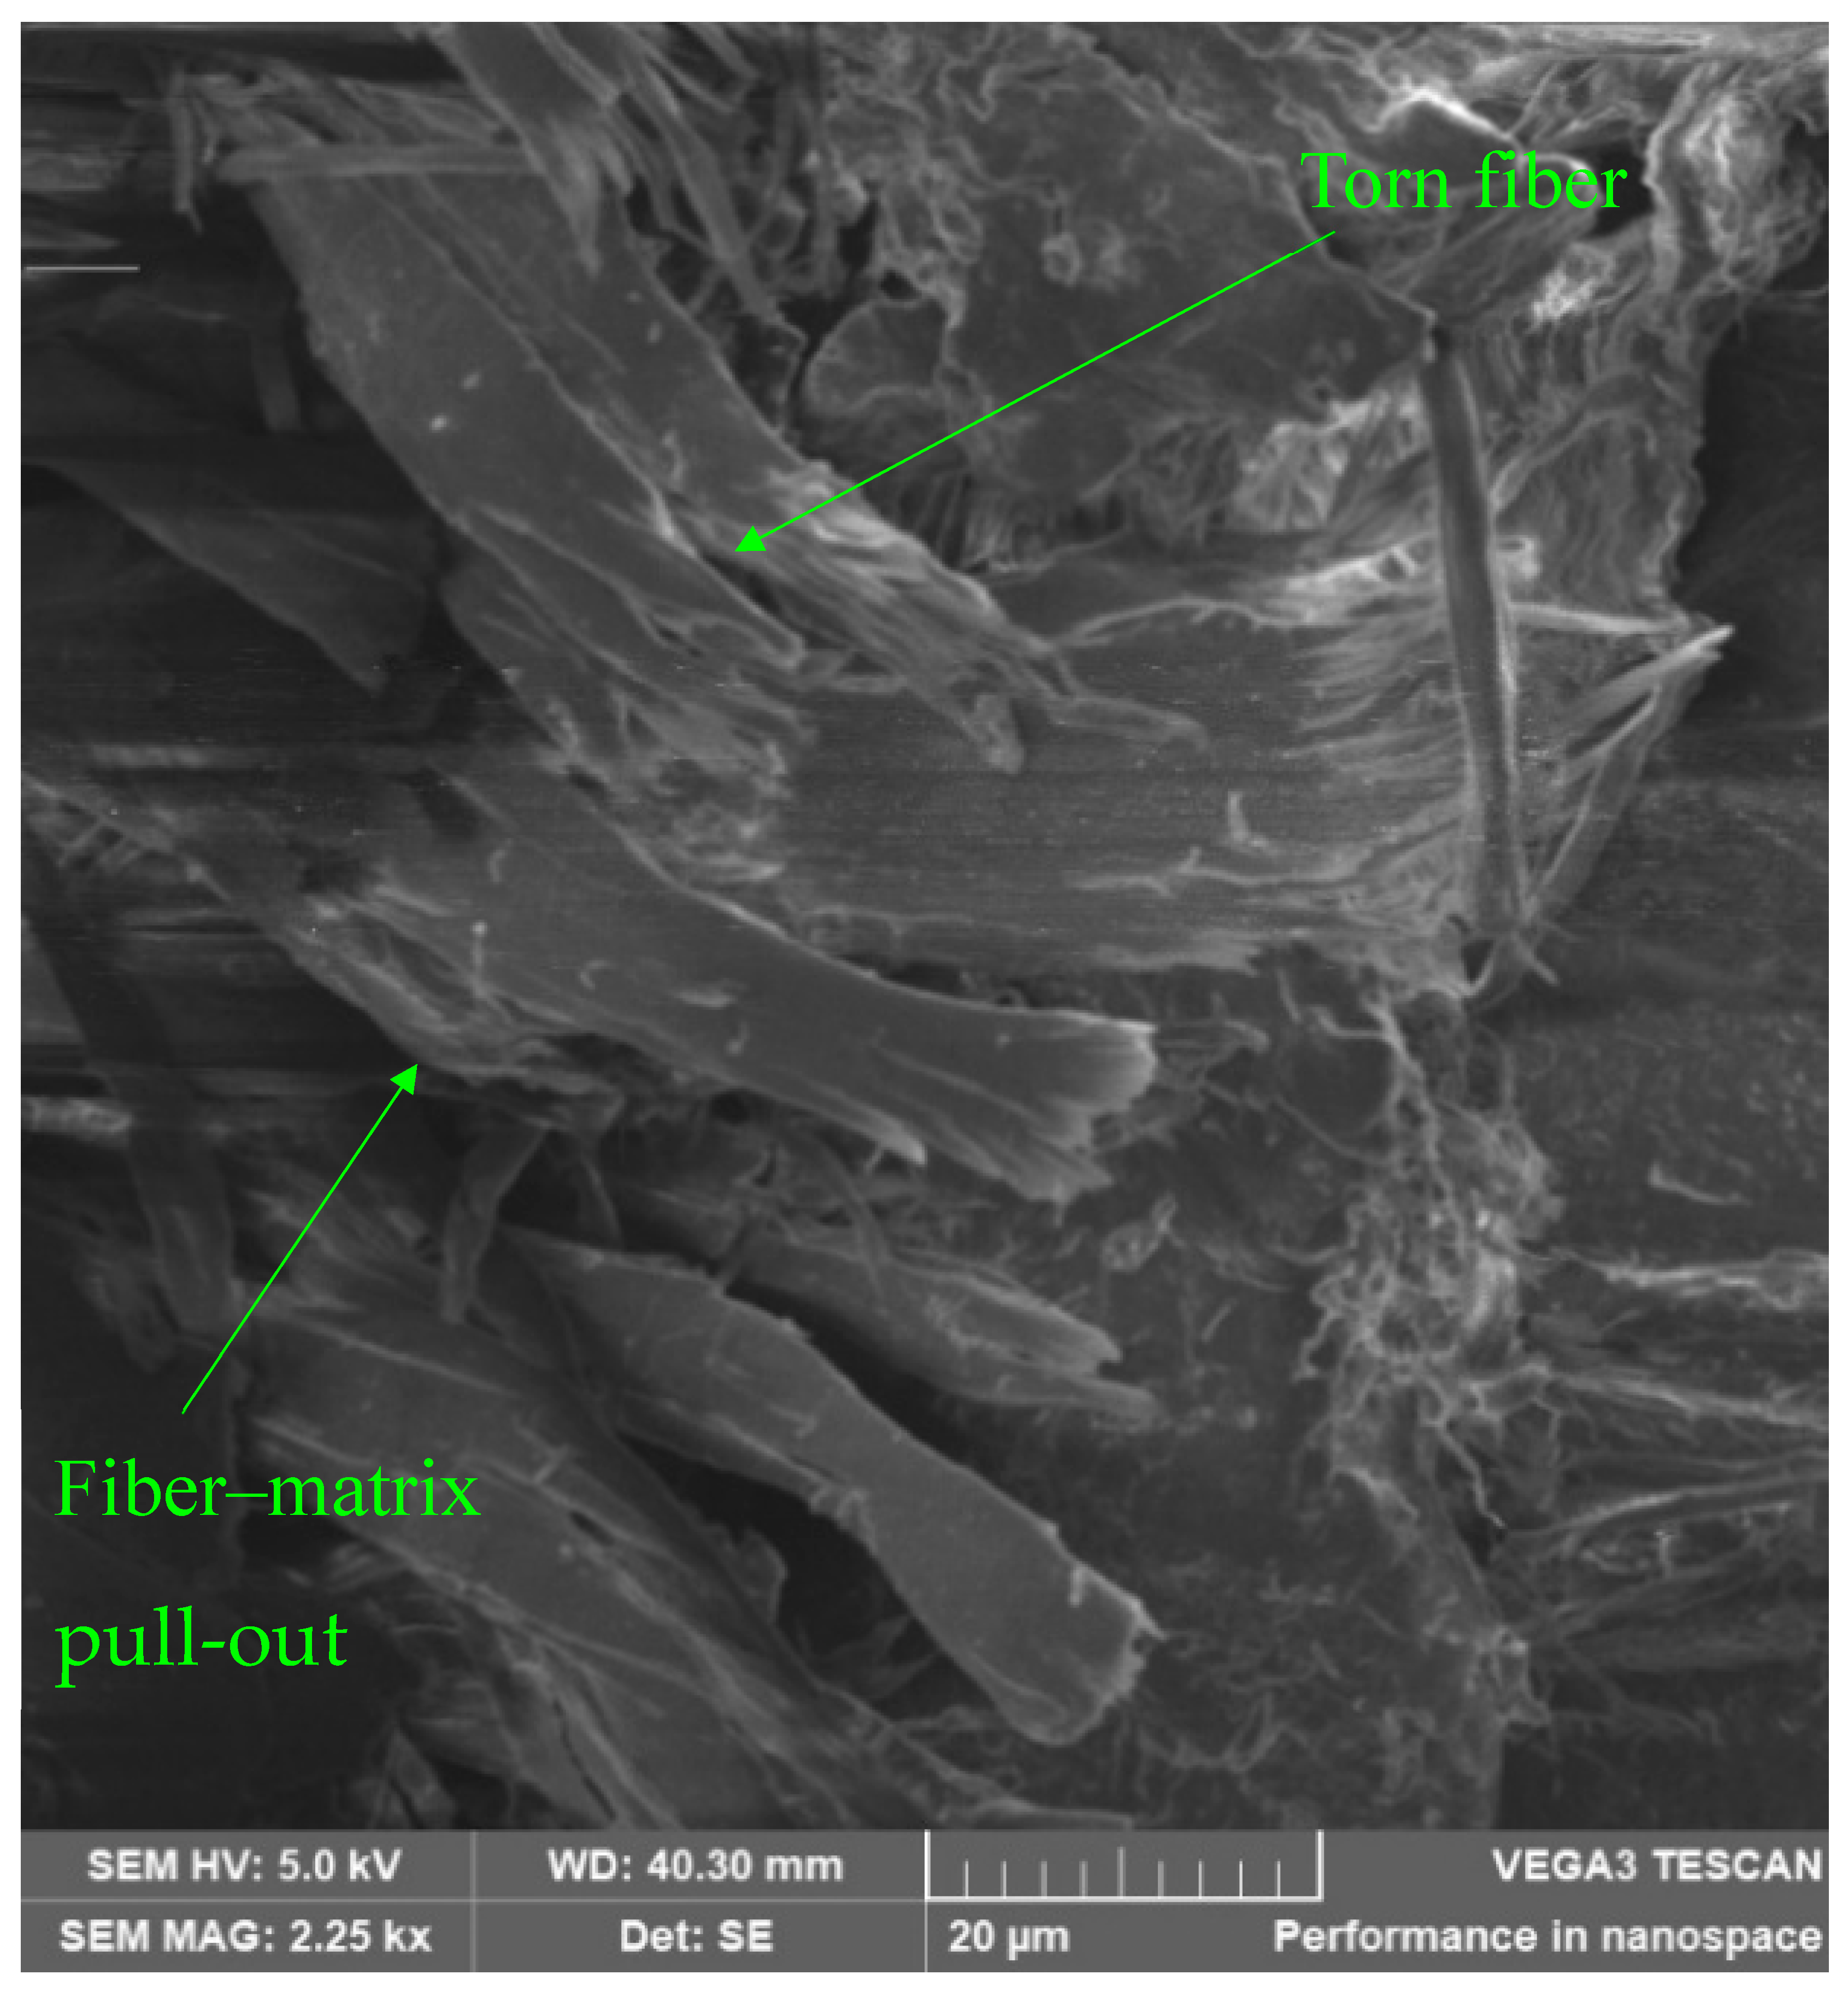
Figure 10 shows a high magnification view of a Kevlar-reinforced sample after 809 k cycles. Torn fibers and fiber–matrix pull-out are visible. Matrix tearing and breaking were observed, although not reported here, and had been previously reported [22]. The existence of matrix fissures between neighboring fibers, which ultimately caused the fibers to split and break, was observed, as reported recently [2]. Kevlar fiber is a tough material, so fibers do not usually break immediately, but they accumulate damage in the matrix and at the fiber–matrix interface, which eventually leads to local breakage and ultimately fiber tearing. Therefore, failure under cyclic loading for the Kevlar-reinforced composites is progressive, with fibers that may both break and tear.

4.3. Discussion

The experimental results shown in Figure 6 describe the experimental fatigue curve obtained for two composite materials consisting of a nylon matrix reinforced with continuous fibers (carbon and Kevlar) and demonstrate the characteristic behavior of composite materials subjected to high load cycles. The achieved service life of up to 4.09 million cycles for the carbon-reinforced and 2.49 million for the Kevlar-reinforced composites indicates a considerable fatigue endurance limit under the alternating load. However, the failure mechanisms evidenced by fractography show progressive degradation in both the matrix and fibers. This is evidenced by the cyclic σ-ε shown in Figure 6, as also reported by Harber [20], where the difference between the applied and dissipated energy can be observed. This difference in energy has been attributed to the failure mechanisms discussed below. Fiber breakdown and matrix tearing in the carbon-reinforced samples, Figure 9, reflect the accumulation of microstructural damage due to repeated cyclic stresses, affecting the load transfer capacity between the fibers. The failure of the carbon fibers is seen as a clean cut that is characteristic of brittle fracture. On the other hand, the tearing of the fibers in the Kevlar-reinforced samples, shown in Figure 10, suggests that once the matrix is compromised, as exemplified in Figure 8a, the fibers continue to withstand the loads until they reach their limit, eventually causing their failure by tearing. Such evolution is schematically shown in Figure 11. Together, these mechanisms explain the progressive decrease in the capacity of the samples to withstand external loading. Understanding the failure mechanism is essential for choosing a precise and reliable material model capable of accurately simulating the behavior of the material being tested and designing safe and effective structures. Therefore, it is necessary to choose a material model that accounts for matrix and fiber mechanical properties, volume fiber fraction, fiber–matrix adhesion, and fiber orientation.
On the other hand, although porosity is widely documented in samples manufactured by MEX, it did not initiate cracks or lead to failure in the composite materials. This indicates that, in this case, porosity did not significantly compromise the structural integrity or fatigue strength of the material.
Finally, the observed failure mechanisms highlight the importance of optimizing fiber–matrix adhesion, including appropriate matrix and fiber storage under controlled low-humidity conditions that influence adhesion quality. The individual strength of each phase cannot be improved by the end user, leaving only alternatives such as HIP (Hot Isostatic Pressing) [21] treatments to improve mechanical response.

5. Conclusions

Fatigue testing using the stress-versus-life method was performed on samples of a polymer matrix composite material reinforced with continuous Kevlar and carbon fibers printed using the novel MEX technique. It is evident that using continuous fiber reinforcement in conjunction with a polymer base material allows for mechanical behavior that cannot be achieved with unreinforced polymers alone. This use of fibers allows AM to achieve a new level of performance and enhances its use in product design. Thus, it was established that reinforced components can withstand at least 2.49 M axial load cycles if subjected to stresses below 46.15 MPa for Kevlar and 4.09 M cycles for carbon when subjected to stress below 42.8 MPa at a load inversion factor of R = 0.1. This allows a designer to project components able to withstand fluctuating load operating conditions with known fatigue limits
The damage progression was evidenced by the changes in the stress–strain loops as the samples showed relaxation. Such relaxation is attributed to fiber tearing, matrix breaking, and fiber–matrix pull-out, which were observed by SEM as causes of failure, as reported in the literature. In this case, wrinkles were also observed in the matrix, with no apparent rupture. This was attributed to fiber buckling. These failure mechanisms agree with what has been reported in the literature.

Author Contributions

J.G.D.-R.: Investigation, writing, data collection, software, methodology, and formal analysis; A.D.P.-C.: Concept, writing, funding, methodology, and formal analysis; O.R.B.-B.: Writing, project administration, visualization, formal analysis, and methodology. All authors have read and agreed to the published version of the manuscript.

Funding

This research received no external funding.

Institutional Review Board Statement

Not applicable.

Informed Consent Statement

Not applicable.

Data Availability Statement

The data in this study are available upon a reasonable request.

Conflicts of Interest

The authors declare no conflict of interest.

References

  1. Díaz-Rodríguez, J.G.; Pertúz-Comas, A.D.; González-Estrada, O.A. Mechanical Properties for Long Fibre Reinforced Fused Deposition Manufactured Composites. Compos. B Eng. 2021, 211, 108657. [Google Scholar] [CrossRef]
  2. Pothnis, J.R.; Hejjaji, A.; Bhatia, G.S.; Comer, A. Failure Analysis under Fatigue Loading of Glass Fibre Reinforced In-Situ Polymerizable Thermoplastic and Bio-Epoxy Based Composites. Compos. Part C Open Access 2025, 17, 100608. [Google Scholar] [CrossRef]
  3. Shah, D.U. Damage in Biocomposites: Stiffness Evolution of Aligned Plant Fibre Composites during Monotonic and Cyclic Fatigue Loading. Compos. Part A Appl. Sci. Manuf. 2016, 83, 160–168. [Google Scholar] [CrossRef]
  4. Guo, R.; Li, C.; Niu, Y.; Xian, G. The Fatigue Performances of Carbon Fiber Reinforced Polymer Composites—A Review. J. Mater. Res. Technol. 2022, 21, 4773–4789. [Google Scholar] [CrossRef]
  5. Paredes, A.C.; Bohórquez, O.; Pertuz, A.; Rueda, Y.; González-Estrada, O.A. Interlaminar Tensile Strength for Composite Materials Made by Additive Manufacturing. J. Phys. Conf. Ser. 2019, 1386, 012002. [Google Scholar] [CrossRef]
  6. Cheng, P.; Han, Z.; Chen, Y.; Ye, L. Recent Progress in Non-Planar 3D Printing of Continuous Fiber-Reinforced Composites. Compos. Part A Appl. Sci. Manuf. 2025, 194, 108900. [Google Scholar] [CrossRef]
  7. Pathan, M.; Ponnusami, S.; Pathan, J.; Pitisongsawat, R.; Erice, B.; Petrinic, N.; Tagarielli, V. Predictions of the Mechanical Properties of Unidirectional Fibre Composites by Supervised Machine Learning. Sci. Rep. 2019, 9, 13964. [Google Scholar] [CrossRef]
  8. Agarwal, K.; Kuchipudi, S.K.; Girard, B.; Houser, M. Mechanical Properties of Fiber Reinforced Polymer Composites: A Comparative Study of Conventional and Additive Manufacturing Methods. J. Compos. Mater. 2018, 52, 3173–3181. [Google Scholar] [CrossRef]
  9. Cuan-Urquizo, E.; Barocio, E.; Tejada-Ortigoza, V.; Pipes, R.B.; Rodriguez, C.A.; Roman-Flores, A. Characterization of the Mechanical Properties of FFF Structures and Materials: A Review on the Experimental, Computational and Theoretical Approaches. Materials 2019, 12, 895. [Google Scholar] [CrossRef]
  10. Zhou, L.; Miller, J.; Vezza, J.; Mayster, M.; Raffay, M.; Justice, Q.; Al Tamimi, Z.; Hansotte, G.; Sunkara, L.D.; Bernat, J. Additive Manufacturing: A Comprehensive Review. Sensors 2024, 24, 2668. [Google Scholar] [CrossRef] [PubMed]
  11. Parrado-Agudelo, J.Z.; Narváez-Tovar, C. Mechanical Characterization of Polylactic Acid, Polycaprolactone and Lay-Fomm 40 Parts Manufactured by Fused Deposition Modeling, as a Function of the Printing Parameters. ITECKNE 2019, 16, 25–31. [Google Scholar] [CrossRef]
  12. Gibson, I.; Rosen, D.; Stucker, B. Additive Manufacturing Technologies; Springer: New York, NY, USA, 2015; ISBN 978-1-4939-2112-6. [Google Scholar]
  13. Mwema, F.M.; Akinlabi, E.T. Basics of Fused Deposition Modelling (FDM). In Fused Deposition Modeling. SpringerBriefs in Applied Sciences and Technology; Springer: Berlin/Heidelberg, Germany, 2020; pp. 1–15. [Google Scholar]
  14. Castro, J.T.P.; Meggiolaro, M.A. Fatigue Design Techniques, 3rd ed.; CreateSpace: North Charleston, SC, USA, 2016; ISBN 1530797365. [Google Scholar]
  15. Alamry, A. Fatigue Damage and Analysis of Laminated Composites: A State-of-the-Art. J. Eng. Res. 2024, 13, 2066–2076. [Google Scholar] [CrossRef]
  16. Sapkota, A.; Ghimire, S.K.; Adanur, S. A Review on Fused Deposition Modeling (FDM)-Based Additive Manufacturing (AM) Methods, Materials and Applications for Flexible Fabric Structures. J. Ind. Text. 2024, 54, 15280837241282110. [Google Scholar] [CrossRef]
  17. Muñoz-Vásquez, S.; Mora-Pérez, Z.A.; Ospina-Henao, P.A.; Valencia-Niño, C.H.; Becker, M.; Díaz-Rodríguez, J.G. Finite Element Analysis in the Balancing Phase for an Open Source Transfemoral Prosthesis with Magneto-Rheological Damper. Inventions 2023, 8, 36. [Google Scholar] [CrossRef]
  18. Rabbi, M.F.; Ertter, J.; Bakis, C.E. Tensile Fatigue Behavior of Short and Continuous Carbon Fiber Reinforced Additively Manufactured Thermoplastic Multiscale Composite. J. Reinf. Plast. Compos. 2024, 44, 1190–1204. [Google Scholar] [CrossRef]
  19. Pertuz, A.D.; Díaz-Cardona, S.; González-Estrada, O.A. Static and Fatigue Behaviour of Continuous Fibre Reinforced Thermoplastic Composites Manufactured by Fused Deposition Modelling Technique. Int. J. Fatigue 2020, 130, 105275. [Google Scholar] [CrossRef]
  20. Harber, G.M. Mechanical Properties and Tension-Tension Fatigue Behavior of a Novel Additively Manufactured Polymer Matrix Composite at Room and Elevated Temperature; Air Force Institute of Technology: Wright-Patterson AFB, OH, USA, 2022. [Google Scholar]
  21. Vidrih, T.; Winiger, P.; Triantafyllidis, Z.; Ott, V.; Terrasi, G.P. Investigations on the Fatigue Behaviour of 3D-Printed Continuous Carbon Fibre-Reinforced Polymer Tension Straps. Polymers 2022, 14, 4258. [Google Scholar] [CrossRef]
  22. Pertuz-Comas, A.D.; Díaz, J.G.; Meneses-Duran, O.J.; Niño-Álvarez, N.Y.; León-Becerra, J. Flexural Fatigue in a Polymer Matrix Composite Material Reinforced with Continuous Kevlar Fibers Fabricated by Additive Manufacturing. Polymers 2022, 14, 3586. [Google Scholar] [CrossRef]
  23. ISO/ASTM 52900:2021; Additive Manufacturing—General Principles—Fundamentals and Vocabulary 2021. ISO: Geneva, Switzerland, 2021.
  24. Thomas, G.; Antoni, M.; Gozdz, S. Three Dimensional Printer with Composite Filament Fabrication 2015; Markforged, Inc.: Watertown, MA, USA, 2015. [Google Scholar]
  25. Blok, L.G.; Longana, M.L.; Yu, H.; Woods, B.K.S. An Investigation into 3D Printing of Fibre Reinforced Thermoplastic Composites. Addit. Manuf. 2018, 22, 176–186. [Google Scholar] [CrossRef]
  26. León, B.J.; Díaz-Rodríguez, J.G.; González-Estrada, O.A. Daño En Partes de Manufactura Aditiva Reforzadas Por Fibras Continuas. Rev. UIS Ing. 2020, 19, 161–175. [Google Scholar] [CrossRef]
  27. Kargar, E.; Ghasemi-Ghalebahman, A. Experimental Investigation on Fatigue Life and Tensile Strength of Carbon Fiber-Reinforced PLA Composites Based on Fused Deposition Modeling. Sci. Rep. 2023, 13, 18194. [Google Scholar] [CrossRef]
  28. Bandyopadhyay, A.; Heer, B. Additive Manufacturing of Multi-Material Structures. Mater. Sci. Eng. R Rep. 2018, 129, 1–16. [Google Scholar] [CrossRef]
  29. Chacón, J.M.; Caminero, M.A.; García-Plaza, E.; Núñez, P.J. Additive Manufacturing of PLA Structures Using Fused Deposition Modelling: Effect of Process Parameters on Mechanical Properties and Their Optimal Selection. Mater. Des. 2017, 124, 143–157. [Google Scholar] [CrossRef]
  30. Nairn, J.A. Matrix Microcracking in Composites. In Comprehensive Composite Materials; Pergamon Press: Oxford, UK, 2000; Volume 2, pp. 403–432. ISBN 978-0-08-042993-9. [Google Scholar]
  31. Awaja, F.; Zhang, S.; Tripathi, M.; Nikiforov, A.; Pugno, N. Cracks, Microcracks and Fracture in Polymer Structures: Formation, Detection, Autonomic Repair. Prog. Mater. Sci. 2016, 83, 536–573. [Google Scholar] [CrossRef]
  32. González-Estrada, O.A.; Pertuz Comas, A.D.; Díaz Rodríguez, J.G. Monotonic Load Datasets for Additively Manufactured Thermoplastic Reinforced Composites. Data Brief 2020, 29, 105295. [Google Scholar] [CrossRef]
  33. Goh, G.D.; Yap, Y.L.; Agarwala, S.; Yeong, W.Y. Recent Progress in Additive Manufacturing of Fiber Reinforced Polymer Composite. Adv. Mater. Technol. 2019, 4, 1800271. [Google Scholar] [CrossRef]
  34. Hedayati, R.; Amin Yavari, S.; Zadpoor, A.A. Fatigue Crack Propagation in Additively Manufactured Porous Biomaterials. Mater. Sci. Eng. C 2017, 76, 457–463. [Google Scholar] [CrossRef]
  35. ASTM D638; Test Method for Tensile Properties of Plastics. American Society for Testing and Materials: West Conshohocken, PA, USA, 2022.
  36. Markforged Composites Mechanical Properties. REV 5.0. Available online: https://static.markforged.com/downloads/composites-data-sheet.pdf (accessed on 9 October 2025).
  37. ASTM D3039; Test Method for Tensile Properties of Polymer Matrix Composite Materials. American Society for Testing and Materials: West Conshohocken, PA, USA, 2017.
  38. Ferdous, W.; Manalo, A.; Peauril, J.; Salih, C.; Raghava Reddy, K.; Yu, P.; Schubel, P.; Heyer, T. Testing and Modelling the Fatigue Behaviour of GFRP Composites—Effect of Stress Level, Stress Concentration and Frequency. Eng. Sci. Technol. Int. J. 2020, 23, 1223–1232. [Google Scholar] [CrossRef]
  39. Gómez, S.; Ramón, B.; Guzman, R. Comparative Study of the Mechanical and Vibratory Properties of a Composite Reinforced with Fique Fibers versus a Composite with E-Glass Fibers. Rev. UIS Ing. 2018, 13, 43–50. [Google Scholar] [CrossRef]
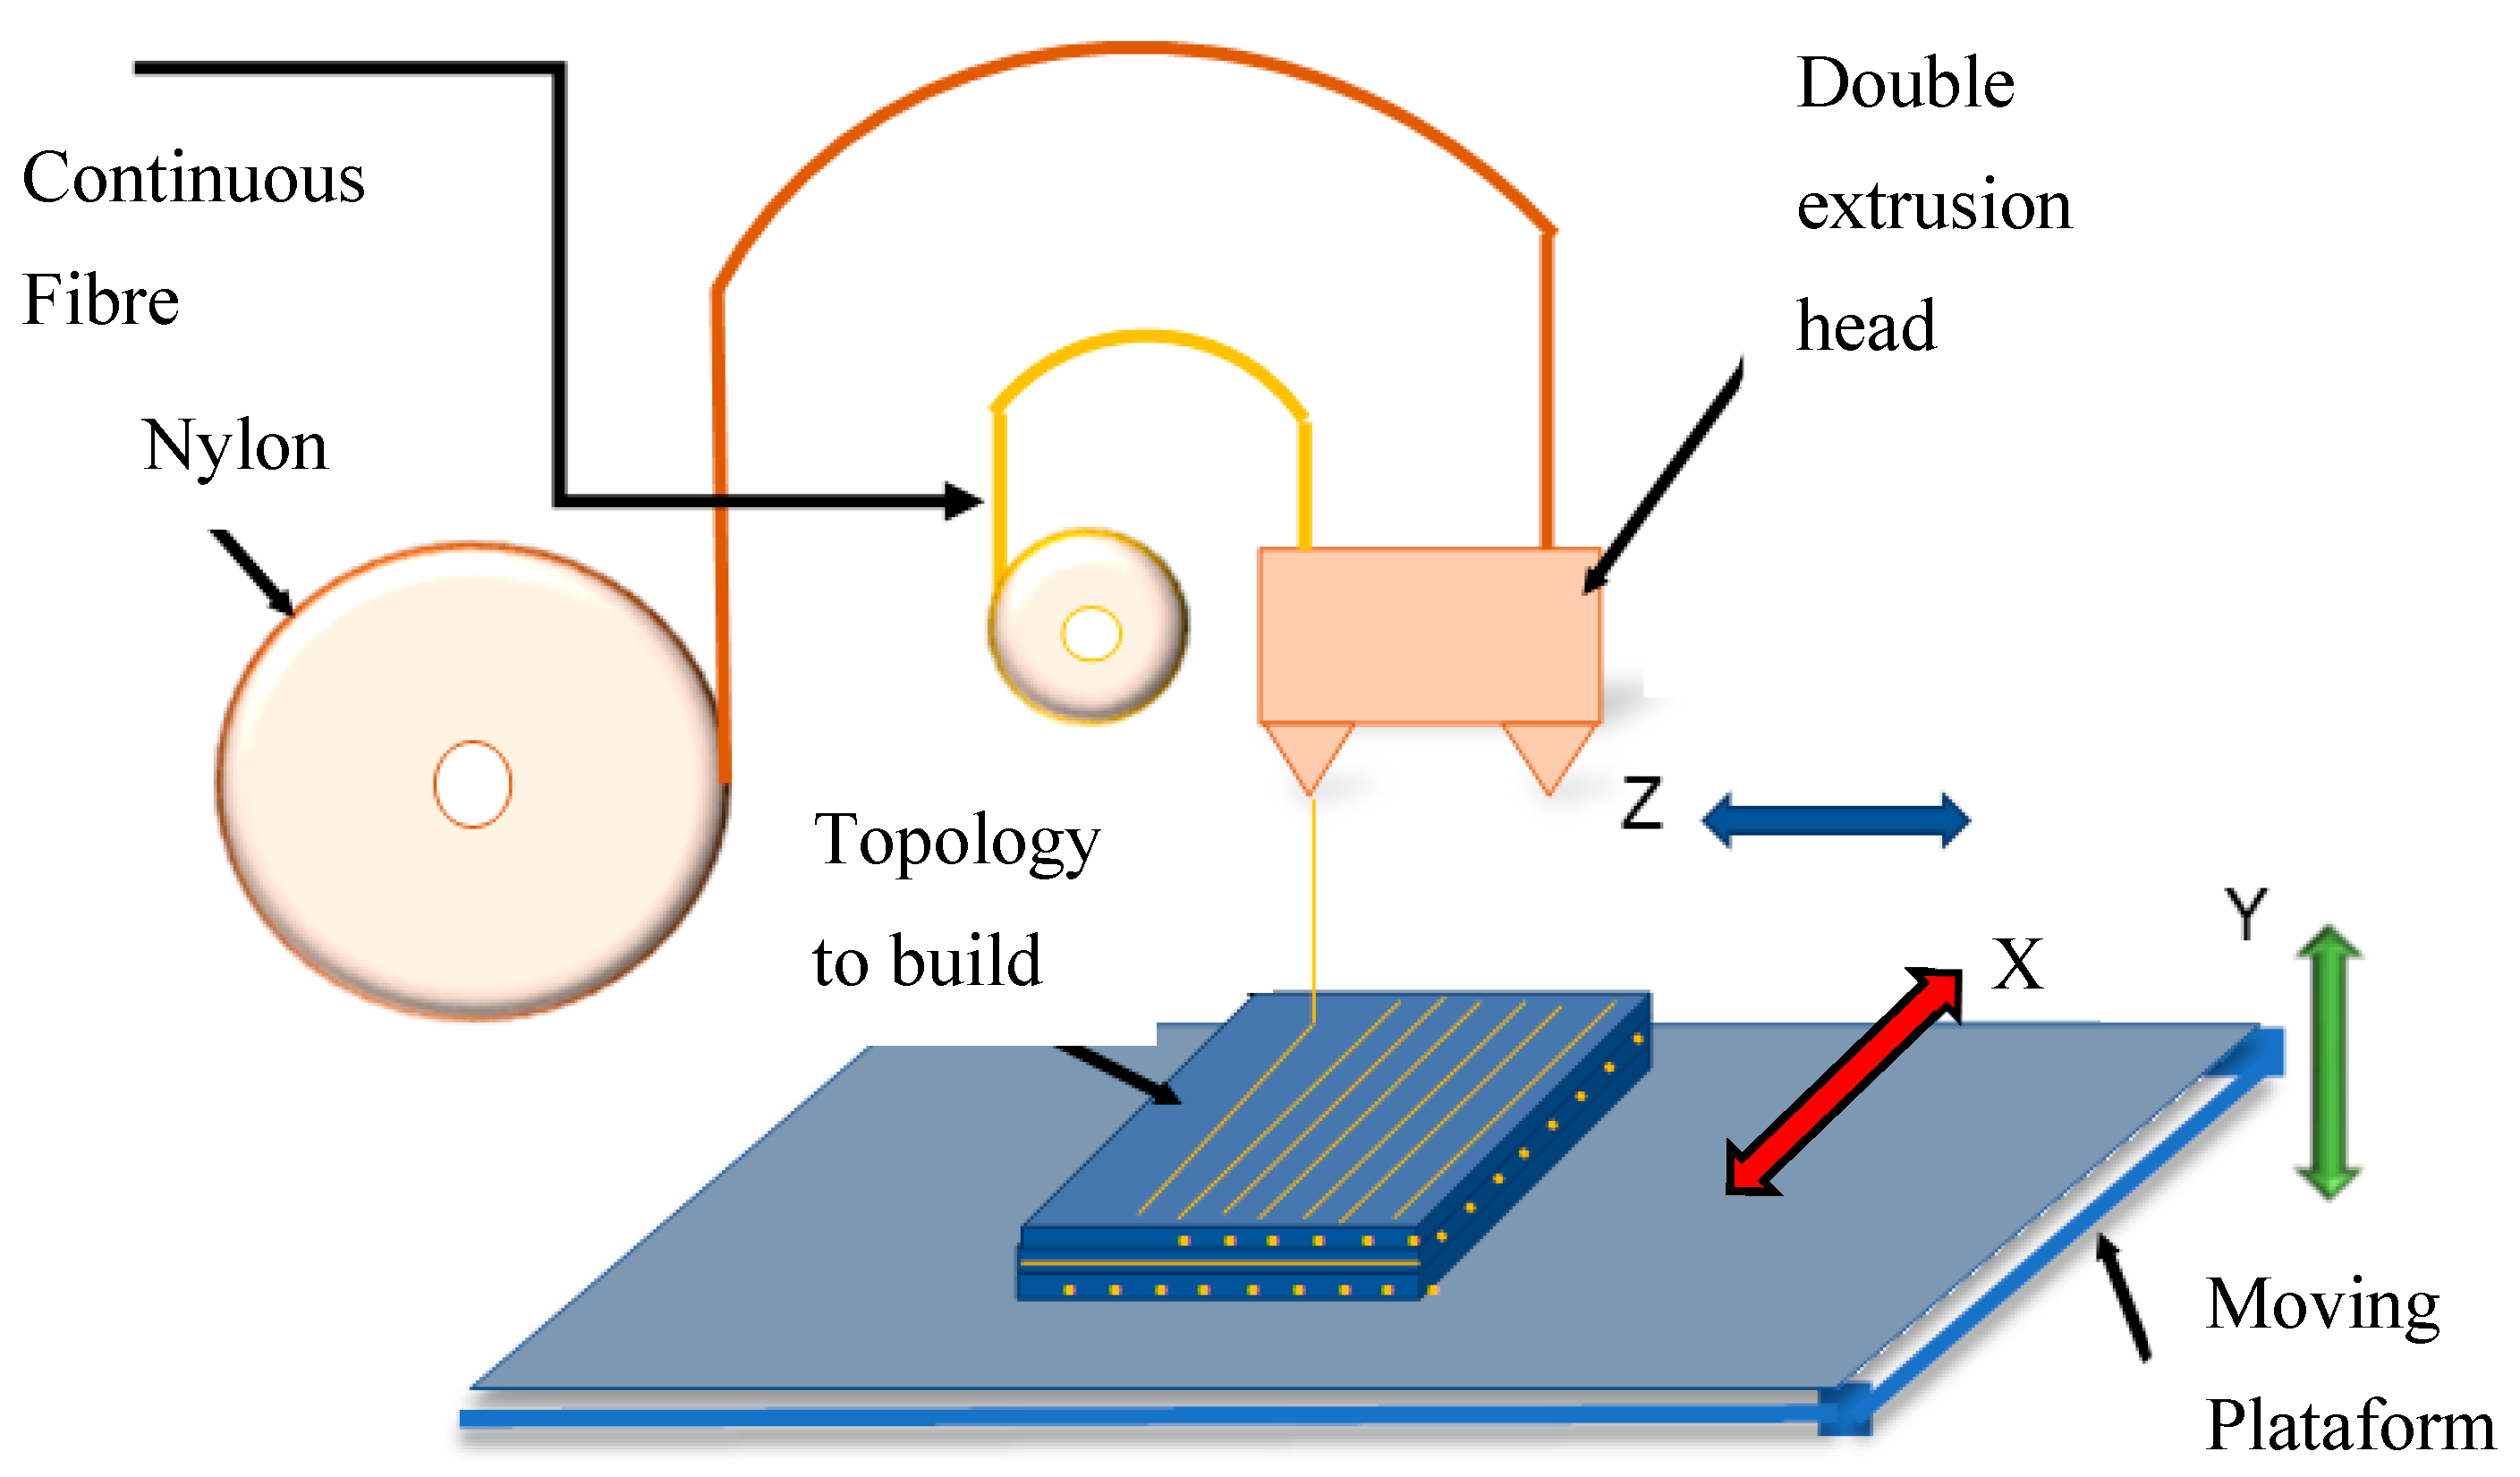
Figure 1. Schematic of the 3D printing process on the Markforged Two printer. Adapted from [26].
Eng 06 00277 g001
Figure 2. Schematic of the options for fiber layout and fill patterns in the Eiger® software.
Eng 06 00277 g002
Figure 3. σ-ε curves reported for different filling patterns [32].
Eng 06 00277 g003
Figure 4. Sample used: (a) Dimensions per ASTM D-639—I [35]. Measurements in mm. (b) View of the sample testing mounted on the universal testing machine.
Eng 06 00277 g004
Figure 5. Comparison of command signal and PID controller response.
Eng 06 00277 g005
Figure 6. Exemplary results of the strain–stress hysteresis loop at different cycles (in thousands) for the Kevlar specimen subjected to 64.7% of the maximum static stress.
Eng 06 00277 g006
Figure 7. Stress versus life results on a Log scale. Arrows indicate tests run out.
Eng 06 00277 g007
Figure 8. Exemplary view of macro failure aspect for specimens: (a) cracks in the matrix in a Kevlar sample, (b) buckling of fibers in a Kevlar sample, (c) lateral view showing matrix buckling in a Kevlar sample, (d) macro failure aspect in a carbon sample.
Eng 06 00277 g008
Figure 9. Low magnification view of a carbon sample after 108 k cycles.
Eng 06 00277 g009
Figure 10. Zoomed in view of a Kevlar-reinforced failure surface after 809 k cycles.
Eng 06 00277 g010
Figure 11. Schematics of failure mechanisms evolution. Blue arrows indicate load direction.
Eng 06 00277 g011
Table 1. Mechanical properties as provided for individual components [36].
MaterialE1 [GPa]σ1 [MPa]Relative Density
Nylon1.733.51.1
Standard usedASTM D638ASTM D638NA
Kevlar fiber276101.2
Carbon608001.2
Standard usedASTM D3039 [37]ASTM D3039NA
NA is standard for Not Available.
Table 2. Fitting constants for Basquin’s rule and fatigue stress limit.
Fiber ReinforcementAbR2Fatigue Limit, MPa
Kevlar121.4−0.04791.1%46.15
Carbon2357.4−0.26388.3142.8
Disclaimer/Publisher’s Note: The statements, opinions and data contained in all publications are solely those of the individual author(s) and contributor(s) and not of MDPI and/or the editor(s). MDPI and/or the editor(s) disclaim responsibility for any injury to people or property resulting from any ideas, methods, instructions or products referred to in the content.