1. Introduction
Efficient irrigation management is fundamental to sustainable agricultural intensification, particularly in regions characterized by seasonal rainfall variability or water scarcity [
1]. In Brazil, which occupies a prominent position in global agricultural output, irrigated farming plays a key role in ensuring high productivity and production stability [
2]. Sprinkler irrigation systems, commonly used across multiple crops and terrain types, are among the most widespread methods due to their moderate cost, ease of automation, and compatibility with a range of field sizes [
3]. However, their performance is often limited by the heterogeneity in water application caused by factors such as wind interference, pressure variation, sprinkler design, and local microtopography [
4].
Irrigation uniformity is a key indicator of system efficiency, as poor distribution can result in under- or over-irrigation zones, affecting plant health, yield, and soil structure [
5]. Traditional methods for evaluating sprinkler performance—such as catch-can tests, flow measurements, and soil moisture monitoring provide valuable insights but are often labor-intensive and limited in spatial resolution, making continuous field-scale assessments challenging. Non-uniform applications contribute to increased water use; energy demand; and, potentially, nutrient leaching or salinization [
6]. Moreover, water redistribution patterns influence critical soil processes, such as infiltration and hydraulic conductivity, and are closely related to soil physical properties like texture, bulk density, and porosity [
7]. Areas with high compaction levels often exhibit reduced infiltration and increased surface runoff, limiting the effectiveness of irrigation and posing challenges to root development and crop resilience [
8].
To address these challenges, Precision Agriculture (PA) provides a framework that incorporates advanced monitoring tools and data-driven management [
9]. The integration of remote sensing technologies, including those mounted on Remotely Piloted Aircraft (RPAs), has revolutionized field monitoring by enabling the acquisition of high-resolution, site-specific data at multiple spectral bands [
10]. RPAs equipped with multispectral cameras allow for the generation of vegetation and moisture indices [
11], such as the Normalized Difference Vegetation Index (NDVI) [
12] and the Normalized Difference Water Index (NDWI), which have been widely applied to infer plant vigor and surface moisture status [
13].
NDWI is sensitive to changes in water content at the soil or canopy surface, making it a promising tool for detecting spatial variability in moisture after irrigation events [
14]. However, spectral indices alone may not provide a complete understanding of the soil–water relationship influencing infiltration, retention, and root-zone conditions [
15]. Ground-based measurements remain essential for quantifying physical attributes such as gravimetric moisture, bulk density, and penetration resistance [
16]. These variables influence infiltration rates, water retention, and the physical structure of the soil matrix [
17]. Integrating UAV-based observations with gravimetric soil moisture, bulk density, and penetration resistance measurements allows a more holistic understanding of field conditions and supports more precise irrigation diagnostics [
18].
Geostatistical analysis further enhances the interpretation of these data by quantifying spatial dependence and allowing the interpolation of unsampled areas [
19]. Techniques such as Ordinary Kriging and Inverse Distance Weighting (IDW) have been widely adopted in agricultural research to generate continuous maps that support decision-making [
20]. These tools are critical in identifying areas with uneven water distribution or structural limitations, enabling targeted interventions that can improve water use efficiency and soil conservation [
21]. Although commonly used for soil or vegetation mapping, application UAV spectral data and soil measurements for assessing sprinkler irrigation uniformity is still underexplored.
Some irrigation monitoring research is being developed by integrating aerial imagery and irrigated crops. Ref. [
22] assessed irrigation uniformity using high-resolution thermal and visible-light images from unmanned aerial vehicles (UAVs). Ref. [
23] estimated water interception in winter wheat canopy under sprinkler irrigation using UAV imagery data with TGDVI, SAVI, DVI, and NDRE indices. Ref. [
24] assessed irrigation uniformity using satellite data and highlighted the need for ground validation for accuracy. Given this context, challenges for efficient water application can be addressed by integrating PRA, soil, and geostatic analyses of water distribution.
The innovation of this research is linked to the instantaneous sharing of aerial and ground data. Integration was performed during subsequent flights and rainfall data measurements, making the research unprecedented when compared to orbital remote sensing studies. In the case of ARP applications for infiltration rate monitoring, the ARP’s sequential flight capability stands out.
Given this context, the present study aimed to evaluate the spatial variability of water distribution in a conventional sprinkler irrigation system, as well as to investigate the associated dynamics of surface moisture and soil physical properties using a combination of multispectral data from RPAs and in situ measurements. By integrating spectral indices, field-based soil characterization, and geostatistical modeling, this work seeks to provide insights into the functioning of sprinkler irrigation systems and propose a methodological approach for their spatial assessment and optimization in precision agriculture contexts.
2. Materials and Methods
2.1. Study Area
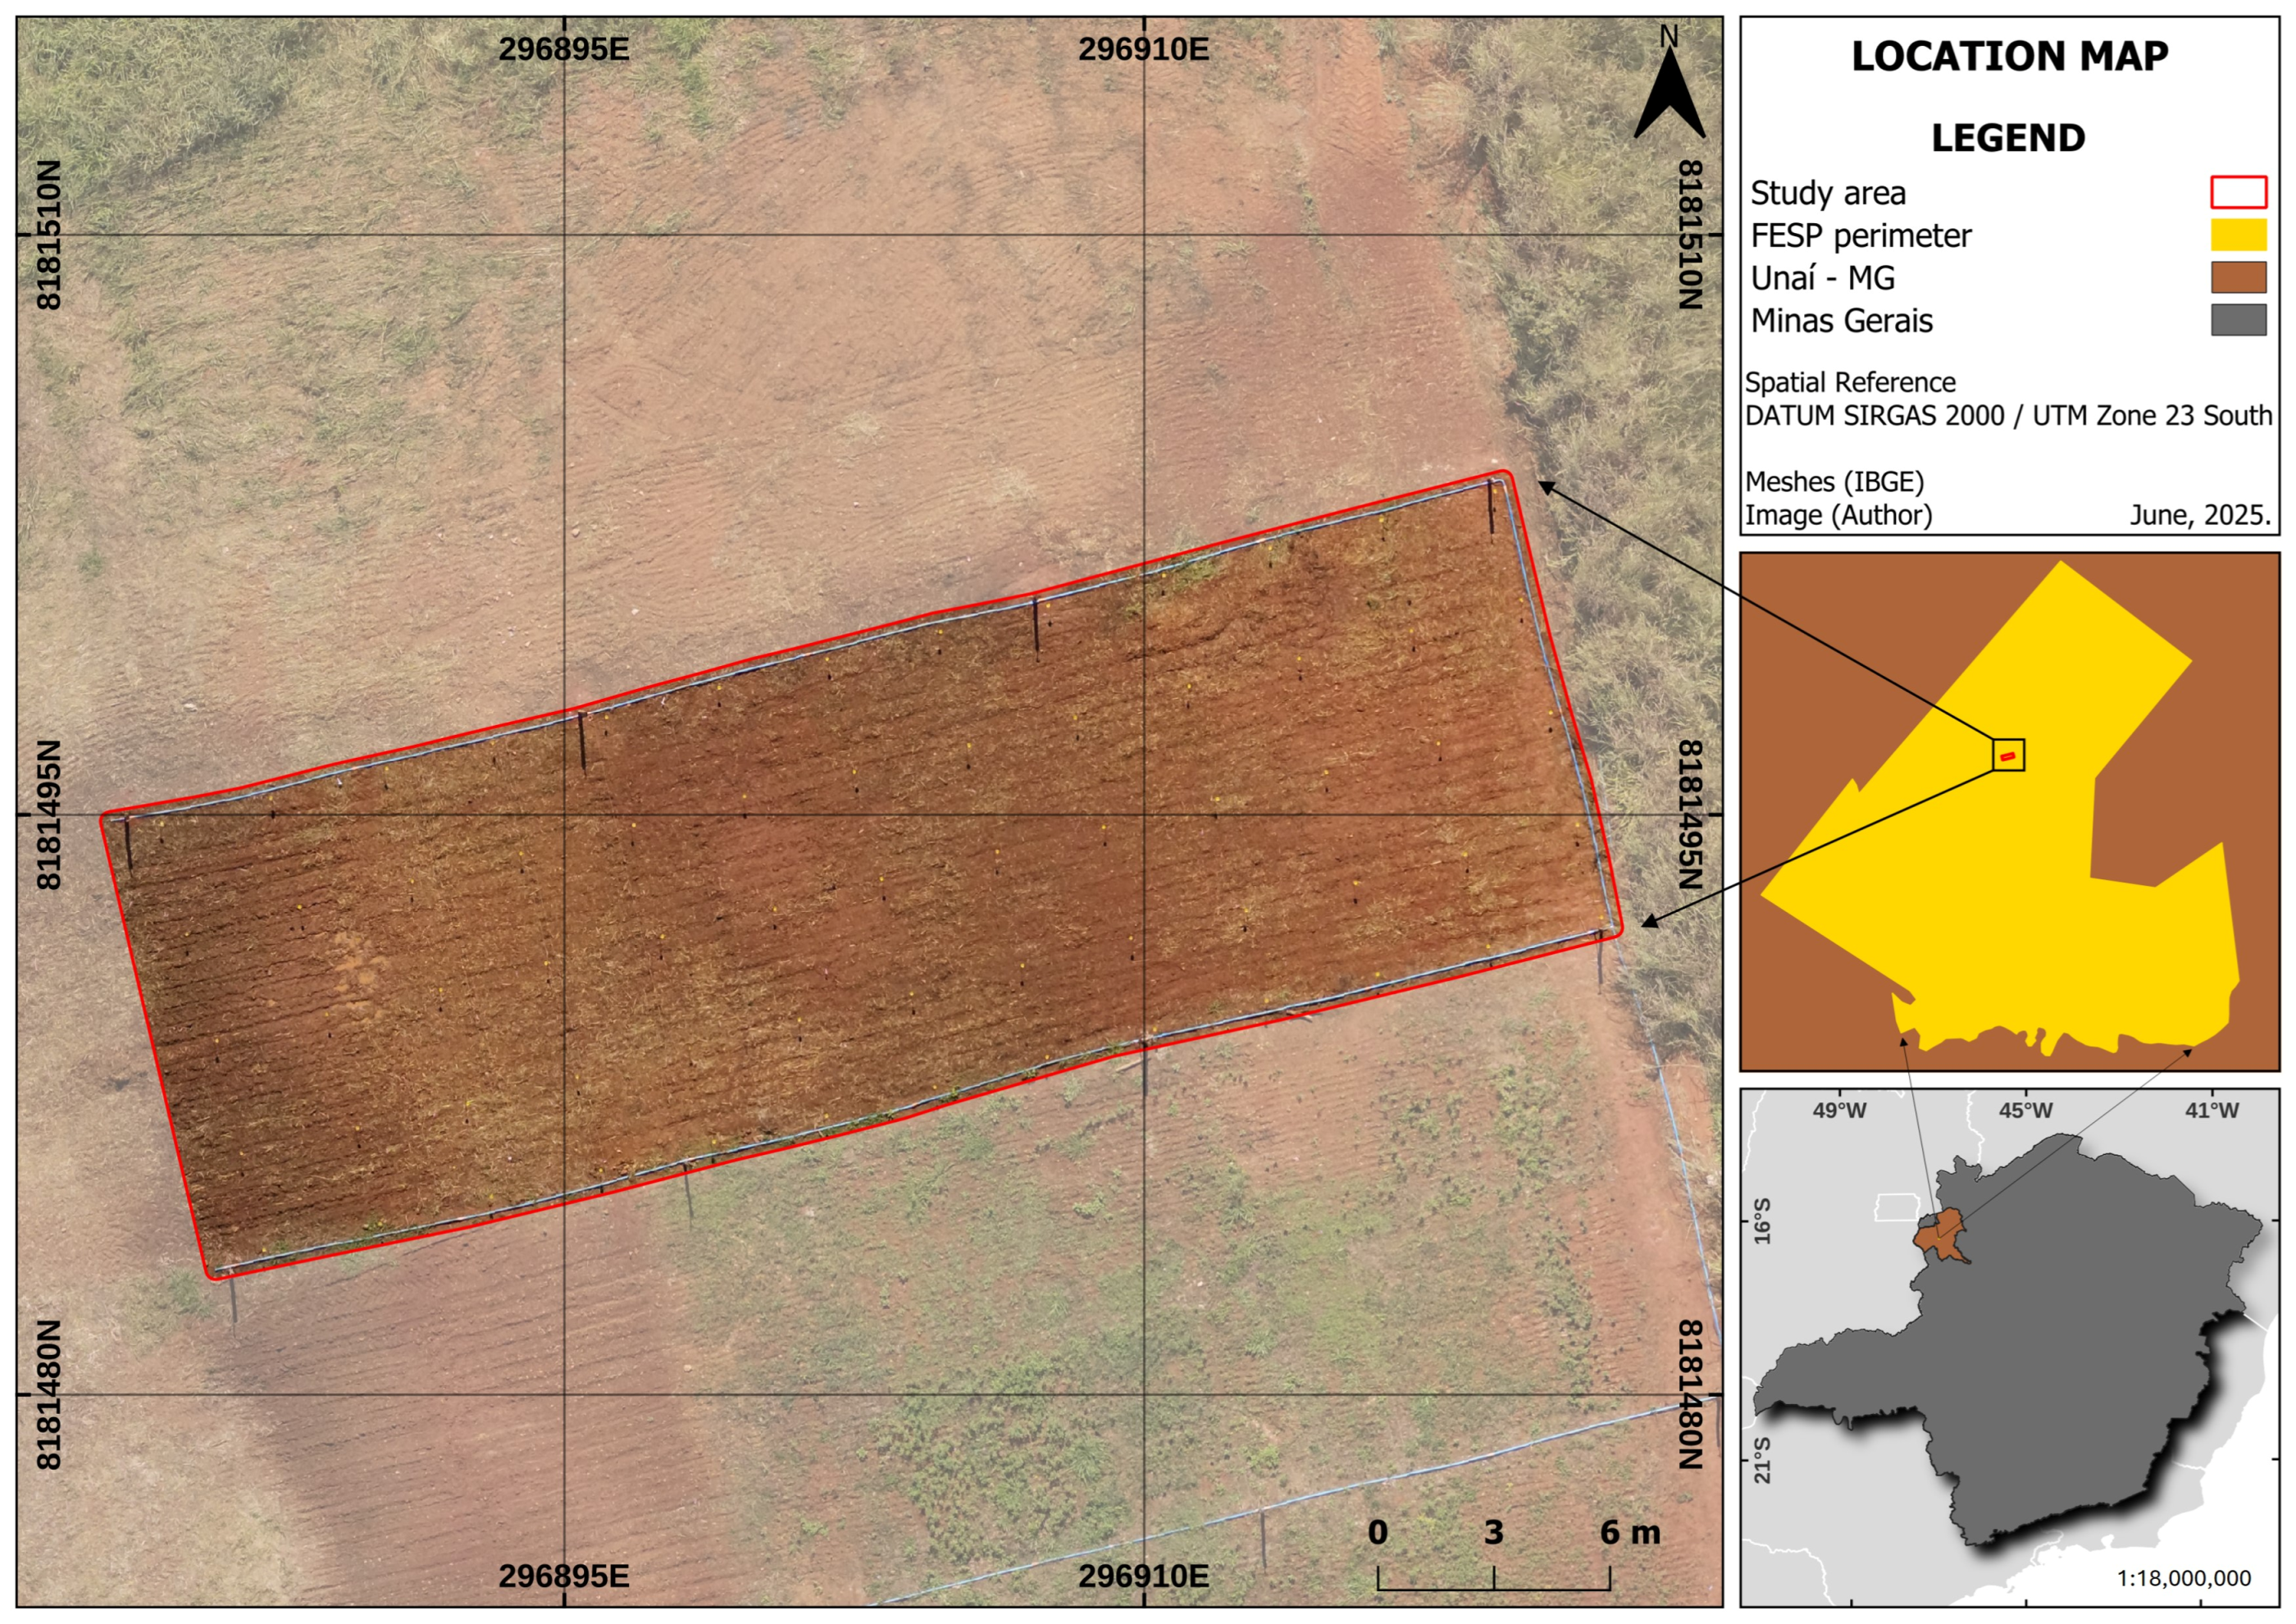
The research was conducted at the Santa Paula Experimental Farm (FESP), a unit of the Federal University of the Jequitinhonha and Mucuri Valleys (UFVJM), located in Unaí, Minas Gerais, Brazil (16°26′22.2″ S, 46°54′07.8″ W) (
Figure 1). The experimental area covered 466.2 m
2 and presented flat topography with an average elevation of 613 m. According to the Köppen climate classification, the region has a tropical savanna climate (Aw) [
25], with annual precipitation ranging from 1400 to 1500 mm and average temperatures between 15 and 31 °C [
26].
The soil was classified as a Red Latosol (Latossolo Vermelho) based on the Brazilian Soil Classification System (SiBCS). These soils are typically deep, well-drained, and exhibit high clay content, which influences their structure, porosity, and response to agricultural operations [
27]. The area had a straw layer on the surface, resulting from a no-till system previously adopted.
2.2. Methodology
2.2.1. Experimental Setup
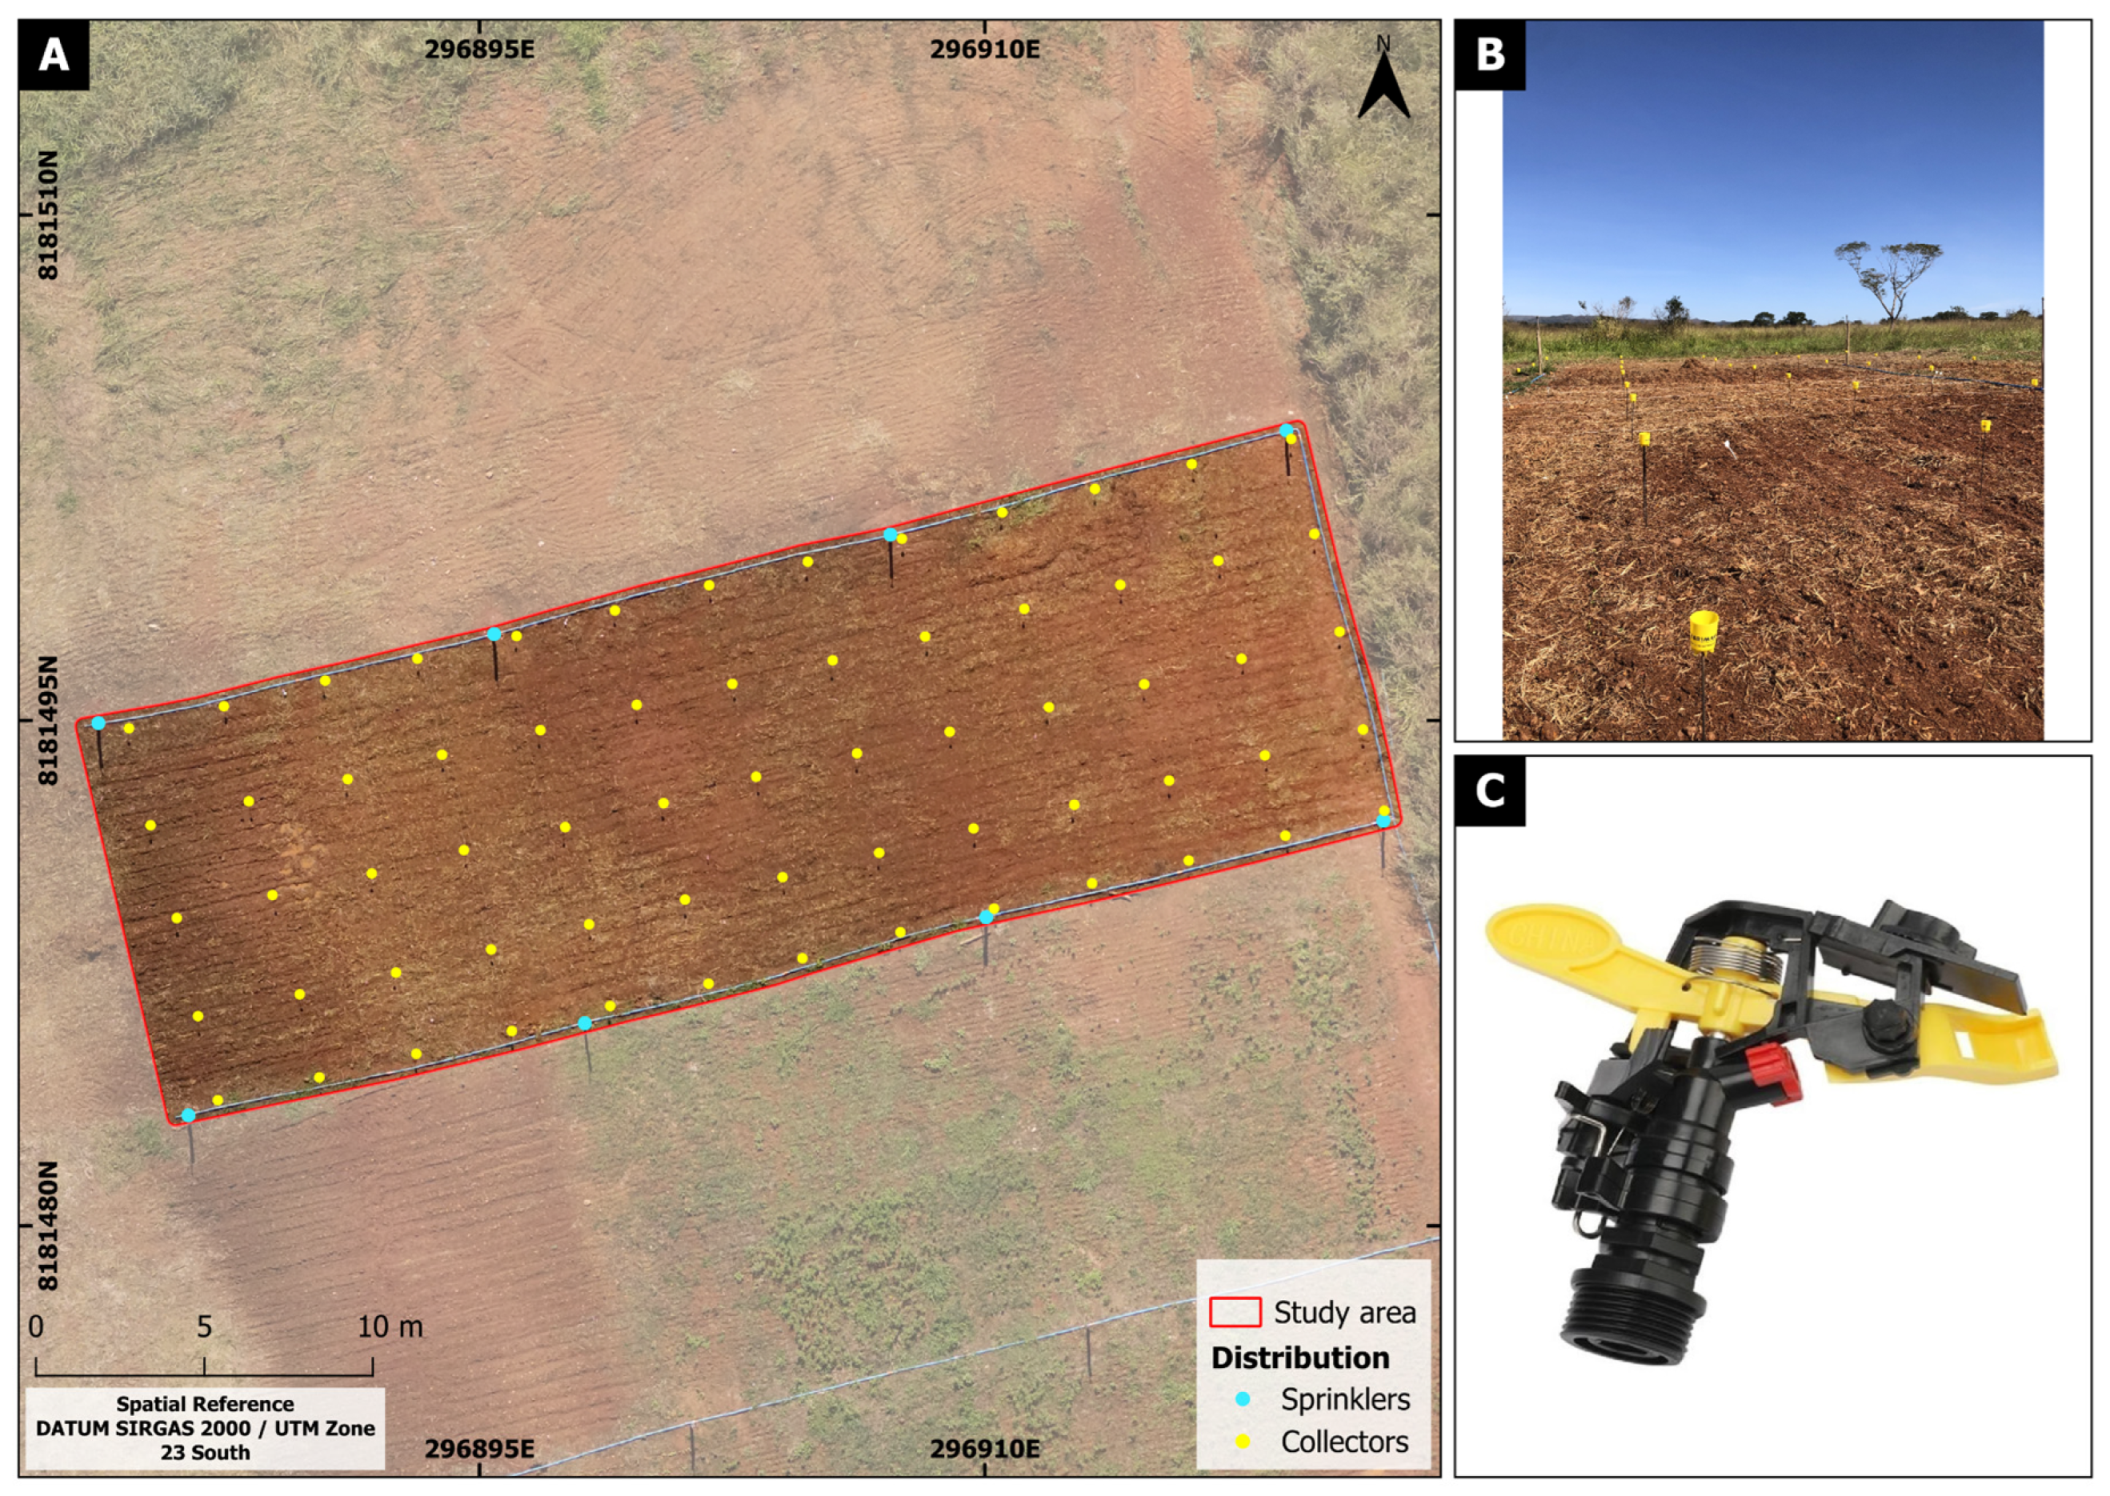
A conventional sprinkler irrigation system was installed in the study area, with 65 irrigation uniformity test collectors spatially distributed (
Figure 2B). The ¾″ Hagra model 89,801 sprinklers (Presidente Prudente, São Paulo, Brazil) (
Figure 2C) were placed along lateral lines spaced 12 m apart, while the collectors were arranged in a georeferenced grid pattern with 3 m spacing both horizontally and vertically across the area (
Figure 2A). The experimental irrigation aimed to measure the applied water depth in millimeters, quantified in the collectors using graduated cylinders after irrigation. The irrigation event lasted 1 h from 10:50 a.m. to 11:50 a.m., during which average environmental conditions were monitored: relative humidity (47%), wind speed (1.1 m/s), and temperature (30.1 °C), with all data collected using a GM 8910 digital multi-purpose anemometer (Nanshan District, Shenzhen, China). The system layout and collector arrangement are clearly shown in
Figure 2A, while
Figure 2B displays the actual collector placement in the field, and
Figure 2C provides a detailed view of the specific sprinkler model used in the experiment.
2.2.2. Soil Sampling and Physical Analysis
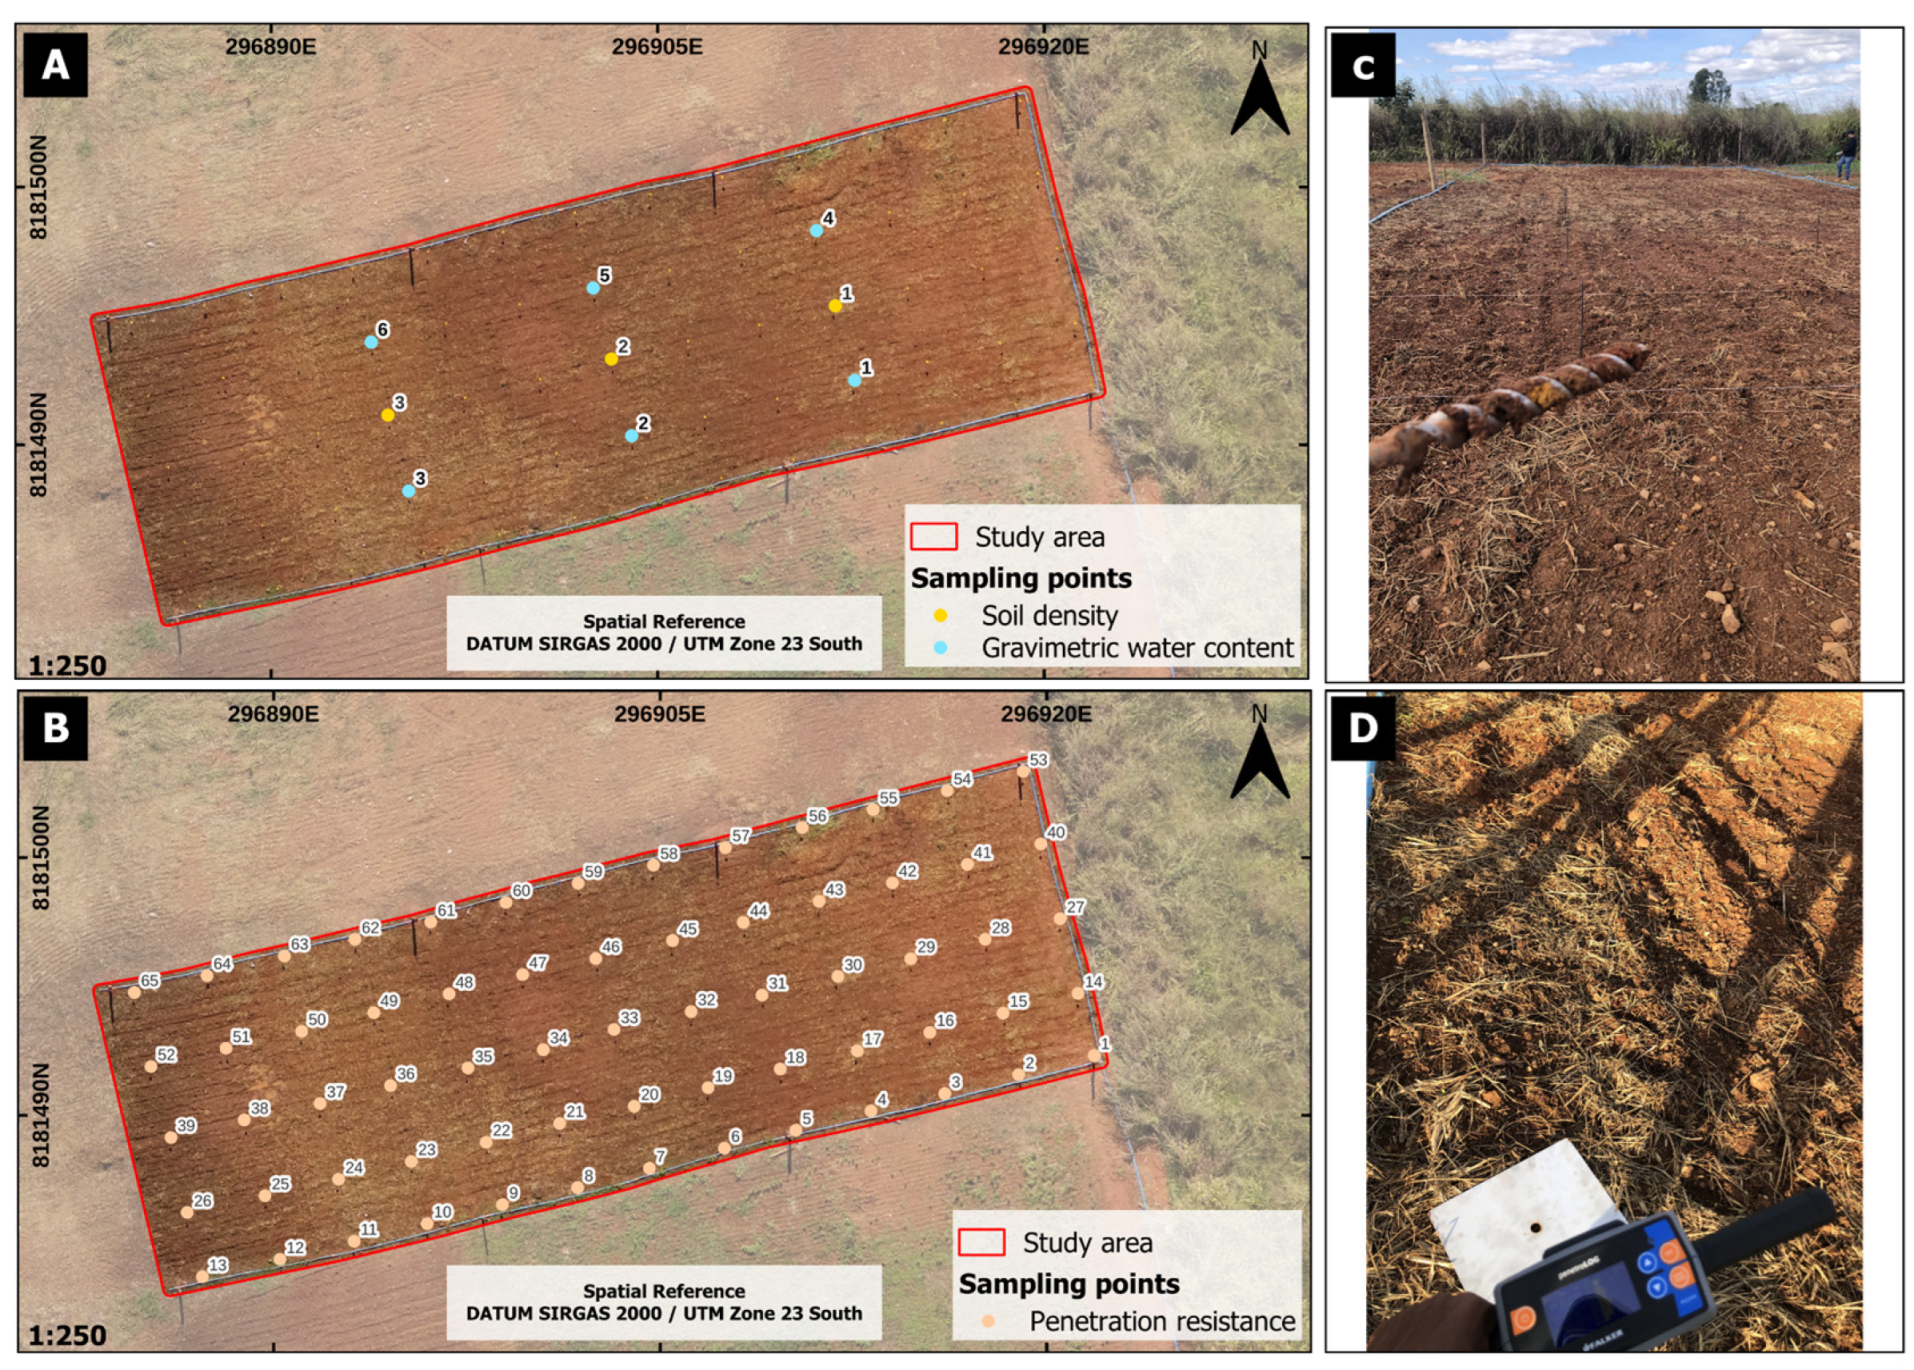
Soil samples were collected in two depth intervals to evaluate bulk density, gravimetric moisture, and resistance to penetration (PR). For bulk density, three undisturbed samples were taken using volumetric steel rings (5 cm height, 5 cm diameter) at the 0–5 cm depth. Gravimetric moisture was measured in four temporal replicates by collecting six auger samples (30–40 cm depth) and drying them at 105 °C for 24 h to obtain the water content by mass.
PR was assessed at 65 georeferenced points using a PLG 2040 digital penetrometer (Falker, Porto Alegre, Brazil), which records resistance at 1 cm intervals up to a depth of 60 cm (
Figure 3). Values were grouped into three layers: 1–10 cm, 11–20 cm, and 21–30 cm. All laboratory analyses were conducted at the Soil Physics Laboratory (AGROPECLAB) of UFVJM, following standard methodologies.
2.2.3. Multispectral Data Acquisition and Processing
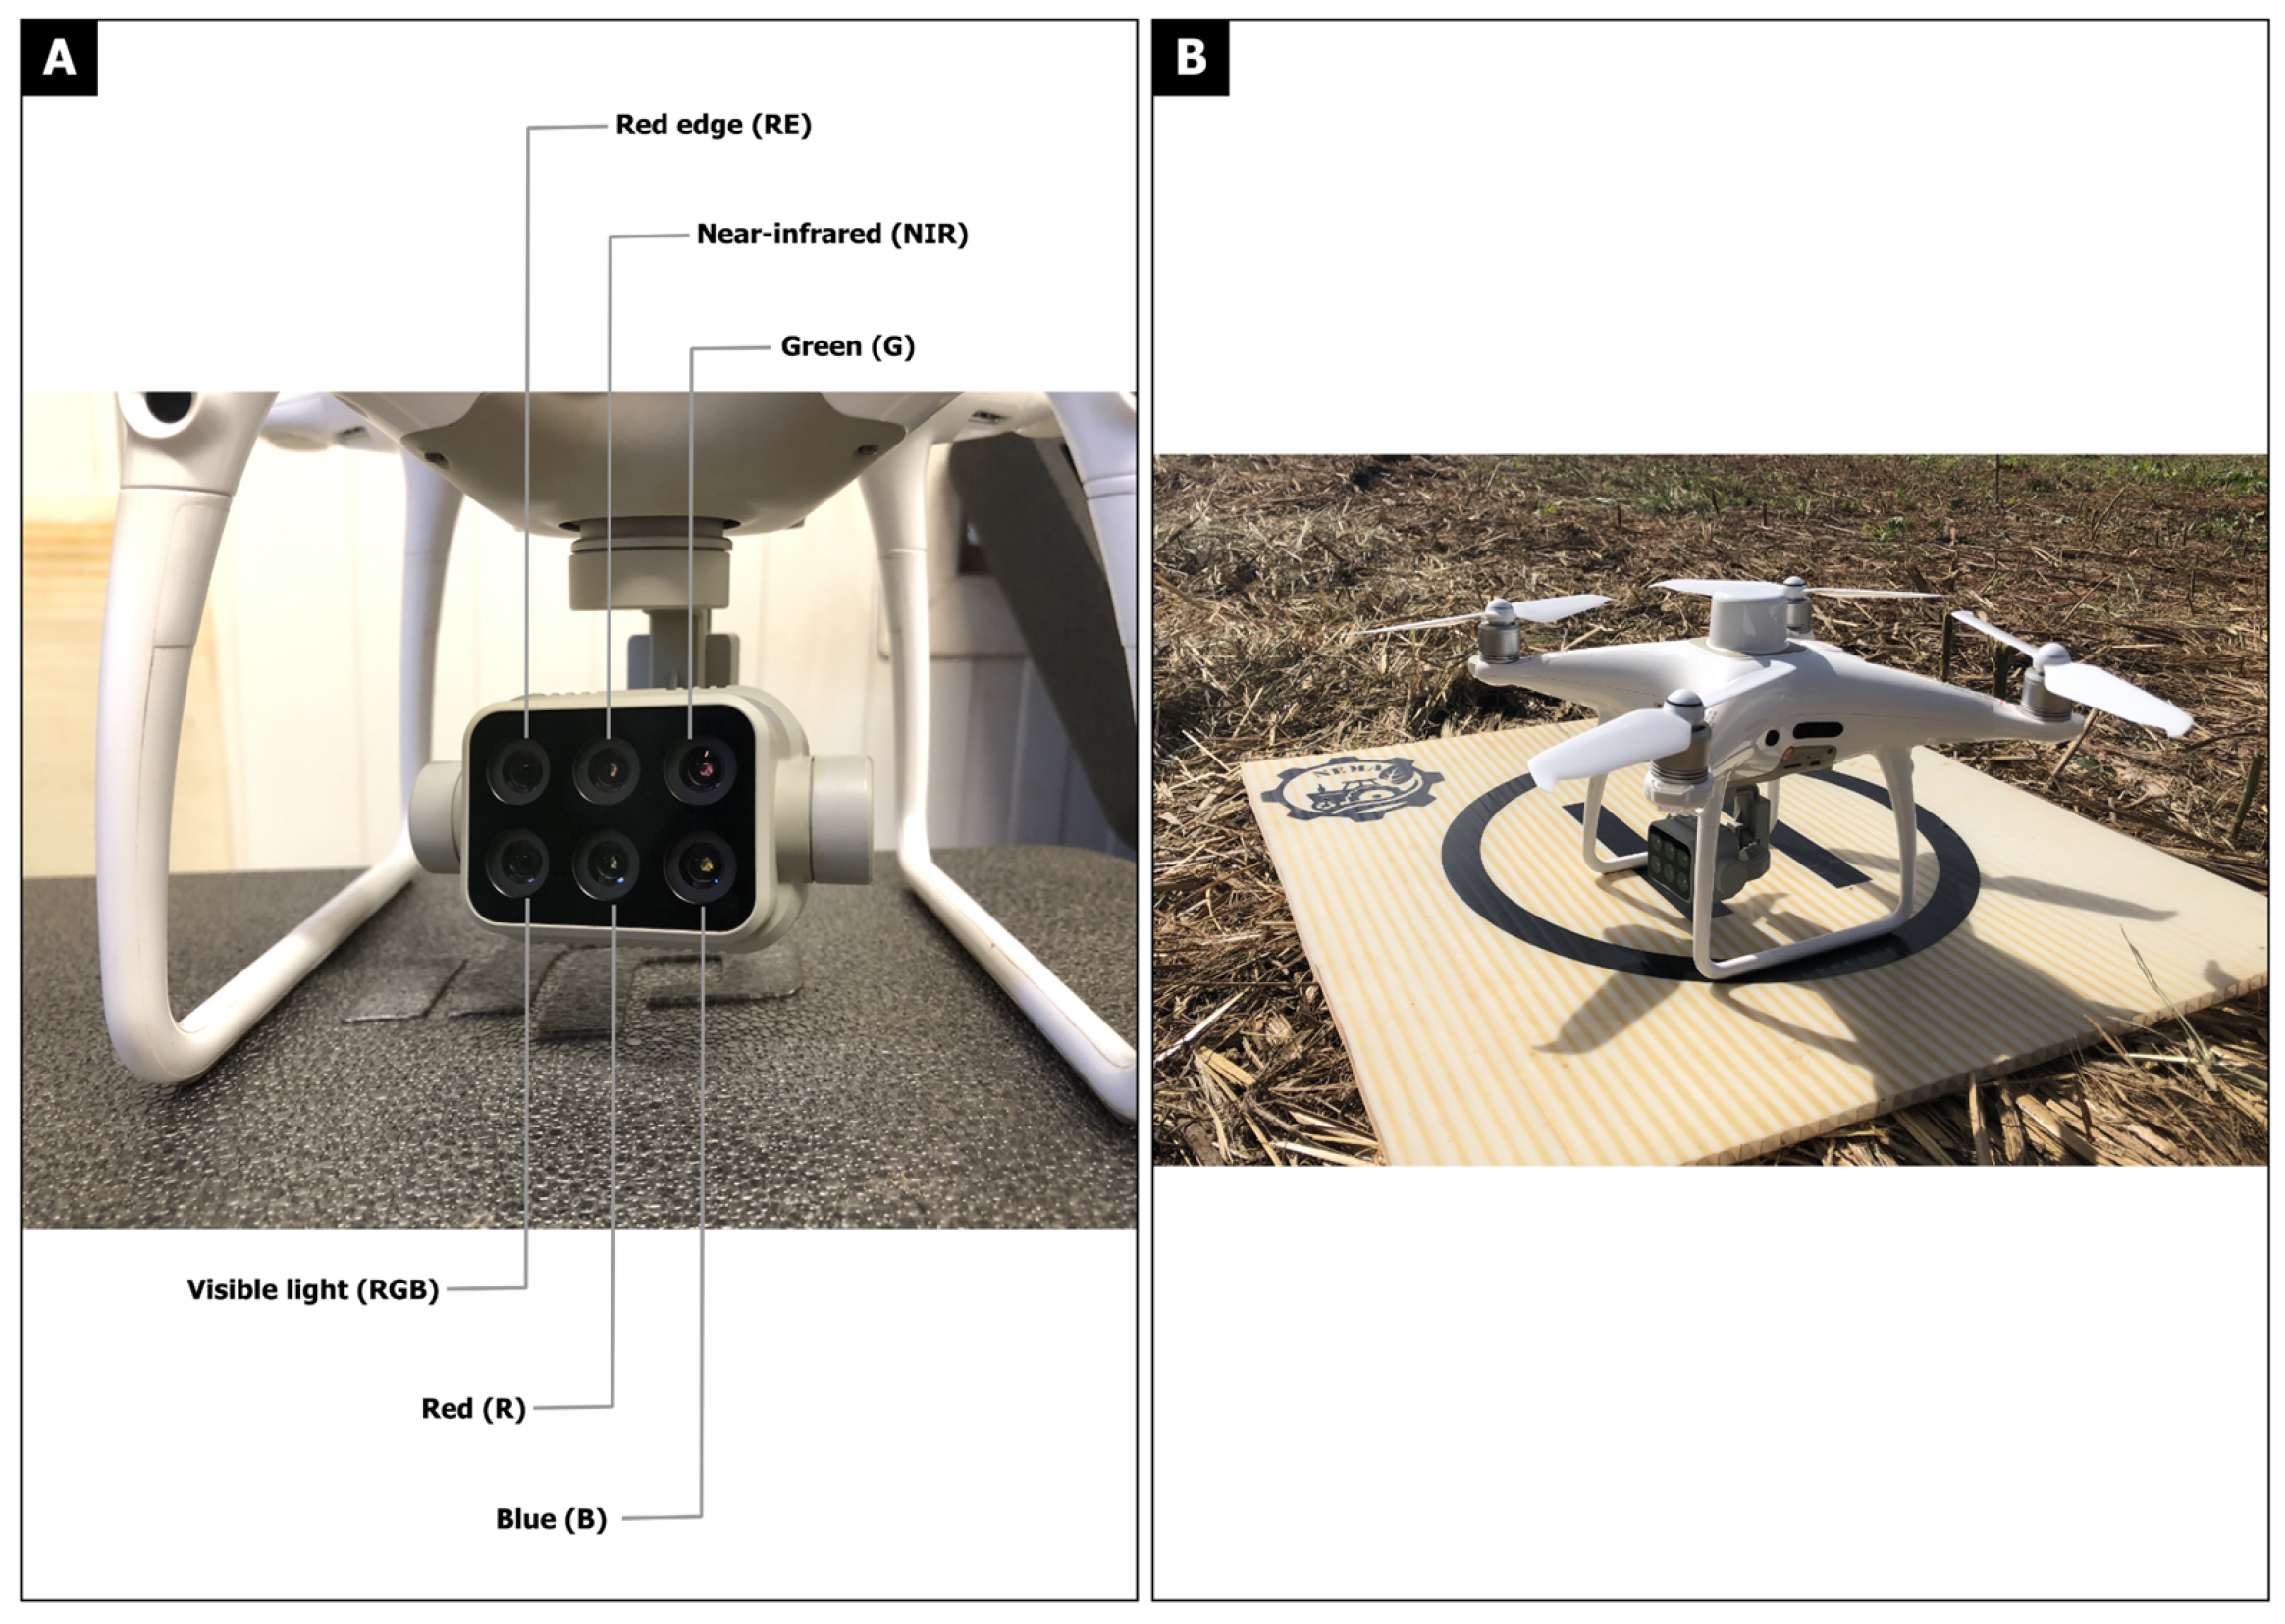
This study utilized a DJI Phantom 4 RTK Multiespectral (Shenzhen, China) (
Figure 4) drone featuring six 1/2.9″ CMOS sensors—five monochromatic narrowband sensors (450 ± 16 nm blue, 560 ± 16 nm green, 650 ± 16 nm red, 730 ± 16 nm red-edge, and 840 ± 26 nm NIR) plus one 48 MP 1-inch CMOS RGB sensor, all mounted on a 3-axis stabilized gimbal. The system incorporated a downwelling light sensor (DLS 2) for real-time solar irradiance measurement and automatic radiometric calibration, capturing 12-bit radiometric data with 2.08 MP resolution (1600 × 1300 pixels) per spectral band through a fixed 5.74 mm focal length lens (40 mm full-frame equivalent). The drone’s dual-frequency RTK GNSS receiver (GPS + GLONASS + GALILEO) provided ±1 cm horizontal positioning accuracy while maintaining less than 1% radiometric variation between sensors. Four drone flights were conducted immediately after irrigation and subsequently at 20 min intervals to monitor the temporal dynamics of surface moisture.
Flights were conducted at a height of 25 m, with 80% frontal and lateral overlap and 1.3 m/s flight speed. The drone was guided via the DJI GS PRO app, with GNSS correction provided by a D-RTK 2 mobile station. The resulting images were processed in Pix4DMapper 4.5.6 to generate orthomosaics and radiometrically corrected reflectance maps. The operations were conducted under stable atmospheric conditions (wind < 2 m/s, clear skies) between 12:13–13:50 h to minimize solar angle variations.
NDVI and NDWI were calculated using band algebra in QGIS Long Term Release (LTR)—version 3.40.6 ‘Bratislava’. The NDVI was derived from the near-infrared and red bands, while NDWI used the near-infrared and green bands according to Equations (1) and (2). All raster outputs were resampled to a ground sample distance (GSD) of approximately 1.15 cm for spatial analysis.
2.3. Geostatistical and Statistical Analysis
Descriptive statistics (mean, standard deviation, coefficient of variation) were calculated for all variables using Microsoft Excel. Inverse Distance Weighting (IDW) was used to interpolate gravimetric moisture and bulk density, while Ordinary Kriging was employed for irrigation depth and PR data due to its robustness in modeling spatial continuity.
Geostatistical analysis was conducted using ordinary kriging using the QGIS Smart-Map plugin (Pixel Size: 0.100, X; Y). The semivariogram models were fitted using theoretical spherical, exponential, Gaussian, and linear models, selected based on the nugget/plateau ratio (Co/Co + C), coefficient of determination (R2), and visual inspection of the residuals. The semivariogram’s structural parameters (nugget, plateau, and reach) were estimated individually for each variable and soil layer. To increase the robustness of the results, leave-one-out cross-validation was performed, in which each sample point is removed and re-estimated based on the others, allowing for quantification of predictive accuracy. The metrics used were the Mean Error (ME), which assesses predictor bias, and the Root Mean Square Error (RMSE), which expresses the average magnitude of the error.
NDWI rasters were cross-referenced with interpolated soil attribute maps to explore spatial correlations using raster algebra. Correlation strength was classified using standard thresholds, and the most representative flight time for each variable was identified based on overlap and visual comparison.
This methodological framework enabled the integration of field-collected data, spectral indices, and spatial modeling to assess the interactions between soil physical properties and irrigation performance in a precision agriculture context.
3. Results
3.1. Soil Moisture and Bulk Density Variability
Gravimetric soil moisture monitoring across four sampling intervals revealed significant temporal and spatial patterns in water distribution following irrigation (
Table 1).
The dataset showed a progressive moisture decline from an initial average of 0.1941 g g−1 to 0.1908 g g−1 in the final measurement, representing a 1.7% reduction over the observation period. Spatial analysis identified a distinct moisture gradient, with maximum values concentrated in the northwest quadrant (peak value 0.2692 g g−1 in Sample 2) and minimum values in the southeast sector (lowest reading 0.1272 g g−1 in Sample 1). The variability decreased over time, as evidenced by the reduction in coefficient variation from 17.77% (Sample 1) to 11.05% (Sample 4), suggesting progressive moisture homogenization through infiltration.
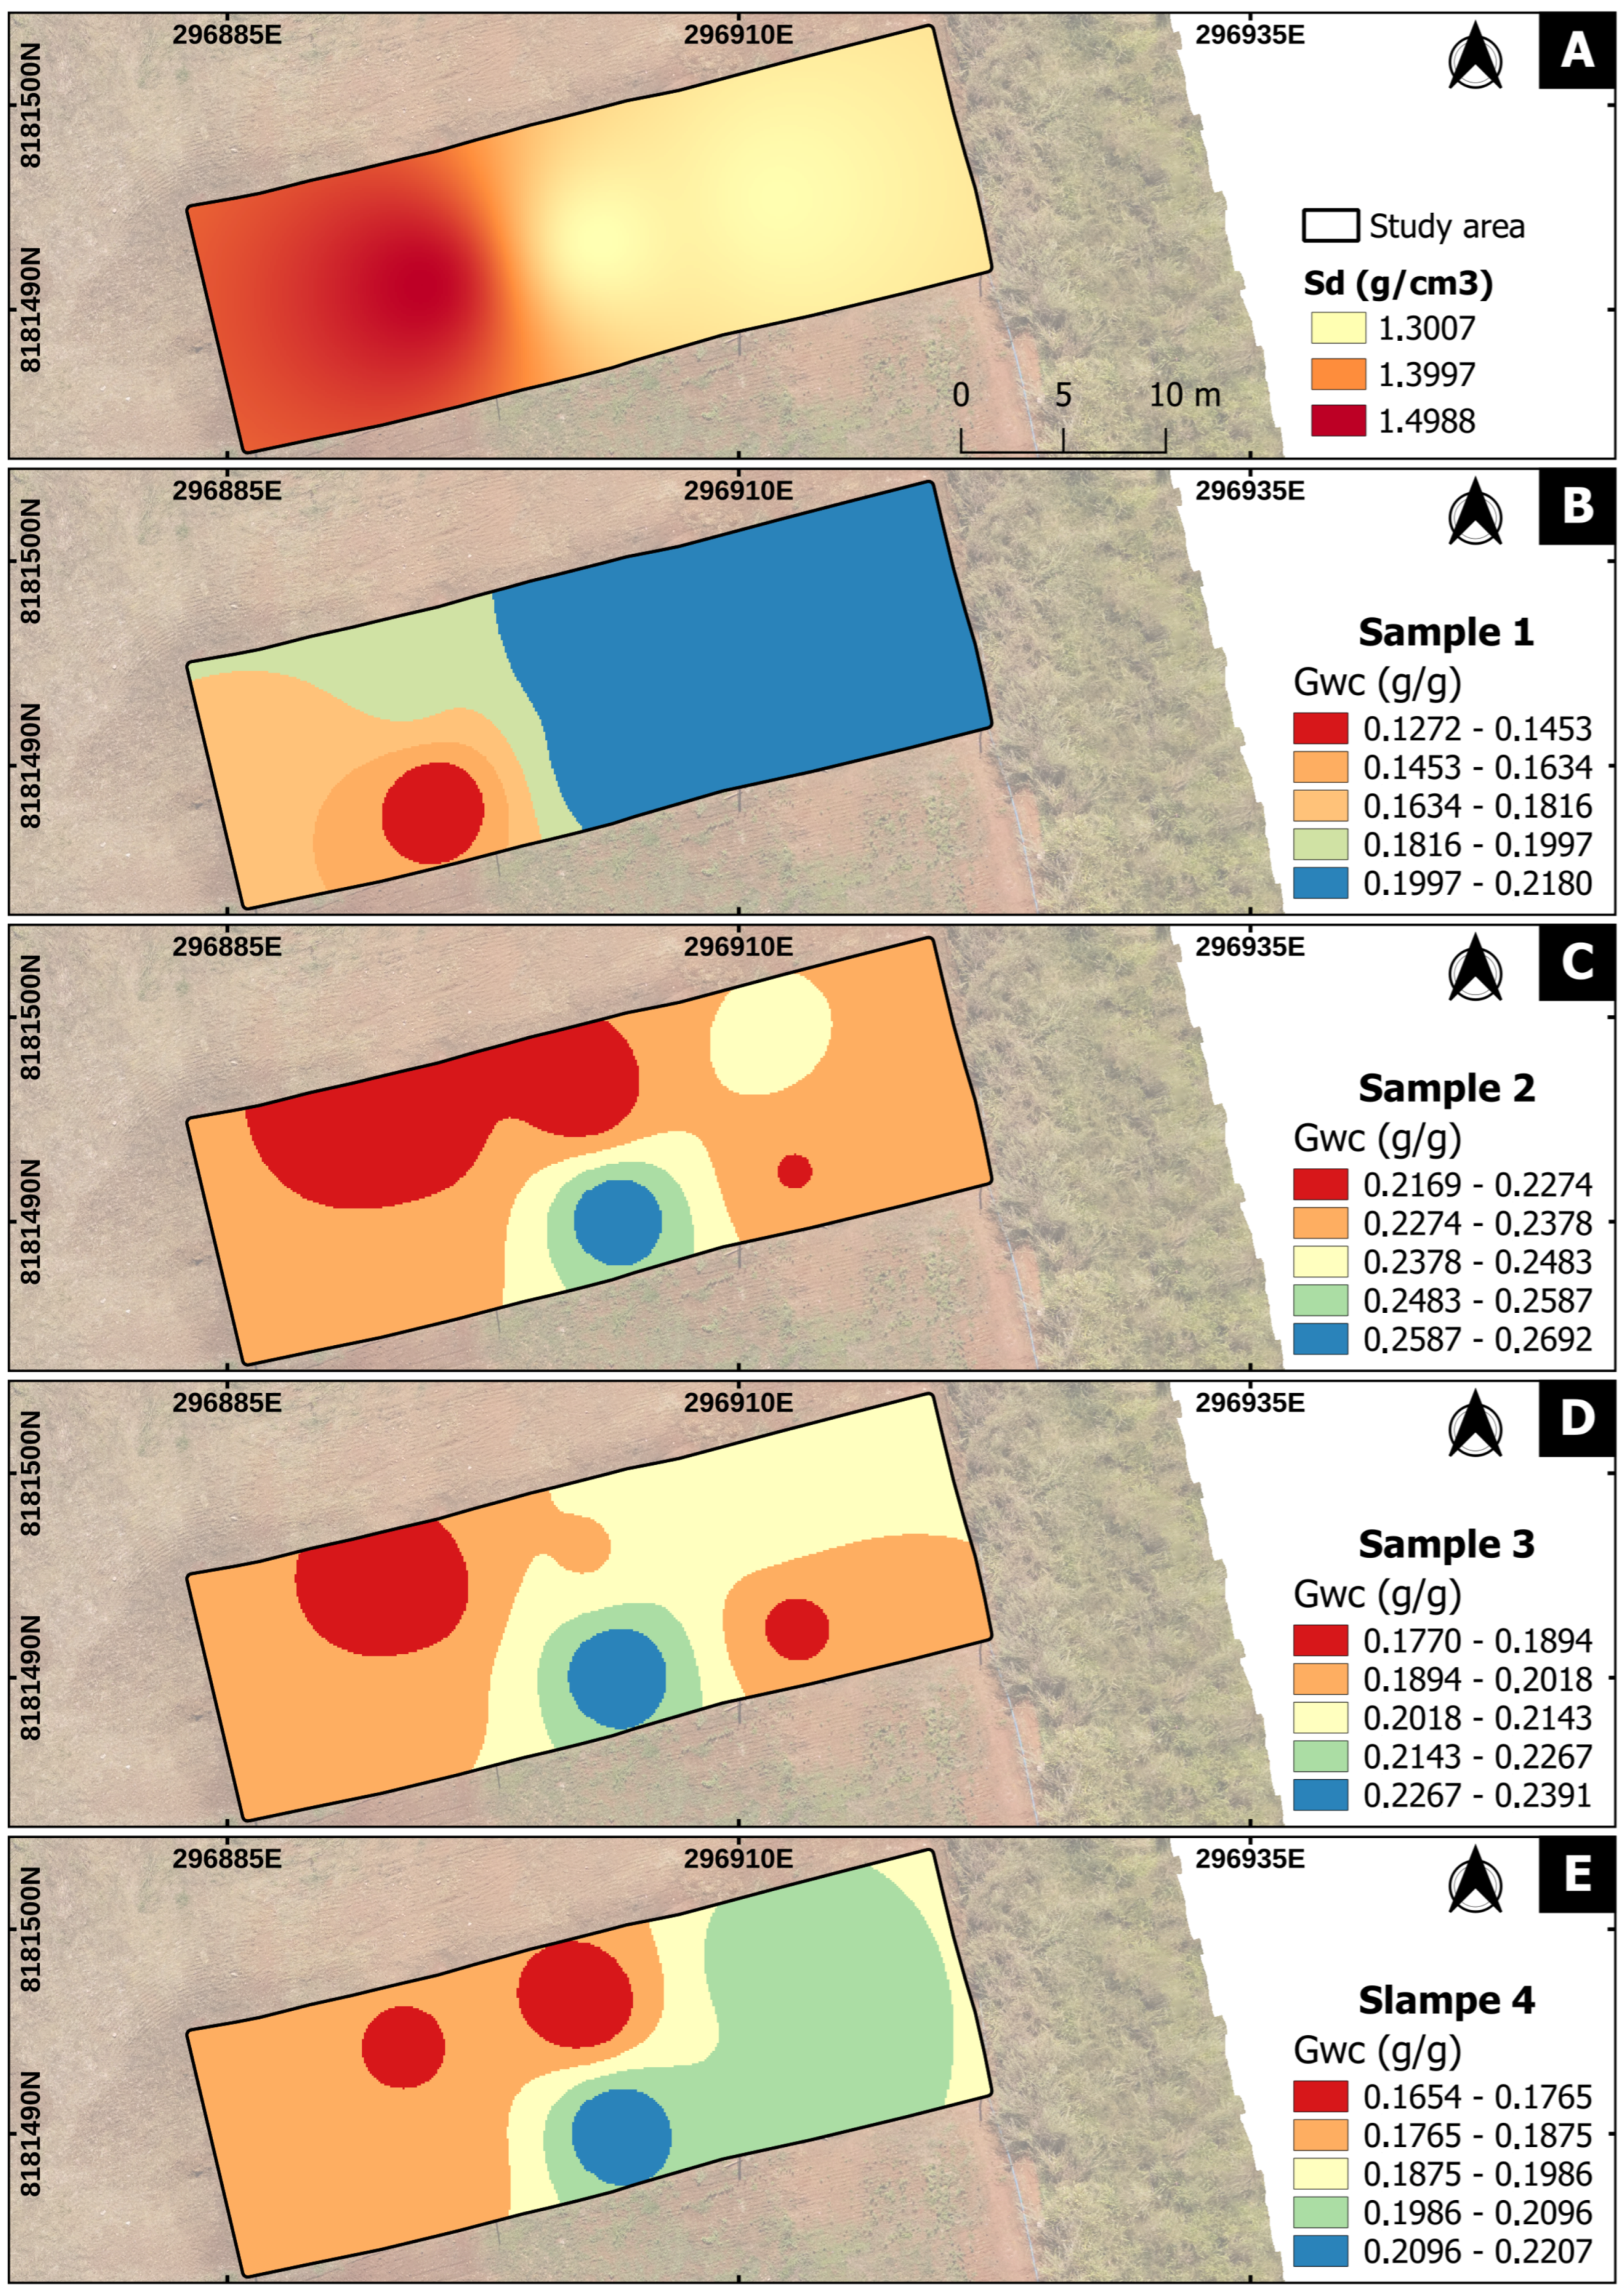
Figure 5A presents bulk density (Sd) values in the study area, interpolated in QGIS from three field-collected samples.
Figure 5B–E depict the temporal dynamics of gravimetric moisture (Gwc) across four post-irrigation sampling intervals, each aligned with RPA flights.
Bulk density (Sd) values in the study area, interpolated using QGIS from three field-collected samples, ranged from 1.3007 to 1.4988 g cm
−3, as shown in
Figure 5A. The highest density was observed at sampling point 3, located in the western sector of the plot, while the lowest value was associated with point 1, distributed from east to west. This spatial pattern reflects the presence of compaction zones in areas of higher Sd, which are typically associated with reduced porosity and lower infiltration potential. These areas coincide with regions of lower gravimetric moisture (Gwc), reinforcing the inverse relationship between bulk density and water retention capacity.
Figure 5B–E illustrate the temporal dynamics of gravimetric moisture (Gwc) across four post-irrigation sampling intervals aligned with RPA flights, revealing a progressive decrease in surface moisture over time, with drier zones associated with areas of higher bulk density, suggesting reduced infiltration due to compaction. The maps highlight zones of persistently lower moisture in areas of higher density, supporting the interpretation that compaction negatively influences the spatial uniformity of irrigation and soil water availability. These findings are consistent with compaction thresholds for Oxisols in comparable agroecological conditions and emphasize the importance of spatial monitoring for precision irrigation management. Regarding the gravimetric moisture variables (Gwc—samples 1 to 4), the adjustments of the variograms models were satisfactory in terms of spatial dependence (R
2 of up to 0.990), although some models presented a null nugget effect and RMSE close to zero, which is consistent with the low variability recorded in the field. In general, the linear models presented a better fit, with range values ranging from 10.7 to 17.1 m, demonstrating spatial dependence of short and medium distance.
3.2. Penetration Resistance and Compaction Zones
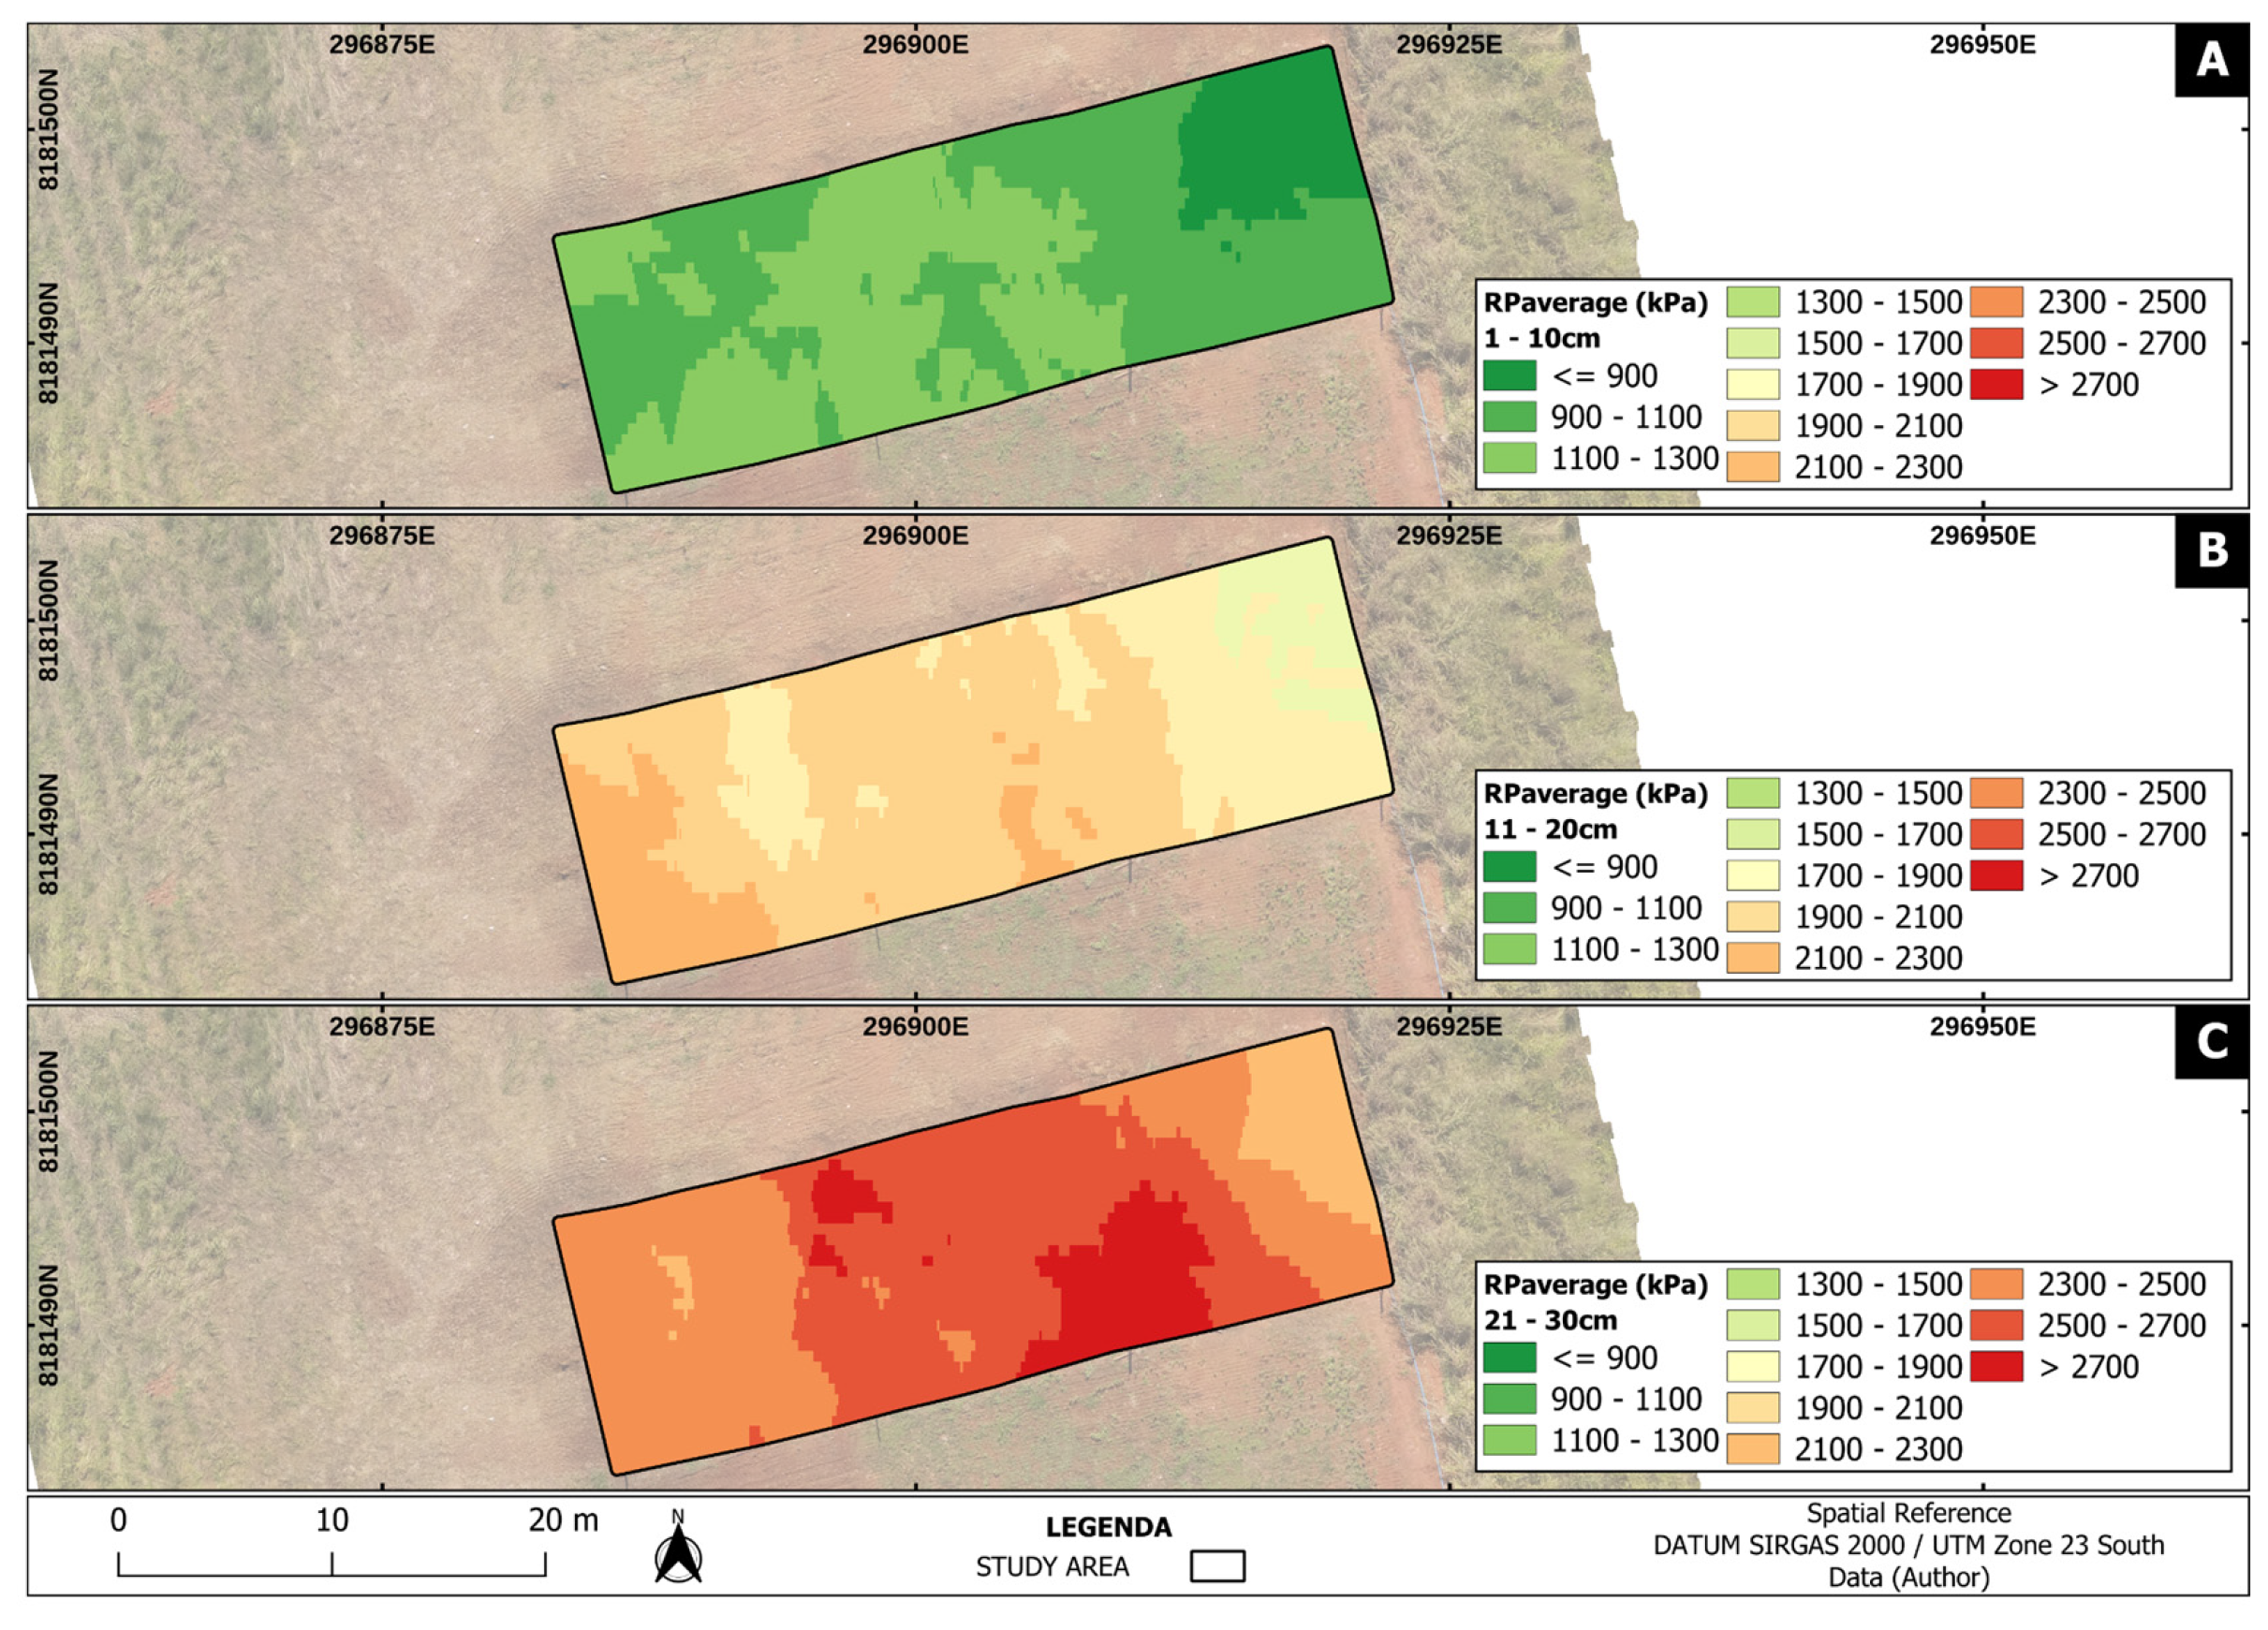
Figure 6 depicts the spatial distribution of soil penetration resistance (PR) at three depths, revealing a progressive increase in compaction with depth, with critical resistance values concentrated in the deepest layer.
Soil resistance to penetration (PR), measured at 65 georeferenced points, increased significantly with depth. At 1–10 cm, the average resistance was 1048.4 kPa, increasing to 1955.9 kPa at 11–20 cm and reaching 2489.8 kPa at 21–30 cm. Several measurements in deeper layers exceeded 3700 kPa, suggesting strong mechanical resistance to root growth and water infiltration. According to established agronomic criteria, PR values above 2000 kPa are considered limiting for most crop roots, particularly in dense subsoil layers.
The spatial distribution of PR revealed critical compaction zones, especially in the central and eastern regions. These zones may have developed due to repeated machinery traffic, especially during land leveling and seedbed preparation. Cross-validation of the interpolation models indicated variable predictive performance across depths, with low coefficients of determination (R2 = 0.034–0.341) and high root mean square error values (RMSE = 2.31–5.43 × 10⁹ kPa), reflecting the high spatial heterogeneity of subsurface soil attributes. Despite the magnitude of the errors, the mean error (ME) was close to zero, indicating no systematic bias in the estimates. Although the absolute RMSE values were high, the interpolated maps successfully captured consistent spatial patterns and identified critical compaction hotspots—which was the primary objective of the spatial modeling in the context of site-specific management. These results highlight that the uncertainty is inherent to modeling soil properties with high intrinsic variability and does not preclude the agronomic utility of the outputs to support targeted soil intervention strategies, such as subsoiling or the use of cover crops with high root biomass to promote biological decompaction.
3.3. Irrigation Uniformity
Figure 7 shows the spatial distribution of conventional sprinkler irrigation depth in the experimental area, based on measurements from 65 collectors.
The water depths collected from the 65 collectors ranged from 7.3 mm to 8.8 mm, indicating notable variability in the irrigation application (
Figure 7). Although the average depth was within the target range, the central region consistently received less water than the plot edges. The most uniform distribution was found in the northwest quadrant, matching the area of higher gravimetric moisture and lower bulk density.
The Gaussian variogram model applied to the irrigation depth data yielded an R2 of 0.89 and RMSE of 3085 and revealed strong spatial dependence up to a range of approximately 15 m, confirming the consistency of the interpolation. This indicates that the variability is not random but follows a structured pattern, possibly influenced by sprinkler overlapping efficiency and wind direction during irrigation. Such insights are valuable for redesigning sprinkler layouts or adjusting pressure regulators to improve uniformity.
3.4. NDVI and NDWI Dynamics
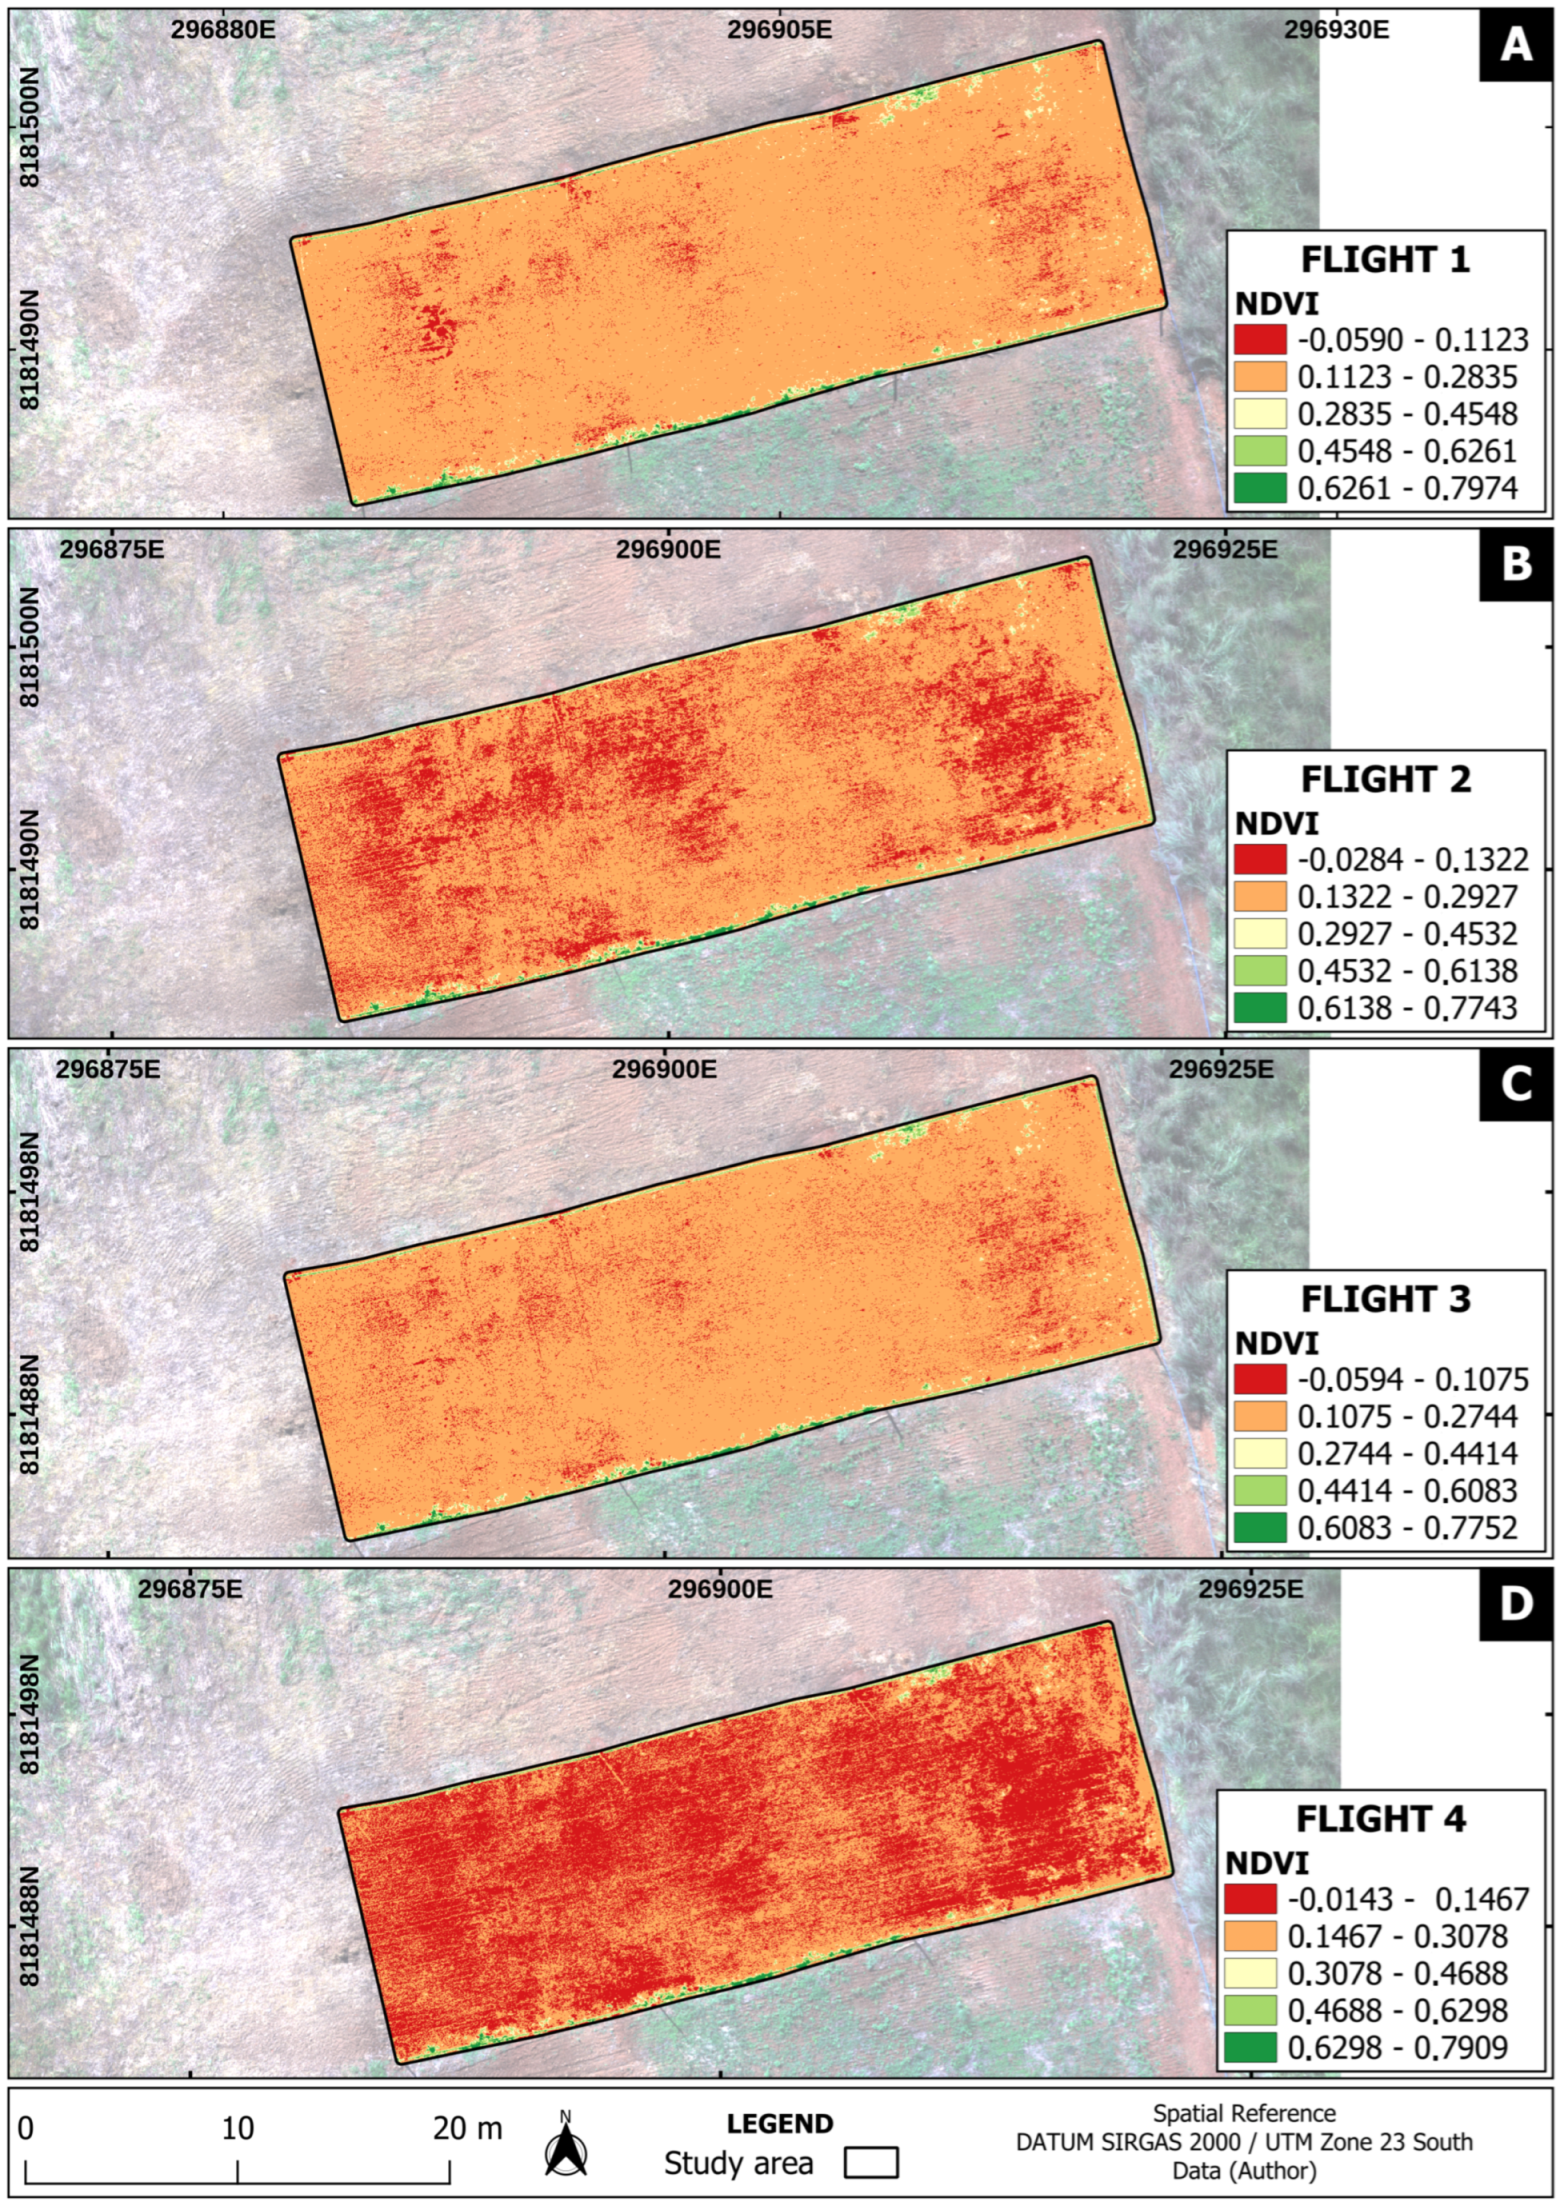
NDVI values obtained (
Figure 8) from the four sequential drone flights were consistently low due to the dominance of straw cover and bare soil conditions.
The NDVI class ranging from 0.11 to 0.28 covered up to 89.7% of the area, suggesting minimal vegetative activity. However, NDVI still played a role in distinguishing areas with spontaneous vegetation along plot borders, where slightly higher values were recorded.
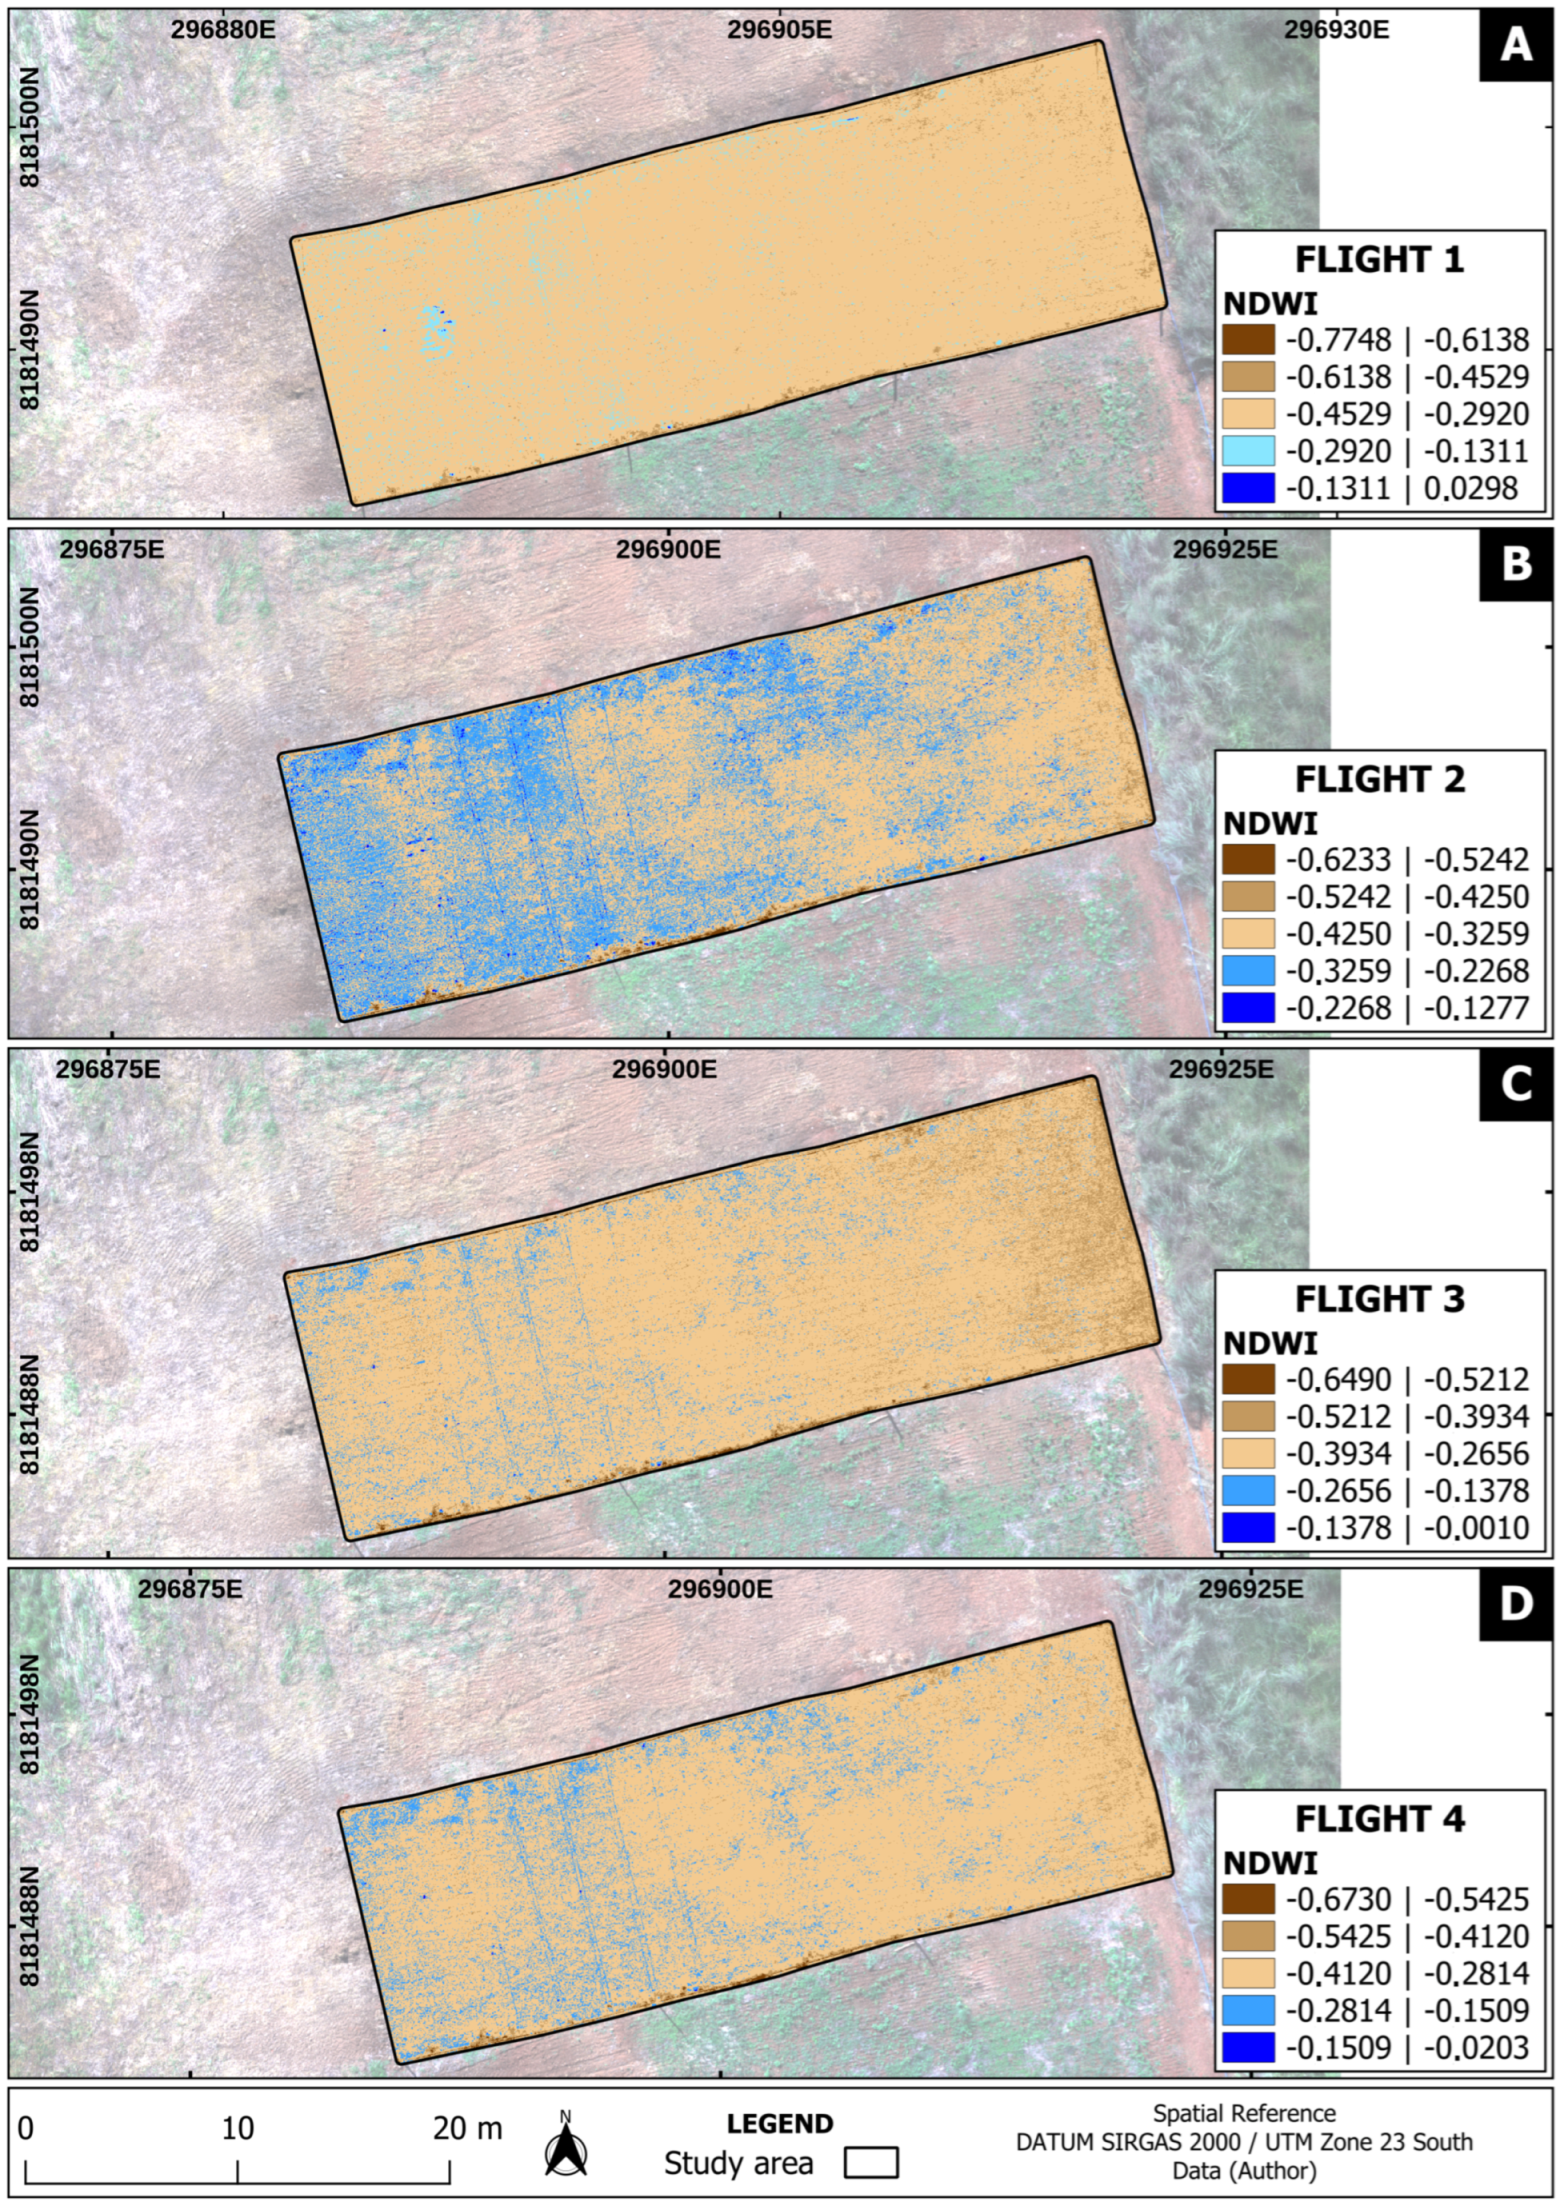
Figure 9 illustrates the temporal variation in NDWI, which was highly responsive to surface moisture dynamics.
Initial values reached 0.03 immediately after irrigation and declined to −0.02 by the fourth flight, reflecting ongoing evaporation and infiltration processes. Spatial NDWI maps were consistent with gravimetric moisture data, particularly in identifying wetter zones during the first and second flights. The strongest correspondence occurred 60 min post-irrigation, indicating this as an ideal time point for RPA-based moisture assessment.
3.5. Spatial Correlation of Spectral and Soil Data
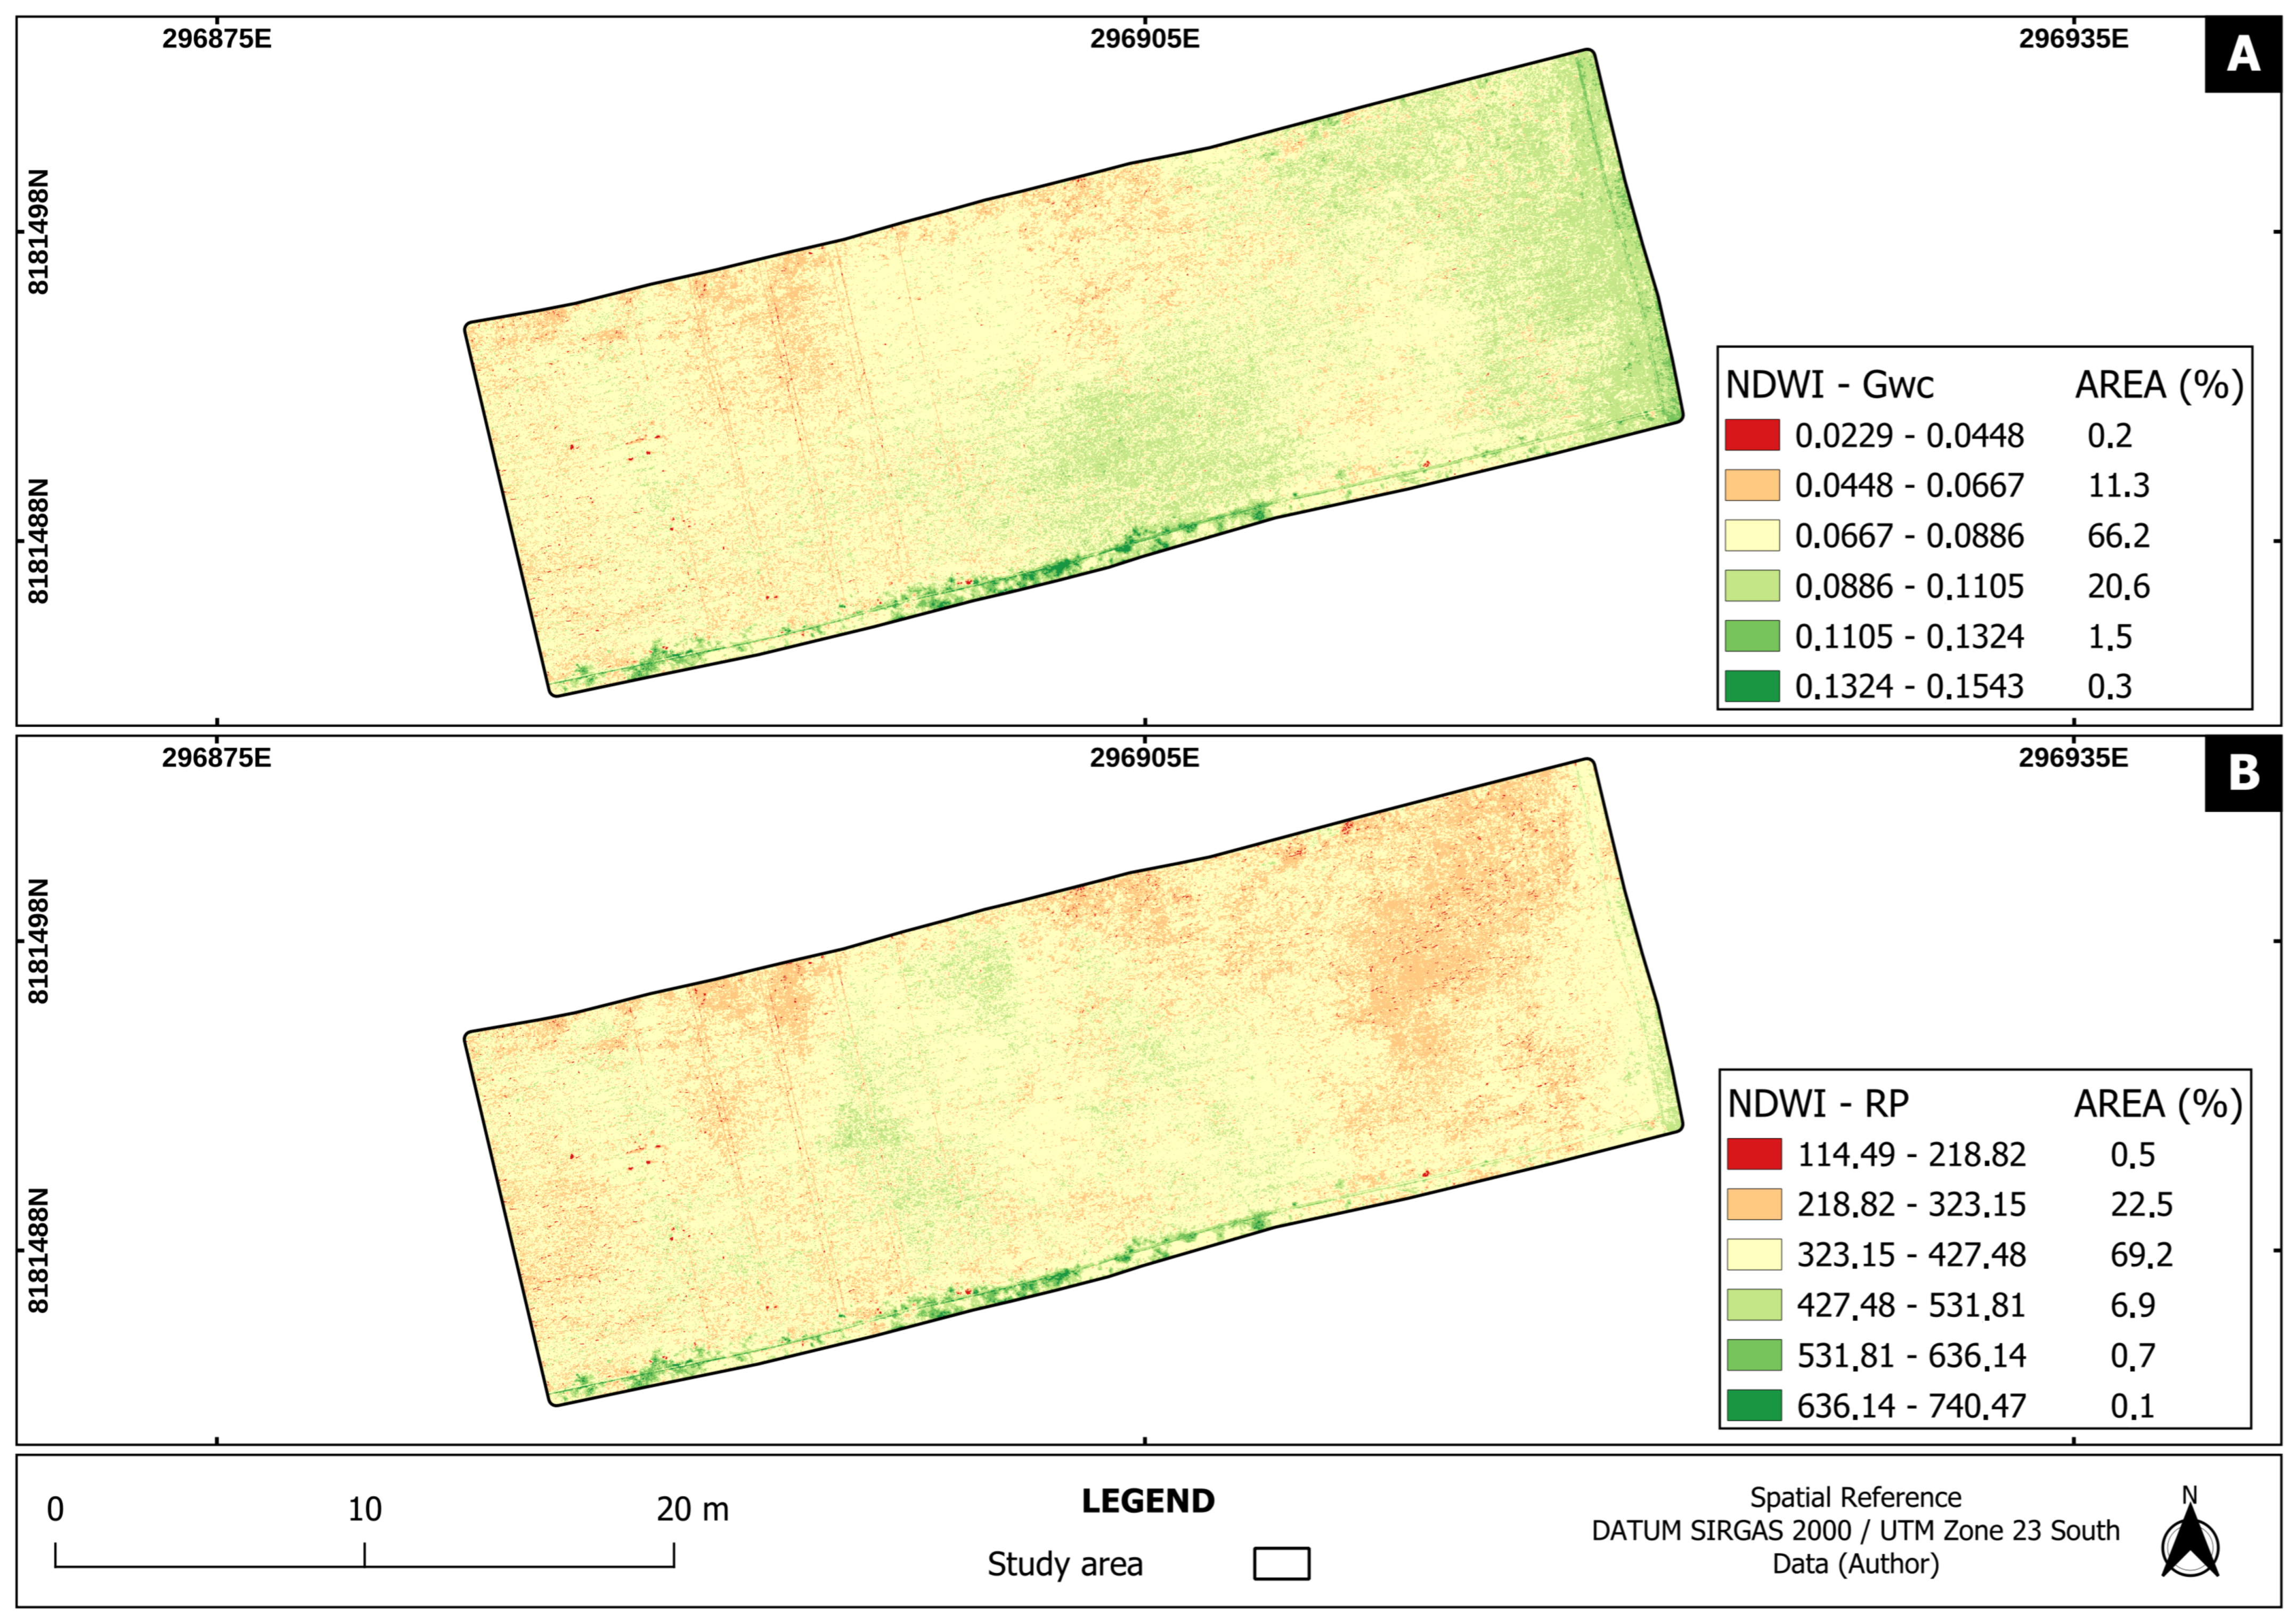
Figure 10 presents the raster correlation between NDWI and gravimetric moisture (A) and Correlation between NDWI and penetration resistant (B).
Raster correlation analysis between NDWI and gravimetric moisture (
Figure 10A) revealed a moderate spatial correlation—particularly during the second flight, when 66.2% of the area showed coefficients between 0.0667 and 0.0886. These correlated zones coincided with areas of low bulk density and high infiltration capacity, reinforcing NDWI’s potential as a proxy for short-term moisture distribution in bare soil.
Correlation between NDWI and PR (1–10 cm) (
Figure 10B) was weaker but still revealed consistent spatial patterns. Areas with high PR values generally showed lower NDWI, suggesting limited surface moisture retention in compacted zones. However, the spectral sensitivity of NDWI decreases with depth, which may explain the limited correlation with deeper PR measurements.
4. Discussion
The spatial variability observed in the physical soil attributes and irrigation application underscores the complexity of water–soil interactions in conventional sprinkler systems. Moisture gradients across the field highlight the combined influence of soil structure, compaction, and irrigation uniformity on infiltration behavior, aligning with the findings by [
28] on heterogeneous water distribution in pressurized systems. Regions with higher bulk density showed limited water retention, consistent with the literature that identifies compaction as a major barrier to effective infiltration and root development [
29,
30].
These findings corroborate those of [
31], who quantified significant impacts of compaction: a 10–20% increase in soil density reduced water storage capacity by 3–49% and cumulative infiltration by 55–82%. These results demonstrate that even moderate increases in compaction can drastically compromise soil hydrological dynamics, reinforcing the need for specific management strategies for critical zones.
The results for penetration resistance confirmed the existence of subsurface compaction zones, with values frequently exceeding agronomic thresholds above 2000 kPa exceeding critical thresholds for root growth [
32]. These areas require management strategies that go beyond traditional tillage, including mechanical decompaction, organic residue incorporation, or the use of species with aggressive root systems [
33], though their cost–benefit trade-offs warrant further study [
34]. Mapping these zones enables the implementation of precision soil management and reduces unnecessary operations in non-compacted areas.
Non-uniform water application observed through collector data and confirmed by spatial models reveals inefficiencies in the irrigation system that are not always detectable by average application rates. The high R
2 value of the Gaussian variogram model supports the existence of structured spatial variability, also reported by [
35,
36] in center-pivot systems which can be mitigated through optimized sprinkler positioning or dynamic pressure regulation [
37].
Ref. [
38] emphasizes that accurate irrigation practices informed by UAV-derived data have the potential to significantly improve water application efficiency, a crucial factor for sustainable agriculture and water conservation efforts in a world facing increasing water scarcity. This reinforces the importance of integrating spatial analysis into irrigation system evaluation.
Multispectral indices, particularly NDWI, proved effective in tracking short-term moisture changes. The index’s responsiveness within the first hour after irrigation suggests that this is the optimal time window for RPA data acquisition when assessing surface wetness—a finding corroborated by [
39] for RPA-based monitoring. The results obtained are consistent with [
40], who determined the optimal period for soil moisture assessment using UAV multispectral data in irrigated systems annual crops. However, our study provides advances by demonstrating that this time range is also effective under conditions of minimal vegetation, thus expanding the potential applications of the method. This spatial correspondence indicates that NDWI can reasonably reflect the surface moisture distribution in exposed soils, especially in regions with low bulk density and high infiltration capacity. These results reinforce the potential of NDWI as a proxy for short-term moisture monitoring, offering a practical tool for hydrological studies and soil management at the landscape scale.
The ability of NDWI to identify areas of higher moisture content in the first flights has relevant practical implications, including (i) early detection of irregularities in irrigation uniformity, (ii) identification of areas with infiltration restrictions, and (iii) support for real-time adjustments in irrigation systems. However, the decrease in correlation observed after the third flight indicates that NDWI is more suitable for short-term monitoring, as highlighted by [
41] in soils with high evaporation rates.
While NDVI was less informative due to minimal vegetation, it provided useful context in identifying plot borders and vegetation remnants [
42].
The observed low NDVI values are consistent with the limited vegetation cover in the experimental area, where soil exposure was predominant. While this reduces the direct use of NDVI as a vegetation vigor indicator, its interpretation in this context remains relevant: it confirms the minimal spectral contribution of vegetation to the overall reflectance signal.
This information is important because it supports the interpretation of NDWI and soil-related indices, ensuring that variations in spectral response can be more confidently attributed to soil moisture and irrigation effects rather than to vegetation dynamics. Thus, NDVI, even with low values, plays a complementary role by delimiting the influence of vegetation and reinforcing the reliability of NDWI and geostatistical analyses focused on irrigation performance.
The integration of remote sensing, geostatistics, and direct soil measurements provides a comprehensive framework for irrigation and soil diagnostics, as advocated by [
43]. This multidisciplinary approach supports the development of localized interventions aimed at improving water use efficiency, reducing energy inputs, and promoting sustainable soil use in irrigated agriculture.
5. Conclusions
The integrated use of multispectral data from RPAs and georeferenced field measurements proved effective for evaluating the spatial variability of water distribution and soil physical conditions under sprinkler irrigation. NDWI values decreased from 0.03 to −0.02 across four flights, indicating surface moisture reduction due to infiltration and evaporation. This trend was consistent with the gravimetric moisture decline from 0.194 g g−1 to 0.191 g g−1, confirming the sensitivity of NDWI to short-term moisture dynamics, especially 60 min after irrigation. Bulk density values between 1.30 and 1.50 g cm−3 and penetration resistance above 2400 kPa indicated compaction zones that can restrict infiltration and root growth, while irrigation depths (7.3 to 8.8 mm) revealed moderate spatial variability.
The combination of remote sensing and geostatistical tools enabled the identification of areas with inefficient water distribution and soil limitations. This approach supports site-specific management and contributes to optimizing irrigation performance.
The integration of monitoring technologies has been recently studied, so this research presents itself as a starting point for other analyses, such as the integration of different sensors, types of surface irrigation, and types of agricultural environments.
Future applications should explore the method in different soil and crop conditions and assess its potential for integration with predictive models and automation strategies in precision agriculture.
