Abstract
The potential for energy efficiency in office buildings is critical, especially in regions facing rapid climate change impacts. This study investigates the use of phase change materials (PCMs) and double-skin façades (DSFs) to optimize energy performance in office buildings in Iran, a country with significant energy demands for heating and cooling. Utilizing Building Information Modeling (BIM) and EnergyPlus 24.1.0 software, we evaluated energy consumption trends across climate scenarios from 1981 to 2030. The findings underscore the rising energy demand due to global temperature increases and demonstrate that integrating PCMs and DSFs can mitigate energy consumption. This research highlights the importance of region-specific building strategies to achieve energy-efficient designs and contributes practical insights for developing sustainable energy policies in Iran.
1. Introduction
Recent data from the Intergovernmental Panel on Climate Change (IPCC) and other climate sources show that global temperatures have already increased by approximately 1.1 °C above pre-industrial levels, with projections suggesting that under high-emission scenarios, the rise could reach between 3.3 °C and 5.7 °C by 2100. In 2023, global surface temperatures reached record highs, ranging between 1.34 °C and 1.54 °C above pre-industrial levels. The rapid warming, particularly over land areas, continues to outpace earlier estimates, and the IPCC warns that surpassing the 1.5 °C threshold could happen as early as 2040 if emissions are not drastically reduced [1,2]. As climate change predicts that summers will be hotter and winters warmer in the next 100 years, currently designed buildings and many existing buildings will have to deal with future weather conditions. According to Cemesova et al. [3], climate change is unavoidable, and anthropogenic greenhouse gases have primarily caused it. The construction industry’s inefficiency has been criticized because it generates too much waste, emits significant amounts of greenhouse gases, and consumes too much energy compared to other industries [4]. Globally, buildings consume 117 exajoules (EJs), or 32% of the final global energy, 25% of greenhouse gas (GHG) emissions, and 51% of global electricity. Additionally, by 2050, heating and cooling energy use in commercial and residential buildings is prognosticated to grow by 79% and 83%, respectively [5,6]. Furthermore, the construction sector is responsible for excessive energy consumption, and its public demand is anticipated to increase in the coming years.
Among developing countries, Iran stands out with buildings accounting for 41% of the nation’s overall energy demand. Within the building sector, 61% of the total energy consumption is dedicated to heating and cooling systems, making this the largest contributor to the country’s energy use. This high demand for thermal regulation highlights the critical importance of improving energy efficiency in the building sector, particularly as Iran faces increasing energy challenges due to climate change and rapid urbanization [7]. In other words, in Iran, a significant proportion of operational energy consumption in buildings is related to thermal needs, primarily for heating and cooling. This emphasizes the importance of studying the thermal energy aspects of buildings in regions with similar climates. However, it is acknowledged that this pattern may differ in other parts of the world where energy consumption patterns in buildings are more diversified and thermal energy does not constitute the majority of operational consumption [8]. Thus, it is foreseen that forthcoming constructions will aim for net-zero operational carbon, which refers to achieving a balance between the carbon emissions from building operations, such as heating, cooling, and electricity, and the amount of carbon sequestered or offset. This is distinct from embodied carbon, which refers to the emissions generated during the construction process and the production of materials. In this context, a “net-zero operational carbon home” ensures that the energy consumed during building operations results in net-zero carbon dioxide emissions [9]. Growth is required in infrastructure, especially in residential building developments, as a priority in urbanization development. Simultaneously, increasing concerns exist regarding the impact of construction on the economy, society, and environment [10]. Therefore, green buildings, eco-architecture, and sustainable buildings have changed the approach of building designers and homebuyers [11].
Green buildings are structures designed to reduce the environmental impact through the efficient use of resources and energy. They incorporate sustainable materials, energy-efficient systems, and waste reduction strategies throughout their life cycle. The key features include renewable energy integration, water conservation measures, and improved indoor environmental quality. The primary objective is to minimize the ecological footprint while enhancing occupant health and productivity [12]. Eco-architecture emphasizes harmony between the built environment and the natural world. This approach integrates natural elements into architectural design, promoting biodiversity and enhancing the well-being of occupants. Features often include green roofs, living walls, and the strategic use of natural light and ventilation. Eco-architecture seeks to create buildings that are not only energy-efficient but also contribute positively to the surrounding ecosystem [13]. Sustainable buildings encompass a broader concept that includes economic and social sustainability alongside environmental considerations. These buildings are designed to meet present needs without compromising the ability of future generations to meet theirs. This involves the use of durable materials, adaptability to changing needs, and the promotion of occupant health and productivity. Sustainable buildings often adhere to certification standards such as LEED or BREEAM, which assess various sustainability criteria [14]. The adoption of these concepts has significantly influenced building designers and homebuyers. Designers are increasingly integrating sustainable practices into their projects, focusing on energy efficiency, material selection, and the overall environmental impact of their designs. This shift is driven by both regulatory requirements and a growing awareness of environmental issues. Homebuyers, on the other hand, are showing a preference for properties that offer sustainability features, recognizing the long-term benefits such as reduced utility costs, improved indoor air quality, and enhanced resale value. This trend reflects a broader societal movement towards environmental responsibility and sustainable living.
Various green building certification systems have been developed to promote both sustainability and the well-being of occupants. Among these, the WELL and LEED standards have gained prominence due to their comprehensive approaches. The WELL standard emphasizes human health, comfort, and well-being, particularly focusing on indoor environmental quality (IEQ) factors such as air quality, thermal comfort, lighting, and acoustics. This standard is designed to enhance occupant satisfaction and overall health outcomes by creating environments that support mental and physical well-being. In contrast, the LEED standard adopts a more holistic approach, integrating sustainability objectives with IEQ parameters. While LEED certifications focus primarily on energy efficiency, water conservation, and the use of sustainable materials, they also include credits dedicated to enhancing the indoor environment through measures such as improved ventilation, natural lighting, and thermal control [15]. Both standards play crucial roles in building design, with WELL being particularly aligned with health-centric design criteria and LEED providing a broader framework that addresses both sustainability and indoor environmental quality. As a result, buildings certified under either system tend to exhibit enhanced environmental performance and occupant satisfaction compared to non-certified buildings. Certification systems such as Green Star in Australia, DGNB in Germany, and BREEAM in the United Kingdom similarly incorporate these dual goals of sustainability and occupant health, demonstrating the growing global emphasis on the importance of designing buildings that are not only environmentally responsible but also conducive to occupant well-being [16]. However, many individuals consider that the prior design stages play an essential role in the stability of buildings, allowing access to information defining a building, such as its form, materialization, and technical systems. Regrettably, the CAD system generally cannot maintain the integral perspectives of construction [17].
The need for this study arises from the critical interplay between climate change and energy consumption in the built environment. As global temperatures rise, driven by anthropogenic activities, the energy demand for both heating and cooling in buildings is expected to increase significantly. This trend is particularly concerning in countries like Iran, where over 60% of a building’s energy consumption is dedicated to thermal regulation. The construction industry, a significant contributor to greenhouse gas emissions, is under pressure to adopt more sustainable practices to mitigate its environmental impact. In this context, Building Information Modeling (BIM) offers a promising solution by allowing for detailed energy simulations and sustainability assessments throughout the building’s life cycle. This research aims to quantify the implications of climate change on building energy consumption through a comprehensive analysis using Building Information Modeling (BIM). By modeling a five-story residential building located in Tabriz, Iran, and applying advanced materials such as phase change materials (PCMs) and double-skin façades (DSFs), this study evaluates the effectiveness of these strategies in mitigating energy use. The conclusions drawn emphasize that integrating PCMs and DSFs can contribute significantly to energy efficiency, offering a potential pathway for sustainable building design in regions with similar climatic conditions. These insights provide a foundation for future applications in energy-efficient residential construction and align with broader global sustainability efforts.
2. Literature Review
According to Seow et al. [18], 80% of a product’s environmental damage occurs after only 20% of its design phase. Building Information Modeling (BIM) allows for the integration of multidisciplinary data throughout the design process, promoting sustainability and performance analysis [8,19]. BIM can be defined as a framework that enhances building design and construction strategies through computer-aided modeling and simulation, ensuring the unified management of graphical and informational data, fostering team collaboration, and optimizing life cycle operations for efficiency and cost reduction [20].
Architects aim to create energy-efficient environments that minimize carbon emissions by reducing the need for excessive heating or cooling [21]. Sustainable building designs are increasingly demanded due to rising climate change concerns. The rapid evaluation of design options and optimization requires advanced tools such as energy modeling and natural ventilation analysis that access distributed data sources [11]. “Green BIM” links these models to sustainable building practices, allowing for the generation of data that meet energy efficiency and sustainability objectives through 3D models [22,23]. With increasing attention to the impact and consumption of non-renewable resources, BIM is increasingly used to predict and monitor the environmental impact of construction [24]. BIM’s sixth dimension (6D) integrates energy analysis into early project planning, enabling project teams to evaluate energy performance and sustainability trade-offs by connecting BIM data with decision-making tools [22,25]. This capability supports assessing both direct and indirect environmental impacts, thus promoting long-term project sustainability [26,27]. Atik et al. [28] noted that BIM integrated with LCA has been pivotal for data-driven decision-making, enhancing design outcomes. Potrč Obrecht, et al. [29] emphasized that early LCA integration supports sustainable material selection and life cycle impact reduction.
Houde [30] detailed that BIM’s simulation capabilities, coupled with tools like Tally, precisely evaluate carbon footprints at the conceptual stage. Jrade and Jalaei [31] highlighted that BIM-based LCA supports strategic design decisions to minimize emissions. Kim, et al. [32] researched window positioning’s effect on energy performance using Revit and Green Building Studio, finding that the lowest energy load occurred when windows were at mid-height, with the east-facing position impacting energy the most. BIM can thus be used to design scenarios that optimize building performance and reduce energy consumption, supporting the move toward zero-carbon buildings. The authors of [33] mentioned that BIM technology could be utilized in controlling building performance to design scenarios that would enable energy savings to be maximized towards zero-carbon buildings. Alhazzaa and Yan [34] demonstrated that using parametric tools within BIM allows iterative design evaluations, optimizing thermal performance. Hasan [35] reported that energy consumption could be reduced by up to 60%, with costs cut by 50%, when energy use is analyzed and optimized in the preliminary design phase using BIM-based tools like Insight.
Energy efficiency improvements in existing buildings can also be achieved by optimizing factors such as insulation, lighting, daylight utilization, and photovoltaic panel efficiency. Bonomolo, et al. [36] proposed a new energy simulation methodology based on BIM using Graphisoft’s BIM software ArchiCAD 21 and the plug-in for dynamic energy simulation EcoDesigner STAR plug-in. Ghaffarianhoseini, et al. [37] discussed BIM’s use in urban sustainability projects, emphasizing its effectiveness in forecasting environmental impacts. Montiel-Santiago et al. [38] found that by applying 6D BIM in a hospital building, energy savings of 47% could be achieved, thereby reducing CO2 emissions and costs. Oti, et al. [39] illustrated that BIM, combined with tools like EnergyPlus, helps meet sustainability standards by accurately simulating energy performance. Ref. [40] integrated BIM and virtual reality (VR) with cost-effectiveness and sustainability life cycle assessment software. The authors concluded that VR with BIM could be used to track carbon footprint and cost, leading to lower emissions and expenses.
Krygiel and Nies identified key areas where BIM enhances sustainability, including the use of renewable energy, daylight analysis, and building orientation [41]. Gourlis and Kovacic [42] assessed BIM’s effectiveness in modeling and optimizing energy-efficient buildings. Andriamamonjy et al. [43] applied BIM to analyze industrial energy efficiency using EnergyPlus, while Welle et al. [44] developed a BIM-based thermal simulation method for multidisciplinary design environments. Arayici and Aouad [45] highlighted BIM’s ability to foster multidisciplinary collaboration for environmentally efficient design. Thermal energy storage (TES), through latent heat systems like phase change materials (PCMs), is among the most effective methods for reducing energy usage [46,47]. PCMs, known for their high energy storage capacity, can store 5–14 times more energy than traditional materials [48]. Using the LHS system with PCMs is an effective way to store thermal energy and benefits from high energy storage density and the isothermal nature of the storage process [49]. This isothermal energy storage method, comprising organic, inorganic, and composite types, optimizes energy performance in building walls [50]. Stetiu and Feustel [51] treated office buildings with PCM beams and night mechanical ventilation, which were found to have the beneficial effect of reducing the maximum cooling load by 28%. PCMs can absorb or release heat during the liquid/solid phase change at a given temperature, and they can store 5–14 times more energy than conventional building materials [52].
Several investigations have been conducted on the topics mentioned by the researchers. Using two experimental structures, the thermal behavior of walls with PCM-impregnated cellulose insulation was experimentally investigated. The experiments showed that the PCM cellulose wall could reduce the maximum daily heat flux by 25% [53]. According to Saffari et al. [54], PCM melting temperatures can be optimized under a variety of climatic conditions to enhance building energy performance. The optimum melting temperature version is 26 °C for hot climates, and for cold climates, it is 20 °C. The coupling of an underfloor heating system with PCM was evaluated with the use of the EnergyPlus tool. It was found that the appropriate-melting-temperature PCM could provide thermal comfort to the occupants, and performance of the PCM is affected by seasonal changes. Furthermore, Sun, et al. [55] studied the performance of three PCM walls during the summer and winter in lightweight buildings. Sadineni et al. [56] indicated that BIM-aided passive solar design can reduce heating and cooling loads by optimizing daylighting and thermal mass. Baniassadi, et al. [57] worked on the optimization of the thickness of the PCM layer and insulation to achieve a minimum total cost in Iran; the authors reported that zero is the desired thickness of PCM in Iran, due to economic factors. Their findings show that using the mentioned walls can save an average of 20% per year. Wang et al. [58] noted that integrating real-time sensor data into BIM enables adaptive building control for dynamic energy management. According to research by Leal [59], many universities worldwide are active in climate change and sustainability. The results show that appropriate measures related to climate change by universities can effectively achieve sustainability.
The need to maximize the energy efficiency of building envelopes has led to the emergence of double-skin façades (DSFs). This system is generally used to cover most or all of the exterior wall to create an all-glass transparent façade [60]. Poirazis [61] describes the double-skin façade as “a system that consists of an external screen, a ventilated cavity, and an internal screen. Solar shading is positioned in the ventilated cavity. The external and internal screens can be single-glass or double-glazed units. The depth of the cavity and the type of ventilation depend on environmental conditions, the desired envelope performance, and the building’s overall design, including environmental systems”. Predicting the performance of double-skin façades is not easy. Temperature and airflow result from many simultaneous heat, light, and fluid flow processes, which are interactive and highly dynamic. These processes depend on the geometric, thermophysical, optical, and aerodynamic characteristics of the double-skin façades and the various components of the building itself [62]. These façades consist of two independent layers. In the cold season, the air trapped between the two layers is heated by the greenhouse effect, contributing to the heating of the building. In the warm season, opening the windows can promote cooling through the airflow between the two skins caused by natural convection. In addition to improving the heat and cold load of the building, this type of façade can also effectively insulate sound in busy cities and noisy places [63].
Ciancio et al. [64] proposed that EnergyPlus could provide an accurate analysis of the energy performance of a building located in the center of Rome and would make approximations depending on the input climate file. Aljundi et al. [65] concluded that in energy simulation and analysis based on BIM, compared to more detailed and validated software like EnergyPlus, Revit 2016 presents significant differences and is also offered as a tool with more substantial errors than the annual seasonal method commonly used for dwelling regulation. Furthermore, Li, et al. [66] compared the simulation results of EnergyPlus and HOT2000 v10.51 with sensor monitoring data in a case study in Edmonton, Canada. The authors concluded that the predictions of EnergyPlus and HOT2000 for total energy consumption are accurate. The differences observed from the monitoring data are 8.0% and 7.1%, respectively, but EnergyPlus achieves better predictions for energy consumption categories. Ama Gonzalo et al. [67] analyzed the energy needs and consumption of a building located in Garrucha, Spain. However, the authors claimed that after extracting all the geometric and spatial information of the building from the BIM model, an energy simulation was run using the EnergyPlus software. Controlling the amount of natural ventilation helps reduce winter heating and cooling energy consumption by 45%. Hasan [35] optimized energy consumption based on BIM using EnergyPlus software. As a result, the author declared that a reduction of up to 60% in the energy consumption and 50% in the cost could be possible by energy analysis and optimization using this framework in the early design phase.
If the double-layer outer wall is appropriately designed, it can improve thermal comfort conditions and reduce energy consumption. The efficiency of the DSF in each region is highly dependent on the climate. The results from the research conducted by Rezazadeh and Medi [68] show that the hot air between the two skins can be recovered to meet the needs of the colder part of the building. In the second half of the year, closing the valves on the façade and trapping air can improve the comfort of the office area adjacent to the façade. Furthermore, DSFs could be suitable for the second half of the year; it is necessary to consider the combination of natural ventilation and mechanical systems to improve indoor temperature and time management in the comfort zone. Norouzi and Motalebzade [69] concluded that the thermal energy loss rate of DSF buildings in mild-climate countries such as Malaysia and Spain is lower than that of ordinary buildings. Furthermore, Shameri et al. [70] proposed that the DSF system has great potential to reduce energy consumption in a wide range of research fields. DSFs have internal and external blinds that automatically adjust to the sun’s direction. The system saves energy, eliminates glare from the sky, and optimizes user comfort [71].
Systematic Comparison of Building Energy Simulation Tools: Capabilities and Applications
Energy simulation software plays a crucial role in the evaluation and optimization of building energy performance, particularly in early design stages. Tools such as EnergyPlus, TRNSYS, IES VE, and DesignBuilder are widely used, each with distinct strengths and limitations that influence their effectiveness in specific applications. EnergyPlus is renowned for its detailed physics-based simulation capabilities and ability to handle complex energy and HVAC system modeling, making it suitable for precise, in-depth energy analyses. It supports various advanced features, such as variable time steps and multizone airflow modeling, providing comprehensive insights into energy consumption patterns [72]. However, EnergyPlus can be complex to use, requiring significant expertise, and is often paired with a separate user interface like DesignBuilder or OpenStudio to improve usability [73]. This complexity can make the initial learning demanding but provides substantial flexibility for custom scenarios.
TRNSYS, on the other hand, is highly regarded for its modular structure that allows the integration of custom mathematical models, making it suitable for projects requiring tailored simulation approaches and detailed HVAC system representations. It is particularly advantageous when paired with external tools like MATLAB for co-simulation, enabling advanced predictive strategy planning and the dynamic analysis of energy systems [74]. However, TRNSYS has limitations in terms of handling non-linear heat and moisture transfer phenomena and can be computationally demanding when simulating complex scenarios [75]. This makes it ideal for specific, intricate modeling needs but less efficient for straightforward building energy evaluations.
IES VE and DesignBuilder are known for their user-friendly graphical interfaces, which make them more accessible for designers and practitioners unfamiliar with coding or advanced simulation inputs. DesignBuilder uses EnergyPlus as its engine but provides a more intuitive workflow, simplifying the modeling process and allowing for the integration of multiple energy-saving strategies within the same framework [76]. IES VE excels in offering comprehensive, scenario-based modeling, which is valuable for evaluating different design options quickly and understanding their impacts on energy consumption and thermal comfort [73]. However, these tools may not match EnergyPlus or TRNSYS in terms of customization and control over simulation algorithms, making them best suited for projects that prioritize rapid analysis and ease of use. The choice between these software tools should be guided by the specific project requirements, balancing detail and user-friendliness with computational demands and the desired output accuracy.
3. Materials and Methods
The integral BIM–life cycle assessment (LCA) framework was utilized in this study based on the ISO 14040 and 14044 guidelines [77] to evaluate the environmental impacts of two types of materials used in the case study in Brazil. LCA is a standardized methodology used to assess the environmental impact of a product, process, or service throughout its entire life cycle—from raw material extraction to disposal [78]. In the context of BIM, integrating LCA allows for a more comprehensive analysis of the sustainability and environmental performance of construction materials, enabling stakeholders to make informed decisions regarding material selection. The ISO 14040 and 14044 standards [77] provide a structured approach for conducting LCA by outlining the principles, framework, requirements, and guidelines for life cycle assessments.
The current study aims to explore the link between climate change and energy consumption through Building Information Modeling (BIM) to propose materials and equipment that minimize energy consumption while enhancing sustainability. This methodology adopts a multi-dimensional approach that uses various sources to compare and validate BIM-based energy simulation results. Autodesk Revit® 2016 and EnergyPlus 24.1.0 are selected due to their status as industry standards for BIM authoring and energy analysis. The process also adheres to ISO 19650-1:2018 [79], which defines the concepts and principles for information management within BIM, and ISO 16739:2013 [80], which specifies the Industry Foundation Classes (IFCs) data model to facilitate effective data exchange. These standards are crucial in ensuring compliance and supporting the interoperability of BIM tools, a critical aspect often highlighted in the literature but underrepresented in many methodologies.
3.1. Interoperability Issues and Their Significance
Interoperability refers to the seamless exchange and integration of data between different software platforms, which is vital for maintaining the accuracy and reliability of simulations and analyses. Studies have shown that data exchange issues, such as geometry misinterpretation, data loss, and material property inconsistencies, can significantly impact simulation results when transferring models from Revit to analysis tools like DesignBuilder and EnergyPlus. For instance, Ciccozzi et al. [81] found that interoperability challenges between BIM and Building Energy Modeling (BEM) tools often lead to discrepancies in energy simulation outcomes. Similarly, Elnabawi [82] highlighted that data loss during model exchange can result in inaccurate energy performance assessments. To address these concerns, this study incorporates mechanisms and practices that minimize these challenges. The IFC data model and gbXML (green building XML) are used as primary means for data exchange, as they are widely recognized for their role in ensuring compatibility and reducing data discrepancies between BIM authoring and simulation platforms. Treeck et al. [83] emphasized the importance of using standardized data models like IFC and gbXML to enhance interoperability in BIM workflows.
3.2. Enhanced Data Workflow
The workflow starts with detailed architectural modeling in Revit 2016, which encompasses comprehensive building details such as the geometry, materials, and mechanical systems. This model is then exported to EnergyPlus for advanced energy simulations. To mitigate known interoperability issues, this study employs gbXML, an open schema facilitating the structured transfer of essential building data. However, as studies indicate, simple data exports may not always ensure a perfect translation of complex details. Dong et al. [84] noted that direct gbXML exports could lead to geometry misinterpretations in energy simulations. Elnabawi [82] also observed that data exchange via gbXML might require additional processing to maintain accuracy. To further enhance the data exchange process, tools such as the Space Boundary Tool (SBT) are utilized to refine and convert IFC data into formats optimized for EnergyPlus, ensuring that all thermal and spatial properties are accurately represented. Bazjanac [85] demonstrated that using tools like SBT can improve the fidelity of data transferred between BIM and energy simulation applications.
Interoperability challenges between BIM tools like Revit and DesignBuilder have been a topic of extensive research, revealing issues such as incomplete geometry mapping and the need for manual adjustments to maintain consistency. Dong, Lam, Huang, and Dobbs [84] discussed the difficulties in achieving seamless data exchange between BIM and energy simulation tools, emphasizing the need for standardized workflows. This study recognizes these challenges and incorporates best practices, such as pre-export validation checks and custom scripts, to ensure that the exported models retain their integrity. These steps are essential to minimizing the impact of potential data interpretation issues that could otherwise lead to inaccuracies in energy simulation results.
To maintain data accuracy and reliability, this study validates the BIM-based energy simulations through a series of cross-references with recognized benchmarks and sensitivity analyses. This not only aligns with established BIM best practices but also addresses the critical aspect of interoperability emphasized in the literature. Studies have shown that ensuring consistency in data exchange leads to more accurate simulations and comprehensive energy analyses. Silva, et al. [86] highlighted the importance of validation in BIM processes to ensure data integrity and reliability. Azhar [87] also underscored the need for rigorous validation to achieve accurate energy performance simulations.
The current research is based on analysis through BIM 6D modeling, including the time, cost, and sustainability to ensure the examination is holistic in terms of performance throughout the life cycle of a building. First, the architectural design is digitized with Autodesk Revit. The detailed information provided includes the building’s location and purpose, geometry, materials, and mechanical systems. The building information is then digitized and exported to EnergyPlus 24.1.0 software for energy simulation. This workflow can ensure a smooth transition from architectural design to detailed energy analysis, considering accuracy and consistency through the process (Figure 1).
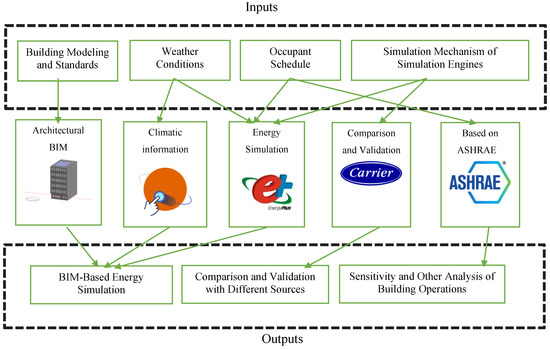
Figure 1.
Framework of BIM-based energy simulation.
3.3. Energy Simulation
Although EnergyPlus is a powerful and comprehensive building energy simulation software, the detailed calculations it performs are automated, and thus, referencing the software manual would suffice for the technical explanation of its algorithms. EnergyPlus integrates the functionalities of the Building Loads Analysis and System Thermodynamics (BLAST) and DOE-2 programs, and it uses a thermal equilibrium approach to model energy performance across building envelopes. The software is divided into two major simulation modules: Heat and Mass Balance Simulation and Building Systems Simulation. These modules simulate heat transfer through building elements such as windows and walls while also accounting for internal gains from occupants, equipment, and lighting. The Building Systems Simulation models the behavior of mechanical systems such as HVAC, on-site power generation, and other mechanical subsystems, based on the thermal loads identified by the Heat and Mass Balance Simulation.
However, more critical to the simulation outcome are the specific parameters used in the EnergyPlus simulation, which directly influence the accuracy of the results. In this study, the important parameters included the occupancy rates, which were modeled based on ASHRAE guidelines [88]; the temperature setpoints for heating and cooling, which were set at 22 °C and 25 °C, respectively; and the HVAC system schedules, which followed a typical residential building profile. Additionally, the lighting controls were modeled with daylighting sensors to minimize unnecessary energy consumption, and the thermophysical properties of building materials were defined in alignment with the Iranian 5th National Building Code [89]. These parameters, which are crucial for predicting building energy performance, should be considered in conjunction with the software’s automated processes to ensure realistic simulation outcomes. Including these details early in the methodology provides a clearer understanding of the building’s operational conditions and their impact on energy consumption.
The heat balance equation is already applied in EnergyPlus; it is an integral part of the ZoneAirHeatBalanceAlgorithm object. In the equation, the Euler method is used to predict zone air temperatures. It is one of the three available solution-based algorithms in the tool for producing an accurate thermal simulation. Since it is a numerical technique for solving ordinary differential equations, the Euler method is very appropriate for dynamic thermal modeling in buildings. The method projects the amount of energy required to maintain the thermal equilibrium within a zone when internal heat gains come into play with environmental external factors and the thermal building features through an iterative solution to the heat balance equation.
Thermal simulation in EnergyPlus is trial and error. It basically assumes an initial amount of energy that can achieve thermal balance within the environment through a heat balance equation. This estimated energy requirement informs the subsequent simulation of building systems like HVAC and on-site power generation. For example, the software will compute the ambient temperature because of the simulated performance of the system. Through this process—the interaction and progressive sophistication of these estimates and simulations—EnergyPlus ensures that the modeled zone air temperatures are very close to the real conditions. Thus, EnergyPlus can adopt these iterative calculations to come up with very precise predictions for the consumption of energy, the indoor environment, and the performance of the whole building; it is, therefore, an essentially required tool during design in sustainable buildings and energy management.
3.4. Climate Condition
This building is located in Tabriz, situated at 38.0962° N, 46.2738° E in the Northwest of Iran, specifically in the East Azerbaijan province. Tabriz experiences a continental climate with distinct seasons (Köppen Dsa), bordering on a cold semi-arid climate (Köppen BSk). Figure 2 illustrates the climate conditions of Tabriz.
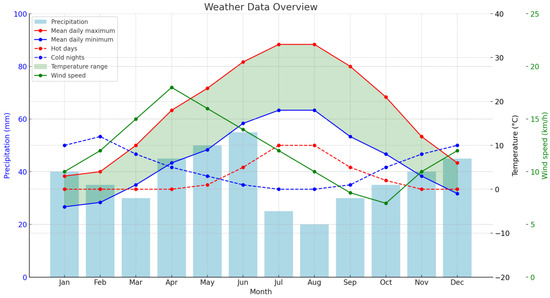
Figure 2.
Climate conditions of Tabriz [90].
3.5. Case Study and BIM Modeling
In the present research, a five-story residential building located in Tabriz, Iran, was selected as the case study and simulated using EnergyPlus 24.0.1 software. The building has a total footprint of 120 square meters, with dimensions of 12 m in length and 10 m in width, and an overall height of 15 m across its five floors. Each floor contains two residential units, and each unit comprises a living room, two bedrooms, a kitchen, and a bathroom, with an approximate area of 60 square meters per unit. The units are designed to provide ample natural lighting and ventilation, utilizing large windows measuring 1 m in height and 2.5 m in width, positioned 1 m above the floor level. The building materials were sourced from the Iranian 5th National Building Code [89], ensuring accurate thermophysical properties were input into the simulation model. The rationale behind the selection of the building was its typical representation of urban residential structures in Tabriz, aligning with prevalent building practices and construction norms. The windows have a solar transmittance of 0.55, a visual transmittance of 0.65, and a thermal conductivity of 0.95 W/m2·K for the 6 mm thick glazing, which plays a critical role in regulating the building’s thermal performance, particularly during the summer months. Table 1 shows the common construction materials used in the case study.

Table 1.
The common construction materials used in the case study.
The building is situated in a densely populated urban area of Tabriz, characterized by narrow streets and closely spaced buildings. This urban typology significantly impacts the building’s exposure to solar radiation and natural ventilation. Due to the proximity of adjacent buildings, particularly on the north side, the lower floors experience reduced airflow and solar gains, thus increasing their reliance on mechanical heating and cooling systems. These environmental factors were carefully modeled in the simulation to account for variations in ventilation and solar heat gain, which directly influence the building’s heating and cooling loads (Figure 3). Furthermore, the climate of Tabriz, which exhibits a continental pattern with hot, dry summers and cold winters, necessitated the use of both heating and cooling systems to maintain indoor thermal comfort. The indoor temperature setpoints of 25 °C for cooling and 22 °C for heating were selected based on local residential standards and occupant comfort preferences in Iran, ensuring the consistency and realism of energy simulations. The simulation incorporated design days that represent extreme weather conditions to calculate peak heating and cooling loads. For instance, the heating design day was selected to represent the coldest day of winter when outdoor temperatures drop below freezing, while the cooling design day represented the hottest summer day, where outdoor temperatures rise as high as 40 °C.
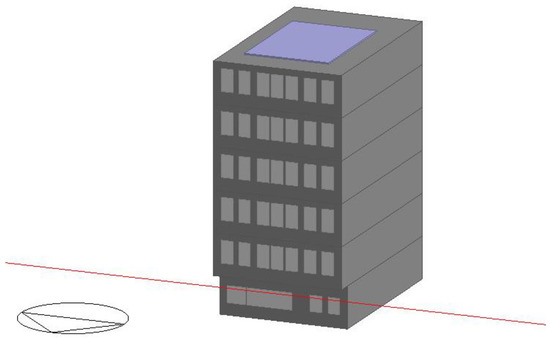
Figure 3.
View of the modeled building.
To accurately reflect the building’s operational demands, the heating hours were primarily set for the period between October and March, while the cooling hours were concentrated between May and September. The building’s heating and cooling needs were met using a Variable Refrigerant Flow (VRF) system, which provided zone-level temperature control across multiple units. The VRF system operates efficiently by modulating refrigerant flow to match the specific cooling or heating demands of each zone, based on signals received from indoor units. This technology allows the system to maintain comfort levels while avoiding unnecessary energy consumption in unoccupied spaces. The outdoor VRF unit, equipped with a variable-speed compressor, operates efficiently across different loads, thus minimizing energy wastage. Setback temperatures of 28 °C for cooling and 18 °C for heating were implemented during unoccupied hours to enhance energy savings further. These operational details were programmed into EnergyPlus to ensure that the building’s energy performance was modeled accurately over an annual cycle, incorporating the specific urban and climatic factors that impact energy demand.
The EnergyPlus simulation was run over the course of an entire year, using weather data derived from Meteonorm 2020 for Tabriz. The model accounted for the building’s geometric configuration, urban context, and mechanical systems to calculate the heating and cooling loads for each zone. The results indicated that the heating load was concentrated during the cold winter months, while the cooling load peaked in the summer, driven by high outdoor temperatures and solar heat gains. The proximity to neighboring buildings further exacerbated the reliance on mechanical cooling in some areas, as natural ventilation was hindered, particularly on the lower floors where airflow was restricted. Additionally, the high solar transmittance of the windows contributed to increased cooling demands during the summer, emphasizing the need for efficient energy management strategies. These findings underscore the importance of the building’s urban context and climatic conditions in shaping its overall energy consumption, making the simulation results crucial for understanding the operational energy dynamics in such dense, urban environments. Gains of the building’s activity is shown in Table 2.
Table 2.
Gains of the building activity.
3.6. Information on Building
In this study, the residential usage of the building was modeled in accordance with ASHRAE standards. The occupancy patterns are shown in Figure 4. The y-axis of the figure represents occupancy level (%), which was capped at 100%, and the time labels were updated to clearly distinguish between the AM and PM periods. A virtual daily occupancy schedule was designed based on [66] and customized in EnergyPlus to match the building’s operational plan. The occupancy schedule reflects variations between working and non-working days, with higher occupancy levels during evenings and weekends.
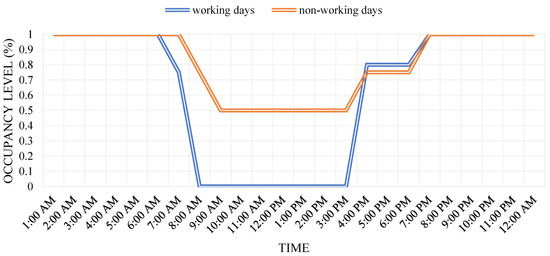
Figure 4.
Occupancy level on working and non-working days.
Hot water use for the residential space was assumed to be 0.72 L per square meter per day, with the primary usage hours between 16:00 and 23:00. This assumption was applied consistently throughout the simulation to reflect typical residential consumption patterns. The updated occupancy schedule in EnergyPlus was then used to simulate the building’s energy performance more accurately, in line with these customized usage patterns.
3.7. HVAC Design Input Data Overview
Table 3 provides a comprehensive summary of the essential HVAC design input data, highlighting the critical factors necessary for accurate energy modeling and system sizing. The table outlines various parameters including indoor and outdoor design conditions, building characteristics, occupancy details, internal heat gains, ventilation requirements, system specifications, control strategies, and environmental influences. These elements are fundamental in the planning and performance optimization of HVAC systems. For instance, maintaining specific indoor temperature setpoints (23.9 °C for cooling and 21.1 °C for heating) ensures occupant comfort while optimizing energy efficiency. Similarly, outdoor design conditions, such as −6.7 °C for heating and 38.4 °C for cooling, are essential for calibrating system capacities to withstand local climatic variations. The building’s thermal envelope, defined by characteristics like the total floor area (120 m2 on the ground floor and 140 m2 on each upper floor) and insulation levels (U-values of 0.518 W/(m2·K) for walls and 0.25 W/(m2·K) for roofs and floors), significantly influences heat transfer and subsequent HVAC loads. Additionally, window-to-wall ratios (e.g., 30%) impact solar heat gains and overall thermal performance.
Table 3.
HVAC design input data.
The table further emphasizes the importance of occupancy details and internal heat gains, both crucial for accurately estimating HVAC loads. With an occupancy rate of 0.0188 persons/m2 and peak usage between 16:00 and 23:00, the system must align with real usage patterns to optimize performance. Internal heat gains from lighting systems (e.g., 28,543 W) and electric equipment loads (14,272 W) contribute significantly to the total cooling and heating requirements. Ventilation needs are governed by standards like ASHRAE to ensure sufficient airflow and maintain air quality, while infiltration rates are factored in to address air leakage. Additionally, system specifications, such as using Carrier HAP for HVAC analysis, support precise calculations of heating and cooling capacities, including airflow rates. Control strategies like thermostat setpoints and basic setback sequences enhance energy efficiency. Environmental data, including local climate information and solar heat gain coefficients, are integral for effective simulation and design, reinforcing the role of comprehensive data in developing efficient, reliable HVAC systems.
3.8. Examined Scenarios and Double-Skin Façade (DSF) Implementation
To evaluate the impact of various energy-saving strategies, this study examined multiple scenarios for the case study building. Each scenario was designed to isolate and analyze specific energy performance factors, with the goal of identifying the most effective measures for reducing energy consumption and enhancing indoor thermal comfort. Table 4 outlines these scenarios, providing a clear reference for the different configurations tested during the simulation.
Table 4.
Overview of examined scenarios for energy-saving strategies.
In the case study building, the DSF was specifically designed to align with the unique climatic conditions of Tabriz. The DSF system consists of an outer glazed screen, an intermediate ventilated cavity, and an inner glazed screen. This configuration allows for adaptive thermal management across different seasons. During the winter months, the DSF acts as an insulating layer, trapping air within the cavity to minimize heat loss and reduce heating loads. The greenhouse effect within the cavity further contributes to maintaining indoor warmth. In contrast, during the hot summer months, the DSF facilitates natural ventilation by enabling air circulation within the cavity, which helps to dissipate heat and decrease reliance on mechanical cooling systems.
The DSF also incorporates automated shading devices within the cavity, which adjust in response to solar radiation levels. These shades help to control solar heat gain while optimizing daylight penetration, striking a balance between energy efficiency and occupant comfort. The incorporation of the DSF in the building simulation demonstrated its significant role in enhancing thermal performance by reducing peak heating and cooling demands. This approach aligns with sustainability goals, showcasing how passive design strategies, such as the use of a DSF, can contribute to more energy-efficient buildings. The scenarios outlined in this study were crafted to provide a comprehensive assessment of different energy-saving measures applicable to residential buildings in climates similar to that of Tabriz. Scenario 1, the baseline model, served as a reference for assessing the effectiveness of subsequent strategies. Scenario 2 introduced phase change materials (PCMs) into the building’s construction, leveraging their high thermal storage capacity to absorb and release heat, thereby stabilizing indoor temperatures and reducing peak energy loads. Scenario 3 explored the use of a double-skin façade (DSF), which added an extra layer of insulation and allowed for natural ventilation. This configuration aimed to reduce heating needs in the winter and minimize cooling loads in the summer through passive airflow. Finally, Scenario 4 combined both PCMs and DSF to analyze the synergistic effects of these two strategies on overall energy performance.
The DSF system employed in the case study building was tailored to enhance energy efficiency while maintaining occupant comfort. This dual-layer façade operates by capitalizing on the natural properties of air insulation and passive solar management. During cooler months, the air trapped between the inner and outer layers acts as an insulator, reducing the need for mechanical heating. In warmer periods, the cavity’s design promotes airflow through natural convection, effectively dissipating heat and reducing cooling requirements. The automated shading devices embedded within the DSF further aid in managing solar heat gain, adapting dynamically to environmental conditions. This design demonstrates how strategic building enhancements can provide sustainable solutions that align with the needs of rapidly changing climates. The implementation of such systems underscores the importance of integrating advanced materials and design features in new construction and retrofit projects to promote energy efficiency and resilience.
4. Results and Discussion
In this regard, the average temperature, sunlight, and precipitation will be focused on after simulating the building in EnergyPlus. The results regarding energy simulation will be evaluated with the help of EnergyPlus, and the validation will be carried out with Carrier software.
4.1. Analyzing the Average Temperature
Figure 5 shows the average temperatures over four main periods: 1981–1990, 1991–2010, 2010–2020, and 2020–2030. A trend in temperature change is clearly captured across the decades in these graphs. In this regard, the average temperatures linearly increased from 1981 to 2020, consistent with observations made globally on a higher temperature field relative to the general increase in greenhouse gas emissions. Gradual temperature increases from one period to another emphasize the increasing effects of global warming. Subsequent decades show higher peaks of temperatures and a wider range of temperature fluctuations, thus exhibiting extremities in weather. What is most interesting, though, is the trend for the period 2020–2030, which has diverged from the previous warming and resulted in some months staying at approximately the same level or showing a slight decrease in average temperatures compared to previous years. This can be driven by natural climate variability, changes in the patterns of atmospheric circulation, or mitigation efforts against climate change. However, care must be taken in making interpretations from these findings, for such short-term phases of cooling can readily occur with long-term climate change. This stabilization is consistent with observations from regional studies showing periods with limited temperature increase amidst an overall warming trend.
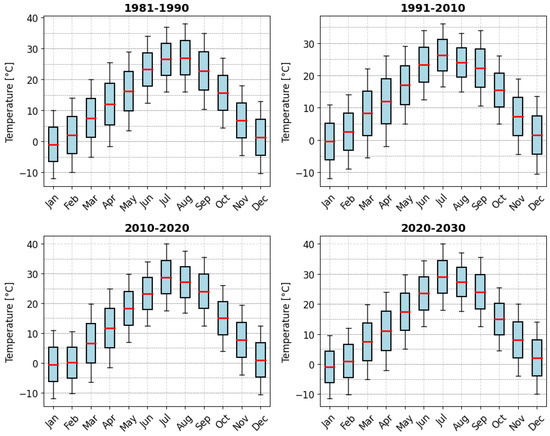
Figure 5.
The graphs of average temperature in different years.
These observations were supplemented by several other studies that documented similar trends of temperature variability. For example, studies have shown that from 1950 to 2004, minimum temperatures rose more quickly than maximum temperatures, thereby markedly reducing the diurnal temperature range [91]. Regional warming in large amounts has been documented in studies carried out in Europe and Switzerland, particularly during spring and summer seasons, thereby having a strong bearing on the ecosystems and human activities therein. Another study on temperature extremes in Serbia during the period 1961–2010 showed that there has been huge warming over the last decades of the twentieth century, which has added to the general trend of rising temperatures [92]. These studies confirm together that climate change is occurring and show how complex it can be to predict the future development of temperature.
4.2. Analyzing the Average Sunlight
Figure 6 shows the average monthly solar radiation for the time periods 1981–1990, 1991–2010, 2010–2020, and 2020–2030. As can be observed from these graphs, there is a clear trend of increasing values from 1981 to 2020 and a slight reduction or stabilization in the period between 2020 and 2030. This increase in the values can be explained by changes in environmental conditions related to the ozone layer and general atmospheric conditions leading to higher intensity solar radiation reaching the Earth’s surface. Since 2010, the solar radiation has been tending towards a reduction in its value, which is fully consistent with the intensified global control of pollution, which has been mastered by the application of cleaner sources of energy with fewer aerosols and pollutants reflecting or absorbing solar radiation. Research supports the observed trends in solar radiation. For example, studies conducted in Spain report a high increase in SSR in the period 1985–2010, popularly called the “brightening period”, because of reductions in cloud cover and aerosols [93]. In the same vein, a pan-European increase in SSR from 1983 to 2010 has been reported, with an increased rise since the middle of the 1990s mainly because of reduced cloud cover. In China, during the period from the 1960s to the 1980s, there was a steep drop, followed by a brightening period in global radiation from the 1990s because of reduced aerosol loadings and enhanced environmental regulation [94].
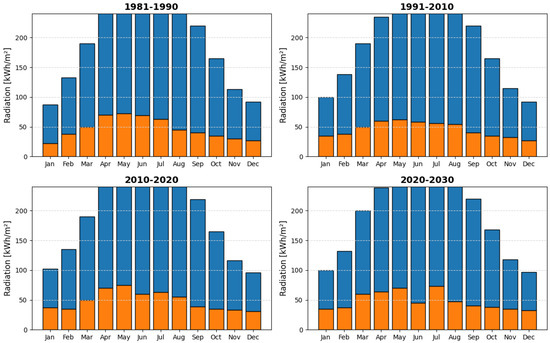
Figure 6.
The graphs of average radiation in different years.
The trend of stabilization or slight decline in solar radiation during 2020–2030 may be linked to the global climate policy in controlling pollution and enhancing renewable energy. Most probably, these measures have reduced atmospheric aerosols and pollutants and hence the scattering and absorption of solar radiation. This may also be contributed to by the adopted cleaner energy sources mitigating environmental impacts usually associated with increasing atmospheric pollution. In other words, these findings underscore, in equal measure, the complex interplay of human activities, atmospheric conditions, and solar radiation, underscoring thereby the effectiveness of global efforts toward mitigating climate change and improving air quality.
4.3. Analyzing the Average Precipitation
Figure 7 illustrates the average monthly precipitation (blue-shaded area) and the number of days with precipitation (red line with dots) over four distinct periods: 1981–1990, 1991–2010, 2010–2020, and 2020–2030. The data are plotted with two distinct y-axes, precipitation levels in millimeters on the left y-axis and days with precipitation on the right y-axis, to clearly represent both datasets. Each line of red dots marks the number of days with precipitation during a specific month, while the blue area indicates the total precipitation amount during the same period. This approach allows for a comprehensive understanding of both the quantity of rainfall and its frequency across each period.
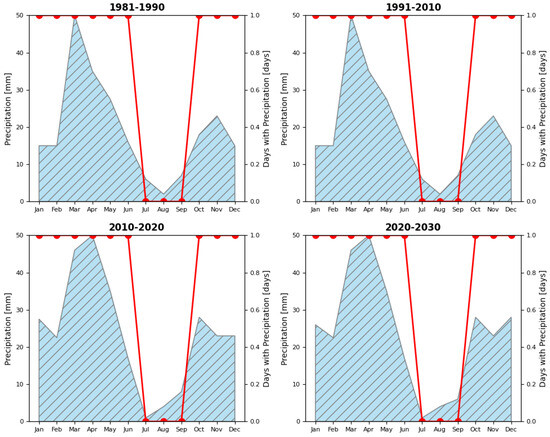
Figure 7.
The graphs of the average precipitation in different years.
Analyzing these charts reveals significant changes in precipitation patterns over the four decades. From 1981 to 2010, the precipitation levels from January to March generally remained below 15 mm. However, starting from 2010, an increase in precipitation can be observed, with levels rising to approximately 25 mm in these months. This pattern of increasing rainfall during the early part of the year points to shifting climate dynamics in response to climate change. Another notable change is the increased precipitation in November post-2010, compared to previous decades, further indicating a rise in overall precipitation levels. These changes suggest a general increase in precipitation over the decades, likely linked to the effects of climate change. The literature supports these observed trends, with studies showing climate change-induced variations in precipitation. For instance, a trend analysis of precipitation in Sicily for the 1921–2012 period indicated a general decrease during the autumn and winter but an increase in total annual precipitation during the 1981–2012 period. Similarly, global analyses have revealed significant increasing trends for the annual maximum daily precipitation, correlated with rising global temperatures [95]. This global phenomenon of rising temperatures influencing precipitation patterns is consistent with the data presented in Figure 7.
The patterns indicate a stabilization and, in some cases, a slight decrease in precipitation during the later periods (2020–2030). This could be attributed to natural climatic variability, along with the potential impact of mitigation strategies against climate change. For example, a study on precipitation trends across the United States and Canada found that, although there were some significant increases in precipitation, the main driver of those trends was natural variability itself [96]. This highlights the complexity of climate systems, where both anthropogenic factors and natural variability contribute to the observed changes. These findings underscore the importance of understanding the combined impact of natural and anthropogenic factors on precipitation patterns, as they have significant implications for predicting future water resource availability. By accurately modeling these changes, planners and policymakers can better manage the potential impacts on agriculture, infrastructure, and ecosystems. Thus, Figure 8 not only reflects historical changes in precipitation but also provides insights into the broader implications of climate variability and climate change on regional precipitation dynamics.
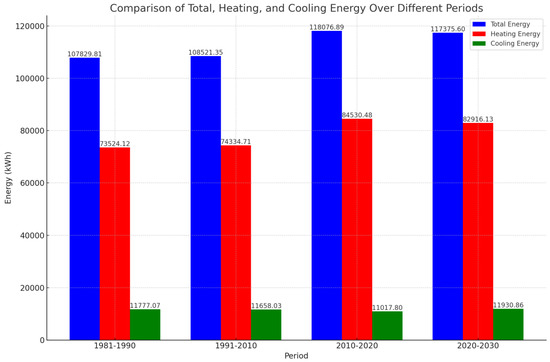
Figure 8.
Comparison of total, heating, and cooling energy over different periods.
4.4. Analyzing Energy in EnergyPlus
Through the in-depth analysis of the impacts of climate change, it has become evident that increasing temperatures across the world are practically altering the energy-use patterns of buildings. Figure 8 compares the total, heating, and cooling energy over different periods. According to the data, in the second period—1991–2010—the change in building energy use increased minimally from the first period—1981–1990—by around 1%. The third period, however, clearly indicates that in the 2010–2020 period, with high rising temperatures and fluctuating precipitation patterns, increased energy demands obviously occurred. This rise amounts to approximately 8% from the first to the third period, clearly pointing to the immense effects caused by climatic change on energy requirements.
Projections for the future period, based on Meteonorm data and used in conjunction with the IPCC AR4 A1B scenario, remain slightly reduced up to 2030. This reduction may be explained by the incorporation of bio-based organic phase change materials and double-skin façades into building models, as simulated through EnergyPlus 24.0.1 software. Specifically, the applied BioPCM M51/Q25 has a capacity of 51 Btu/ft2 and a melting temperature of 25 °C; it was applied to external and internal walls, floors, roofs, and ground floors. These materials enhance the thermal performance through the storage and discharge of heat by phase changes, hence reducing their impact on the HVAC systems. The HVAC and PV systems were unchanged from previous configurations; therefore, there was a baseline constant throughout for comparison.
For BioPCM, the specific properties applied include a thermal conductivity of 0.2 W/(m·K), a specific heat of 1970 J/kg·K, and a density of 235 kg/m3. These features ensure efficient thermal management that may contribute to the observed reduction in energy consumption despite ongoing climatic changes. Advanced materials and building designs that are to be implemented in buildings show proactive action toward the mitigation of the impacts of climate change on energy consumption in a region like Tabriz, where extreme weather conditions are more frequent. The strategic integration of BioPCM into this process shows that innovative building materials can become very instrumental in improving energy efficiency and sustainability in the face of climate change.
These findings support the prevailing body of research on the interaction between climate change and building energy use. In fact, a lot of studies indicate that temperature increases and altered precipitation patterns have significant impacts on energy demand in buildings, therefore compelling adjustments to be made. Such adaptive measures include using advanced materials like BioPCM and sustainable design that would decrease these effects to promote energy efficiency in the built environment.
The amount of energy consumption for heating the building is depicted in Figure 8. In this study, natural gas was utilized to supply energy for the heating equipment of the building, and it is observed that the heating energy trend mirrors the overall energy consumption trend of the building. Heating represents a major part of a building’s energy use, especially in Tabriz, where the cold weather necessitates heating for most of the year. The chart illustrates energy consumption for heating up to 2020, highlighting a decrease in this trend from 2020 onwards. This reduction is attributed to rising global temperatures, decreased precipitation, and regional climate changes. Previous graphs also show a steady increase in sunlight. Moreover, incorporating PCMs and double-skin façades is seen as an effective way to lower energy consumption for heating, particularly in colder climates.
Figure 8 also illustrates the energy consumption of the building for cooling, providing a distinct perspective compared to previous charts. More importantly, it represents a progressive decrease in the building’s cooling energy use from 1981 to 2020; the general trend is a serious drop from 2010 to 2020. This was because of changes and enhancements made to the building and several energy-efficient technologies adopted during this period. However, this trend reverses from 2020 to 2030, with an increase in cooling energy consumption. This is expected since global temperatures are likely to rise during this period. In fact, increased energy consumption for cooling will directly go hand in hand with an expected warming climate on Earth that will require enhanced indoor comfort cooling measures. With temperature increase forecasts from 2020, it will be of essence to find new methods of controlling energy consumption. Among the approaches, there is the integration of PCMs into building construction.
PCMs applied to the building envelope can drastically improve the thermal regulation through the absorption of excess heat by the materials during the day and its release at night. This can help in maintaining an almost constant temperature indoors, thereby decreasing the load on cooling systems. Passive cooling by this phenomenon not only helps in saving energy but also contributes to overall sustainability by reducing the dependency on energy-intensive HVAC systems.
The specific application of BioPCM, with properties like a thermal storage capacity of 51 Btu/ft2 and a melting temperature of 25 °C, can be cited as a typical example of how these materials could be tailored for use under specific local climatic conditions. For instance, the temperature sometimes reaches extremes in Tabriz; hence, BioPCM plays a significant role in mitigating the impacts of increasing temperatures by assuring indoor thermal comfort with minimum energy use. These findings are supported by various studies that show the efficacy of PCMs in reducing energy use for cooling. Research has shown that incorporating PCMs into building structures significantly reduces peak cooling loads, increasing energy efficiency [97]. Furthermore, the flexibility of PCMs to adjust to different climatic conditions makes them very suitable for buildings across the world, especially where temperature fluctuations are extreme.
5. Validation
In this regard, the performance of the PCM module and the algorithm implemented in EnergyPlus was benchmarked against the experimental data provided by [98]. As shown in Figure 9, the simulated zone temperatures were well aligned with the experimental data in both the PCM and non-PCM cases. To provide a more robust evaluation, we calculated the Mean Absolute Error (MAE) and Root Mean Square Error (RMSE) instead of relying solely on percentage deviations. For the non-PCM case (Figure 9a), the MAE was 1.91 °C, and the RMSE was 2.04 °C, indicating a moderate but acceptable level of error between the simulated and experimental results. This level of accuracy is consistent with prior findings, such as [99], which reported an average deviation of 2.6% between the experimental and numerical data for similar studies. These values indicate that while the simulation captures general temperature trends, some discrepancies remain due to simplifications in the EnergyPlus model or experimental uncertainties.
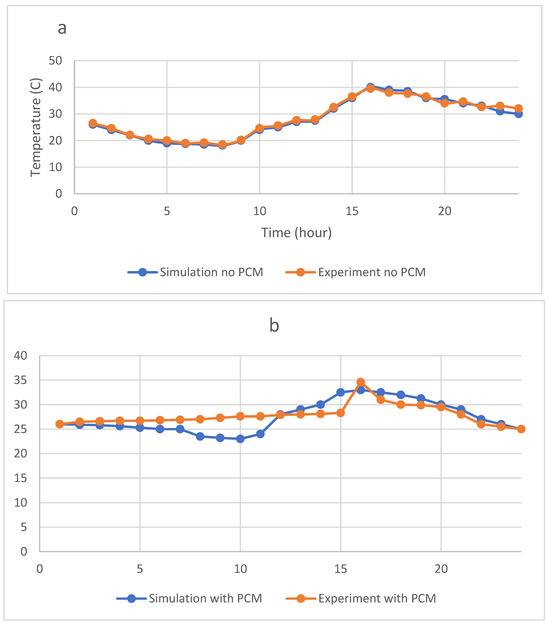
Figure 9.
Experimental and simulated zone temperature (a) without PCM and (b) with PCM.
In the PCM case (Figure 9b), the simulation results showed an even closer correlation with the experimental data. The MAE was calculated to be 0.90 °C, and the RMSE was 1.11 °C, demonstrating that the EnergyPlus PCM module provides more accurate predictions when phase change materials are included. The lower error margins in the PCM case indicate that the thermal performance of the PCM module is well represented in the simulation, closely matching the experimental results. This finding suggests that EnergyPlus is a reliable tool for evaluating the benefits of PCM integration in building designs.
5.1. Manual Calculations
To demonstrate the accuracy of the information obtained, the total heat load of the building in the analytical calculations was derived as the sum of the heat lost through the walls, the heat required for ventilation and cooling, and the heat needed for hot water consumption. The heat lost through the building walls was calculated by means of Equation (1).
where the following variables are used:
- U = heat transfer coefficient;
- A = external wall area;
- ti = indoor temperature;
- t0 = outdoor design temperature for winter.
During the current investigation, the indoor temperature was set to 22 °C as per residential building standards, and the heat transfer coefficient for each wall was determined based on Table 1. Considering the surface area of each wall and the outdoor design temperature for Tabriz in winter, the total heat loss through all building walls amounted to 124 kW.
According to Equation (2), the heat required for air infiltration through walls and materials, as well as the heat needed for supplying fresh air, was evaluated.
where the following variables are used:
- = the amount of infiltrating air or fresh air;
- ti = indoor temperature;
- t0 = outdoor design temperature for winter;
- V = the volume of space;
- ACH = the amount of room air change per hour.
In this study, the infiltration from walls and building materials was calculated at 0.7 air changes per hour (ACH), and the fresh air requirement per person followed ASHRAE standard 62, set at 10 cubic feet per minute (cfm) per person. ASHRAE defines infiltration as “the flow of outdoor air into a building through cracks, joints, and other unintentional openings, as well as through doors for normal entry and exit” [100].
Accordingly, in Equation (2), the heat load required to compensate for air infiltration and supply fresh air amounts to 23.42 kW and 34.29 kW, respectively. Thus, the total load required for incoming air is 57.71 kW.
Next, the heat required for hot water consumption was evaluated using Equation (3).
where the following variables are used:
- V = the amount of hot water consumed in gallons per hour;
- t2 = consumption of hot water from the water heater;
- t1 = city water temperature entering the water heater.
The amount of water consumed is considered according to Table 5, based on the ASHRAE standard [88].
Table 5.
The amount of hot water used for the residential building.
Referring to Table 5 and considering the building’s occupancy per software standards, which categorize it as a residential building, the required heat load at this stage amounts to 68.59 kW. The cumulative thermal load calculated analytically totals 192.65 kW.
5.2. Carrier Software Calculations
Due to the high-reliability requirement, the thermal and cooling loads of the building were calculated using Carrier HAP v6. software. According to the results obtained, the calculated thermal load was 184.590 kW. Manual estimations of the cooling load may not provide a highly accurate criterion for comparison. Hence, Carrier software was used to estimate the building’s cooling load under the specified conditions. As can be observed in Table 6, the results that can be drawn from Carrier software in relation to the thermal and cooling loads in this building include a refrigeration load of 68.45 kW for the building in the Tabriz climate.
Table 6.
Results extracted from Carrier software for building in Tabriz.
5.3. EnergyPlus Calculations
The thermal performance of buildings and the energy consumption based on data extracted from EnergyPlus for Tabriz offer vast information. Figure 10 and Figure 11 give a more detailed picture of the combined impact of internal gains and solar gains on the heating and cooling loads. Figure 10 shows the zone sensible heating, which is 183.02 kW. This value illustrates the interaction between internal gains resulting from occupants, equipment, and lighting and the solar gains through the building envelope that influence heating needs. The large heating load depicted in the figure highlights the significant role of solar radiation in contributing to the overall heating demand. This finding underscores the importance of implementing efficient thermal management schemes, such as improved insulation and strategic shading devices, to mitigate excessive energy consumption while maintaining indoor thermal comfort. The integration of such strategies can substantially lower the impact of peak solar gains, ultimately enhancing the building’s energy performance. The data reflected in Figure 10 not only demonstrate the thermal loads associated with internal and solar gains but also emphasize the potential for energy-saving opportunities through targeted passive and active measures tailored to reduce heating requirements.
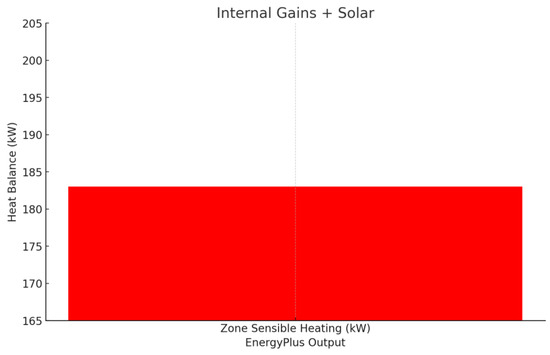
Figure 10.
The heat load of the building using EnergyPlus in Tabriz.
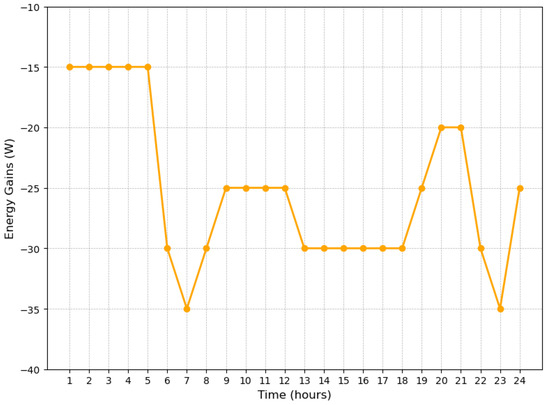
Figure 11.
The thermal and refrigeration load of the building using EnergyPlus software in Tabriz.
Figure 11 shows the system dynamic loads profile for the building during a typical day. The internal and solar gain variation profile follows the day, peaking in the early morning and late evening. These periods mark high demands for cooling and heating. The data underscore how solar gains and internal heat loads fluctuate throughout the day, influencing the overall energy use for heating and cooling. One effective strategy to mitigate heating loads and enhance energy efficiency is the integration of phase change materials (PCMs) into building construction. PCMs, during periods of excessive heat, can absorb and store thermal energy that can later be released in areas where needed, reducing the dependence on active heating and cooling. According to studies, PCMs are able to smooth the indoor temperature and decrease the peak loads for both space heating and cooling.
Conclusively, with the background of the results in Table 7, the heating load estimation by different methods for the Tabriz building gives very accurate and reliable estimates. It resulted in an estimated heating load of 192.65 kW through manual calculation, 184.59 kW through Carrier software, and 183.02 kW through EnergyPlus. The credibility of EnergyPlus as a simulation tool becomes apparent from the minor deviation of about 5% between manual calculations and the EnergyPlus calculation. EnergyPlus demonstrated an extremely detailed simulation capability in respect of energy use and environmental performance based on interrelationships between different built components and systems, including the envelope structure, windows, HVAC systems, lighting, plug loads, and internal heat gains from a variety of sources. There are advanced algorithms which give it the capability to predict quite accurately the system load needed to maintain the desired indoor air temperature so as to achieve thermal comfort [101].
Table 7.
Comparison of heating loads obtained from software and manual calculations.
This further supports the credibility of EnergyPlus: a comparison study of simplified energy calculations, like ISO 13790 [102], with dynamic simulations like EnergyPlus shows that the former can offer a more detailed and accurate result in specific conditions and under changing conditions and uncertainties [103]. This accuracy is important in modeling complex interactions in building systems that are very often simplified in manual calculations. The slight overestimation of the cooling loads provided by the EnergyPlus simulations in relation to the Carrier software suggests that EnergyPlus may have more conservative assumptions, or it accounts for something that the simpler models ignore. This will ensure that building systems are adequately sized to meet peak demands, enhancing the reliability and performance of building systems under real-world operating conditions.
The overall findings indicate that EnergyPlus has the capability to provide a good amount of accuracy for building energy performance simulation and can be effectively used as a design tool for developing and assessing energy-efficient buildings. The ability to combine various building components together in a single package and accurately predict system interactions sets it above manual calculations and other less complicated software solutions that are available on the market. Thus, EnergyPlus would be appropriate for detailed energy analysis and building performance optimization under different climatic conditions, including in Tabriz [104].
The findings from this study can be generalized to broader applications in the field of energy-efficient building design, particularly in regions with similar climatic characteristics to those in Tabriz, Iran. The use of Building Information Modeling (BIM) tools such as Autodesk Revit® and EnergyPlus has been shown to be effective for simulating and optimizing energy consumption in residential buildings. By assessing both heating and cooling loads under different climatic conditions, the methodology used in this study can be applied to various geographic locations with similar climate conditions. For example, regions that experience extreme temperature fluctuations, like those in other parts of the Middle East, southern Europe, or central Asia, could adopt these findings to optimize energy efficiency in buildings. The integration of phase change materials (PCMs) demonstrated significant improvements in thermal regulation, suggesting that their application in different building types, such as commercial and public buildings, could yield similar energy-saving benefits. Moreover, this research demonstrated that the simulation and analysis processes could be expanded to include a variety of building designs and materials, making the findings applicable to different architectural forms and building structures. The use of EnergyPlus allowed for the detailed modeling of the building envelope, occupancy patterns, and energy loads, which can be replicated in different settings, including in high-rise buildings, multi-residential complexes, or individual homes. The successful validation of the EnergyPlus simulation against experimental data further supports the generalizability of this approach, as it can be adapted to other climates, building regulations, and materials worldwide. In particular, this study’s methodology for assessing the effectiveness of PCMs in reducing heating and cooling demands can be applied to any region facing high energy consumption due to temperature extremes. This offers a scalable solution to building energy efficiency, contributing to global efforts to reduce energy consumption and carbon emissions.
The generalization of these findings also extends to the use of simulation tools for forecasting future building performance under different climate scenarios. With increasing emphasis on sustainable construction, the approach used in this study can be applied to green building projects globally. The flexibility of BIM and EnergyPlus allows for customization to regional building codes, materials, and climate conditions, making this a versatile solution for architects and engineers aiming to create energy-efficient buildings. Moreover, this study’s focus on material properties, such as window transmission values and wall insulation, provides a framework for general application, regardless of specific building designs or local climates. Overall, the results of this study demonstrate that the strategies used to optimize thermal performance in a residential building in Tabriz can be generalized and applied across various regions and building types to achieve greater energy efficiency and sustainability.
6. Conclusions and Future Directions
This research work aims to analyze the energy consumption trends of buildings from the past to the future considering climate change while proposing viable solutions to reduce energy consumption by 2030. This study utilized BIM to assess the interoperability among climate change impacts, energy consumption patterns, and sustainability goals. A five-story residential building in Tabriz, Iran, served as the case study. EnergyPlus 24.0.1, Carrier, and Meteonorm software were employed to achieve the research objectives. BioPCM and double-skin façades were integrated into the building modeling using Autodesk Revit® 2016 and EnergyPlus to evaluate the potential impact of these advanced materials on future energy consumption reduction. In a five-story residential building in a cold climate, applying BioPCM and double-skin façades would reduce the total consumed energy in 2030 by roughly 701 kW (0.6%) compared to the year 2020. Specifically, PCMs and double-skin façades reduced the heating energy use by approximately 1.909%, which is equivalent to 82,916.13 kW in 2030. However, due to projected increases in global average temperatures, the energy consumption for cooling is expected to rise from 11,017.8 kW in 2020 to 11,930.86 kW in 2030. While novel materials may not significantly reduce cooling energy demand, BioPCMs have the potential to absorb and release energy cyclically, which could partially offset cooling needs.
On the validation front, EnergyPlus was found to be more accurate in computing and estimating the energy use as compared to manual calculations and Carrier software estimations. Further studies should be aimed at assessing the effectiveness of different kinds of newly emerging materials and technologies, such as halochromic smart materials, photochromic materials, and thermal expansion smart materials, in reducing the total amount of energy use. This should be based on the requirements, objectives, and climatic conditions of the projects with respect to the location.
This study also provides both practical and theoretical contributions to the field of energy-efficient building design, particularly in regions impacted by climate change. From a practical perspective, the integration of Building Information Modeling (BIM) tools such as Autodesk Revit® and EnergyPlus allows for the detailed simulation and analysis of energy consumption patterns, enabling more sustainable building designs. The application of phase change materials (PCMs) and double-skin façades offers real-world strategies for reducing energy consumption in residential buildings, as demonstrated by the case study in Tabriz, Iran. This research also highlights the significance of advanced simulation tools in predicting future energy trends under climate change scenarios, offering valuable insights for architects and engineers aiming to meet sustainability goals. The use of BIM and energy simulation software presents a robust approach to enhancing design efficiency while minimizing environmental impact, contributing to the global effort to reduce carbon emissions in the construction sector. From a theoretical perspective, this research enriches the existing literature on the role of advanced materials in improving building performance under future climate conditions. By benchmarking the EnergyPlus simulation results against experimental data, this study provides a validated methodology for assessing the thermal performance of buildings equipped with PCMs and double-skin façades. This reinforces the effectiveness of these materials in improving energy efficiency, particularly in cold climates. Furthermore, this study identifies critical gaps in the understanding of cooling energy demand, which is projected to increase due to rising global temperatures. This opens avenues for future research to explore additional materials and technologies, such as smart materials, which can further reduce energy consumption. However, one limitation of this study is the reliance on simulation data, which may not fully capture the complexities of real-world energy performance. Future research should focus on long-term field studies to validate the findings and assess the applicability of the proposed solutions across different climate zones and building types.
Author Contributions
Conceptualization, S.F.M. and A.R.H.; methodology, A.R.H.; software, A.R.H.; validation, S.F.M.; formal analysis, S.F.M.; investigation, A.R.H.; resources, M.B.S.; data curation, M.C.; writing—original draft preparation, S.F.M. and A.R.H.; writing—review and editing, M.C., M.B.S. and N.B.; visualization, M.B.S. and N.B.; supervision, S.F.M.; project administration, S.F.M.; funding acquisition, M.C. All authors have read and agreed to the published version of the manuscript.
Funding
This research received no external funding.
Data Availability Statement
The data presented in this study are available on request from the corresponding author.
Conflicts of Interest
The authors declare no conflicts of interest.
References
- Wong, K.d.; Fan, Q. Building information modelling (BIM) for sustainable building design. Facilities 2013, 31, 138–157. [Google Scholar] [CrossRef]
- Lee, H.; Calvin, K.; Dasgupta, D.; Krinner, G.; Mukherji, A.; Thorne, P.; Trisos, C.; Romero, J.; Aldunce, P.; Barret, K.; et al. Climate Change 2023: Synthesis Report, Summary for Policymakers; Contribution of Working Groups I, II and III to the Sixth Assessment Report of the Intergovernmental Panel on Climate Change, Core Writing Team, Lee, H., Romero, J., Eds.; IPCC: Geneva, Switzerland, 2023. [Google Scholar]
- Cemesova, A.; Hopfe, C.J.; Mcleod, R.S. PassivBIM: Enhancing interoperability between BIM and low energy design software. Autom. Constr. 2015, 57, 17–32. [Google Scholar] [CrossRef]
- Abanda, F.; Tah, J.; Cheung, F. BIM in off-site manufacturing for buildings. J. Build. Eng. 2017, 14, 89–102. [Google Scholar] [CrossRef]
- Schlueter, A.; Geyer, P. Linking BIM and Design of Experiments to balance architectural and technical design factors for energy performance. Autom. Constr. 2018, 86, 33–43. [Google Scholar] [CrossRef]
- Ürge-Vorsatz, D.; Lucon, O.; Akbari, H.; Bertoldi, P.; Cabeza, L.; Eyre, N.; Gadgil, A.; Harvey, D.; Jiang, Y.; Liphoto, E. Climate Change 2014: Mitigation of Climate Change; IPCC: Geneva, Switzerland, 2014; Chapter 9: Buildings. [Google Scholar]
- Mohammadi, A.; Daraio, J.A. Improving the energy efficiency of existing residential buildings by applying passive and cost-effective solutions in the Hot and humid region of Iran. Space Ontol. Int. J. 2020, 9, 77–96. [Google Scholar]
- Shoubi, M.V.; Shoubi, M.V.; Bagchi, A.; Barough, A.S. Reducing the operational energy demand in buildings using building information modeling tools and sustainability approaches. Ain Shams Eng. J. 2015, 6, 41–55. [Google Scholar] [CrossRef]
- McLeod, R.S.; Hopfe, C.J.; Rezgui, Y. An investigation into recent proposals for a revised definition of zero carbon homes in the UK. Energy Policy 2012, 46, 25–35. [Google Scholar] [CrossRef]
- Ahmad, T.; Aibinu, A.; Thaheem, M.J. BIM-based iterative tool for sustainable building design: A conceptual framework. Procedia Eng. 2017, 180, 782–792. [Google Scholar] [CrossRef]
- Niu, J. Some significant environmental issues in high-rise residential building design in urban areas. Energy Build. 2004, 36, 1259–1263. [Google Scholar] [CrossRef]
- Liu, T.; Chen, L.; Yang, M.; Sandanayake, M.; Miao, P.; Shi, Y.; Yap, P.-S. Sustainability considerations of green buildings: A detailed overview on current advancements and future considerations. Sustainability 2022, 14, 14393. [Google Scholar] [CrossRef]
- Li, Y.; Rong, Y.; Ahmad, U.M.; Wang, X.; Zuo, J.; Mao, G. A comprehensive review on green buildings research: Bibliometric analysis during 1998–2018. Environ. Sci. Pollut. Res. 2021, 28, 46196–46214. [Google Scholar] [CrossRef] [PubMed]
- Ghahramani, M.; Habibi, D.; Ghahramani, M.; Nazari-Heris, M.; Aziz, A. Sustainable Buildings: A Comprehensive Review and Classification of Challenges and Issues, Benefits, and Future Directions. In Natural Energy, Lighting, and Ventilation in Sustainable Buildings; Springer: Berlin/Heidelberg, Germany, 2023; pp. 1–28. [Google Scholar]
- Kent, M.G.; Parkinson, T.; Schiavon, S. Indoor environmental quality in WELL-certified and LEED-certified buildings. Sci. Rep. 2024, 14, 15120. [Google Scholar] [CrossRef] [PubMed]
- Azhar, S.; Carlton, W.A.; Olsen, D.; Ahmad, I. Building information modeling for sustainable design and LEED® rating analysis. Autom. Constr. 2011, 20, 217–224. [Google Scholar] [CrossRef]
- Schlueter, A.; Thesseling, F. Building information model based energy/exergy performance assessment in early design stages. Autom. Constr. 2009, 18, 153–163. [Google Scholar] [CrossRef]
- Seow, Y.; Goffin, N.; Rahimifard, S.; Woolley, E. A ‘Design for Energy Minimization’approach to reduce energy consumption during the manufacturing phase. Energy 2016, 109, 894–905. [Google Scholar] [CrossRef]
- Daqiqnia, A.H.; Fard Moradinia, S.; Baghalzadeh Shishehgarkhaneh, M. Toward nearly zero energy building designs: A comparative study of various techniques. AUT J. Civ. Eng. 2021, 5, 339–356. [Google Scholar]
- Migilinskas, D.; Popov, V.; Juocevicius, V.; Ustinovichius, L. The benefits, obstacles and problems of practical BIM implementation. Procedia Eng. 2013, 57, 767–774. [Google Scholar] [CrossRef]
- Chow, D.H.; Levermore, G.J. The effects of future climate change on heating and cooling demands in office buildings in the UK. Build. Serv. Eng. Res. Technol. 2010, 31, 307–323. [Google Scholar] [CrossRef]
- Wong, J.K.W.; Zhou, J. Enhancing environmental sustainability over building life cycles through green BIM: A review. Autom. Constr. 2015, 57, 156–165. [Google Scholar] [CrossRef]
- Baghalzadeh Shishehgarkhaneh, M.; Keivani, A.; Moehler, R.C.; Jelodari, N.; Roshdi Laleh, S. Internet of Things (IoT), Building Information Modeling (BIM), and Digital Twin (DT) in construction industry: A review, bibliometric, and network analysis. Buildings 2022, 12, 1503. [Google Scholar] [CrossRef]
- Wong, J.K.-W.; Kuan, K.-L. Implementing ‘BEAM Plus’ for BIM-based sustainability analysis. Autom. Constr. 2014, 44, 163–175. [Google Scholar] [CrossRef]
- Baghalzadeh Shishehgarkhaneh, M.; Fard Moradinia, S. The role of Building Information Modeling (BIM) in reducing the number of project dispute resolution sessions. In Proceedings of the 8th National Conference on Civil Engineering, Architecture and Sustainable Urban Development of Iran, Mashhad, Iran, 24 August 2020. [Google Scholar]
- Butt, T.E.; Francis, T.J.; Greenwood, D.; Jones, K.; Nasir, A.M. The role of BIM in tackling obsolescence, climate change, and sustainability. Angl. Rus. Res. Online 2015, 149, 555–565. [Google Scholar]
- Shishehgarkhaneh, M.B.; Azizi, M.; Basiri, M.; Moehler, R.C. BIM-based resource tradeoff in project scheduling using fire hawk optimizer (FHO). Buildings 2022, 12, 1472. [Google Scholar] [CrossRef]
- Atik, S.; Aparisi, T.D.; Raslan, R. The opportunities and challenges of using LCA-based BIM plugins in early-stage building design: An industry expert perspective. In Proceedings of the International Civil Engineering and Architecture Conference, Hanoi, Vietnam, 16–18 December 2022; pp. 401–408. [Google Scholar]
- Potrč Obrecht, T.; Röck, M.; Hoxha, E.; Passer, A. BIM and LCA integration: A systematic literature review. Sustainability 2020, 12, 5534. [Google Scholar] [CrossRef]
- Houde, K. Using Revit and Dynamo to Assess Embodied Carbon. 2021. Available online: https://www.autodesk.com/autodesk-university/article/Using-Revit-and-Dynamo-Assess-Embodied-Carbon-2021 (accessed on 20 September 2024).
- Jrade, A.; Jalaei, F. Integrating building information modelling with sustainability to design building projects at the conceptual stage. Build. Simul. 2013, 6, 429–444. [Google Scholar] [CrossRef]
- Kim, S.; Zadeh, P.A.; Staub-French, S.; Froese, T.; Cavka, B.T. Assessment of the impact of window size, position and orientation on building energy load using BIM. Procedia Eng. 2016, 145, 1424–1431. [Google Scholar] [CrossRef]
- Motawa, I.; Carter, K. Sustainable BIM-based evaluation of buildings. Procedia-Soc. Behav. Sci. 2013, 74, 419–428. [Google Scholar] [CrossRef]
- Alhazzaa, K.; Yan, W. Integrating Parametric Modeling, BIM, and Building Performance Analysis into Augmented Reality for Architectural Design and Education. In Proceedings of the 2023 7th International Conference on Virtual and Augmented Reality Simulations, Sydney, NSW, Australia, 3–5 March 2023; pp. 68–76. [Google Scholar]
- Hasan, I. Energy Optimization of a Residential High Rise Building using BIM for Sustainability. Master’s Thesis, Capital University of Science and Technology, Islamabad, Pakistan, 2020. [Google Scholar]
- Bonomolo, M.; Di Lisi, S.; Leone, G. Building information modelling and energy simulation for architecture design. Appl. Sci. 2021, 11, 2252. [Google Scholar] [CrossRef]
- Ghaffarianhoseini, A.; Tookey, J.; Ghaffarianhoseini, A.; Naismith, N.; Azhar, S.; Efimova, O.; Raahemifar, K. Building Information Modelling (BIM) uptake: Clear benefits, understanding its implementation, risks and challenges. Renew. Sustain. Energy Rev. 2017, 75, 1046–1053. [Google Scholar] [CrossRef]
- Montiel-Santiago, F.J.; Hermoso-Orzáez, M.J.; Terrados-Cepeda, J. Sustainability and energy efficiency: BIM 6D. Study of the BIM methodology applied to hospital buildings. Value of interior lighting and daylight in energy simulation. Sustainability 2020, 12, 5731. [Google Scholar] [CrossRef]
- Oti, A.; Tizani, W.; Zada, A.J. A BIM extension for sustainability appraisal of conceptual structural design of steel-framed buildings. In Proceedings of the Computing in Civil and Building Engineering, Proceedings of the 2014 International Conference on Computing in Civil and Building Engineering, Orlando, FL, USA, 23–25 June 2014; pp. 219–226. [Google Scholar]
- Kamari, A.; Paari, A.; Torvund, H.Ø. Bim-enabled virtual reality (vr) for sustainability life cycle and cost assessment. Sustainability 2020, 13, 249. [Google Scholar] [CrossRef]
- Carvalho, J.P.; Bragança, L.; Mateus, R. Optimising building sustainability assessment using BIM. Autom. Constr. 2019, 102, 170–182. [Google Scholar] [CrossRef]
- Gourlis, G.; Kovacic, I. Building Information Modelling for analysis of energy efficient industrial buildings—A case study. Renew. Sustain. Energy Rev. 2017, 68, 953–963. [Google Scholar] [CrossRef]
- Andriamamonjy, A.; Saelens, D.; Klein, R. A combined scientometric and conventional literature review to grasp the entire BIM knowledge and its integration with energy simulation. J. Build. Eng. 2019, 22, 513–527. [Google Scholar] [CrossRef]
- Welle, B.; Haymaker, J.; Rogers, Z. ThermalOpt: A methodology for automated BIM-based multidisciplinary thermal simulation for use in optimization environments. In Proceedings of the Building Simulation, 12th Conference of IBPSA, Sydney, NSW, Australia, 14–16 November 2011; pp. 293–313. [Google Scholar]
- Arayici, Y.; Aouad, G. Building information modelling (BIM) for construction lifecycle management. Constr. Build. Des. Mater. Tech. 2010, 2010, 99–118. [Google Scholar]
- Xie, J.; Wang, W.; Liu, J.; Pan, S. Thermal performance analysis of PCM wallboards for building application based on numerical simulation. Sol. Energy 2018, 162, 533–540. [Google Scholar] [CrossRef]
- Kenisarin, M.; Mahkamov, K. Passive thermal control in residential buildings using phase change materials. Renew. Sustain. Energy Rev. 2016, 55, 371–398. [Google Scholar] [CrossRef]
- Mehling, H.; Cabeza, L.F. Heat and Cold Storage with PCM; Heat Mass Transfer; Springer: Berlin/Heidelberg, Germany, 2008; pp. 11–55. [Google Scholar]
- Sarbu, I.; Sebarchievici, C. A comprehensive review of thermal energy storage. Sustainability 2018, 10, 191. [Google Scholar] [CrossRef]
- Cui, Y.; Xie, J.; Liu, J.; Pan, S. Review of phase change materials integrated in building walls for energy saving. Procedia Eng. 2015, 121, 763–770. [Google Scholar] [CrossRef]
- Stetiu, C.; Feustel, H.E. Phase-Change Wallboard and Mechanical Night Ventilation in Commercial Buildings; American Council for an Energy-Efficient Economy: Washington, DC, USA, 1998. [Google Scholar]
- Devaux, P.; Farid, M.M. Benefits of PCM underfloor heating with PCM wallboards for space heating in winter. Appl. Energy 2017, 191, 593–602. [Google Scholar] [CrossRef]
- Lee, K.O.; Medina, M.A.; Sun, X.; Jin, X. Thermal performance of phase change materials (PCM)-enhanced cellulose insulation in passive solar residential building walls. Sol. Energy 2018, 163, 113–121. [Google Scholar] [CrossRef]
- Saffari, M.; De Gracia, A.; Fernández, C.; Cabeza, L.F. Simulation-based optimization of PCM melting temperature to improve the energy performance in buildings. Appl. Energy 2017, 202, 420–434. [Google Scholar] [CrossRef]
- Sun, X.; Jovanovic, J.; Zhang, Y.; Fan, S.; Chu, Y.; Mo, Y.; Liao, S. Use of encapsulated phase change materials in lightweight building walls for annual thermal regulation. Energy 2019, 180, 858–872. [Google Scholar] [CrossRef]
- Sadineni, S.B.; Madala, S.; Boehm, R.F. Passive building energy savings: A review of building envelope components. Renew. Sustain. Energy Rev. 2011, 15, 3617–3631. [Google Scholar] [CrossRef]
- Baniassadi, A.; Sajadi, B.; Amidpour, M.; Noori, N. Economic optimization of PCM and insulation layer thickness in residential buildings. Sustain. Energy Technol. Assess. 2016, 14, 92–99. [Google Scholar] [CrossRef]
- Wang, J.; Sun, W.; Shou, W.; Wang, X.; Wu, C.; Chong, H.-Y.; Liu, Y.; Sun, C. Integrating BIM and LiDAR for real-time construction quality control. J. Intell. Robot. Syst. 2015, 79, 417–432. [Google Scholar] [CrossRef]
- Leal Filho, W.; Pallant, E.; Enete, A.; Richter, B.; Brandli, L. Planning and implementing sustainability in higher education institutions: An overview of the difficulties and potentials. Int. J. Sustain. Dev. World Ecol. 2018, 25, 713–721. [Google Scholar] [CrossRef]
- Aldawoud, A.; Salameh, T.; Ki Kim, Y. Double skin façade: Energy performance in the United Arab Emirates. Energy Sources Part B Econ. Plan. Policy 2021, 16, 387–405. [Google Scholar] [CrossRef]
- Poirazis, H. Double Skin Façades for Office Buildings; Report EBD-R—04/3; Lund University: Lund, Sweden, 2004. [Google Scholar]
- Hensen, J.; Bartak, M.; Drkal, F. Modeling and simulation of a double-skin facade system. ASHRAE Trans. 2002, 108, 1251–1259. [Google Scholar]
- Sabooni, M.A.; Vaseti, H.M.; Maerefat, M.; Azimi, A. Development of the capability of Energyplus software to simulation of building double-skin facade. In Proceedings of the SEBUA-12 ICHMT International Symposium on Sustainable Energy in Buildings and Urban Areas, Kusadasi, Turkey, 14–20 July 2012. [Google Scholar]
- Ciancio, V.; Falasca, S.; Golasi, I.; Curci, G.; Coppi, M.; Salata, F. Influence of input climatic data on simulations of annual energy needs of a building: EnergyPlus and WRF modeling for a case study in Rome (Italy). Energies 2018, 11, 2835. [Google Scholar] [CrossRef]
- Aljundi, K.; Pinto, A.; Rodrigues, F. Energy analysis using cooperation between bim tools (Revit and Green Building Studio) and Energy Plus. In Proceedings of the 1º Congresso Português de Building Information Modelling, Guimaraes, Portugal, 24–25 November 2016; pp. 24–65. [Google Scholar]
- Li, H.X.; Ma, Z.; Liu, H.; Wang, J.; Al-Hussein, M.; Mills, A. Exploring and verifying BIM-based energy simulation for building operations. Eng. Constr. Archit. Manag. 2020, 27, 1679–1702. [Google Scholar] [CrossRef]
- Ama Gonzalo, F.d.; Ferrandiz, J.A.; Moreno Santamaria, B. Building Energy Modeling by means of BIM software. A case study with Water Flow Glazing. In Proceedings of the Seventh European Conference on Renewable Energy Systems (ECRES2019), Madrid, Spain, 10–12 June 2019. [Google Scholar]
- Rezazadeh, N.; Medi, H. Thermal behavior of Double Skin Facade in terms of energy consumption in the climate of North of Iran-Rasht. Space Ontol. Int. J. 2017, 6, 33–48. [Google Scholar]
- Norouzi, R.; Motalebzade, R. Effect of Double-Skin Façade on Thermal Energy Losses in Buildings: A Case Study in Tabriz. In Exergetic, Energetic and Environmental Dimensions; Elsevier: Amsterdam, The Netherlands, 2018; pp. 193–209. [Google Scholar]
- Shameri, M.A.; Alghoul, M.; Sopian, K.; Zain, M.F.M.; Elayeb, O. Perspectives of double skin façade systems in buildings and energy saving. Renew. Sustain. Energy Rev. 2011, 15, 1468–1475. [Google Scholar] [CrossRef]
- Farrokhzad, M. Double skin glass façade and its effect on saving energy. Iran Univ. Sci. Technol. 2014, 24, 65–74. [Google Scholar]
- Crawley, D.B.; Lawrie, L.K.; Winkelmann, F.C.; Buhl, W.F.; Huang, Y.J.; Pedersen, C.O.; Strand, R.K.; Liesen, R.J.; Fisher, D.E.; Witte, M.J. EnergyPlus: Creating a new-generation building energy simulation program. Energy Build. 2001, 33, 319–331. [Google Scholar] [CrossRef]
- Al-janabi, A.; Kavgic, M.; Mohammadzadeh, A.; Azzouz, A. Comparison of EnergyPlus and IES to model a complex university building using three scenarios: Free-floating, ideal air load system, and detailed. J. Build. Eng. 2019, 22, 262–280. [Google Scholar] [CrossRef]
- Alibabaei, N.; Fung, A.S.; Raahemifar, K. Development of Matlab-TRNSYS co-simulator for applying predictive strategy planning models on residential house HVAC system. Energy Build. 2016, 128, 81–98. [Google Scholar] [CrossRef]
- Nayak, A.K.; Hagishima, A. Modification of building energy simulation tool TRNSYS for modelling nonlinear heat and moisture transfer phenomena by TRNSYS/MATLAB integration. In Proceedings of the E3S Web of Conferences, 12th Nordic Symposium on Building Physics (NSB 2020), Tallin, Estonia, 6–9 September 2020; p. 25009. [Google Scholar]
- Millán-Martínez, M.; Osma-Pinto, G.; Jaramillo-Ibarra, J. Estimating a Building’s Energy Performance using a Composite Indicator: A Case Study. TecnoLógicas 2022, 25, 2352. [Google Scholar] [CrossRef]
- Finkbeiner, M.; Inaba, A.; Tan, R.; Christiansen, K.; Klüppel, H.-J. The new international standards for life cycle assessment: ISO 14040 and ISO 14044. Int. J. Life Cycle Assess. 2006, 11, 80–85. [Google Scholar] [CrossRef]
- Najjar, M.; Figueiredo, K.; Palumbo, M.; Haddad, A. Integration of BIM and LCA: Evaluating the environmental impacts of building materials at an early stage of designing a typical office building. J. Build. Eng. 2017, 14, 115–126. [Google Scholar] [CrossRef]
- ISO 19650-1:2018; Organization and Digitization of Information About Buildings and Civil Engineering Works, Including Building Information Modelling (BIM)—Information Management Using Building Information Modelling—Part 1: Concepts and Principles. International Organization for Standardization: Geneva, Switzerland, 2018.
- ISO 16739:2013; Industry Foundation Classes (IFC) for Data Sharing in the Construction and Facility Management Industries. International Organization for Standardization: Geneva, Switzerland, 2013.
- Ciccozzi, A.; de Rubeis, T.; Paoletti, D.; Ambrosini, D. BIM to BEM for Building Energy Analysis: A Review of Interoperability Strategies. Energies 2023, 16, 7845. [Google Scholar] [CrossRef]
- Elnabawi, M.H. Building information modeling-based building energy modeling: Investigation of interoperability and simulation results. Front. Built Environ. 2020, 6, 573971. [Google Scholar] [CrossRef]
- Treeck, C.v.; Wimmer, R.; Maile, T. BIM for energy analysis. In Building Information Modeling: Technology Foundations and Industry Practice; Springer: Berlin/Heidelberg, Germany, 2018; pp. 337–347. [Google Scholar]
- Dong, B.; Lam, K.P.; Huang, Y.; Dobbs, G. A comparative study of the IFC and gbXML informational infrastructures for data exchange in computational design support environments. In Proceedings of the Building Simulation 2007: 10th Conference of IBPSA, Beijing, China, 27–30 July 2007. [Google Scholar]
- Bazjanac, V. IFC BIM-based methodology for semi-automated building energy performance simulation. In Proceedings of the 25th International Conference on Information Technology in Construction, Santiago, Chile, 14–16 July 2008. [Google Scholar]
- Silva, M.J.F.; Salvado, F.; Couto, P.; e Azevedo, Á.V. Roadmap proposal for implementing building information modelling (BIM) in Portugal. Open J. Civ. Eng. 2016, 6, 475. [Google Scholar] [CrossRef]
- Azhar, S. Building information modeling (BIM): Trends, benefits, risks, and challenges for the AEC industry. Leadersh. Manag. Eng. 2011, 11, 241–252. [Google Scholar] [CrossRef]
- ASHRAE Standard 62.1-2022; Ventilation for Acceptable Indoor Air Quality. American Society of Heating, Refrigerating and Air-Conditioning Engineers: Peachtree Corners, GA, USA, 2022.
- Iran Ministry of Roads & Urban Development. Iranian National Building Code. Part 5: Construction; Iran Ministry of Roads & Urban Development: Tehra, Iran, 2015. [Google Scholar]
- Simulated Historical Climate & Weather Data for Tabriz. Available online: https://www.meteoblue.com/en/weather/historyclimate/climatemodelled/tabriz_iran_113646 (accessed on 10 July 2024).
- Vose, R.S.; Easterling, D.R.; Gleason, B. Maximum and minimum temperature trends for the globe: An update through 2004. Geophys. Res. Lett. 2005, 32, L23822. [Google Scholar] [CrossRef]
- Ruml, M.; Gregorić, E.; Vujadinović, M.; Radovanović, S.; Matović, G.; Vuković, A.; Počuča, V.; Stojičić, D. Observed changes of temperature extremes in Serbia over the period 1961−2010. Atmos. Res. 2017, 183, 26–41. [Google Scholar] [CrossRef]
- Sanchez-Lorenzo, A.; Calbó, J.; Wild, M. Global and diffuse solar radiation in Spain: Building a homogeneous dataset and assessing their trends. Glob. Planet. Change 2013, 100, 343–352. [Google Scholar] [CrossRef]
- Che, H.; Shi, G.; Zhang, X.; Arimoto, R.; Zhao, J.; Xu, L.; Wang, B.; Chen, Z. Analysis of 40 years of solar radiation data from China, 1961–2000. Geophys. Res. Lett. 2005, 32, L06803. [Google Scholar] [CrossRef]
- Westra, S.; Alexander, L.V.; Zwiers, F.W. Global increasing trends in annual maximum daily precipitation. J. Clim. 2013, 26, 3904–3918. [Google Scholar] [CrossRef]
- Knutson, T.R.; Zeng, F. Model assessment of observed precipitation trends over land regions: Detectable human influences and possible low bias in model trends. J. Clim. 2018, 31, 4617–4637. [Google Scholar] [CrossRef]
- Waqas, A.; Ji, J.; Ali, M.; Alvi, J.Z. Effectiveness of the phase change material-based thermal energy storage integrated with the conventional cooling systems of the buildings—A review. Proc. Inst. Mech. Eng. Part A J. Power Energy 2018, 232, 735–766. [Google Scholar] [CrossRef]
- Kuznik, F.; Virgone, J. Experimental assessment of a phase change material for wall building use. Appl. Energy 2009, 86, 2038–2046. [Google Scholar] [CrossRef]
- Kuznik, F.; Virgone, J. Experimental investigation of wallboard containing phase change material: Data for validation of numerical modeling. Energy Build. 2009, 41, 561–570. [Google Scholar] [CrossRef]
- Younes, C.; Shdid, C.A.; Bitsuamlak, G. Air infiltration through building envelopes: A review. J. Build. Phys. 2012, 35, 267–302. [Google Scholar] [CrossRef]
- Kim, Y.-J.; Yoon, S.-H.; Park, C.-S. Stochastic comparison between simplified energy calculation and dynamic simulation. Energy Build. 2013, 64, 332–342. [Google Scholar] [CrossRef]
- ISO 13790:2008; Energy Performance of Buildings—Calculation of Energy Use for Space Heating and Cooling. International Organization for Standardization: Geneva, Switzerland, 2008.
- Hygh, J.S.; DeCarolis, J.F.; Hill, D.B.; Ranjithan, S.R. Multivariate regression as an energy assessment tool in early building design. Build. Environ. 2012, 57, 165–175. [Google Scholar] [CrossRef]
- Chowdhury, A.A.; Rasul, M.; Khan, M. Parametric analysis of thermal comfort and energy efficiency in building in subtropical climate. In Thermofluid Modeling for Energy Efficiency Applications; Elsevier: Amsterdam, The Netherlands, 2016; pp. 149–168. [Google Scholar]
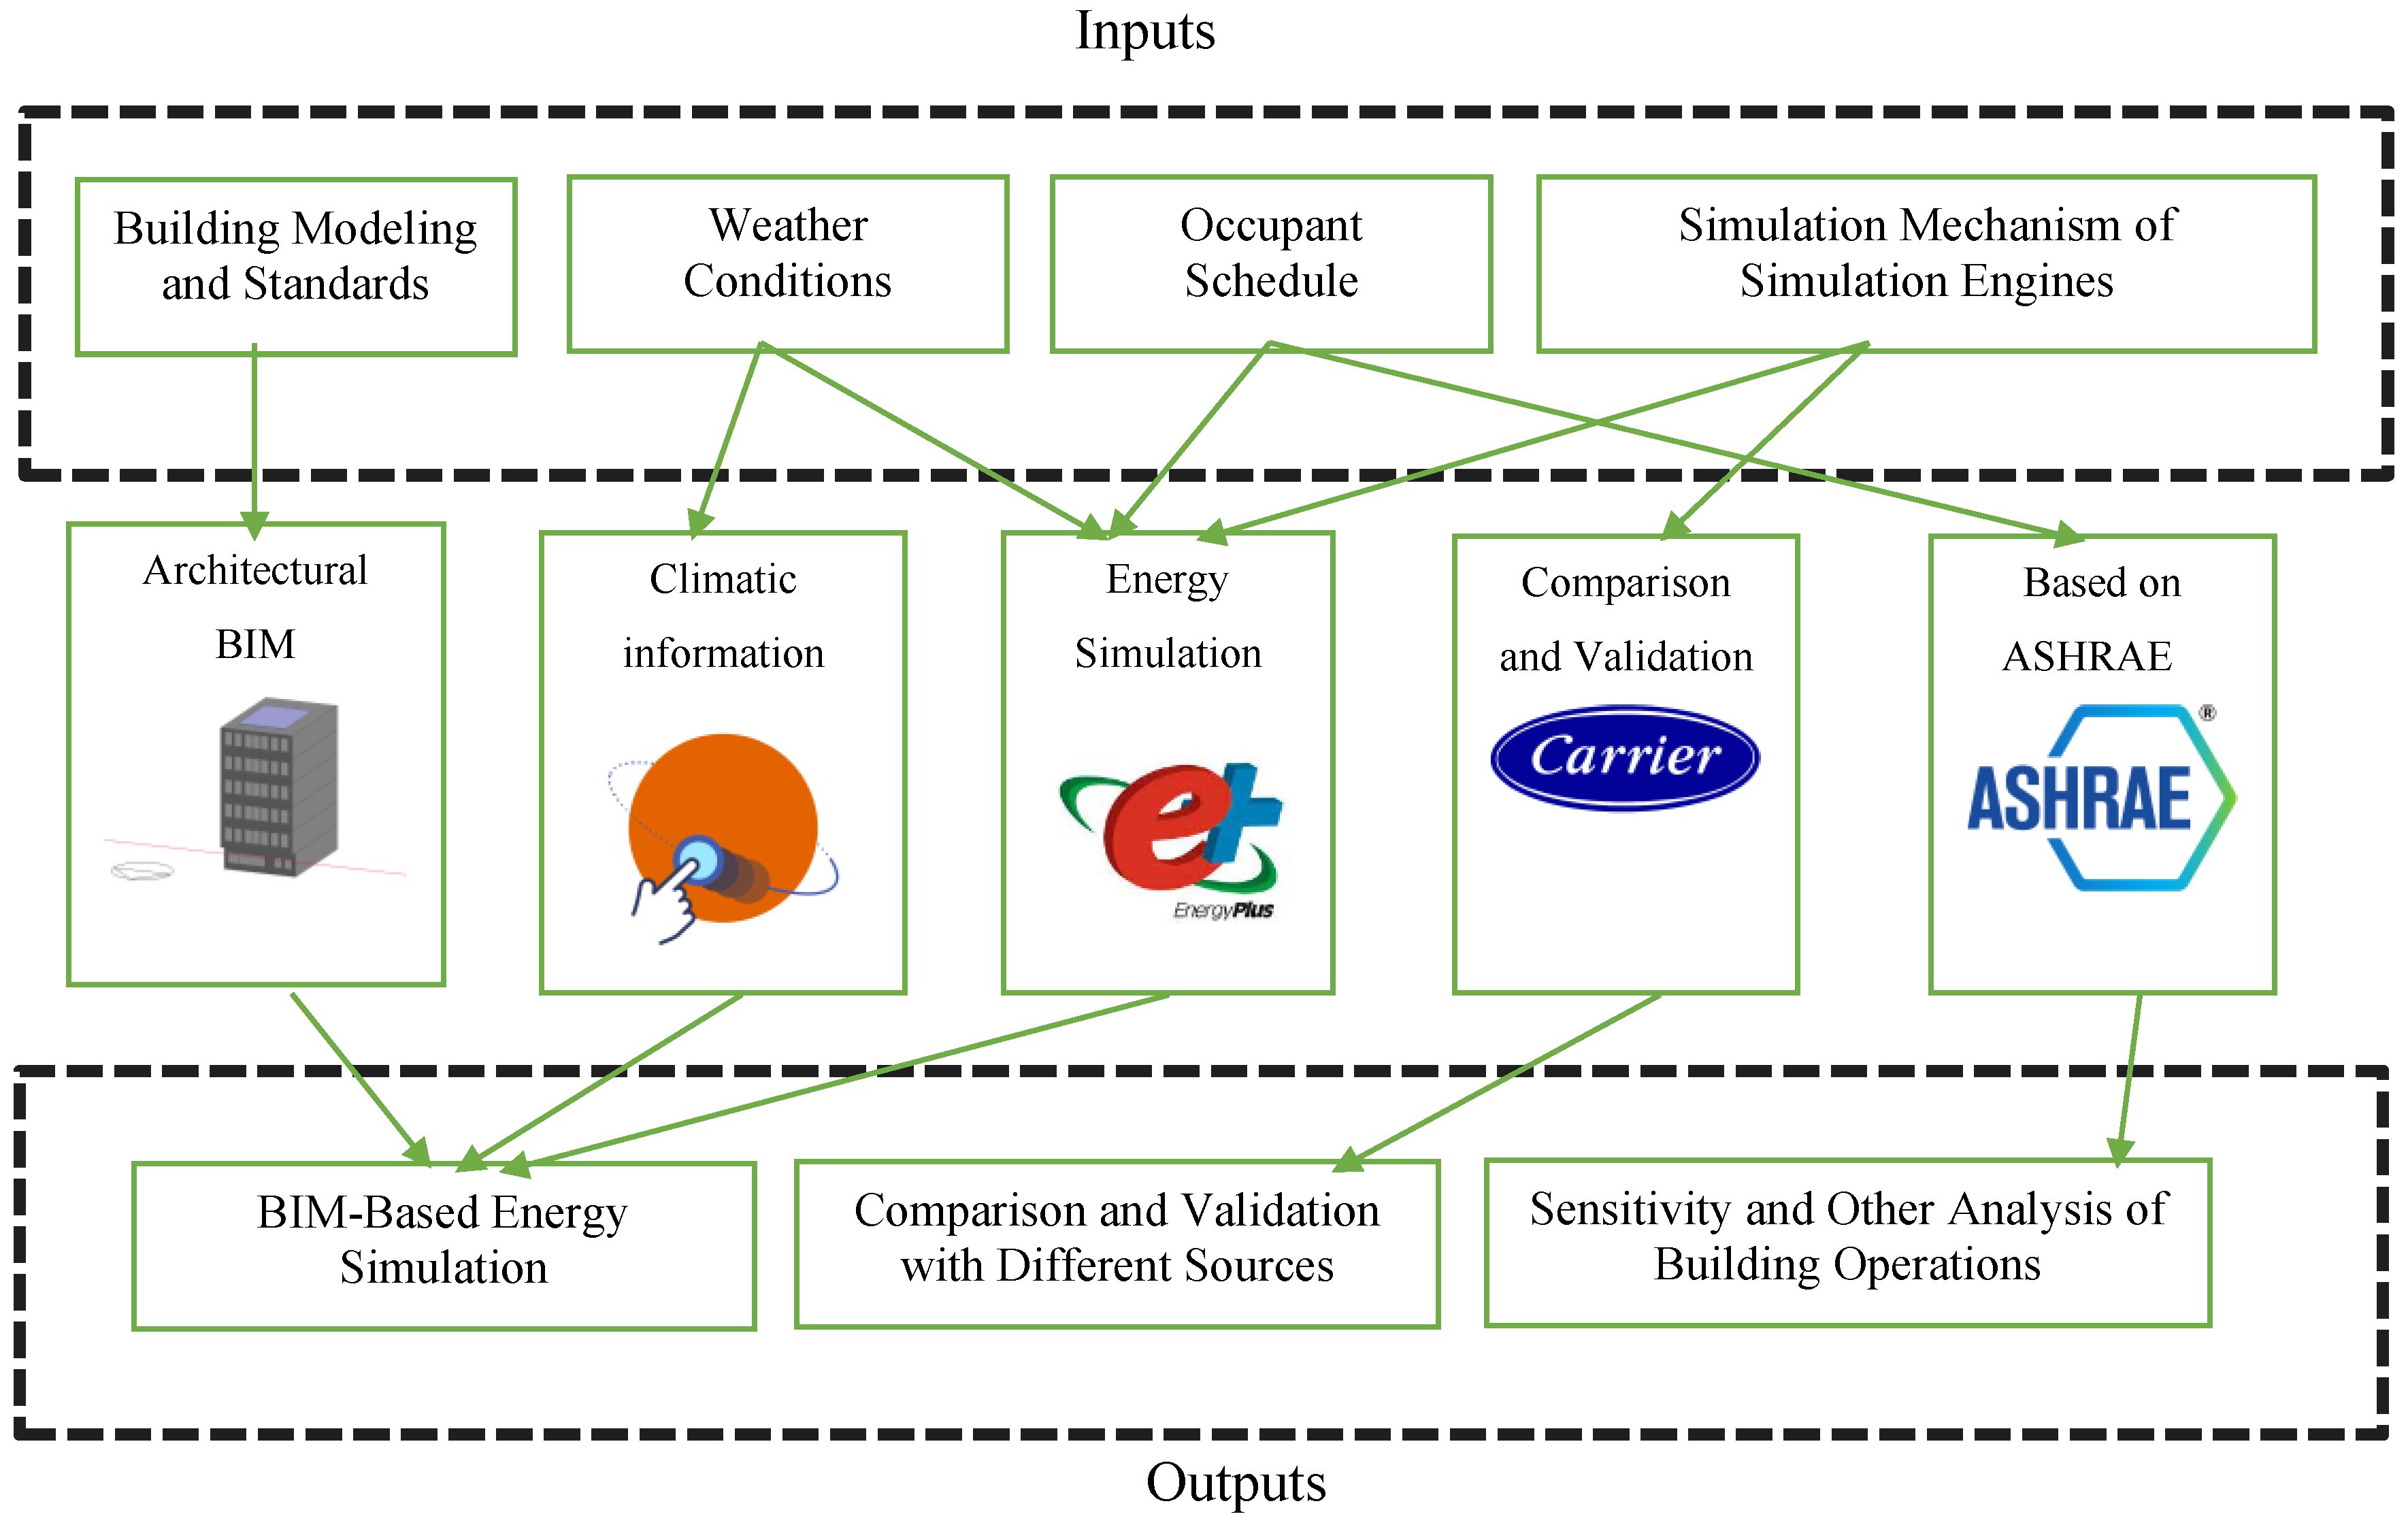
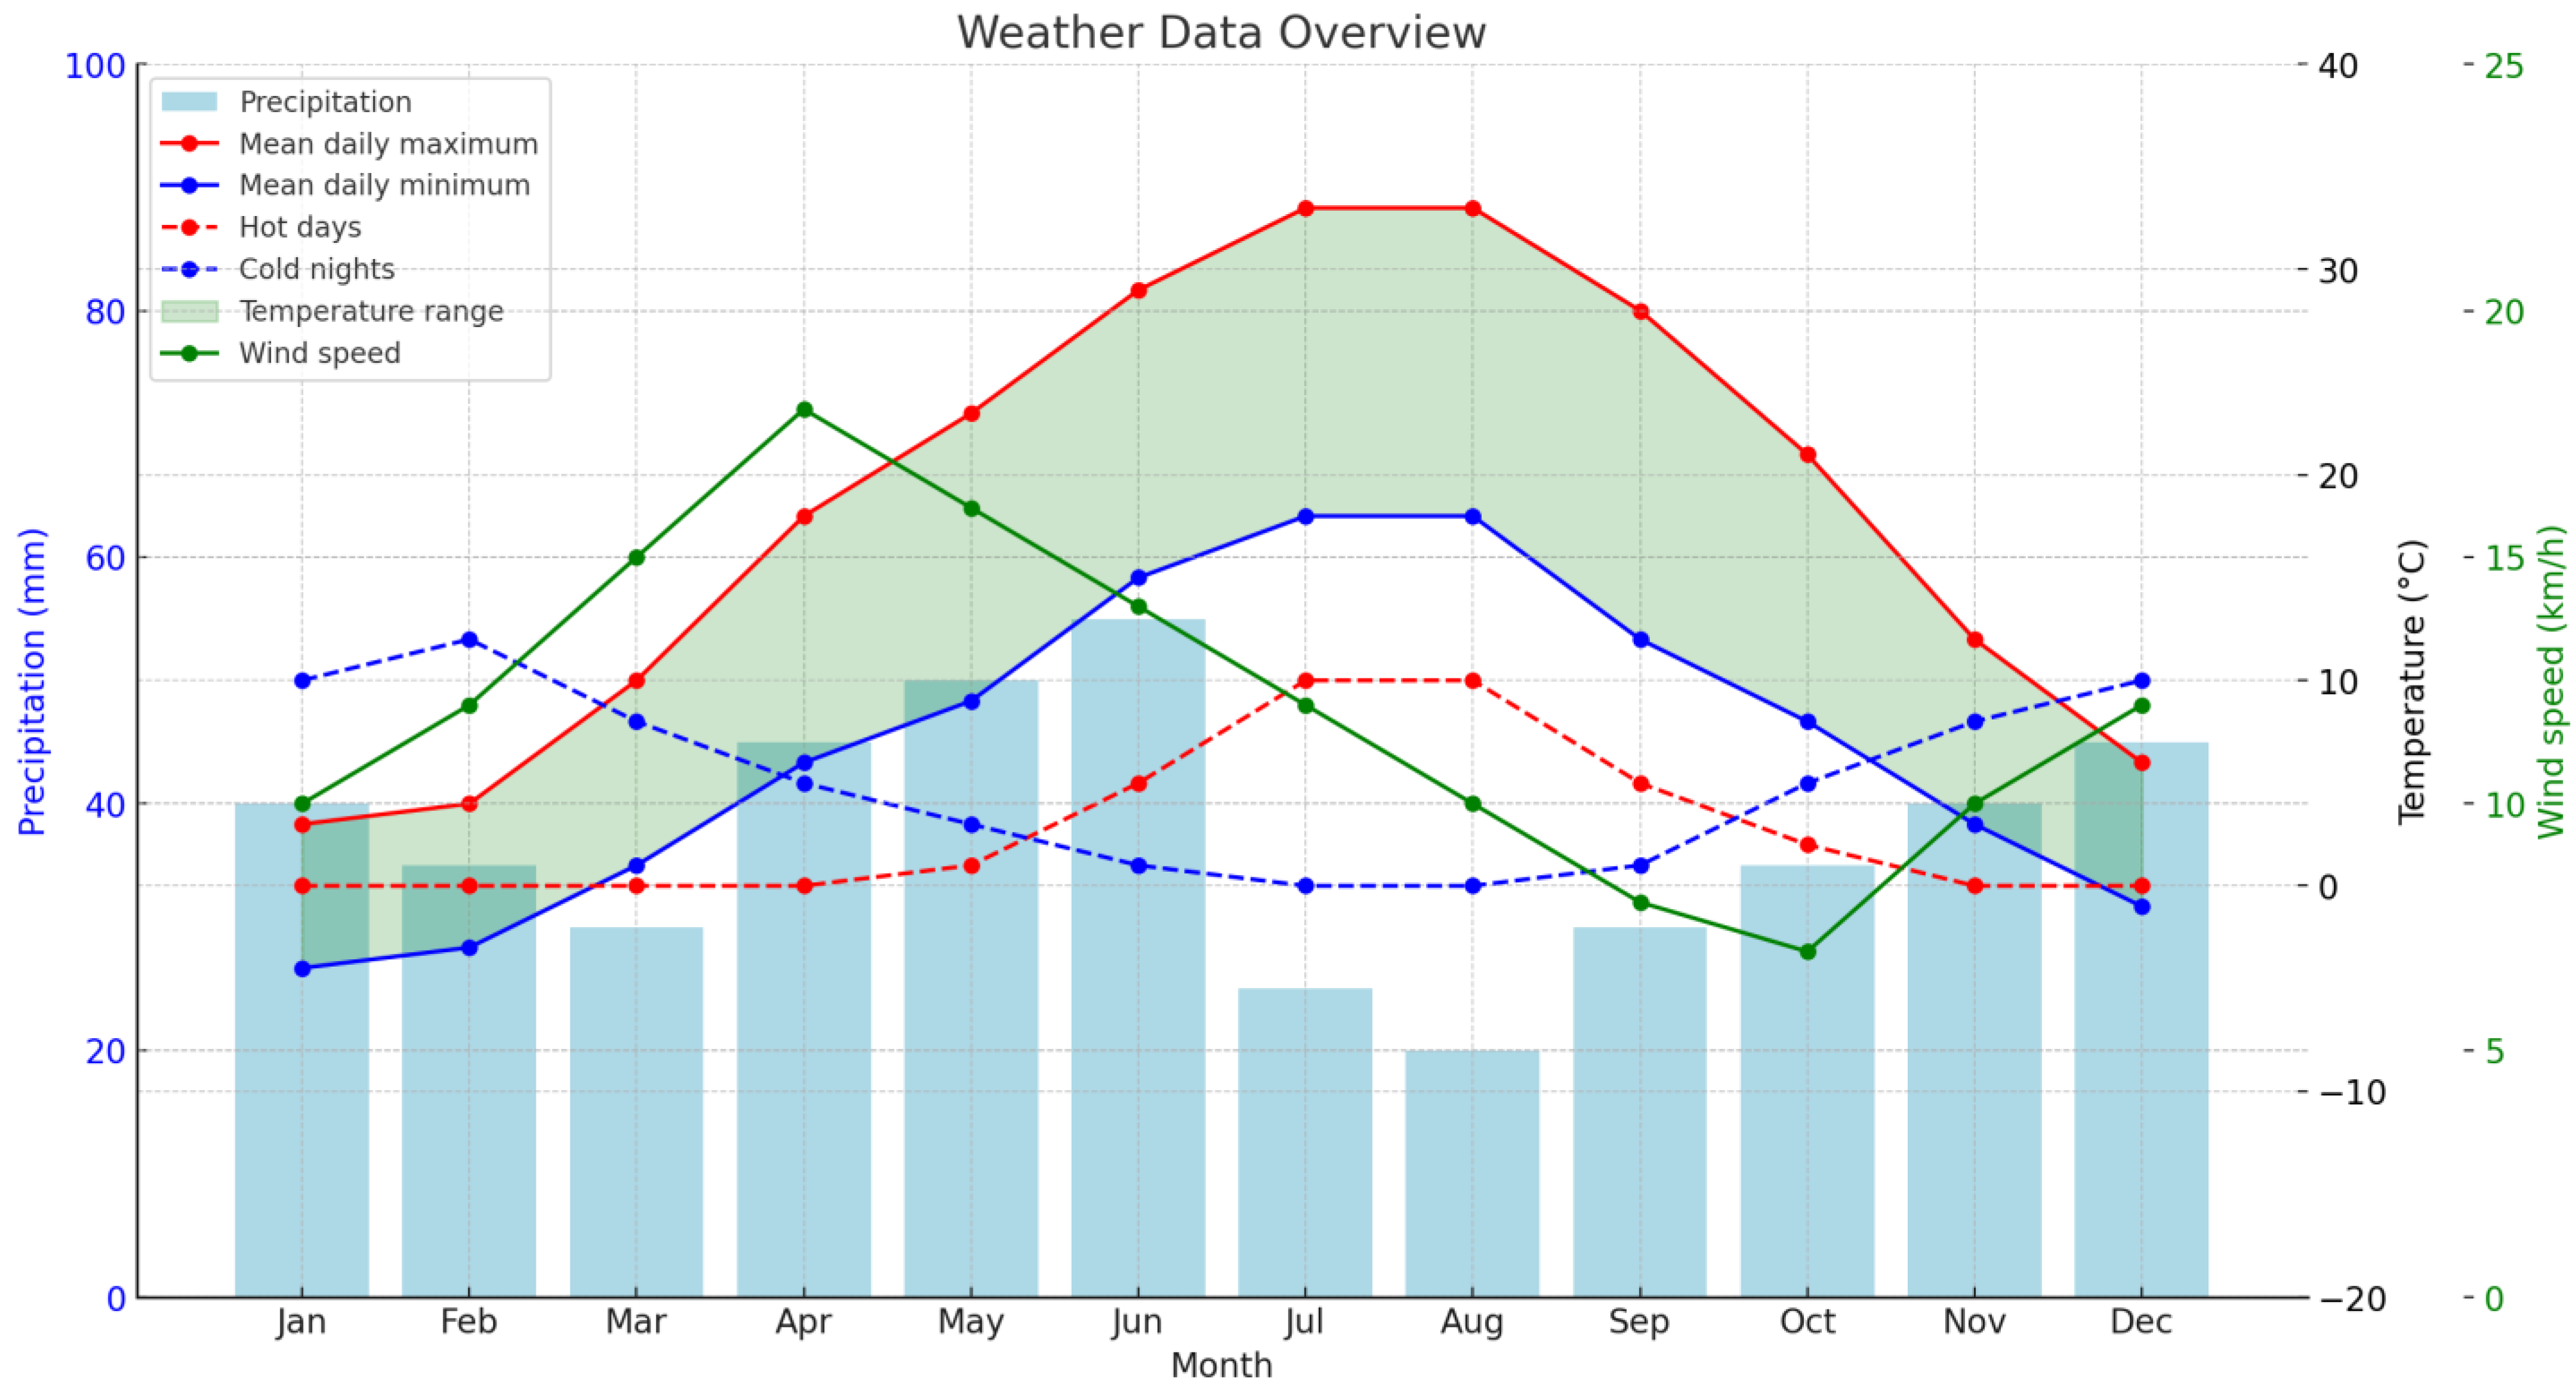
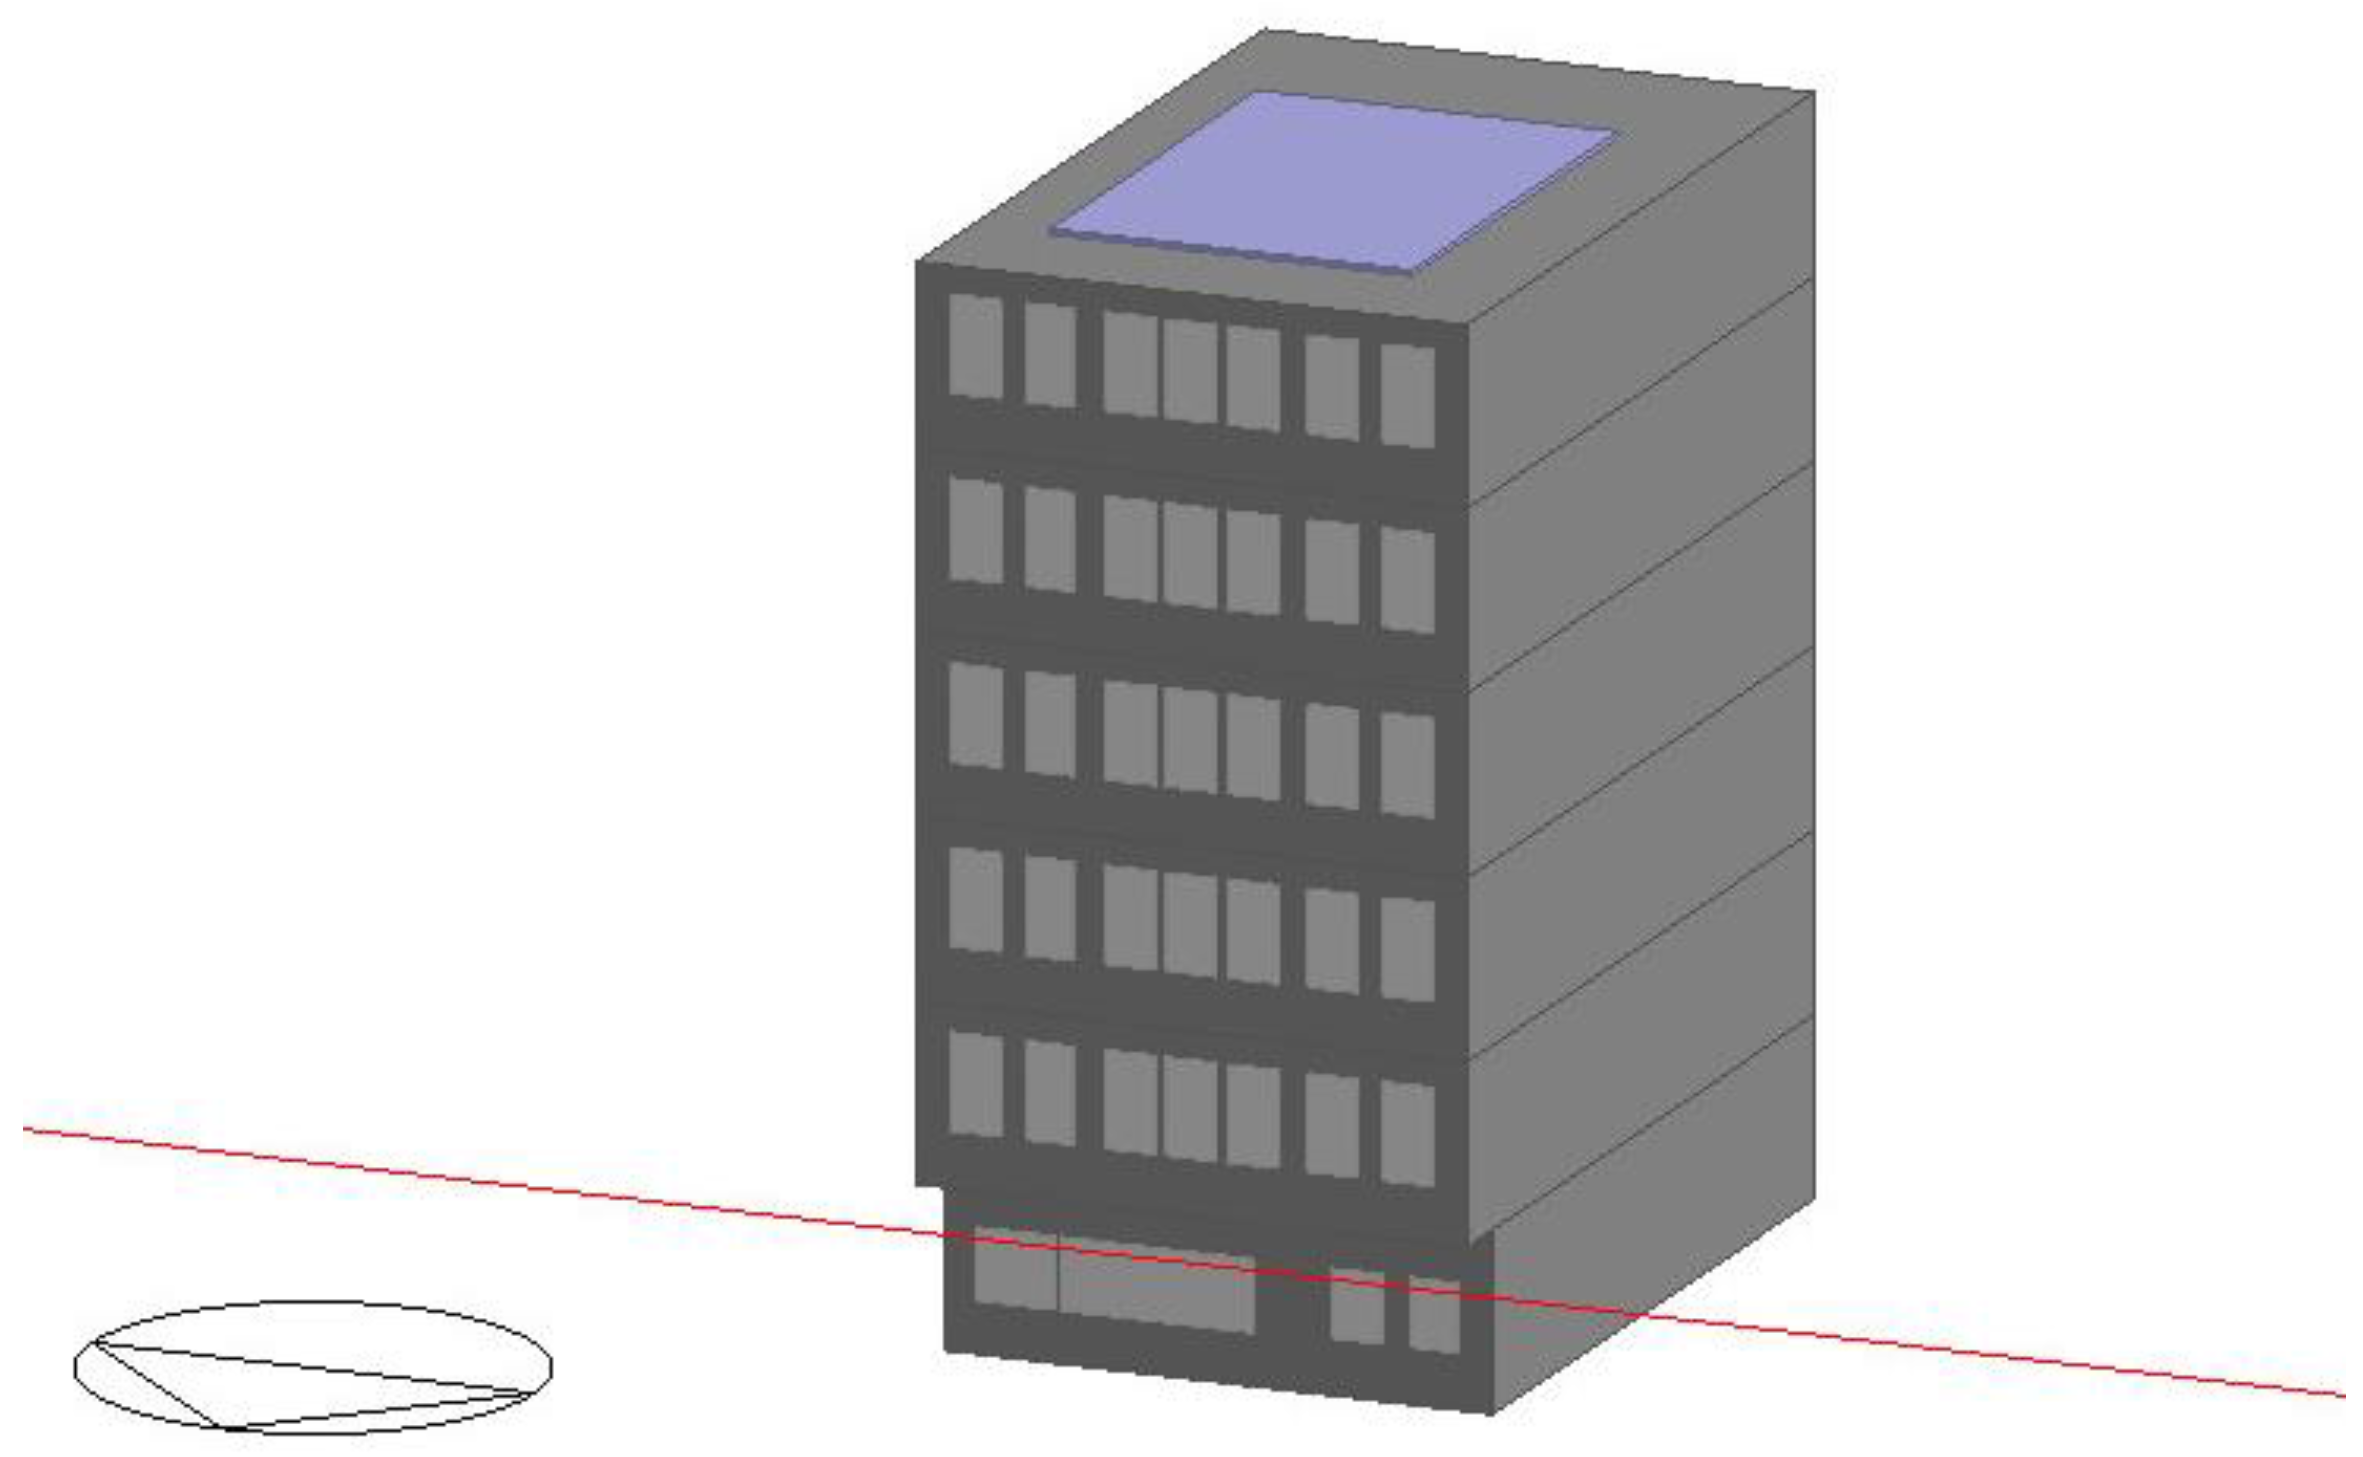
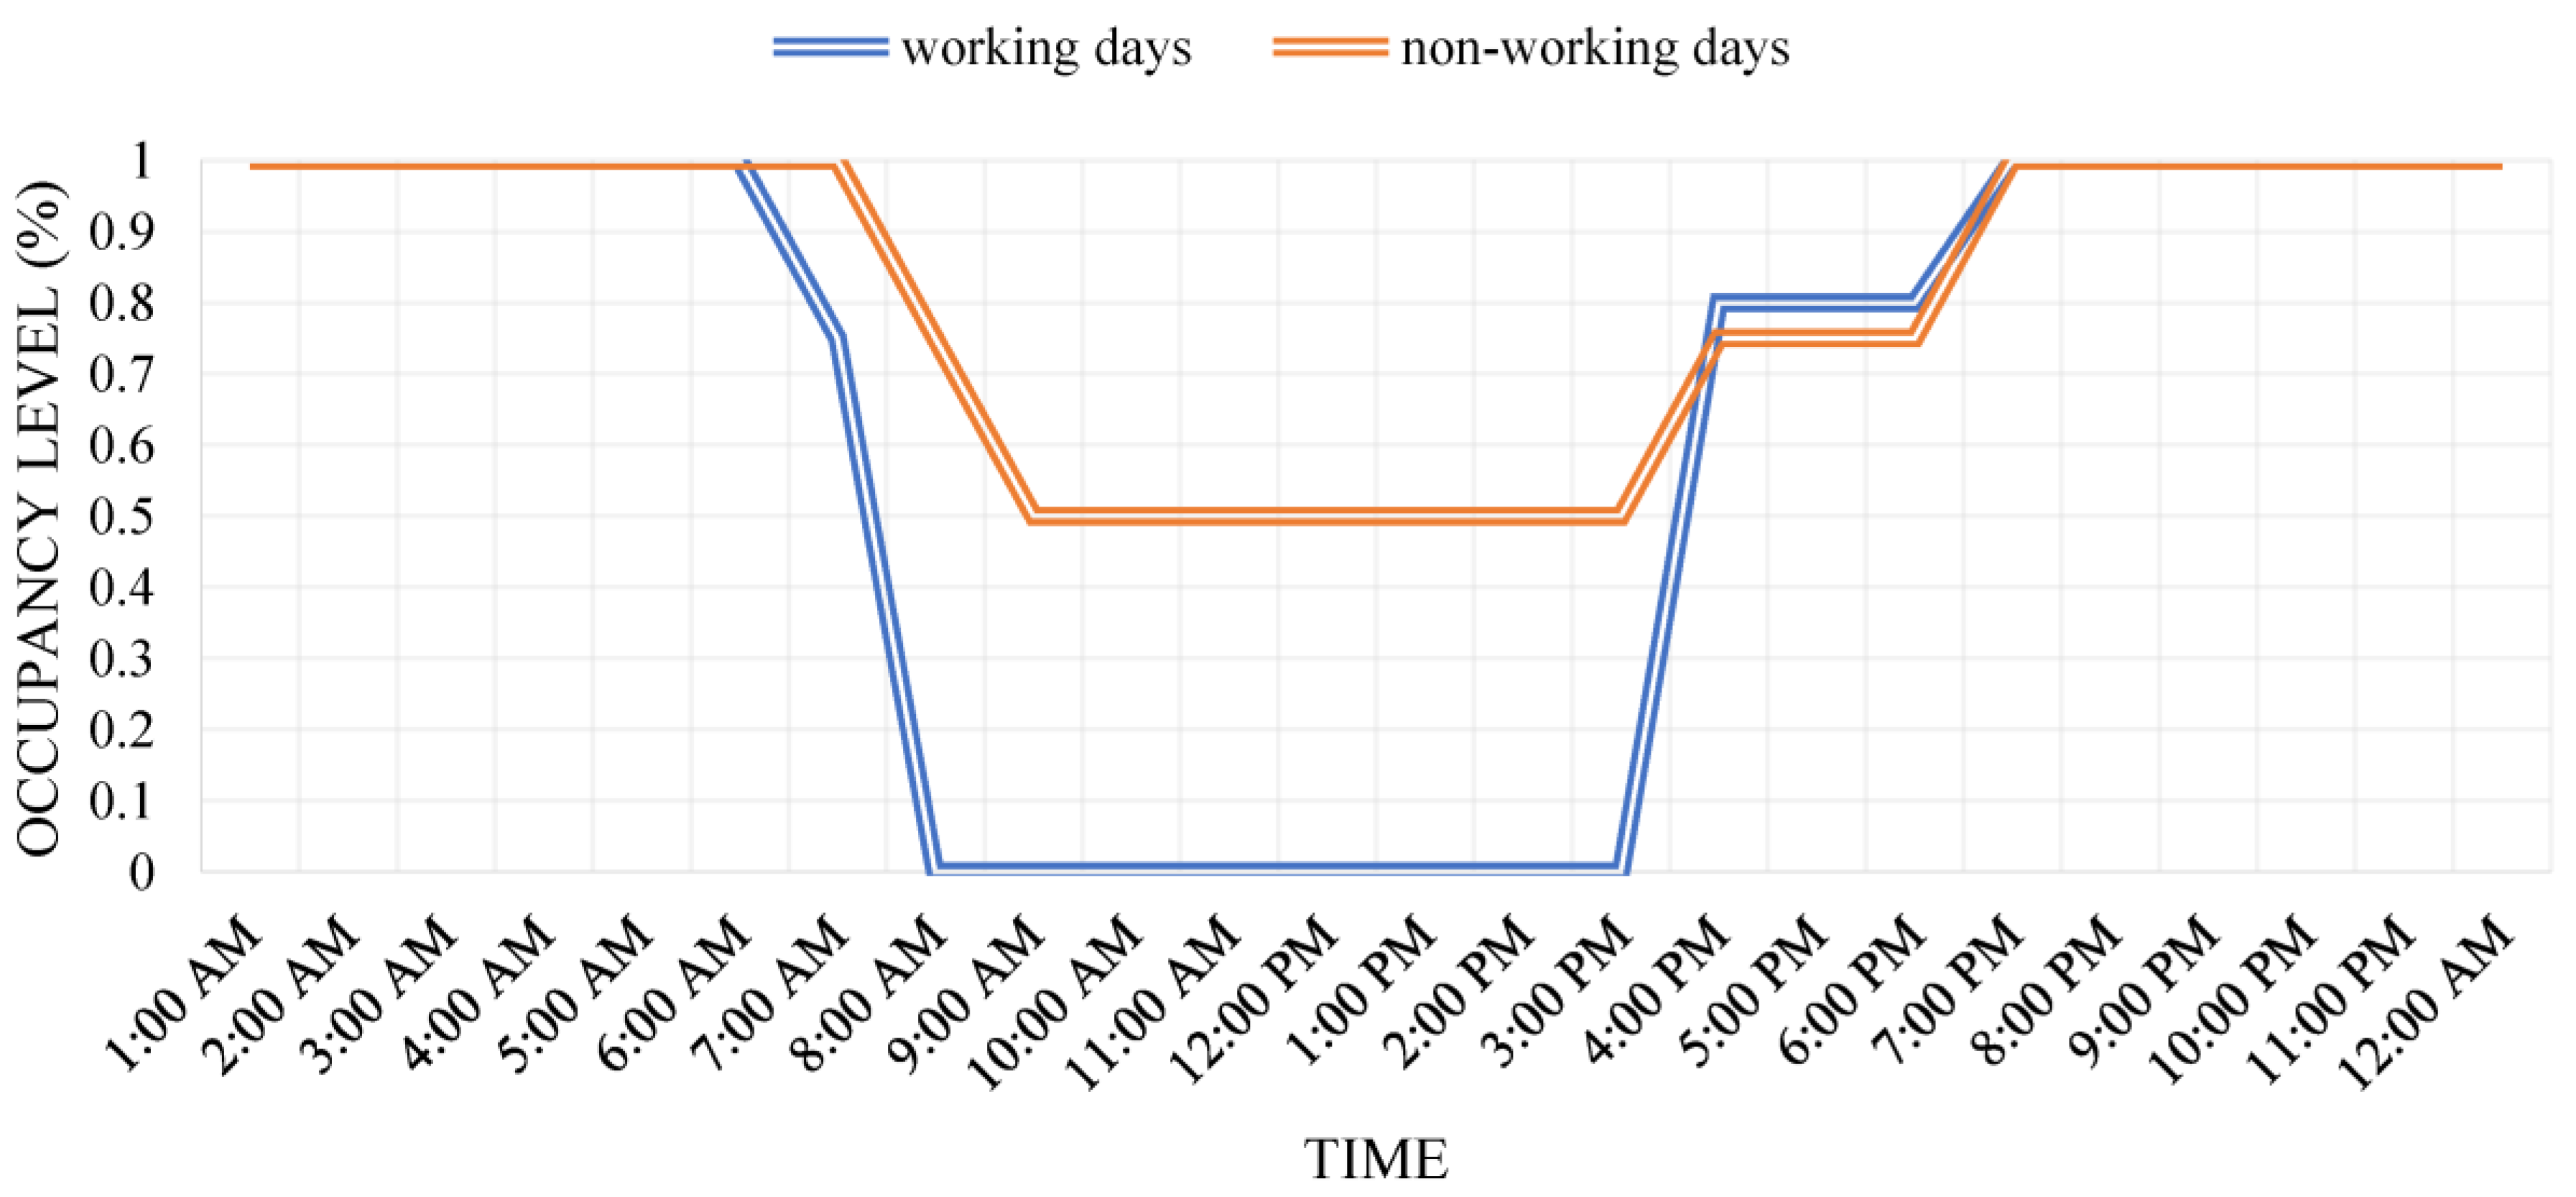
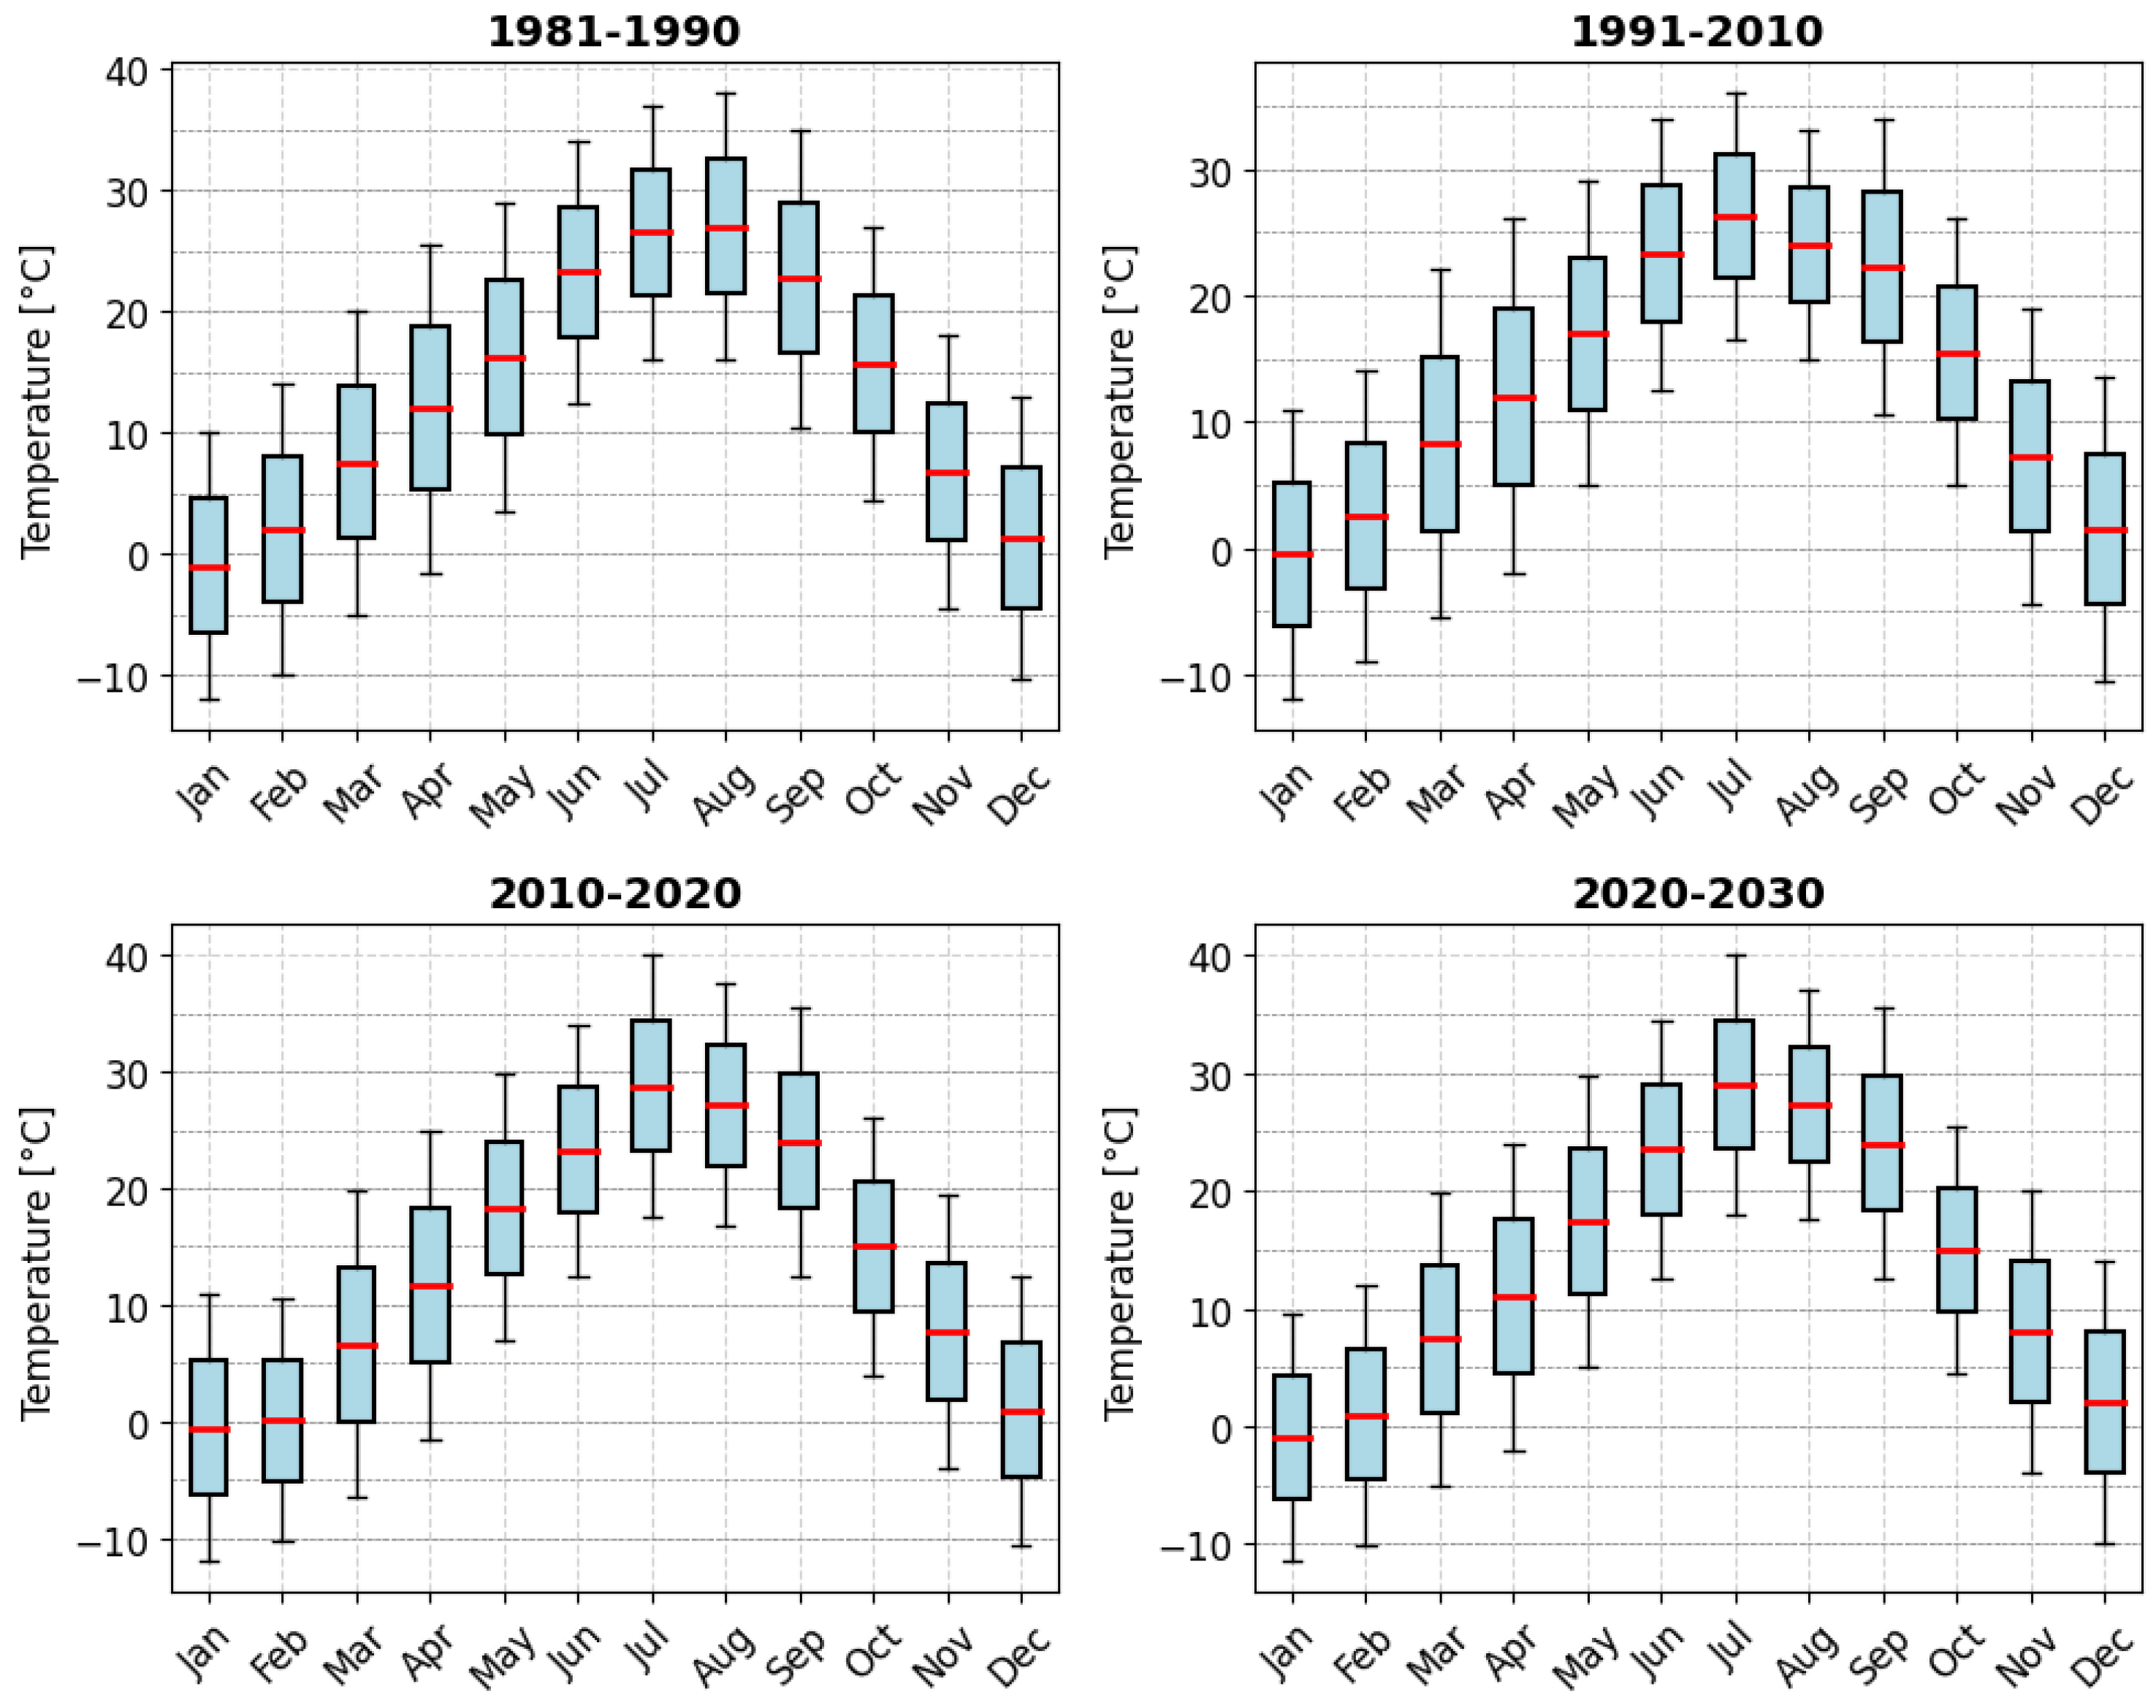
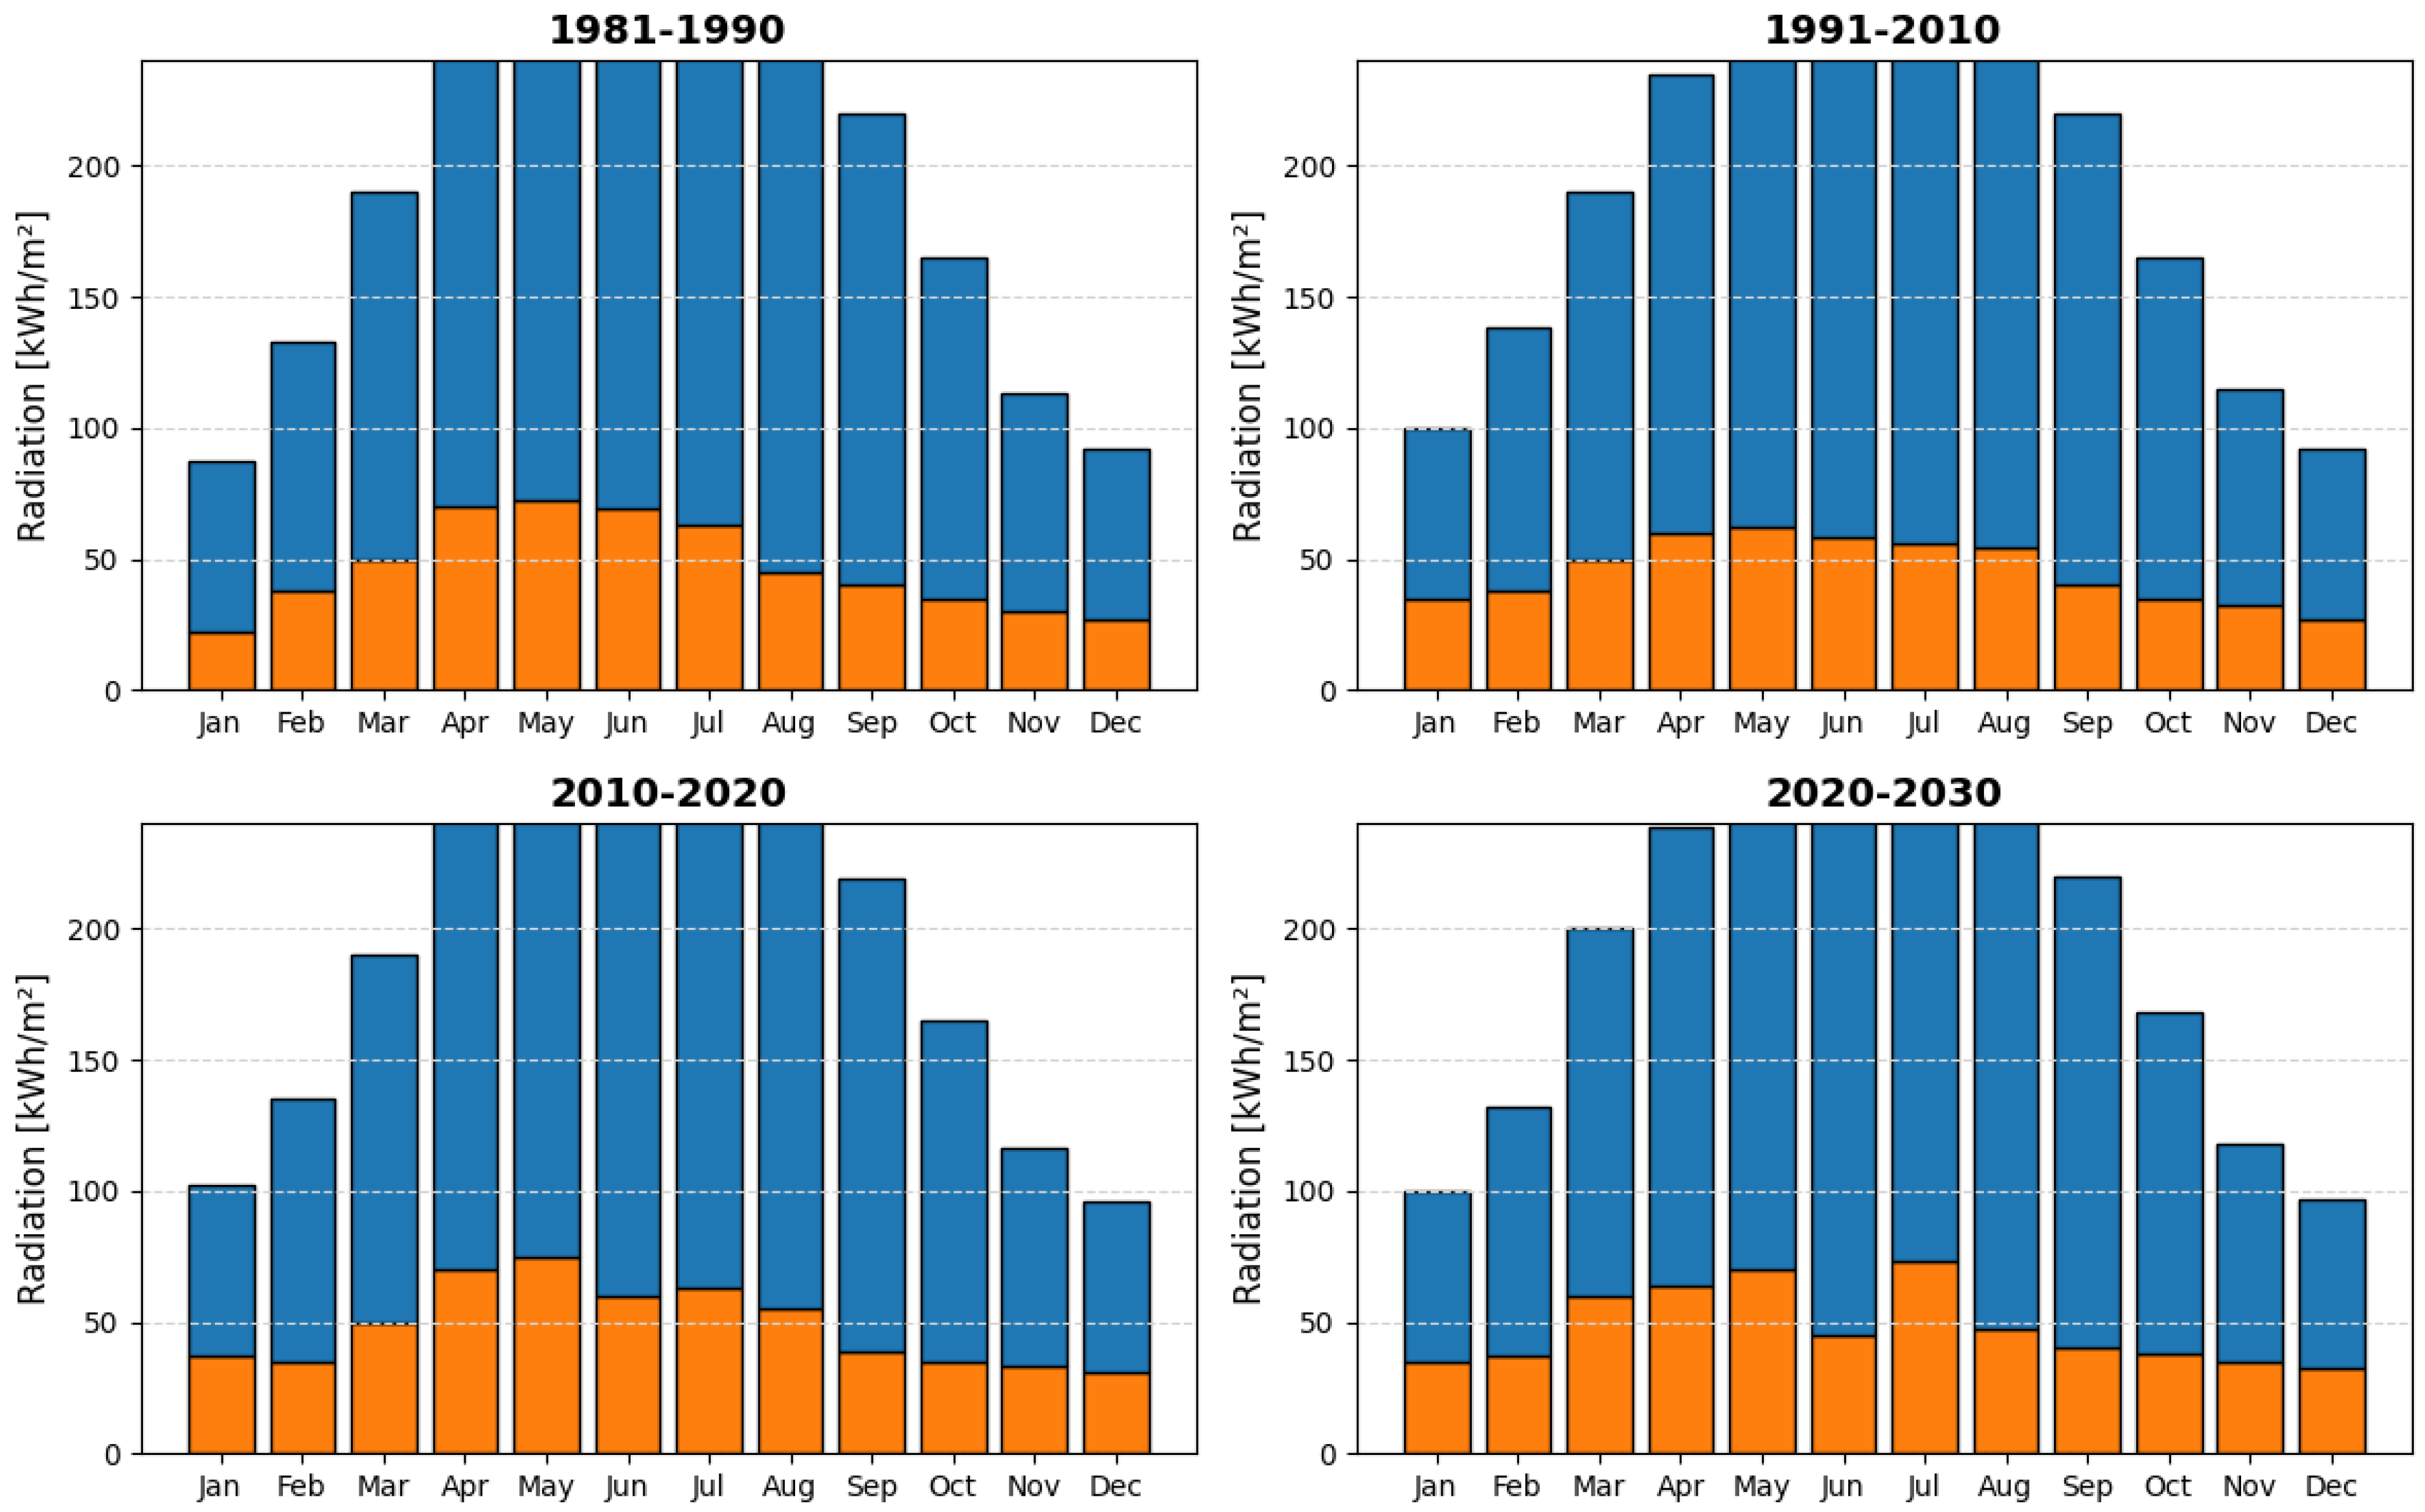
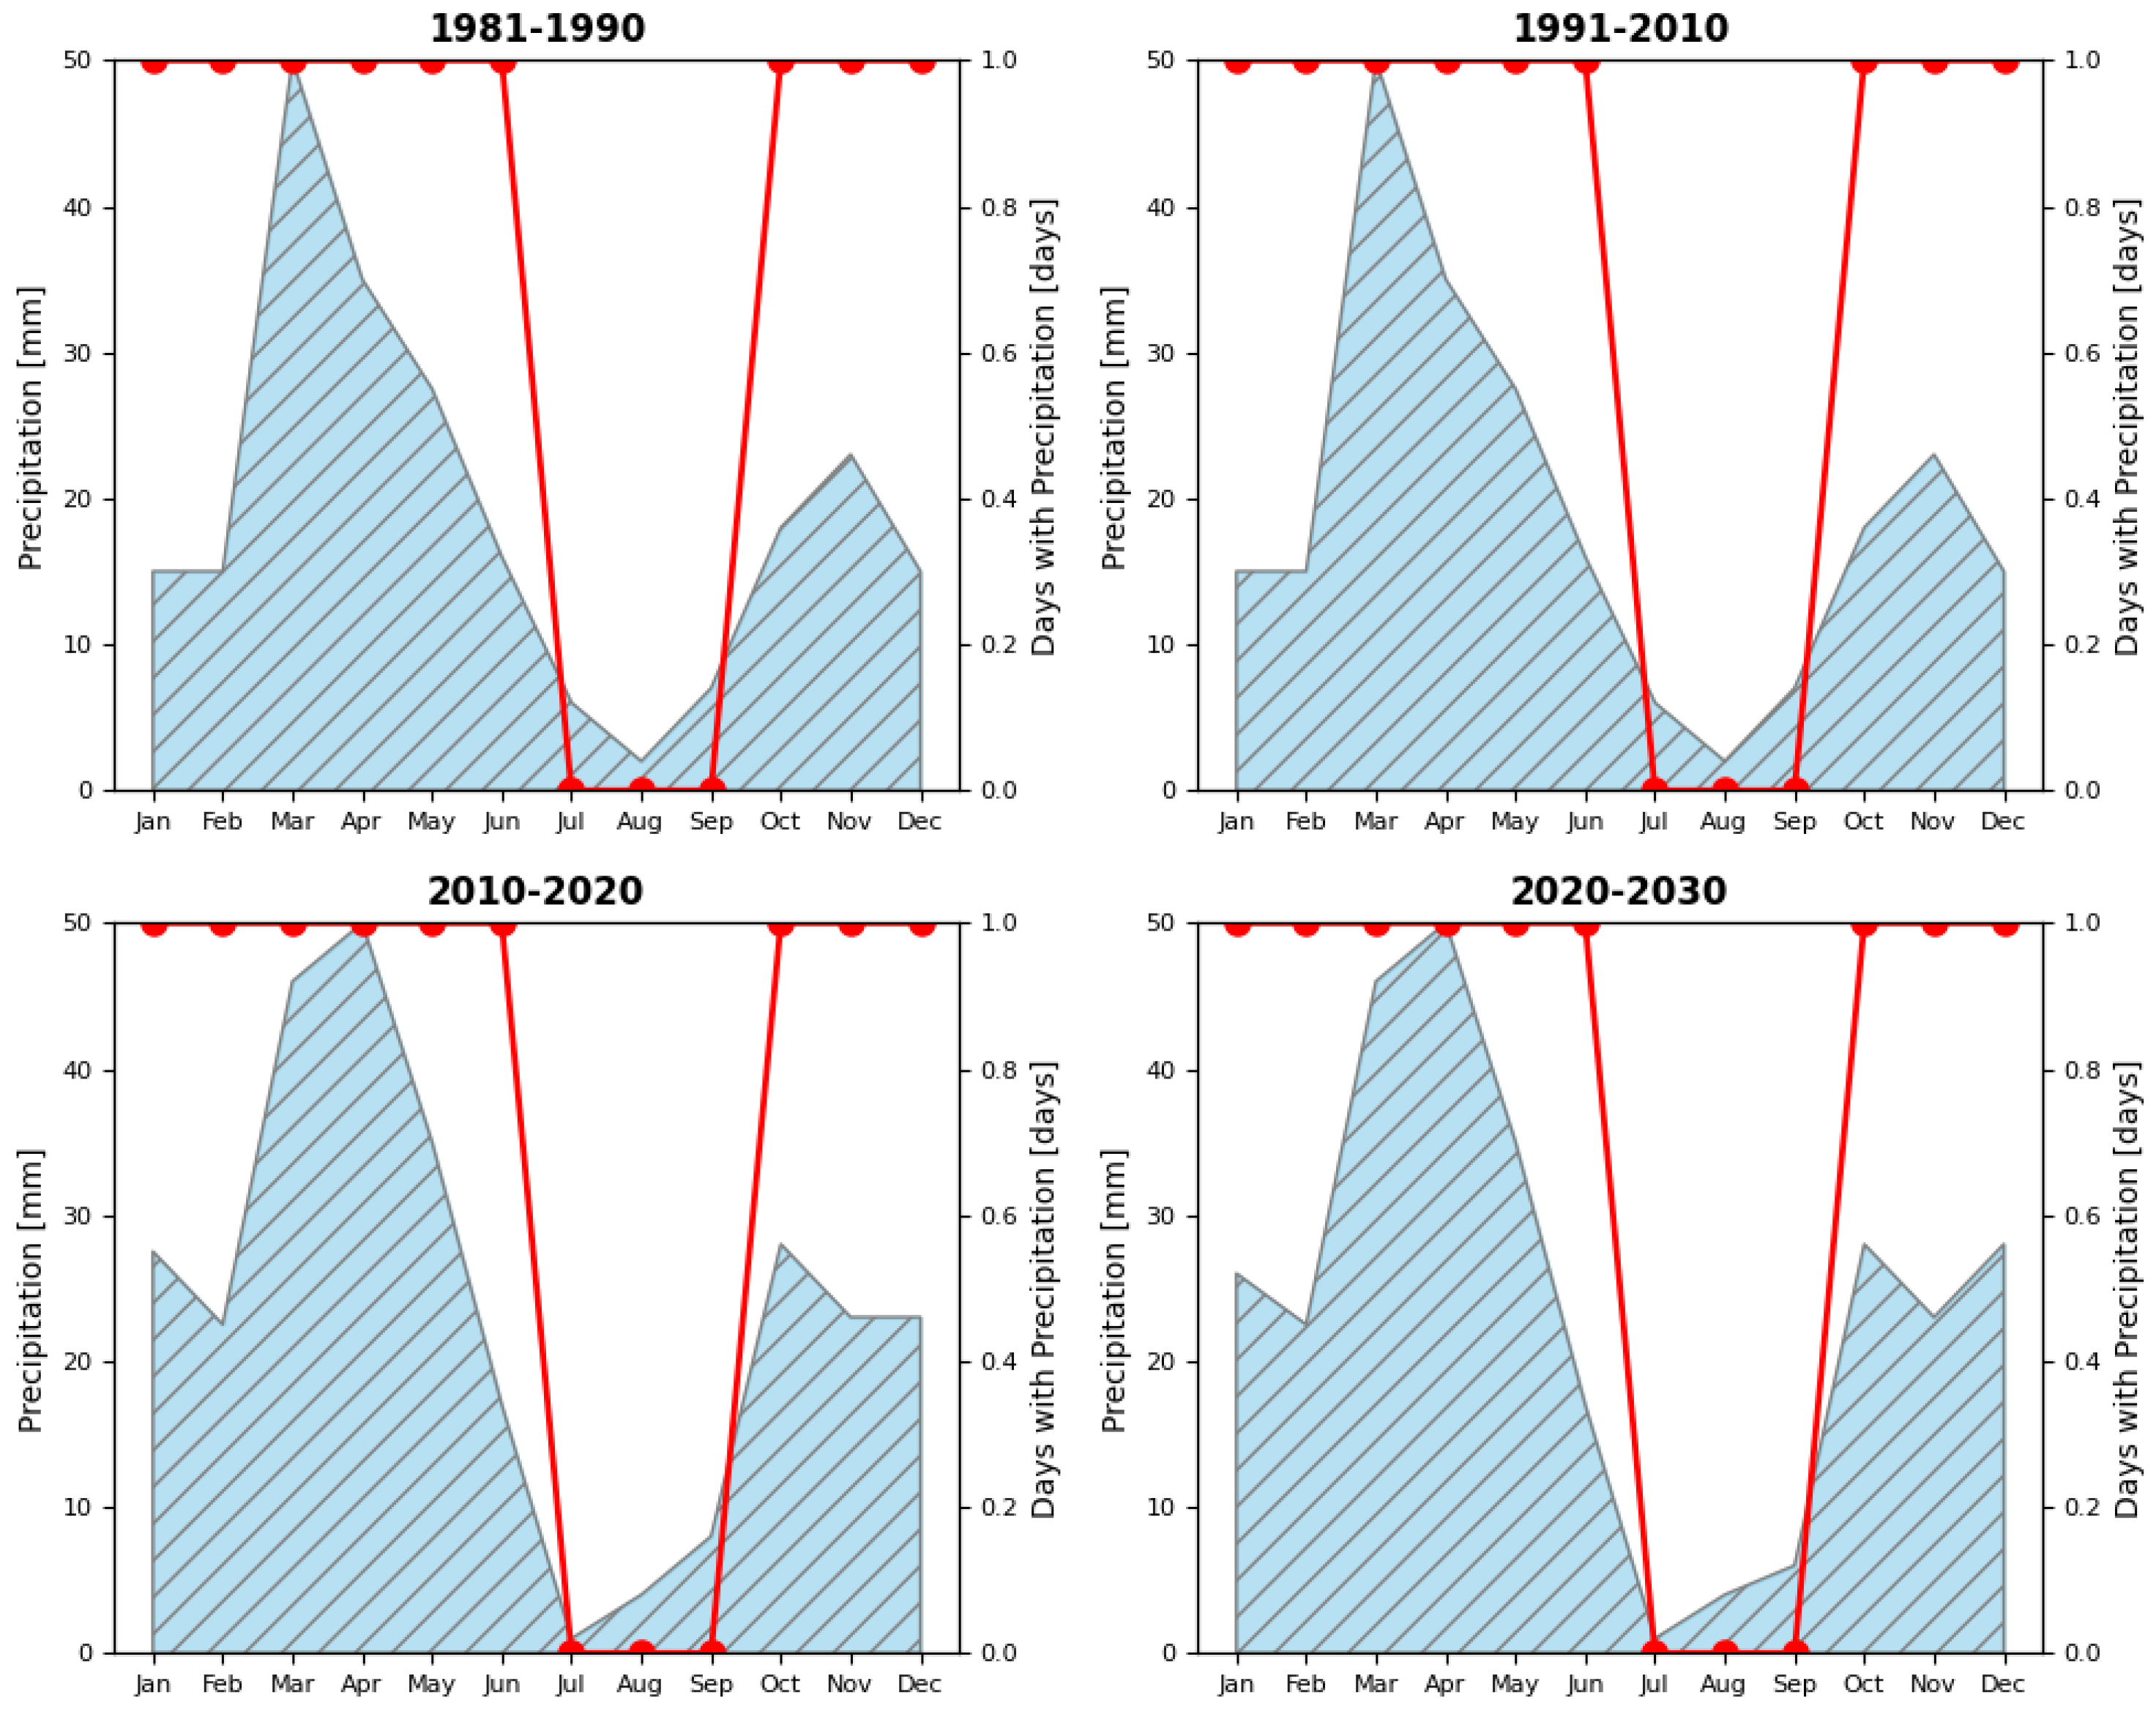

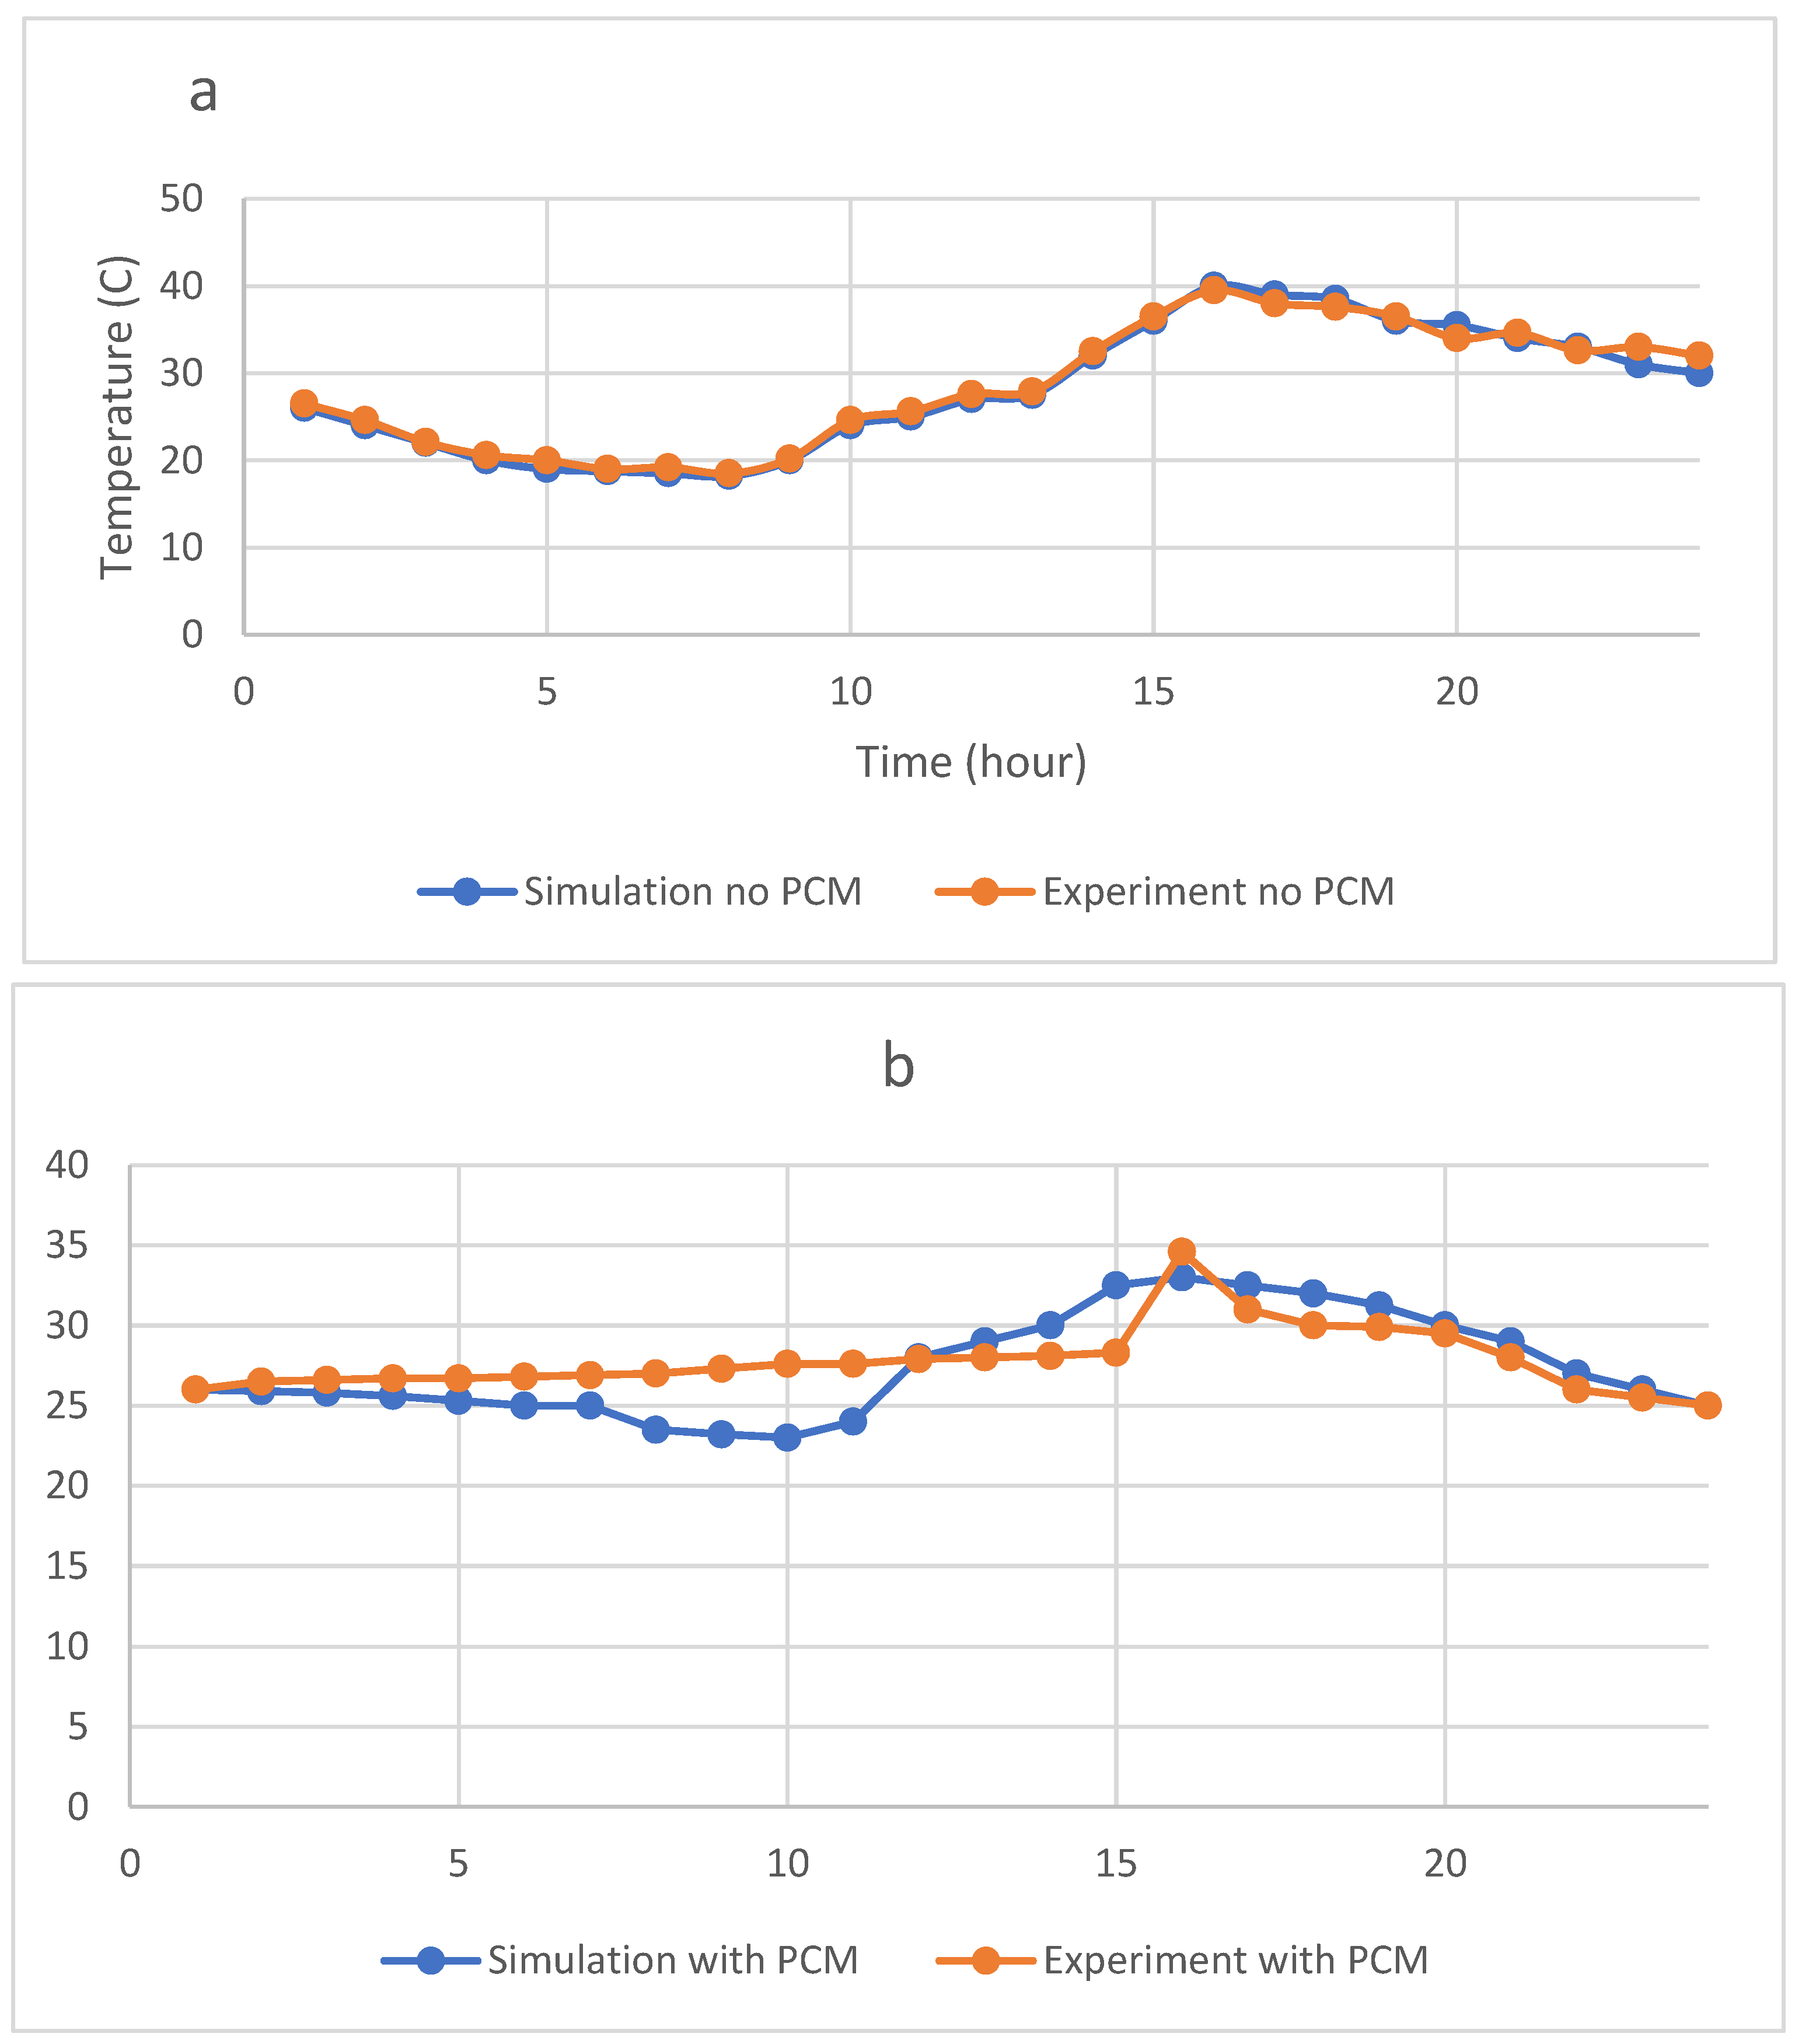


Disclaimer/Publisher’s Note: The statements, opinions and data contained in all publications are solely those of the individual author(s) and contributor(s) and not of MDPI and/or the editor(s). MDPI and/or the editor(s) disclaim responsibility for any injury to people or property resulting from any ideas, methods, instructions or products referred to in the content. |
© 2024 by the authors. Licensee MDPI, Basel, Switzerland. This article is an open access article distributed under the terms and conditions of the Creative Commons Attribution (CC BY) license (https://creativecommons.org/licenses/by/4.0/).