Abstract
Consumer dissatisfaction and damage are increasing worldwide due to the increase in defects caused by the decline in housing quality, and disputes over housing defects are expanding. The number of housing units, a representative standard related to housing quality, is used in Canada, Japan, and Korea. Generally, quality costs increase as the number of housing units increases, and each country’s laws apply stricter management standards. Therefore, the quality is expected to be better as the number of units increases. In 2020, South Korea added a new regulation requiring inspections by a quality inspection team by a public institution only when building housing complexes with more than 300 households. There is a debate about whether this direction of regulation is appropriate. This study examines whether the number of households is being used appropriately as a criterion related to housing quality. It aims to determine whether the limit of 300 households is appropriate for distinguishing housing quality. In addition, since the contractor’s role is vital in housing construction, the contractor’s capabilities and supply–demand relationship were also considered as factors affecting housing quality. The ratio of defect repair costs to construction costs was used as a quality measure for 285 housing complexes in Korea. Generally, the lower the defect repair–construction costs ratio, the better the quality. A comparative study was conducted through a variance analysis on the scale of 300 households and the status of the contractor’s capability, whether they were among the top 10 construction companies with excellent construction performance, and whether a sole contract was made. The results showed that the quality was better in the cases with 300 or more households than in the cases with fewer than 300 households. The quality was better in the cases built by higher-ranking contractors than in those built by other contractors, but there was no difference according to supply-and-demand relationships. The results of the comprehensive analysis indicated that the quality was better when higher-ranking contractors built housing complexes with 300 or more households than when lower-ranking contractors built housing complexes with fewer than 300 households. Therefore, the direction of the Korean regulation requiring quality inspections for housing complexes with more than 300 households is incorrect and should be improved to regulate housing complexes with fewer than 300 households, and of low quality. In addition, the standard of determining housing quality based solely on the number of households should be revised, and the direction should be changed to strengthen quality control and the public supervision of housing built by low-capacity contractors. If the results of this study are utilized with this view in mind, a reasonable system to protect housing consumers will be promoted.
1. Introduction
The housing quality issue is a subject of global interest [1,2,3,4,5]. Among the quality issues, defects during construction are found, investigated, and repaired mainly by the builder, contractor, or supervisor, who are housing construction project operators [6,7]. However, the owner frequently finds various defects during use after the house is built. The house owner claims the house was defective when it was handed over [8,9]. On the other hand, the builder or contractor often denies that it is their responsibility; rather, they argue that the defect is due to misuse by the house owner [10].
The definition and classification of housing defects vary from researcher to researcher, depending on the target houses. Rework is used to cope with defects or problems that occur during the construction of a house [4]. On the other hand, problems that occur during the usage phase after a house is completed are called defects, and there is a strong tendency to regard these as problems for which the responsibility lies with the builder or general constructor [1,3,7]. However, this is often difficult to distinguish clearly, and even if there is specific research evidence, it is not easy to ascertain. The housing issues addressed in this study are those named as defects, and as will be described in Section 3, the collected case data were investigated at the usage stage.
These disputes are consistently increasing, and many cases, such as lawsuits, are a last resort [11]. In Korea, most disputes over housing defects are resolved through litigation. The investigation results obtained by the expert sent by the court showed that significant defects remained [9]; therefore, regardless of the reason, the builder or contractor cannot be free from responsibility for housing defects.
To solve these housing defects, it is important to manage housing quality thoroughly [12,13]. Korea, which has just become a developed country, is still mainly constructing and supplying mass-produced multi-family housing [7]. Housing policies, funds, subsidy benefits, and construction standards still favor builders or follow those formed by their practices [14]. In addition, many of the standards enacted by the bureaucracy during industrialization arbitrarily defined the standards without any basis [15]. In particular, there are no standards for properly securing and managing housing quality. Therefore, the existing pre-modern systems and standards must be supplemented appropriately at present, as the economy has developed and industries have advanced.
Among the various criteria for housing, the number of households is used in countries such as Canada, Japan, and Korea. As discussed in Section 2 below, in Korea, various regulations are imposed as the number of households increases. However, the basis for establishing these regulations is unclear. Moreover, although these regulations aim to protect consumers by improving housing quality, they are not suitable measures to safeguard disadvantaged housing and consumers. In particular, Korea’s current law stipulates that when building a housing complex exceeding 300 households, the construction must be performed by a general contractor (GC), certified architect (CA), or inspector with experience and track record. Therefore, housing complexes with fewer than 300 households will probably be low-quality as incompetent general contractors build them. If this is the case, it is necessary to devise institutional supplementary measures for housing complexes with fewer than 300 households.
Furthermore, the regulations in Korea became tighter through a 2020 law revision that required additional quality inspections from public institutions when building housing complexes with more than 300 households. This regulation was newly established in response to the surge in consumer complaints and disputes over housing defects in Korea around 2020. If a study were conducted or supporting data were presented showing that housing complexes with 300 or more households are of worse quality than those with fewer than 300 households, and the law was revised by reviewing this, the direction of this regulation could be reasonable. However, as mentioned above, no rational reason or basis has been disclosed for amending the law.
Although the number of households is a criterion used in many ways as a standard for housing construction and quality, there is controversy over whether regulations using the number of households are set in the right direction. In addition, if the process of social discussion through sufficient research and investigation is neglected when establishing regulations, society may not justify the regulation as legitimate. Moreover, although the purpose of setting such rules is to protect the socially disadvantaged and prevent the waste of social costs and time, the direction of the regulations will be meaningless if they do not protect the socially disadvantaged and only cause social waste.
This study aims to determine whether the number of households is being appropriately used as a criterion for housing quality, and whether it is being set in the right direction as a basis for regulating quality. Specifically, it targets Korean housing by dividing it into housing complexes with 300 or more households and housing complexes with fewer than 300 households. The quality differences were compared using a ratio of defect repair cost to construction cost (DRCCC) as a measure for these housing complexes. In addition, the quality difference between the levels of general contractors was compared according to the regulations set by 300 households in Korea. In Korea, contractors whose construction performance is in the top 10 in the industry were designated as Top General Contractors (Top GCs) and compared to Other General Contractors (Other GCs). The housing quality differences in the subcontracting method were also compared depending on whether one GC was contracted (single contract; SC) or multiple GCs were jointly contracted (joint venture contract; JVC). These results will help to supplement the direction of regulations on housing quality.
This study proceeds in the following order: Section 2 reviews the laws and standards of Korea and other countries worldwide, which regulate housing construction and quality based on the number of households. It examines how the number of households is used as a housing-related criterion and whether its direction is consistent with general cases. Section 3 describes a methodology for comparing the relationship between housing quality and the number of households. Housing quality is defined as the ratio between the construction cost and the cost of repairing defects due to inferior quality, and it is based on collected Korean housing cases. The comparison method uses analysis of variance. Section 4 discusses the results of an analysis of quality differences, depending on the housing scale, of more than 300 households. Section 5 derives the implications from the analysis results and discusses the direction of the regulation. Lastly, Section 6 summarizes the overall research and its results and describes the conclusions and limitations of the research.
2. Literature Review
2.1. Housing Quality Regulations
In Korea, various restrictions on the selling, construction, and maintenance of houses depend on the size of the house. For housing complexes or multi-family housings where multiple dwellings are gathered, the conditions for the site area, floor area, and household are stipulated by law. Although indicators and scales vary widely, the regulations based on the number of houses being 300 are particularly outstanding. As shown in Table 1, based on 300 households, the contents stipulated in the Enforcement Decree of the Housing Act, Multi-Family Housing Management Act, and Regulations on the Housing Construction Standard Regulations are summarized in the 12 articles [16,17,18,19].

Table 1.
Regulation on multi-family housing complexes with more than 300 households.
Among the provisions above, the three following provisions stipulated in the Enforcement Decree of the Housing Act are representative and appear to be related to housing quality:
First, according to Article 47 of the Enforcement Decree of the Housing Act, the qualification of a supervisor monitoring housing construction is limited to engineering business entities for housing complexes with more than 300 houses [17]. On the other hand, in cases of fewer than 300 households, a certified architect can be a supervisor. Being an architect in Korea is a qualification specializing in design, and to design buildings on more than a certain scale, one must qualify as an architect. After graduating from an architecture-related college, experience in design practice for a considerable period and passing a separate exam are required to become an architect. Although being an architect is crucial to being recognized as a design expert in Korea, it is not easy to consider an architect as an expert with all-around experience in the construction field.
For this reason, the supervisor’s qualifications for medium-to-large housing complexes with more than 300 households are given only to construction engineering business entities, and the engineering businesses must hire state-recognized professional engineers [17]. As of the end of March 2023, there were a total of 13,762 architects registered with the Korea Institute of Registered Architects [20], but among the engineers registered with the Korean Professional Engineers Association, there were only 4493 professional engineers with architectural execution related to housing construction [21], which is only 33% of the number of previously mentioned architects, implying that experienced and competent engineers are few.
Moreover, according to data released by the Korea Institute of Registered Architects, 12,485 of 12,993 architect firms are run by only one architect, accounting for 96% of the total [20]. On the other hand, according to data released by the Korean Professional Engineers Association, the number of professional engineers with architectural execution is 4493, and there are 343 architectural engineering firms [21]. The number of professional engineers with architectural execution working for each company is unknown. However, based on the number of these companies, only 2.6% of the professional engineer architectural specialization offices are related to the construction field.
If the foregoing circumstances are considered, the number of engineers who have accumulated experience in housing quality work is smaller than that of architects, and the number of related firms is also significantly low. Therefore, if the supervisors who monitor housing quality are limited to professional engineers or to the engineering business entities to which the engineers belong, it will be difficult to supervise the entirety of housing construction. For this reason, it was stipulated that architects could also work as supervisors for housing complexes with fewer than 300 households, which is a small number.
However, given the above facts, there is a very high possibility that an architect with insufficient technical skills and experience may work as a supervisor in a housing complex with fewer than 300 households, compared to a housing complex with more than 300 households. If an architect who lacks understanding of the construction process supervises it, the performance of housing quality management may not be smooth. In addition, architects who do not have experience in performing tasks such as quality evaluation and comparison are inevitably poor at analyzing quality levels, pointing out problems, and taking improvement measures. Therefore, due to limitations in the relevant regulations, the quality of housing complexes with fewer than 300 households may be inferior to that of housing complexes with more than 300 households.
Second, according to Article 17, Paragraph 3, Item 2 of the Enforcement Decree of the Housing Act, for a housing business to construct a house with more than six floors, it must have a track record of building 300 or more houses for the last 3 years. In Korea, if the number of floors in a house is more than six, more regulations must be followed. For example, according to Article 58, Paragraph 1 of the Regulation on Structure Standards of Building and Articles 91–3, Paragraph 1 of the Enforcement Decree of the Building Act, buildings with more than six floors must have confirmation of their structural safety and seismic design submitted when the commencement of their construction works is reported [22,23,24,25]. In other words, it is necessary for a professional engineer to review and confirm whether the house is structurally safe and prepared for earthquakes. This is one of the difficult procedures that takes substantial time and money. In addition, according to Article 7, Paragraph 1, Item 4 of the Enforcement Decree of the Act on the Installation and Management of Firefighting Facilities, when a house is built, the consent of the fire chief must be obtained before obtaining approval for the use of the building from the administrative authority. Since the following conditions must be fulfilled as shown in Table 2, when the number of floors in a house is six or more, including the forgoing contents, the house is subject to regulation.

Table 2.
Regulation on multi-family housing with more than six stories.
As reviewed above, considerable construction skills and experience are required to build a house with more than six floors because various regulations must be met. As a condition, the experience of constructing housing complexes with more than 300 households would be needed in Korea. Therefore, the construction of more than 300 households can be an important criterion for explaining the capability of the construction industry.
Third, according to Articles 53-5 of the Enforcement Decree of the Housing Act, housing complexes with more than 300 households must be inspected by quality inspection Teams operated by administrative authorities [17]. This standard was newly established in 2020, and before that, there was no special management or supervision by the administrative authority for housing quality. Meanwhile, the dispute over the quality of housing in Korea has reached its peak, and the problem of defects is frequently reported through the media. With a little exaggeration, most housing complexes are being sued. There is another reason for the increasing number of disputes: Despite the perceptions of Korean house owners, whose expectations have risen due to economic development and improved income levels, housing quality improvement is slower than in the past. However, the biggest problem is that defects are not fundamentally reduced. Therefore, the administrative authority have designed a system of quality inspection teams to inspect housing quality.
However, as reviewed above, engineering businesses with superior technical skills supervise housing complexes with more than 300 households, and more-than-mid-sized construction companies with abundant construction experience are mainly engaged in construction. Architects with low technical skills supervise houses with fewer than 300 households, and the size of the builders is also small. If housing quality is problematic, houses with fewer than 300 units are likely to be more vulnerable to quality issues. Therefore, it is doubtful whether the legal definition of a house that a quality inspection team must inspect is reasonable.
2.2. Previous Studies in Other Countries
The Korean system was examined first, and this section explores how the number of households is used to judge the housing quality in other countries’ systems and previous studies. Each country has different standards for housing. Canada and Japan are representative countries that use the number of households as a standard measure for housing quality. The Canadian state of British Columbia requires homeowners to avail of home warranty insurance. Specifically for multi-family housing, the home warranty insurance amount must be more than the original purchase price of the least expensive household in an area, multiplied by the number of households, multiplied by USD 100,000 or USD 2.5 million [26]. Japan stipulates that a housing defect repair deposit of a minimum of JPY 20 million and a maximum of JPY 12 billion be deposited according to the number of households under the Act on Assurance of Performance of Specified Housing Defect Warranty [27]. However, the reason or basis for the difference in housing defect repair deposit according to the number of households was not specified.
In addition, previous studies on housing quality and quality failure (defects) were investigated. Earlier studies conducted on the types of defects that occurred in housing [9,11,28,29,30] focused on the frequency of defect occurrence [31,32,33] and utilized defect repair costs [34,35,36,37,38]. Among the studies that used the number of households to indicate housing quality and defects were those by Seo and Lee, Choi, and Kim [36,37,38]. However, it is unclear whether there is a difference in housing quality according to the number of households in these studies. Our research aims to fill this gap by comprehensively analyzing the relationship between the number of households, the level of general contractors, and housing quality in Korean houses. Furthermore, there was no discussion on whether there is a difference in quality based on the size of 300 households or whether there is a difference according to the capability of the general contractor. In summary, the systems and previous studies on housing quality and defects failed to provide clear grounds for making differences based on the number of households.
Accordingly, this study aims to determine whether the household size standard related to housing quality in Korea is appropriate. Specifically, Korean laws stipulate that multi-housing complexes should have more facilities and equipment during construction. It is understandable that more time and money are required to construct these complexes and that reputable experts are needed to manage and supervise their construction efficiently. Therefore, the following points should be checked:
Is there a difference in quality between housing complexes with more than 300 households and housing complexes with fewer than 300 households?
If there is a difference in quality, how great is the difference?
Furthermore, can it be concluded that the quality is better because reputable experts were hired for complexes with more than 300 households?
In other words, is the quality worse in cases of fewer than 300 households because people with less experience or knowledge manage and supervise them?
3. Materials and Methods
3.1. Data Collection
This study evaluated quality using defects, which are quality problems that occur after constructing a house and handing it over to the house owner. The target houses are 285 housing complexes in Korea, and house owners filed a lawsuit in the Korean court against the builder and contractor, the housing construction project operators, and the guarantee company that provides defect repair guarantees for them. The defect repair cost was confirmed through the judgment of the first trial. This study obtained the judgments of these lawsuits and extracted data such as construction cost, defect repair deposit, defect repair cost, and number of households.
The construction cost refers to the final cost determined in the settlement after the completion of the house. The law sets 3% of the construction cost as a defect repair deposit, and it is guaranteed only for defects that occur after the house is handed over to the homeowner. Therefore, the defect repair cost in this study also means only the cost of defects that occurred after the house was handed over.
Housing defects include not only the structure, finishing, and facilities of individual houses but also transportation facilities, such as roads and parking lots within the complex, and utility facilities and piping, such as those involved in water supply and sewerage, city gas, and electricity. According to the Housing Act, each defect is classified according to 18 criteria and 80 detailed criteria related to housing construction. In addition, the defects that occur can be further subdivided, depending on the location or part of the occurrence, so there are hundreds of types [9,11].
In some cases, information such as the number of households was inaccurate or unspecified, so information was collected based on the building ledgers and the Housing Management Systems.
3.2. Housing Quality Metrics
Various variables can explain housing quality, but there are not many that can be used as objective quantitative indicators. In previous studies, indicators such as the scale of defects, defect repair costs, and a ratio of defect repair costs to construction costs were used to evaluate housing quality.
The number of defects that occur allows us to know how many defects have occurred. Since the number of defects is expressed in various quantity units, such as length, area, and volume, it is possible to quantify and compare them. For example, cracks in reinforced concrete are indicated by length, and the number of tiles or areas indicates tile damage. However, there is a disadvantage in that the scales used for each defect cannot be compared. Since the cracks in reinforced concrete are measured in length and tiles are measured in length or area, it is difficult to compare them. Therefore, the scale of defects is not suitable as a criterion for comparing the quality of an entire house.
Defect repair cost refers to the cost required to repair a defect that has occurred. Therefore, even if the dimensions of the measure for the scale of defects are different, it is possible to compare them as costs. However, although an absolute comparison of defect repair costs is likely, a relative comparison is impossible. If, for example, housing complexes A and B have different numbers of households, and the repair costs for these are USD 100 and USD 200, respectively, B’s maintenance cost is higher than A’s, so B’s quality will be better. However, what if A is a housing complex with 5 households and B with 50 households? A’s per-household repair cost becomes USD 20, while B’s is USD 4. In this case, A’s quality will be better than B’s. When the sizes of houses are different, it is difficult to compare their quality simply with the repair cost alone.
The ratio of repair cost to construction cost (DRCCC) is the ratio between the construction cost and the repair cost required when constructing a house. Since this index considers housing construction costs, a relative comparison is possible. Therefore, this study adopted a rate of defect repair cost to construction cost (DRCCC) as a comparison scale. This is calculated as in Equation (1).
3.3. Influencing Factors
Many variables are expected to affect housing quality. This study selected and compared three factors: the level of ability of the house contractor, the construction contract method, and the housing size.
Regarding the ability level (General Contractor Level; GC Level) of builders, Korea operates a system called construction capability evaluation. This is a system in which contractors’ performance, management evaluation, and number of engineers are comprehensively gathered and announced annually. Generally, contractors with high rankings are evaluated as having excellent abilities and high performance. In this study, the contractors in each case were classified as Top GCs (Top 10 General Contractors) from 1st to 10th in the construction capacity evaluation as of 2022, and Other GCs from rank 11.
The housing construction contract method (GC Contract Type) can be divided into cases in which a single contractor is engaged, and multiple contractors are jointly contracted. When a house is large, various constructors are generally entered into the contract. On the other hand, if the housing size is small, there is almost no joint contract because profitability is low. In this study, the GC contract of each case was classified into Single Contract (SC), where a single contractor is engaged in the construction, and Joint Venture Contract (JVC), where multiple contractors are jointly contracted.
Regarding housing size, standards include the number of households, total floor area, and land area. Even in the number of households, there is no single classification standard. However, as mentioned in the introduction, there are more facilities and spaces to be equipped if there are more than 300 households in Korea, so it is stipulated that a contractor or supervisor with high abilities manage them. Therefore, this study classified each case into cases with more than 300 households and cases with fewer than 300 households.
3.4. Comparative Method
This study compared whether there is a difference in the ratio of defect repair cost to construction cost (DRCCC) according to the contractor’s ability, the contract type, and the size of households described above. A high DRCCC ratio means that the ratio of defect repair costs to construction costs is higher than the input cost for building a house. Therefore, the ratio of defects that occur compared to the investment is more significant, so the quality can be regarded as poor. Conversely, a low DRCCC indicates that the quality is good or excellent.
On the other hand, it is difficult to assert that there is a difference in housing quality due to the competence of the general contractor, based only on the difference in the ratio of defect repair costs to construction costs. Therefore, it is necessary to examine whether there is a statistically significant difference in the mean values of each group based on the results of variance analyses such as t-test and ANOVA. If the results of the ANOVA confirm a difference, there could be a difference in quality between the comparison groups. Therefore, t-test and ANOVA were conducted using IBM SPSS in this study.
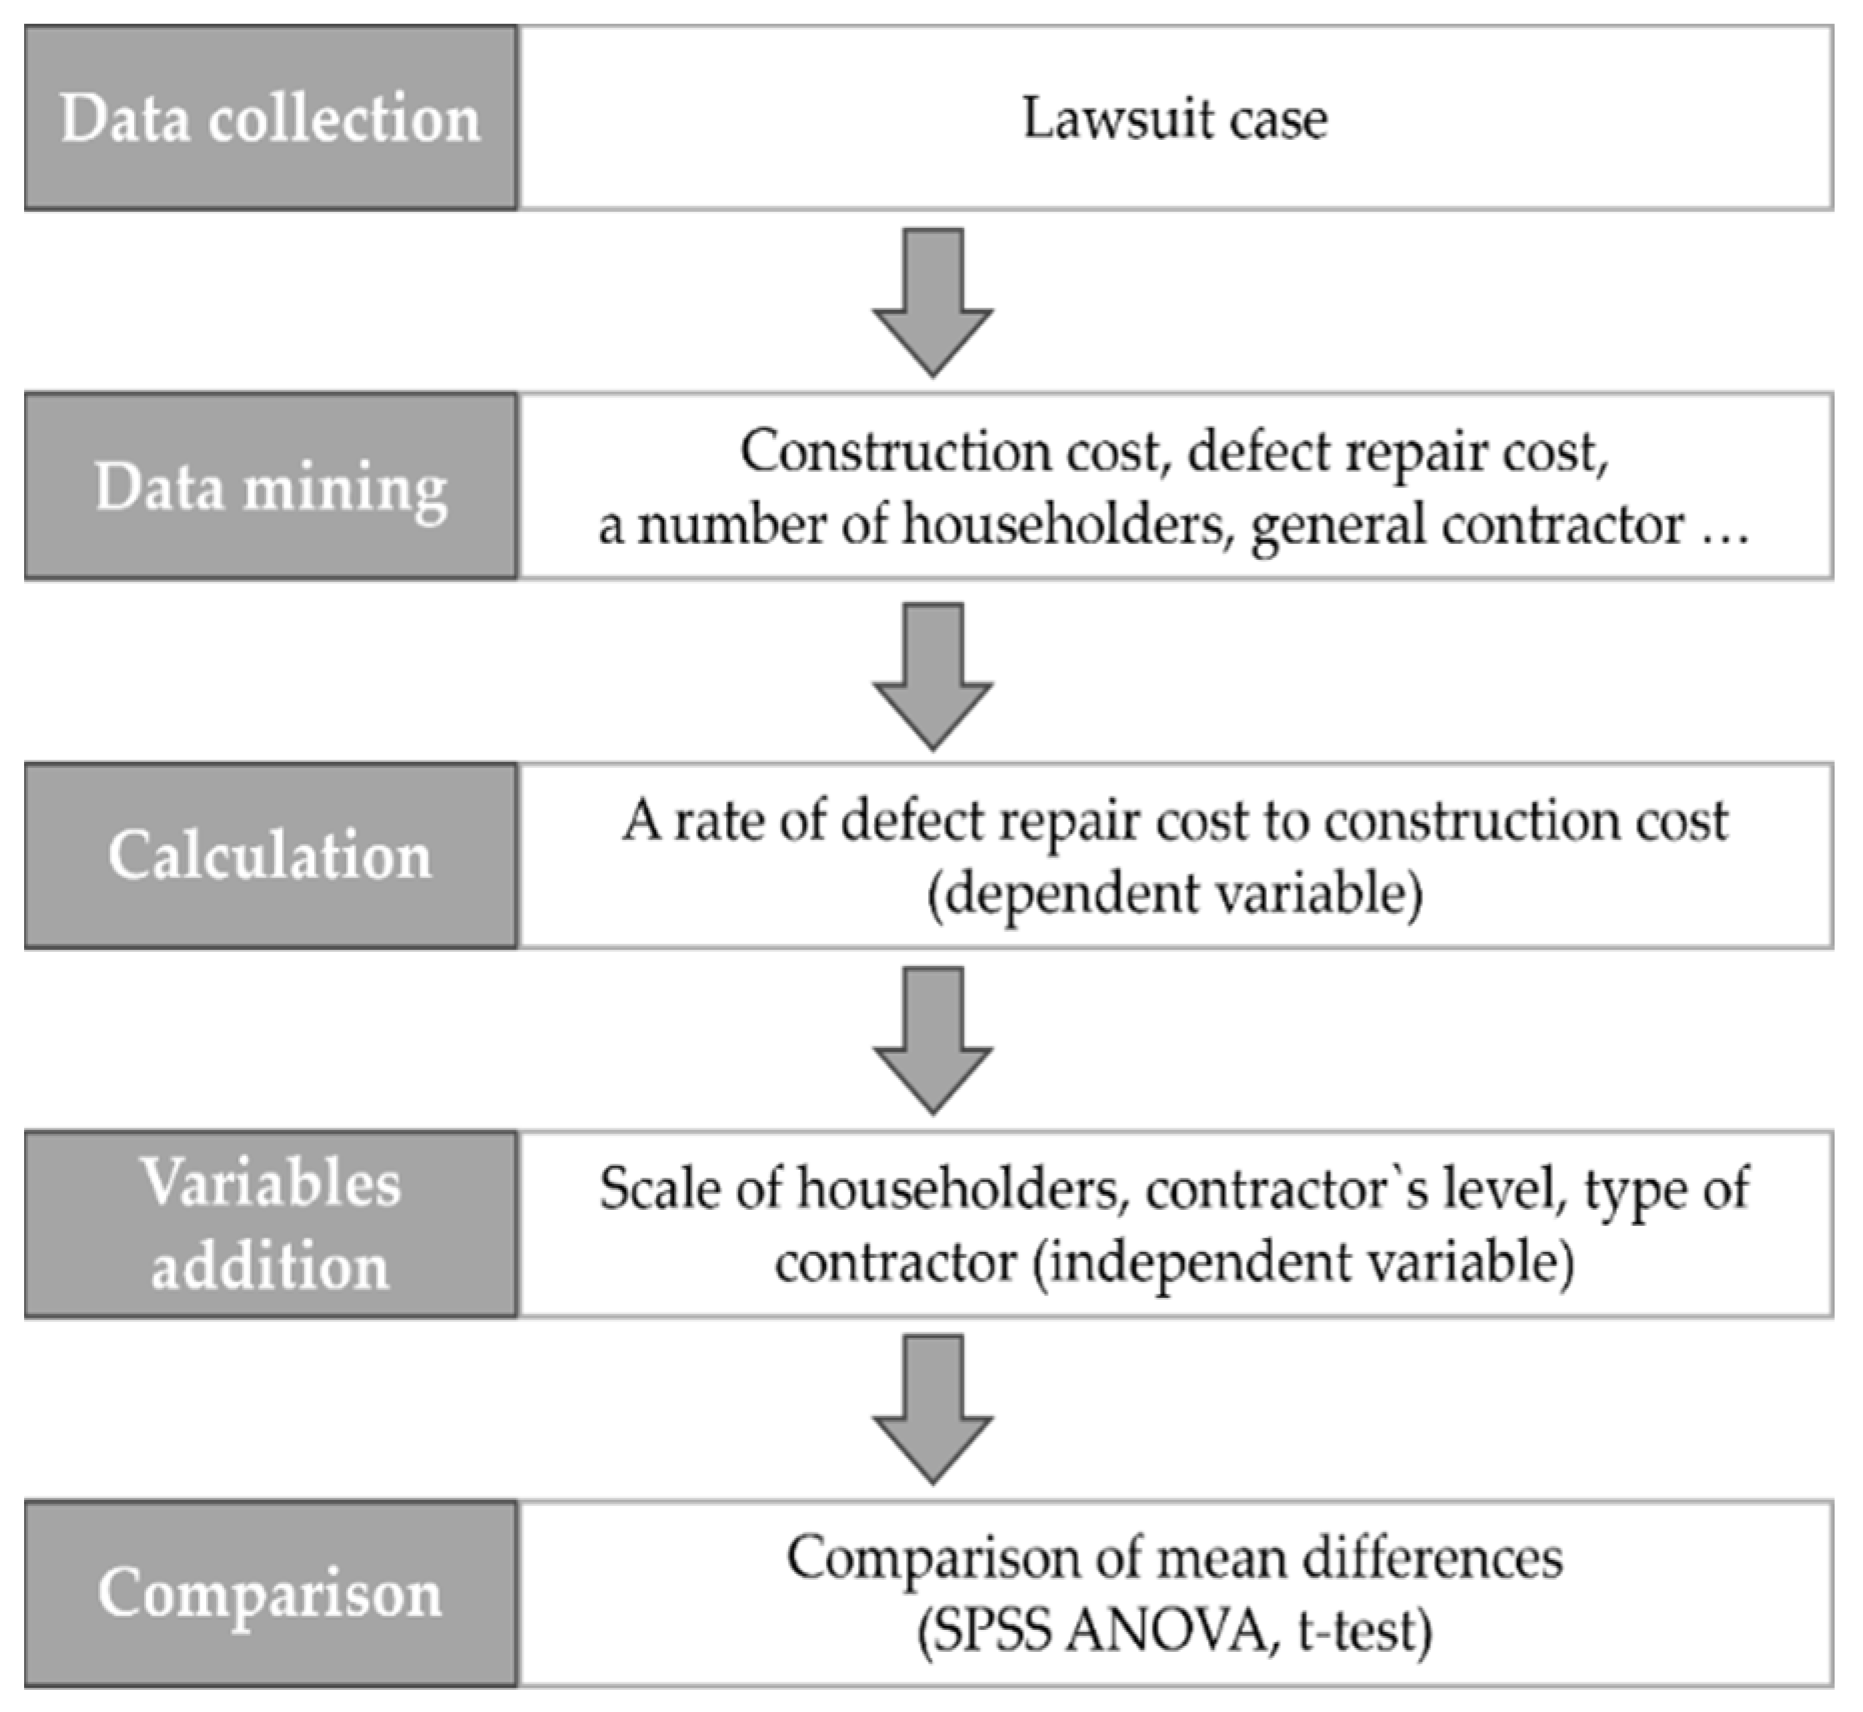
The overall process for the analysis described above can be summarized in Figure 1. First, the case data on housing defects are collected. Second, information such as construction cost, defect repair cost, and number of households is extracted from the data. Third, the ratio of defect repair cost to construction cost (DRCCC) is calculated. Fourth, nominal variables are added according to the household scale, contractor’s level, and subcontracting method. Fifth, variance analysis is conducted for each variable, and the differences are compared.
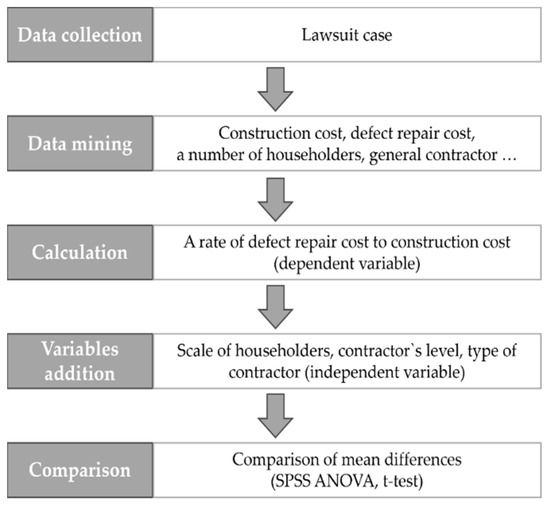
Figure 1.
Analysis flowchart.
4. Results
4.1. Outline
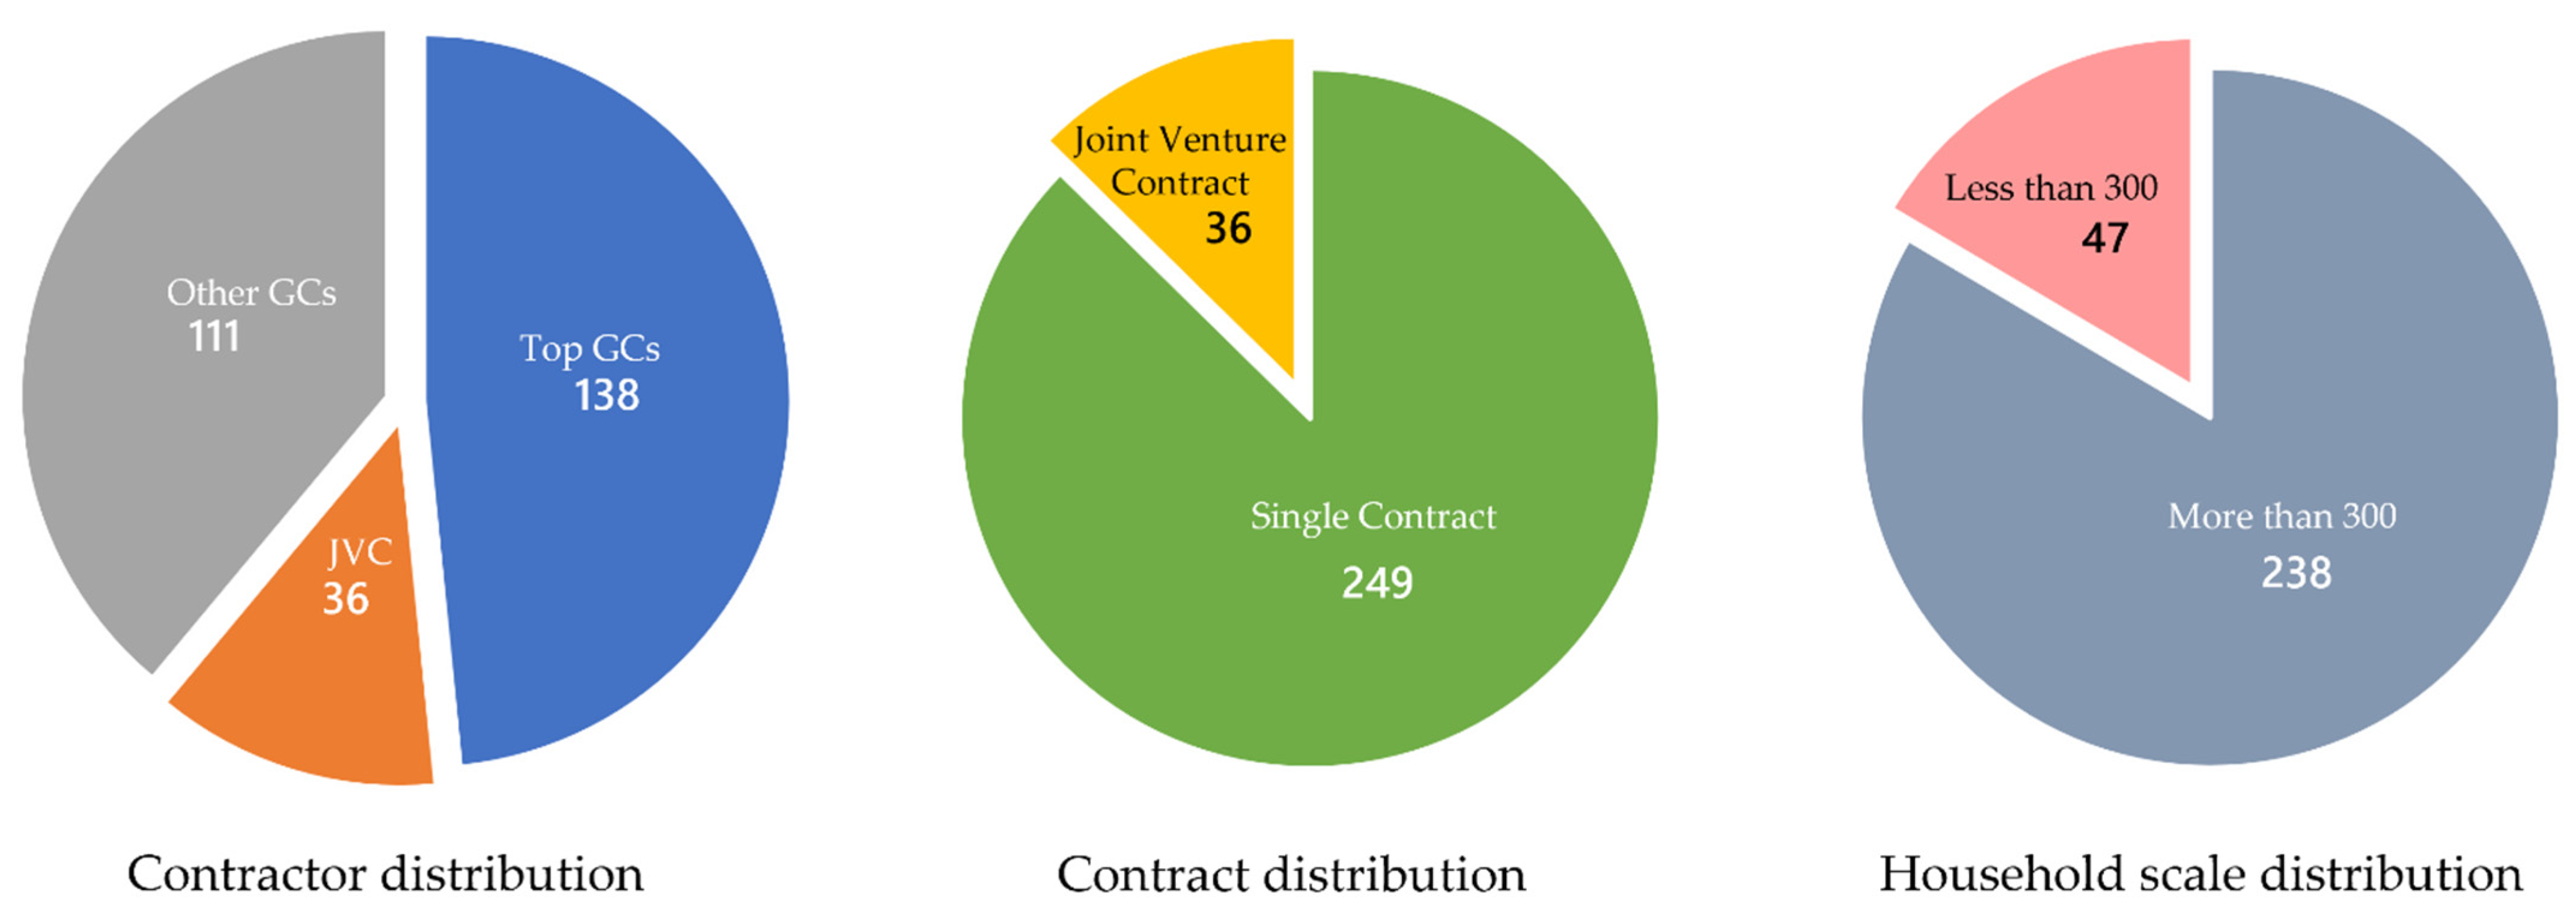
An overview of the entire case is shown in Figure 2. On the left side of Figure 2, for housing GCs, 138 cases were built by Top GCs alone, while Other GCs constructed 111 cases, and JVC built 36 cases. Next, in the middle of Figure 2, the contract type is shown: in total, 249 cases of SC and 36 cases of JVC. In addition, the size of the households, as shown on the right side of Figure 2, is 238 cases with more than 300 households and 47 cases with fewer than 300 households.
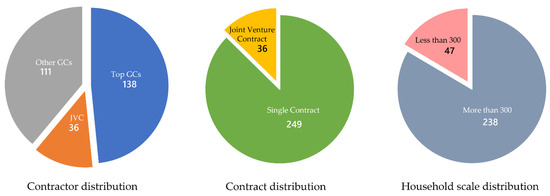
Figure 2.
Case distribution.
It was found that a single GC often carries out housing construction in Korea, and that there are relatively few cases of JVC. In addition, in Korean housing construction, the number of households is more than 300 in many cases, and there are relatively few cases in which the number of households is less than 300.
4.2. GC Level
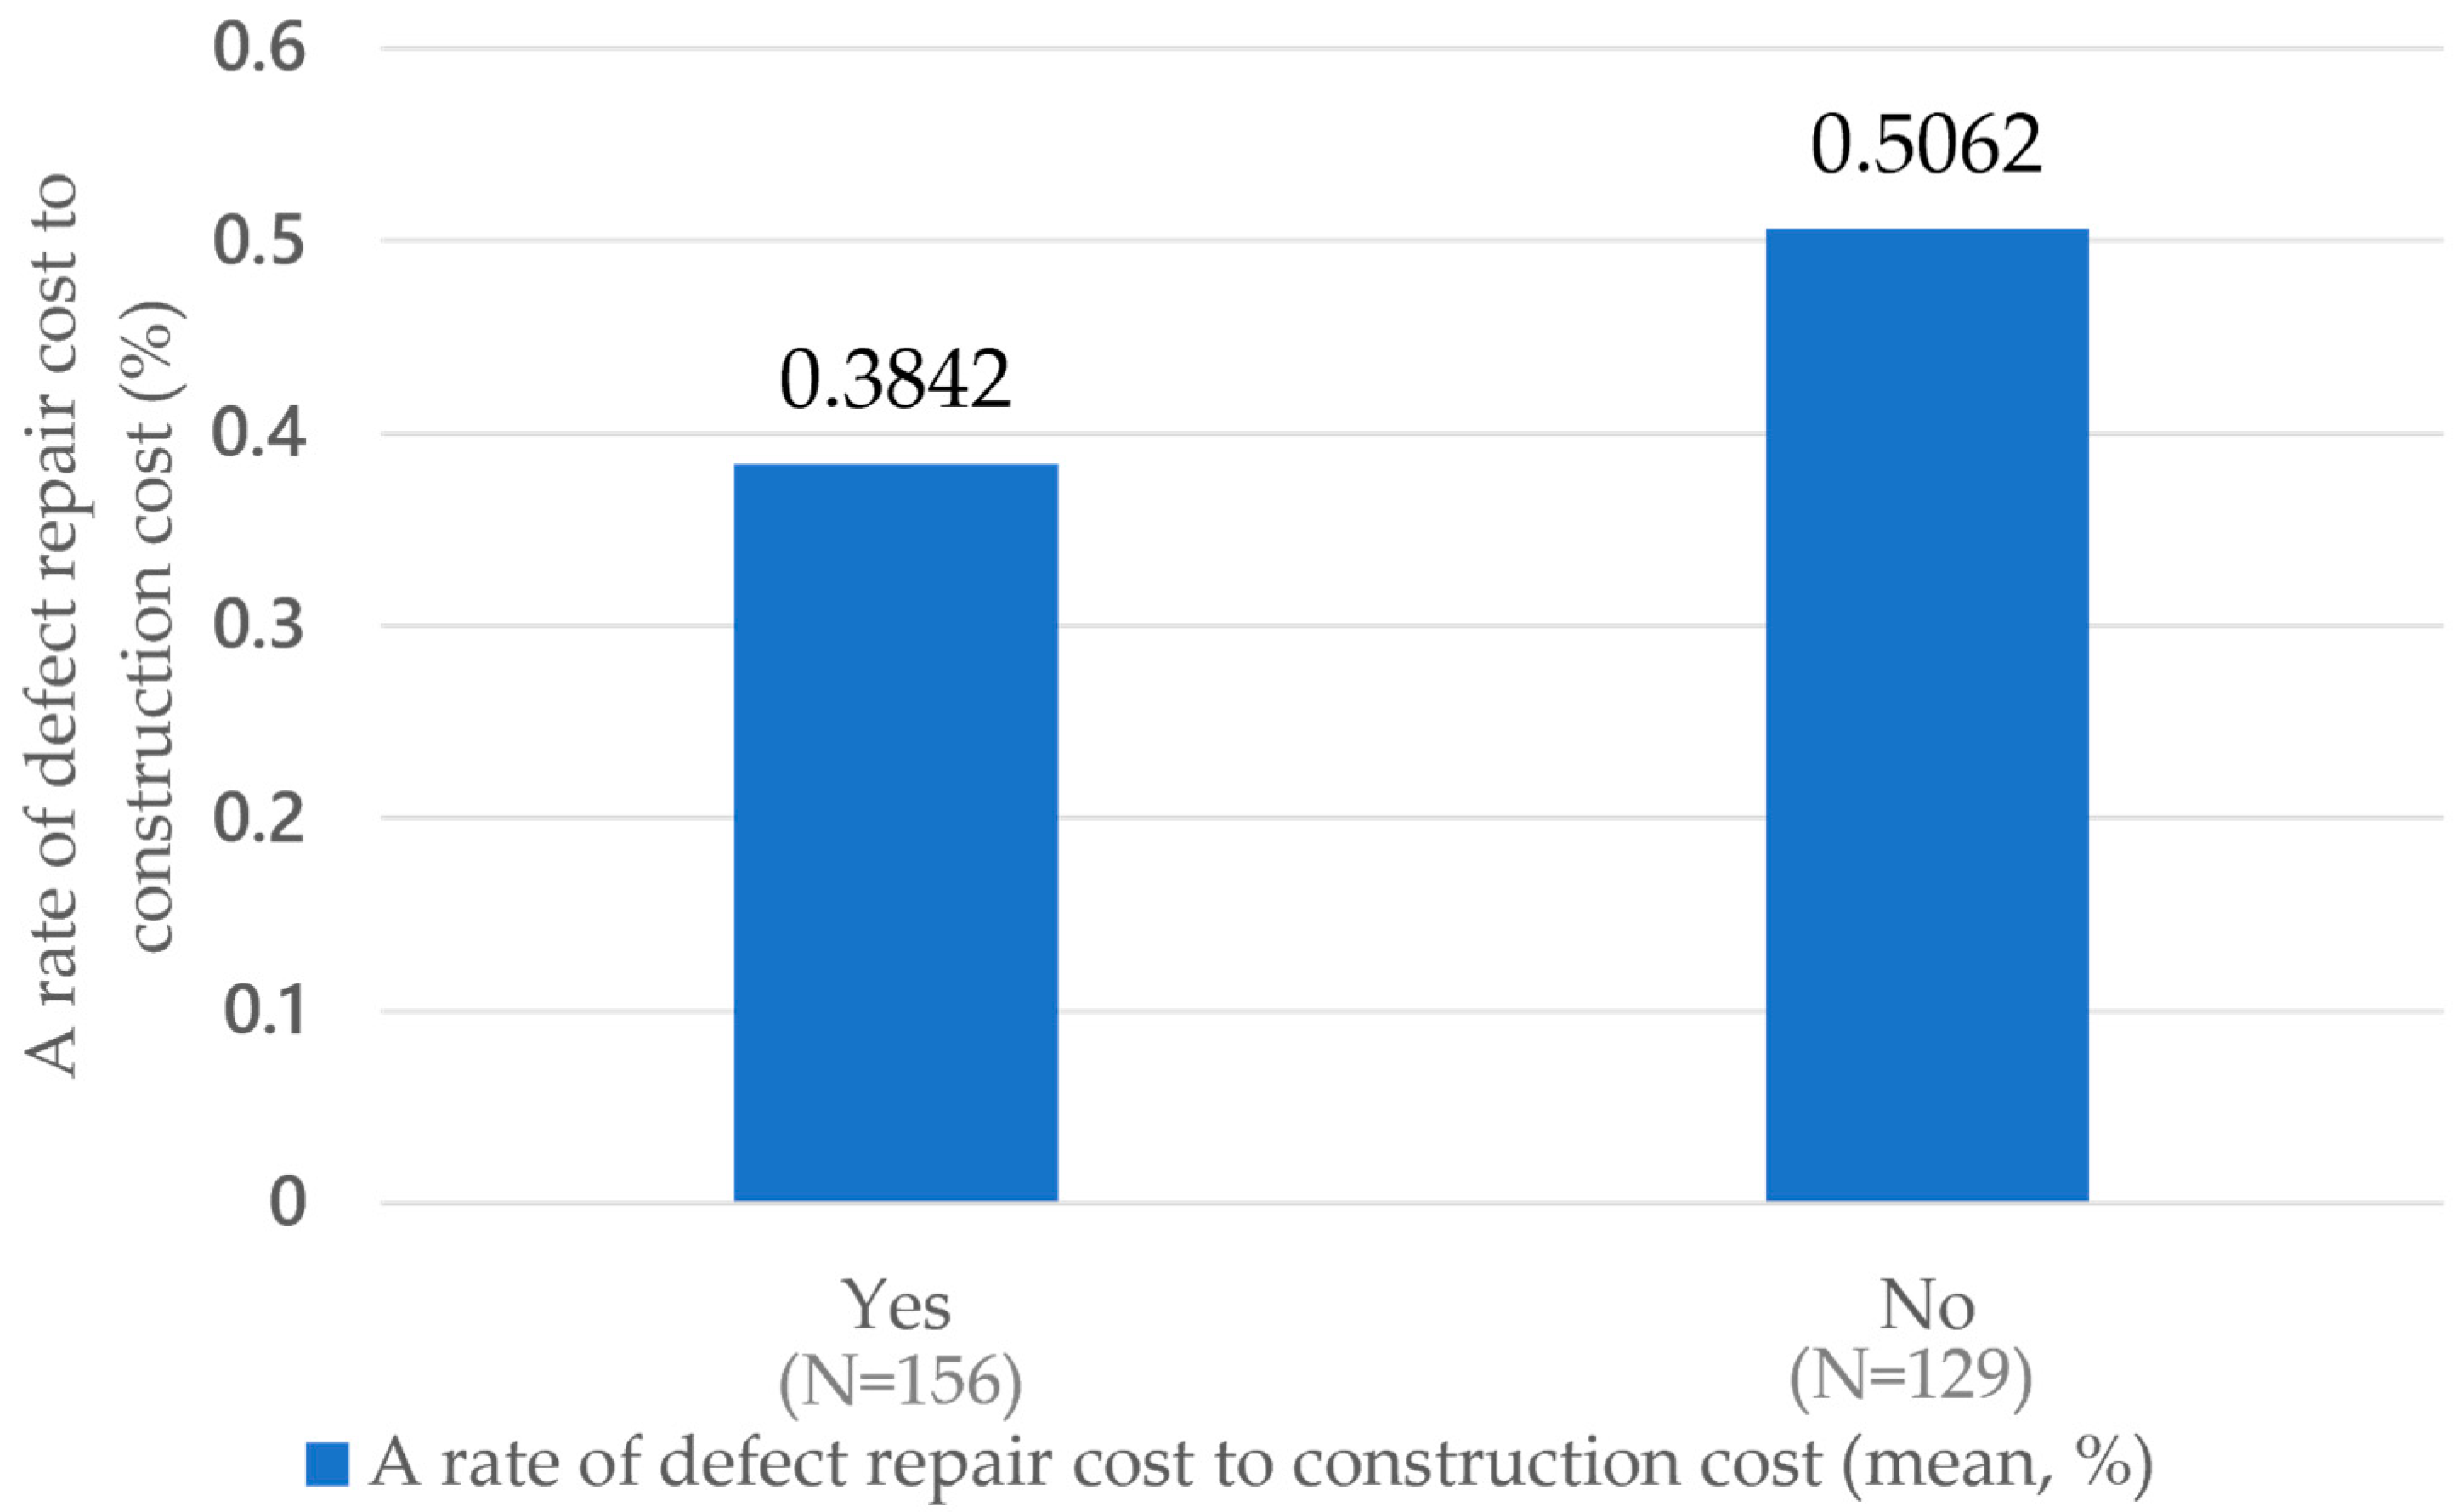
If the difference in housing quality according to the GC level is examined, as shown in Figure 3, the average ratio of defect repair cost to construction cost of houses built by the Top GCs is 0.3842%. This means that a Top GC is a single or joint contract between Top GCs and Other GCs. On the other hand, on average, the ratio of defect repair cost to construction cost (DRCCC) of houses not built by Top GCs is 0.5062%. The average repair cost is higher by 1.32 times for contracts other than those of the Top GCs.
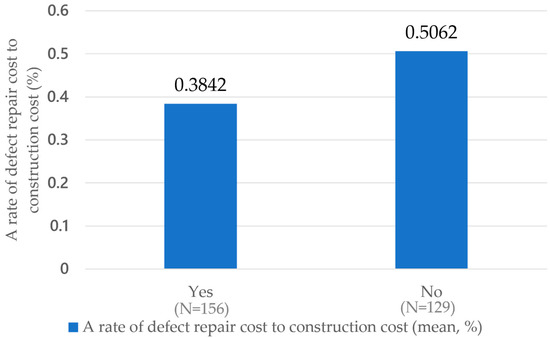
Figure 3.
Comparison of Top GCs.
The t-test results with DRCCC as the dependent variable and the contract status with the Top GCs as the independent variable showed that the Levene sig-value was 0.329, so equal variance was assumed. In addition, the p-value with the assumed equal variance was 0.000. Therefore, it is believed that there is a statistically significant difference in the average DRCCC value between the case of the SC with the Top GCs and the other contract cases. Therefore, since the DRCCC is lower than that of the non-Top GCs, the quality of houses built by Top GCs is considered better.
4.3. GC Contract Type
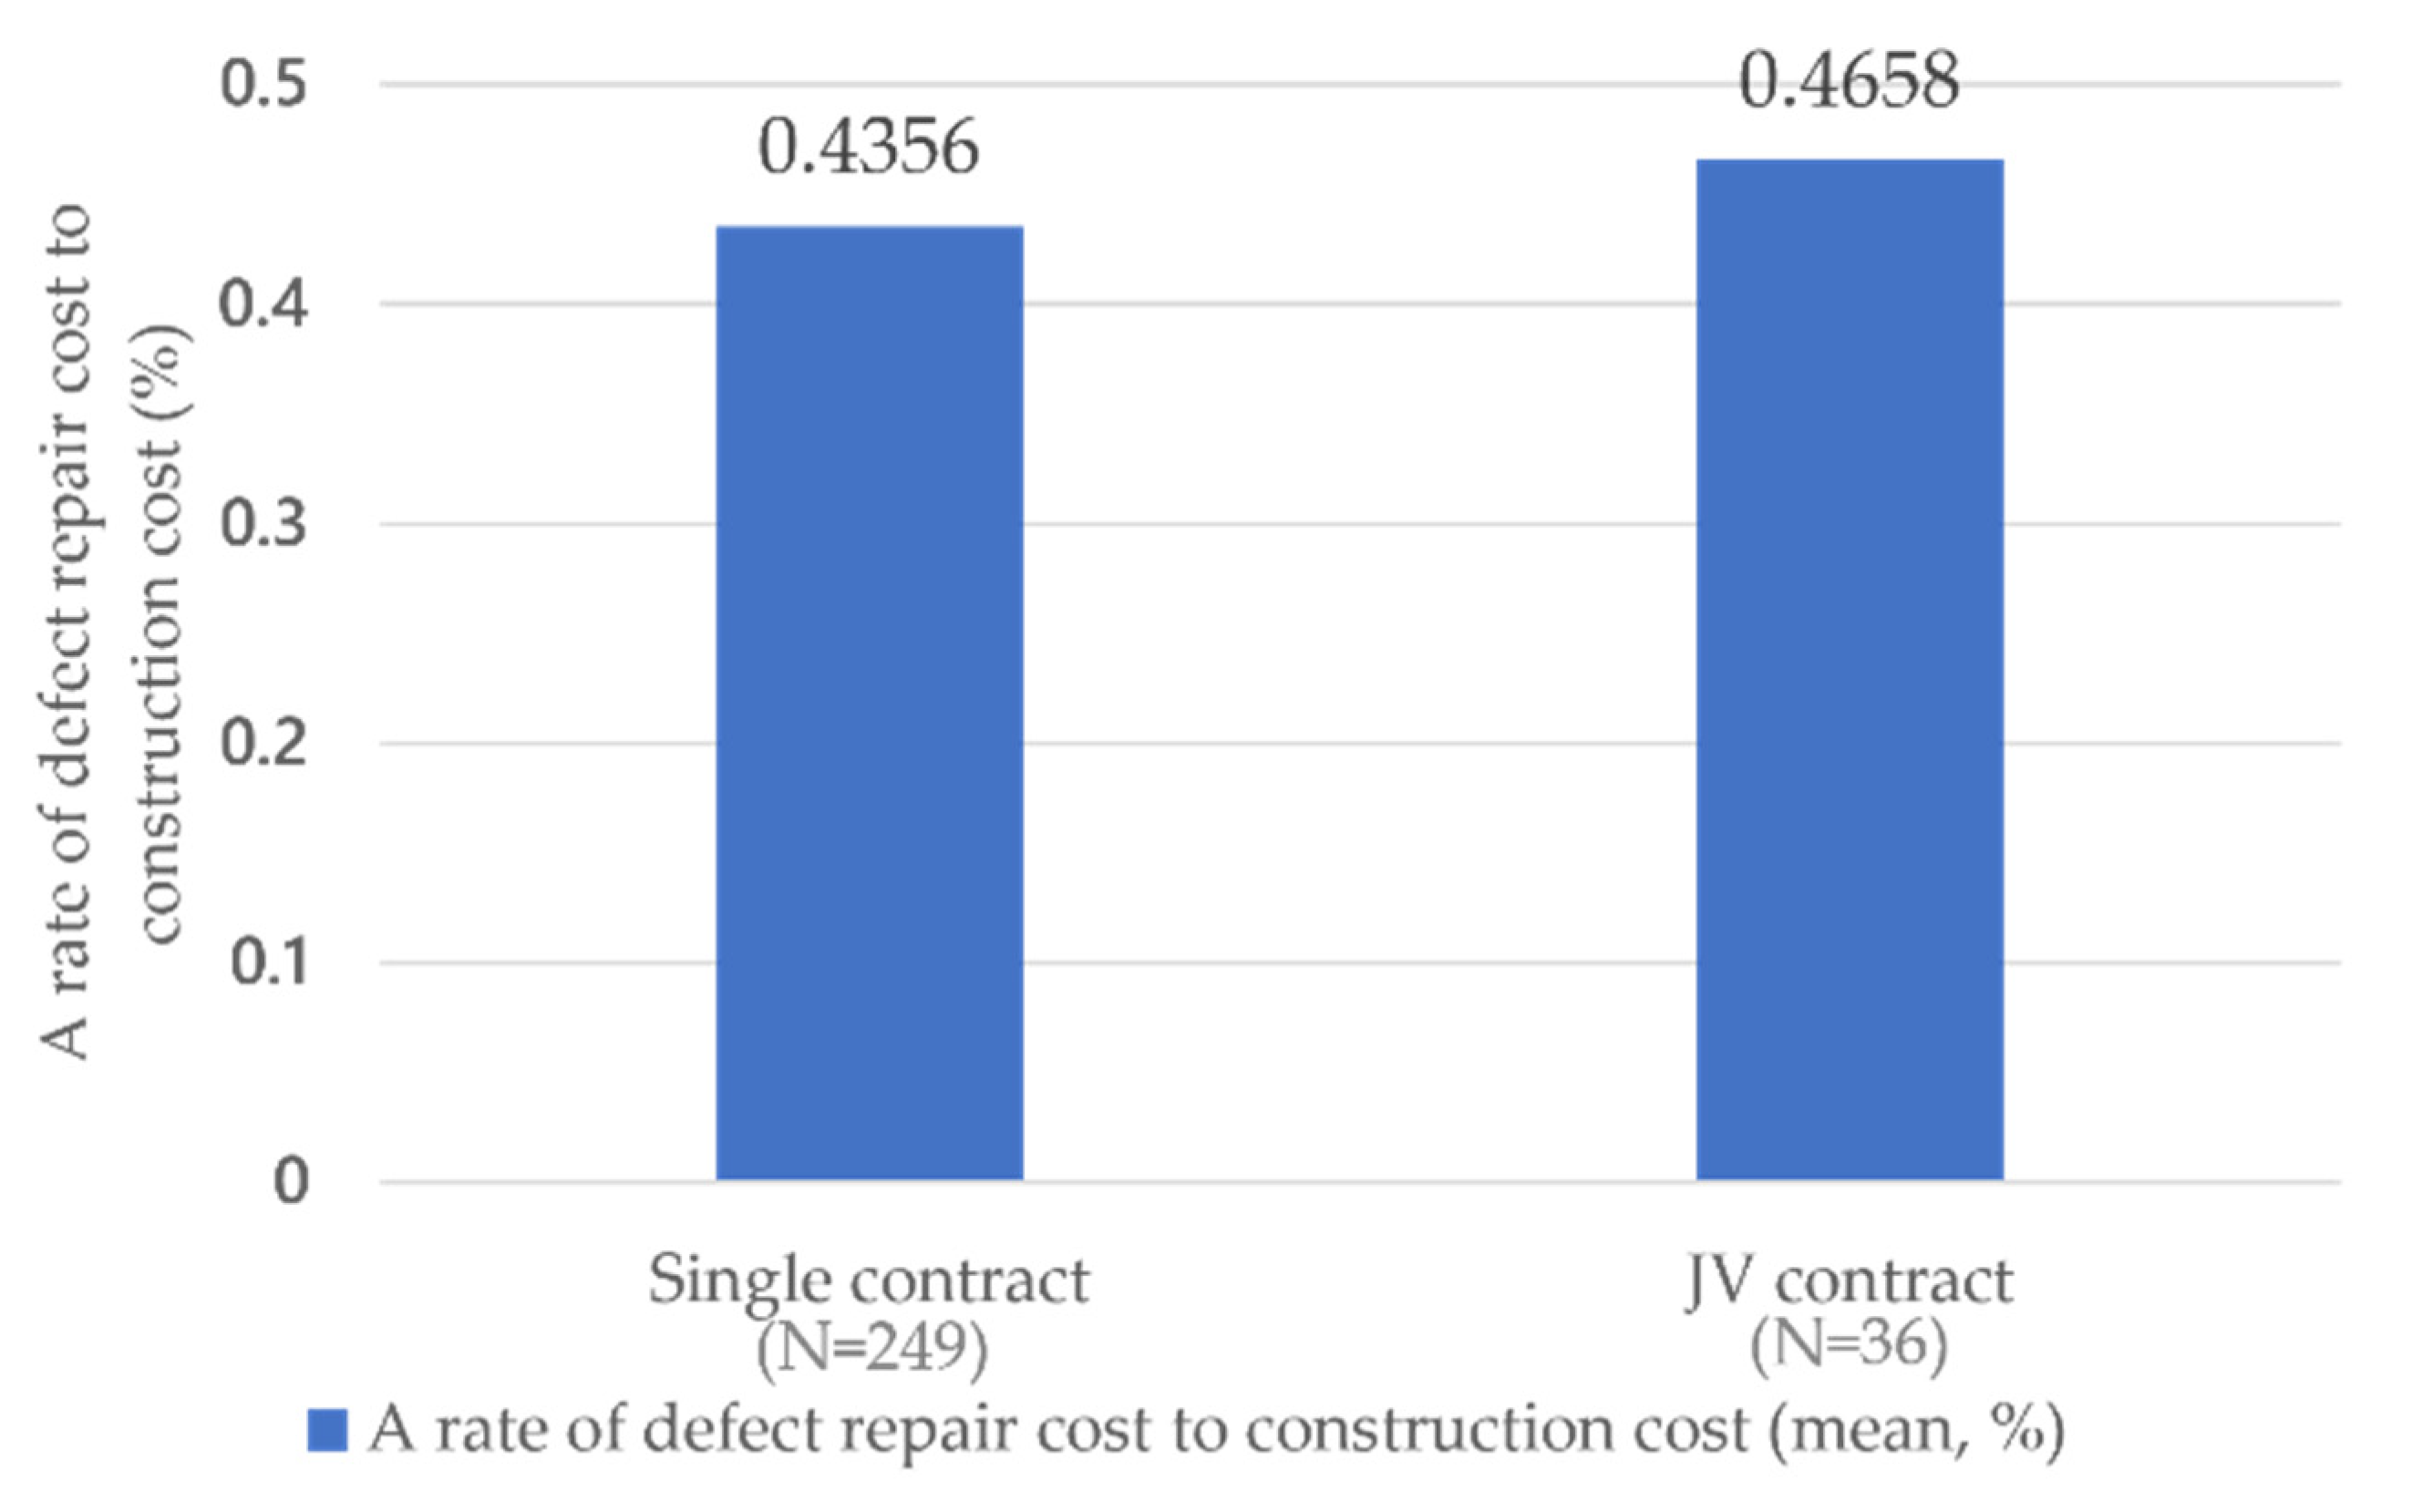
According to the GC contract type, the difference in housing quality showed that the average ratio of defect repair cost to construction cost was 0.4356% for SC and 0.4658% for JVC, as shown in Figure 4. The difference between them is only 1.07 times, and it does not seem to be a significant difference compared to the difference in the status of contract type among the Top GCs.
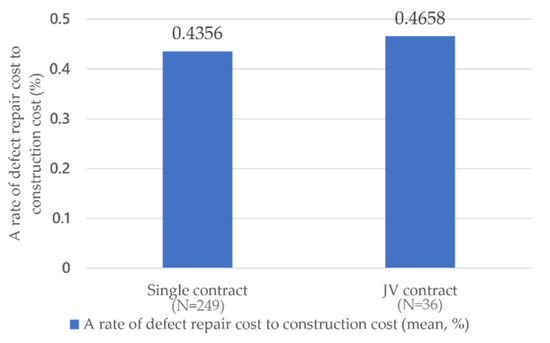
Figure 4.
Comparison of GC contract types.
The t-test results with the ratio of defect repair cost to construction cost (DRCCC) as the dependent variable and the GC contract type as the independent variable showed that the Levene sig-value was 0.847, so equal variance was assumed. Since the p-value with the assumed equal variance is 0.530, no statistically significant difference exists in the average DRCCC between SC and JVC. Therefore, it is difficult to assert that there is a difference in housing quality according to the GC contract type.
4.4. GC Level and GC Contract Type
Previously, the difference in the rate of defect repair cost to construction cost (DRCCC) according to the statuses of the participating Top GCs in the construction and GC contract type was examined. There was a difference in the GC level, but the difference in the GC contract type was unclear. Therefore, it was necessary to check the difference between combining the GC level and the GC contract type. These types can be subdivided into five categories: SC of Top GCs, JVC between Top GCs, JVC between Top GCs and Other GCs, JVC between Other GCs, and SC of Other GCs.
First, the case of the SC with the Top GCs is specified as the first from the left in Figure 5. The DRCCC with the SC with the Top GCs was 0.3816%, while it was 0.4937% for the non-SC of the GC. The difference between the two is about 1.29 times. The t-test results for the DRCCC as the dependent variable and the status of the contract type with the Top GCs as the independent variable showed that the Levene sig-value was 0.190, so equal variance was assumed. Since the p-value with the assumed equal variance was 0.000, there is a statistically significant difference in the average DRCCC between the case with the SC of the Top GCs and the case of the non-Top GCs. Therefore, there might be a difference in housing quality, depending on the status of the SC of the Top GCs.

Figure 5.
Comparison 1 on GC level and GC contract type.
Second, the case of JVC between the Top GCs is specified the second from the left in Figure 5. The DRCCC in the case with the JVC between the Top GCs was 0.3758%. In the other cases, it was 0.4408%. The DRCCC was higher in the non-Top GCs than in the case of JVC among the Top GCs by about 1.17 times. The t-test results with DRCCC as the dependent variable and the JVC among the Top GCs as the independent variable showed that the Levene sig-value was 0.673, so equal variance was assumed. Since the p-value with the assumed equal variance is 0.560, there is no statistically significant difference in the average DRCCC between the case of JVC between the Top GCs and the non-Top GSs. Therefore, it is difficult to determine the difference in housing quality depending on the status of JVC between the Top GCs.
Third, the case with the JVC between the Top GCs and Other GCs is specified in the center of Figure 5. The DRCCC in the case of JVC between the Top GCs and Other GCs was 0.4191%, whereas in the Other GCs cases, it was 0.4403%. The difference between the two is about 1.05 times. The t-test results with DRCCC as the dependent variable and the JVC between the Top GCs and Other GCs as the independent variable showed that the Levene sig-value was 0.340, so equal variance was assumed. Since the p-value with the assumed equal variance is 0.790, there is no statistically significant difference in the average DRCCC in the case of JVC between the Top GCs and Other GCs and the case of non-JVC. Therefore, it is difficult to determine the difference in housing quality depending on the status of JVC between the Top GCs and Other GCs.
Fourth, the case of JVC among Other GCs is specified fourth from the left in Figure 5. The DRCCC in the case of JVC among Other GCs was 0.527%, whereas in the case of other contracts, it was 0.4335%. The difference between the two is about 1.22 times. The t-test results with DRCCC as the dependent variable and the joint contract among Other GCs as the independent variable showed that the Levene sig-value was 0.582, so equal variance was assumed. Since the p-value when equal variance was assumed was 0.155, there is no statistically significant difference in the average DRCCC between the case of JVC among Other GCs and other types of contracts. Therefore, it is difficult to determine the difference in housing quality depending on JVC among Other GCs.
Lastly, the case with the single contract of Other GCs is specified at the right end of Figure 5. The DRCCC’s single contract with other GCs was 0.5028%, while in other cases, it was 0.3990%. The difference between the two is about 1.26 times. The t-test results with DRCCC as the dependent variable and the status of the SC with the Other GCs as the independent variable showed that the Levene sig-value was 0.314, so equal variance was assumed. Since the p-value with assumed equal variance was 0.001, there is a statistically significant difference in the average DRCCC between the SC with the Other GCs and the remaining cases. Therefore, there is a difference in housing quality depending on the status of the SC compared to the Other GCs.
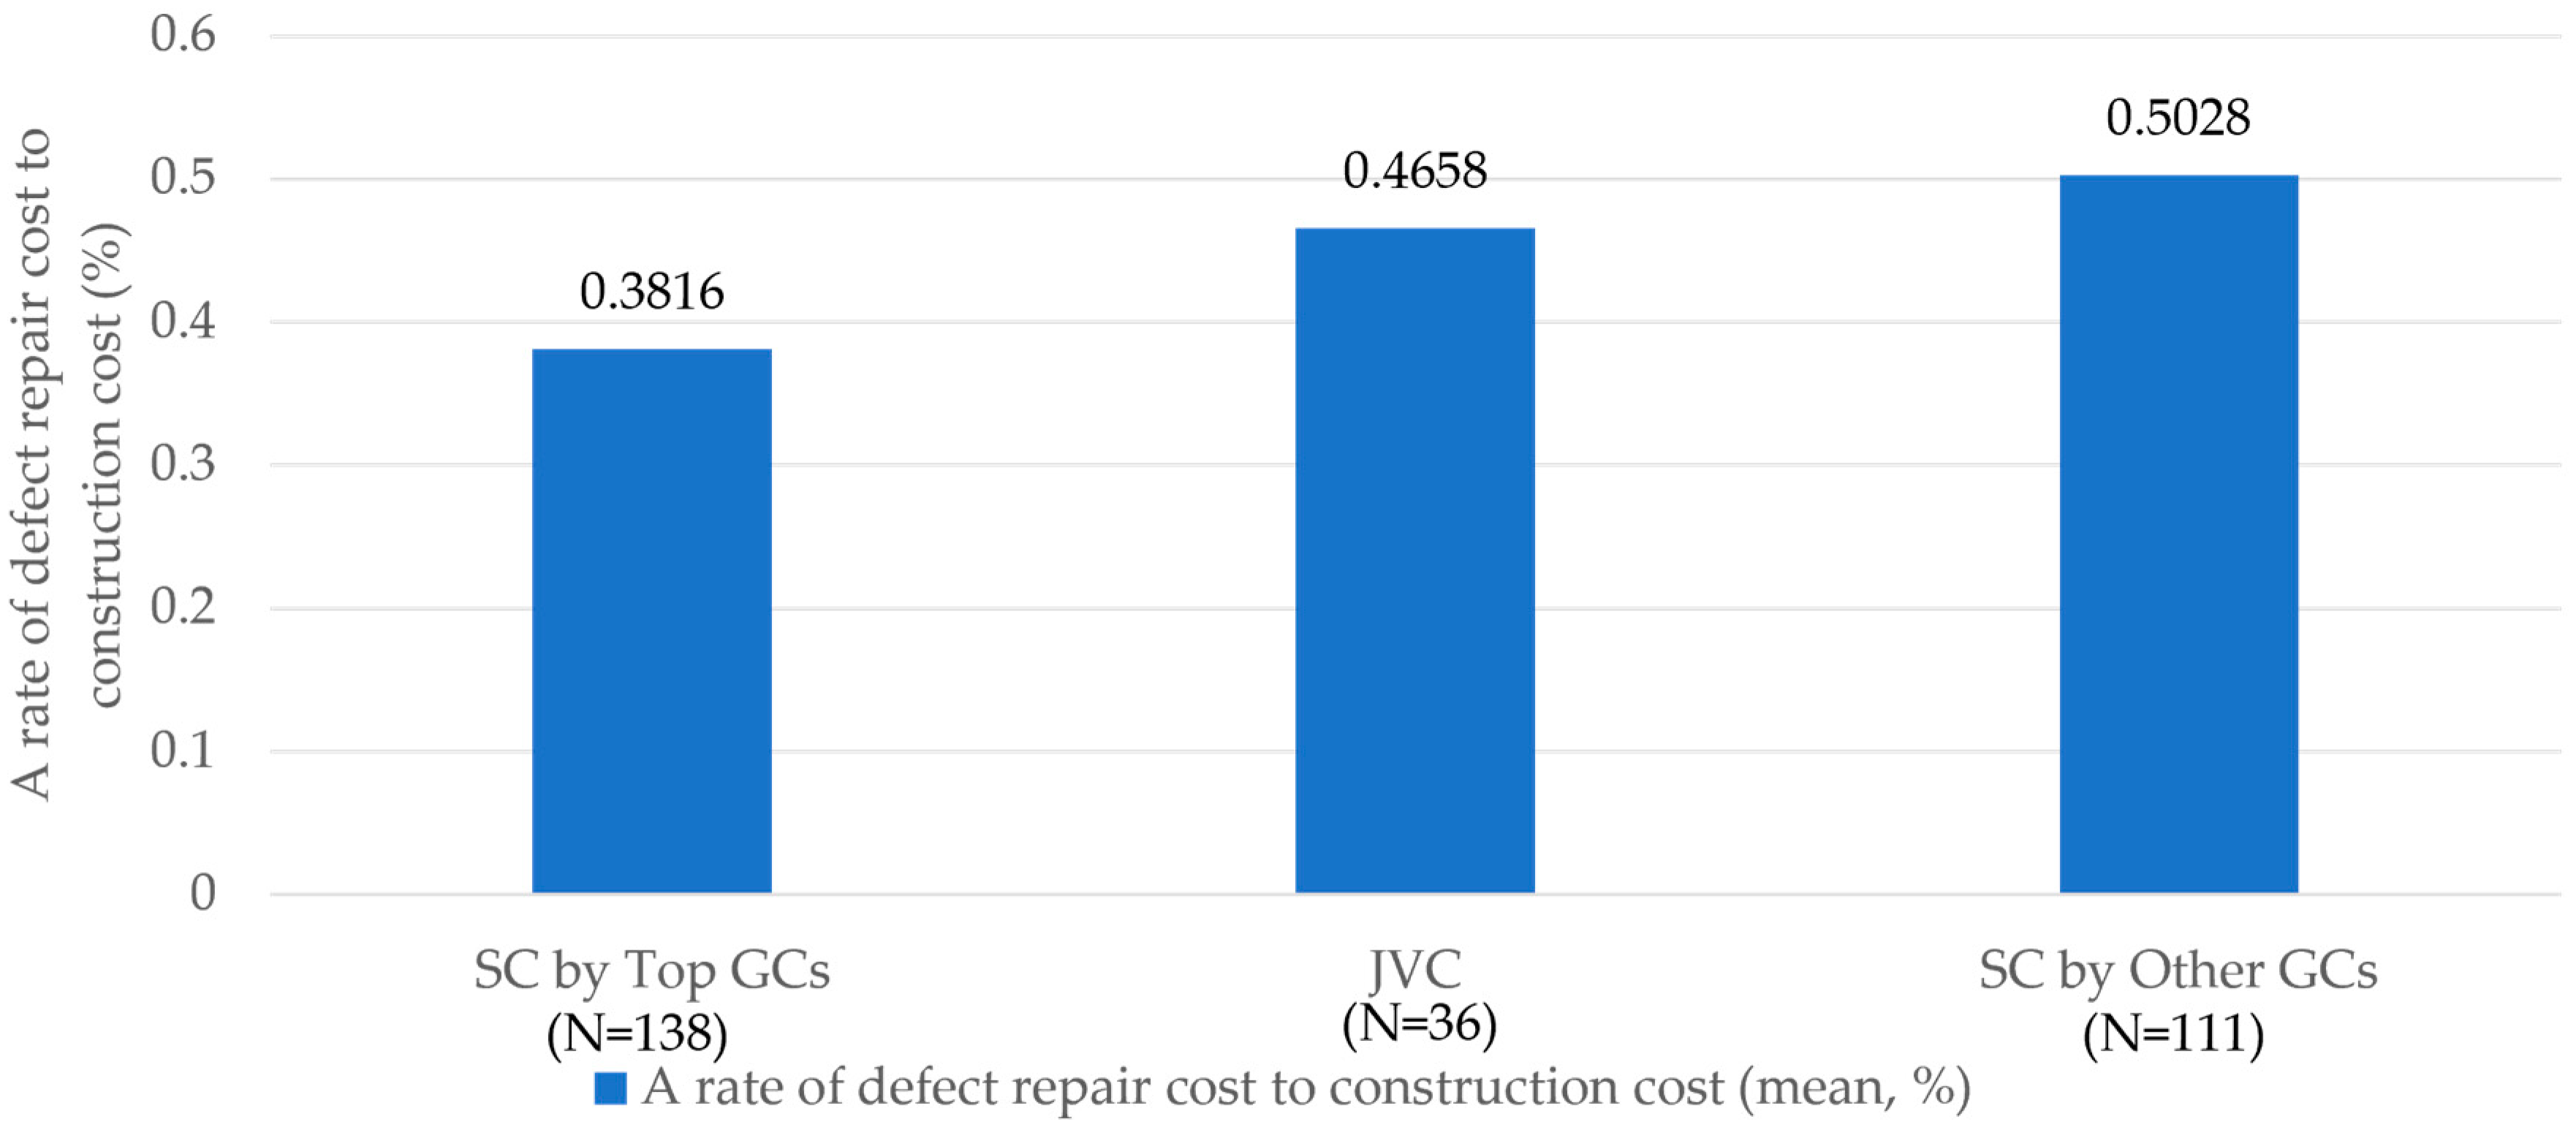
Considering the case in which significant results were derived from the analysis of the above five types, the GC level and GC contract type types can be summarized as follows: the Top GCs are SC, JVC, and SC, with the Other GCs. As shown in Figure 6, the ratio of defect repair cost to construction cost (DRCCC) for each case was 0.3816% for SC with the Top GCs, 0.4658% for JVC, and 0.5028% for SC with Other GCs.
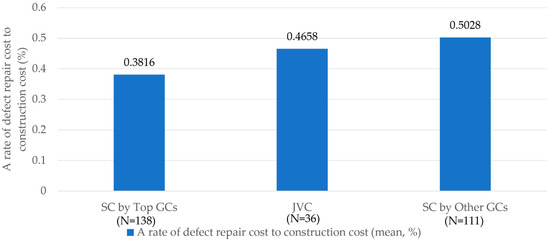
Figure 6.
Comparison 2, on GC level and GC contract type.
The ANOVA results with DRCCC as the dependent variable showed that the Levene sig-value was 0.385, so equal variance was assumed. Since the p-value with the equal variance was 0.001, there is a statistically significant difference in the average value of DRCCC for these three cases. A post hoc test using the Tamhane and Dunnett T3 method was conducted, and there was a difference in the average DRCCC value between the case of the SC with the Top GCs and the SC with the Other GCs. Therefore, the quality of the single contract with the Top GCs is better than that of the SC with Other GCs.
4.5. Household Scale
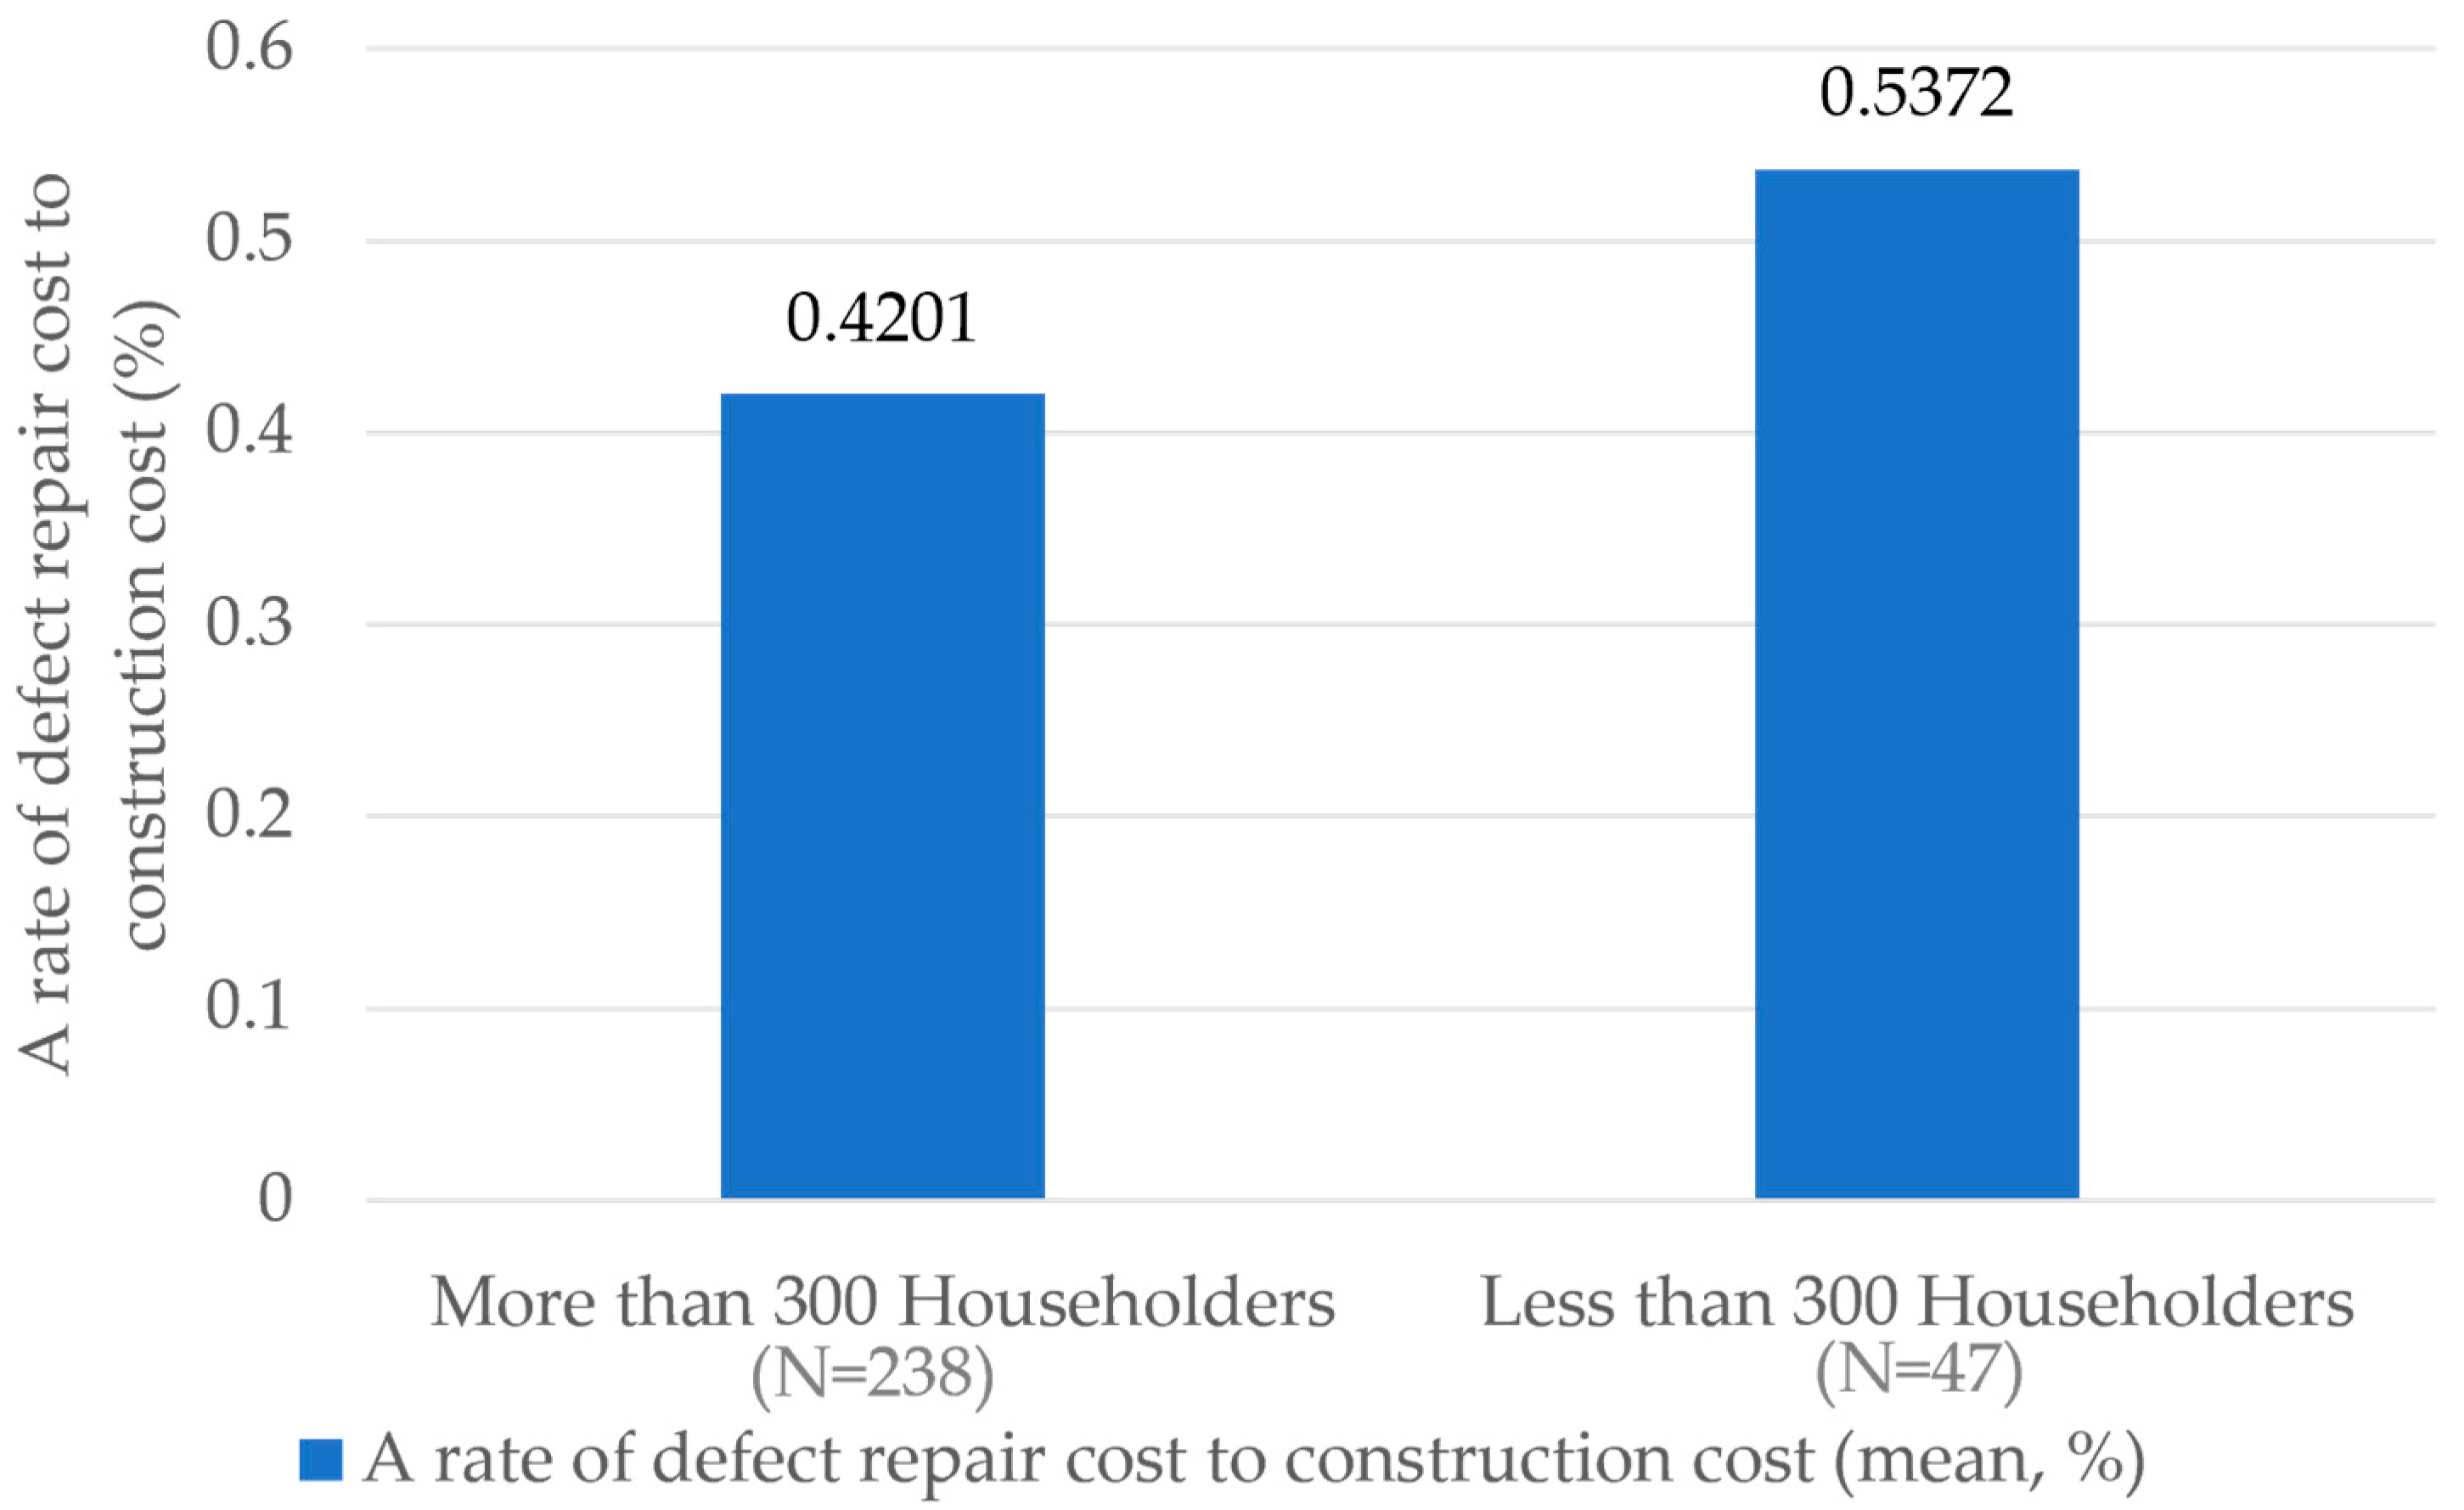
The difference in housing quality depending on the size of housing complexes with more than 300 households showed that the ratio of defect repair cost to construction cost (DRCCC) for housing complexes with more than 300 households averaged 0.4201%, as in Figure 6. On the other hand, the DRCCC for housing complexes with fewer than 300 households was found to be 0.5372%, on average. The difference was about 1.28 times.
The t-test results with DRCCC as the dependent variable and the statuses of the housing complexes with more than 300 households as the independent variable showed that the Levene sig-value was 0.108, so equal variance was assumed. In addition, the p-value with the assumed equal variance was 0.006. Therefore, there is a statistically significant difference in the average DRCCC between households with more than 300 households and housing complexes with fewer than 300 households. As shown in Figure 7, the DRCCC of housing complexes with more than 300 households is lower than that for housing complexes with fewer than 300. Therefore, the quality is good when the number of households exceeds 300.
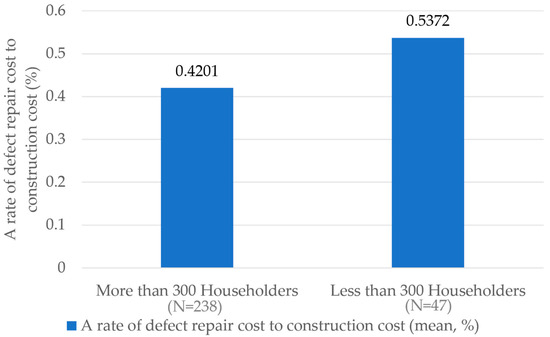
Figure 7.
Comparison on a household scale.
4.6. Comparison of Combinations
Previously, the differences in the ratio of defect repair cost to construction cost (DRCCC) according to GC level, GC contract type, and household scale were examined. Differences according to GC level and GC contract type were classified into three types, and differences according to household scale were classified into two types (Figure 8). Accordingly, the differences between the six types that combined them were examined: SC with the Top GCs for housing complex sizes of less than 300, SC with Top GCs for housing complex sizes of less than 300, JVC for complexes with more than 300 households, JVC for complexes with fewer than 300 households, SC with Other GCs for complexes with more than 300 households, and SC with the Other GCs for the complexes with fewer than 300.

Figure 8.
Comparison of combinations.
The ANOVA results with DRCCC as the dependent variable showed that the Levene sig-value was 0.178, so equal variance was assumed. In addition, the p-value when equal variance was assumed was 0.001. Therefore, there is a statistically significant difference in the average DRCCC value for these six cases. The post hoc test using the Tamhane and Dunnett T3 method showed that there is a clear difference in the average DRCCC between the case with the SC with the Top GCs for complexes with more than 300 households and the SC with the Other GCs for those with fewer than 300 households. Therefore, the quality is the best in the SC with the Top GCs for complexes with more than 300 households, and the poorest in the SC with the Other GCs for the complexes with fewer than 300 households.
5. Discussion
5.1. GC Level and Housing Quality
When the relationship between GC level and housing quality was reviewed, this study confirmed that the higher the GC level, the higher the likelihood of better quality when considering the defects that occurred during the use phase of Korean housing.
Since the quality of the houses built by the Top GCs was good regardless of the contract type and the size of the households, the quality control level with the Top GCs is superior. On the other hand, in the case of the contract with the non-Top GCs, the quality level was relatively low. Therefore, the contracts of non-Top GCs require an in-depth analysis of their quality level and efforts must be made to improve their quality. Due to this difference in quality, Korean home buyers prefer homes built by the Top GCs. Considering that the global economy is currently in recession due to interest rate hikes, home builders need to be highly determined and invest to be chosen by home buyers.
However, in this study, the GC level was arbitrarily divided and analyzed according to the situation in Korea, and the difference according to the level of individual GC companies could not be compared. Therefore, among the same Top GCs, better GCs and worse GCs may exist. Conversely, we cannot rule out the fact that GCs may build houses of good quality. If sufficient data are collected for each GC in the future and the quality level is compared, the housing quality capability of each GC could be diagnosed more accurately.
5.2. Household Scale and Housing Quality
Next, the relationship between household scale and housing quality should be considered. In this case, the number of households in Korea is divided into complexes with more than 300 and those with fewer than 300. Accordingly, there are differences in terms of facilities and management. Therefore, it is necessary to review whether there is a difference in quality according to the standard of 300 households and whether it is appropriate.
According to the comparison of the quality difference for housing complexes based on 300 households in this study, the most striking contrast was found between the SC with the Top GCs for complexes with more than 300 households and SC with the Other GCs for complexes with fewer than 300. In addition, in the case of the SC with the Other GCs, the quality difference between those with more than 300 households and those with fewer than 300 was significant. On the other hand, there seems to be no difference in quality between the SC with the Top GC and JVC based on 300 households.
In general, when the housing scale, such as the number of households, increases, quality control may become difficult because the scope of management of the constructor or supervisor increases. Therefore, the quality level may decrease as the number of households increases. However, the analysis results of this study showed no significant difference in the quality of the houses in the building contract with the Top GCs and JVC. The Top GCs and JVC might not manage quality differently according to the household scale. It is expected that there will be no differences in management goals, methods, and managers, but these details have not been proven. Of course, this is based on the comparison standard of the household complex size of 300; if the standard is different, the result will be different.
On the other hand, there was a significant difference in Other GCs. These points imply that there may be some difference in quality control between complexes with more than 300 households and those with fewer than 300 households. It is difficult to rule out that there may be differences in workforce and investment for quality management, such as different levels of quality management goals or the assignment of managers with different capabilities. Even in the case of the Other GCs, small-scale housing projects with fewer than 300 households may not correctly focus on quality control. To dispel this concept, it is strongly recommended that Other GCs make efforts to improve the quality of housing.
The analysis results of this study suggest that it is difficult to conclude that there was a difference in housing quality based only on the household scale of 300. Instead, it is believed that the difference in GC level and the impact of the household scale simultaneously cause the difference in housing quality. Therefore, if the standard of 300 households is appropriately used for managing or improving housing quality, it may be necessary to consider the GC level as a supplementary variable. For example, the current laws and regulations in Korea stipulate that a quality inspection team should only inspect the quality of houses when there is a household scale of more than 300. In addition, even if a builder of the Other GCs type builds fewer than 300 households, they must be inspected by the quality inspection team. In the future, if the quality level of Other GCs is continuously monitored and the improvement of the quality level to more than a certain level is proven, it will be reasonable to revise the standards in such a way as to exempt the complex from a quality inspection if the contractor constructs fewer than 300 households. Through this arrangement, it is expected that quality improvement can be promoted even when Other GCs build complexes with fewer than 300 households.
6. Conclusions
Post-handover home quality is important to home buyers and housing construction project operators. No consumer should ever need to buy a poor-quality house again. If the quality is bad, the reputation of the housing construction project operators will be bad, and in the worst case, they can face a series of lawsuits. In other words, amid an economic downturn, housing quality and reputation can be decisive success factors that can save housing construction project operators from crises. Therefore, defining housing quality and revealing the factors influencing it are essential.
In this study, the ratio of defect repair cost to construction cost was used as a dependent variable, and housing quality was evaluated and compared according to GC level, contract type, and household scale for the housing quality analysis. The analysis showed that depending on the GC level, there was a quality difference between the case in which a housing contract is made with Korea’s Top GCs and the case in which it was made with non-Top GCs. In addition, when comparing GC levels and contract types in combination, the quality was good when the SC was made with the Top GCs, and the quality was poor when the Other GCs were in a single contract. In the case of the household scale, the quality was better in the case of more than 300 households than in the case of fewer than 300 households. Lastly, the case with the SC with the Top GCs for more than 300 households had the best quality, and the case with the SC with the Other GCs for fewer than 300 households showed the worst quality. However, it was difficult to conclude that the standard of 300 households was a clear criterion for distinguishing housing quality. Therefore, applying laws based on 300 households in Korea is not realistically reasonable, and supplementation of the system is required.
Therefore, in Korea, it is reasonable to require inspections by a public quality inspection team when building houses with fewer than 300 households, especially houses built by low-level GCs. This is important for protecting housing consumers and is also considered a necessary measure to awaken housing producers.
Furthermore, the quality level of each GC could not be found in this study. This is because securing sufficient data at a statistically significant level is practically difficult. Therefore, it was not confirmed which of the Top GCs was better and whether there were high-quality GCs in the case of the Other GCs. In the future, efforts should be made to provide more accurate housing quality information to housing construction project operators and home buyers by supplementing this point and comparing the quality levels of individual GCs.
In addition, since the case data obtained in this study did not include information on designers and supervisors, it was difficult to examine whether they influenced the outcome. Nonetheless, since housing quality can vary depending on the completeness of the original design drawings and specifications, differences, according to designers should also be investigated in the future. In addition, differences in housing quality according to the capabilities of inspectors who monitor quality should also be reviewed.
Author Contributions
Conceptualization, J.P.; methodology, J.P.; software, J.P.; validation, J.P. and D.S.; formal analysis, J.P.; investigation, J.P.; resources, J.P.; data curation, J.P.; writing—original draft preparation, J.P.; writing—review and editing, J.P. and D.S.; visualization, J.P.; supervision, D.S.; project administration, D.S.; funding acquisition, D.S.; All authors have read and agreed to the published version of the manuscript.
Funding
This work was supported by the National Research Foundation of Korea (NRF) grant funded by the Korean government (RS-2024-00343417).
Institutional Review Board Statement
Not applicable.
Informed Consent Statement
Not applicable.
Data Availability Statement
The data presented in this study are available on request from the corresponding author.
Conflicts of Interest
The authors declare no conflicts of interest.
References
- Gurmu, A.; Krezel, A.; Ongkowijoyo, C. Fuzzy Stochastic Model to Assess Defects in Low-Rise Residential Buildings. J. Build. Eng. 2021, 40, 102318. [Google Scholar] [CrossRef]
- Home Builders Federation. National New Home Customer Satisfaction Survey. Home Builders Federation. Available online: https://www.hbf.co.uk/documents/13411/19th_CSS_Survey_2024_Completions_Oct_2022_to_Sept_2023.pdf (accessed on 30 June 2024).
- Plebankiewicz, E.; Malara, J. Analysis of Defects in Residential Buildings Reported During the Warranty Period. Appl. Sci. 2020, 10, 6123. [Google Scholar] [CrossRef]
- Balouchi, M.; Gholhaki, M. Reworks Causes and Related Costs in Construction: Case of Parand Mass Housing Project in Iran. Int. J. Qual. Reliab. Manag. 2019, 36, 1392–1408. [Google Scholar] [CrossRef]
- Apartment Defect Dispute Mediation Committee. Case Status. Available online: https://www.adc.go.kr/adms/portal/com/movePage.do (accessed on 30 June 2024).
- Zou, W.; Couani, P. Managing Risks in Green Building Supply Chain. Archit. Eng. Des. Manag. 2012, 8, 143–158. [Google Scholar] [CrossRef]
- Park, J.; Seo, D. Defect Repair Cost and Home Warranty Deposit, Korea. Buildings 2022, 12, 1027. [Google Scholar] [CrossRef]
- Home Owners Alliance. Homeowner Survey 2019: Top UK Housing Concerns Revealed. Available online: https://hoa.org.uk/2019/08/homeowner-survey-2019 (accessed on 30 June 2024).
- Park, J.; Seo, D. Post-Handover Quality Management Index of Electric Housing Work. Adv. Civ. Eng. 2022, 2022, 4690073. [Google Scholar] [CrossRef]
- Sommerville, J.; Craig, N.; Bowden, S. The Standardisation of Construction Snagging. Struct. Surv. 2004, 22, 251–258. [Google Scholar] [CrossRef]
- Park, J.; Seo, D. Defect Index of Timberwork in House, Korea. Forests 2021, 12, 896. [Google Scholar] [CrossRef]
- Suprapto, M.; Bakker, H.; Mooi, H.; Moree, W. Sorting Out the Essence of Owner–Contractor Collaboration in Capital Project Delivery. Int. J. Proj. Manag. 2015, 33, 664–683. [Google Scholar] [CrossRef]
- Torregrosa-Jaime, B.; Martínez, P.; González, B.; Payá-Ballester, G. Modelling of a Variable Refrigerant Flow System in Energy Plus for Building Energy Simulation in an Open Building Information Modelling Environment. Energies 2019, 12, 22. [Google Scholar] [CrossRef]
- Park, J.; Seo, D. Post-Handover Housing Quality Management and Standards in Korea. Buildings 2023, 13, 1921. [Google Scholar] [CrossRef]
- Park, J.; Seo, D. Defect Repair Deposit and Insurance Premium for a New Home Warranty in Korea. Buildings 2023, 13, 815. [Google Scholar] [CrossRef]
- National Law Information Center. Housing Act. South Korea, 2024. Available online: https://www.law.go.kr/lsInfoP.do?lsiSeq=257311&lsId=004949&chrClsCd=010202&urlMode=engLsInfoR&viewCls=engLsInfoR&efYd=20240319&vSct=%EC%A3%BC%ED%83%9D%EB%B2%95&ancYnChk=#0000 (accessed on 30 June 2024).
- National Law Information Center. Enforcement Decree of the Housing Act. South Korea, 2024. Available online: https://www.law.go.kr/lsInfoP.do?lsiSeq=261081&lsId=004949&chrClsCd=010202&urlMode=engLsInfoR&viewCls=engLsInfoR&efYd=20240319&vSct=ENFORCEMENT%20DECREE%20OF%20THE%20HOUSING%20ACT&ancYnChk=#0000 (accessed on 30 June 2024).
- National Law Information Center. Multi-family Housing Management Act. South Korea, 2024. Available online: https://www.law.go.kr/lsInfoP.do?lsiSeq=255407&lsId=004949&chrClsCd=010202&urlMode=engLsInfoR&viewCls=engLsInfoR&efYd=20240118&vSct=%EA%B3%B5%EB%8F%99%EC%A3%BC%ED%83%9D&ancYnChk=#0000 (accessed on 30 June 2024).
- National Law Information Center. Regulations on Housing Construction Standards, etc. South Korea, 2024. Available online: https://www.law.go.kr/LSW/lsSc.do?section=&menuId=1&subMenuId=15&tabMenuId=81&eventGubun=060101&query=%EC%A3%BC%ED%83%9D%EA%B1%B4%EC%84%A4%EA%B8%B0%EC%A4%80+%EB%93%B1%EC%97%90+%EA%B4%80%ED%95%9C+%EA%B7%9C%EC%A0%95#undefined (accessed on 30 June 2024).
- Korea Institute of Registered Architects. South Korea, 2024. Available online: https://www.kira.or.kr/jsp/main/04/04.jsp?ba_bbsId=BBS_00_BZ_PDS&bbsLocale=&sc_ba_bbsId=BBS_00_BZ_PDS&mode=read&sc_ba_cateId=&sc_scType=1&sc_keyword=&sc_ba_titleL=&sc_ba_authorNameL=&ba_id=236727 (accessed on 30 June 2024).
- Korean Professional Engineers Association. South Korea, 2024. Available online: https://www.kpea.or.kr/kpea/engineer/engineer.do?gubun=5 (accessed on 30 June 2024).
- National Law Information Center. Regulation on Structure Standards of Building. South Korea, 2024. Available online: https://www.law.go.kr/LSW/lsSc.do?section=&menuId=1&subMenuId=15&tabMenuId=81&eventGubun=060101&query=%EA%B1%B4%EC%B6%95%EB%AC%BC%EC%9D%98+%EA%B5%AC%EC%A1%B0%EA%B8%B0%EC%A4%80+%EB%93%B1%EC%97%90+%EA%B4%80%ED%95%9C+%EA%B7%9C%EC%B9%99#undefined (accessed on 30 June 2024).
- National Law Information Center. Enforcement Decree of the Building Act. South Korea, 2024. Available online: https://www.law.go.kr/engLsSc.do?menuId=1&subMenuId=21&tabMenuId=117&query=%EA%B1%B4%EC%B6%95%EB%B2%95%20%EC%8B%9C%ED%96%89%EB%A0%B9# (accessed on 30 June 2024).
- National Law Information Center. Enforcement Decree of the Act on Installation and Management of Firefighting Systems. South Korea, 2024. Available online: https://www.law.go.kr/lsSc.do?menuId=1&subMenuId=15&tabMenuId=81&query=%EC%A3%BC%ED%83%9D%EA%B1%B4%EC%84%A4%EA%B8%B0%EC%A4%80%20%EB%93%B1%EC%97%90%20%EA%B4%80%ED%95%9C%20%EA%B7%9C%EC%A0%95#undefined (accessed on 30 June 2024).
- National Law Information Center. Regulations on the Housing Construction Standard. South Korea, 2024. Available online: https://www.law.go.kr/LSW/lsSc.do?section=&menuId=1&subMenuId=15&tabMenuId=81&eventGubun=060101&query=%EA%B1%B4%EC%B6%95%EB%AC%BC%EC%9D%98+%EA%B5%AC%EC%A1%B0%EA%B8%B0%EC%A4%80+%EB%93%B1%EC%97%90+%EA%B4%80%ED%95%9C+%EA%B7%9C%EC%B9%99#undefined (accessed on 30 June 2024).
- Queen’s Printer, Homeowner Protection Act and Insurance Act. Available online: https://www.bclaws.gov.bc.ca/civix/document/id/complete/statreg/29_99#section7 (accessed on 30 June 2024).
- Japanese Digital Agency. Act on Assurance of Performance of Specified Housing Defect Warranty. Available online: https://elaws.e-gov.go.jp/document?lawid=419AC0000000066_20210930_503AC0000000048&keyword=%E4%BD%8F%E5%AE%85 (accessed on 30 June 2024).
- Forcada, N.; Macarulla, M.; Gangolells, M.; Casals, M. Handover Defects: Comparison of Construction and Post-handover Housing Defects. Build. Res. Inf. 2016, 44, 279–288. [Google Scholar] [CrossRef]
- Chisholm, E.; Keall, M.; Bennett, J.; Marshall, A.; Telfar-Barnard, L.; Thornley, L.; Howden-Chapman, P. Why don’t Owners Improve Their Homes? Results from a Survey Following a Housing Warrant-offitness Assessment for Health and Safety. Aust. N. Z. J. Public Health 2019, 43, 221–227. [Google Scholar] [CrossRef]
- Fan, C.-L. Defect Risk Assessment Using a Hybrid Machine Learning Method. J. Constr. Eng. Manag. 2020, 146, 04020102. [Google Scholar] [CrossRef]
- Schultz, C.; Jørgensen, K.; Bonke, S.; Rasmussen, G. Building Defects in Danish Construction: Project Characteristics Influencing the Occurrence of Defects at Handover. Archit. Eng. Des. Manag. 2015, 11, 423–439. [Google Scholar] [CrossRef]
- Vásquez-Hernández, A.; Botero, L. Standardizing System of Post Handover Defects for the Construction Sector in Colombia. J. Archit. Eng. 2019, 25, 05019004. [Google Scholar] [CrossRef]
- Sandanayake, M.; Yang, W.; Chhibba, N.; Vrcelj, Z. Residential Building Defects Investigation and Mitigation—A Comparative Review in Victoria, Australia, for Understanding the Way Forward. Eng. Constr. Archit. Manag. 2022, 29, 3689–3711. [Google Scholar] [CrossRef]
- Love, P.; Li, H. Quantifying the Causes and Costs of Rework in Construction. Constr. Manag. Econ. 2000, 18, 479–490. [Google Scholar] [CrossRef]
- Milion, R.; Alves, T.; Paliari, J.; Liboni, L. CBA-Based Evaluation Method of the Impact of Defects in Residential Buildings: Assessing Risks towards Making Sustainable Decisions on Continuous Improvement Activities. Sustainability 2021, 13, 6597. [Google Scholar] [CrossRef]
- Seo, D.; Lee, U. Characteristic Analysis of Utilization of Security Deposit for Repairing Defects Using Statistical Analysis. J. Korea Inst. Build. Constr. 2015, 15, 209–215. [Google Scholar] [CrossRef][Green Version]
- Choi, J. Evaluation of Defect Repairing Bond Ratio through Defect Lawsuit Case Study in Apartment Building. Ph.D. Dissertation, Chungbuk National University, Cheongju, Republic of Korea, 2017. Available online: https://chungbuk.dcollection.net/public_resource/pdf/200000766489_20240722132236.pdf (accessed on 30 June 2024).
- Kim, Y. Regression Models for Defect Repair Cost Predictions Year and Wet Construction of Apartment House. Master’s Thesis, University of Seoul, Seoul, Republic of Korea, 2019. Available online: https://dcollection.uos.ac.kr/public_resource/pdf/000000031146_20240722132138.pdf (accessed on 30 June 2024).
Disclaimer/Publisher’s Note: The statements, opinions and data contained in all publications are solely those of the individual author(s) and contributor(s) and not of MDPI and/or the editor(s). MDPI and/or the editor(s) disclaim responsibility for any injury to people or property resulting from any ideas, methods, instructions or products referred to in the content. |
© 2024 by the authors. Licensee MDPI, Basel, Switzerland. This article is an open access article distributed under the terms and conditions of the Creative Commons Attribution (CC BY) license (https://creativecommons.org/licenses/by/4.0/).

