Article

Automated Concrete Bridge Deck Inspection Using Unmanned Aerial System (UAS)-Collected Data: A Machine Learning (ML) Approach

by
Rojal Pokhrel
1,
Reihaneh Samsami
1,*,
Saida Elmi
2 and
Colin N. Brooks
3
1
Department of Civil and Environmental Engineering, University of New Haven, West Haven, CT 06516, USA
2
Department of Electrical and Computer Engineering and Computer Science, University of New Haven, West Haven, CT 06516, USA
3
Michigan Tech Research Institute (MTRI), Michigan Technological University, Ann Arbor, MI 49931, USA
*
Author to whom correspondence should be addressed.
Eng 2024, 5(3), 1937-1960; https://doi.org/10.3390/eng5030103
Submission received: 10 June 2024 / Revised: 22 July 2024 / Accepted: 25 July 2024 / Published: 15 August 2024

Abstract

:
Bridges are crucial components of infrastructure networks that facilitate national connectivity and development. According to the National Bridge Inventory (NBI) and the Federal Highway Administration (FHWA), the cost to repair U.S. bridges was recently estimated at approximately USD 164 billion. Traditionally, bridge inspections are performed manually, which poses several challenges in terms of safety, efficiency, and accessibility. To address these issues, this research study introduces a method using Unmanned Aerial Systems (UASs) to help automate the inspection process. This methodology employs UASs to capture visual images of a concrete bridge deck, which are then analyzed using advanced machine learning techniques of Convolutional Neural Networks (CNNs) and Vision Transformers (ViTs) to detect damage and delamination. A case study on the Beyer Road Concrete Bridge in Michigan is used to demonstrate the developed methodology. The findings demonstrate that the ViT model outperforms the CNN in detecting bridge deck damage, with an accuracy of 97%, compared to 92% for the CNN. Additionally, the ViT model showed a precision of 96% and a recall of 97%, while the CNN model achieved a precision of 93% and a recall of 61%. This technology not only enhances the maintenance of bridges but also significantly reduces the risks associated with traditional inspection methods.

1. Introduction

Bridges are one of the major infrastructure elements that connect and advance the development of any nation. They enhance the movement of goods and people and boost the regional socio-economy of a country [1]. According to the National Bridge Inventory (NBI) and the Federal Highway Administration (FHWA), there are more than 616,000 bridges in the U.S. Around 40% of these bridges have passed their design life of 50 years, and 7.5% of these bridges are considered structurally deficient [1]. The estimated cost to repair these bridges equals nearly USD 164 billion [2,3,4].
In a traditional inspection procedure, each bridge undergoes periodic manual and visual inspections to assess its physical and operational state. There are several safety, efficiency, and accessibility issues associated with these traditional inspection procedures. For example, these procedures are often conducted by blocking the traffic and potentially placing the inspectors and engineers in areas with restricted movement. In addition, it is difficult to reach every part of the bridge (such as the space between the girders, beams, or other parts of the bridge). Last but not least, underwater bridge inspections require diving equipment and trained personnel.
Understanding the difficulties of traditional bridge inspection, some advanced technologies are offered to automate bridge inspection. UAS is one of these advanced technologies. UAS is a system consisting of a drone and usually a set of optical, LiDAR, and/or thermal sensors mounted on the drone for data collection purposes.
By using UAS, it is possible to collect visual and thermal images and remotely inspect different bridge components [5]. Some advantages of UAS data collection are as follows [5]:
It reduces the overall time and the cost of inspection.
It reduces traffic control during the time of inspection.
It provides easy access to areas of the bridge that are difficult to reach, such as tall piers.
Most importantly, it provides safety for the inspection crew by reducing the need for interaction with hazardous environments and working in the tight and confined spaces of snooper trucks and roadside areas.
UAS-collected data can be analyzed by using machine learning (ML). ML is a technique that imitates intelligent human behavior by learning via computational methods. In this method, a computer can develop learning algorithms that build models from data [6]. Under the context of ML, Convolutional Neural Networks (CNNs) and Vision Transformers (ViTs) are two approaches inspired by the human brain, designed for processing visual data [6]. While CNN uses convolutional layers to learn hierarchical representations and extract meaningful features from images [7], ViT employs self-attention mechanisms to treat images as sequences of patches, which enables more direct learning of relationships across different parts of an image. This approach not only enhances classification accuracy but also significantly reduces computational demands compared to CNN [8].
Recent studies have increasingly explored the use of ML for bridge inspections, primarily focusing on Convolutional Neural Networks (CNNs) and, to a lesser extent, on Vision Transformers (ViTs). The primary ML techniques employed for identifying and locating damage and delamination on bridge decks include labeling areas, localization, and segmentation [9]. These tools are utilized to analyze images collected by UAS [10], facilitating the creation of damage and delamination reports [9].
The objective of this research study is to design an automated bridge inspection framework that integrates UAS-collected data with ML tools including CNN and ViT to detect damage and delamination on a concrete bridge deck. The performance of these two tools is also compared in terms of Accuracy, Precision, Recall, and F Score for a case study located in Michigan to illustrate the performance of the developed methodology.

2. Literature Review

A bridge is a structure including supports erected over a depression or an obstruction, such as water, or highway [11]. The National Bridge Inspection Standards (NBIS) are federal regulations in the United States that set forth guidelines for bridge inspectors and state and define bridge inspection intervals. Basic intervals were established by the NIBS for three different types of bridge inspection: routine inspection (every 24 months), fracture critical member (every 24 months), and submerged inspection (every 60 months). Inspection programs usually take a complete approach, including short-interval visits by maintenance staff, medium intervals by certified inspectors, and long-term intervals by licensed professional engineers [12].
In a traditional inspection procedure, each bridge undergoes periodic manual and visual inspections to assess its physical and operational state. There are several safety, efficiency, and accessibility issues associated with these traditional inspection procedures. For example, these procedures are conducted by blocking the traffic and transporting the inspectors and engineers in a tight and confined space. In addition, it is difficult to reach every part of the bridge (such as the space between the girders, beams, or other parts of the bridge). Last but not least, underwater bridge inspections require diving equipment and trained personnel. The traditional approach of bridge inspection depends on the visual inspection and manual measurement of damage which increases the duration, cost, and manpower required for the inspection. It also mainly depends on the bridge inspector’s qualifications and experience and the frequency of the bridge inspection [13].

2.1. Automated Bridge Inspection

In contrast to manual inspections, automated bridge inspection leverages advanced technologies to optimize the collection, processing, analysis, and documentation of bridge data, effectively overcoming many of the traditional method’s limitations [14]. Automated data collection and data analysis phases and tools enabling each phase are described in the following sections.

Automated Data Collection

The rapid progress of technology has transformed data collection techniques, which have gradually shifted from conventional methods to advanced ones. The requirement for scalability, precision, and efficiency in data collection across multiple domains has propelled this shift [15]. Laser scanning technology is one of the emerging methods of data collection in terms of bridge inspection due to its high precision and rapid data collection rate. By capturing thousands of 3D points per second with accuracy down to the mm, laser scanners make it possible to create intricate 3D bridge models for examination. For creating methods for organizing data gathering in the field and for automating the analysis of the data to find geometric elements of interest, advanced laser scanning technology may be used [16].
In addition to laser scanners, remote sensors have been progressively integrated by both public and private organizations into their infrastructure management workflow to overcome the drawbacks of visual inspection. With the use of remote sensing technologies, crack detection will be more automated and efficient, requiring less human inspection and resolving time and accessibility concerns [6,17].
UAS is one of the remote sensing tools that can be equipped with different sensors on the drone for data collection. By using UAS, it is possible to collect visual and thermal images of bridge components and remotely inspect different bridge components [5]. These data can be collected and processed into the inspection dataset such as point clouds, 3D photologs, and ortho plane images. Some advantages of UAS data collection in comparison to manual data collection are as follows [5]:
  • It reduces the overall time and the cost of inspection.
  • It reduces traffic control during the time of inspection.
  • It provides easy access to areas of the bridge that are difficult to reach, such as tall piers.
  • Most importantly, it provides safety for the inspection crew by removing the need for interaction with hazardous environments and working in the tight and confined space of the snooper trucks.
While laser scanning offers high precision, its practical applications in bridge inspection can be limited by high operational costs and the intricacies of data processing [17]. In contrast, UAS provides a more versatile and cost-effective solution. UAS not only accesses hard-to-reach areas with less risk but also delivers faster data collection with comparable accuracy. Moreover, the flexibility and lower cost of deployment make UAS especially advantageous for regular bridge monitoring, reducing both financial burdens and disruption to traffic, unlike laser scanning, which often requires extensive setup and can be more disruptive. Thus, UAS emerges as a more suitable technology for comprehensive and frequent bridge inspections [5,14].
While UAS is a highly effective tool for bridge inspections, there are some minor limitations to consider. These include manageable challenges like optimizing data processing algorithms [9] and the need for occasional additional manpower for drone operations [5]. The State of Ohio has shown that bridge inspectors can be trained in drone operations as part of their job [18]. Environmental factors such as adverse weather can also influence drone performance [5], and there are routine regulatory processes to navigate when flying in restricted airspace [14]. Additionally, the size limitations of drone-mounted cameras and sensors may affect data collection to some extent [19]. Nonetheless, these issues are generally outweighed by the significant benefits of UAS, making it a valuable tool for bridge inspection tasks.

2.2. Machine Learning for Automated UAS Data Analysis

UAS data analysis requires the application of advanced computer vision and image processing tools and techniques extract meaningful data from the collected images. One of these tools is ML. The ML approach uses statistical models and algorithms to let systems learn from data, find patterns, and make well-informed predictions or decisions.
Different algorithms are built for pattern recognition and classification of damage in bridges such as cracking, weathering, and spalling using ML [20]. It has been proven that ML enables accurate and comprehensive image-based damage detection in infrastructure systems. Some of the popular ML approaches are CNN and ViT.
CNNs are a class of deep learning (DL) architecture intended for applications like object detection, image classification, and image recognition. A CNN model consists of several steps [7]. Numerous studies have investigated the application of CNNs in bridge inspection. Dorafshan draws attention to the potential of CNNs in identifying and measuring cracks, while Kim concentrates on the application of UASs equipped with high-resolution vision sensors [7,8]. With the increase in detection accuracy, the effectiveness and precision of CNNs in bridge inspection are even greater.
In addition to CNNs, ViT is another deep learning tool that uses architectures that are effective for visual recognition. It consists of several layers of self-attention. One of the core tasks in computer vision is image classification, which is labeling an image according to its content. A ViT model predicts class labels for an input image by treating it as a sequence of image patches, much to the word embeddings used when text is transformed. When trained on sufficient data, ViT performs extraordinarily and requires four times less processing power than CNN.
A range of methods have been proposed for crack detection. Luqman et al. employed sophisticated advanced ML methods, i.e., Vision Transformation to concentrate on crack detection. Their model uses images as datasets of around 5800 images with a resolution of 224 × 224 pixels [21]. Their ViT model architecture was developed and trained by combining the sliding window method with the trained ViT model to ultimately localize the cracks. Their model was demonstrated to perform well in identifying and localization of cracks [21].
Several other studies have utilized ML for bridge inspection purposes. A few of these studies are reviewed and summarized in Table 1.

3. Materials and Methods

The primary objective of this research study is to develop an automated bridge inspection framework that leverages UAS to collect visual data of bridge surfaces which are then analyzed using CNN and ViT tools. This integration aims to enhance the detection and analysis of damage and delamination on concrete bridge decks. This methodology consists of the following steps (Figure 1):
Data collection: As the first step, the UAS collects images of the bridge deck surface as raw data.
Data processing: The raw data are then processed automatically by labeling the features of the data to create positive (damaged) and negative (undamaged) datasets.
Data analysis: CNN and ViT algorithms are developed, and the labeled data are deployed in these models to identify and localize damage on the bridge deck.
Model evaluation and results: The final step assesses the performance of the model after it is trained on specific datasets, focusing on its ability to predict and classify data accurately. The evaluation encompasses various metrics such as training loss, validation loss, model accuracy, and validation accuracy, which help gauge the model’s efficiency and reliability.

3.1. Data Collection

UAS is used to collect visual data during the first step of data collection. Its main purpose is to take high-resolution photos of the target areas. With its ability to collect data across wide and inaccessible areas with precision and efficiency, UAS images provide unique insights into bridge conditions. The different UAS platforms are illustrated in the Illustrative Example section of this study.

3.2. Data Processing

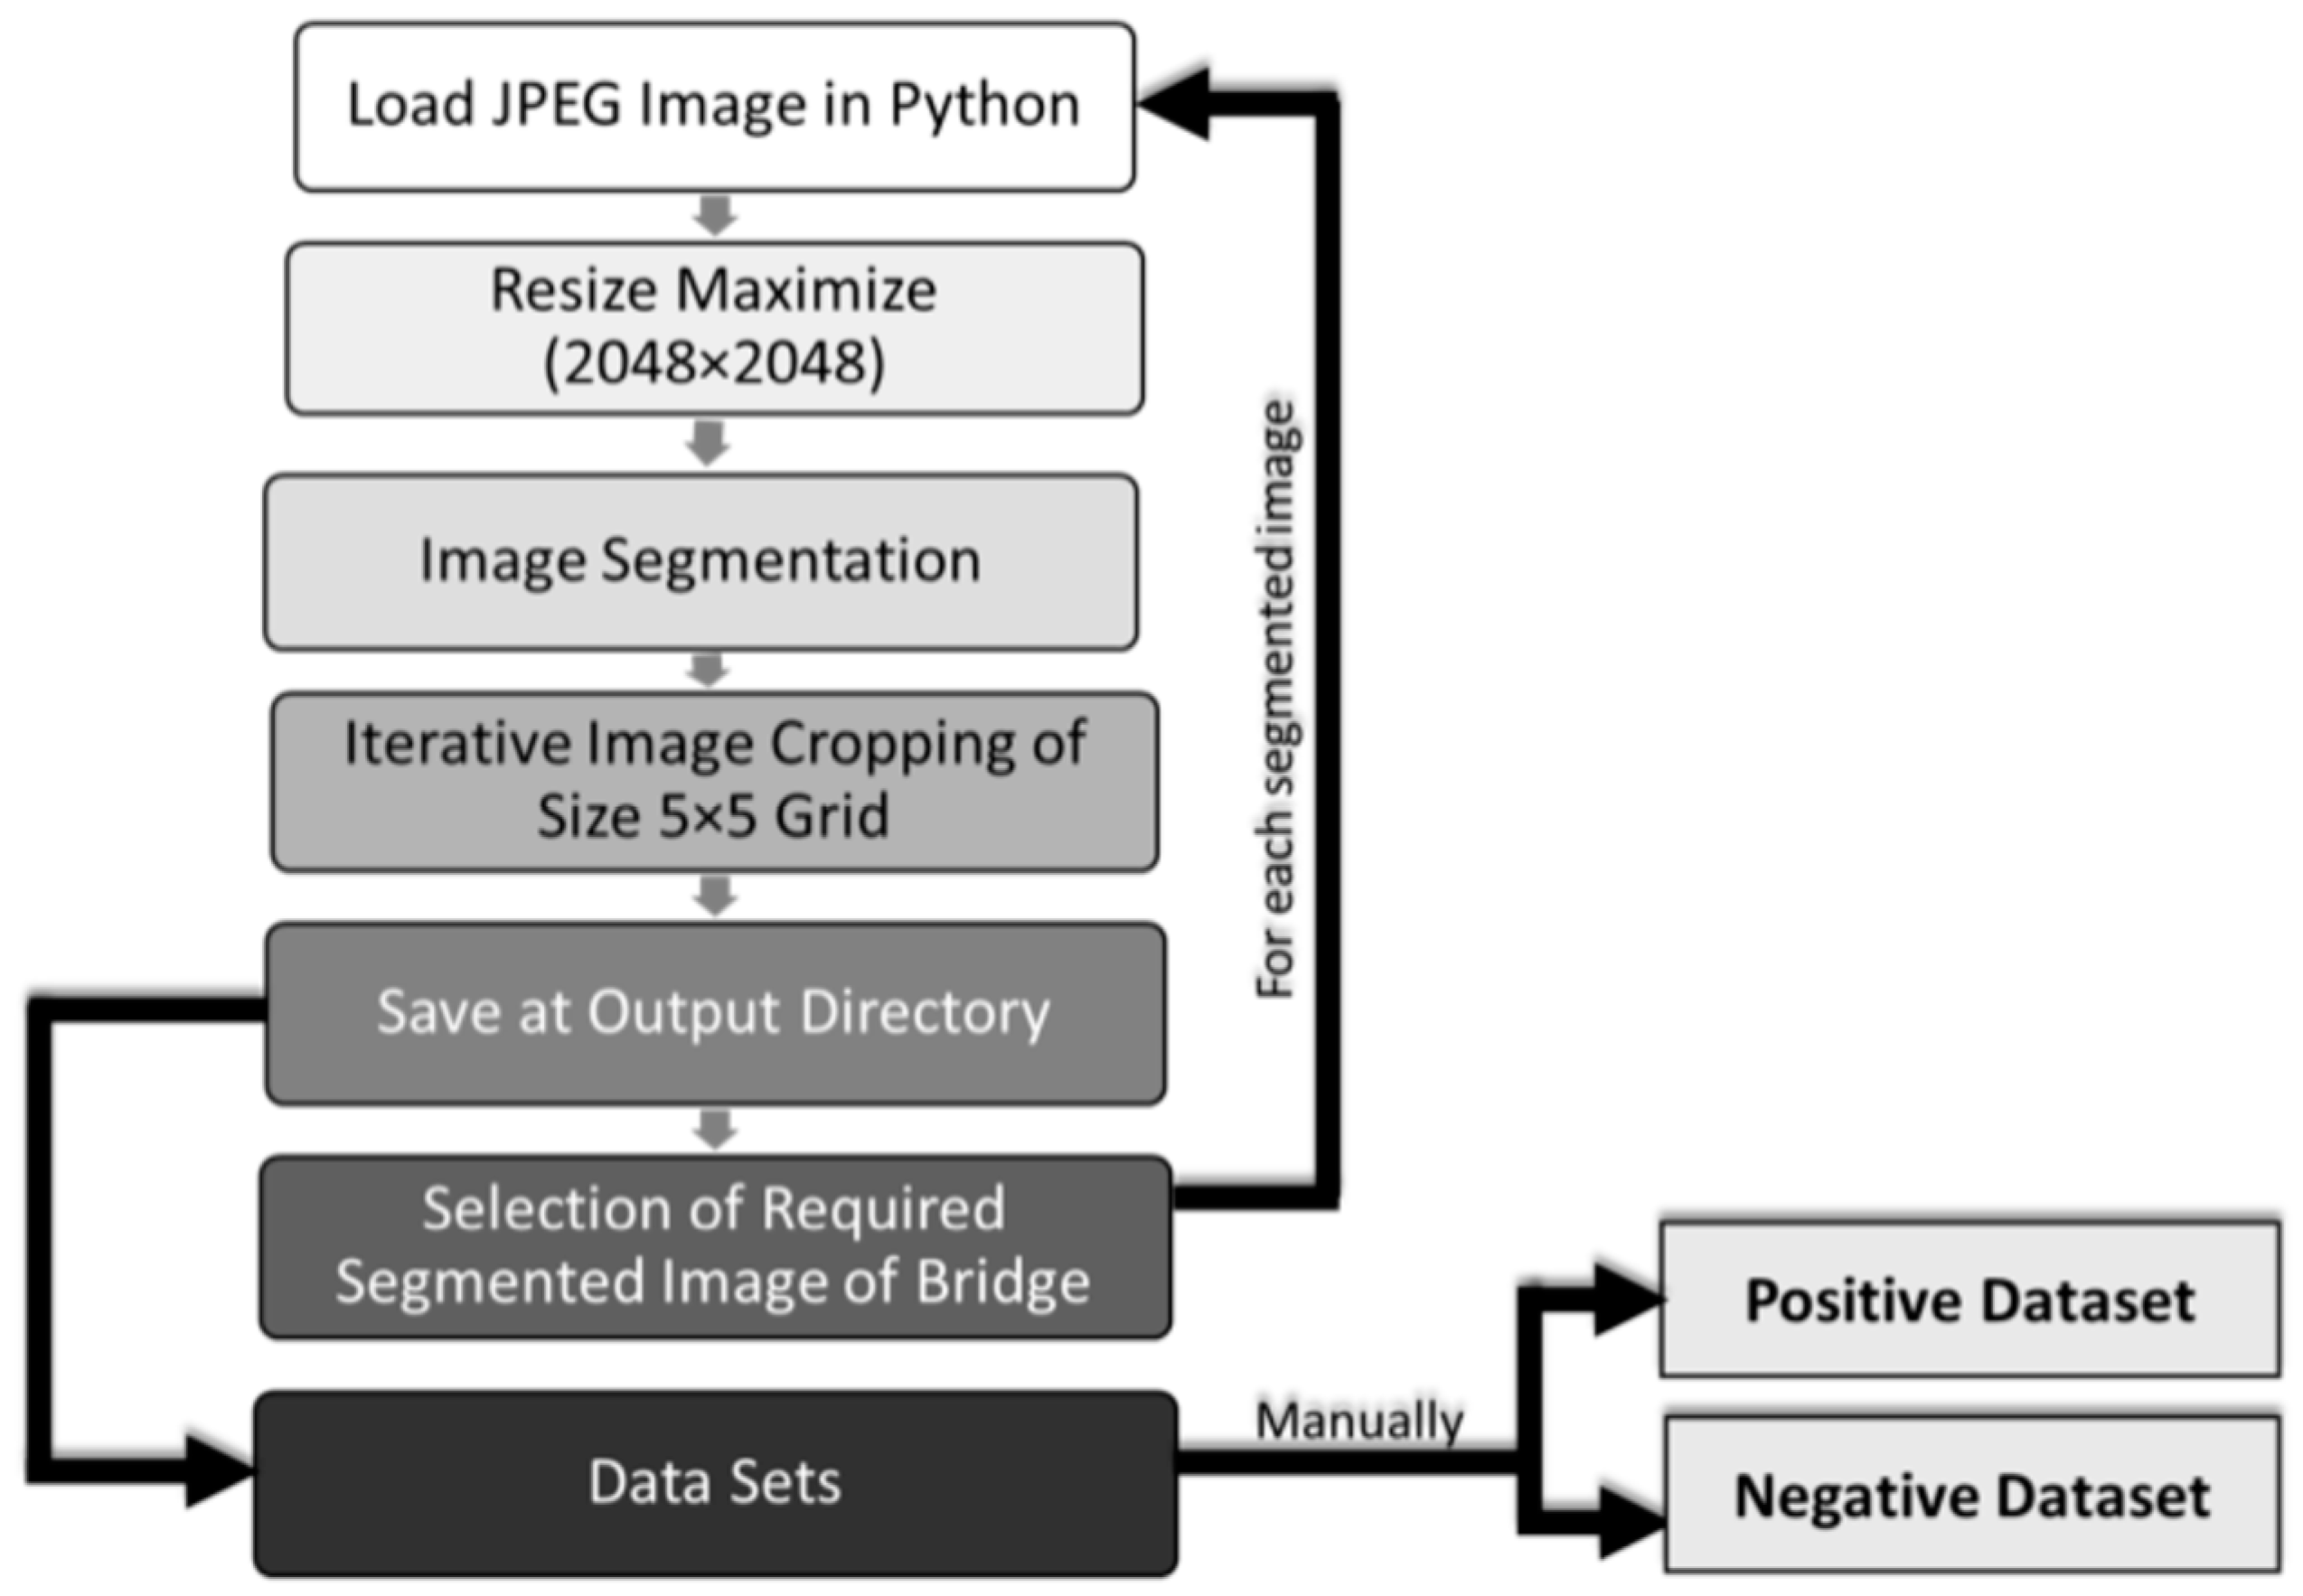
In the second step, images collected by UAS are processed. Frequently initially in .tiff file format, these images are then converted to .jpeg format, or they can be in .jpeg format initially, depending on the drone and sensor set being used. During this conversion, RGB channels are preserved while cropping the JPEG images to a specified size. Subsequently, the images are manually classified into two datasets: the positive dataset, which includes photos showing damage, and the negative dataset, which comprises images without damage. Careful attention is given to accurately distinguish between these two categories during this manual classification process. Steps for this conversion are shown in Figure 2.

3.3. Data Analysis

As the third step, the labeled images are analyzed using the CNN and ViT algorithms developed by the authors. These two algorithms are explained in the following sections.

3.3.1. Data Analysis Using CNN

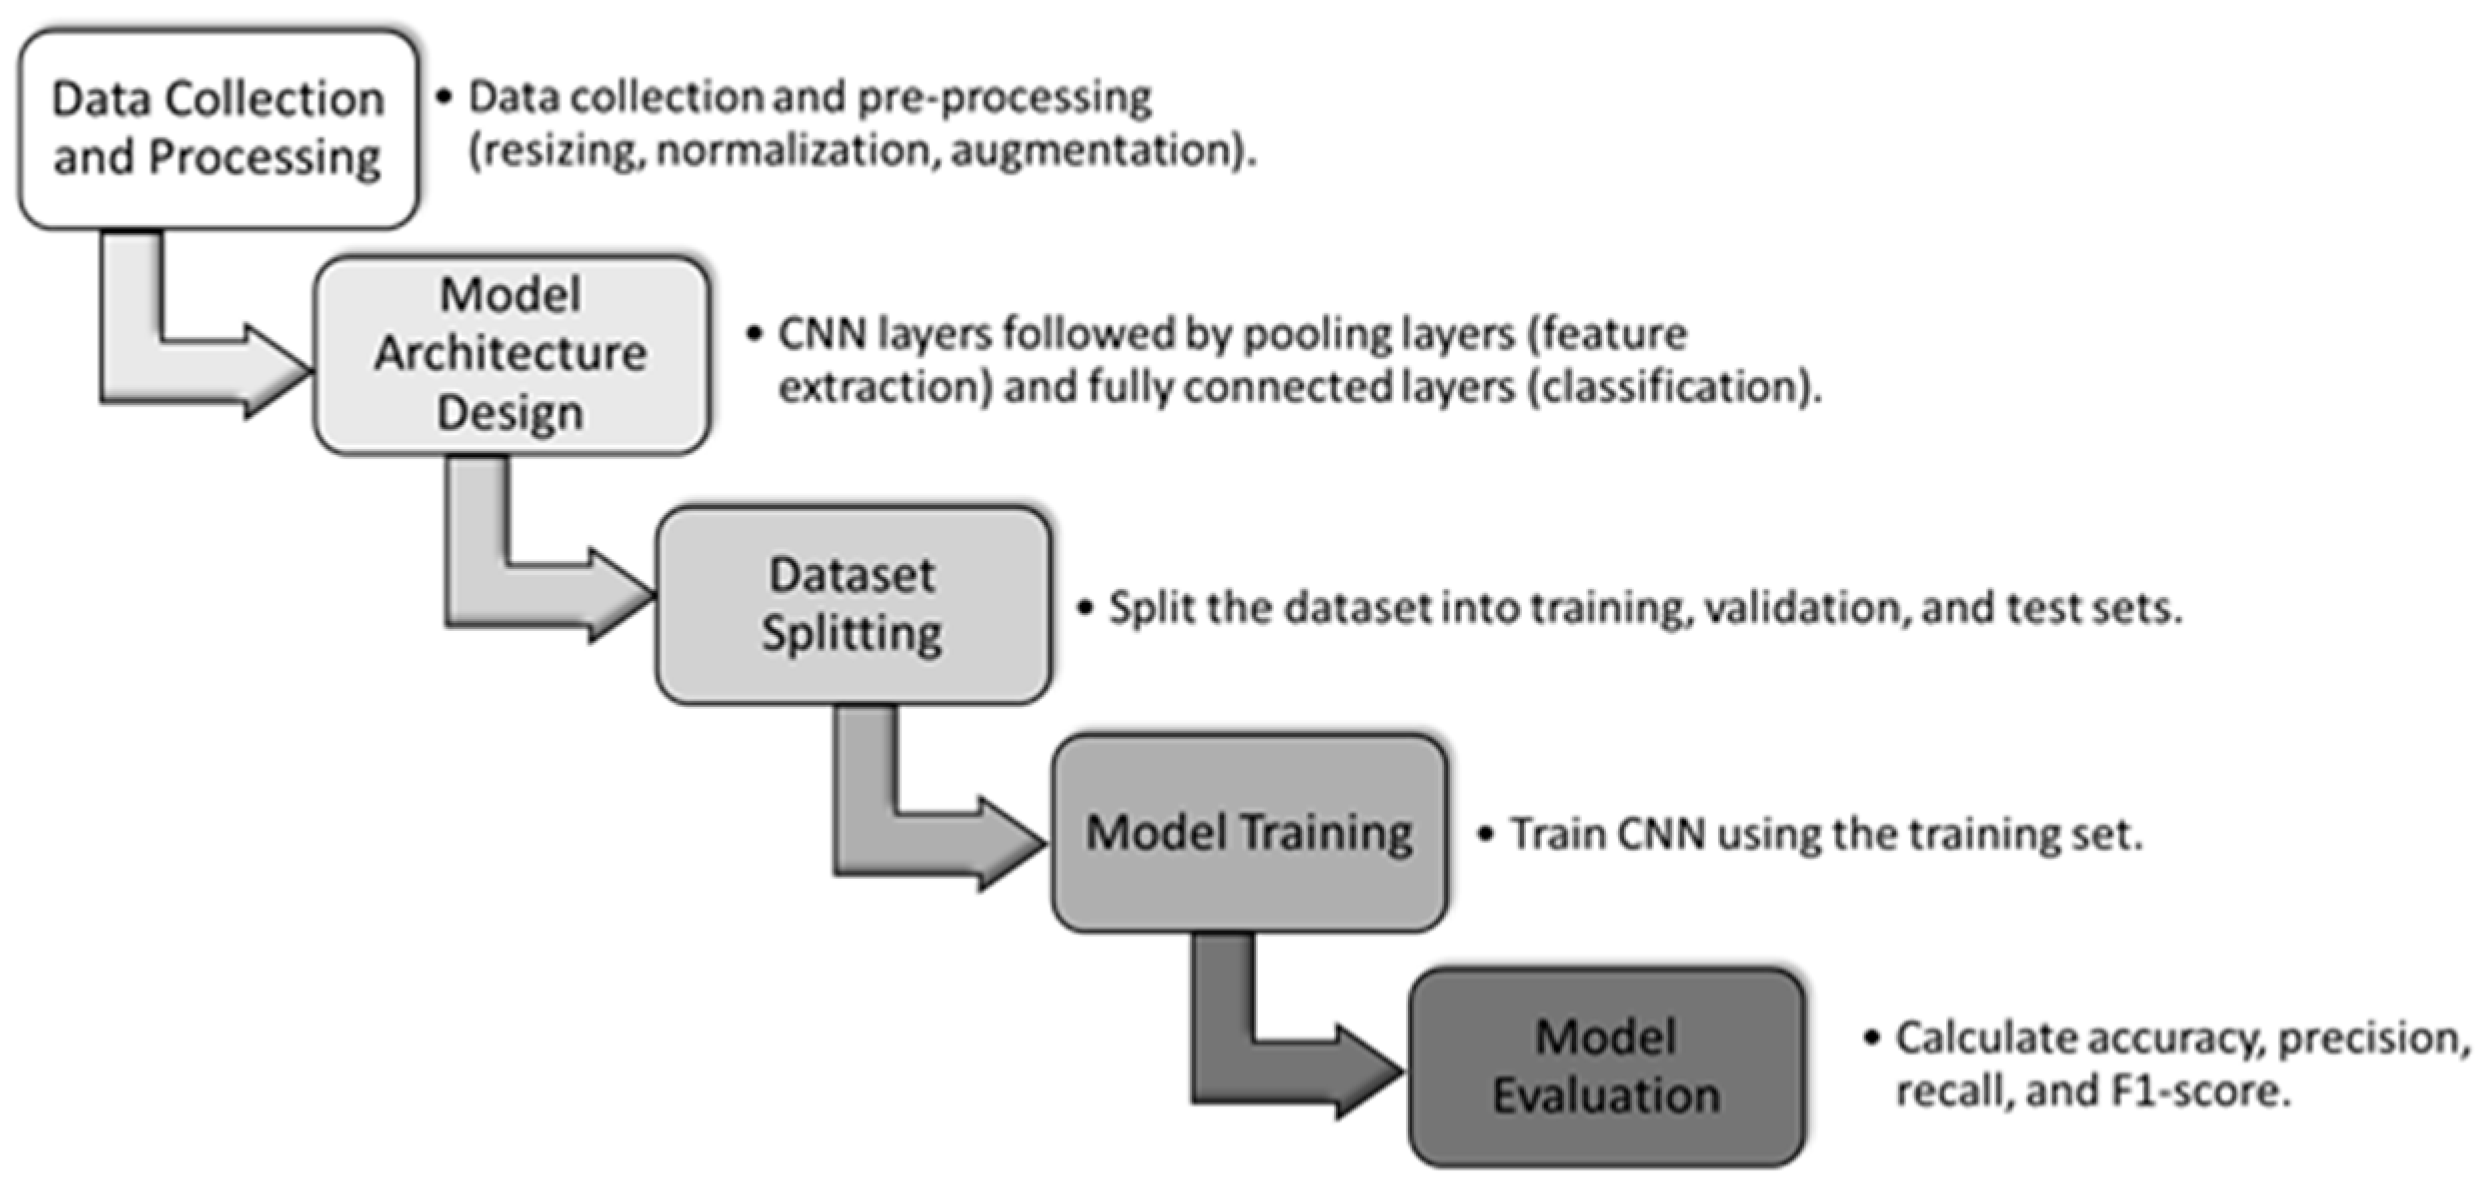
Figure 3 illustrates the methodology developed for data analysis using the CNN approach.
As explained at the beginning of the Methodology section, a data frame is created to represent the dataset, labeled as positive (damaged) or negative (undamaged) and stored in the file path. The data are then shuffled to ensure randomization and prevent bias in the dataset. For training the neural networks, all the datasets are rescaled by a factor of 1/255, normalizing the pixel values to the range of [0, 1]. The dataset is then split into 70% for training and 30% for evaluation purposes. Additionally, 20% of the training data are used for validation during the model training.
The model uses images of 120 × 120-pixel size with RGB color data. The CNN architecture is designed using TensorFlow’s Keras Interface, introducing different layers to extract features from the data. The first layer is the input layer, which takes the input data, followed by two convolutional layers with 16 and 32 filters respectively, each followed by a ReLU activation function. After these layers, max pooling is applied to down sample the spatial dimensions of the data, and global average pooling is used to reduce the output to a single value.
The model is compiled using binary cross-entropy as the loss function, accuracy as the performance metric, and Adam as the optimizer. The model is trained for 100 epochs, with an early stopping mechanism introduced if there is no change in the model accuracy for 15 consecutive epochs. Data such as accuracy and loss are recorded to evaluate the model’s efficiency and to establish a robust framework for the CNN model. The evaluation of the model is conducted based on the metrics described in Section 3.4 and its result is interpreted using the illustrative example.

3.3.2. Data Analysis Using ViT

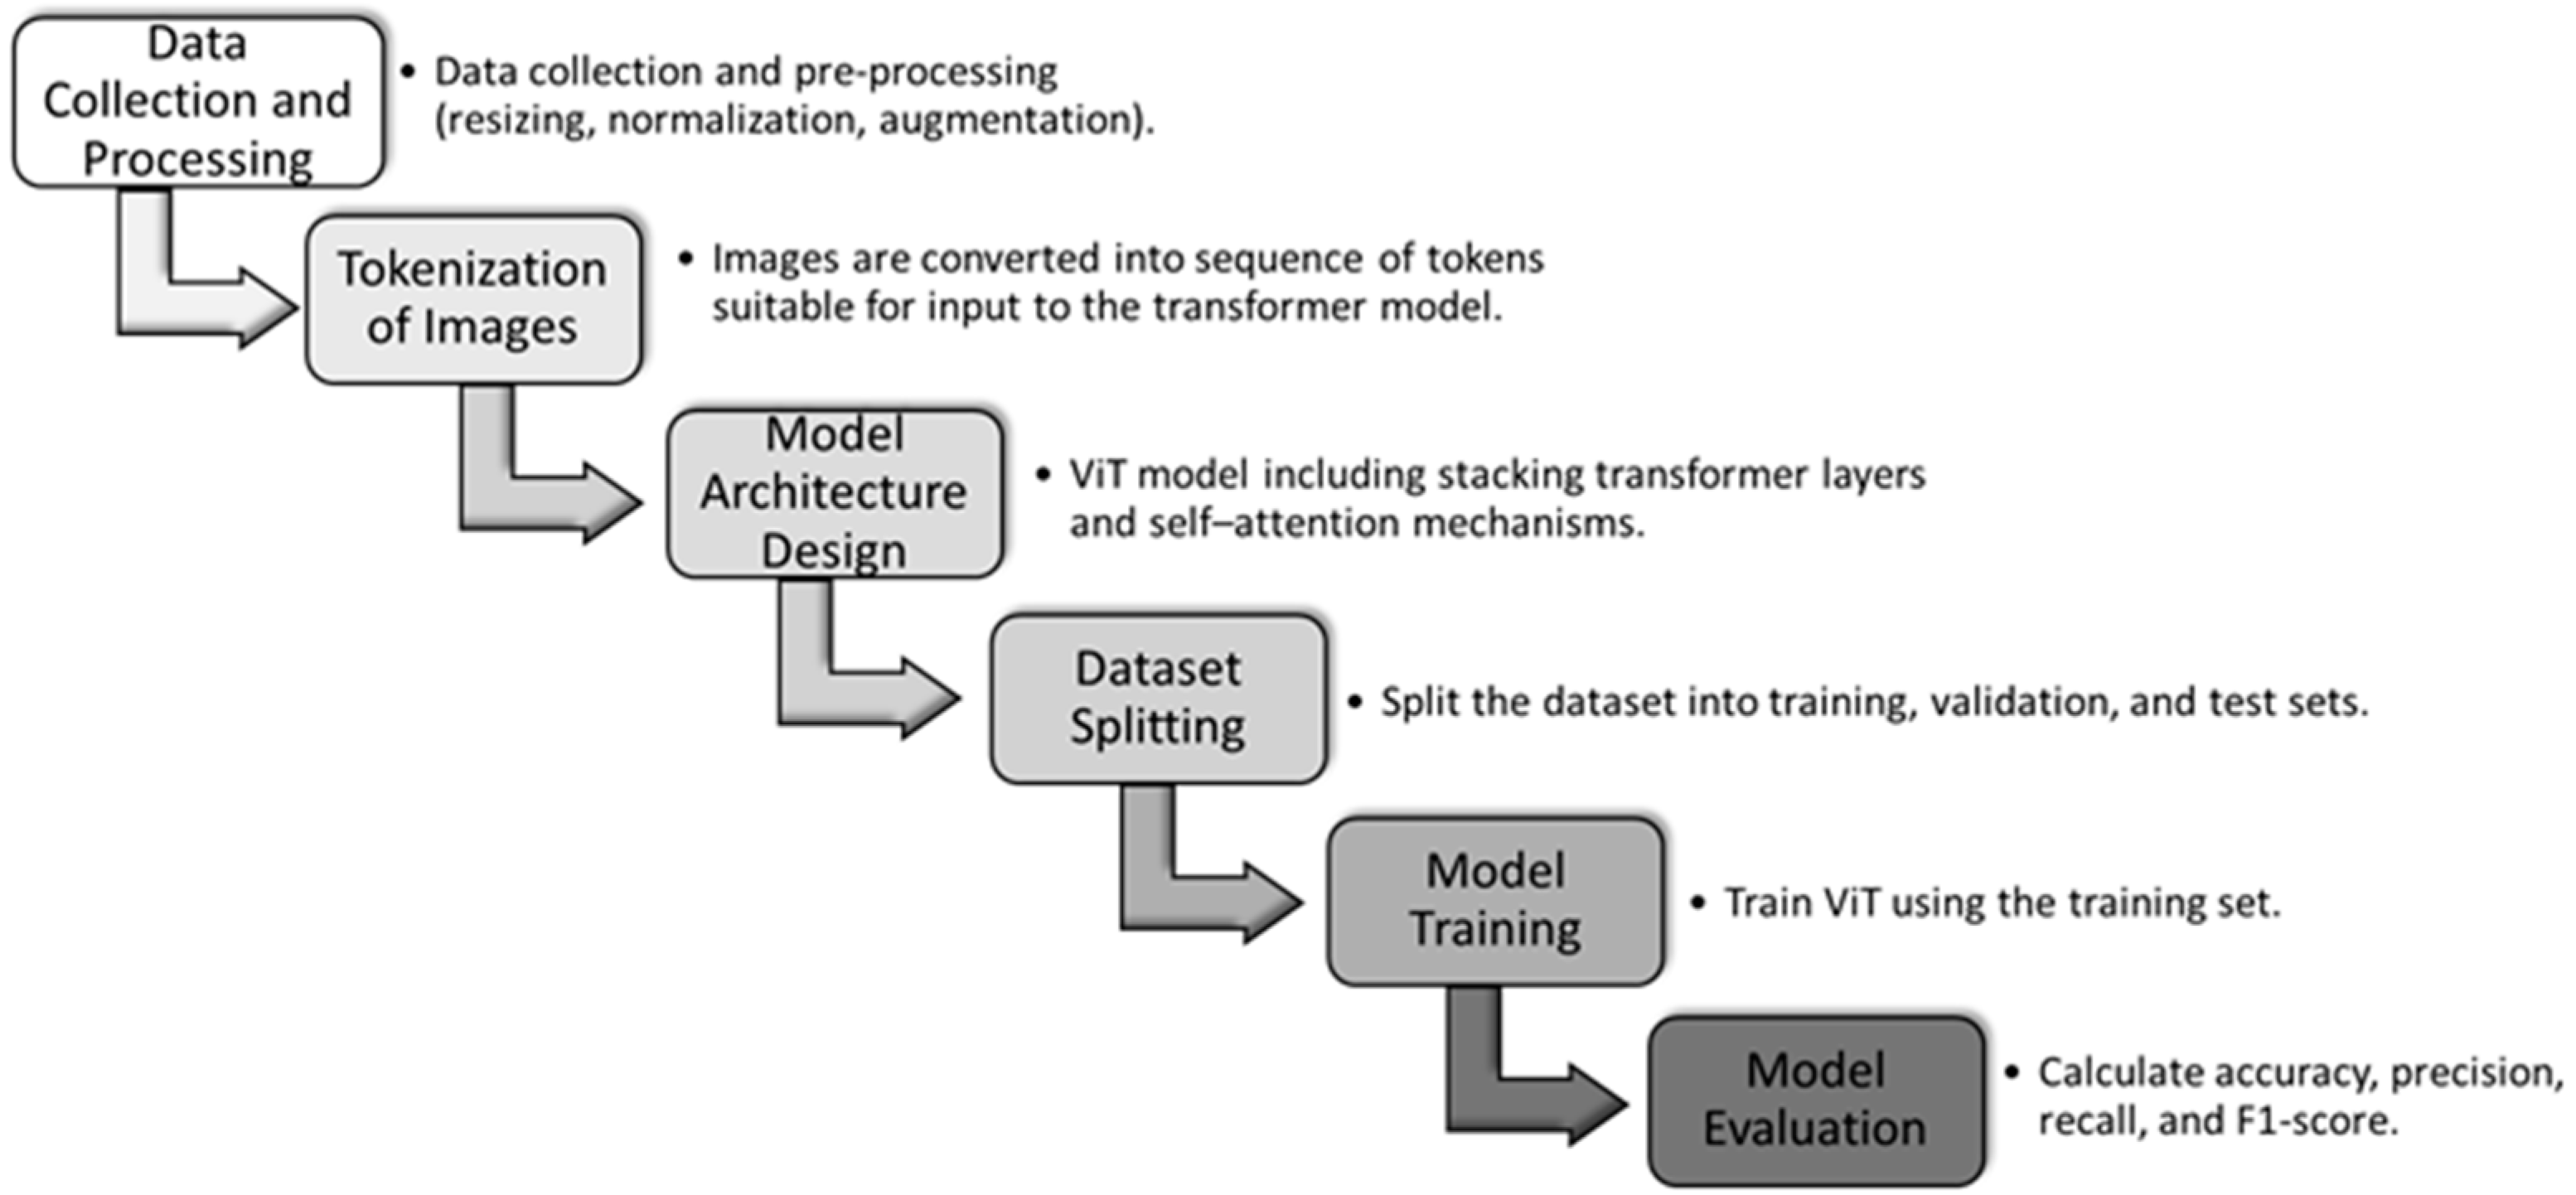
A ViT model is designed in addition to the CNN model. Figure 4 illustrates the model developed based on the ViT approach.
The data collection and initial processing are the same as mentioned in Section 3.1 and Section 3.2. A data frame is created to represent the dataset, which is then labeled and stored. The data are shuffled, rescaled, and normalized as mentioned in Section 3.3.1. The dataset is split into a 70–30 ratio for training and testing, with 20% of the data used for validation purposes.
Instead of using convolutional layers, the ViT model uses a transformer architecture, which was originally developed for natural language processing tasks. In the initial steps of the model architecture, the input images are divided into fixed-size patches. These patches are then flattened into vectors and subjected to a linear projection. Positional encodings are added to the patches to retain their positional information. Multiple transformer encoder layers are then applied to the ViT model.
A self-attention mechanism is employed in the model to capture dependencies between patches, regardless of their original positions in the images. Each attention head is a position-wise forward neural network, typically composed of two fully connected layers separated by a ReLU activation. To assist in training deeper models, residual connections are used after the normalization layer. A classification token is prepended to the sequence of patch embeddings to obtain the output, and this output from the final transformer encoder layer is used for classification tasks.
The pretrained model from Hugging Face is fine-tuned to meet the specific requirements of this study [35]. The model is trained for 100 epochs, with all accuracy and loss metrics recorded for evaluation. Finally, the model is evaluated using the same methods mentioned in Section 3.3.1.

3.4. Model Evaluation and Results

The final step in the methodology is model evaluation, which assesses how well the trained model performs on a particular dataset. Test accuracy and loss are computed for this purpose. It also allows the model to function with the test data, generating comprehensive classification reports and confusion maps as well as model predictions. The confusion matrix is transformed into a heatmap that makes it evident where the model hits and misses the target. Ultimately, it is a comprehensive guide for training, tracking the model’s development, and assessing how well it performs in the specific region of image surface damage identification. Some of the metrics used during the evaluation of the model are described in the following section.

3.4.1. Training Loss

Training loss comcpares outputs predicted by the model to the known labels for training data. It is often measured by a loss such as cross-entropy for a classification problem or mean square error for regression.
Training   loss = 1 / N i = 1 N L o s s
where N = number of samples in the training set.

3.4.2. Model Accuracy

When a trained model is assessed on a different test dataset, its overall performance is known as model accuracy. It is derived as below:
Model   accuracy = N u m b e r   o f   c o r r e c t   P r e d i c t i o n s T o t a l   n u m b e r   o f   p r e d i c t i o n s × 100 %

3.4.3. Validation Loss

Validation loss is the loss of the model on the validation dataset, a separate set of samples that are never used as training samples but rather used to test the model’s generalization abilities. It is computed with the same loss function used for the training loss.
Training   loss = 1 / M j = 1 M L o s s
where M = number of samples in the validation set.

3.4.4. Validation Accuracy

In the validation dataset, validation accuracy is the percentage of properly predicted instances. Ground truth data for delamination locations were available from a bridge inspection process including hammer sounding, chain dragging, and marking of likely delamination areas performed for the study described in [36]. Spalling was detected through visual interpretation and field visits to the bridge. Validation accuracy is derived as follows:
Validation   Accuracy = N u m b e r   o f   c o r r e c t   P r e d i c t i o n s T o t a l   N u m b e r   o f   P r e d i c t i o n s × 100 %

3.4.5. Epoch

A single training session that goes through the complete training dataset is referred to as an epoch. The model minimizes the training loss in each epoch by iteratively updating its parameters depending on the training data.

3.4.6. Precision

The precision of the model is defined as the ratio of true-positive (TP) predictions to all positive predictions (i.e., both true-positive and false-positive (FP) predictions). It is derived as
Precision = T P T P + F P

3.4.7. Recall

Recall is a statistical measure that quantifies the percentage of actual positive predictions in the dataset that correspond to true-positive forecasts. It is calculated by dividing the true-positive predictions by the total of false-negative (FN) and true-positive predictions.
Recall = T P T P + F N

3.4.8. F1 Score

The harmonic mean of recall and precision yields the F1 score, which strikes a balance between the two metrices. It ranges from 0 to 1 and higher values indicate better performance.
F 1   Score = 2 × P r e c i s i o n × R e c a l l P r e c i s i o n + R e c a l l

3.4.9. Macro Avg

The macro average determines the mean of a performance metric (such as recall, precision, or F1 score) for every class, ignoring any imbalance in the distribution of classes.
Macro   Avg = i = 1 C L o s s   M e t r i c / ( N u m b e r   o f   C l a s s e s C )

3.4.10. Weighted Avg

The weighted average weights each class’s contribution according to its percentage in the dataset, considering any class imbalance while calculating the average of the performance indicator.
Weighted   Avg = i = 1 C M e t r i c i × C l a s s ( i ) T o t a l   I n s t a n c e s   i n   t h e   d a t a s e t

3.4.11. Confusion Matrix

The confusion matrix is a table used to summarize the performance of a classification model. It describes the extent to which actual and predicted class labels match or do not match. The rows of the confusion matrix correspond to the “actual” class labels, while the columns correspond to the “predicted” class labels. Each cell of the matrix represents the count (or proportion) of data that fall into the actual predicted class label combinations. It consists of four main components:
True positive (TP): It is the number of cases in the positive class that the model properly predicts to be positive.
False positive (FP): It is the number of cases in the negative class that model incorrectly predicts to be positive.
True negative (TN): It is the number of cases in the negative class that the model properly predicts to be negative.
False negative (FN): It is the number of cases in the positive class that model incorrectly predicts to be negative.

4. Illustrative Experiment
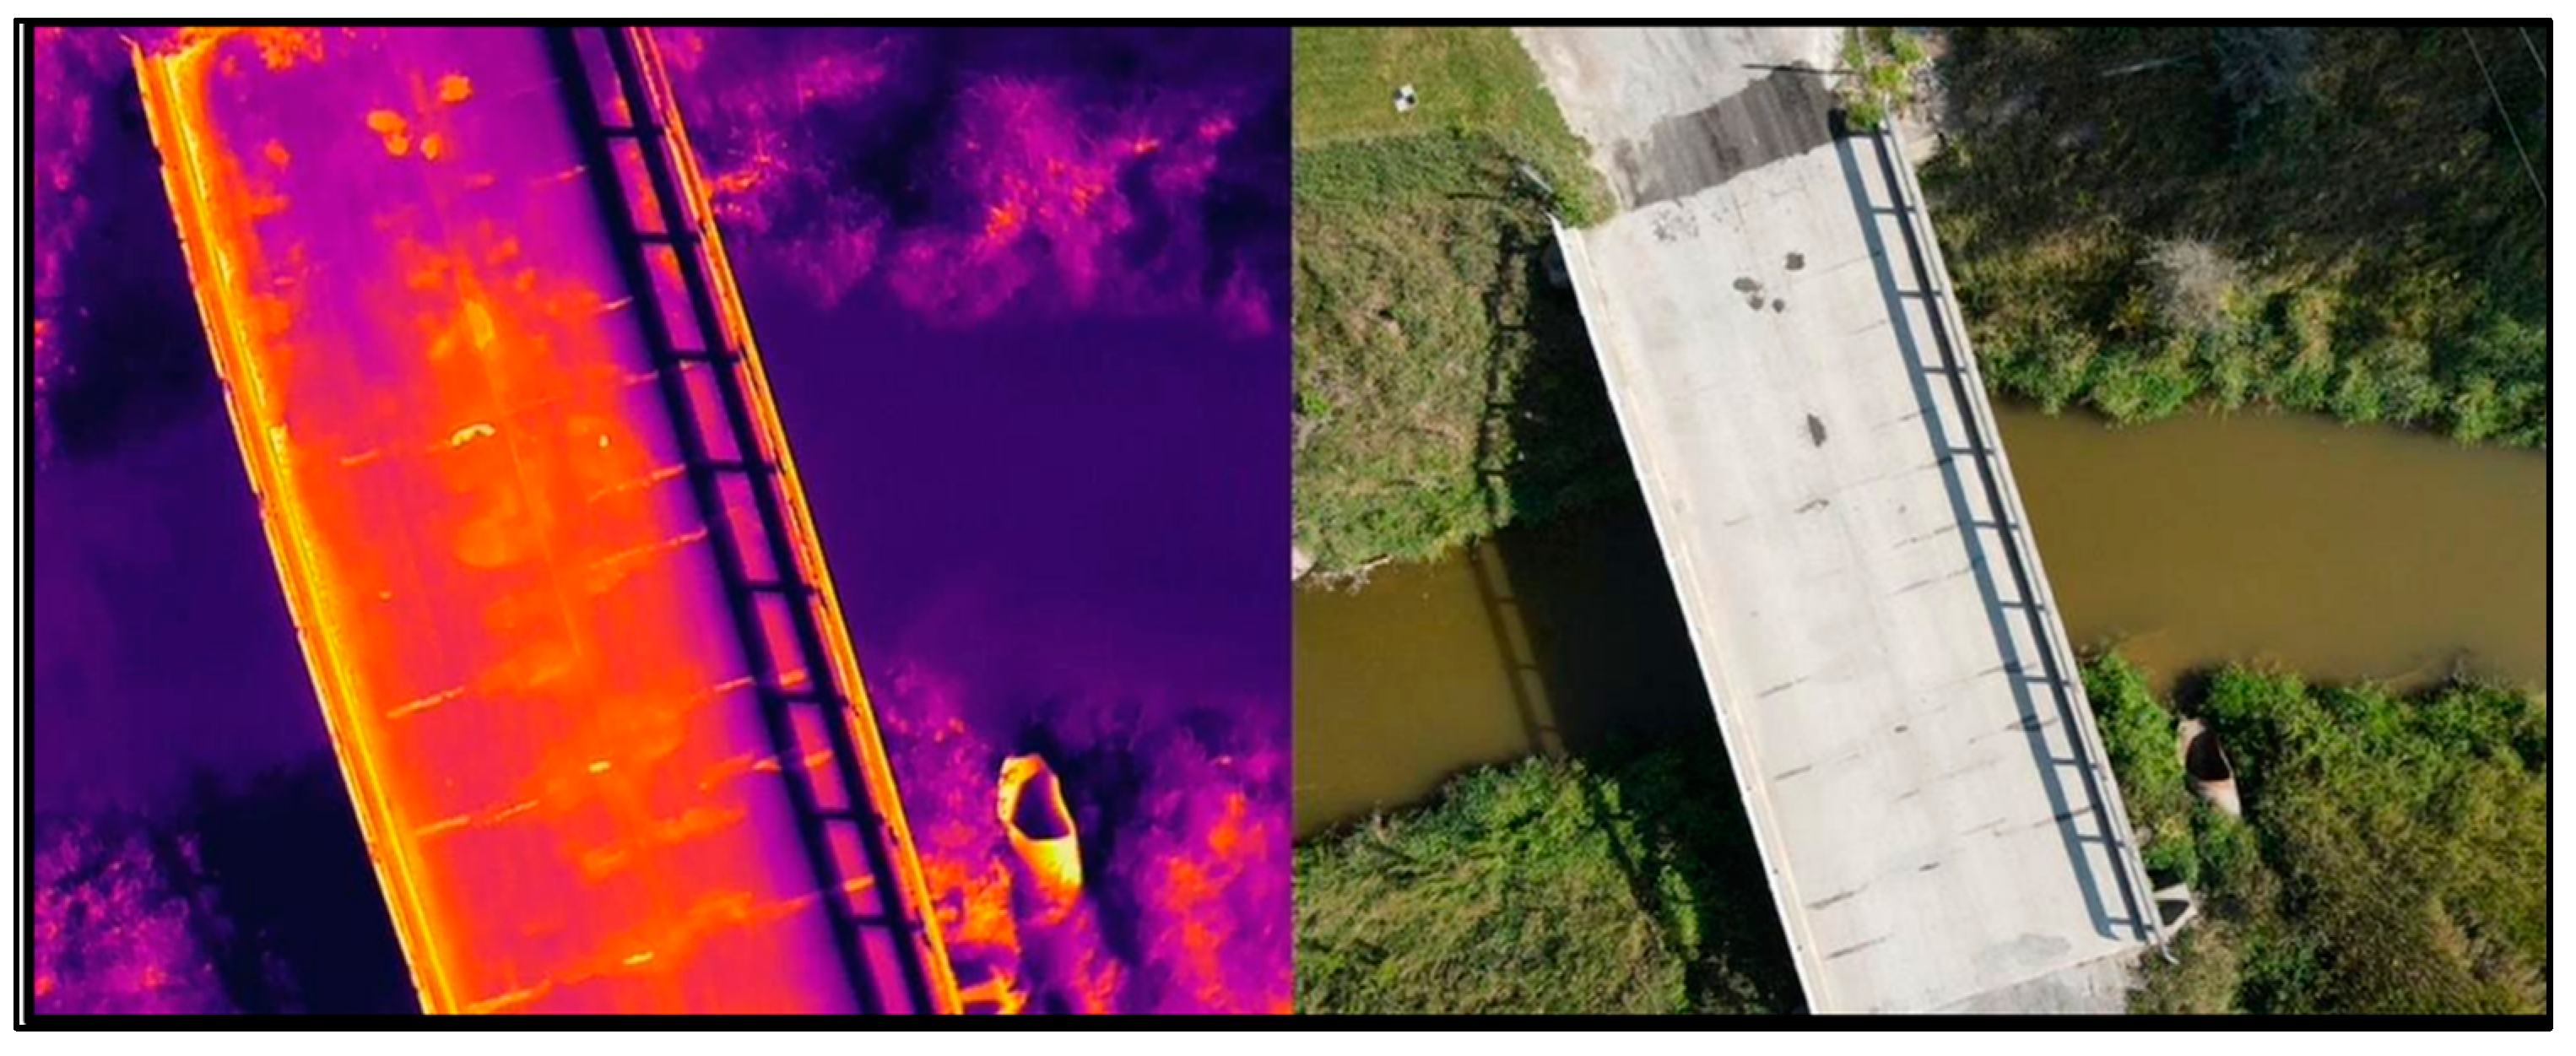
To illustrate the proposed methodology, a Michigan Department of Transportation (MDOT) bridge case is studied. UAS data on this bridge were collected by the Michigan Tech Research Institute (MTRI) over the Beyer Road bridge near Saginaw, Michigan. The Beyer Road bridge over Cheboyganing Creek measures 67 ft long by 26 ft wide with a concrete surface deck. During the initial inspection in 2016, the bridge deck was rated as having a surface condition of “5” (“fair”) due to four large spalls and one delaminated area. On 30 December 2016, RGB and thermal imagery were captured at this location using the Nikon D810 and DJI Phantom 3A coupled sensors. MTRI provided ground control points with 10 cm positional accuracy for georeferencing outputs. After the initial investigation and data collection in 2016, the bridge did not receive significant maintenance before another UAS-enabled deck assessment in August 2021. Thus, in August 2021, the site was revisited to determine whether there had been any changes in delamination and thermal and optical images were acquired by MTRI [37]. Figure 5 illustrates the data collected from this bridge, in two formats of thermal image (on left) and optical image (on right).
Figure 5. Beyer Road Bridge, near Saginaw, Mi, showing thermal data (left) and optical data (right) (image courtesy: MTRI [37]).
Eng 05 00103 g005

4.1. Data Collection

The different tools that were used during the data collection include (a) Nikon D810, (b) DJI Phantom 3A, (c) DJI M2EA, (d) Bergen Quad-8, and (e) SSI survey GPS. Each of these tools plays a crucial role in capturing comprehensive data for the bridge inspection, described in the following section.

4.1.1. Nikon D810

The Nikon D810 is a digital single-lens reflex (DSLR) camera equipped with a 36.3-megapixel sensor. This camera can continuously capture photos at a maximum rate of two frames per second. It features photo geotagging capabilities through an Aokatec AK-G1 GPS unit attached to the camera. For typical pavement bridge inspections, a 50 mm prime lens is commonly used. The images are captured at an altitude of 30 m (100 feet), resulting in a ground sample distance (GSD) of 3 mm, meaning that each pixel in the image represents a 3 mm square area on the ground. Figure 6 illustrates this camera, mounted on a Bergen Quad-8 UAS.
Figure 6. Nikon D810 mounted on Bergen Quad-8 (image courtesy: MTRI) [37].
Eng 05 00103 g006

4.1.2. DJI Phantom 3A

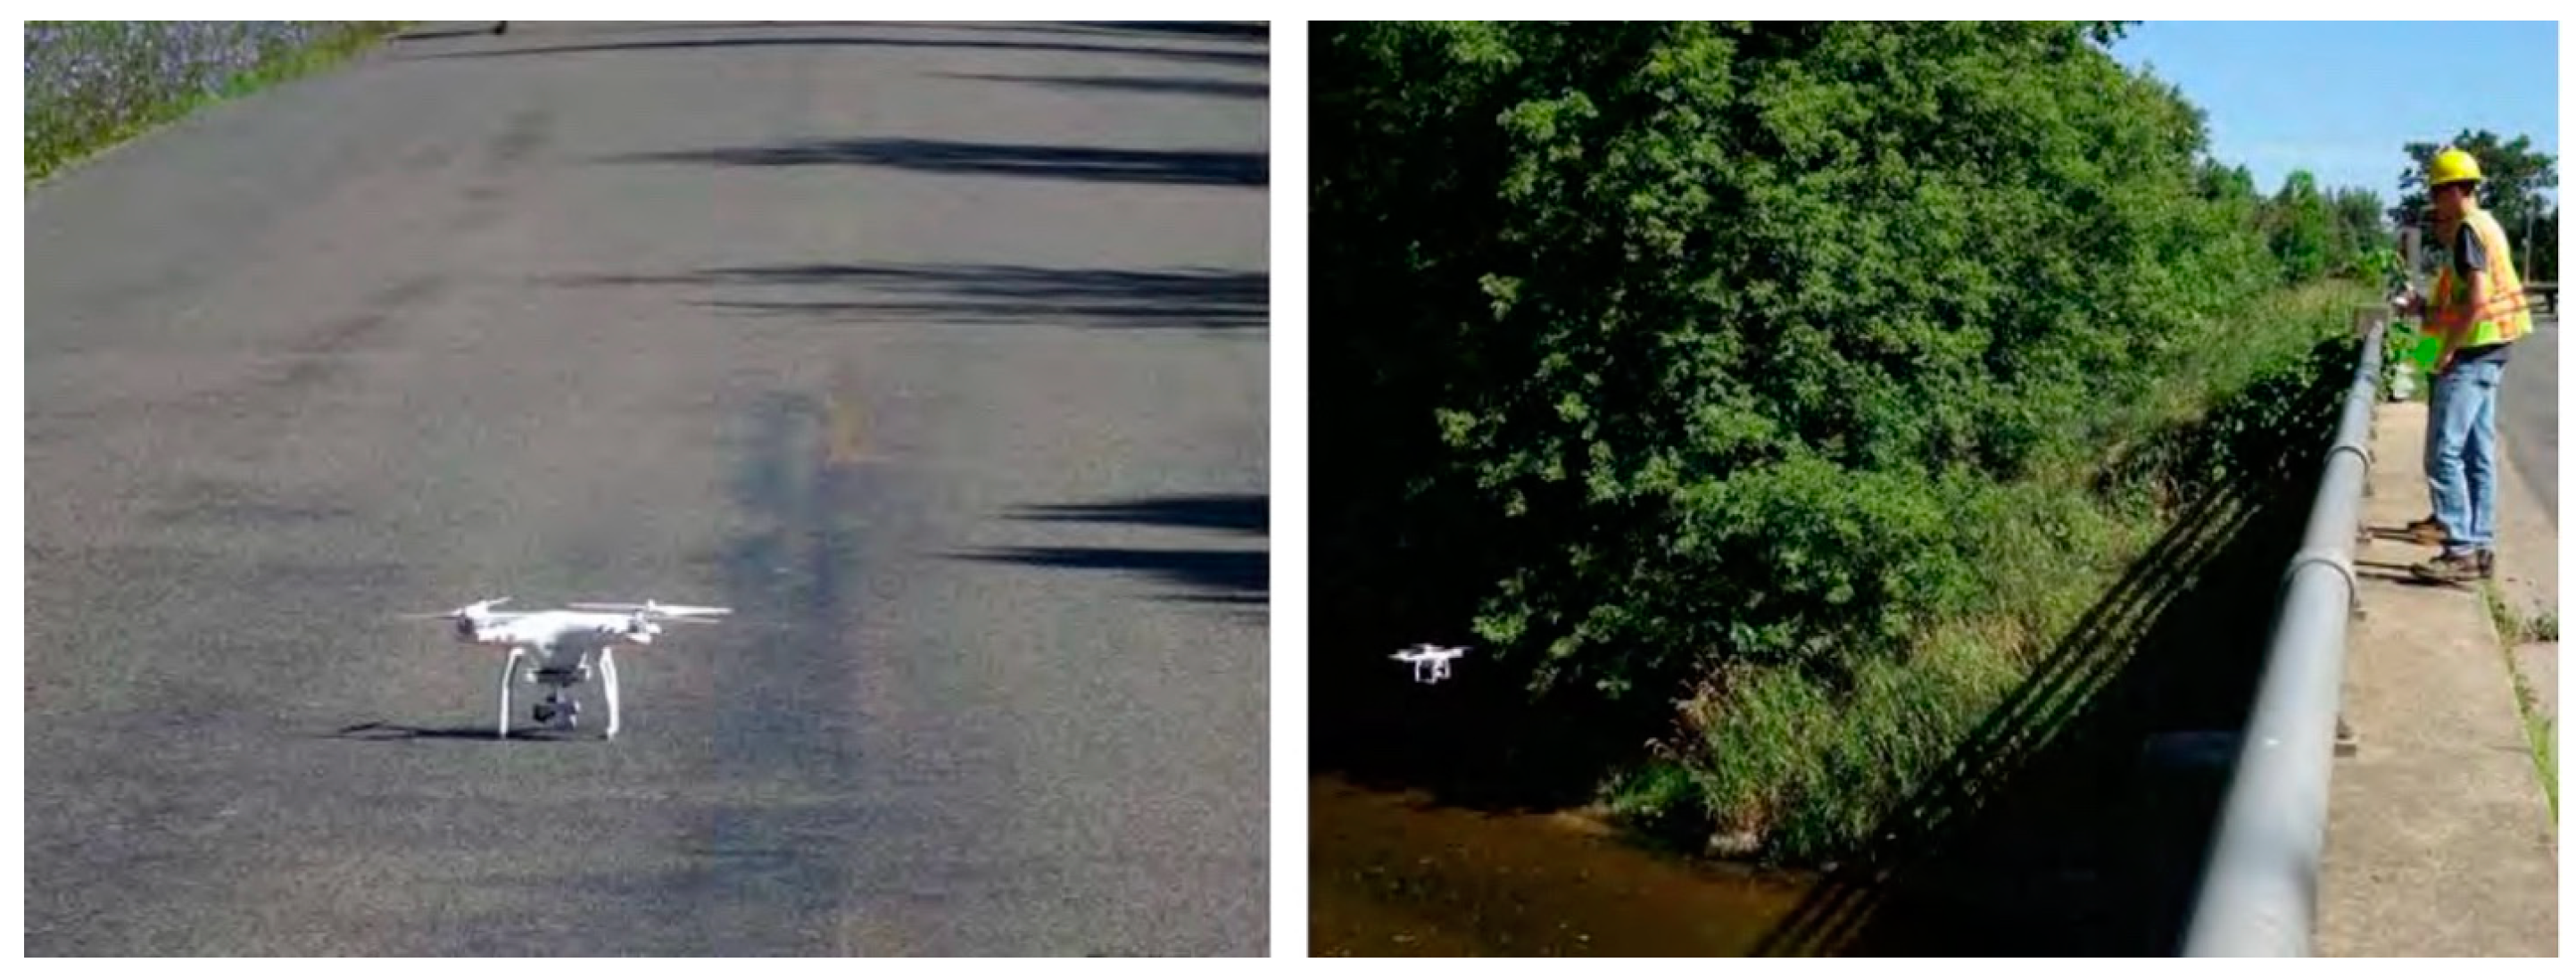
The DJI Phantom 3A is a quadcopter equipped with a 12.4-megapixel camera capable of recording 2.7 K resolution videos at 30 frames per second (Figure 7). It can reach a top speed of 35 mph and has a flight duration of up to 23 min. The drone features three-axis gimbals for camera stabilization, providing high-resolution first-person-view (FPV) video. With a 94-degree field of view, the camera offers a wide range of angles. When flying at an altitude of 15 m (50 feet), the drone achieves a ground sample distance (GSD) of 10 mm (2/5 inch), covering approximately 115 square feet per frame. At the maximum flight height of 122 m (400 feet) allowed by the FAA, it achieves a GSD of about 66 mm (2.6 inches), capturing around 850 square feet per frame.
Figure 7. DJI Phantom 3A on the bridge deck (left) and inspecting the side of the bridge (right) (image courtesy: MTRI) [37].
Eng 05 00103 g007

4.1.3. DJI M2EA

The DJI M2EA is a portable quadcopter equipped with a 12.35-megapixel camera capable of recording 4K video and a radiometric FLIR camera with 640 × 512-pixel resolution; the data in Figure 5 were collected with this system. It has a top speed of 64 km/hr (40 mph) and a flight duration of 27 min. The drone features a collision avoidance system that prevents collisions from both forward and downward directions. It provides high-resolution FPV footage and is stabilized by a 3-axis gimbal. The camera has a 78.8-degree field of view. When flying at an altitude of 15 m (50 feet), the drone achieves a ground sample distance (GSD) of 6 mm (1/4 inch), covering approximately 650 square feet per frame. At the maximum flight height of 122 m (400 feet) allowed by the FAA, it achieves a GSD of about 50 mm (2 inches), capturing around 60 square meter (650 square feet) per frame. This quadcopter is shown in Figure 8 in three modes of folded (left), ready-to-fly (center) and flying (right).
Figure 8. DJI in folded mode (left), ready-to-fly mode (center), and flying mode (right) (image courtesy: MTRI) [37].
Eng 05 00103 g008

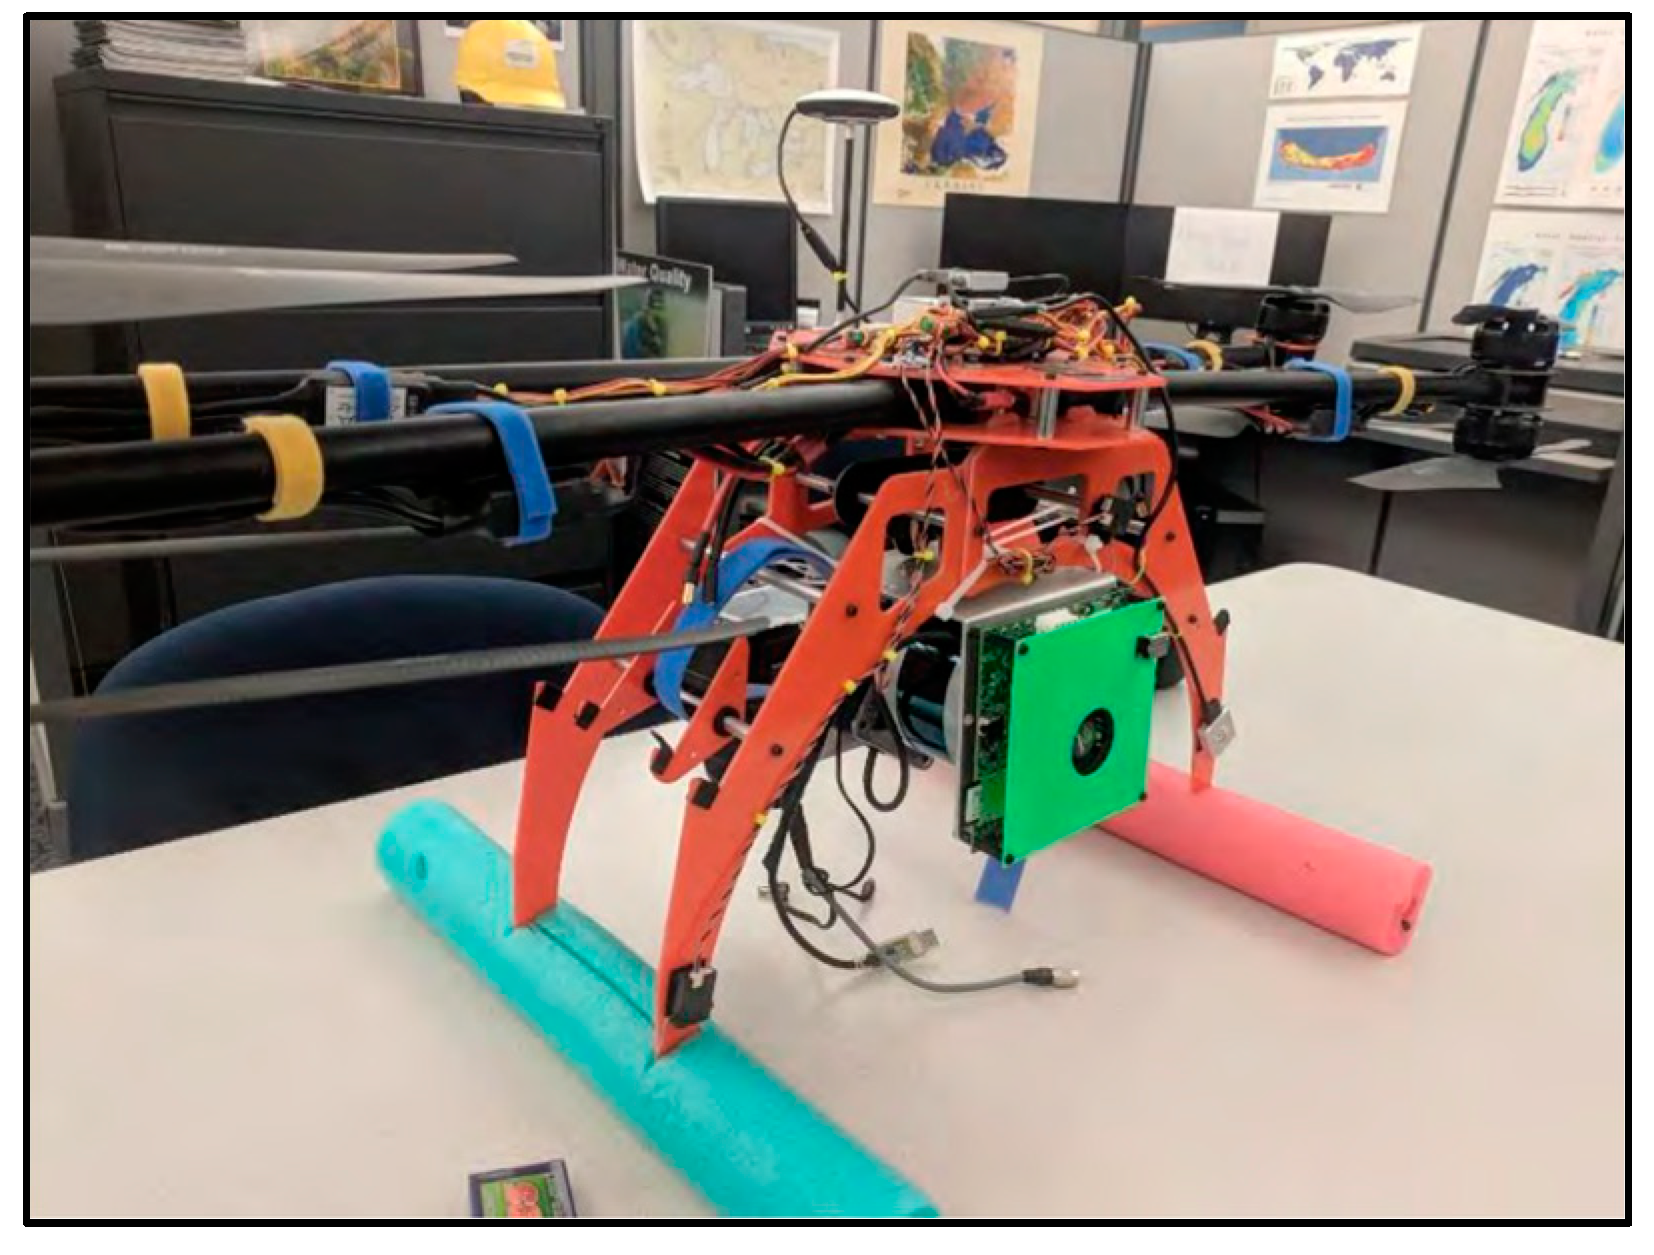
4.1.4. Bergen Quad-8

Bergen RC produces the quadcopter, the Bergen Quad-8 (Figure 9), which has a flight time of 20 min, allowing for data collection while maintaining a 25% battery reserve. This versatile drone can mount various sensors, such as the FLIR VUE Pro and Nikon D810, with a payload capacity of up to 4.5 kg (10 pounds) for comprehensive data collection.
Figure 9. Bergen Quad-8 (image courtesy: MTRI) [37].
Eng 05 00103 g009

4.1.5. Ground Control Points with GPS

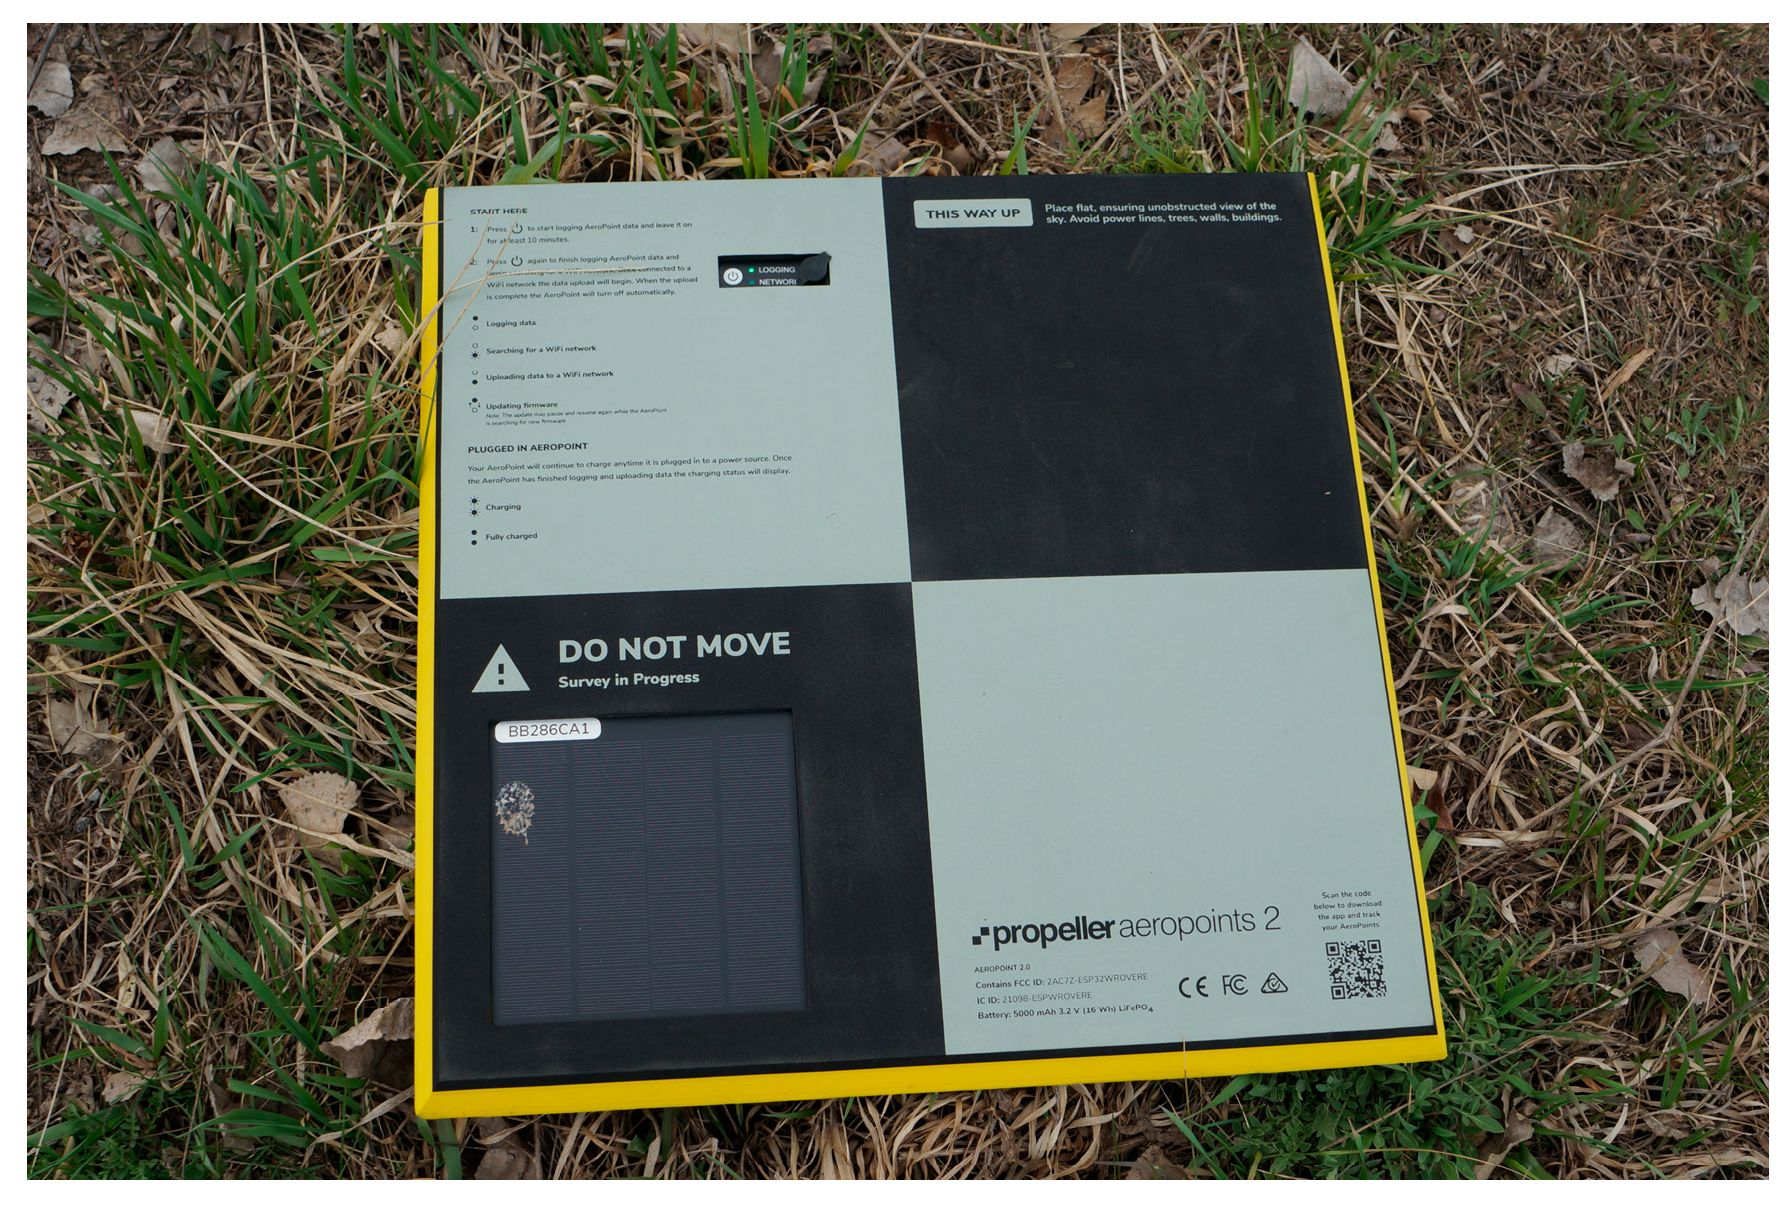
The locations of ground control points required to improve the positional accuracy of the UAS imagery were provided by MTRI. Each bridge had a different number of calibration points, with at least four being typical. The positioning methods deployed in 2016 used cloth ground control targets, with the center location recorded with a decimeter-accuracy Trimble GeoXH GPS unit, with post-processing kinematic (PPK) data. The positions obtained from this method had an accuracy within 10 cm horizontally and 20 cm feet vertically, meeting the team’s normal accuracy requirements for close-range photogrammetry drone data collections. In 2021, the MTRI team deployed Propeller Aeropoints (Figure 10) which have built-in GPS with a PPK workflow, which enabled an accuracy of 3 cm horizontally and 6 cm vertically.

4.2. Data Processing

In the second step, the images collected by the UAS were processed. The following figures provide an overview of the sample dataset. As shown in Figure 11 and Figure 12, the dataset was prepared for testing, training, and evaluating the two models, CNN and ViT, for damage detection. The negative dataset consisted of 585 images, while the positive dataset comprised 251 images. These images were manually classified to train the model effectively.
Figure 11. Positive dataset (damaged).
Eng 05 00103 g011
Figure 12. Negative dataset (undamaged).
Eng 05 00103 g012

4.3. Data Analysis

As the third step, for data analysis, CNN and ViT model algorithms were developed. The developed models were evaluated using the different functions mentioned in Section 3.3, and the results were interpreted in the subsequent step. To provide a comprehensive overview of our methodology, two distinct models were developed, each with its unique approach to data analysis. The CNN model leveraged convolutional layers to extract hierarchical features from the images, while the ViT model utilized a transformer architecture to capture long-range dependencies within the image patches. Both models were trained and validated using the same dataset, ensuring a fair comparison of their performance.

4.4. Model Evaluation and Results

Model evaluation is described for each tool as follows.

4.4.1. CNN Model Evaluation and Results

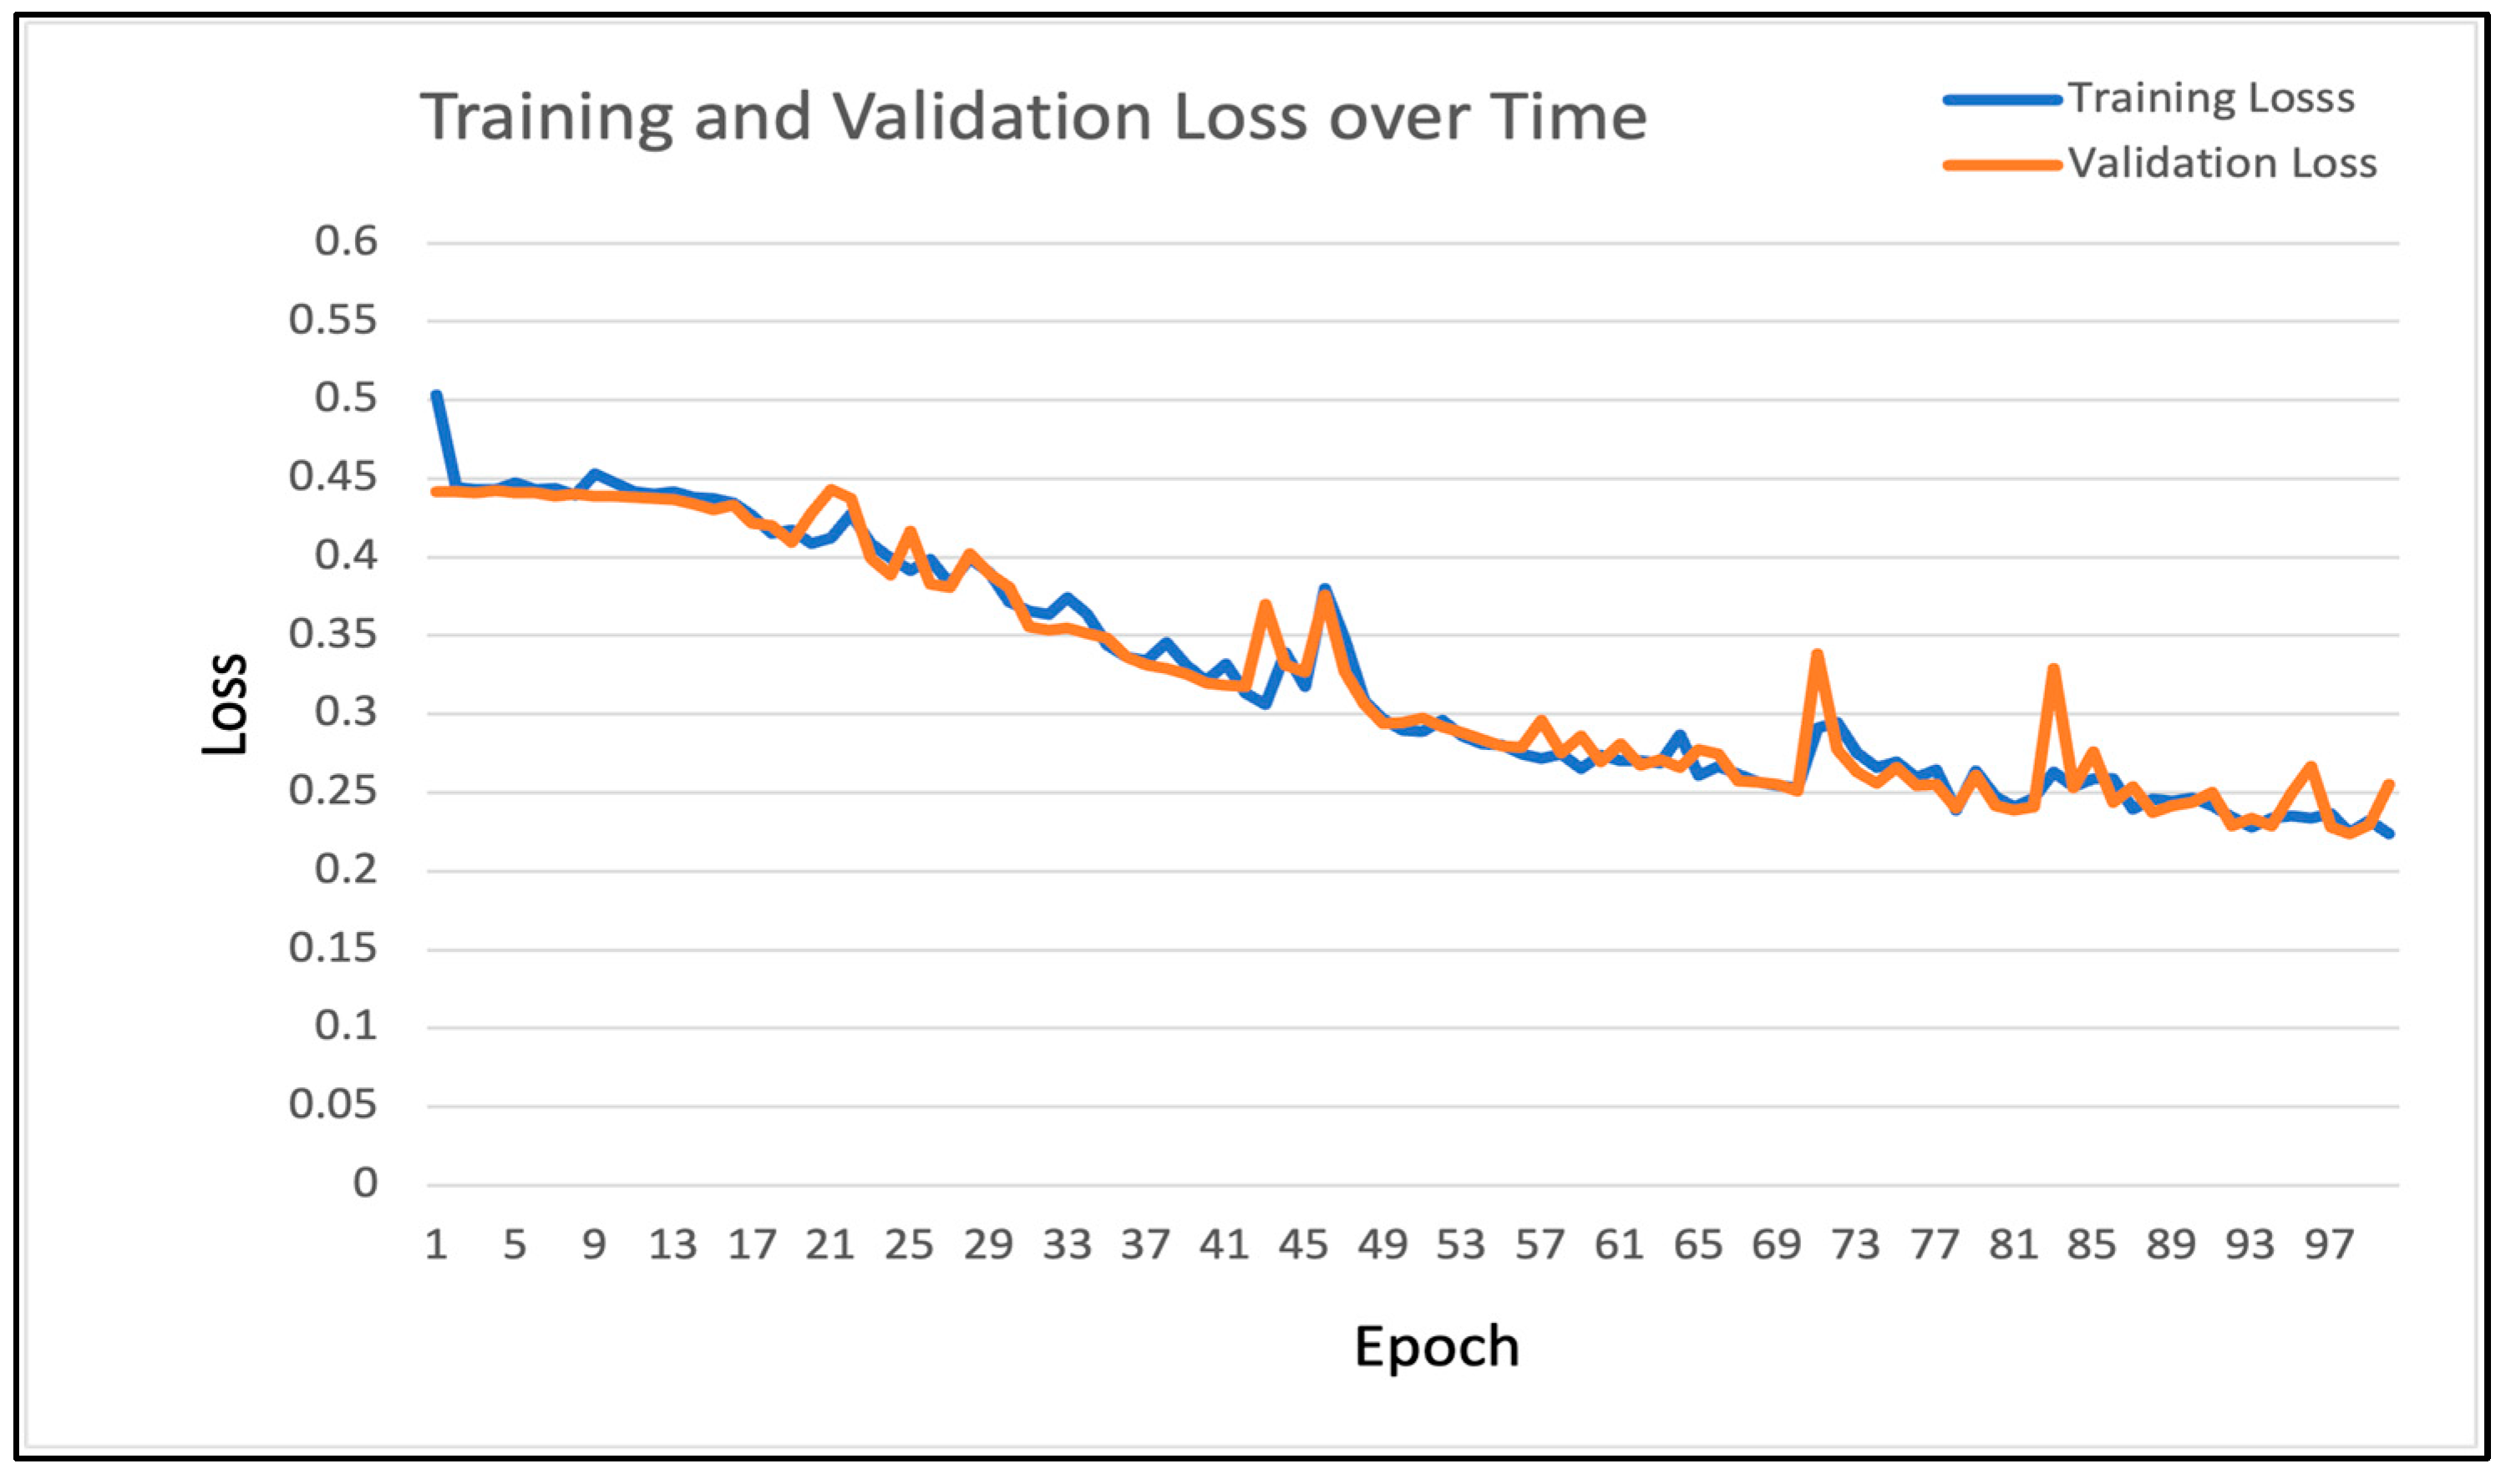
The model was trained for 100 epochs. The graph of training and validation loss over time is shown in Figure 13, and model accuracy is depicted in Figure 14.
Figure 14 illustrates how the model is getting better in each epoch of the training. Furthermore, Table 2 shows the results of the above graph in four points: the 1st epoch of training, the 50th epoch of the training, the 98th epoch of the training, and the 100th epoch of the training. As illustrated in these figures, it is evident that the performance of the model improved gradually as the number of epochs increased during training. At epoch 1, the model predicted the training dataset with a loss of 0.51 and an accuracy of 82.69%. After 50 epochs, the accuracy of the trained model increased to 88.25%, demonstrating a significant improvement in performance, with loss decreasing from 0.51 to 0.30. The training continued to achieve better results, with accuracy further improving to 92.09% at epoch 98 and loss decreasing to 0.22. By the end of 100 epochs, the model achieved an accuracy of 91.45%, although there was a slight increase in the loss value to 0.22.
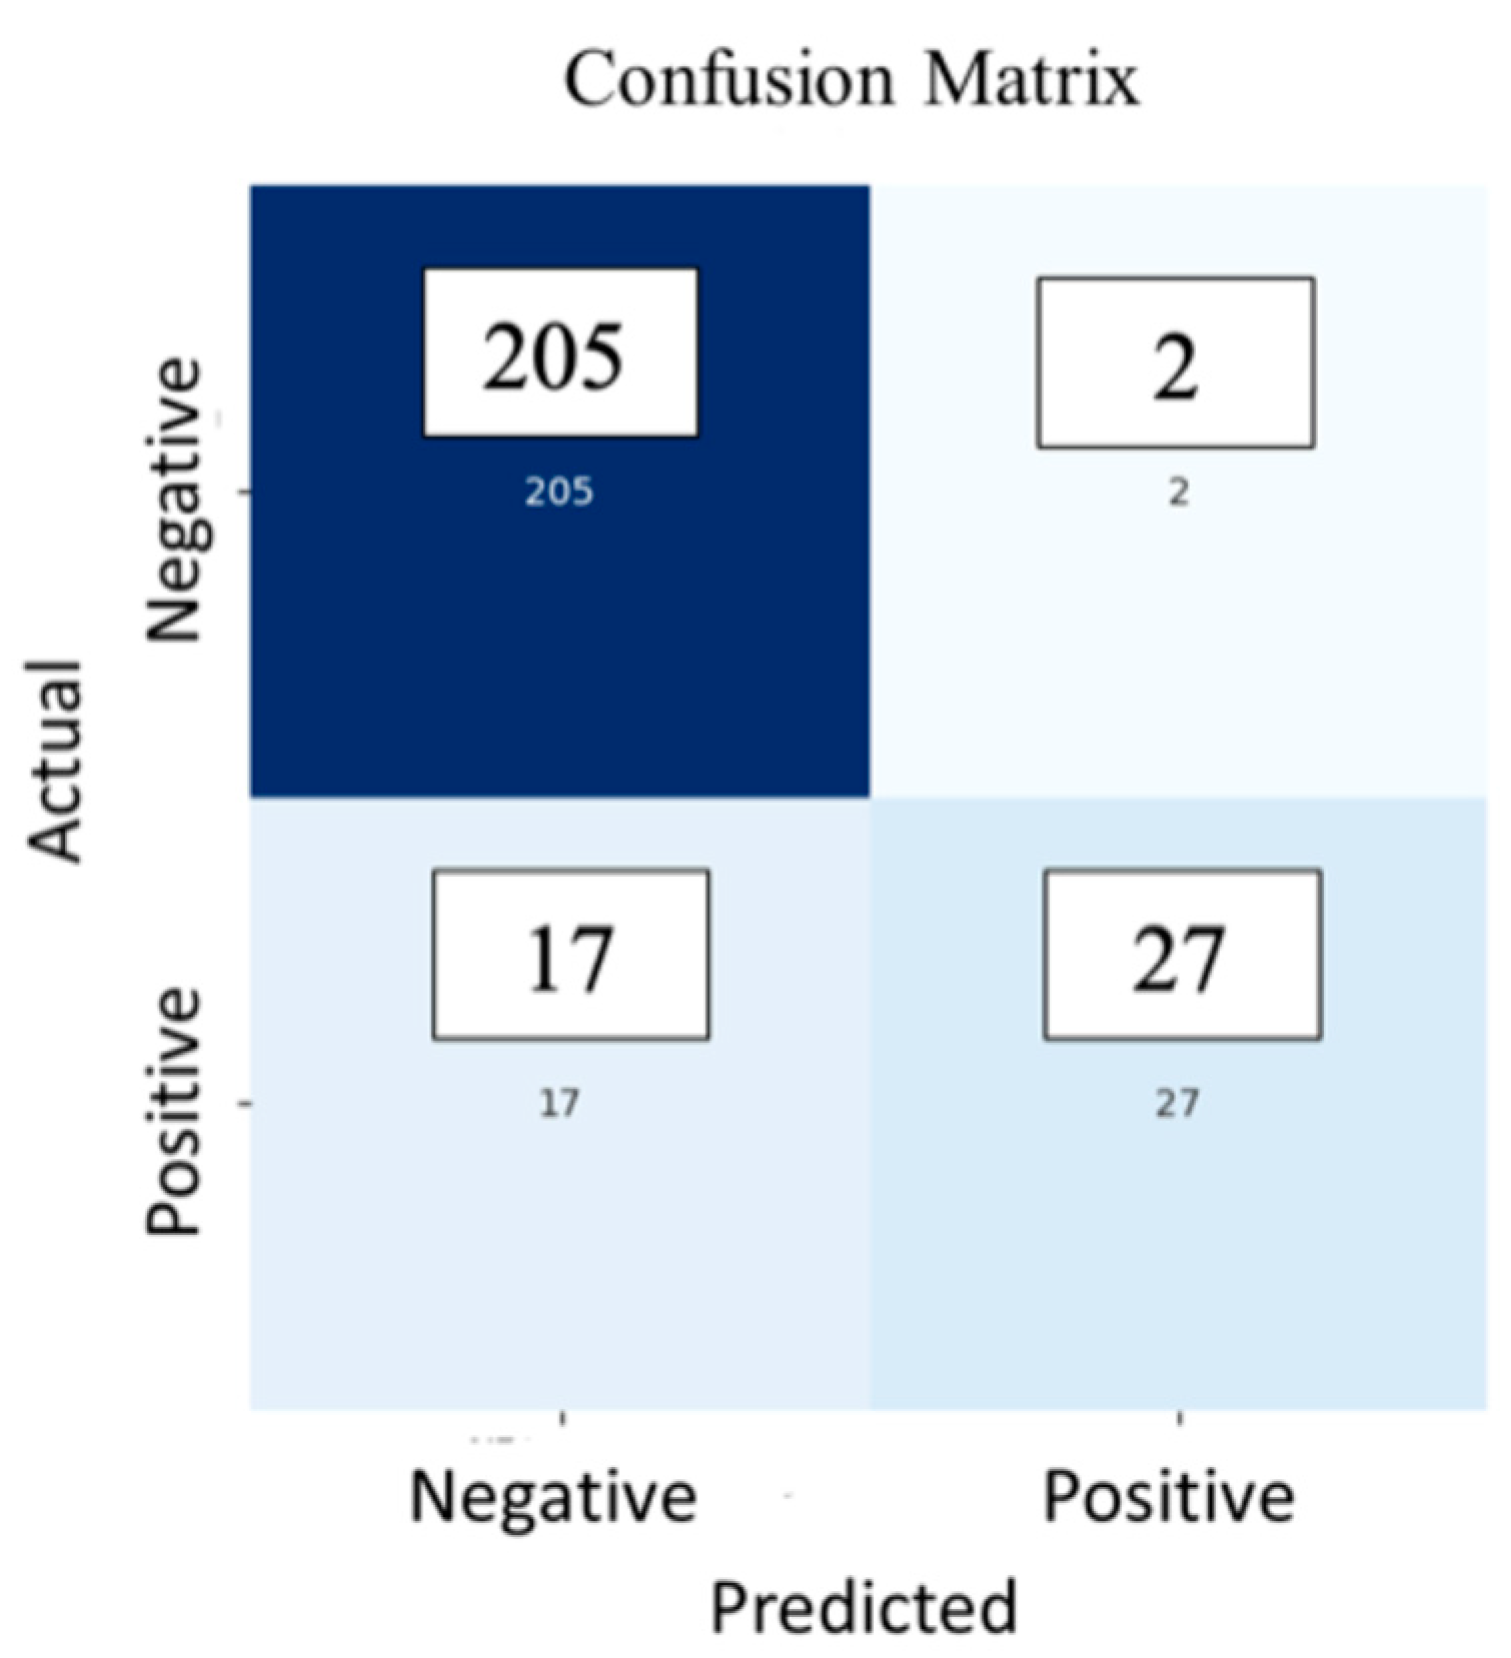
The CNN model was evaluated using confusion matrices, as shown in Figure 15. The classification report of the CNN model is shown in Table 3.
Based on the CNN model analysis, the model demonstrates a test accuracy of 92% and a test loss of 0.22. These performance metrics indicate the extent to which the classification model can predict the two classes, “Negative” and “Positive”. Specifically, the precision of the “Negative” class is 0.92, meaning that 92% of the cases predicted as negative are true negatives. With a recall of 0.99, it suggests that nearly all actual “Negative” instances were correctly identified. The F1 score of 0.95 reflects a balance between precision and recall for the “Negative” class.
The dataset contains 207 instances of the “Negative” class. For the “Positive” class, the recall is 0.61, indicating that 61% of actual positive instances were correctly identified. The precision for the “Positive” class is 0.93, meaning that 93% of the cases predicted as positive are true positives. The F1 score for the “Positive” class is 0.74, reflecting the balance between precision and recall. The “Positive” class consists of 44 instances in the dataset.
The model’s overall accuracy is 0.92, which represents the percentage of correct predictions across both classes. The macro average and weighted average provide a comprehensive measure across both classes, aggregating precision, recall, and F1 score statistics. The weighted average, in particular, accounts for the number of instances per class, providing a more accurate measure of overall performance. Considering both micro and macro averages, the results indicate that the model performed well overall.

4.4.2. ViT Model Evaluation and results

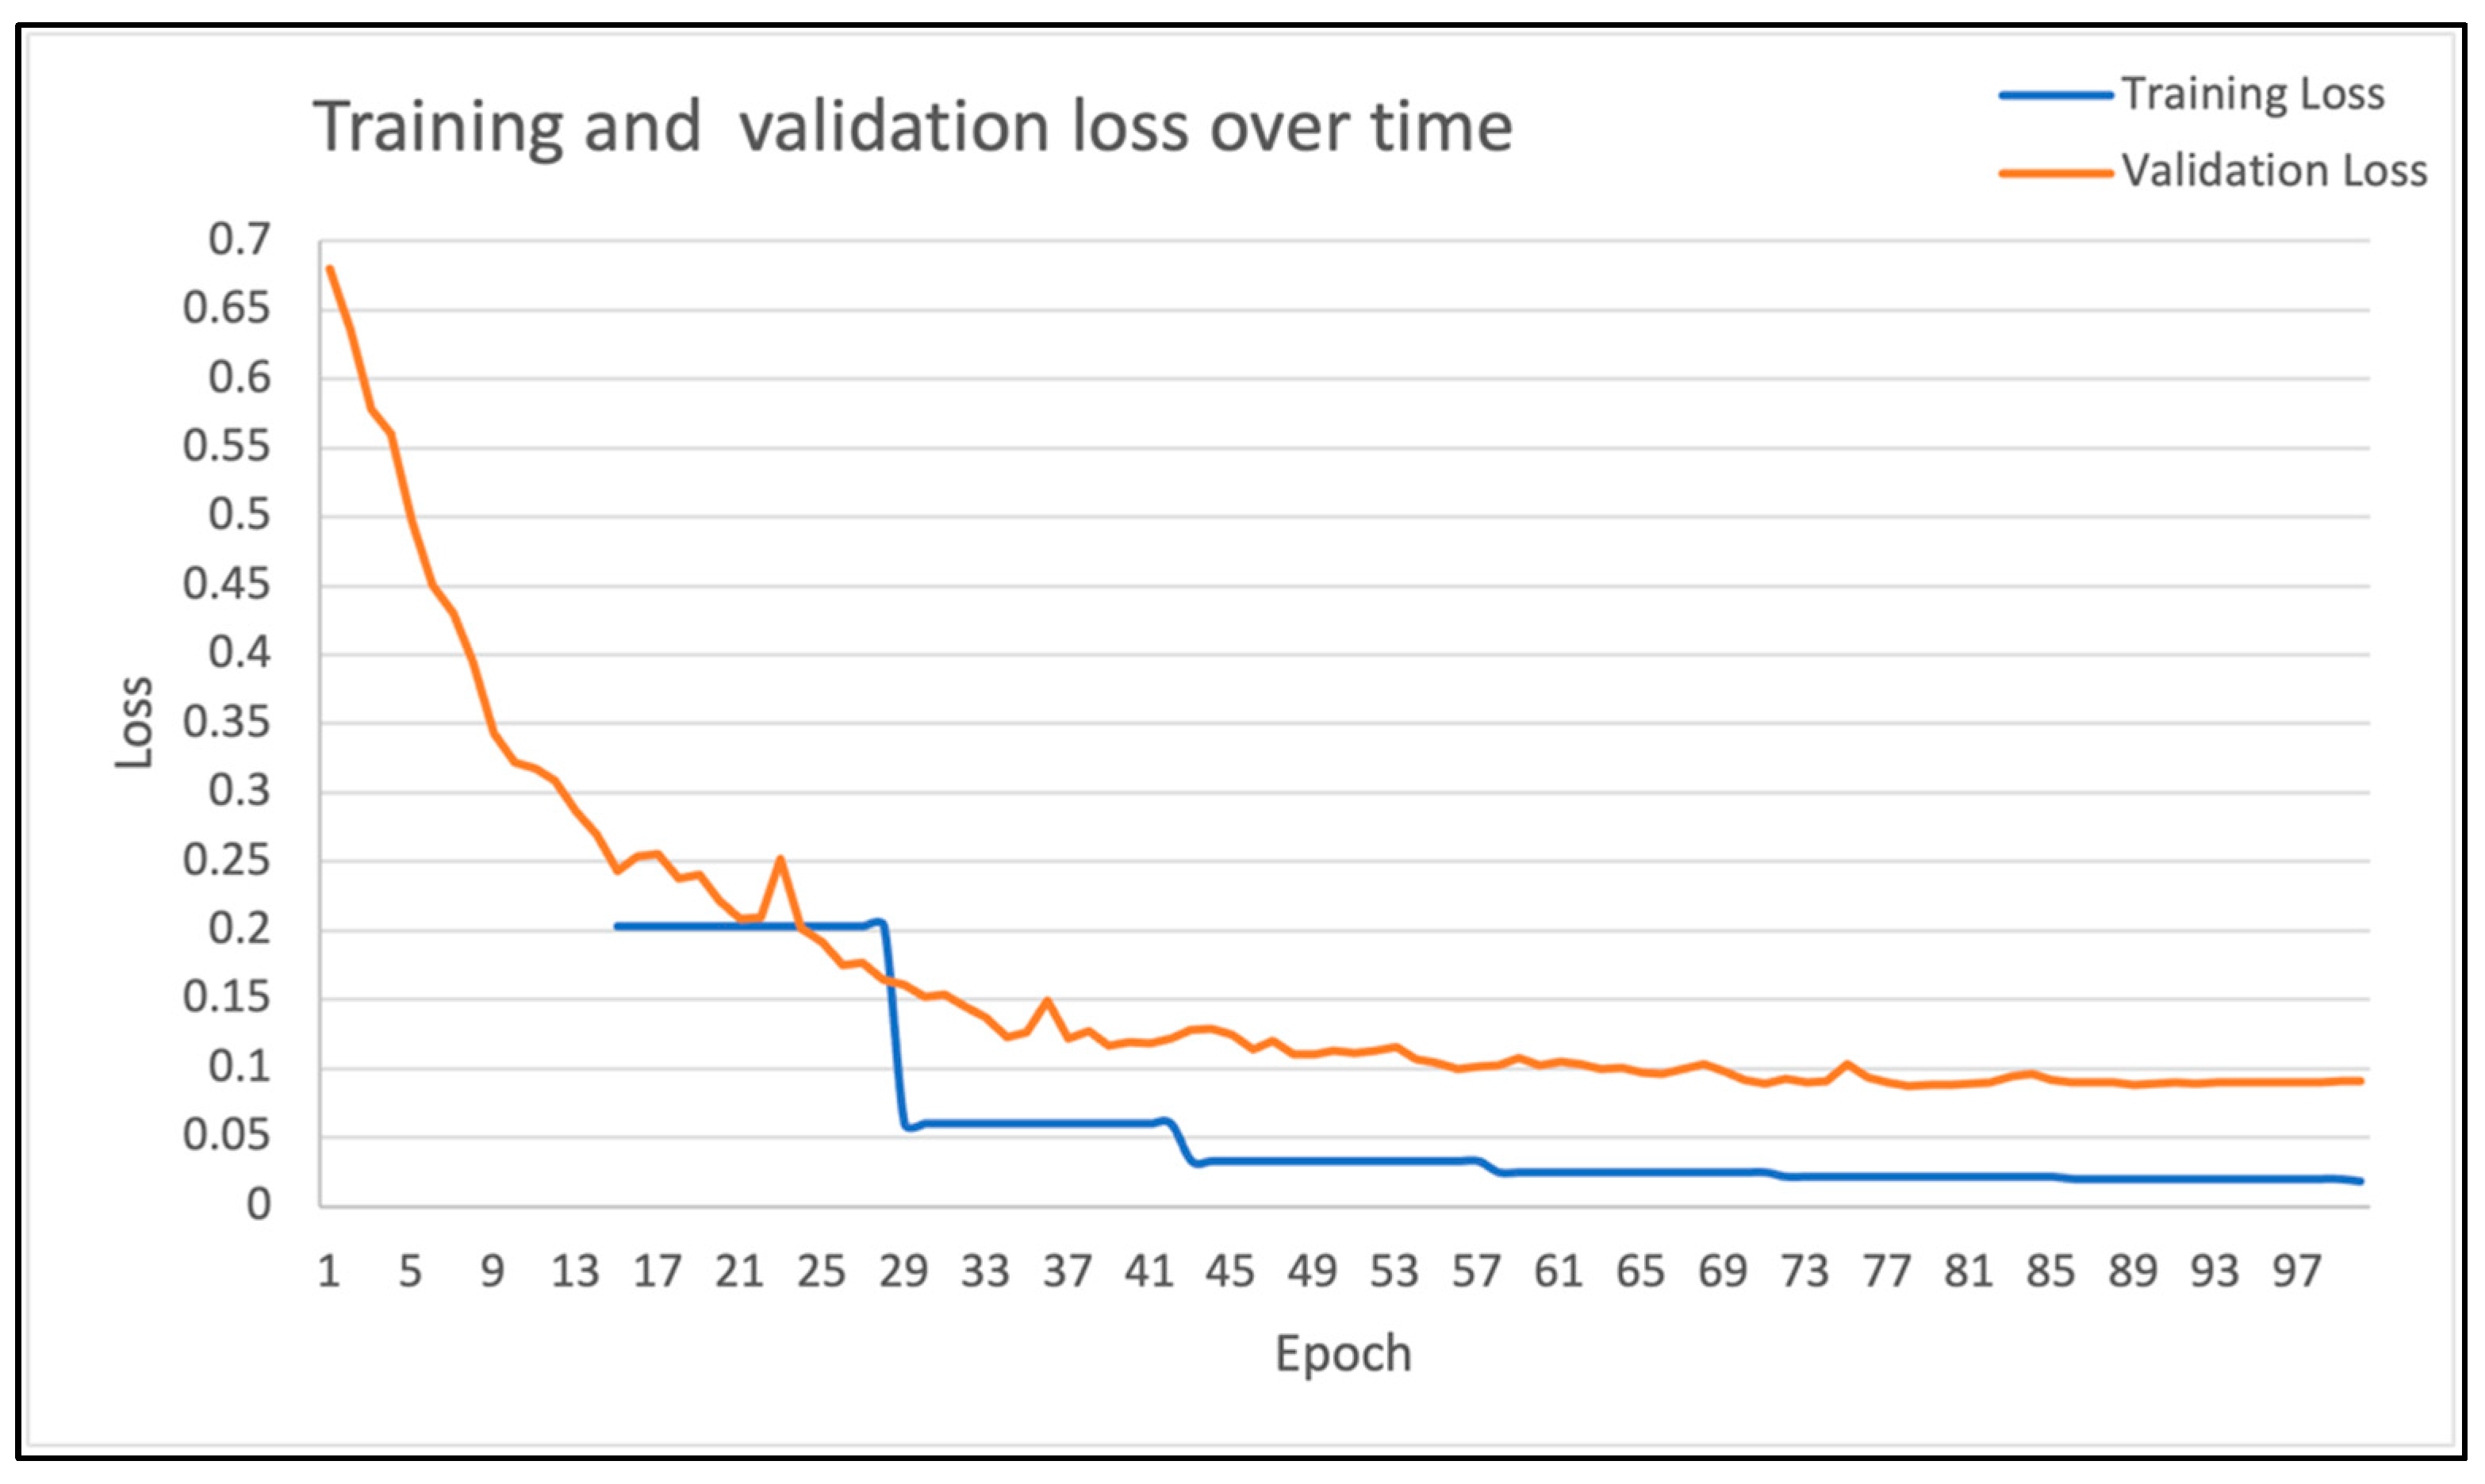
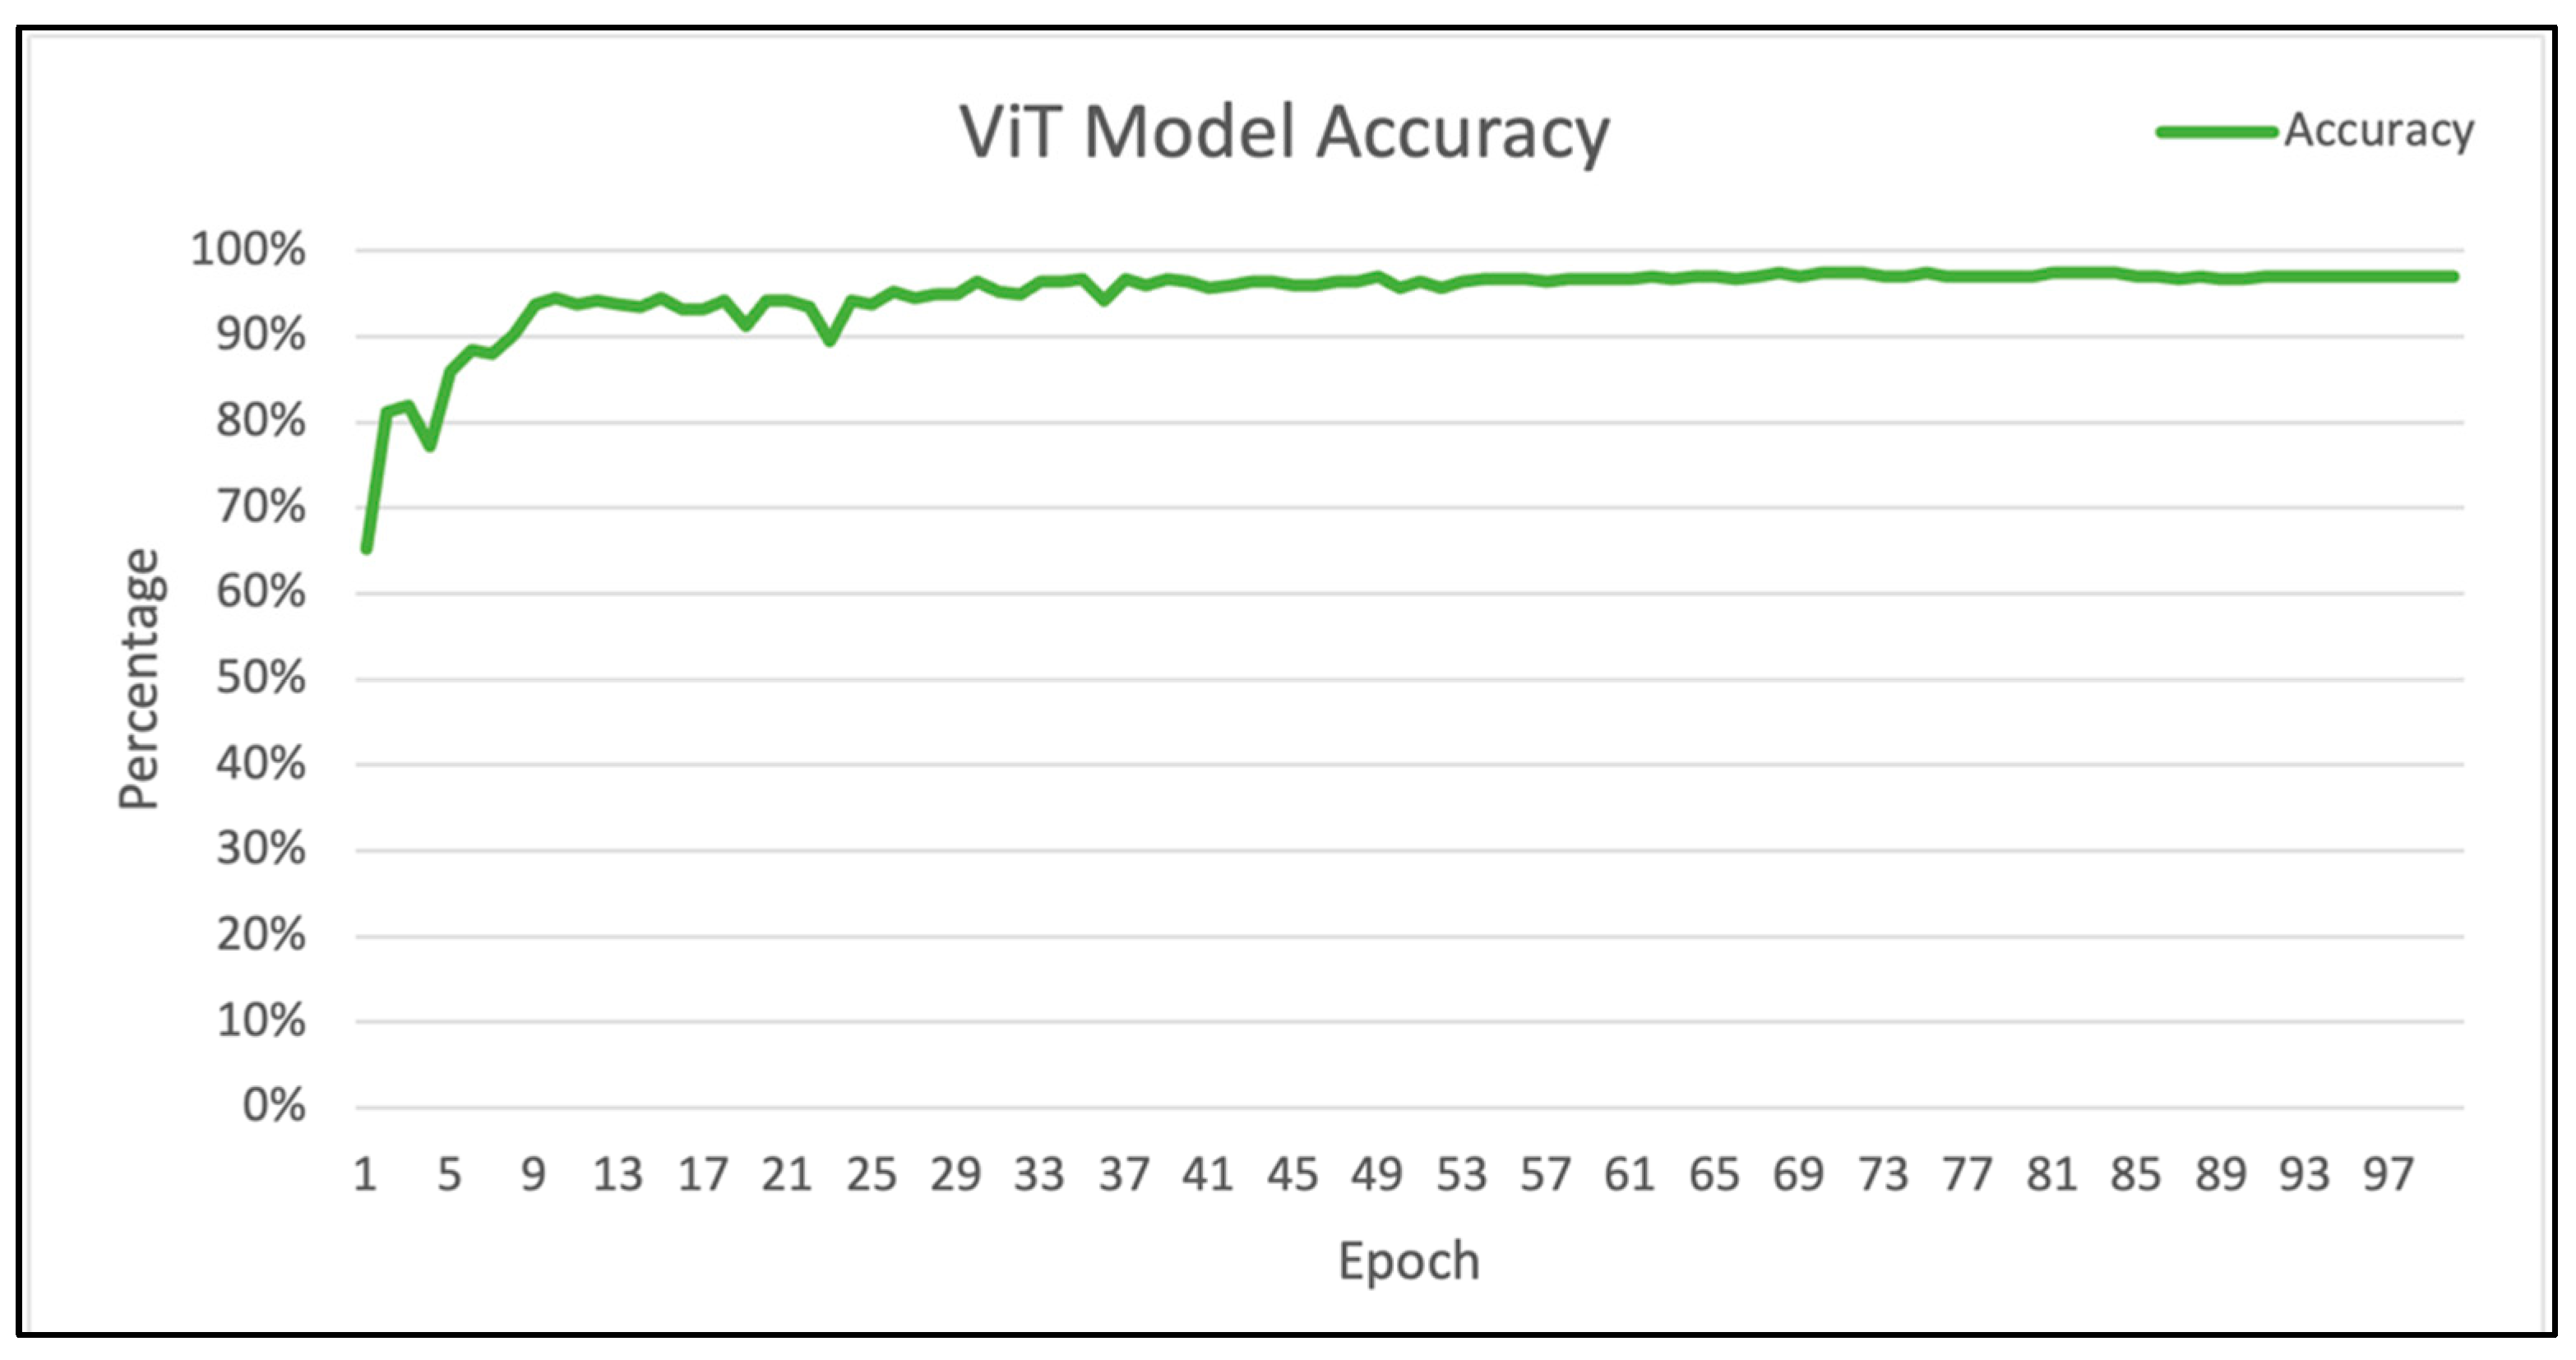
For the ViT model, the model was also trained for 100 epochs. The graph for training and validation loss over time is shown in Figure 16 and model accuracy in shown in Figure 17.
In addition, Table 4 shows the results at five points: the 1st epoch of training, the 50th epoch of the training, the 98th epoch of the training, and the 100th epoch of the training.
It is evident that the performance of the model improved gradually as the number of epochs increased during training. During the first 14 epochs, the training loss showed no log, indicating the initializing or warm-up phase to stabilize or adapt the data. At the beginning of training, the validation loss and accuracy were 0.68 and 65.34%, respectively. By epoch 15, the accuracy of the trained model increased to 94.58%, with a training loss of 0.20 and a validation loss of 0.24, demonstrating a significant improvement in the ViT model’s performance.
In the middle of the training, the model achieved an accuracy of 95.66%, with a training loss of 0.03 and a validation loss of 0.11. The training continued to achieve better results, with accuracy further improving to 97.47% at epoch 68, and the training loss decreasing to 0.02 and the validation loss to 0.10. By the end of 100 epochs, the model achieved an accuracy of 97.11%, with a training loss of 0.01 and a validation loss of 0.09.
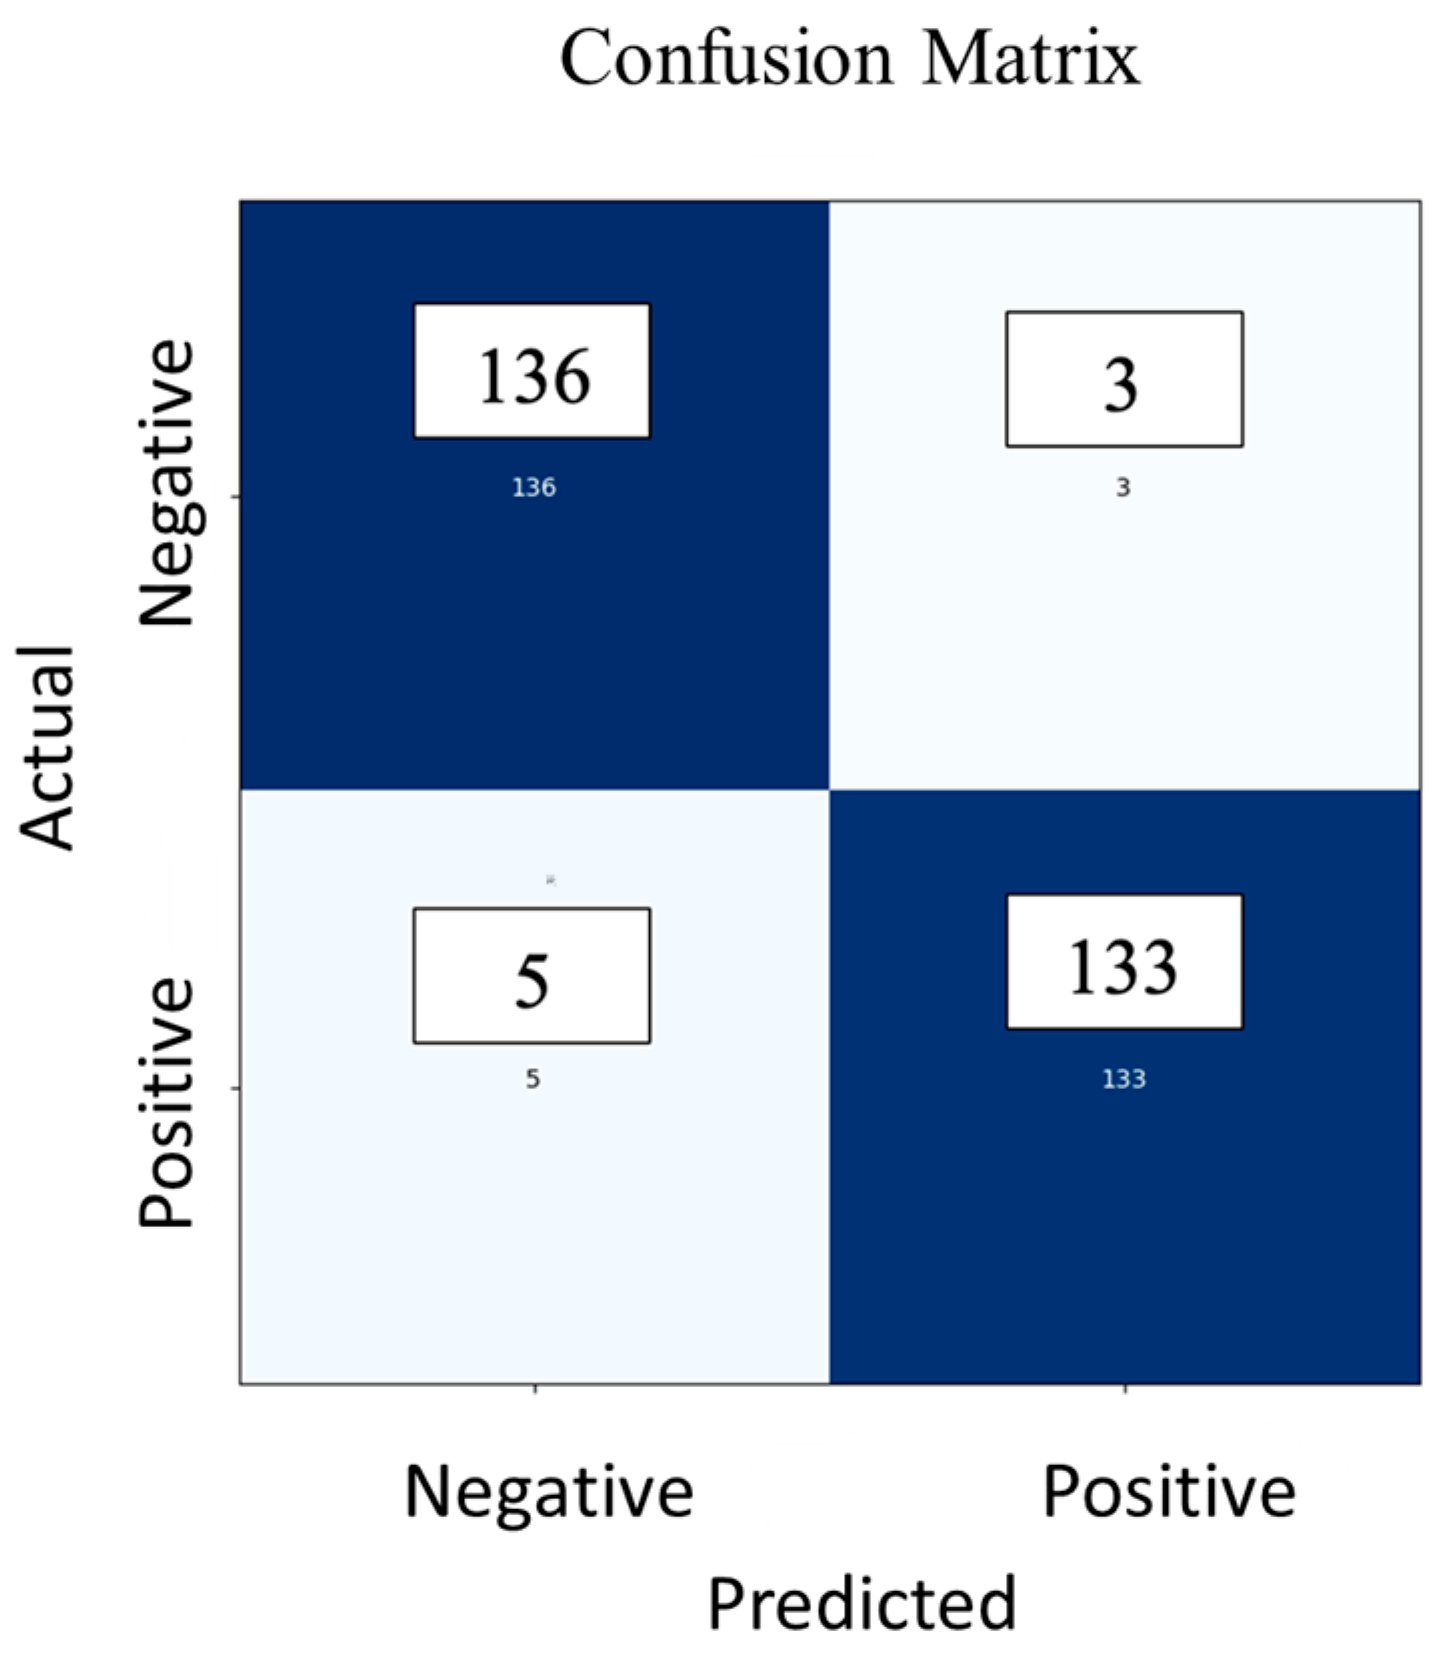
The ViT model was evaluated using a confusion matrix, as shown in Figure 18. The classification report of the ViT model is illustrated in Table 5.
Based on the ViT model analysis, the model demonstrates an accuracy of 97.11%. These performance metrics indicate how well the model classified data as “Negative” and “Positive”. For the “Negative” class, the recall is 0.96, illustrating that nearly 96% of actual “Negative” instances were detected, and the precision is 0.97, meaning that almost 97% of cases predicted as “Negative” were true. The F1 score for this class is 0.97, reflecting a balance between precision and recall. The original dataset contained a total of 138 instances of the “Negative” class.
For the “Positive” class, the recall is 0.97, indicating that nearly 97% of actual “Positive” instances were detected, while the precision is 0.96, meaning that nearly 96% of cases predicted as “Positive” were true. This class also has an F1 score of 0.97, demonstrating a fair balance between recall and precision. The “Positive” class consisted of 139 instances in the dataset.
The model’s overall accuracy is 97.11%. The macro average and weighted average metrics provide combined measures for both classes; the macro average is the unweighted mean of precision, recall, and F1 score, while the weighted average considers the total number of examples in each class, providing a more comprehensive analysis of unbalanced sample sizes. The macro average precision, recall, and F1 score are all slightly over 0.97, indicating balanced performance in both classes. Similarly, the F1 score, weighted average precision, and recall are all slightly over 0.97, reflecting the overall strong performance across the sample.
The performance of the CNN and ViT models was compared based on various factors, as shown in Table 6. This table demonstrates that the ViT model generally performs better in terms of accuracy, precision, recall, and F1 score. However, it requires a significantly longer training time (about 8 times more) compared to the CNN model.
All experiments were conducted on a MacBook Pro workstation equipped with M2 processor, 16 GB of RAM, and an integrated GPU. This minimal system configuration was chosen to ensure that the work is replicable across similar hardware setups, making this methodology accessible for broader application. The time to train the CNN model with this minimum system configuration was 12 min, in comparison to 91 min for the ViT model. Using a high-end system equipped with an NVIDIA RTX 3080 GPU, the training time for the CNN model could be reduced to approximately 2 min and that of the ViT model to around 15 min.

5. Discussion

This paper presents an automated bridge inspection framework that integrates UAS and advanced ML techniques, including CNN and ViT, to detect and analyze damage on concrete bridge decks. The methodology enhances inspection accuracy, efficiency, and safety by leveraging high-resolution imagery and automated data analysis. The comparative analysis reveals that while the ViT model offers superior performance in terms of accuracy, precision, recall, and F1 score, it requires more training time compared to the CNN model. The findings demonstrate the potential of integrating UAS and ML in infrastructure maintenance, providing valuable insights for infrastructure inspectors, project managers, and policymakers to improve maintenance strategies, allocate resources effectively, and ensure the longevity and safety of critical infrastructure.

5.1. Limitations

When implementing an automated ML model for infrastructure inspection, several limitations must be considered. One major challenge is dealing with blurry and noisy images, which can mislead the model and reduce its accuracy. Noisy and blurry images pose significant difficulties in data processing, as they obscure relevant features and create randomness in pixel values. This noise can lead to both false positives and false negatives, undermining the reliability of the model. Addressing these issues is crucial to enhancing the model’s performance and accuracy.
Adverse weather conditions, such as strong winds, also complicate data collection. High winds can affect the stability and control of drones, resulting in blurred or unusable images. The excessive movement caused by wind leads to poor-quality datasets, while the lightweight nature of drones increases the risk of damage or loss, making it difficult to maintain position, altitude, and flight path. Harsh weather conditions can further damage the drone, its equipment, and sensors, leading to incomplete data collection. Rain is also usually incompatible with imaging-based drone data collections.
Data storage and handling present additional challenges due to the large number of high-quality image files involved. Managing and organizing these extensive datasets requires substantial computing and storage resources. Each image contains a vast amount of information, necessitating robust storage systems and security mechanisms to maintain data integrity and security. Effective platform accessibility and data transmission further increase complexity, requiring careful design and execution.
Training the model effectively requires a large number of datasets to achieve better accuracy and performance. A comprehensive dataset not only enhances the model’s training but also improves its real-world application for damage detection. A heterogeneous dataset encompassing various materials, conditions, and scenarios allows the model to generalize better to new images. Both positive (damaged) and negative (undamaged) images are used to train the model to recognize damage-related attributes. Given that ML algorithms learn complex representations of damage from both linear and nonlinear features, substantial data are necessary for efficient learning. Additionally, a large, regularized dataset helps prevent overfitting in complex models, resulting in a more resilient, accurate, and generalizable model for detecting delamination in engineering and construction applications.

5.2. Future Scope

Future directions for this research include expanding the application of CNN and ViT models to larger datasets and to steel bridges. Larger datasets are essential for detecting damage in more complex bridge structures. The capabilities of these models for comprehensive steel bridge inspections have not been sufficiently explored in this project, which could result in improved accuracy and reduced false positives.
CNNs are effective at capturing features and dependencies between localized regions due to their architecture, which is designed to understand global feature dependencies among pixels in an image. ViT, on the other hand, captures features and dependencies through self-attention techniques specifically designed for images. However, both models require larger datasets to fully realize their potential. The architecture of both models can generalize more diverse fracture patterns and handle the complicated conditions of steel bridges when trained on larger datasets. Given the often complex designs of steel bridges, it is crucial for both CNN and ViT models to be trained on extensive datasets to accurately detect damage, ensuring structural integrity and safety. Engineers can explore various architectures of CNN and ViT with larger datasets to improve the detection process, leading to safer and more effective monitoring and analysis of steel bridges.
Additionally, the CNN and ViT models can be compared with other models, such as RCNN and DL models, which are also developed for damage detection. Comparing these models helps in understanding their architectures and performance. CNNs adopt global feature dependencies among pixels, while the ViT model uses self-attention techniques for global feature dependencies. The RCNN model, however, employs region-based detection for feature localization and visual recognition using ML. Understanding the architectures, performance, generalization abilities, and resource requirements of different models enables engineers to identify and evaluate the most suitable model for real-world implementation in structural health monitoring systems. Empirical evaluations of these models on large datasets and under various environmental conditions can enhance the robustness, accuracy, speed, and efficiency of damage detection in steel bridges and other structural applications, facilitating timely repairs and maintenance.

6. Conclusions

As national infrastructure (particularly bridges) continues to age, regular monitoring and inspection are essential for safe operation and maintenance. Traditionally, bridge inspectors rely on visible inspection tools and manuals to examine bridges and make recommendations. However, advancements in technology, including the use of UAS and ML techniques, have improved data collection and analysis processes.
This research study aims to identify and locate damage on bridge decks using data collected by UAS, employing image processing techniques and ML algorithms. This study specifically discusses the utilization of CNN and ViT models for damage detection, using a dataset containing 836 images, split into positive (damaged) and negative (undamaged) samples. Both models were trained and achieved accuracies exceeding 90%.
During the experimental phase, 30% of the dataset was used for testing, resulting in an accuracy of 92% for the CNN model and 97% for the ViT model. Both models were then tested with a new dataset of bridge images not used during training, and both successfully located damage and patches on the bridge deck. This demonstrates the strength of both models in performing damage detection tasks.
In the case study, both CNN and ViT models demonstrated excellent performance in detecting damage and non-damage in images. However, the ViT model achieved higher accuracy (97.11%) compared to the CNN model (92.03%). Both models play a significant role in infrastructure inspection, helping to prevent economic losses and structural failures and enhancing the safety of inspection crews by reducing exposure to traffic and other hazards.
Overall, this study highlights the transformative potential of integrating UAS with ML techniques for automated bridge inspection. By leveraging the strengths of CNN and ViT models, it is possible to achieve high accuracy in damage detection, thus offering a reliable alternative to traditional inspection methods. The significant improvements in accuracy and efficiency demonstrated by the ViT model suggest a promising direction for future research and application in infrastructure monitoring. Moreover, this study underscores the necessity for ongoing development and refinement of ML algorithms to enhance their applicability and effectiveness in real-world scenarios. Continued advancements in these technologies will be crucial in addressing the growing demands of infrastructure maintenance and ensuring the safety and reliability of our bridge networks.

Author Contributions

Conceptualization, R.S.; methodology, R.S. and R.P.; software, R.P. and S.E.; validation, R.P.; formal analysis, R.S. and R.P.; resources, C.N.B.; writing—original draft preparation, R.S. and R.P.; writing—review and editing, C.N.B., S.E., R.P. and R.S.; visualization, R.S. and R.P.; supervision, R.S. and S.E. All authors have read and agreed to the published version of the manuscript.

Funding

This research received no external funding.

Institutional Review Board Statement

Not applicable.

Informed Consent Statement

Not applicable.

Data Availability Statement

The original contributions presented in the study are included in the article, further inquiries can be directed to the corresponding author.

Acknowledgments

All support by MDOT and MTRI is gratefully acknowledged, including support from Michael Meyer, Steve Cook, and Andre Clover at MDOT for project advice and support from Rick Dobson and Chris Cook at MTRI for UAS data collection and processing. Any opinions, findings, conclusions, or recommendations presented in this paper are those of the authors and do not necessarily reflect the views of these agencies.

Conflicts of Interest

The authors declare no conflicts of interest.

References

  1. Weseman, W.A. The Recording and Coding Guide for the Structure Inventory and Appraisal of the Nation’s Bridges; United States Department of Transportation, Ed.; Federal Highway Administration: Washington, DC, USA, 1995; Volume 119.
  2. Li, T.; Alipour, M.; Harris, D.K. Mapping textual descriptions to condition ratings to assist bridge inspection and condition assessment using hierarchical attention. Autom. Constr. 2021, 129, 103801. [Google Scholar] [CrossRef]
  3. American Society of Civil Engineers, America’s Infrastructure. 2017. Available online: https://www.infrastructurereportcard.org/wp-content/uploads/2016/10/2017-Infrastructure-Report-Card.pdf (accessed on 1 September 2023).
  4. American Road & Transportation Builders Association, 2020 ARTBA Bridge Report. 2020. Available online: https://www.artbabridgereport.org (accessed on 9 December 2023).
  5. Azari, H.; O’shea, D.; Campbell, J. Application of unmanned aerial systems for bridge inspection. Transp. Res. Rec. 2022, 2676, 401–407. [Google Scholar] [CrossRef]
  6. Zhou, Z.-H. Machine Learning; Springer Nature: Berlin/Heidelberg, Germany, 2021. [Google Scholar]
  7. Kim, I.-H.; Jeon, H.; Baek, S.-C.; Hong, W.-H.; Jung, H.-J. Application of crack identification techniques for an aging concrete bridge inspection using an unmanned aerial vehicle. Sensors 2018, 18, 1881. [Google Scholar] [CrossRef]
  8. Dorafshan, S.; Thomas, R.J.; Coopmans, C.; Maguire, M. Deep learning neural networks for sUAS-assisted structural inspections: Feasibility and application. In Proceedings of the 2018 International Conference on Unmanned AIRCRAFT Systems (ICUAS), Dallas, TX, USA, 12–15 June 2018; IEEE: Piscataway, NJ, USA, 2018; pp. 874–882. [Google Scholar]
  9. Nguyen, D.-C.; Nguyen, T.-Q.; Jin, R.; Jeon, C.-H.; Shim, C.-S. BIM-based mixed-reality application for bridge inspection and maintenance. Constr. Innov. 2022, 22, 487–503. [Google Scholar] [CrossRef]
  10. Choi, Y.; Choi, Y.; Cho, J.-S.; Kim, D.; Kong, J. Utilization and Verification of Imaging Technology in Smart Bridge Inspection System: An Application Study. Sustainability 2023, 15, 1509. [Google Scholar] [CrossRef]
  11. Kim, R.C. Local Assistance Procedures Manual Exhibit 11-B Bridges and Structures. 2022. Available online: https://dot.ca.gov/programs/engineering-services/manuals (accessed on 1 June 2023).
  12. USDOT; Federal Highway Administration (FHWA). 2022-09512; 2022. Available online: https://www.govinfo.gov/content/pkg/FR-2022-05-06/pdf/2022-09512.pdf (accessed on 1 September 2023).
  13. Kušar, M. Bridge inspection quality improvement using standard inspection methods. In Proceedings of the Joint COST TU1402—COST TU1406—IABSE WC1 Workshop: The Value of Structural Health Monitoring for the Reliable Bridge Management, Zagreb, Croatia, 2–3 March 2017; Available online: https://www.grad.unizg.hr/_download/repository/BSHM2017_3.7.pdf (accessed on 1 September 2023).
  14. Lovelace, B. Improving the Quality of Bridge Inspections Using Unmanned Aircraft Systems (UAS). 2018. Available online: https://transportation.org/uas-aam/wp-content/uploads/sites/80/2023/05/201826.pdf (accessed on 1 June 2023).
  15. Ganapuram, S.; Adams, M.; Patnaik, A. Ohio Department of Transportation, Office of Research and Development: Columbus, OH, USA, 2012. Available online: https://rosap.ntl.bts.gov/view/dot/24222 (accessed on 1 September 2023).
  16. Sen, S.; Bricka, S. Data Collection Technologies—Past, Present, and Future. 2013. Available online: https://books.google.co.in/books?hl=en&lr=&id=uIwWBAAAQBAJ&oi=fnd&pg=PA295&dq=related:UnIrl330L7cJ:scholar.google.com/&ots=FuRxiamYqU&sig=0DEG09a9BCfzw3Nz7Qydp4BNrG4&redir_esc=y#v=onepage&q&f=false (accessed on 1 September 2023).
  17. Tang, P.; Akinci, B.; Garrett, J.H. Laser Scanning for Bridge Inspection and Management. In IABSE Symposium Report, International Association for Bridge and Structural Engineering; 2007; pp. 17–24. Available online: https://www.researchgate.net/profile/Pingbo-Tang/publication/233686297_Laser_Scanning_for_Bridge_Inspection_and_Management/links/543edbc50cf2e76f02244798/Laser-Scanning-for-Bridge-Inspection-and-Management.pdf (accessed on 1 September 2023).
  18. Badanes, B. Ohio Department of Transportation, Eyes in the Sky. 2022. Available online: https://www.transportation.ohio.gov/about-us/stories/march-winter-spring-2022/eyes-in-the-sky (accessed on 1 June 2023).
  19. Hiasa, S.; Karaaslan, E.; Shattenkirk, W.; Mildner, C.; Catbas, F.N. Bridge inspection and condition assessment using image-based technologies with UAVs. In Structures Congress 2018; American Society of Civil Engineers: Reston, VA, USA, 2018; pp. 217–228. [Google Scholar]
  20. Seo, J.; Jeong, E.; Wacker, J.P. Machine learning approach to visual bridge inspection with drones. In Structures Congress 2022; American Society of Civil Engineers: Reston, VA, USA, 2022; pp. 160–169. [Google Scholar]
  21. Ali, L.; Aljassmi, H.; Parambil, M.M.A.; Swavaf, M.; AlAmeri, M.; Alnajjar, F. Crack Detection and Localization in Stone Floor Tiles using Vision Transformer approach. In Proceedings of the International Symposium on Automation and Robotics in Construction, Chennai, India, 5–7 July 2023; IAARC Publications: Waterloo, ON, Canada, 2023; pp. 699–705. [Google Scholar]
  22. Chun, P.; Yamane, T.; Maemura, Y. A deep learning-based image captioning method to automatically generate comprehensive explanations of bridge damage. Comput.-Aided Civ. Infrastruct. Eng. 2022, 37, 1387–1401. [Google Scholar] [CrossRef]
  23. Zhang, G.-Q.; Wang, B.; Li, J.; Xu, Y.-L. The application of deep learning in bridge health monitoring: A literature review. Adv. Bridge Eng. 2022, 3, 22. [Google Scholar] [CrossRef]
  24. Jáuregui, D.V.; Tian, Y.; Jiang, R. Photogrammetry applications in routine bridge inspection and historic bridge documentation. Transp. Res. Rec. 2006, 1958, 24–32. [Google Scholar] [CrossRef]
  25. Adhikari, R.S.; Moselhi, O.; Bagchi, A. Image-based retrieval of concrete crack properties for bridge inspection. Autom. Constr. 2014, 39, 180–194. [Google Scholar] [CrossRef]
  26. Song, L.; Sun, H.; Liu, J.; Yu, Z.; Cui, C. Automatic segmentation and quantification of global cracks in concrete structures based on deep learning. Measurement 2022, 199, 111550. [Google Scholar] [CrossRef]
  27. Zhang, C.; Wan, L.; Wan, R.-Q.; Yu, J.; Li, R. Automated fatigue crack detection in steel box girder of bridges based on ensemble deep neural network. Measurement 2022, 202, 111805. [Google Scholar] [CrossRef]
  28. Ayele, Y.Z.; Aliyari, M.; Griffiths, D.; Droguett, E.L. Automatic crack segmentation for UAV-assisted bridge inspection. Energies 2020, 13, 6250. [Google Scholar] [CrossRef]
  29. Zollini, S.; Alicandro, M.; Dominici, D.; Quaresima, R.; Giallonardo, M. UAV photogrammetry for concrete bridge inspection using object-based image analysis (OBIA). Remote Sens. 2020, 12, 3180. [Google Scholar] [CrossRef]
  30. Potenza, F.; Rinaldi, C.; Ottaviano, E.; Gattulli, V. A robotics and computer-aided procedure for defect evaluation in bridge inspection. J. Civ. Struct. Health Monit. 2020, 10, 471–484. [Google Scholar] [CrossRef]
  31. Wang, W.; Su, C. Automatic concrete crack segmentation model based on transformer. Autom. Constr. 2022, 139, 104275. [Google Scholar] [CrossRef]
  32. Xiao, S.; Shang, K.; Lin, K.; Wu, Q.; Gu, H.; Zhang, Z. Pavement crack detection with hybrid-window attentive vision transformers. Int. J. Appl. Earth Obs. Geoinf. 2023, 116, 103172. [Google Scholar] [CrossRef]
  33. Reghukumar, A.; Anbarasi, L.J.; Prassanna, J.; Manikandan, R.; Al-Turjman, F. Vision based seg-mentation and classification of cracks using deep neural networks. Int. J. Uncertain. Fuzziness Knowl.-Based Syst. 2021, 29, 141–156. [Google Scholar] [CrossRef]
  34. Escobar-Wolf, R.; Oommen, T.; Brooks, C.N.; Dobson, R.J.; Ahlborn, T.M. Unmanned aerial vehicle (UAV)-based assessment of concrete bridge deck delamination using thermal and visible camera sensors: A preliminary analysis. Res. Nondestruct. Eval. 2018, 29, 183–198. [Google Scholar] [CrossRef]
  35. Wolf, T.; Debut, L.; Sanh, V.; Chaumond, J.; Delangue, C.; Moi, A.; Cistac, P.; Rault, T.; Louf, R.; Funtowicz, M.; et al. Transformers: State-of-the-art natural language processing. In Proceedings of the 2020 Conference on Empirical Methods in Natural Language Processing: System Demonstrations, Online, 16–20 November 2020; pp. 38–45. [Google Scholar]
  36. Brooks, C.; Dobson, R.; Banach, D.; Oommen, T.; Zhang, K.; Mukherjee, A.; Havens, T.; Ahborn, T.; Escobar-Wolf, R.; Bhat, C.; et al. Implementation of Unmanned Aerial Vehicles (UAVs) for Assessment of Transportation Infrastructure-Phase II; Michigan Technological University: Houghton, MI, USA, 2018. [Google Scholar]
  37. Brooks, C.; Cook, C.; Dobson, R.; Oommen, T.; Zhang, K.; Mukherjee, A.; Samsami, R.; Semenchuk, A.; Lovelace, B.; Hung, V.; et al. ntegration of Unmanned Aerial Systems Data Collection into Day-to-Day Usage for Transportation Infrastructure—A Phase III Project. Michigan Department of Transportation Research Administration Report No. 1713. 2022. Available online: https://rosap.ntl.bts.gov/view/dot/62974 (accessed on 1 June 2023).
Figure 1. Automated bridge inspection.
Eng 05 00103 g001
Figure 2. Dataset preparation diagram.
Eng 05 00103 g002
Figure 3. Methodology chart for CNN model.
Eng 05 00103 g003
Figure 4. Methodology chart for ViT model.
Eng 05 00103 g004
Figure 10. Ground control GPS survey using Aeropoints (image courtesy: MTRI) [37].
Eng 05 00103 g010
Figure 13. Graphical representation of training and validation loss over time using CNN.
Eng 05 00103 g013
Figure 14. Graphical representation of accuracy over epochs using CNN.
Eng 05 00103 g014
Figure 15. CNN confusion matrix.
Eng 05 00103 g015
Figure 16. Graphical representation of training and validation loss over time using ViT.
Eng 05 00103 g016
Figure 17. Graphical representation of accuracy over epochs using ViT.
Eng 05 00103 g017
Figure 18. Confusion matrix for ViT model.
Eng 05 00103 g018
Table 1. Summary of the reviewed literature.
No.PaperTitleMethodologyOutput
1Seo et al., 2022 [14].Machine Learning Approach to Visual Bridge Inspection with DronesCNN is used as a machine learning algorithm.
Damage assessment is conducted using semantic segmentation software (ImageJ 2022).
Identification of different types of damage such as cracking, weathering, and spalling (chipping, flaking, or breaking off of small fragments from the surface).
2Nguyen et al., 2022 [9].BIM-based mixed-reality application for bridge inspection and maintenanceBIM-based model named Heronbridge for bridge inspection based on Microsoft HoloLens.Inspection information improved in the interpretation, visualization, and visual interpretation of 3D models.
3Dorafshan et al., 2018 [8].Deep Learning Neural Networks for sUAS-Assisted Structural Inspections: Feasibility and ApplicationDeep learning CNN for concrete deck inspection.
Autonomous image classification and object detection and calculation of learning parameters through thousands to millions of iterations.
A CNN algorithm using Alex net architecture and ResNet to improve network evaluation.
4Chun et al., 2022 [22].A deep learning-based image captioning method to automatically generate comprehensive explanations of bridge damageDeep learning model to generate texts for the condition of bridges.Generation of explanatory texts for 1000 new bridge images.
5Zhang et al., 2022 [23].The application of deep learning in bridge health monitoring: a literature reviewDeep learning based on deep neural networks for structural health monitoring (vibration- and vision-based).A review of bridge health monitoring and damage detection techniques.
6Kim et al., 2018 [7].Application of Crack Identification Techniques for an Aging Concrete Bridge Inspection Using an Unmanned Aerial VehicleCommercial software, Pix4D mapper 2022, for 3D model generation.
AutoCAD 2017 to convert spatial information into digital information by using.
Three-dimensional point cloud of bridge.
RCNN algorithm.
7Choi et al., 2023 [10].Utilization and Verification of Imaging Technology in Smart Bridge Inspection System: An Application StudyImage processing and machine learning data algorithms.Three-dimensional external inspection map.
VR assisted in illustrating inspection details.
Inspection cost was reduced by 19%.
8Azari et al., 2022 [5].Application of Unmanned Aerial Systems for Bridge InspectionUAS and LiDAR (light detection and imaging) to capture HD images.
Use of geospatial software programs and CAD to create 3D model of bridges.
Cost, time, and labor effectiveness are reported.
9Li et al., 2021 [2].Mapping textual descriptions to condition ratings to assist bridge inspection and condition assessment using hierarchical attentionHierarchical architecture recurrent neural network (GRU-based sequence encoder) with an attention mechanism.Condition rating and quality control of bridges.
10Hiasa et al., 2018 [19].Bridge Inspection and Condition Assessment Using Image-Based Technologies with UAVsInfrared thermography inspection to detect subsurface defects such as delamination and voids.
High-definition (HD) imaging technologies to detect surface defects such as cracks.
Crack size is assessed according to several manuals or standards.
11David V et al. [24].Photogrammetry applications in routine bridge inspection and historic bridge documentationPhotogrammetry techniques to assess bridge geometry. PhotoModeler 2006 software was used to process the images for measurement.Photogrammetry techniques provide sufficient accuracy.
12Adhikari et al., 2014 [25].Image-based retrieval of concrete crack properties for bridge inspectionIntegrated model based on digital image processing to identify crack quantification, change detection, neural networks, and 3D visualization.Fourier transform of digital images and integrated model is used to detect crack length and change detection.
13Song et al., 2022 [26].Automatic segmentation and quantification of global cracks in concrete structures based on deep learning.Methods of close-range scanning and shooting to obtain HD panoramas of the surface of concrete.Identification and quantification of cracks and calculation of crack width with 3.87% accuracy.
14Zang et al., 2022 [27].Automated fatigue crack detection in steel box girder of bridges based on ensemble deep neural networkSub-networks (detection classifiers) to differentiate cracks on images; segmentation sub-network to obtain pixel level crack details.Crack segmentation.
15Ayele et al., 2020 [28].Automatic Crack Segmentation for UAV-Assisted Bridge InspectionMask RCNN.
Three-dimensional construction of bridge geometry and damage identification.
Detection, locating, and quantification of cracks and fractures on the bridge.
16Zollini et al., 2020 [29].UAV Photogrammetry for Concrete Bridge Inspection Using Object-Based Image Analysis (OBIA)Object-Based Image Analysis (OBIA).Concrete structure inspection model.
17Potenza et al., 2020 [30].A robotics and computer-aided procedure for defect evaluation in bridge inspectionColor-based image processing algorithm and software DEEP (Defect Detection by Enhanced image processing).Defect extension evaluation.
18Wang et al., 2022 [31].Automatic concrete crack segmentation model based on transformerNovel SegCrack model for pixel-level crack segmentation using a hierarchically structured transformer.Pixel-level crack segmentation.
19Xiao et al., 2023 [32].Pavement crack detection with hybrid-window attentive vision transformersVision Transformers.Pavement crack detection.
20Reghukumar et al., 2021 [33].Vision based segmentation and classification of cracks using deep neural networksDeep Neural Networks.Crack classification.
21Ali et al., 2023 [21].Crack detection and localization in stone floor tiles using vision transformation approach.Vision Transformation.Crack detection and localization.
22Escobar-Wolf et al., 2018 [34]Close-range photogrammetry and thermal sensingEdge detection techniques.Delamination and spall detection.
Table 2. Sample data of loss and accuracy over time.
Epoch NumberLossAccuracyValidation LossValidation Accuracy
10.51950.82690.45050.8291
500.30370.88250.30220.8632
980.22470.92090.24470.8974
1000.22820.91450.23020.9145
Table 3. Classification report of CNN model.
PrecisionRecallF1 ScoreSupport
Negative0.920.990.95207
Positive0.930.610.7444
Accuracy0.92251
Macro avg0.920.800.84251
Weighted avg0.920.870.94251
Table 4. Sample data of loss and accuracy over time.
Epoch NumberTraining LossValidation LossAccuracy
1No log0.680.65
150.200.240.94
500.030.110.95
680.020.100.97
1000.010.090.97
Table 5. Classification report of ViT model.
PrecisionRecallF1 ScoreSupport
Negative0.970.960.97139
Positive0.960.970.97138
Accuracy0.97277
Macro avg0.970.970.97277
Weighted avg0.970.970.97277
Table 6. Comparison table of CNN and ViT models.
Model FactorsCNN ModelViT Model
Model Accuracy0.920.97
Negative Precision0.920.97
Positive precision0.930.96
Negative Recall0.990.96
Positive Recall0.610.97
Negative F1 Score0.950.97
Positive F1 Score0.740.97
Disclaimer/Publisher’s Note: The statements, opinions and data contained in all publications are solely those of the individual author(s) and contributor(s) and not of MDPI and/or the editor(s). MDPI and/or the editor(s) disclaim responsibility for any injury to people or property resulting from any ideas, methods, instructions or products referred to in the content.