Article

Hosting Capacity Assessment of South African Residential Low-Voltage Networks for Electric Vehicle Charging

Department of Electrical Power Engineering, Durban University of Technology, Durban 4000, South Africa
*
Author to whom correspondence should be addressed.
Eng 2023, 4(3), 1965-1980; https://doi.org/10.3390/eng4030111
Submission received: 9 June 2023 / Revised: 26 June 2023 / Accepted: 11 July 2023 / Published: 12 July 2023
(This article belongs to the Section Electrical and Electronic Engineering)

Abstract

:
The necessity for environmentally friendly transportation systems has prompted the proliferation of electric vehicles (EVs) in low-voltage (LV) distribution networks. However, large-scale integration and simultaneous charging of EVs can create power quality challenges for the distribution grid. It is therefore important to assess the impact of connecting EVs for charging in existing distribution networks and determine the hosting capacity (HC) of such a network. This paper uses a deterministic time-series method and stochastic method based on a simplified Monte Carlo simulation to estimate the HC of single-phase and three-phase EV charging, respectively, for a South African low-voltage distribution network containing 21 households. Voltage drop and equipment loading are the performance indices (PI) considered for the impact assessment and HC estimation in this study. The impact assessment result confirms that increasing EV charging penetration will result in a corresponding movement of the PIs toward the allowable limits. The results show that the HC is 5–8 three-phase EVs charging simultaneously for the worst-case scenario and 9–13 EVs for the best-case scenario. Furthermore, the single-phase HC for the popular 3.7 kW EV charger is 15 and 8 EVs for the best-case and worst-case scenarios, respectively. The result showing the seasonal variation in HC and for other EV charging power is also presented. The difference in HC for the worst-case and best-case scenarios portrays the effect that the location of charging has on the HC.

1. Introduction

The existing electrical power grid in various parts of the world is overburdened due to grid expansion, increased urbanization and a concomitant upsurge in the number and magnitude of grid-connected loads. Environmental safety concerns and the ongoing energy crisis make it essential that alternative sources of transportation be clean [1,2]. These concerns are progressively being alleviated by the rapid increase in the use of environmentally friendly electric vehicles (EVs) [2,3]. The growing sales of plug-in electric vehicles [3] imply that EV charging in the distribution network is increasing, and this translates into a corresponding increase in peak power consumption and changes in consumption patterns [4,5]. However, large-scale integration and simultaneous charging of multiple EVs are identified as having a high impact on the existing electrical networks, disrupting the standard operating condition of the grid by creating several technical challenges, such as voltage violations, transformer and lines overloading, and increasing electrical losses [6]. As a result, distribution network operators (DNOs) carry out impact assessments and perform hosting capacity (HC) analysis to assess the behavior of the network when EVs are connected and determine the amount of EV charging that can be integrated into a particular distribution network. This makes the HC a useful planning tool for estimating the amount of EV charging that is possible on a distribution feeder.
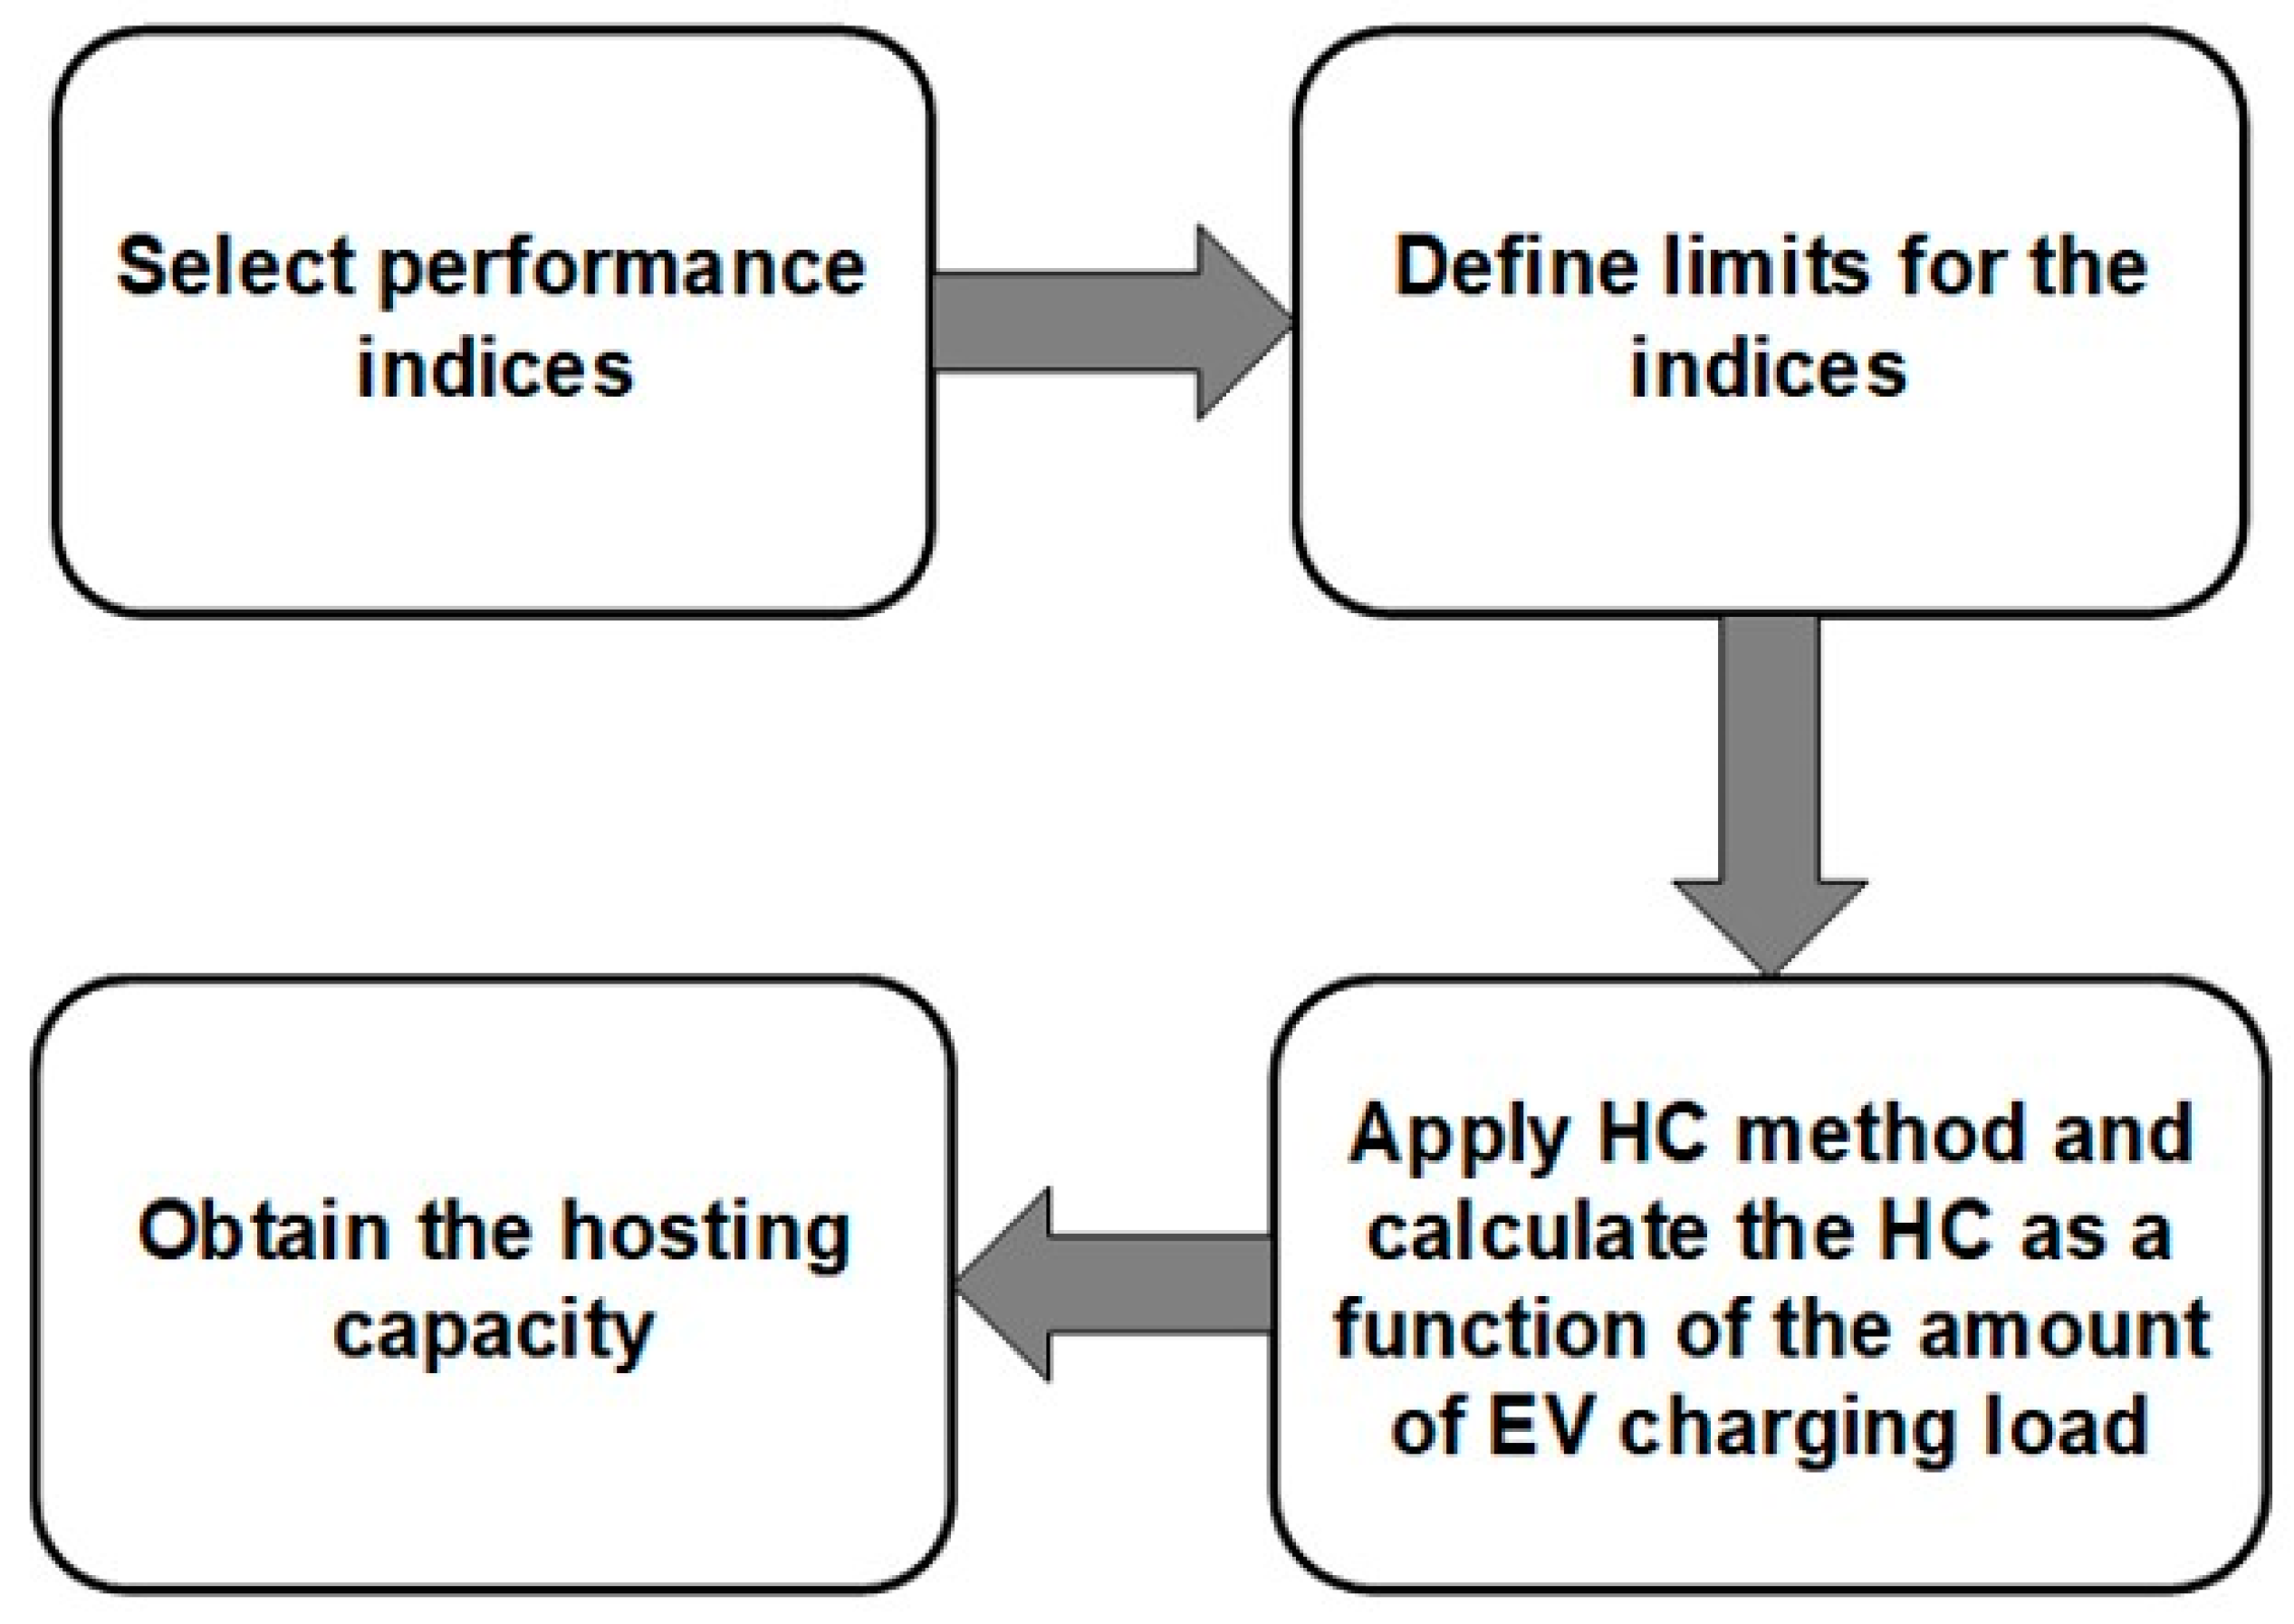
Hosting capacity concept, illustrated in Figure 1, was first introduced in March 2004 [7] as a concept in electrical power systems and was later defined as the amount of new production or consumption that can be connected to the network without risking the reliability or power quality of other customers [8,9]. The HC calculation methodology shown in Figure 2 usually begins by selecting one or more performance indices (PI) such as voltage drop, voltage unbalance, equipment loading, system losses, and harmonics. This is followed by defining a suitable limit for the selected PI as specified by national or international regulatory standards and then applying HC determination methods to estimate the HC of EV charging [10,11]. This will guide the choice of a maximum number of EVs that can be integrated into a distribution network without violating the operational limits of such a network.
The different HC determination methods for EV charging include deterministic, time-series, stochastic and optimization-based HC methods [12,13,14]. The deterministic HC method is straightforward, does not account for uncertainties, and can be used to obtain a quick estimate of the HC, whereas the time-series method uses real system measurements of load and historical time-series profiles with an extensive time scale and high resolution for HC calculation. The stochastic method uses probabilistic load flow to take into account the likelihood that the unknown variables and uncertainties associated with EV charging integration in the distribution network will occur. The optimization-based method treats the HC as an optimization problem with the objective of maximizing EV charging by using optimal power flow techniques [9]. Previous studies have adopted one or more of these methods for HC determination. For instance, ref. [15] used a deterministic method to determine the HC from survey and measurement data. The study applied the limiting factors for a charging period occurring between 6 p.m. and 10 p.m. Likewise, the study in [16] also used the deterministic method to estimate the HC of EV charging in a Swedish LV distribution network containing 13 family houses, with cable loading and voltage drop selected as the limiting factors for different case studies. The results for the particular grid show that 6–11 (46% to 85%) customers can simultaneously charge their EVs of 11 kW before a violation occurs.
A stochastic method is adopted in [2] to determine the single-phase and three-phase HC of two existing distribution networks considering both aleatory and epistemic uncertainties. The study considered background voltage and undervoltage as the limiting factors, with the result showing that EV charging HC sensitivity to the lowest background voltage and highest power consumption. The study reported in [8] applied a Monte Carlo simulation (MCS) that uses limited grid input data to estimate the EV charging HC. Furthermore, some studies have combined different HC determination methods for EV charging HC assessment. The authors in [17] used stochastic and time-series methods to assess the power quality challenges of EV charging using stochastic measured data of EVs. They developed a stochastic harmonic model and usage scenario models, and concluded that transformer loading was the most violated performance limit.
However, since high load variability will occur from the installation of higher power chargers because the EV charging load will ramp up and down over shorter periods, it is important to consider key uncertainties like charging patterns and mode of charging in EV charging HC. The major types of charging strategies adopted to manage the time and frequency of connection to the grid are uncontrolled and controlled charging. The uncontrolled or uncoordinated charging allows vehicle owners to connect their EVs to the grid for charging at any time and disconnect at any time, irrespective of the peak hours and without any intelligent scheduling. The controlled or coordinated charging strategy uses intelligent control and communication between the EVs and the grid to allow the EVs to charge during off-peak hours when the demand is low in order to obtain technical and economic benefits. An uncontrolled charging approach at different penetration levels has the greatest impact on the distribution network [18,19]. The studies in [20] presented a voltage-constrained-based method of estimating the HC of EVs under uncontrolled charging scenarios, while the authors in [21] considered both uncontrolled and controlled charging strategies.
The importance of HC studies makes it necessary for more studies to be conducted on real LV distribution networks. Whereas there is an abundance of studies on solar photovoltaic (PV) HC, there is a dearth of studies on EV charging HC in the South African LV distribution network. It is therefore pertinent that more practical systems be modelled and investigated to contribute directly to knowledge and economy of the locale where the distribution systems are installed. This study helps to fill this research gap by conducting impact assessment and HC studies on an existing LV distribution network in South Africa to help utilities estimate the amount of EV charging that can be allowed in the network. This paper aims to assess the impact of three-phase and single-phase EV charging on the network, determine the HC from the assessment, investigate how the three-phase EV charging HC changes based on different circumstances and also estimate the single-phase HC for different EV charging power. The deterministic and time-series method is used for the three-phase HC determination while a stochastic method based on a simplified Monte Carlo simulation method is adopted for single-phase HC analysis. Voltage drop and equipment loading are the two PIs considered in this study, and their limit is set according to the South African standard NRS097 [10].

2. Methodology

This section briefly describes the method adopted for modelling different components of the grid and the simulation procedures for three-phase and single-phase EV charge impact assessment and HC estimation.

2.1. Test Network

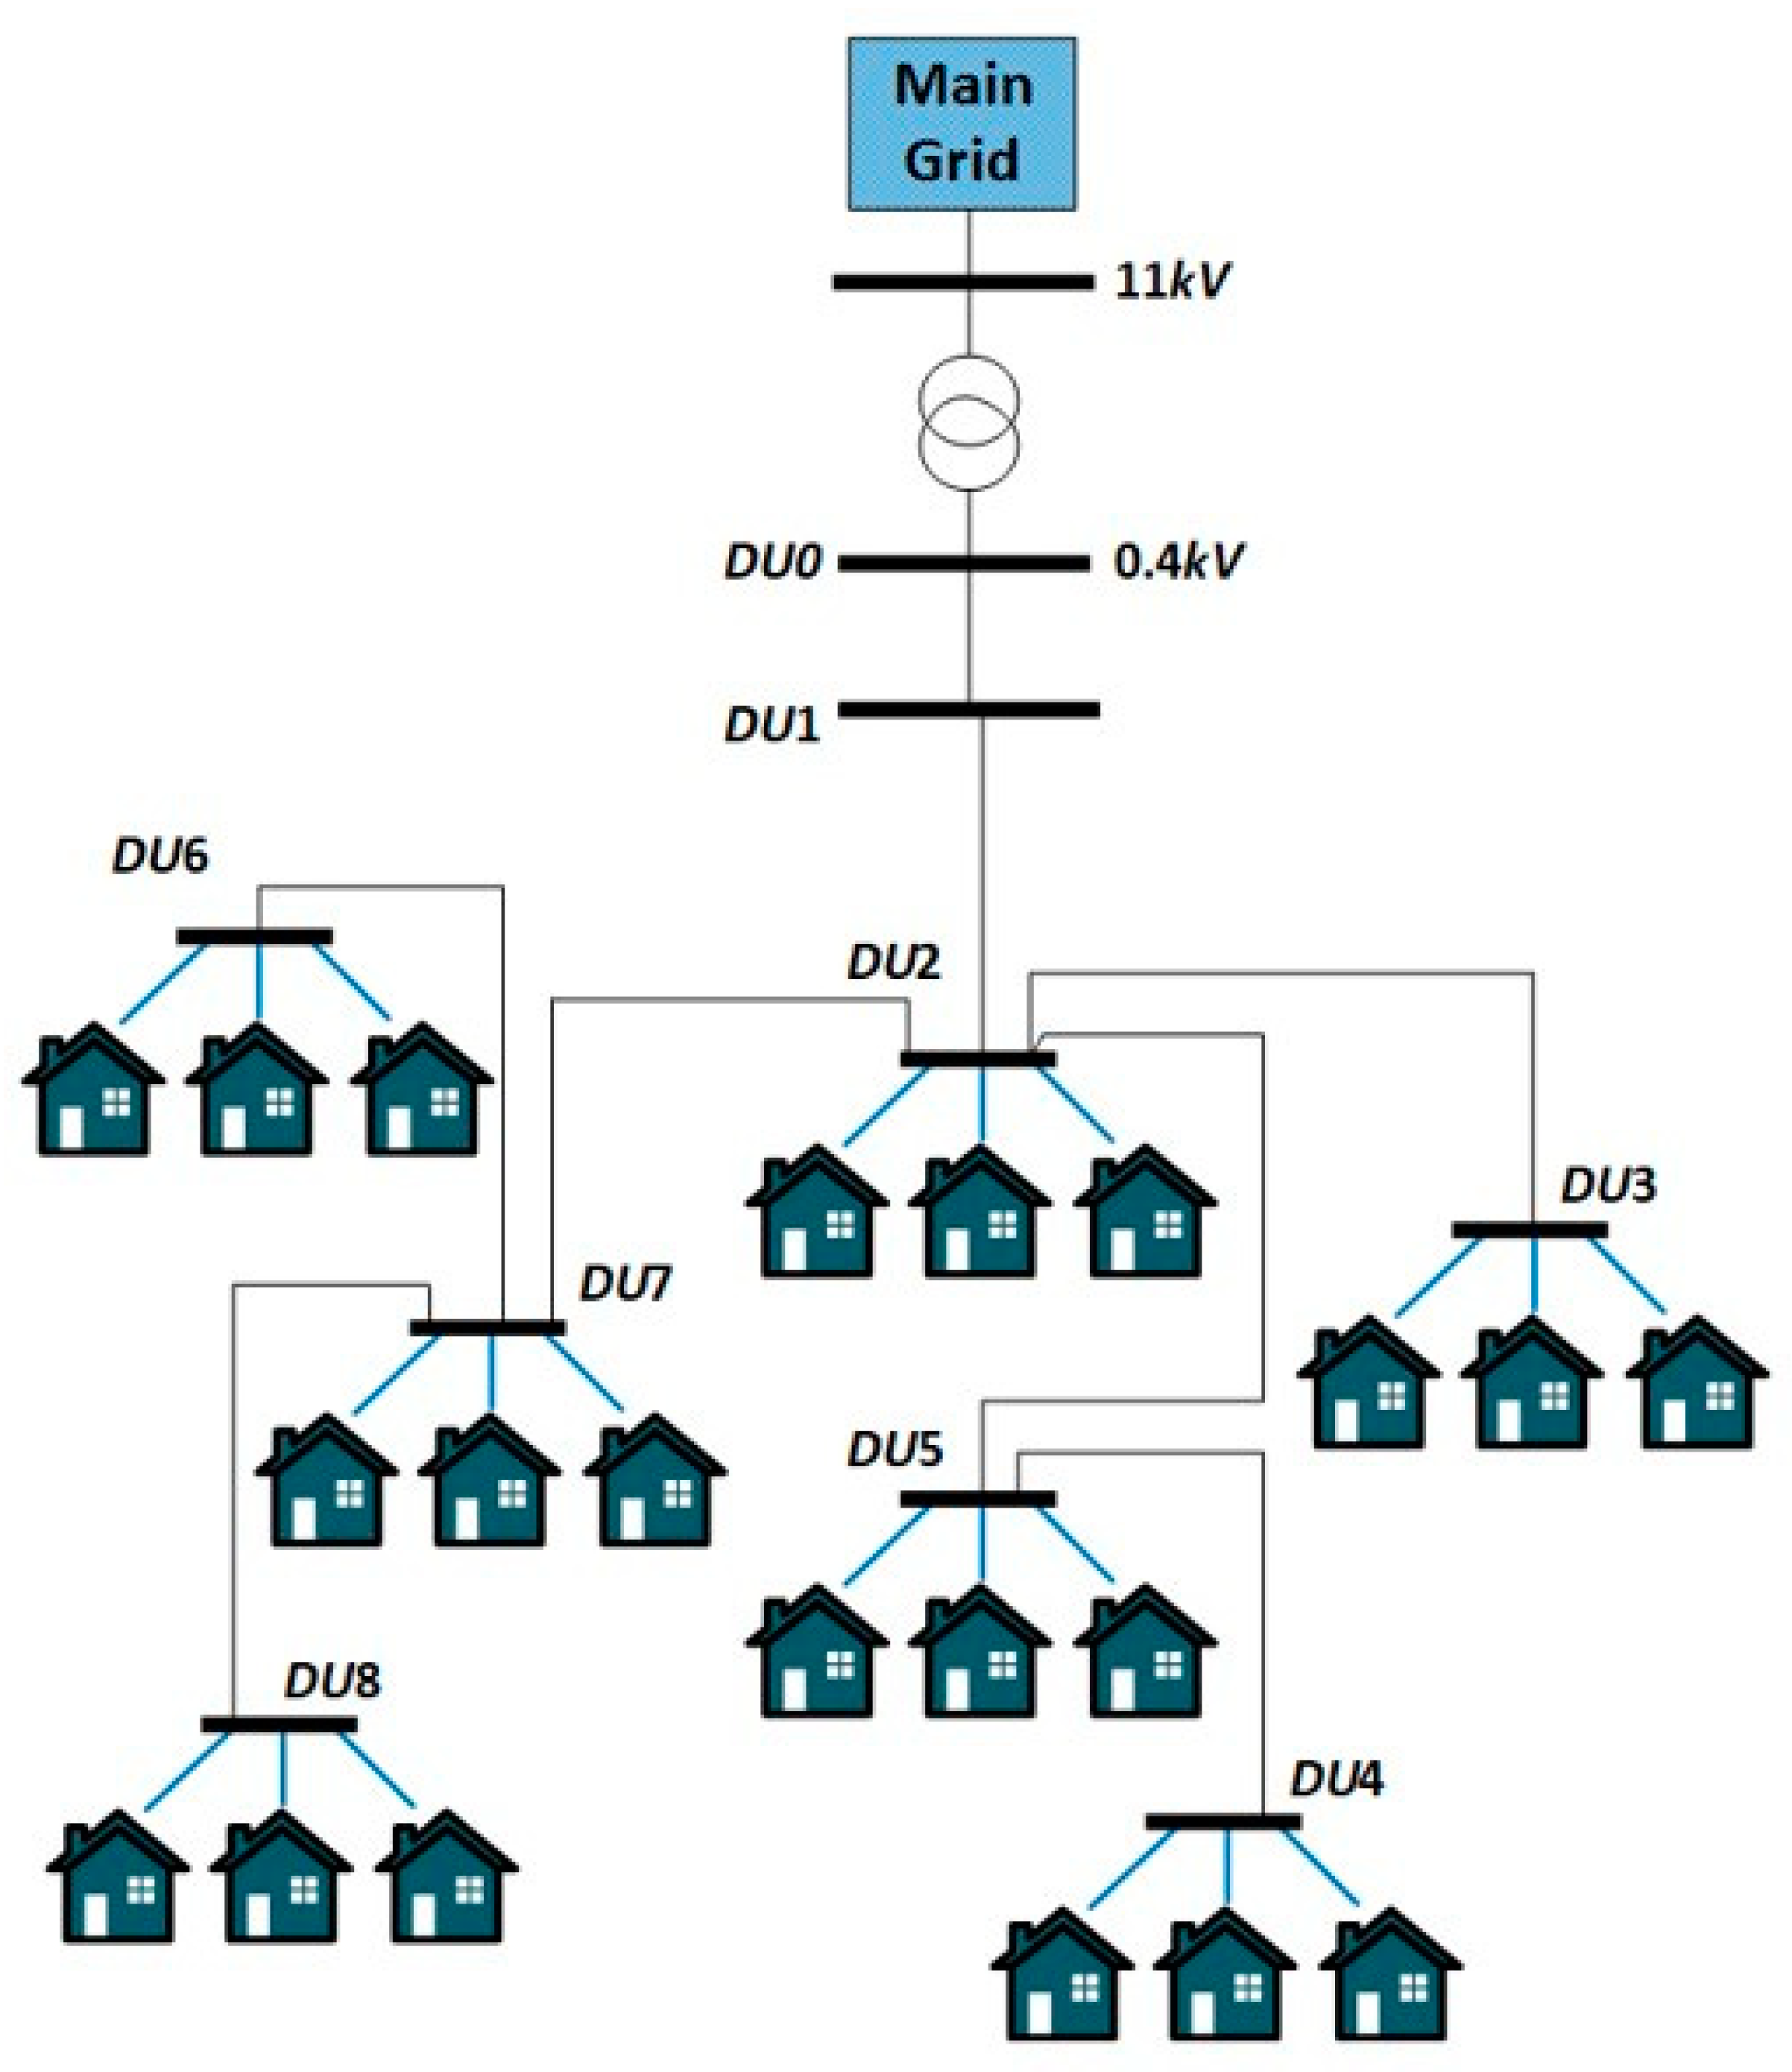
The test LV distribution network used for this study is part of an eThekwini power grid. The studied area is a housing development in Durban, South Africa consisting of 21 high-income homes, each with the potential for owning EVs. Figure 3 shows a single line diagram of the studied grid. The grid is supplied by a 350 kVA 11/0.41 kV Dyn11 transformer, and the cable characteristics are detailed in Table 1. Every household represents a customer and is evenly allocated on a customer distribution unit (DU) resulting in three customers per DU. It was assumed that each customer is capable of connecting only one EV to the grid.

2.2. Load Modeling

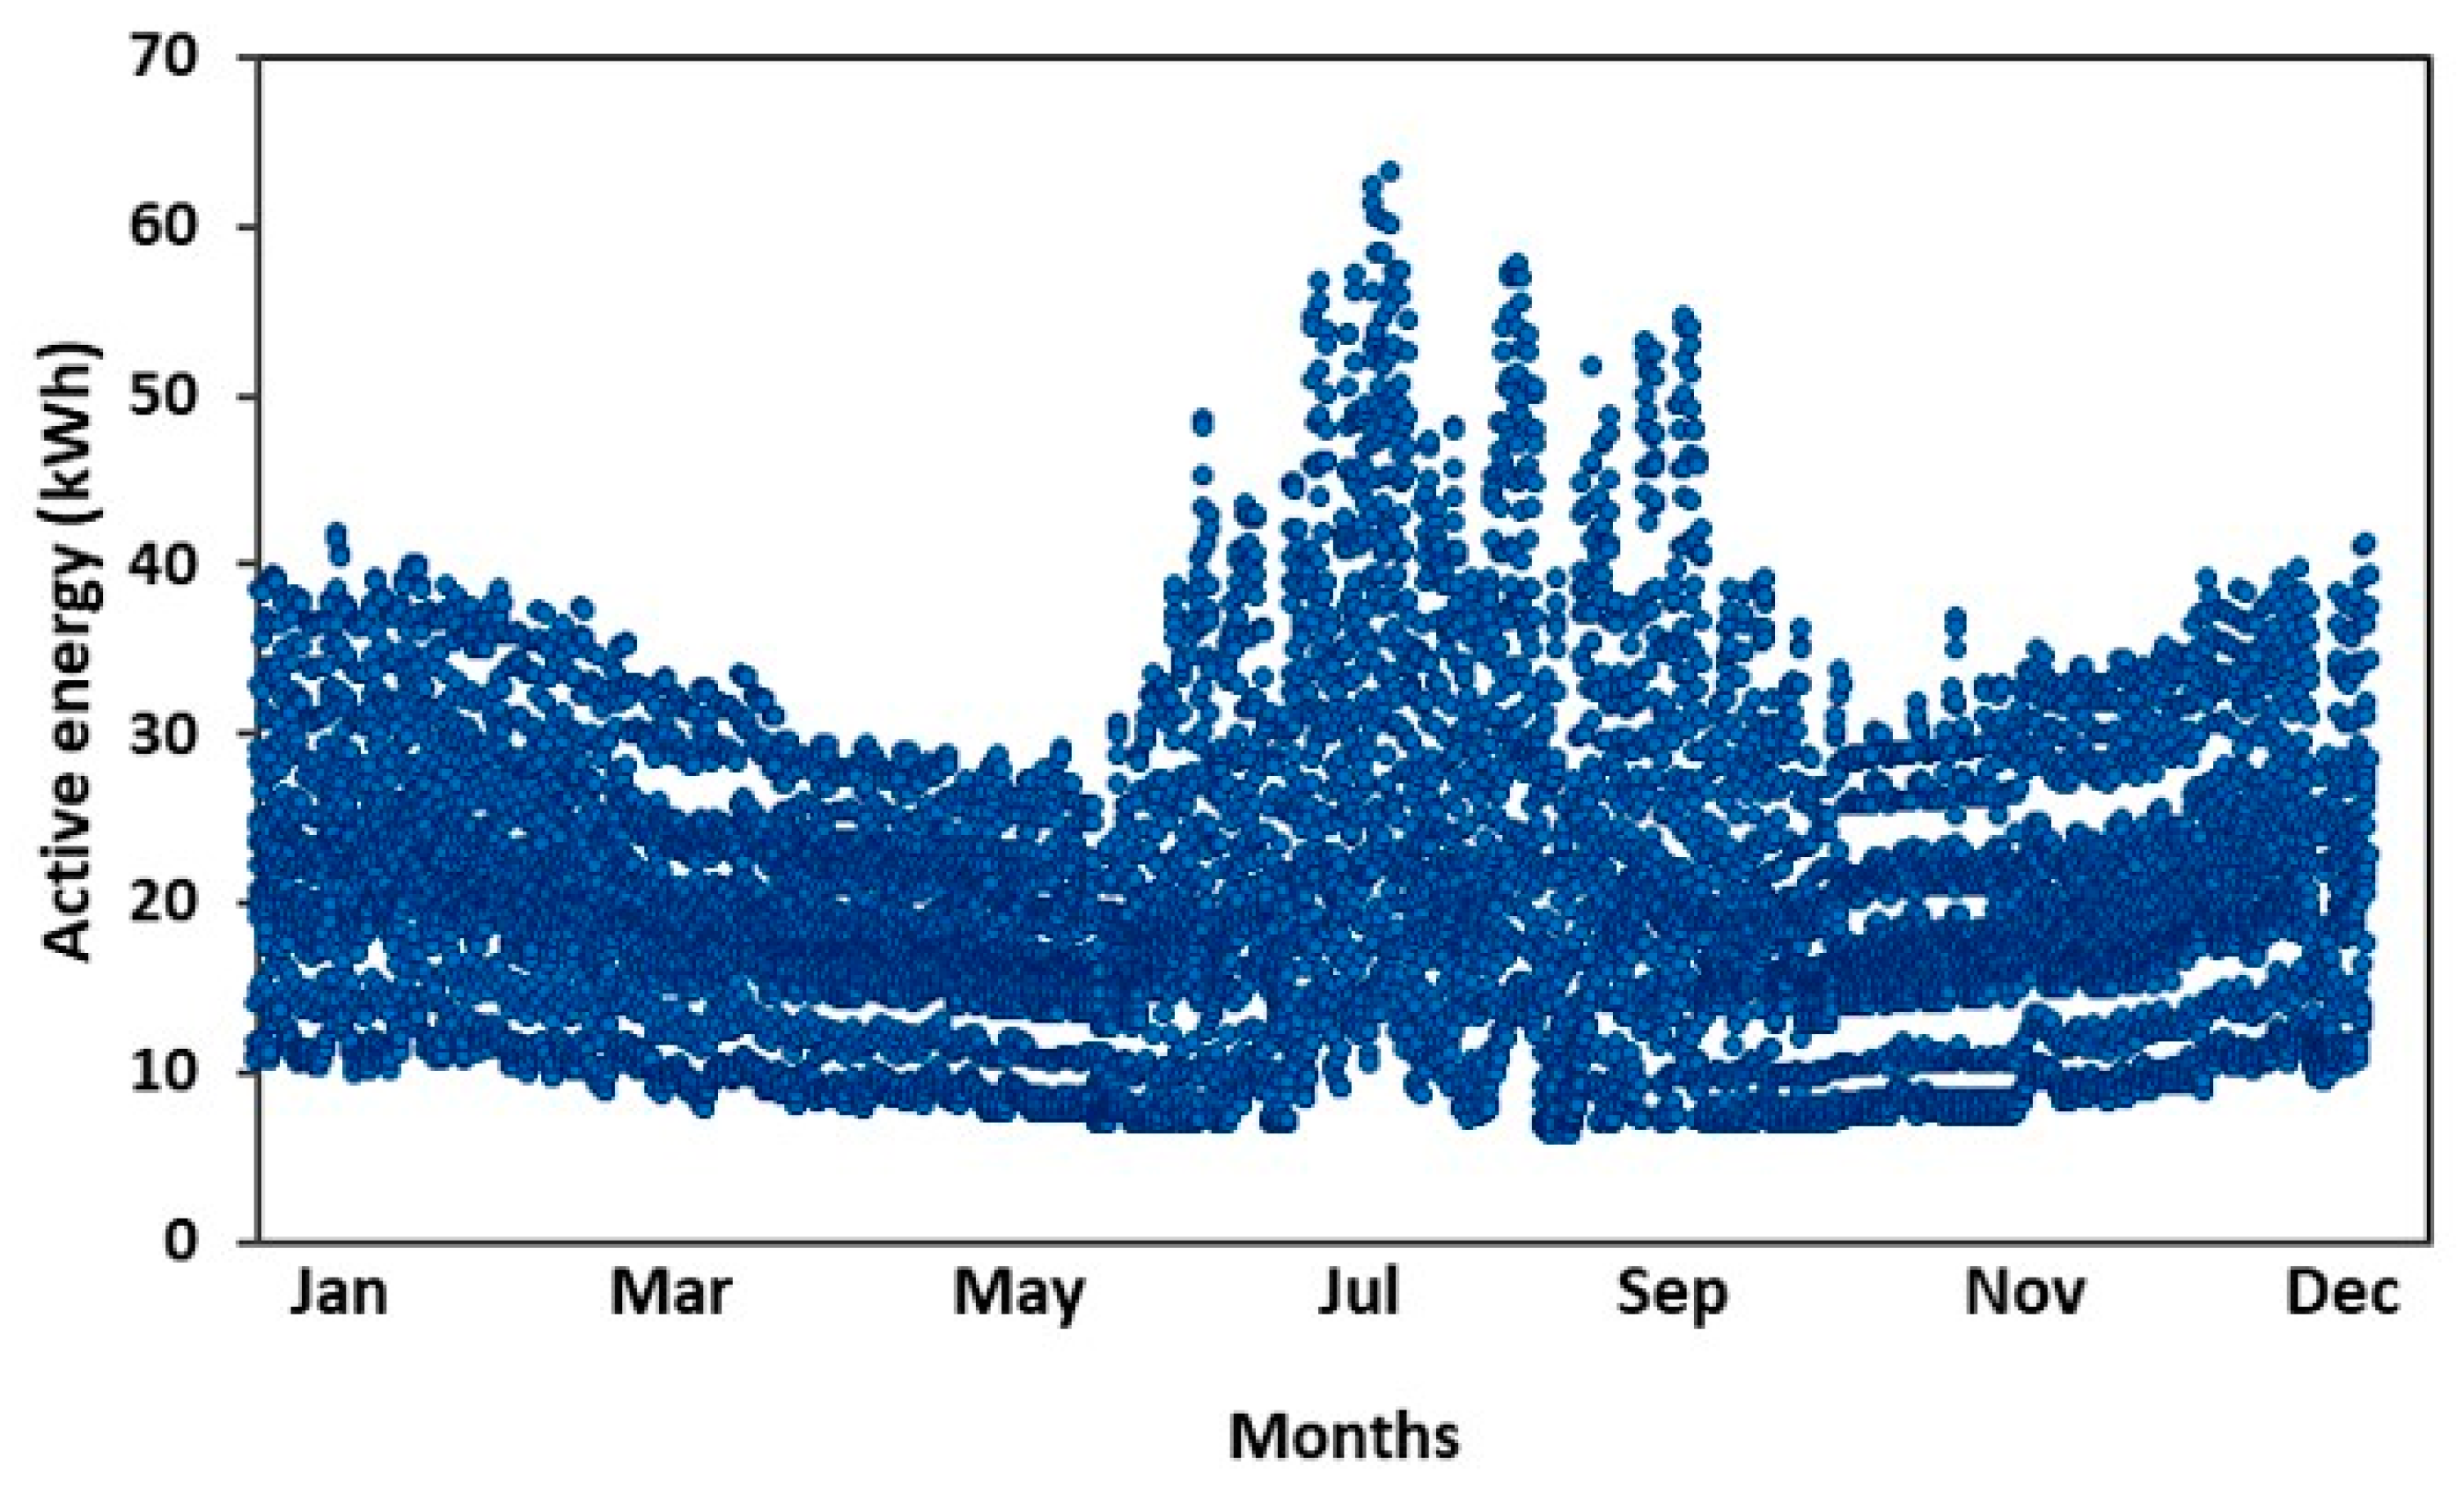
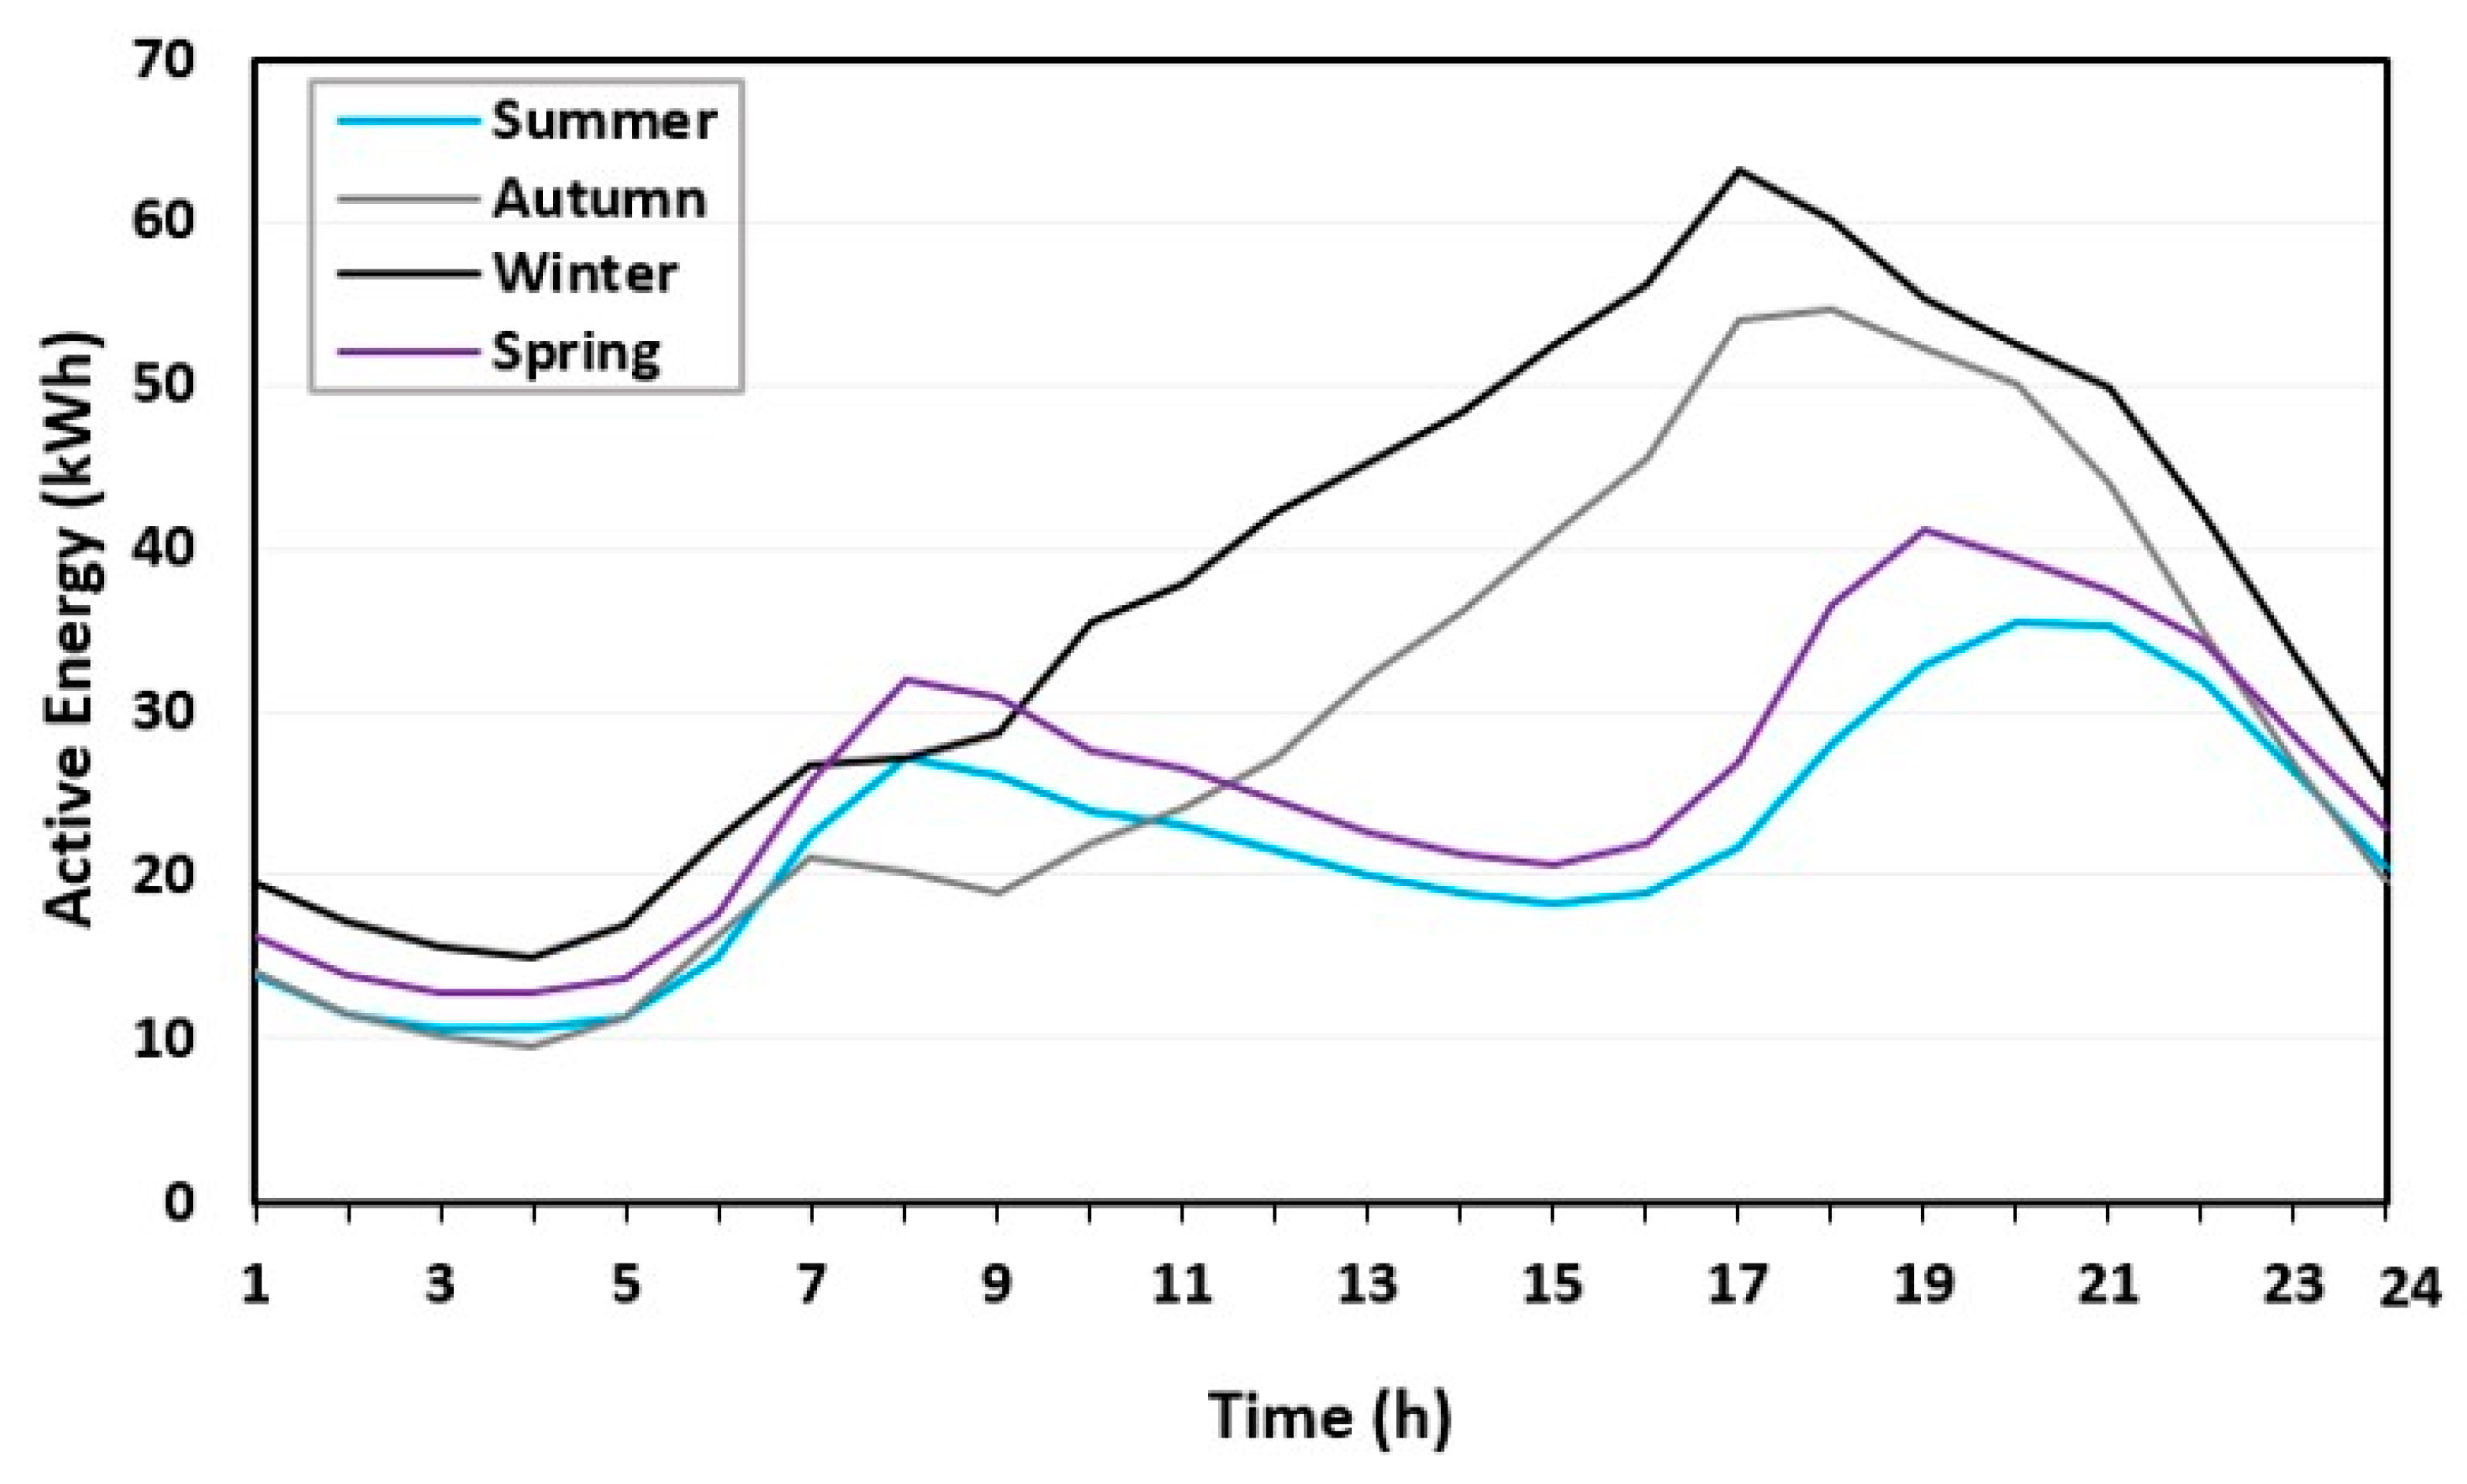
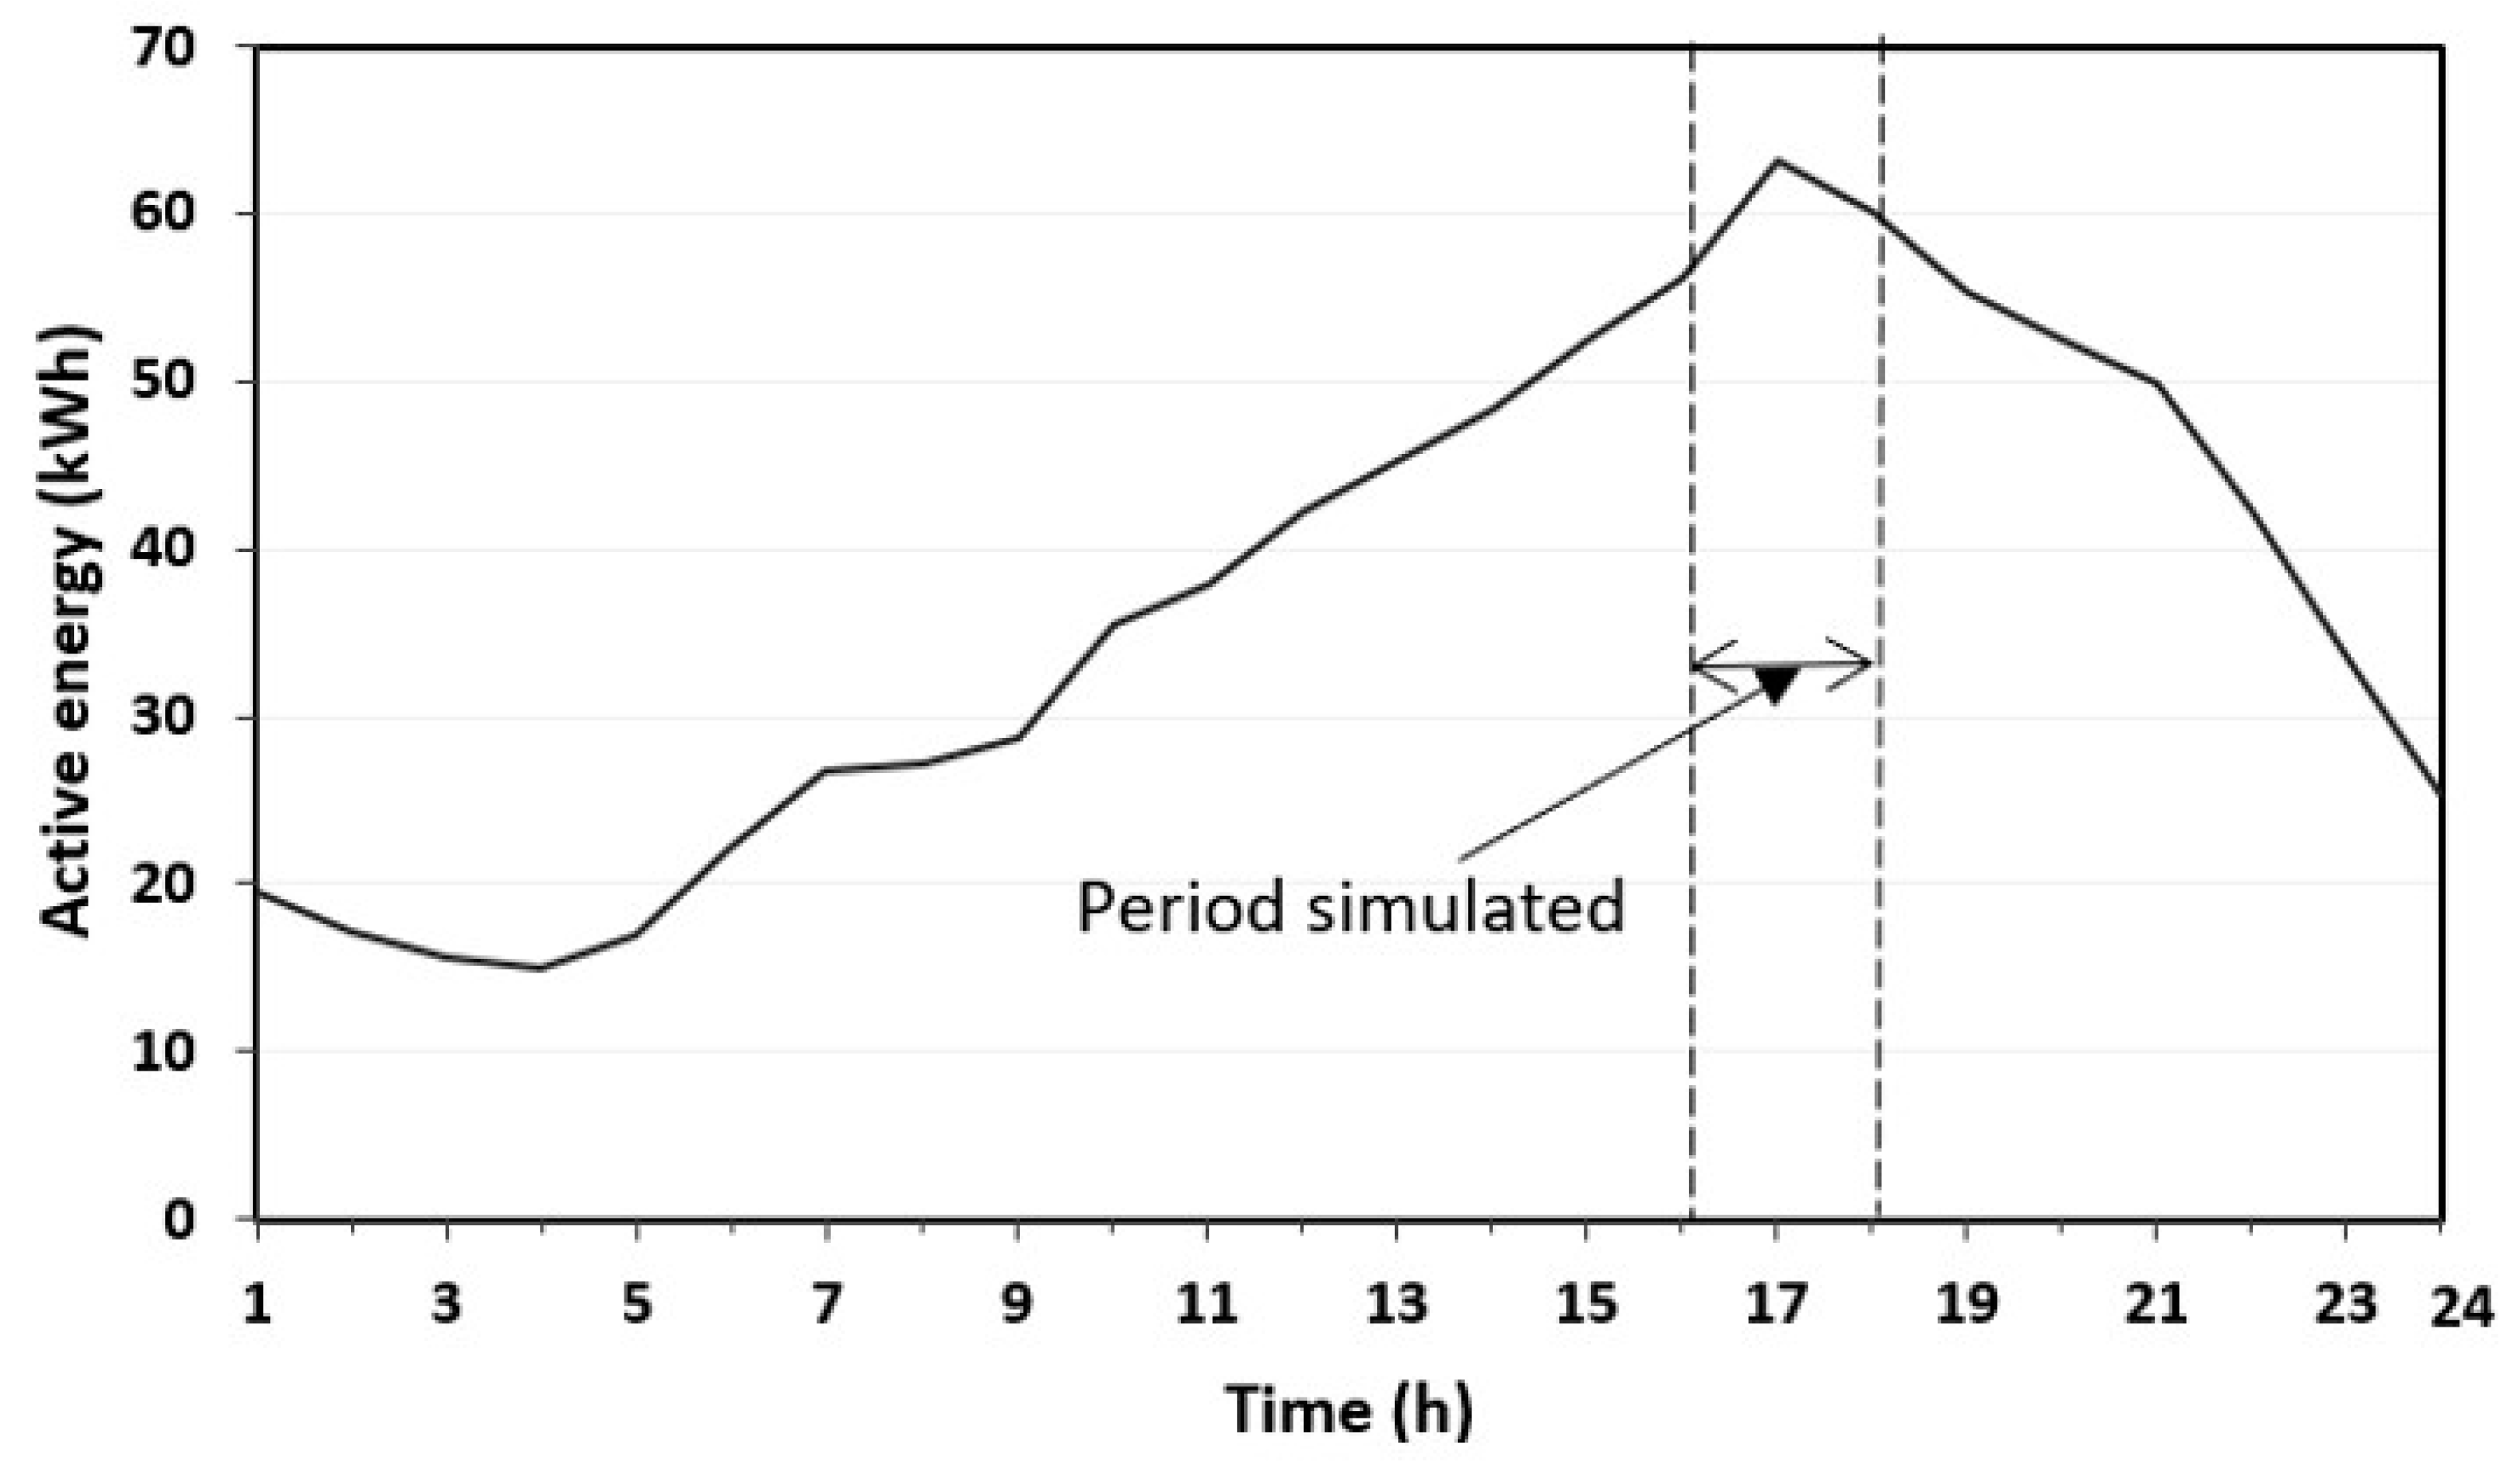
The historical time-series load data available for the studied grid are one calendar year (2021) measured hourly average active energy (kWh) for all the 21 customers in the distribution network obtained from the eThekwini Municipality, the distribution network operator. Figure 4 shows the aggregated historical time-series load data used to model the studied grid with peak consumption observed in July. Figure 5 shows the seasonal load profile across each season of the year. It can be observed that the highest consumption occurred during the winter season, with 15 July 2021 being set as the critical day with the highest consumption, which is subsequently used as the simulated period for single-phase EV charging HC assessment. Since information about the load consumption of individual households is not available and all customers are assumed to be of the same class with the same consumption pattern, the load scaling method is applied to estimate the load for each consumer. Load scaling is a top-down method of estimating the load distributed along a feeder, to sum up to the known measurement at the beginning of the feeder. It is a standard feature in DIgSILENT PowerFactory 2022 software.

2.3. EV Charging Power

The hosting capacity was initially estimated for the most popular EV chargers with charging power of 3.7 kW single phase and 11 kW three-phase, corresponding to a 16-A fuse. However, since utilities in South Africa have not yet specified the allowable EV chargers on the grid, other single-phase charging powers considered included 4.6, 5.75, 6.9, 9.2, and 11.5 kW chargers, corresponding to 20, 25, 30, 40, and 50-A fuses, respectively [22]. The HC for 22 kW three-phase charging power was also evaluated. Each household on the network was modeled as an EV candidate with equal chances of installing any of the chargers. EV charging was considered an addition to the domestic load, and an uncontrolled charging pattern was assumed without considering the state of charge of the battery.

2.4. Penetration Level, Hosting Capacity and Operational Limits

The penetration level in this study was defined as the ratio total number of customers equipped with EVs to the total number of customers in the area under study as formulated in Equation (1). Hosting capacity was defined as the number of customers on the LV distribution network that can charge their EV simultaneously without violating an operational limit. The performance indices considered were voltage drop and equipment loading with their operational limit set according to the South African standard NRS097. The limit of the equipment loading (cables and transformer) was set to 100% while the voltage must not be below 0.90 p.u. of the nominal voltage. These two performance indices were considered to be the leading limiting factor for the grid integration of electric vehicles.
P L E V = C u s t o m e r s   c h a r g i n g   t h e i r   E V s T o t a l   n u m b e r   o f   c u s t o m e r s   o n   t h e   n e t w o r k   100 %

2.5. Simulation Procedure

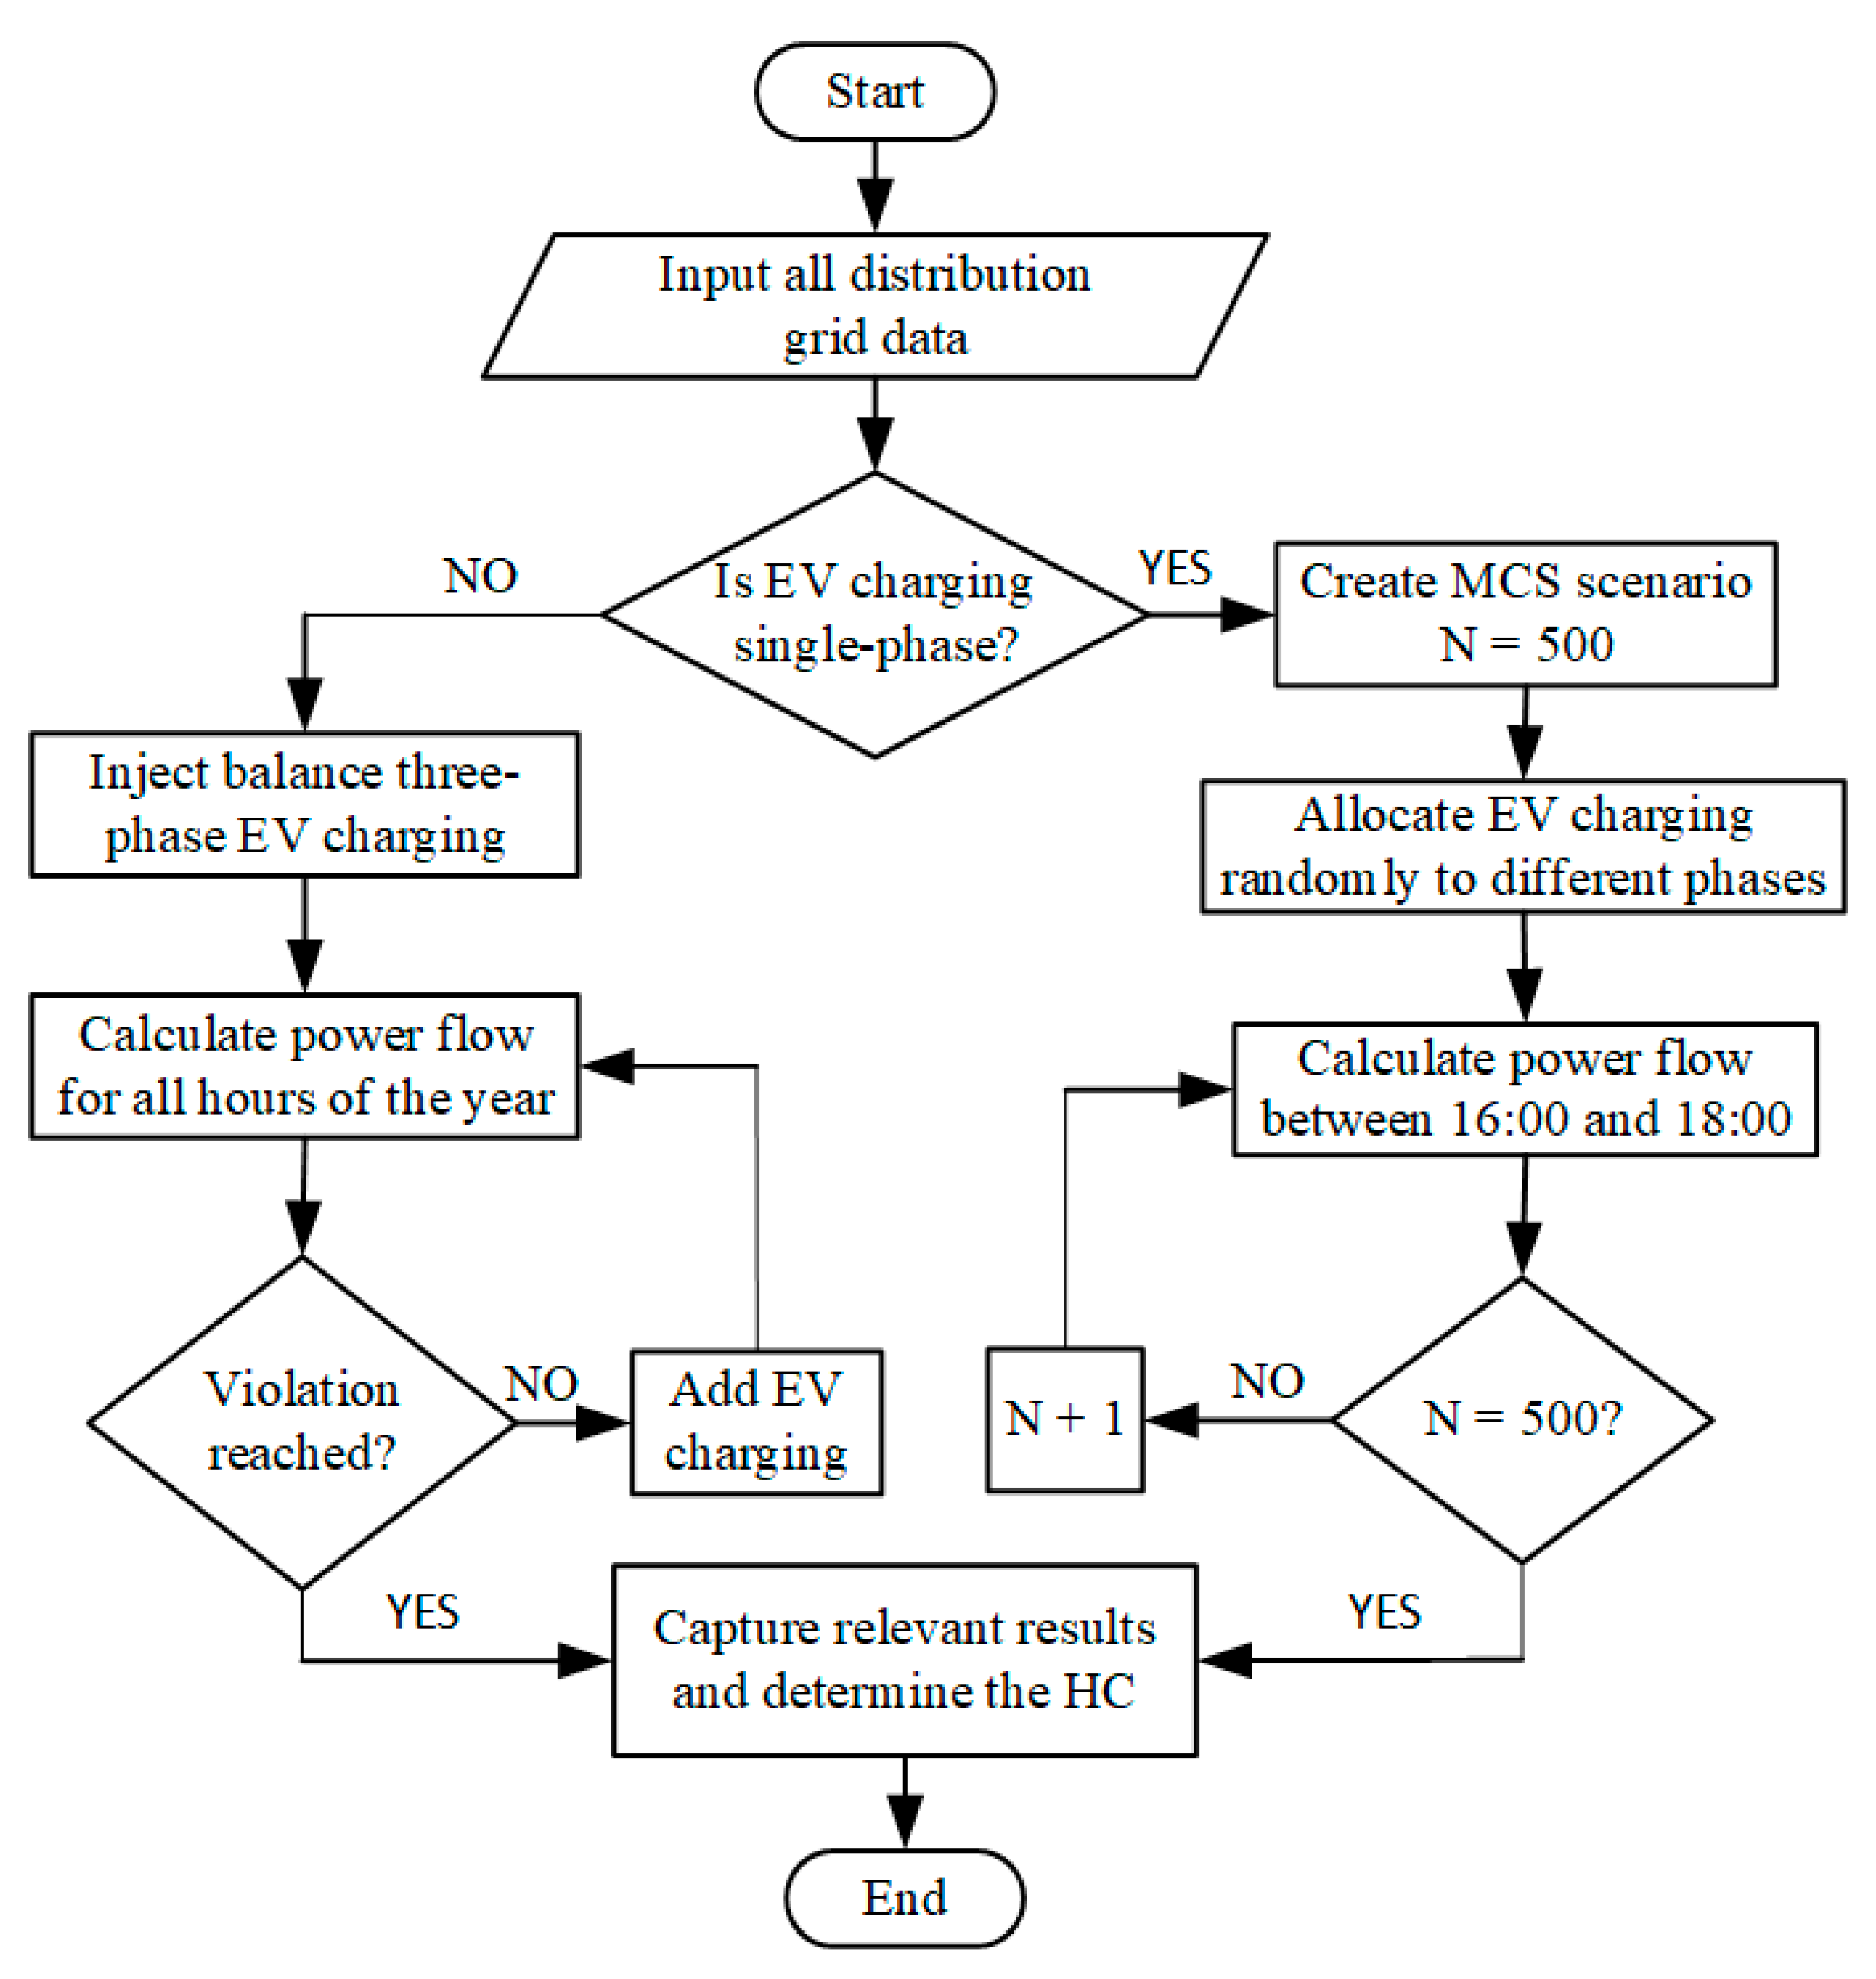
DIgSILENT PowerFactory was the software used to model the grid and carry out power flow simulations. Grid data obtained from the utility were used as input to the model. The historical time-series load data were assigned at the beginning of the feeder and scaled equally to the customers, who are all classified as high-income customers. The HC for three-phase and single-phase EV charging using the time-series method and the stochastic method based on a simplified Monte Carlo simulation (MCS) method, respectively, was performed following the flowchart in Figure 6. An initial baseline power flow was conducted without the addition of EV charging to assess the voltages at different terminals. A deterministic method was used to determine the location of EV charging. This was performed by creating a priority list from the result of the baseline power flow and applying the list in both forward and backward directions to decide which customer the EV charging load would be added on first and so on. The forward application of the list was termed the “worst case” and began with the customers having the highest voltage drop. The backward application was termed the “best case” and began with customers having the lowest voltage drop. Two case studies were considered in this study and are described in the following subsection.

2.5.1. Case Study 1: Hosting Capacity of Balanced Three-Phase EV Charging

This case study evaluated the impact of three-phase EV charging, estimates the HC and examined how the HC changes throughout the year and how the location of EV charging affected the change. Historical load data for all hours of the year were used to conduct the power flow simulations. The EV charging power (11 kW and 22 kW) was added to each household and was simulated as a constant power load, balanced across the three phases. EV charging power was added to one customer at a time for every simulation based on the priority list for either the worst-case or best-case scenario. The process was iterated until the first violation of either voltage or loading limits, and the HC was obtained.

2.5.2. Case Study 2: Hosting Capacity of Single-Phase EV Charging in an Unbalanced Network

This case study assessed the impact of single-phase EV charging on the LV distribution network and estimated the HC. A stochastic method was adopted with phase selection as the only uncertainty considered. A simplified MCS first introduced in [23] for PV hosting capacity studies that use minimum available data and reduces simulation time was adapted and used in this study. The method was used to randomly assign the phase to each customer at every addition of the EV charging load. Three power flow simulations were performed for each scenario for the period of interest (critical day), indicated in Figure 7 (1 h resolution from 16:00 and 18:00). According to [24], EV charging will have the greatest impact on the distribution grid when there is peak household demand. Therefore, this period with the highest consumption throughout the year was chosen, and it was assumed that if there was no violation during this period, it was likely that there would not be in other periods. The procedure was repeated for 500 MCS scenarios and the result of interest was captured.

3. Results and Discussion

The method in Section 2 is applied to the 21-customer LV distribution network in Figure 1. The impact assessment and HC results for the different case studies for voltage drop and equipment loading are presented in this section.

3.1. Three-Phase Impact Assessment and HC

3.1.1. Impact on Voltage Drop

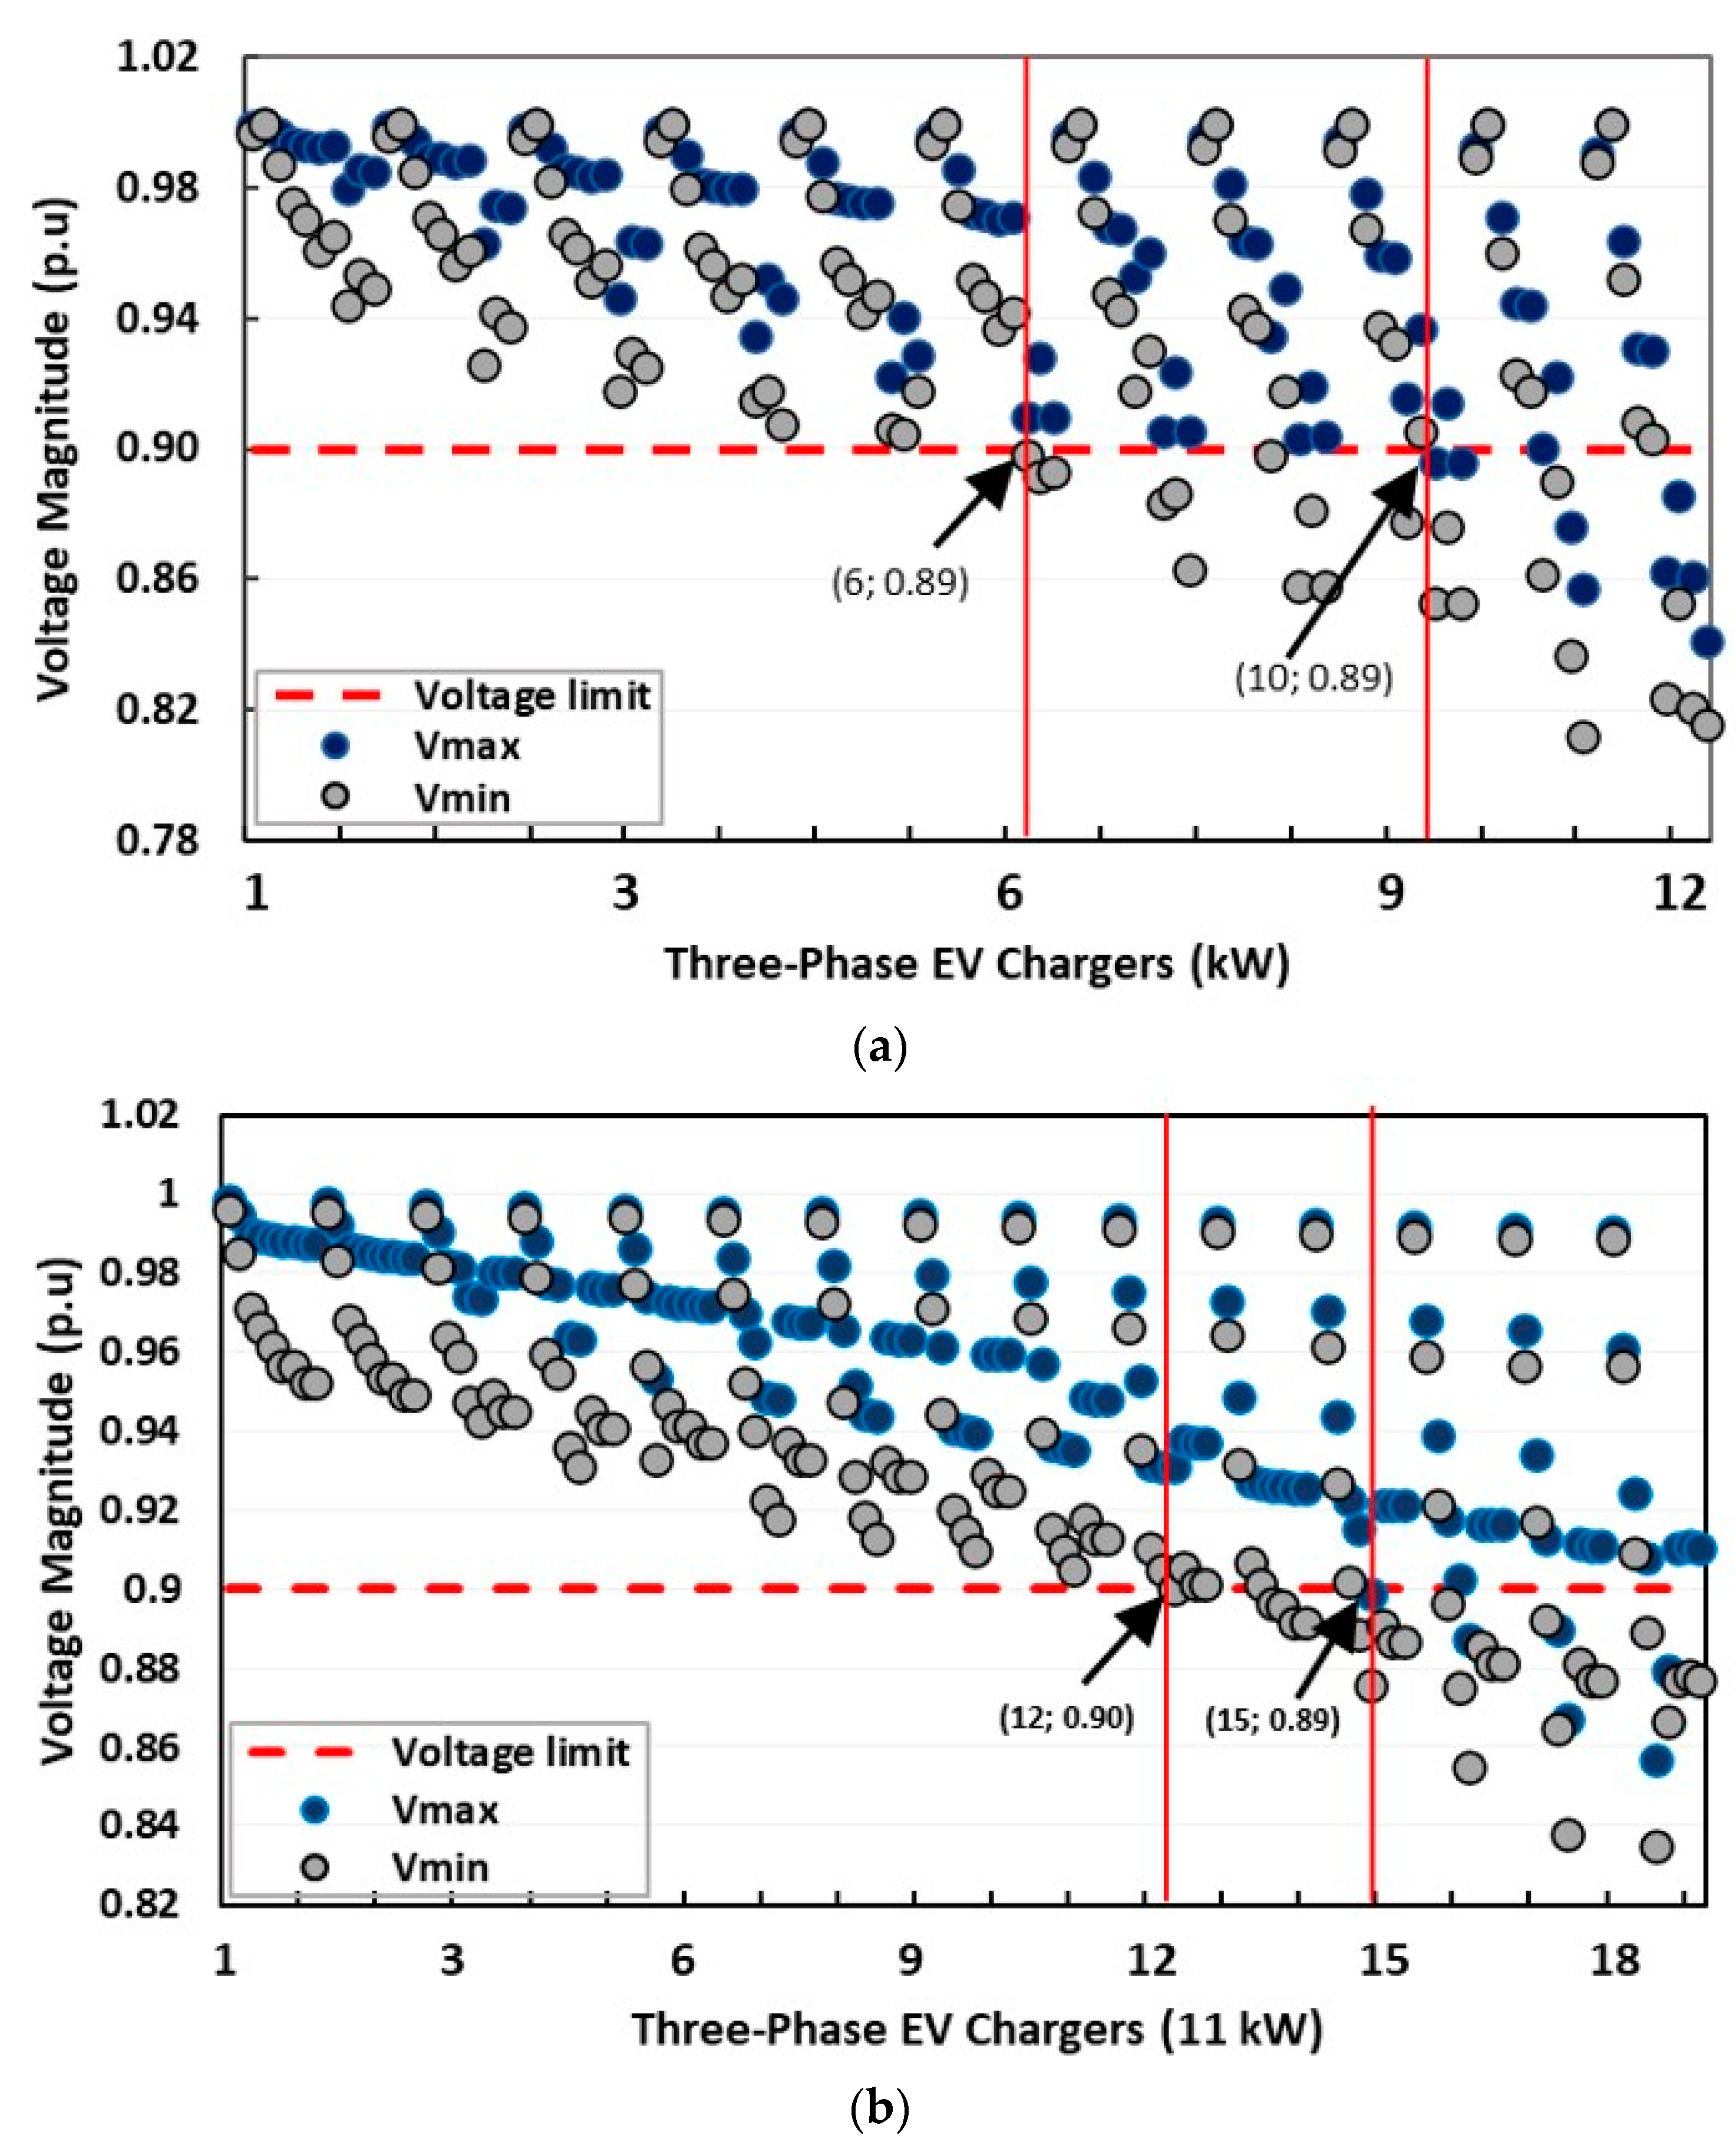
The voltage profile in the network when EVs are connected for the worst-case and best-case scenarios is shown in Figure 8a,b, respectively. The scattered plot demonstrates the relationship between the maximum and minimum feeder voltages at each busbar and the penetration of EV charging in the test LV network. Each dot in the figures shows maximum and minimum voltages at the different busbars in the network as the allocation of EV charging is gradually increased. It is observed that an increase in the penetration level of EVs ( P L E V ) decreases the feeder voltages towards the lower limit. For the worst-case scenario shown in Figure 8a, the first violation is observed at 29% P L E V when six customers are simultaneously charging. Due to load variations, more customers can charge at hours of lower household load demand until both minimum and maximum voltages exceed the limits when nine EVs (43% P L E V ) are simultaneously charging. At this point, there will always be a violation, irrespective of the time of year. Figure 8b shows the best-case scenario where the first violation is observed at 57% P L E V , when 12 EVs are simultaneously charging. At 71% P L E V (15 EVs simultaneously charging) and beyond, there will always be a violation for every hour of the year.

3.1.2. Impact on Loading

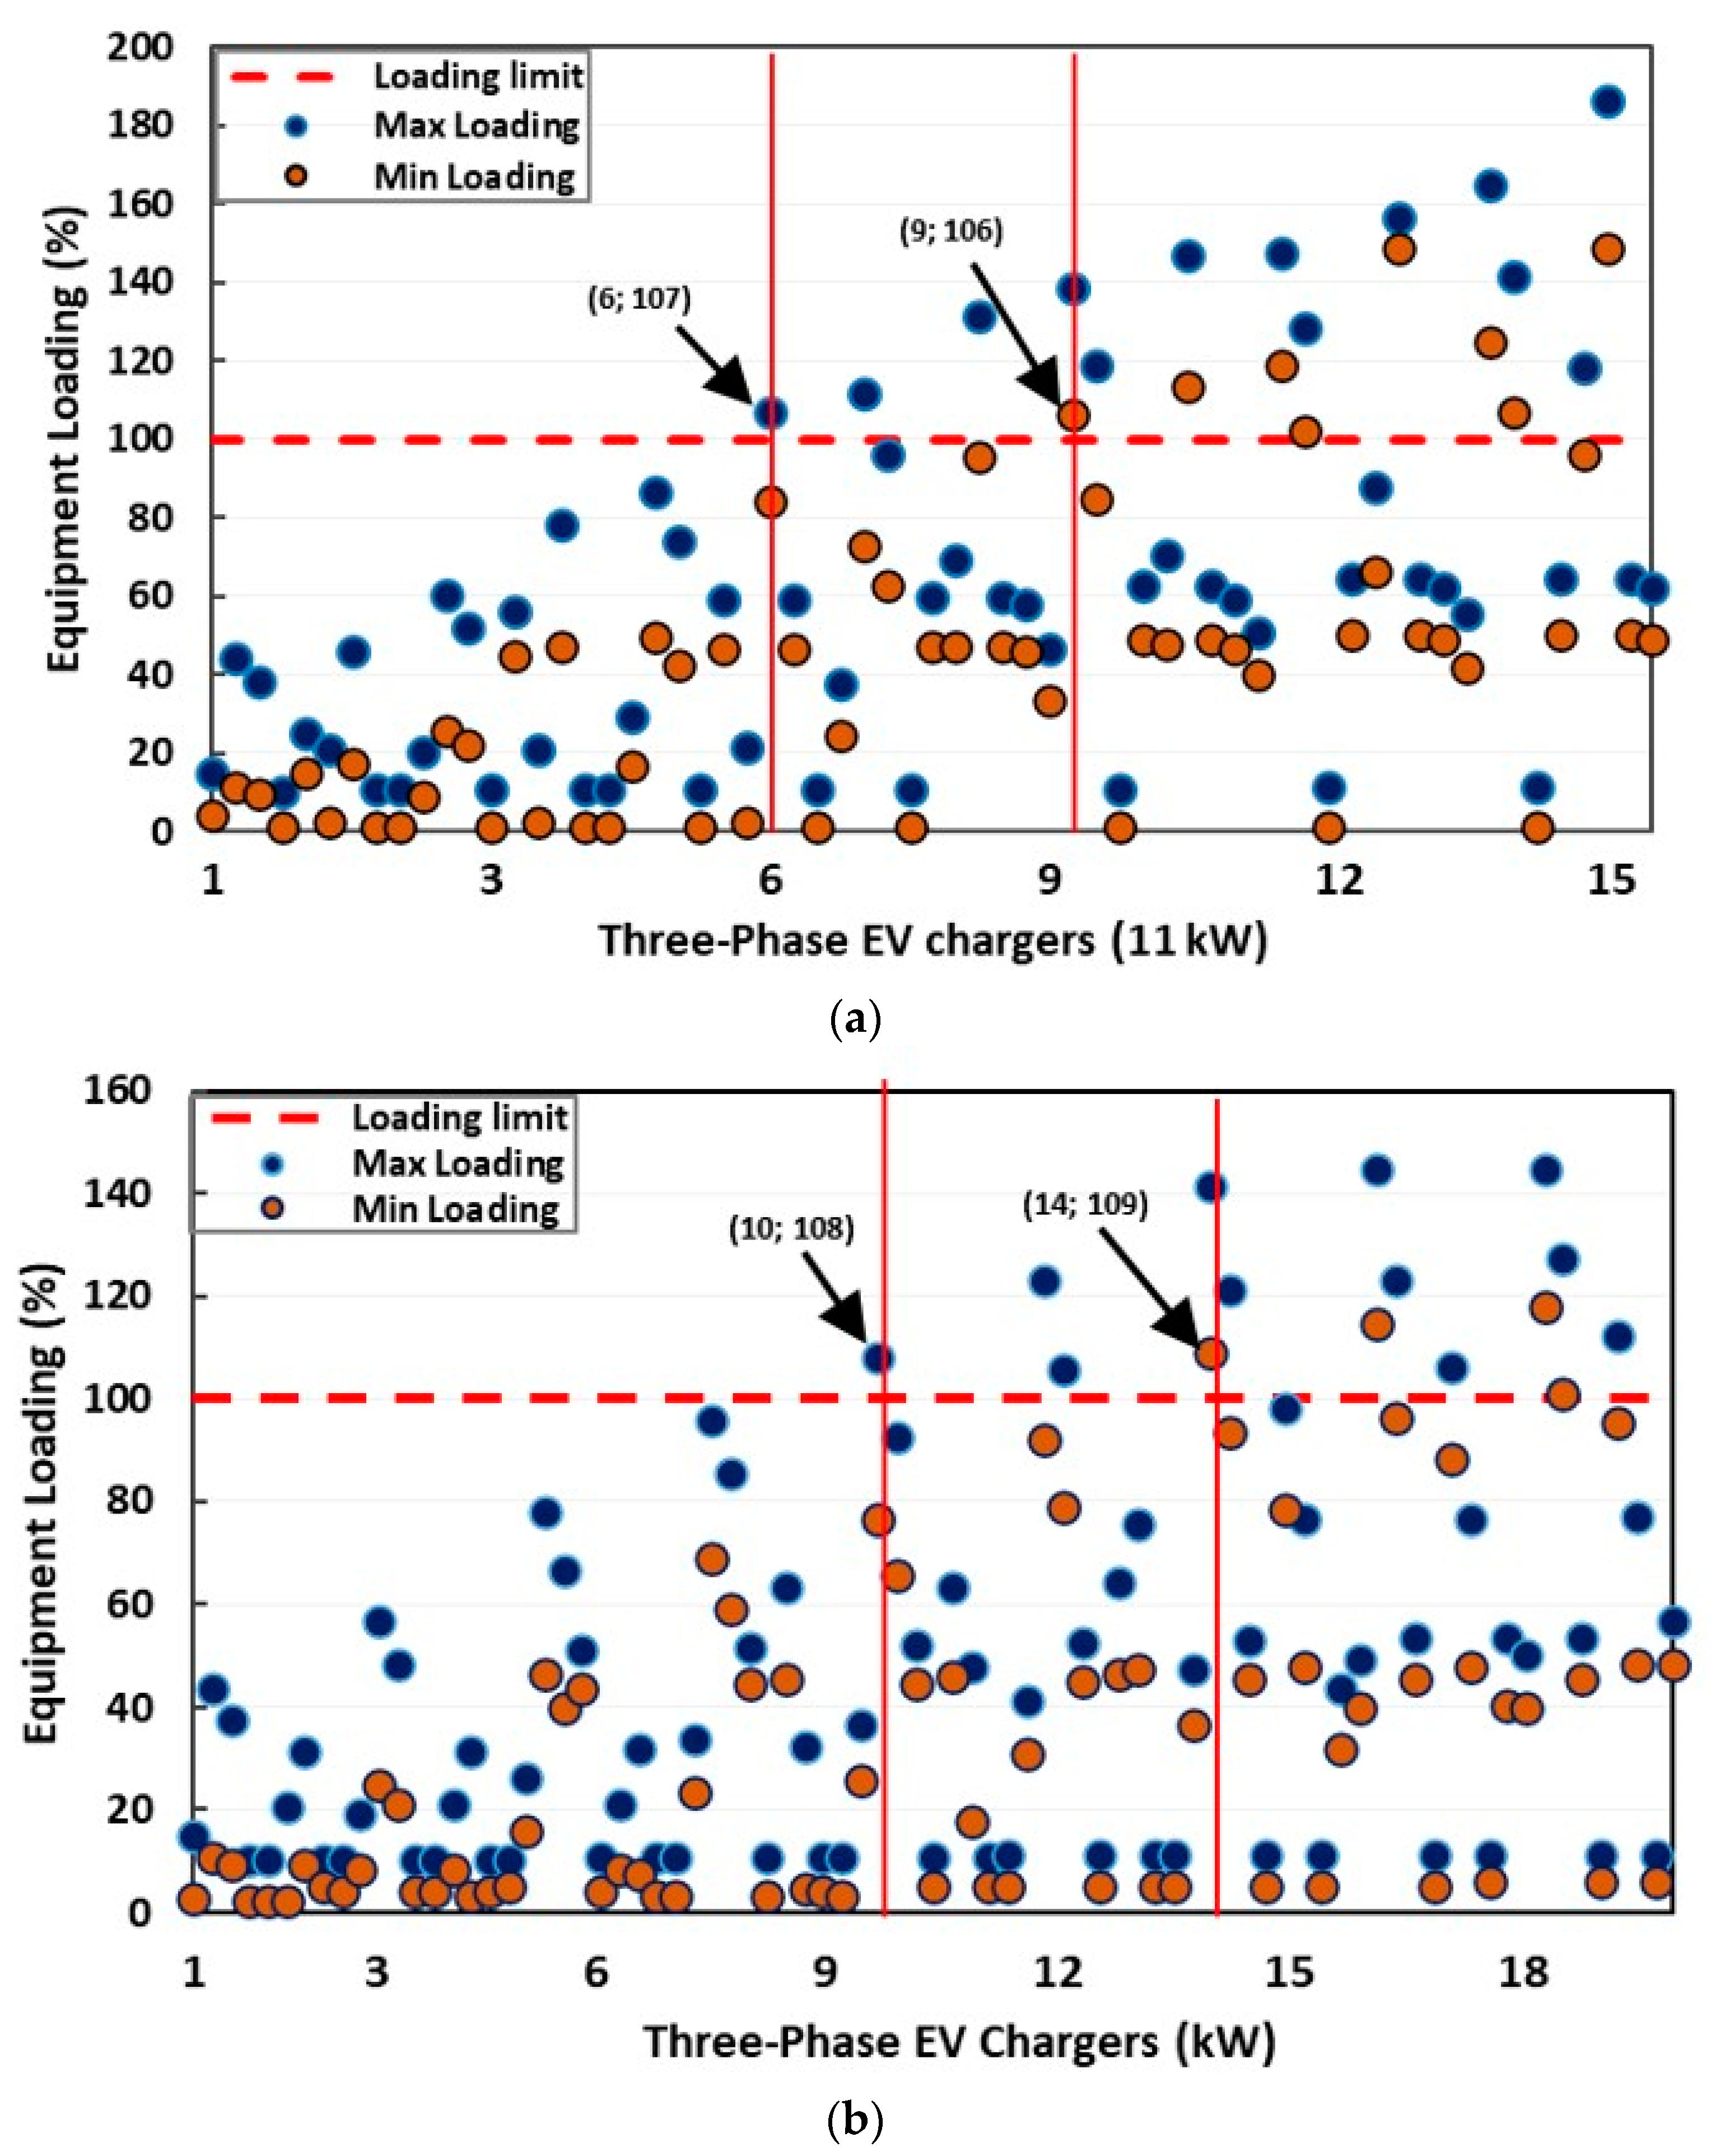
The scatter plot in Figure 9a,b shows the maximum and minimum equipment loading for the worse-case and best-case scenario, respectively, for all the hours of the year simulated as the P L E V is varied. The equipment considered are the cables and the transformer and the dots represent the maximum and minimum values for each during the period of simulation. It is observed that increasing the penetration level result in a corresponding increase in the equipment loading towards the allowable limit. In the worst-case scenario in Figure 9a, the first violation at 108% equipment loading is observed at 29% P L E V , when six customers are simultaneously charging their EVs. More customers can charge at hours of lower household load demand until both minimum and maximum equipment loading exceed the limits when nine EVs (43% P L E V ) are simultaneously charging. The best-case scenario in Figure 9b shows the first violation at 107% equipment loading when 10 customers (48% P L E V ) are simultaneously charging. At 67% P L E V (14 customers) and beyond, there will always be a violation for every hour of the year.

3.1.3. Hosting Capacity Estimation

The range of values for the hosting capacity of the balanced three-phase network obtained from the impact assessment conducted is 5–8 customers and 9–13 customers for the worst-case and best-case scenario, respectively. This range is generally considering all hours of the year and all the performance indices. However, further analysis is carried out to estimate the seasonal and yearly variations in HC values.
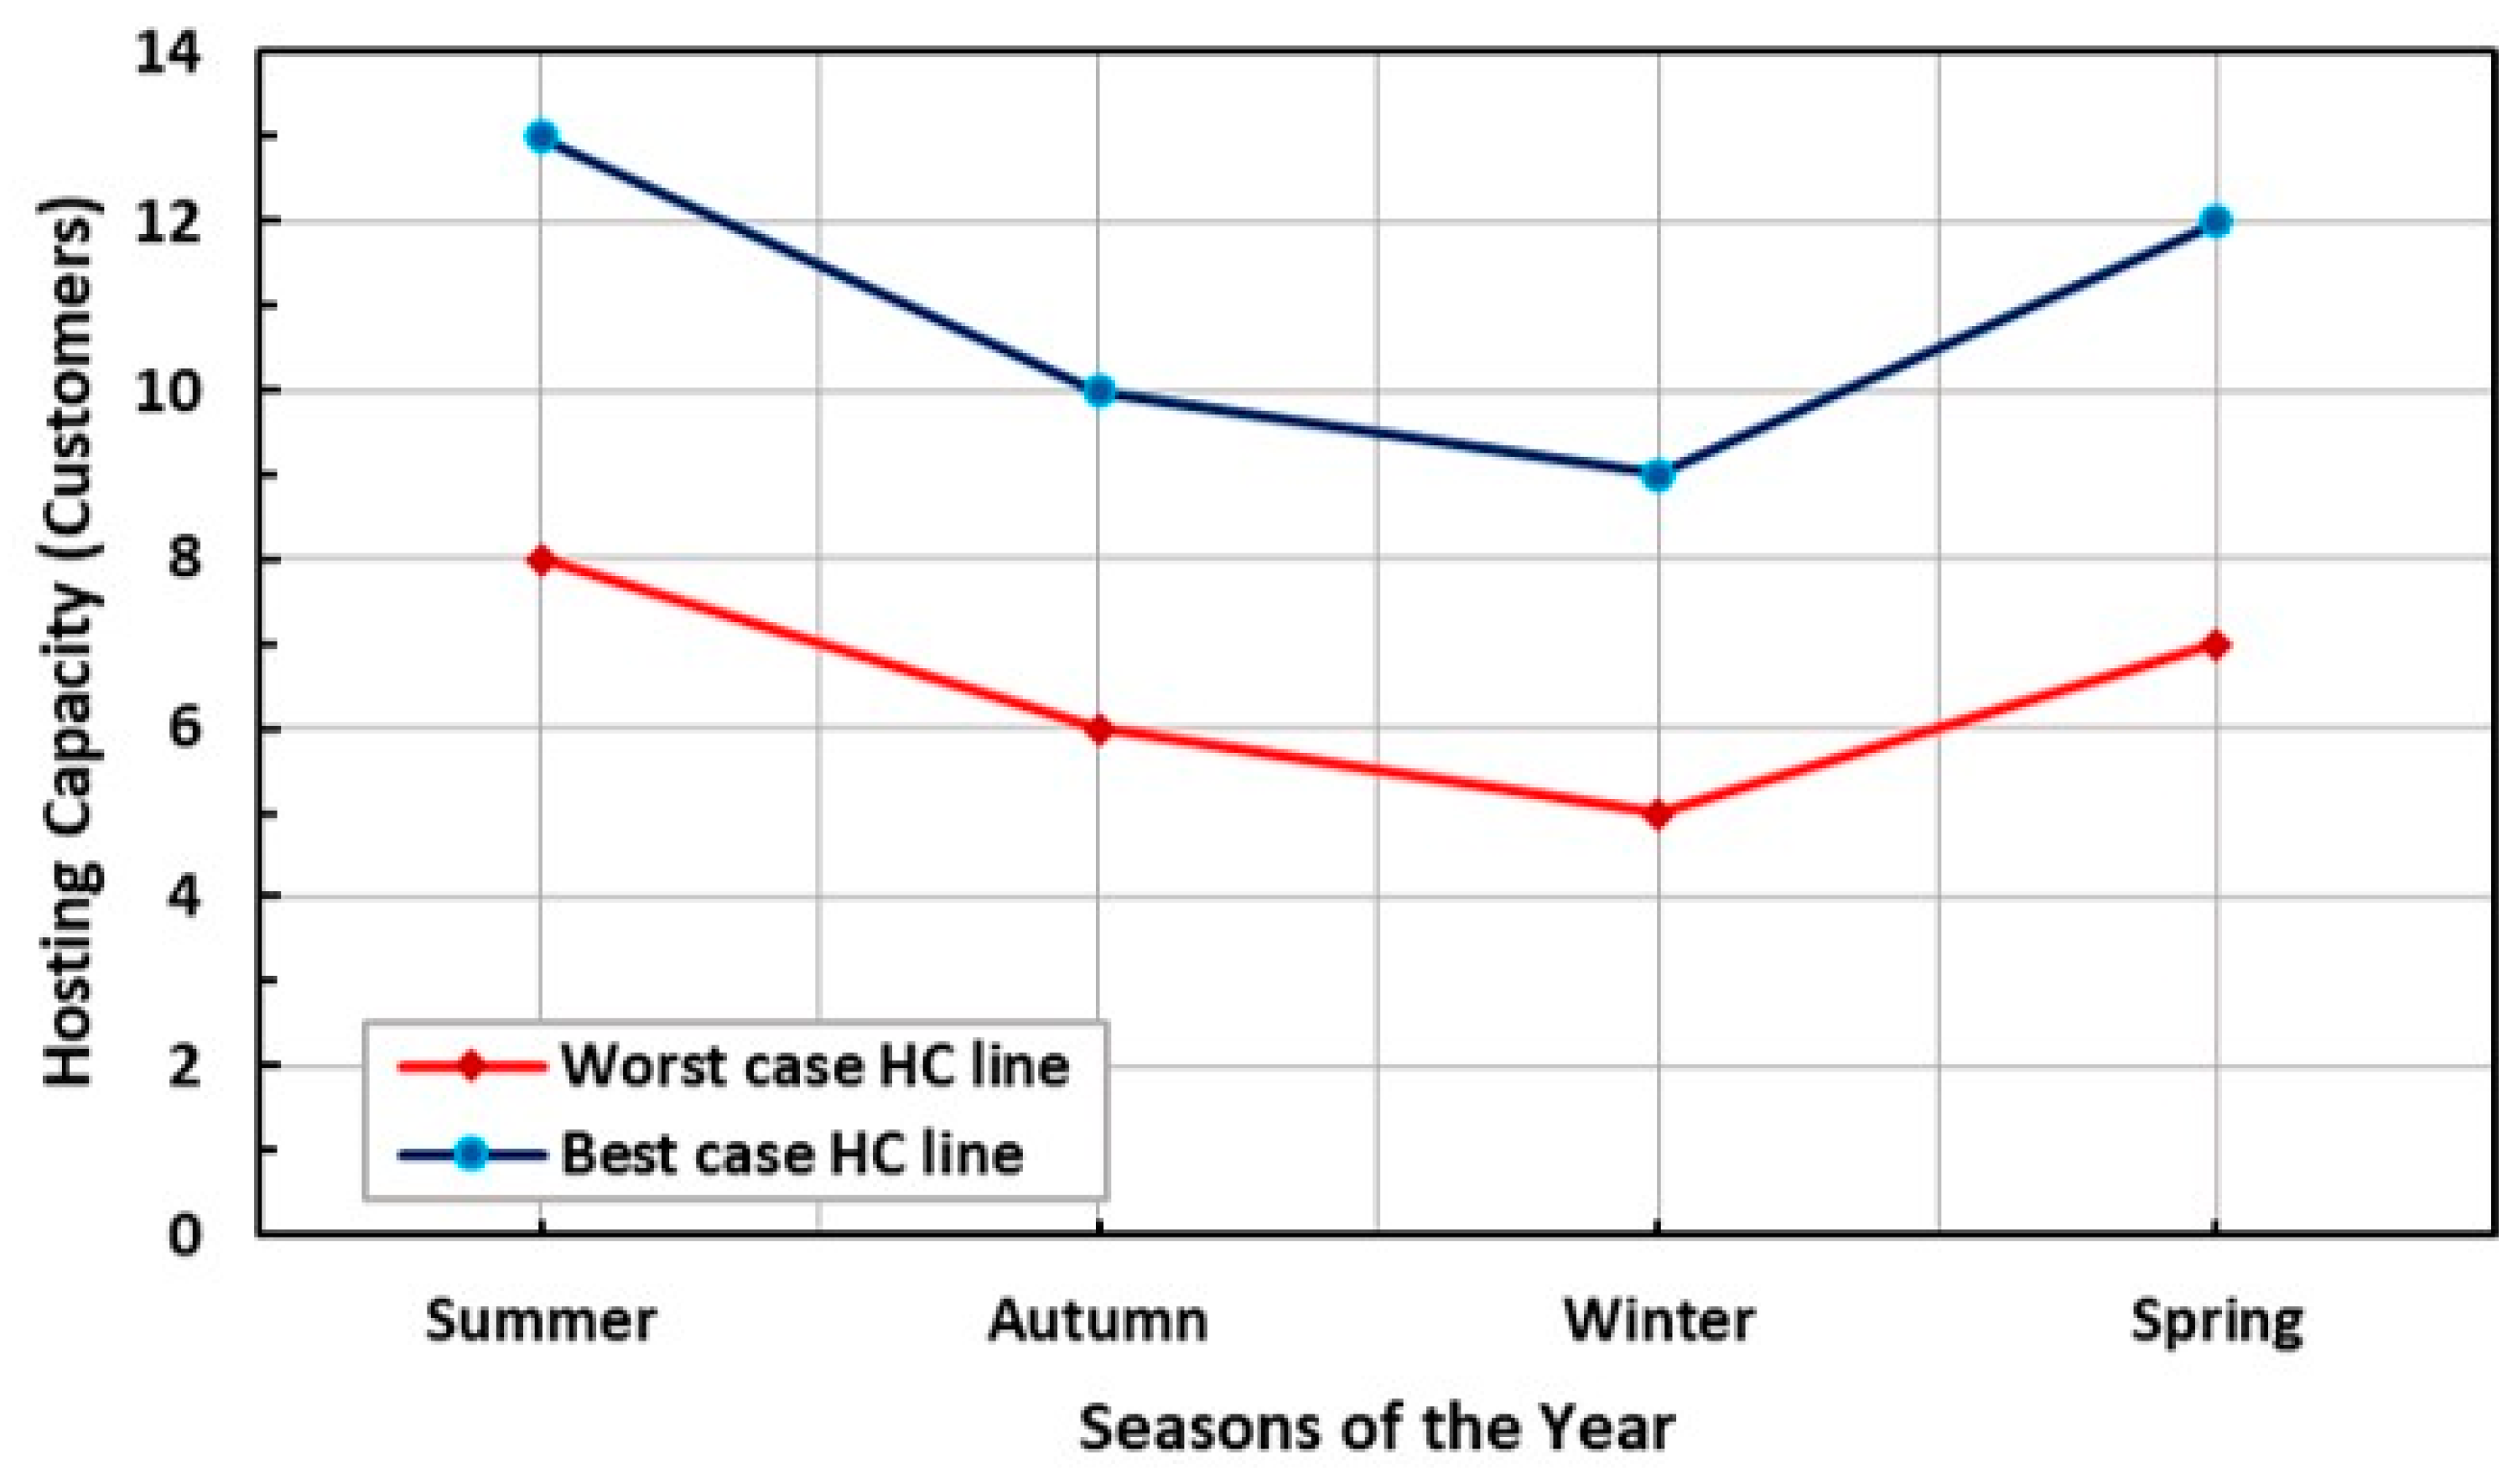
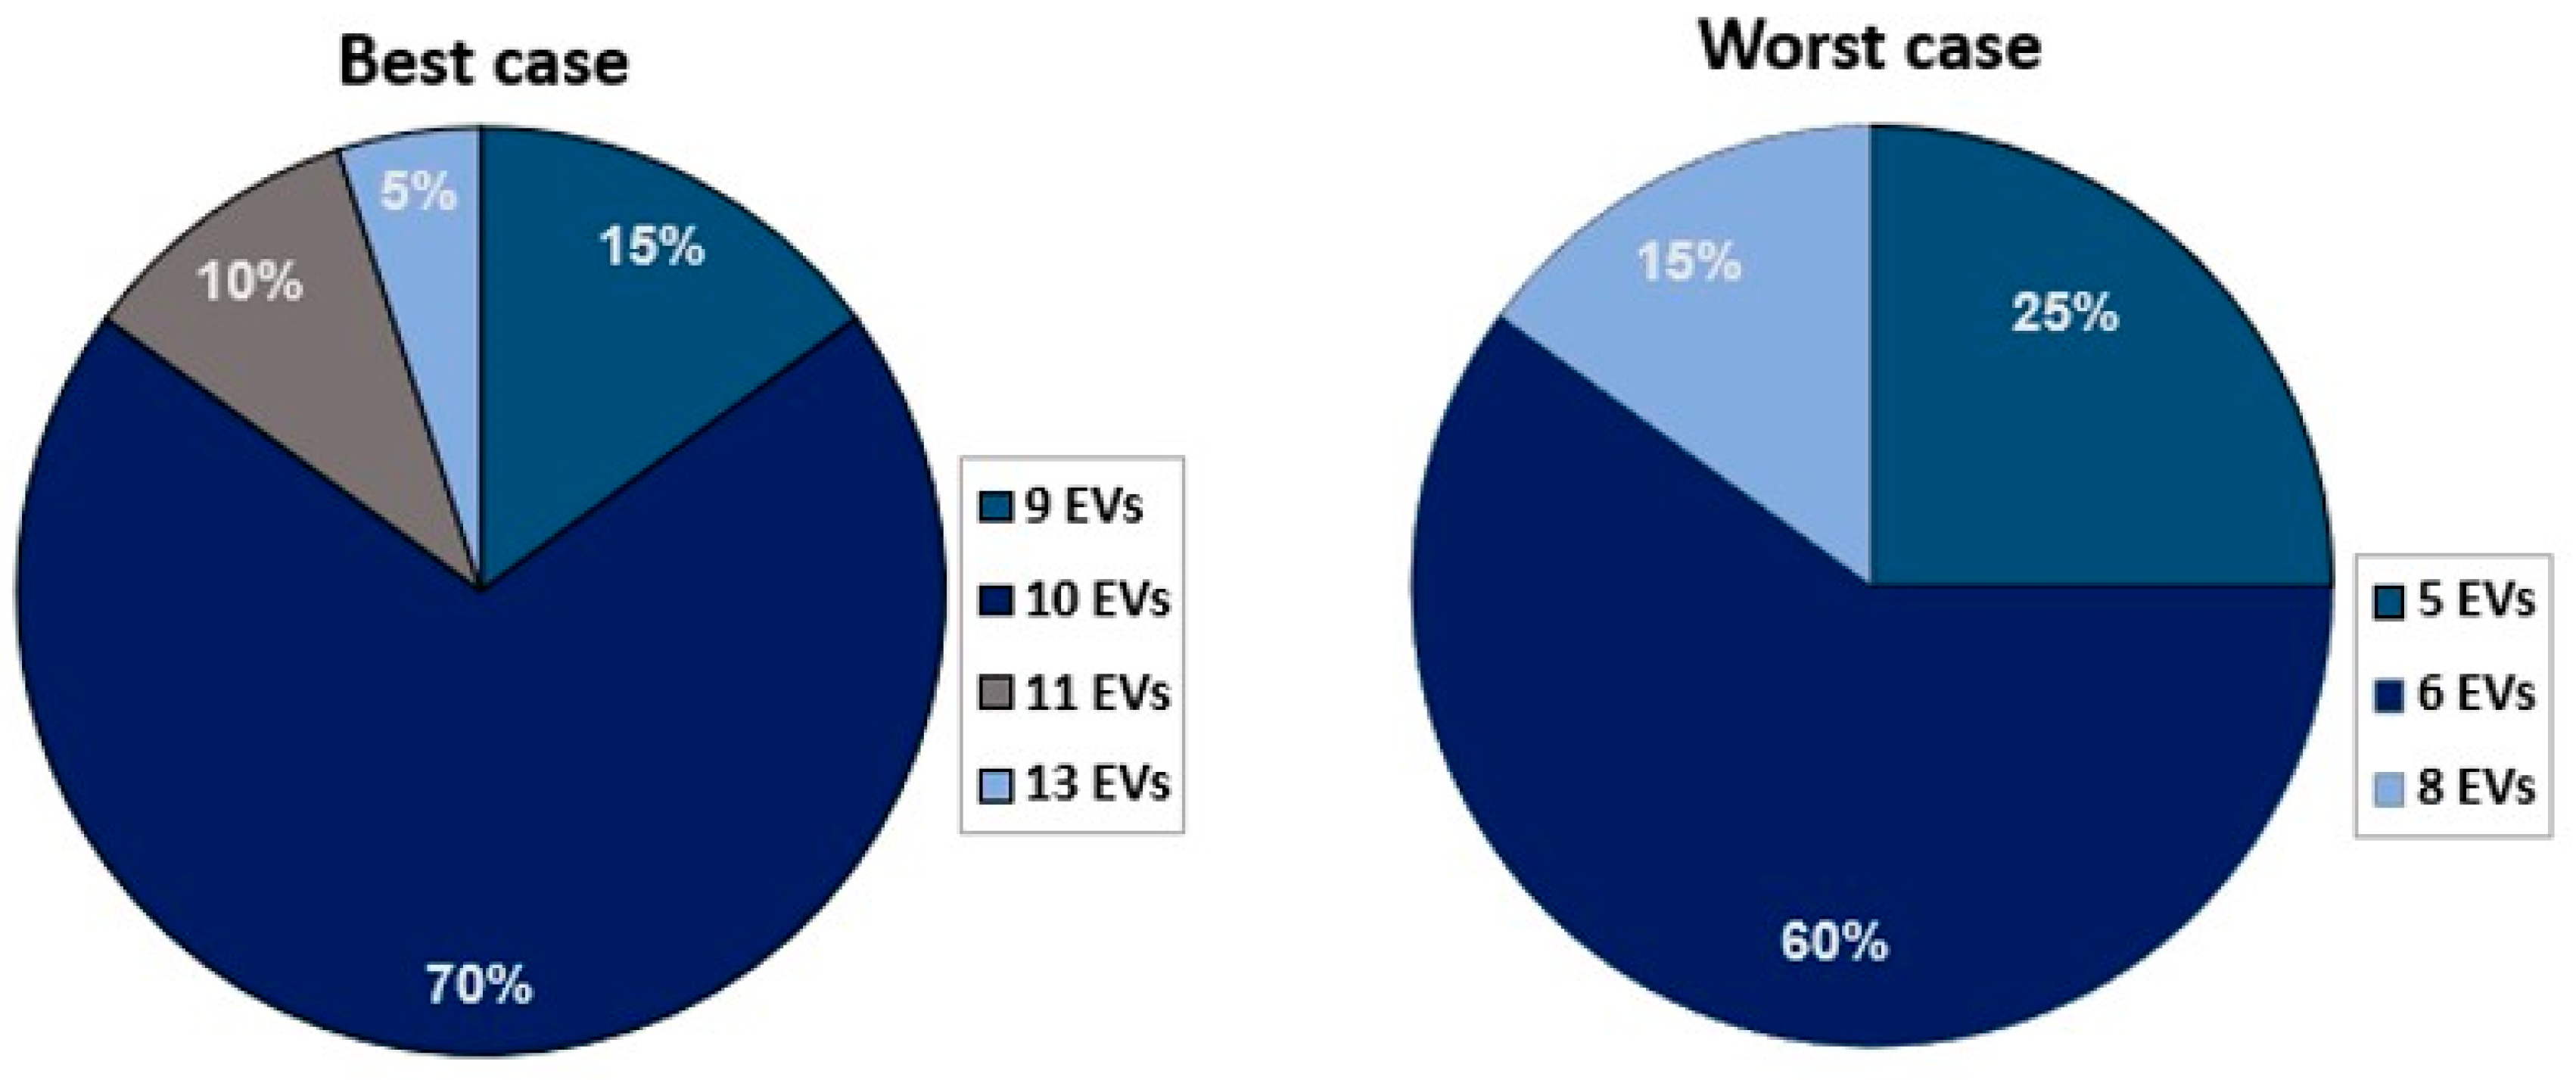
Figure 10 shows the seasonal variation in HC for the best-case and worst-case scenarios. The test network can host more customers (13 and eight for best-case and worst-case scenario, respectively) with EVs during the summer while the fewest number of EVs can be connected during the winter. Figure 11 shows the fraction of the year with the number of EVs that can be hosted simultaneously in the network without violating any performance limit. The pie charts include results from all hours of 2021. During the best-case scenario, nine and 10 customers can be hosted simultaneously for 85% and 70% of the hours, respectively. Moreover, five and six customers can charge their EVs simultaneously for 85% and 60% of the year, respectively, during the worst-case scenario without violating the limit of any PI.

3.2. Single-Phase Impact Assessment and HC Estimation

3.2.1. Impact on Voltage Drop

The voltage profile in the network when EVs are connected for the worst-case and best-case scenario, is shown in Figure 12a,b, respectively. Each dot represents a MCS scenario and shows the minimum voltages anywhere in the network based on the increasing EV charging load and random phase allocation. For the worst-case scenario shown in Figure 12a, the first violation is observed at 52% P L E V when 11 customers are simultaneously charging. The probability of a violation increases from this point as more EVs are connected. Figure 12b shows the best-case scenario, where the first violation is observed at 76% P L E V when 16 EVs are simultaneously charging. It is observed that increasing the penetration level of EVs decreases the feeder voltages.

3.2.2. Impact on Equipment Loading

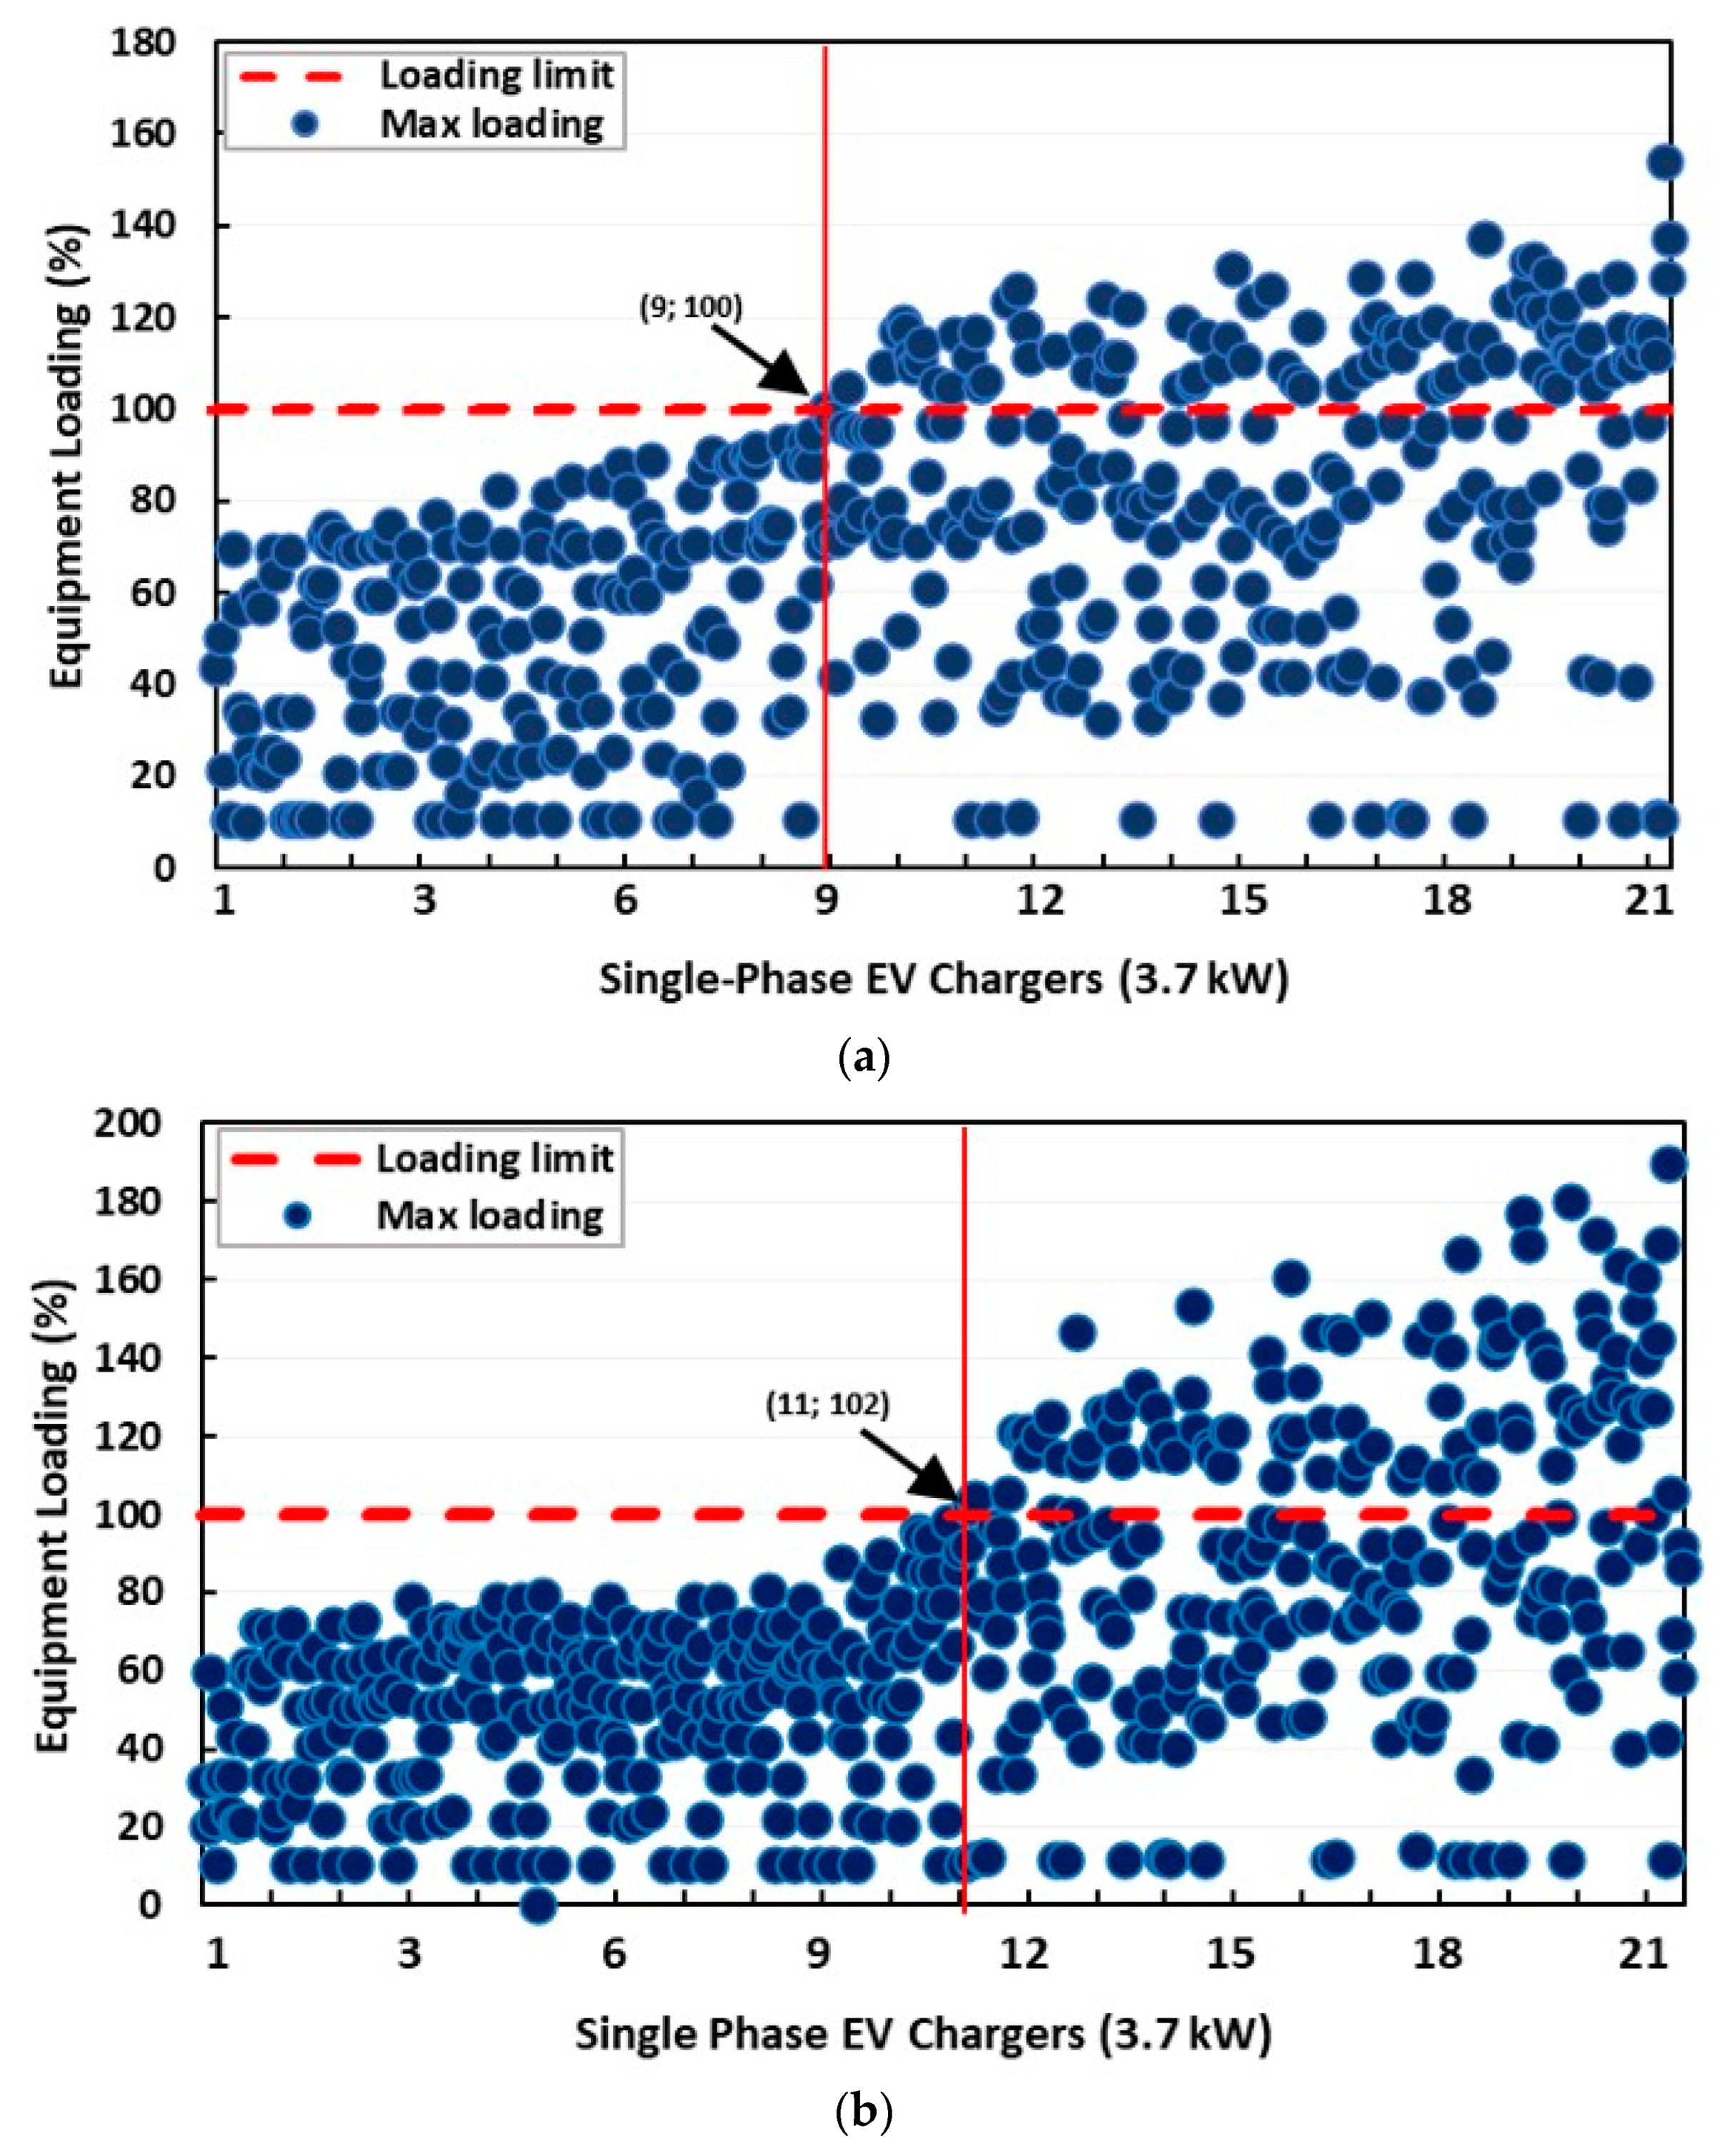
The scatter plot in Figure 13a,b shows the maximum equipment loading anywhere in the network for the worst-case and best-case scenario, respectively, and each dot represents an MCS scenario. It is observed that increasing the penetration level results in a corresponding increase in the equipment loading towards the allowable limit. During the best-case scenario in Figure 13a, the first violation at 100% equipment loading is observed at 43% P L E V when nine customers are simultaneously charging their EVs. The best-case scenario in Figure 13b shows the first violation at 102% equipment loading when 11 customers (52% P L E V ) are simultaneously connected to the network.

3.2.3. Hosting Capacity Estimation

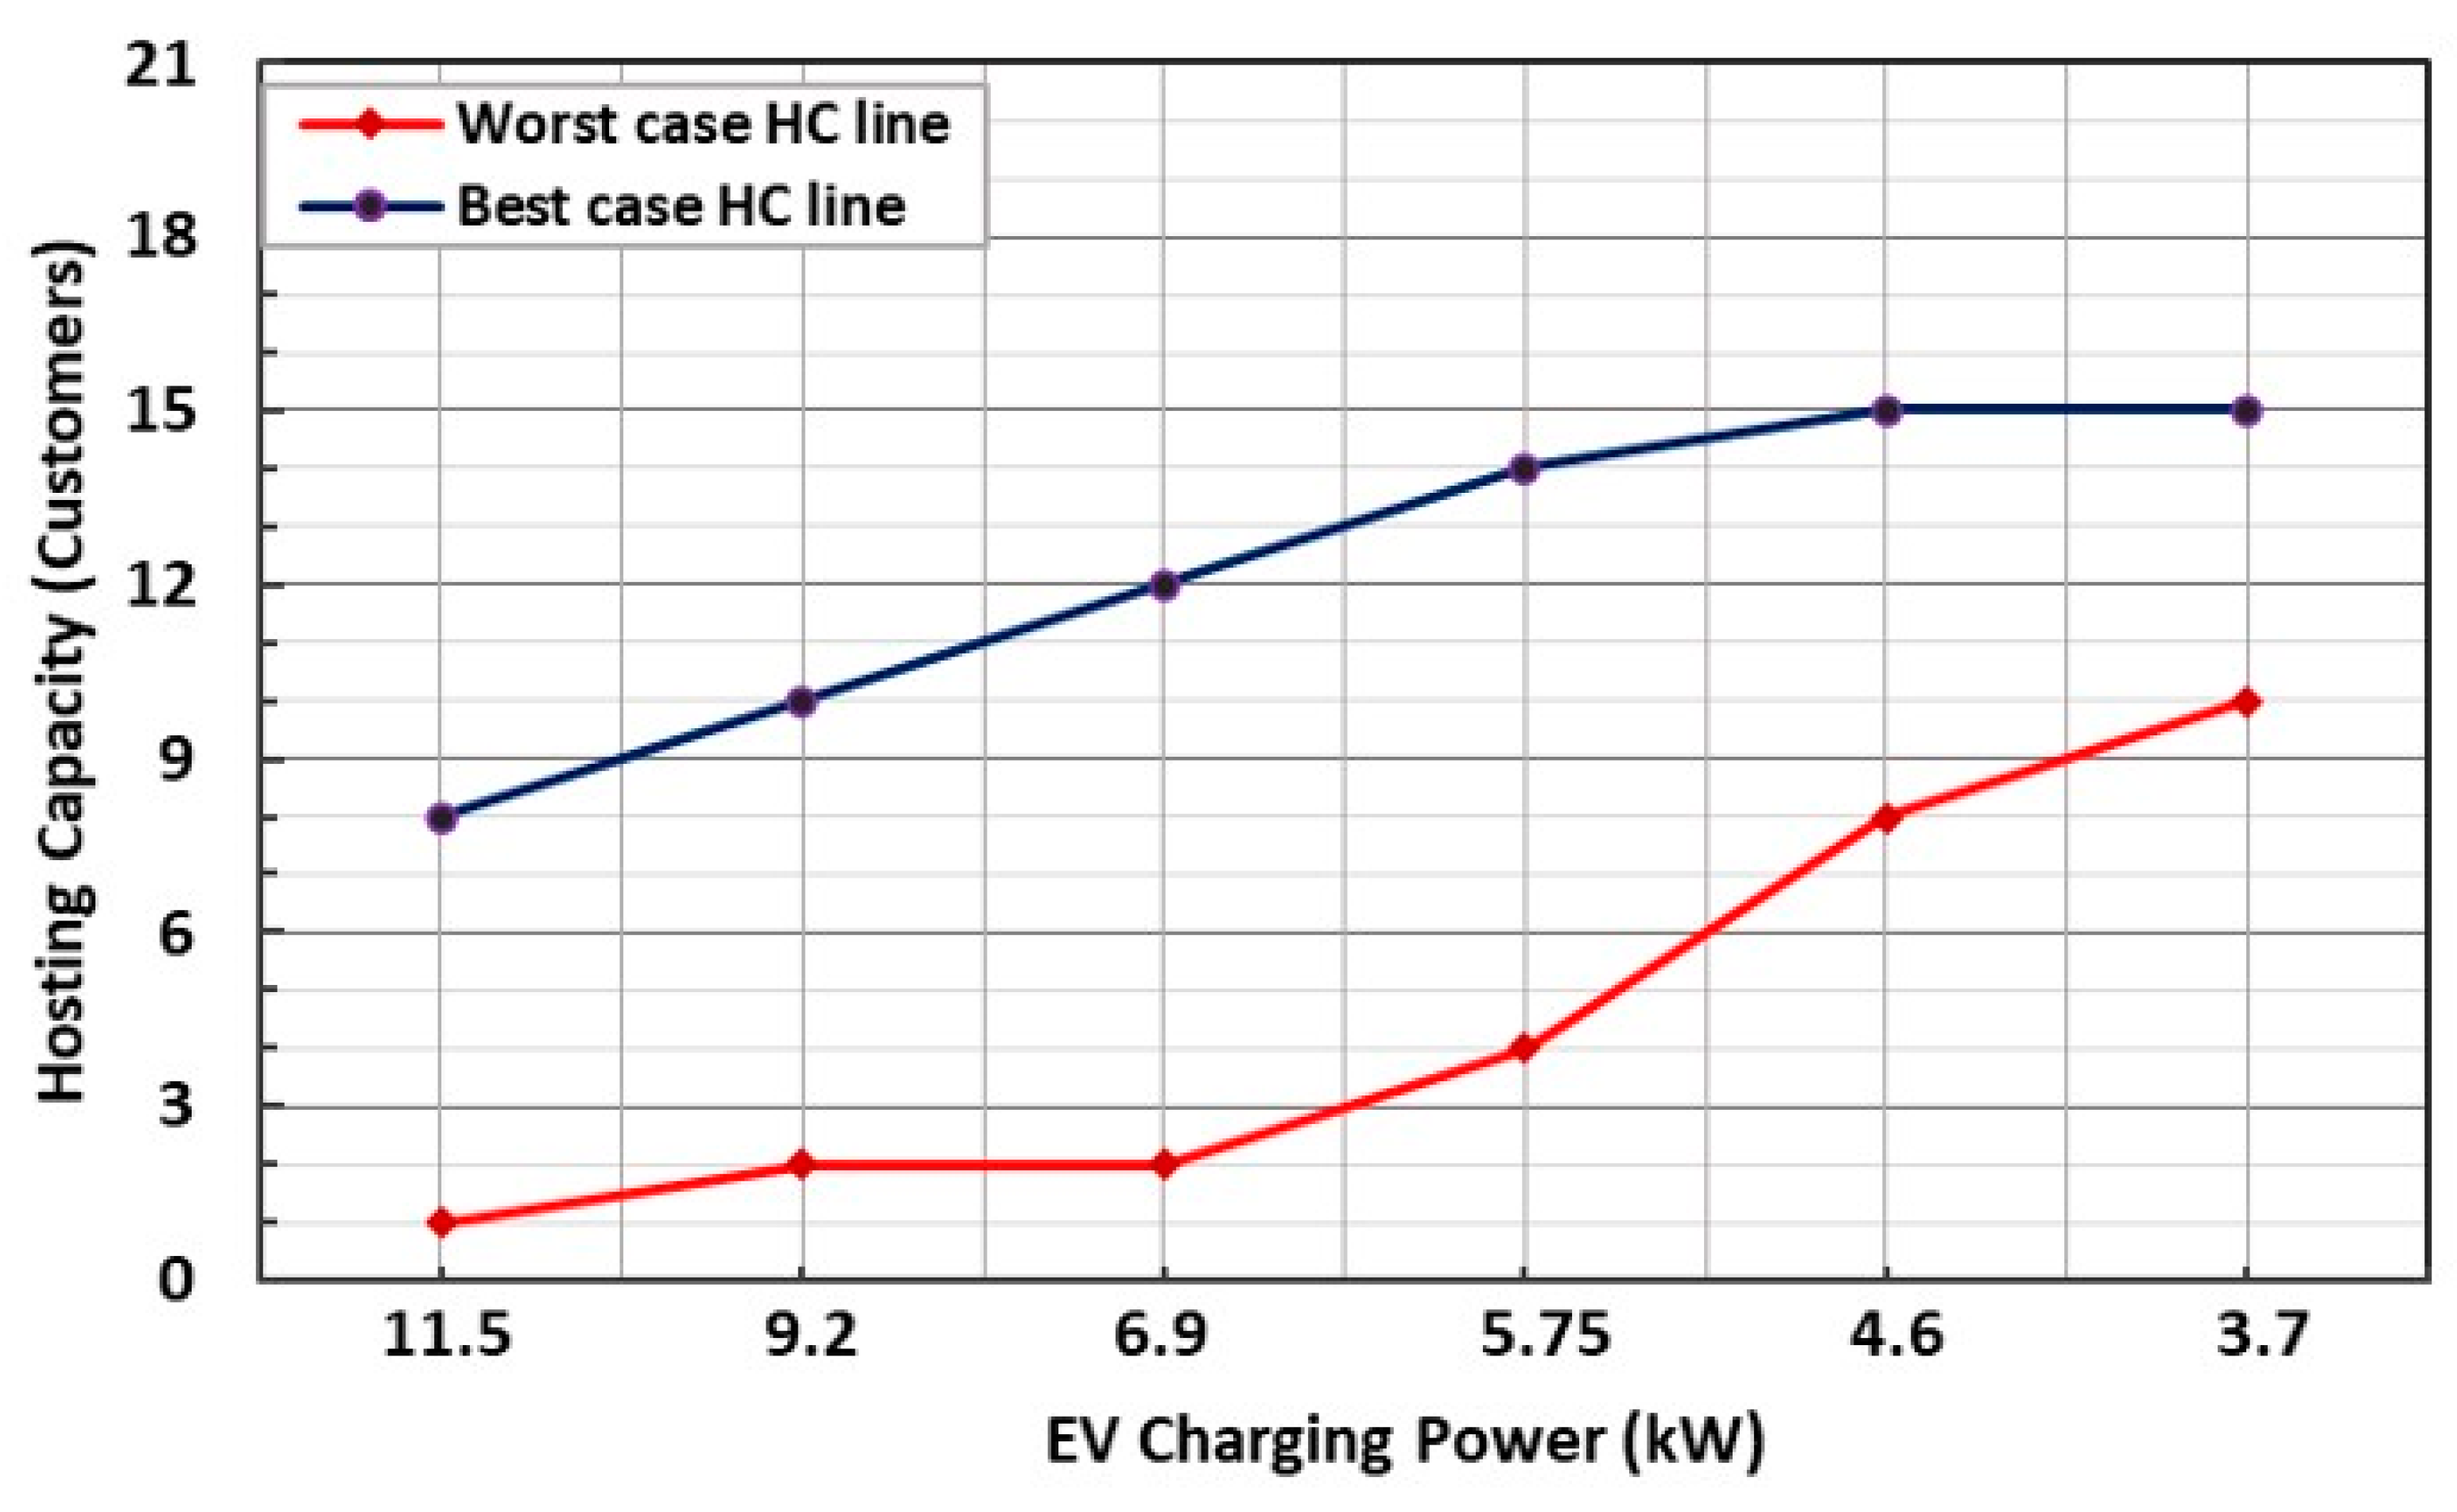
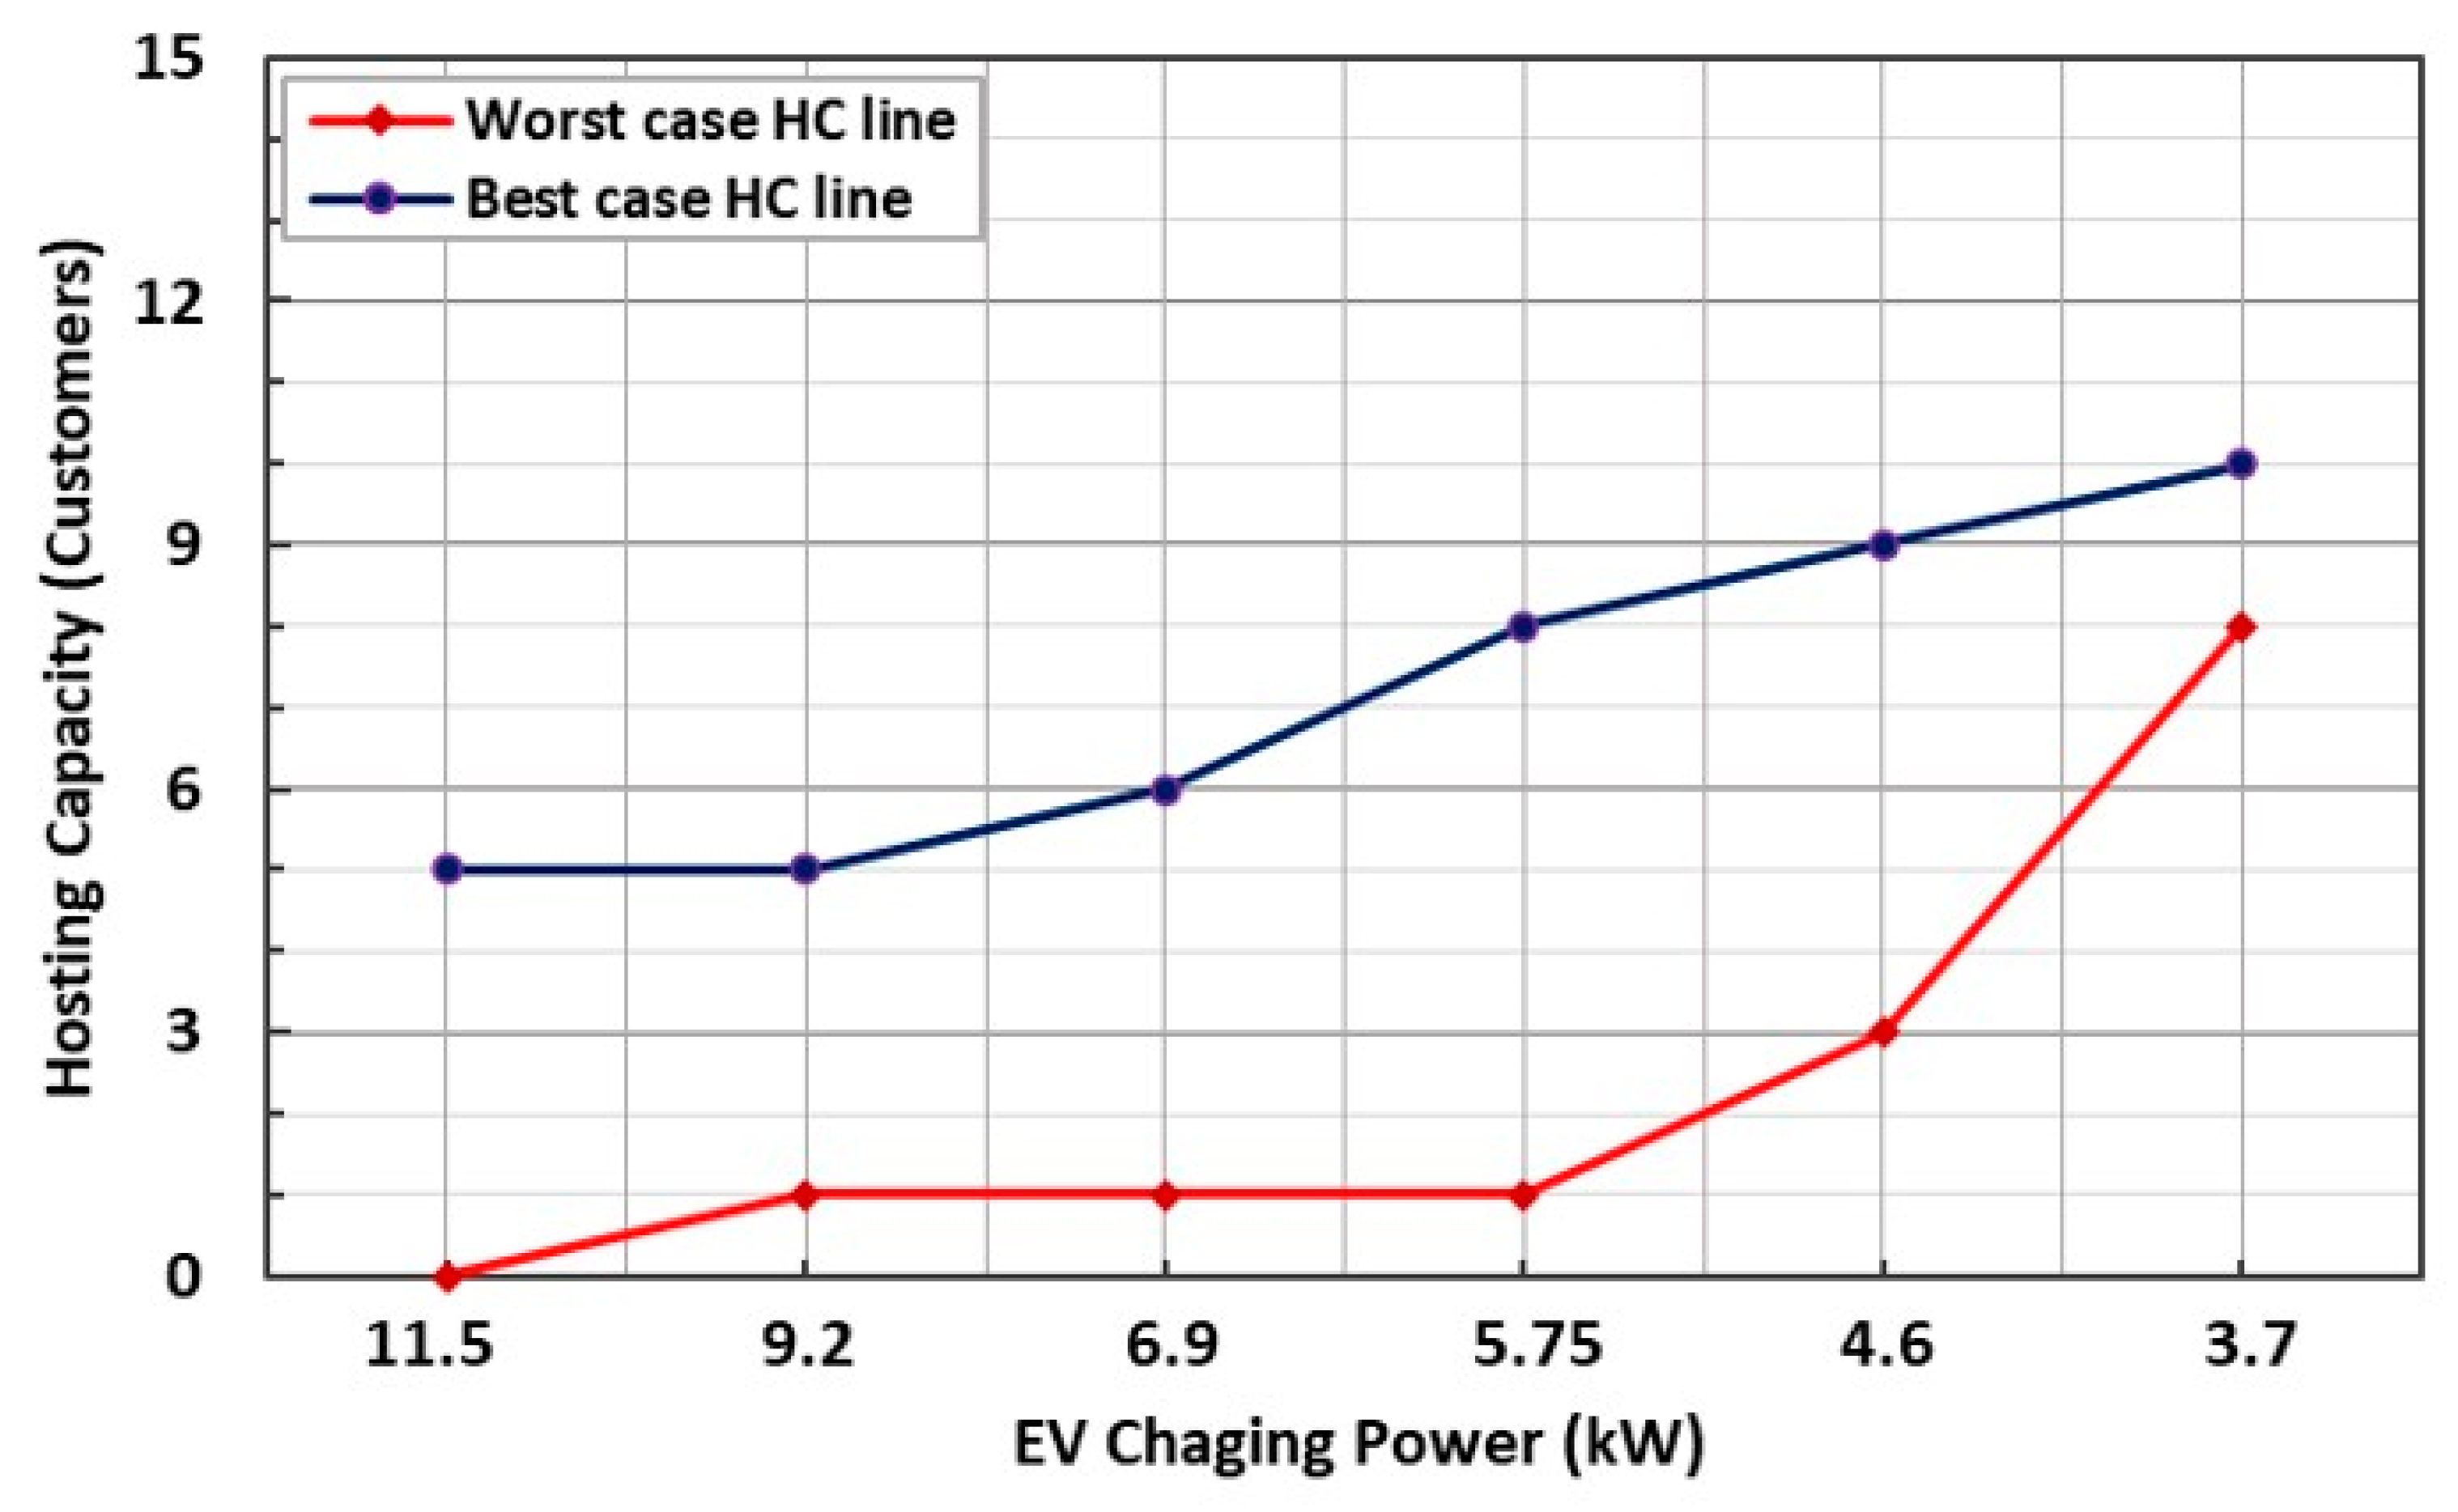
The hosting capacity of the unbalanced single-phase network obtained from the impact assessment conducted for different charging powers is shown in Figure 14 and Figure 15 for voltage drop and equipment loading, respectively. In Figure 14, the HC with a charging power of 3.7 kW, is 48% and 71% (10 and 15 customers) for the worst-case and best-case scenario, respectively, when voltage drop is the PI considered. The HC reduces to 9.5% and 57% at 6.9 kW charging power. When considering equipment loading as the PI in Figure 15, none of the customers can charge their EVs with an 11.5 kW charger during the worst-case scenario, while five customers can charge during the best case. The HC is zero and five customers for the worst case and best case, respectively. Moreover, for the popular 3.7 kW charger, the HC is eight customers for the worst-case and 10 customers for the best-case scenario. Table 2 shows a comparison of the HC values for worst-case and best-case scenarios when considering both PIs, with equipment loading as the most limiting PI. The difference in HC values between the two scenarios in this case study also highlights the effect of the charging location on the HC of single-phase EV charging.

4. Conclusions

In this paper, a three-phase and single-phase EV charging impact assessment and HC estimation for an existing LV distribution network have been presented. A deterministic method is applied for the three-phase HC determination while a stochastic method based on a simplified MCS is adapted for the single-phase HC estimation. Only phase selection is considered as the random variable for the single-phase HC assessment due to its impact on an unbalanced network and to reduce the simulation time. Voltage drop and equipment loading are the PIs considered and their limit is set using the South African standard NRS097. The result of the impact assessment shows that increasing the EV penetration level results in a corresponding increase in the performance indices towards their allowable limit. Equipment loading is found to be the major limiting factor in determining the HC of EV charging. The three-phase HC results show that 6–9 customers can charge their EVs simultaneously in the worst-case scenario without a violation, while 9–12 customers can connect their EVs at the same time in the best-case scenario. Also, the single-phase HC result presented shows that 48% to 76% of the customers can charge simultaneously when the voltage drop is the PI considered.
The HC method adopted in this study can readily be used by operators to obtain an immediate estimate of the EV charging in the distribution network for planning and expansion purposes. However, the results presented are for a specific grid, PI, and the PI limits, and cannot be immediately transferred to another grid since the distribution grids are non-homogenous. Also, this study uses uncontrolled EV charging without considering the charging behavior and the state of charge, but the EV load is added to all the hours of the year. This approach may underestimate the HC but generates a result that shows the variation in HC throughout the year. In reality, there may be a higher probability of more EV charging simultaneously if the charging is distributed in time. Future studies in the South African electrical network may consider the controlled charging and the state of charging charge of the battery. Simulating the different possible charging behavior of the customers with different states of charge will provide a more realistic HC value. Moreover, since distribution networks are non-homogenous, further studies can also conduct a comprehensive analysis and sensitivity studies of large-scale residential feeders in South Africa, to access their potential behavior at different levels of EV charging penetration. This will generate a streamlined approach for HC estimation.

Author Contributions

Conceptualization, V.U.; methodology, V.U.; software, V.U.; validation, V.U., A.A. and K.M.; formal analysis, V.U.; investigation, V.U.; resources, A.A. and K.M.; data curation, V.U.; writing—original draft preparation, V.U.; writing—review and editing, V.U., A.A. and K.M.; visualization, V.U.; supervision, A.A. and K.M. All authors have read and agreed to the published version of the manuscript.

Funding

This research received no external funding.

Institutional Review Board Statement

Not applicable.

Informed Consent Statement

Not applicable.

Data Availability Statement

Not applicable.

Acknowledgments

This project was supported by the Center for Excellence in Smart Grid, Durban University of Technology and the eThekwini Municipality.

Conflicts of Interest

The authors declare no conflict of interest.

References

  1. Haque, M.M.; Wolfs, P. A review of high PV penetrations in LV distribution networks: Present status, impacts and mitigation measures. Renew. Sustain. Energy Rev. 2016, 62, 1195–1208. [Google Scholar] [CrossRef]
  2. Mulenga, E.; Bollen, M.; Etherden, N. Adapted Stochastic PV Hosting Capacity Approach for Electric Vehicle Charging Considering Undervoltage. Electricity 2021, 2, 387–402. [Google Scholar] [CrossRef]
  3. EV Sales. Available online: https://cleantechnica.com/tag/ev-sales/ (accessed on 11 November 2022).
  4. Ping, J.; Yan, Z.; Chen, S. A two-stage autonomous EV charging coordination method enabled by blockchain. J. Mod. Power Syst. Clean Energy 2020, 9, 104–113. [Google Scholar] [CrossRef]
  5. Shepero, M.; Munkhammar, J.; Widén, J.; Bishop, J.D.; Boström, T. Modeling of photovoltaic power generation and electric vehicles charging on city-scale: A review. Renew. Sustain. Energy Rev. 2018, 89, 61–71. [Google Scholar] [CrossRef] [Green Version]
  6. Ogunboyo, P.T.; Tiako, R.; Davidson, I.E. Effectiveness of Dynamic Voltage Restorer for Unbalance Voltage Mitigation and Voltage Profile Improvement in Secondary Distribution System. Can. J. Electr. Comput. Eng. 2018, 41, 105–115. [Google Scholar] [CrossRef]
  7. Deuse, J.; Benintendi, D.; Agrell, P.; Bogetoft, P. Power system and market integration of der, the eu-deep approach. In Proceedings of the CIRED 2005—18th International Conference and Exhibition on Electricity Distribution, Turin, Italy, 6–9 June 2005; pp. 1–4. [Google Scholar]
  8. Bollen, M.H.; Rönnberg, S.K. Hosting capacity of the power grid for renewable electricity production and new large consumption equipment. Energies 2017, 10, 1325. [Google Scholar] [CrossRef] [Green Version]
  9. Umoh, V.; Davidson, I.; Adebiyi, A.; Ekpe, U. Methods and Tools for PV and EV Hosting Capacity Determination in Low Voltage Distribution Networks—A Review. Energies 2023, 16, 3609. [Google Scholar] [CrossRef]
  10. NRS 097-2-1; Grid Interconnection of Embedded Generation, Eskom: Sunninghill, South Africa, 2017.
  11. EN 50160:2010; Voltage Characteristic of Electricity Supplied by Public Electricity Networks, Standard. European Commitee for Electrotechnical Standardization (CENELEC): Brussels, Belgium, 2010.
  12. Zain ul Abideen, M.; Ellabban, O.; Al-Fagih, L. A review of the tools and methods for distribution networks’ hosting capacity calculation. Energies 2020, 13, 2758. [Google Scholar] [CrossRef]
  13. Zhu, J.; Nacmanson, W.J.; Ochoa, L.F.; Hellyer, B. Assessing the EV Hosting Capacity of Australian Urban and Rural MV-LV Networks. Electr. Power Syst. Res. 2022, 212, 108399. [Google Scholar] [CrossRef]
  14. Paudyal, P.; Ghosh, S.; Veda, S.; Tiwari, D.; Desai, J. EV hosting capacity analysis on distribution grids. In Proceedings of the 2021 IEEE Power & Energy Society General Meeting (PESGM), Washington, DC, USA, 26–29 July 2021; IEEE: Washington, DC, USA, 2021; pp. 1–5. [Google Scholar]
  15. Leou, R.-C.; Su, C.-L.; Lu, C.-N. Stochastic analyses of electric vehicle charging impacts on distribution network. IEEE Trans. Power Syst. 2013, 29, 1055–1063. [Google Scholar] [CrossRef]
  16. Sandström, M.; Bales, C.; Dotzauer, E. Hosting Capacity of the Power Grid for Electric Vehicles—A Case Study on a Swedish Low Voltage Grid. IOP Conf. Ser. Earth Environ. Sci. 2022, 1050, 012008. [Google Scholar] [CrossRef]
  17. Leou, R.-C.; Su, C.-L.; Lu, C.-N. Stochastic analysis of electric transportation charging impacts on power quality of distribution systems. IET Gener. Transm. Distrib. 2018, 12, 2725–2734. [Google Scholar] [CrossRef]
  18. Habib, S.; Kamran, M.; Rashid, U. Impact analysis of vehicle-to-grid technology and charging strategies of electric vehicles on distribution networks—A review. J. Power Sources 2015, 277, 205–214. [Google Scholar] [CrossRef]
  19. García-Villalobos, J.; Zamora, I.; San Martín, J.I.; Asensio, F.J.; Aperribay, V. Plug-in electric vehicles in electric distribution networks: A review of smart charging approaches. Renew. Sustain. Energy Rev. 2014, 38, 717–731. [Google Scholar] [CrossRef]
  20. Fadi, A.K.; Bruno, F. Holistic approach for prioritizing emergency EV charging in an existing distribution network. In Proceedings of the CIRED Porto Workshop 2022: E-Mobility and Power Distribution Systems, Porto, Portugal, 2–3 June 2022. [Google Scholar]
  21. Palomino, A.; Parvania, M. Probabilistic impact analysis of residential electric vehicle charging on distribution transformers. In Proceedings of the 2018 North American Power Symposium (NAPS), Fargo, ND, USA, 9–11 September 2018; IEEE: Fargo, ND, USA, 2018; pp. 1–6. [Google Scholar]
  22. Acharige, S.S.G.; Haque, M.E.; Arif, M.T.; Hosseinzadeh, N.; Hasan, K.N.; Oo, A.M.T. Review of Electric Vehicle Charging Technologies, Standards, Architectures, and Converter Configurations. IEEE Access 2023, 11, 41218–41255. [Google Scholar] [CrossRef]
  23. Torquato, R.; Salles, D.; Pereira, C.O.; Meira, P.C.M.; Freitas, W. A comprehensive assessment of PV hosting capacity on low-voltage distribution systems. IEEE Trans. Power Deliv. 2018, 33, 1002–1012. [Google Scholar] [CrossRef]
  24. Dixon, J.; Bell, K. Electric vehicles: Battery capacity, charger power, access to charging and the impacts on distribution networks. ETransportation 2020, 4, 100059. [Google Scholar] [CrossRef]
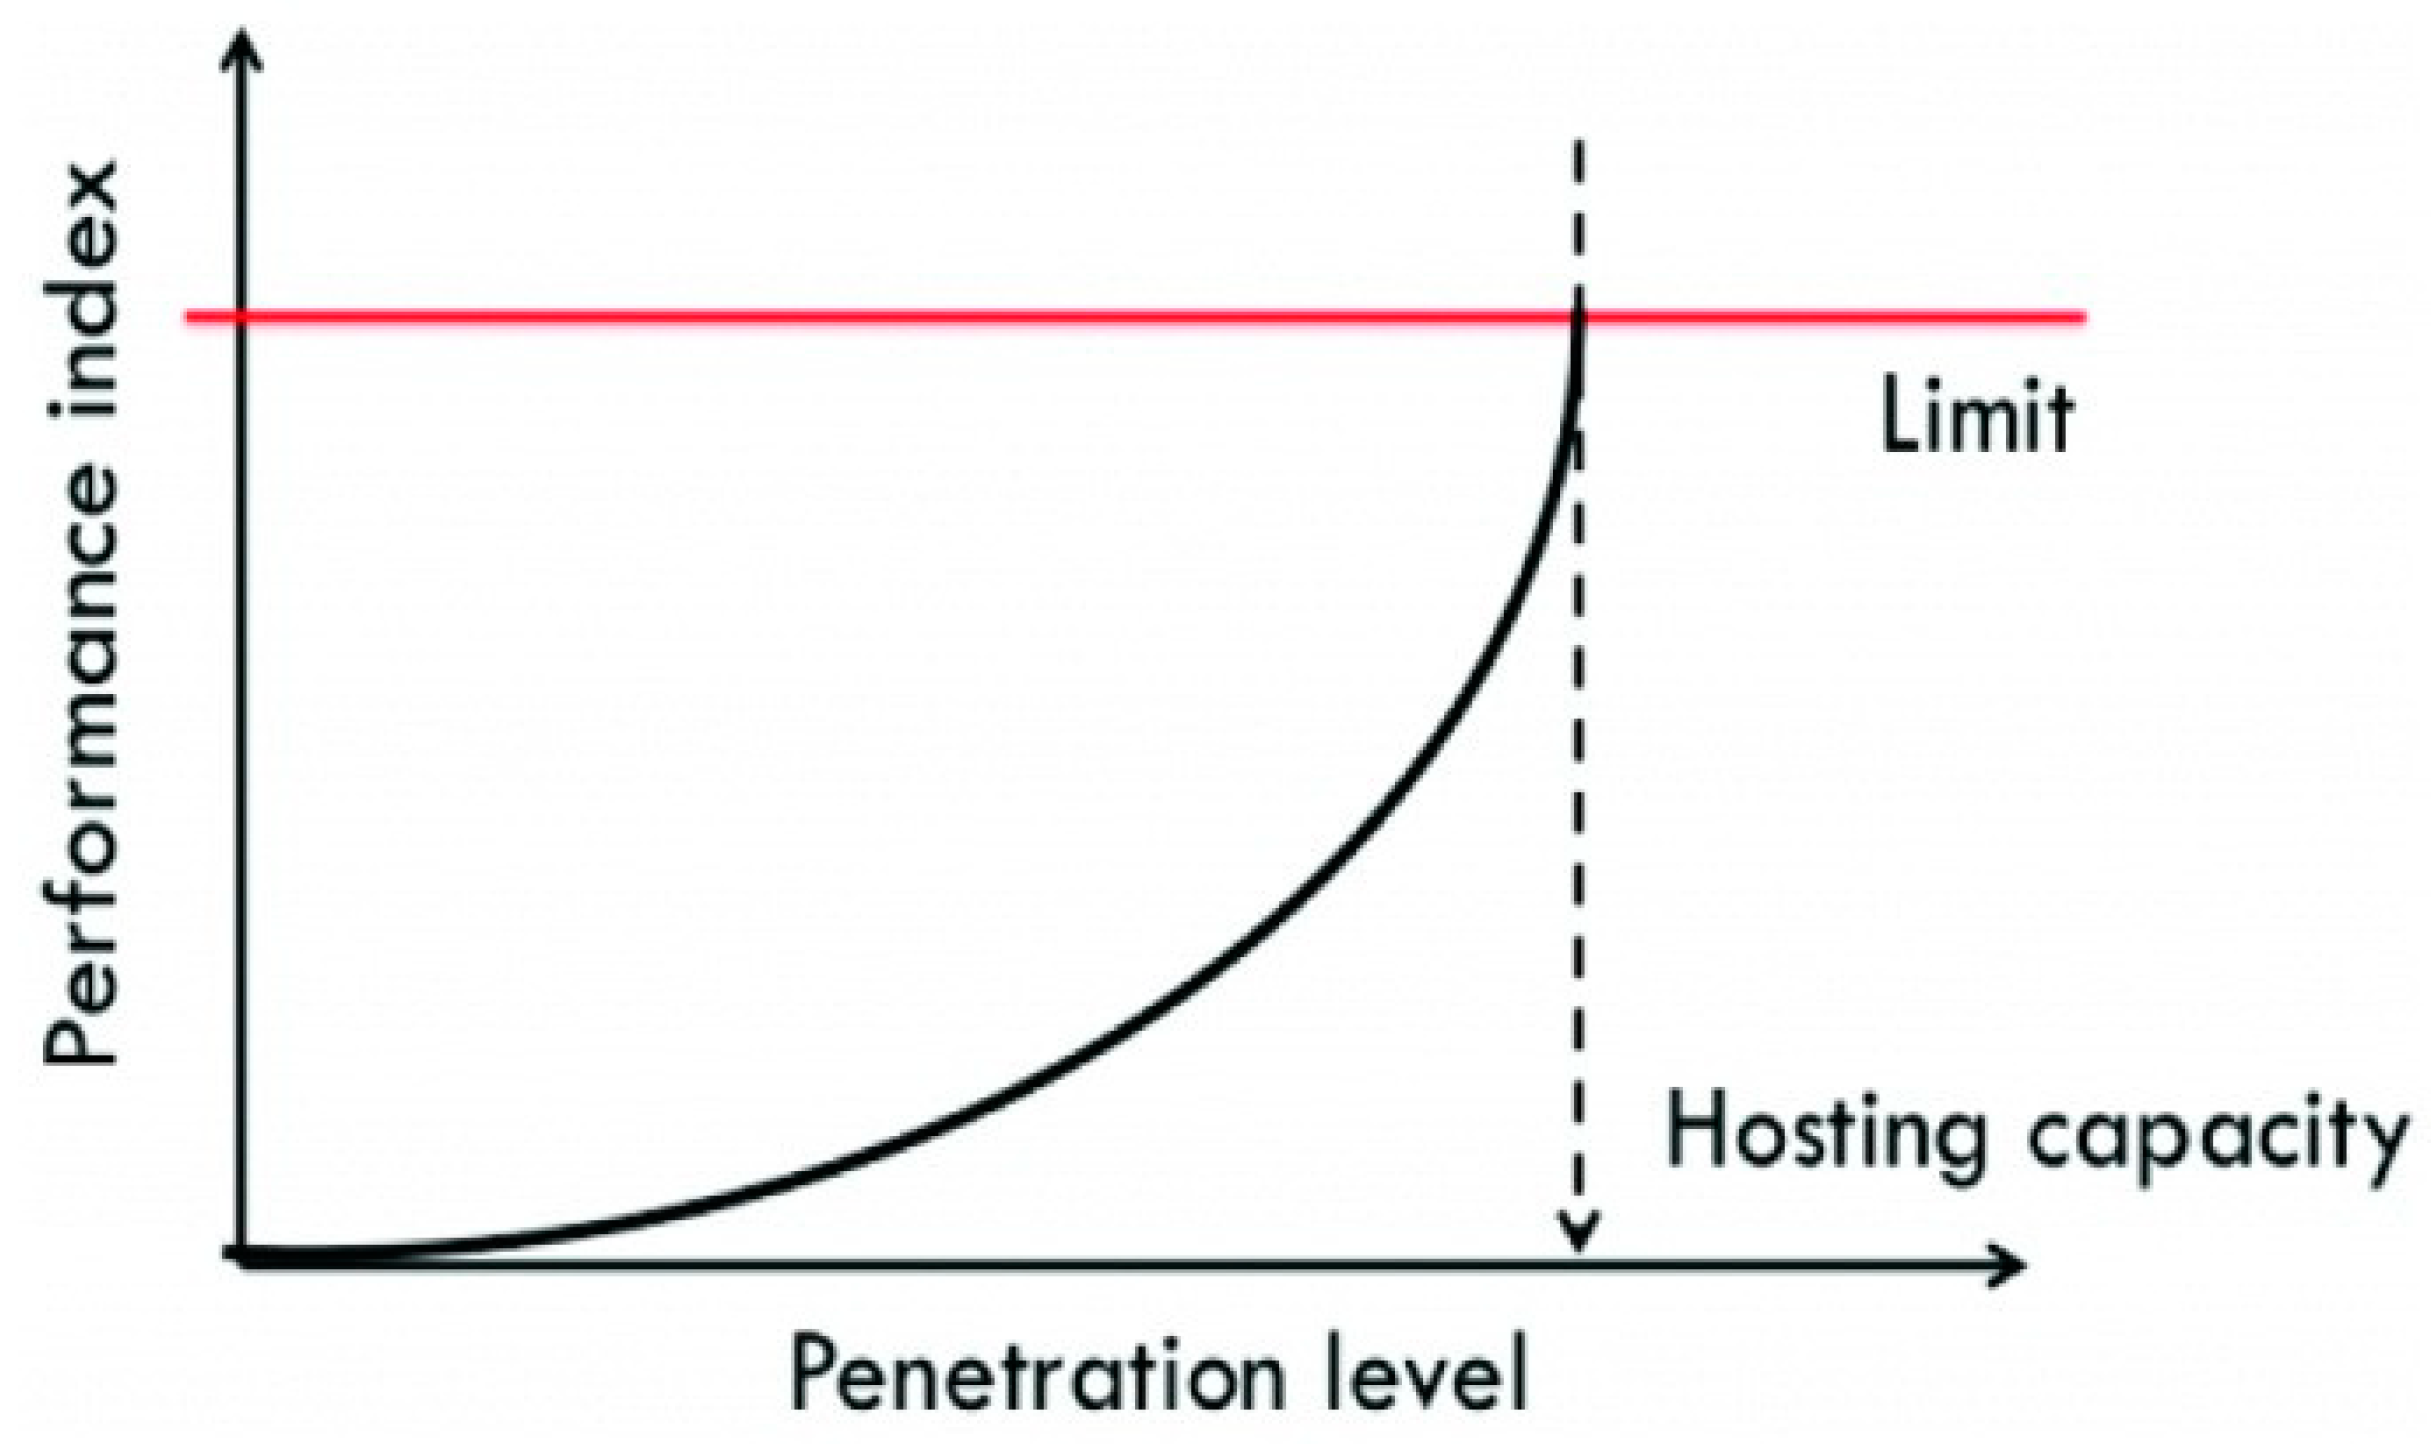
Figure 1. Hosting capacity concept.
Eng 04 00111 g001
Figure 2. General HC methodology.
Eng 04 00111 g002
Figure 3. Test network.
Eng 04 00111 g003
Figure 4. Aggregated historical time-series load for the year 2021.
Eng 04 00111 g004
Figure 5. Seasonal load profile for the day of highest consumption.
Eng 04 00111 g005
Figure 6. Flowchart for the EV charging HC method.
Eng 04 00111 g006
Figure 7. Seasonal load profile for the day highest consumption.
Eng 04 00111 g007
Figure 8. Feeder voltages (a) Worst case; (b) Best case.
Eng 04 00111 g008
Figure 9. Equipment loading (a) Worst case; (b) Best case.
Eng 04 00111 g009
Figure 10. Seasonal hosting capacity.
Eng 04 00111 g010
Figure 11. Fraction of the year with the given number of EVs that can charge without a violation of any PI.
Eng 04 00111 g011
Figure 12. Feeder minimum voltage (a) Worst case; (b) Best case.
Eng 04 00111 g012
Figure 13. Feeder maximum loading (a) Worst case; (b) Best case.
Eng 04 00111 g013
Figure 14. Single-phase hosting capacity results for different charging power when considering voltage drop as the PI.
Eng 04 00111 g014
Figure 15. Single-phase hosting capacity results for different charging power when considering equipment loading as the PI.
Eng 04 00111 g015
Table 1. Cable properties.
Cable IDLength
(m)
R1 (Ω)X1 (Ω)Rated Current (A)
DU0-1980.0190.007282
DU1-2640.0250.005242
DU2-3790.0910.007122
DU2-5810.0920.007122
DU2-7720.0810.006122
DU5-4770.0900.006122
DU6-7630.0740.005122
DU7-8660.0760.005122
Table 2. HC comparison of both performance indices.
Charging Power
(kW)
HC When Voltage Drop Is PI
(Customers)
HC When Equipment Loading Is PI
(Customers)
Worst CaseBest CaseWorst CaseBest Case
11.51805
9.221015
6.921216
5.7541418
4.681539
3.71015810
Disclaimer/Publisher’s Note: The statements, opinions and data contained in all publications are solely those of the individual author(s) and contributor(s) and not of MDPI and/or the editor(s). MDPI and/or the editor(s) disclaim responsibility for any injury to people or property resulting from any ideas, methods, instructions or products referred to in the content.