Abstract
This work presents the use of a high-fidelity neural network surrogate model within a Modular Optimization Framework for treatment of crud deposition as a constraint within light-water reactor core loading pattern optimization. The neural network was utilized for the treatment of crud constraints within the context of an advanced genetic algorithm applied to the core design problem. This proof-of-concept study shows that loading pattern optimization aided by a neural network surrogate model can optimize the manner in which crud distributes within a nuclear reactor without impacting operational parameters such as enrichment or cycle length. Several analysis methods were investigated. Analysis found that the surrogate model and genetic algorithm successfully minimized the deviation from a uniform crud distribution against a population of solutions from a reference optimization in which the crud distribution was not optimized. Strong evidence is presented that shows boron deposition in crud can be optimized through the loading pattern. This proof-of-concept study shows that the methods employed provide a powerful tool for mitigating the effects of crud deposition in nuclear reactors.
1. Introduction
Crud is a unique form of fouling in light water reactors (LWRs) caused by particulates—such as iron and nickel—depositing on fuel rods in the reactor as a result of system corrosion [1]. Crud imposes operational challenges to the current fleet of operating LWRs [2] and is strongly associated with subcooled boiling and high-power fuel regions, such as within fresh fuel assemblies loaded into the reactor [3]. For pressurized water reactors (PWRs), the primary issues caused by crud deposition are crud-induced localized corrosion (CILC) and crud-induced power shift (CIPS) caused by the uptake of soluble boron within the crud layer. Crud deposition is also associated with a pressure drop in nuclear reactors as well [4]. Methods of managing crud are based on conservatively bounding the risk associated with the occurrence of CIPS and CILC through the reactor core reload design. Some of these techniques, such as flattening the power distribution to reduce the overall steaming rate, increase the fuel cycle cost of the reactor due to an increase in the number of fresh fuel assemblies.
CIPS, also known as the axial offset anomaly (AOA), is depicted in Figure 1. CIPS is an unexpected downward shift in the power distribution, which manifests as a decrease in the axial offset (AO) of the reactor [5] with the potential for rapid AO increase in the event of crud burst. CIPS is caused by boron coming out of solution from the moderator and uptaking into the crud layer. This introduces an extraneous neutron absorber in the upper portion of crud-impacted assemblies [6]. Significant AO deviations from the operating target AO force reactor operators to decrease operating power to bring the reactor to a more stable operating regime. For example, Cycle 9 of the Callaway Plant had to reduce to 70% of rated operating power due to CIPS [7]. For a 1000 MWe PWR, every 1% decrease in operating power corresponds to an approximate loss of $10,000 per day in revenue due to the need for replacement power purchases [8].
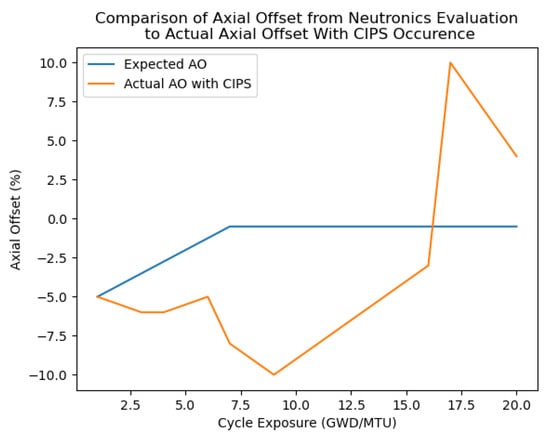
Figure 1.
Comparison of the expected AO based on a neutronics analysis to the AO when CIPS occurs [9].
CILC is an increased rate of corrosion in the fuel cladding that arises from the insulating effect of crud on the fuel rod [10] and a higher temperature distribution across the fuel rod [11]. In addition, chemical interactions between the crud and cladding also play a role in increasing the rate of corrosion [12].
It is estimated that nuclear power plants spend $2 million annually in operations and maintenance costs related to crud [13]. Several methods have been proposed for preventing crud deposition. Strict PH control of the moderating water has been proposed as a possible solution, but PH control becomes more difficult as fuel assemblies achieve high burnup levels [2]. Advanced material coatings for fuel rods have also been proposed as a method for preventing crud deposition [8,14]. Ultrasonic cleaning of fuel assemblies has become a standard practice for mitigating crud deposition in the operating PWR fleet. Ultrasonic cleaning effectively reduces the thickness of the crud layer on fuel assemblies reloaded into the reactor, and it reduces the total mass of crud within the reactor [2]. The aforementioned methods have successfully reduced occurrences of CIPS and CILC in the operating reactor fleet with limitations. For example, ultrasonic cleaners do not remove enough particulate to prevent crud-induced effects.
Therefore, advanced simulation tools for predicting crud growth and its impact on reactor performance and safety are highly desired by reactor core designers in order to minimize or completely eradicate the adverse effects of crud. Some efforts have been made in the nuclear industry in this regard. The boron offset anomaly toolbox (BOA) is a tool developed by the Electric Power Research Institute (EPRI) and Westinghouse capable of predicting the mass of boron that deposits within crud on a nodal basis. BOA is often used to check a PWR loading pattern’s susceptibility to CIPS [2]. Finally, utilities have developed their own proprietary operating limits for lowering instances of CIPS and CILC based on correlated parameters such as number of fuel rods predicted to undergo subcooled boiling or maximum soluble boron concentration. However, the use of BOA or utility operating limits for preventing CIPS and CILC can lead to overly conservative core loading patterns that require an increase in fresh fuel loading.
This work provides the initial progress of a new methodology for reducing the effects of crud deposition within PWRs by using a genetic algorithm and a neural network surrogate model based on the crud chemistry code MAMBA [9] for designing loading patterns that mitigate the effects of CIPS and CILC without penalizing other loading pattern objectives such as enrichment or cycle length. The crud chemistry code MAMBA was chosen for this work because it performs the crud calculations at the pin level. This level of depth is desired in order to readily understand how the optimization algorithm is changing the loading pattern design in order to account for crud deposition. CrUdNET, the neural network surrogate model developed for this work, is a necessary replacement of MAMBA because MAMBA simulations are computational cost prohibitive for use with optimization algorithms. For example, solutions were evaluated in sixteen parallel processes. Directly running MAMBA in this way would require 896 processors and take approximately 400 h to perform the optimization. In addition, an experimental database suitable for training a neural network based crud chemistry code is not available, which makes the simulation data the only feasible option.
A neural network, a popular family of machine learning (ML) algorithms, is used in this work as a surrogate model for crud evaluation. ML is observing increasing application in the field of nuclear engineering. ML algorithms have been applied to cross section predictions [15], neutron transport acceleration [16], and accident classification [17]. Neural networks were used as surrogate models in loading pattern optimizations. For example, they have been applied as a core simulator for evaluating loading pattern solutions [18,19]. Additionally, ML algorithms have been a preemptive evaluator to reduce the computational burden of the optimization [20].
Genetic algorithms (GAs) were chosen to perform core loading pattern optimization due to their long history of application in the field. They were one of the first optimization algorithms applied to the core loading pattern problem [21]. They have been successfully applied numerous times to PWRs [22,23], and they have also been used for the loading pattern optimization of boiling water reactors [24,25,26,27]. Moreover, GAs have served as the yardstick by which new optimization methodologies are measured. For example, GA was one of the benchmarks used to evaluate development of Tabu algorithms for fuel loading pattern optimization [28,29]. Likewise, it has been used to test the development of various particle swarm algorithms [30,31]. GAs were also used in a wide comparison of optimization methodologies for BWR loading pattern optimization [32].
2. Optimization Tools and Methods
This work made use of the neural network surrogate model crUdNET and a GA within the Modular Optimization Framework (MOF) [33,34]. This section provides a brief discussion of these tools, and how they are employed for crud optimization.
2.1. Neural Network for CRUD Modeling
Pin-level crud calculations are desired to understand how changes in the loading pattern affect the crud distribution. This necessitates the use of the crud chemistry code MAMBA for its capability of calculating crud deposition on a pin level basis, as opposed to BOA which provides results on a nodal level.
MAMBA has been integrated into the core simulator VERA [9,35]. Through VERA, MAMBA is coupled to the neutronics solver MPACT [36] and subchannel thermal hydraulics code CTF [37]. MAMBA uses information provided by these two codes and Equation (1) to calculate the surface deposition of crud on every fuel rod across a PWR [9].
In Equation (1), represents the deposited crud molar density after timestep . represents the non-boiling crud deposition rate. represents the boiling deposition rate, and represents the boiling heat flux obtained through the VERA coupling. , , and are multiplied by the term , which represents the concentration of nickel-ferrite particulate in the reactor coolant. Lastly, and represent the erosion rate and surface kinetic energy which account for the crud that erodes from the surface of the fuel rod [9].
MAMBA coupled within VERA requires significant numbers of processors and wall-clock time. This makes a fully coupled MAMBA analysis unsuitable for use in an optimization algorithm. For this reason, MAMBA is replaced with a convolutional neural network (CNN) based on the U-NET neural network architecture [38] to assess crud deposition. Reference [33] details why the U-NET neural network architecture was selected for the surrogate model.
Figure 2 shows the architecture of the CNN surrogate model, crUdNET. CrUdNET was designed to predict the change in the crud distribution at a single axial layer of the 3D CTF mesh in a reactor core. In essence, crUdNET can be thought of as replacing Equation (1) with Equation (2) for performing reactor core crud deposition calculations.
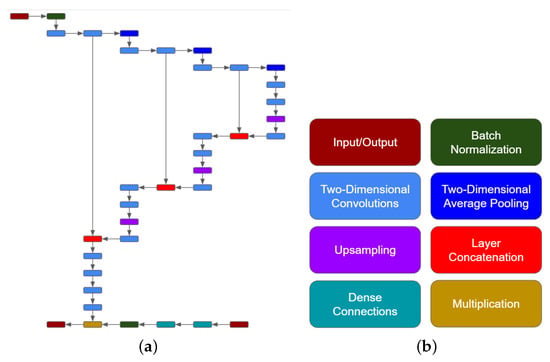
Figure 2.
(a) The neural network architecture of the crUdNET surrogate model. (b) Key proivding each of the neural network layers used in crUdNET.
In Equation (2), F represents the change in the crud surface density as predicted by crUdNET, and the crud densities are altered from molar densities to surface mass densities at the beginning and end of a time step, , . The density is altered because VERA reports the surface mass density in units g/cm, rather than the molar density mol/cm. As the primary driver of crud deposition in MAMBA, F is naturally a function of the nickel-ferrite particulate in the coolant, , in parts per billion [9]. By using multiple trained networks, developed uniquely for each axial layer, a reconstruction of the three-dimensional (3D) crud distribution is obtainable. Thus, the use of crUdNET reformulates the crud deposition analysis from an analytical problem to a pattern recognition problem. The soluble boron concentration in the coolant in parts per million (ppm), , and end of time step cycle exposure in Giga-Watt-days/Metric-Ton-Uranium (GWD/MTU), E are also provided to aid in pattern recognition. In broad terms, cycle exposure accounts for the nuclear fuel residence time in the core, while soluble boron concentration reflects the reactivity of the fuel. The higher the soluble boron concentration, the more reactive the fuel is, and so more crud should likely deposit. In other words, less and less crud will deposit in the reactor towards the end of the cycle exposure. Lastly, F is a function of the change in the whole core pin power distribution, , given by Equation (3).
The leakyReLU activation function, given in Equation (4), is used as the activation between all layers in crUdNET [39]. The number of nodes used in the layers of crUdNET are provided in Table 1. Convolutional layers used a window size of .

Table 1.
Number of nodes used in the layers of crUdNET.
The difference in the pin power distribution, , is provided as input to the “U” portion of the neural network. Here, the data is first normalized in the batch normalization layer before being transformed by a series of 2D convolutional and averaging nodes. These nodes transform the data, shaping it from a core-wide matrix of data to an assembly wide matrix which identifies which assemblies are most likely to see significant changes in crud deposition. Through a series of more convolutional nodes, upsampling nodes, and concatenation nodes, the network then transforms this data into the core-wide crud distribution, in relative quantities, for a single layer in the 3D CTF mesh. Meanwhile, the inputs , , and E are fed into the linear dense connections of the neural network where they are transformed and normalized to determine the scale of the change in the crud deposition. Lastly the spatial distribution and scaling terms are multiplied together and output from the neural network in order to get the final change in the crud distribution. As Equation (2) shows, the cycle crud deposition can then be calculated by summing the outputs of the network over each timestep [40].
CrUdNET was trained based on a fixed time step, , of 0.5 GWd/MTU. Pin-powers, soluble boron concentrations, and cycle exposures are provided by a nodal analysis code. which was used to replace MPACT for nuclear analysis to reduce the computational burden of developing the training library, while this means that the CTF+MAMBA analyses are decoupled from neutronics, this does not impact this work [33].
CrUdNET was trained on a library of 6600 unique sets of input and output data in an 80/20 training/validation split. The performance of crUdNET was then tested against a further 1500 unique samples [33]. The training and testing inputs were developed through repeated core loading pattern optimizations to obtain , , and E. was obtained through random sampling. Figure 3 provides a comparison of MAMBA and crUdNET for a crud distribution at end of cycle (EOC) for a reactor predicted by crUdNET. Figure 3 shows that crUdNET provides acceptable agreement with MAMBA in predicting crud distributions. Figure 3 also represents a computational power reduction from 540 processors and 1 h of wall clock time to a single processor and 30 s of wall clock time. More detailed explanations on the development and training process for crUdNET used in this work were previously presented in reference [33].
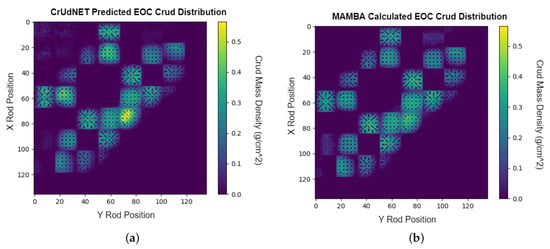
Figure 3.
(a) The crud distribution at EOC as predicted by crUdNET. (b) The crud distribution at EOC as calculated by MAMBA for a reactor core.
2.2. Genetic Algorithm
The main features of a GA are crossover, mutation, and selections [41]. For this work, the GA was developed using MOF, an object-oriented code for facilitating the rapid development and application of optimization algorithms [34]. This GA utilized is relatively standard.A flowchart of the GA is provided in Figure 4.
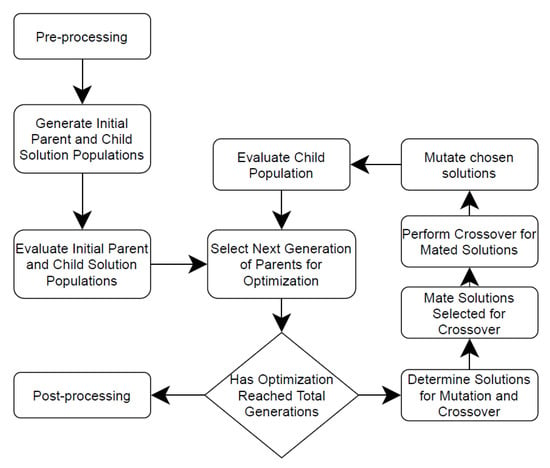
Figure 4.
Flowchart of the GA used for loading pattern optimization developed through MOF.
The initial population of solutions is generated by randomly selecting assembly types allowed for each core location in all initial solutions. All solutions that pass the selection process become parents to the next generation of solutions. Solutions are selected to undergo either mutation or crossover, based on the mutation rate. For each solution a random number is drawn. If the number is less than the current mutation rate, the solution is selected to undergo mutation. Otherwise the parent solution will create a new solution through crossover. All solutions selected for crossover are designed to mate and undergo crossover with the most genetically similar solution. This mating is performed by selecting the first un-mated solution, and examining the remaining un-mated solutions for the highest number of fuel assembly types in the same position. These solutions are then mated for crossover. A solution can only be mated once for undergoing crossover.
Crossover is performed by exchanging fresh fuel assemblies in the same core location between the two genomes while the positions of reloaded fuel assemblies are shuffled within the core. These restrictions on crossover ensure that the inventory on fresh and burned fuel assemblies is preserved throughout the entire optimization. This is done in place of other techniques, such as throwing out solutions that violate the used fuel inventory and desired number of fresh fuel assemblies.
Mutation is performed in two ways. Fresh fuel assemblies are allowed to be freely replaced with other available fresh fuel assembly designs, or fresh fuel assemblies can swap their position in the core with another fuel assembly. Reloaded fuel assemblies are allowed to exchange positions only within the other fuel assemblies in the solution. The number of solutions that undergo mutation is determined by the mutation rate R, and Equation (5) [34].
where and are the updated and current mutation rate, respectively, and is defined by
where and are the initial and final mutation rate, respectively, [34].
Selection is performed using the tournament method [42]. The tournament method is completely random, allowing parents to compete against child solutions, child solutions to compete against other child solutions, and parent solutions to compete against other parents. Specific parameters of the GA, such as the mutation rate and population size, are provided with the relevant optimization performed.
2.3. Crud Optimization Methodologies
Solutions generated by MOF are evaluated in a two-step process. In the first step, a neutronic analysis is performed to evaluate the loading pattern designed by the GA. This provides information on the radial rod power peaking, soluble boron concentrations, and cycle length. This also provides soluble boron concentrations, exposures, and the quarter-core power distribution for crUdNET. In the second step, these values are combined with a nickel particulate concentration history to calculate the crud distribution produced by the solution. As previously mentioned, solutions were evaluated in sixteen parallel processes. This was a limit set by a system limit on the number of parallel nuclear simulation evaluations that could be performed in parallel.
In order to evaluate the effectiveness of optimizing crud, an initial optimization is first performed without any optimization objectives related to crud. The optimization is then re-performed. This second optimization includes an objective related to crud, and it begins from an initial random population just as the first optimization. The crud optimization is considered successful if the optimized solution provides similar results to the initial optimization in regard to the non-crud objectives, and must show improved performance in regard to crud over the first optimized solution when evaluated using CTF+MAMBA. For this work, the results of MAMBA calculations are taken as the true crud deposition.
Three optimization objectives unrelated to crud were used in each optimization. The first objective was maximizing the cycle length based on a fixed number of fresh fuel assemblies. This was used in place of meeting requirements on a specified cycle length and minimizing the core-wide enrichment. The second objective was minimizing the cycle peak soluble boron concentration. The third objective was minimizing radial rod power peaking (FH). This is calculated using Equation (7).
Core loading pattern optimization was performed on the third cycle of a four-loop, 193 assembly, Westinghouse PWR. This model used geometry and operating conditions from the publicly available P9 progression problem published by CASL [43]. Heuristic restrictions were imposed on where certain types of fuel assemblies could be placed when generating initial solutions. This is a requirement and limitation of MOF in order to maintain the desired fuel inventory because MOF can only directly track the number of decision variables in a group, not how the placement of those decision variables affect total assembly count in a full core arrangement. Fuel assemblies were divided into four symmetry groups based on allowed location in the core (i.e., major and minor axis, non-axis), and whether they were a fresh or previously burned fuel assembly. Figure 5 provides the allowed locations of assemblies for the four groups. 1’s denote allowed locations and 0’s denote prohibited locations. Figure 5 shows that fresh fuel assemblies are grouped based on octant or quarter symmetry depending on whether they are axis or non-axis locations.
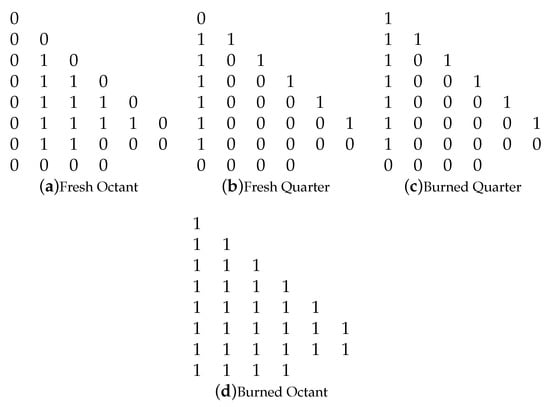
Figure 5.
Decision variable maps for the four fuel assembly groups used in each optimization case: (a) fresh fuel assemblies in octant symmetry, (b) fresh fuel assemblies in quarter symmetry, (c) burned fuel assemblies previously placed in quarter symmetry, (d) burned fuel assemblies previously placed in octant symmetry.
3. Optimization Methodologies and Results
Two optimization methodologies were tested. The first sought to reduce the total mass of crud in the core. The second sought to have a uniform amount of crud distribute on all fuel rods in the core.
3.1. Total Crud Mass Reduction
The logical first objective regarding crud deposition would be minimizing the total mass of crud that deposits within the reactor core. Reducing the total mass of crud that deposits in the core reduces the risk of CIPS and CILC. A methodology for reducing the total crud mass was proposed, however it turned out that this optimization objective could not be optimized using the chosen toolset.
The proposed optimization objective formulation for reducing the total core crud mass was quite simple. Three crUdNET models were trained. Each model predicted the crud distribution at a different axial elevation. Per Equation (8), these three predictions, , are summed across all fuel rods, , to produce a single crud mass value.
The crud mass optimization methodology was explored using six test cases. Cases differed in two ways: (1) whether the limiting value FH was 1.55 or 1.60, and (2) whether the case used 84, 88, or 92 fresh fuel assemblies. This exploratory study consisted of generating an optimized loading pattern using MOF based on each of the six cases using the previously described non-crud related optimization objectives. These objectives were maximizing cycle length, measured in effective full power days (EFPD), and meeting the described limits on maximum FH and a maximum soluble boron concentration less than 1300 ppm. These cases were then repeated with the inclusion of crUdNET and the crud mass objective described in Equation (8). The twelve optimized cases were then re-analyzed using CTF+MAMBA to determine if the combination of MOF and crUdNET had noticeably reduced the total mass of crud in the core. For this work, the results of MAMBA calculations are taken as the true crud deposition.
The loading pattern parameters for the cases optimized without crud are presented in Table 2. Results for the cases optimized with crud as an optimization objective, are presented in Table 3. Both tables also provide the mass of crud as predicted by crUdNET. This mass is significantly smaller than the total core crud mass because of the use of a subset of axial planes used in the analysis, as described previously. Figure 6 shows the FH values over the course of the cycle for the twelve highest fitness solutions, and Figure 7 provides the soluble boron concentration.

Table 2.
Optimization objective values, including crud mass predicted by crUdNET, for highest fitness solution for optimizations performed without total crud mass optimization objective.

Table 3.
Optimization objective values, including crud mass predicted by crUdNET, for highest fitness solution for optimizations performed with total crud mass optimization objective.
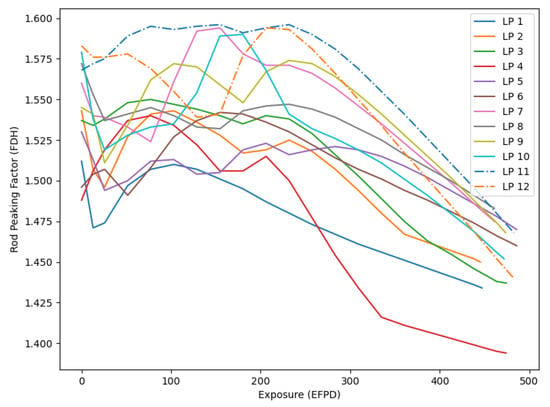
Figure 6.
Comparison of FH versus exposure for the highest fitness solutions for the six optimization cases with and without crud objectives.
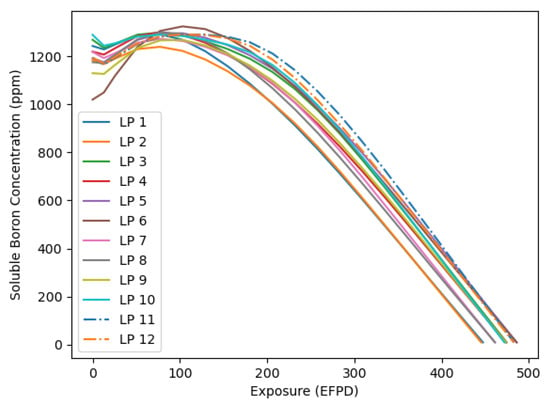
Figure 7.
Comparison of the soluble boron concentration for the highest fitness solutions for the six optimization cases with and without crud objectives.
Table 2 and Table 3 show that in five of the six cases optimized, crUdNET evaluation of the crud objective within the GA lowered the total mass of crud deposited. These tables also show that the highest fitness loading patterns for the 12 optimizations performed are unique. This is further reinforced by Figure 6 and Figure 7, which show unique FH and soluble boron concentration histories for each of the 12 cases analyzed.
Figure 8 shows the total mass of crud within the core, as calculated by MAMBA, over the length of the cycle for the 12 cases. Table 4 provides the EOC total crud mass for the twelve cases.
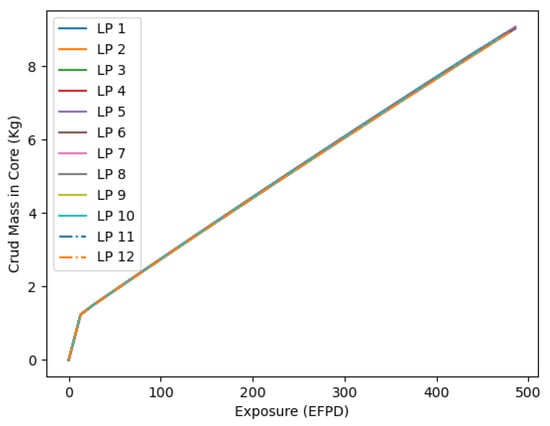
Figure 8.
Whole crud mass, as calculated by MAMBA, versus exposure for loading patterns analyzed in crud mass optimization.

Table 4.
Comparison of total core crud mass, as calculated by MAMBA, at cycle exposure of 438 EFPD for the 12 highest fitness solutions for the total core crud mass optimization demonstrations.
Table 2, Table 3 and Table 4 and Figure 8 mean several things. The significant difference in mass between the crUdNET predictions and MAMBA calculations indicate that the use of a three-layer modeled by crUdNET is not sufficient to represent the whole-core crud mass. Additionally, MAMBA calculating the same crud mass for all twelve loading pattern designs indicate MAMBA is not mature in regard to the total crud mass deposited. It is unlikely for the nickel particulate concentration in the coolant to be the sole factor in determining the core wide crud mass, and for the power distribution to not significantly impact the core-wide crud mass.
Improvements in MAMBA will improve both itself and crUdNET, and further refinement of crUdNET will improve its predictive capability when it comes to total core crud mass. This work will make it possible to use crUdNET, in conjunction with an optimization algorithm, to design loading patterns that drive down the mass of crud that deposits within the reactor core. In the short term however, this means that a different optimization objective is required to demonstrate that crUdNET can successfully be used to optimize loading patterns in regard to crud deposition.
3.2. Crud Deposition Analysis
To demonstrate that crUdNET in conjunction with optimization algorithms could control crud deposition, an optimization objective to maximize the uniformity of the crud distribution over the entire reactor was adopted. In other words, the objective is to have as many fuel rods with the same amount of crud as possible. This methodology modeled a single axial layer. Deviation from a uniform distribution was measured via Equations (9) and (10):
For Equations (9) and (10), is the crud mass density for fuel pin i, is the average crud mass density, and D is the deviation from the average value.
Equation (11) is the fitness equation for the deviation from uniform methodology analysis.
In Equation (11), D is the deviation from a uniform distribution given by Equation (10), represents the solution cycle length, F is the maximum rod power peaking, and is the maximum soluble boron concentration.
The GA used a population size of 30 and iterated solutions over 200 generations. Initially, 25% of solutions were mutated, but the number of solutions grew to 55% of solutions by the end of the optimization. Assemblies used in the optimization had enrichments of 4.4, 4.7, or 4.9 w/o. IFBA, gadolinium, and pyrex were used as burnable poisons in the fuel assemblies for all three enrichments. Fuel assemblies containing IFBA used 80 or 120 IFBA rods. Fuel assemblies using gadolinium had either 12 or 24 rods containing gadolinium. Gadolinium was utilized at 3%, 5%, and 8% w/o. Finally, assemblies containing pyrex as a burnable poison used a 12, 16, or 24 pyrex rod configuration.
3.2.1. Optimization Results
Figure 9 provides the deviation of crud from a uniform distribution—as calculated by Equations (9) and (10)—in the reactor over the course of the cycle as predicted by crUdNET for the reference and test methodology optimizations. The reference optimization did not include the optimization objective related to crud. The test optimization methodology sought minimize the deviation from a uniform crud distribution. Figure 9 shows that the use of crUdNET significantly improved the uniformity of the crud distribution across the reactor core.
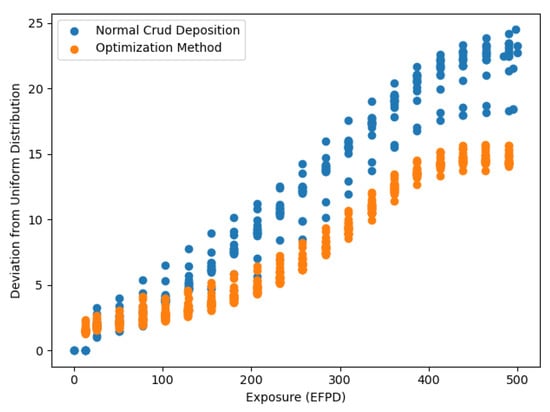
Figure 9.
Deviation from a uniform crud distribution using crUdNET with and without considering crud as an optimization objective.
As mentioned, crUdNET and the optimization algorithm are considered to have successfully optimized the crud distribution if the optimization objective for the test methodology is improved over the reference value when solutions for both optimizations are evaluated using MAMBA. Figure 10 is reproduced Figure 9 using MAMBA, rather than crUdNET, to calculate the crud distribution for the population of solutions. It shows that although the difference between the two populations in terms of deviance from a uniform crud distribution is significantly smaller, the population of solutions optimized for crud clearly shows lower values, and thus a more uniform crud distribution than the reference optimization population.
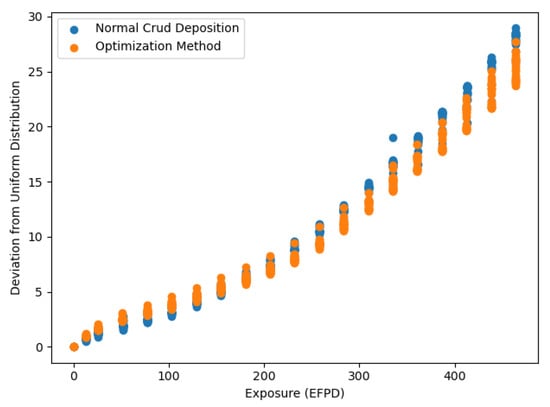
Figure 10.
Deviation from a uniform crud distribution using MAMBA with and without considering crud as an optimization objective.
Figure 10 shows that crUdNET and optimization algorithms can be combined to directly optimize crud distributions through the fuel loading pattern. This provides a significant advancement toward reducing the effects of CIPS and CILC within PWRs by providing core design engineers with a direct means of evaluating and manipulating the crud distribution when designing loading patterns. This is an improvement over current methods that seek to reduce crud deposition based on correlated parameters or evaluating crud as part of a post processing analysis.
It is also important to understand how the genetic algorithm optimized the loading pattern in regard to crud. Figure 11 provides the loading patterns for the highest fitness solutions for the reference optimization and crud optimization test methodology. The comparison shows that the loading pattern for the test methodology has a larger concentration of fresh fuel assemblies toward the outer edge of the reactor core.
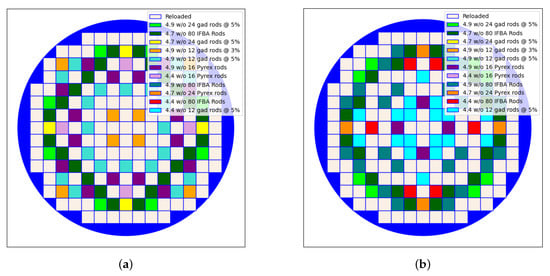
Figure 11.
(a) The loading pattern for the highest fitness solution in the reference optimization. (b) The loading pattern for the highest fitness solution in the test methodology optimization. The loading pattern optimized in the test methodology has far fewer fresh assemblies towards the center of the core than the reference optimization loading pattern.
The effects are shown in Figure 12 and Figure 13, which compare the power distributions between the loading patterns at beginning of cycle (BOC) and middle of cycle (MOC), respectively. The figures show that the loading pattern optimized for crud maintains higher and denser power concentrations over the reference optimization.
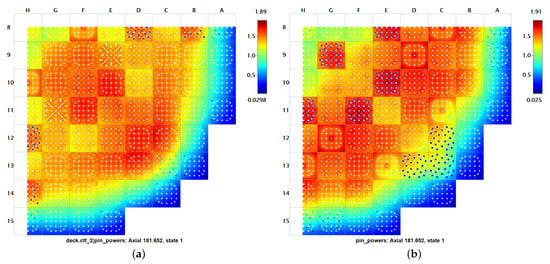
Figure 12.
(a) The BOC power distribution for the highest fitness solution of the reference optimization. (b) The BOC power distribution for the highest fitness solution of the crud test methodology. The solution optimized for crud shows higher power concentrations over the reference solution.
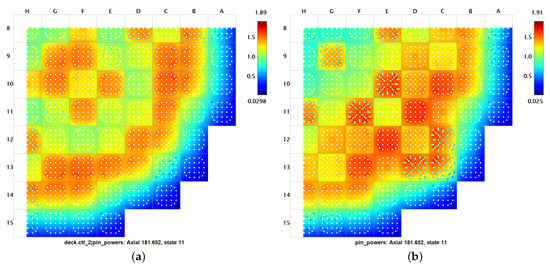
Figure 13.
(a) The MOC power distribution for the highest fitness solution in the reference population. (b) The MOC power distribution for the highest fitness solution in the crud test methodology population. The crud optimized solution shows continued higher power concentrations than the reference case, which has more distributed power.
Figure 14 illustrates the effect of these higher power concentrations on the crud distribution in the loading patterns. Figure 14 indicates that the GA optimized the loading pattern to have a minimal deviation from uniform crud distribution by concentrating the power distribution so that crud grows very densely on a small number of assemblies. This results in most fuel rods having no crud on them, and so the deviation from a uniform distribution is minimized.
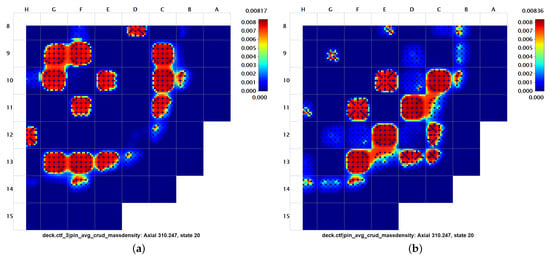
Figure 14.
(a) The EOC crud distribution for the highest fitness solution in the reference optimization population. (b) The EOC crud distribution for the highest fitness solution in the crud test methodology. The GA optimized the deviation from uniform crud distribution objective by designing the loading pattern to concentrate the power. This causes crud to grow in only a few assemblies.
This shows that there is room for improvement in both MAMBA and the surrogate model crUdNET. However, the needs for improvement do not discount this work. Improvements in both crUdNET and MAMBA will only increase the effectiveness of the methods discussed here. The optimization objective demonstrated that the combination of crUdNET and a GA can be successfully used for a multi-objective optimization that designs the crud distribution in a given way while also meeting other requirements such as rod power peaking and cycle length. However, in practice, dense distributions of crud, such as the one shown in Figure 14, created through the optimization are undesirable. Refinement of MAMBA, crUdNET, and the crud optimization objective will significantly improve reactor performance with respect to CIPS and CILC.
3.2.2. Note on the Mass of Boron in Crud
Although not the focus, the boron mass deposited in crud was calculated as part of the MAMBA crud deposition analysis. The total boron mass in crud over cycle exposure for cases analyzed in MAMBA are presented in Figure 15. Figure 15 shows that there is nearly a 50 g range mass of boron that uptakes into the crud layer. This implies that loading pattern optimization with a reduced-order model or fast surrogate model trained for boron in crud prediction could effectively reduce the impact or occurrence of CIPS without penalizing other parameters such as enrichment or cycle length.
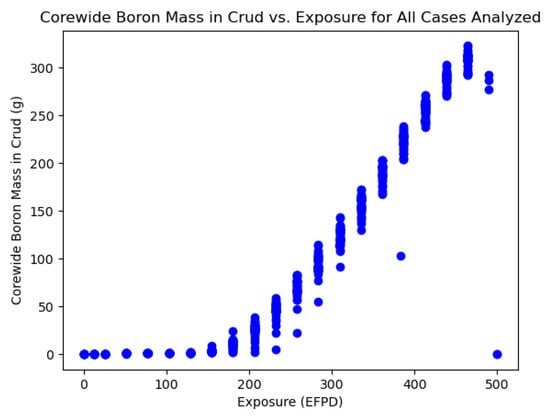
Figure 15.
The boron mass in crud values for all cases analyzed using MAMBA show a large amount of variation, indicating that loading pattern optimization can be utilized to reduce instances of CIPS.
4. Conclusions and Future Work
This work presents a proof of concept demonstration that neural network surrogate models combined with optimization algorithms such as the GA can optimize properties related to crud deposition in nuclear reactors via loading pattern optimization. Deficiencies in both MAMBA and the modeling approach taken with crUdNET prevented optimization of the mass of crud that deposits in the core. However, by setting a crud related optimization objective to minimize the deviation from a uniform crud distribution, it was shown that the GA could successfully use crUdNET to develop loading patterns that outperformed a reference optimization regarding this parameter without sacrificing other objectives of the loading pattern optimization including power peaking, cycle length, and maximum soluble boron concentration.
CrUdNET’s accuracy requires some improvement. The most immediate way in which the fidelity of crUdNET could be improved is through the introduction of ensemble modeling. Ensemble modeling is a powerful tool for increasing the predictive capability of neural networks, and the expansion of the surrogate modeling used in this work to multiple neural network architectures trained using varying data sets would greatly increase the accuracy of crUdNET. Additionally, it was shown that there is need for improvement in MAMBA, particularly regarding the crud mass calculations. As MAMBA matures the strength of the neural network surrogate models and the efficacy of the methods demonstrated here will only improve.
These improvements will also allow for the further exploration of optimization objectives related to crud. The deviation from a uniform crud distribution was used here based on the current capabilities of both MAMBA and crUdNET. Improvements to MAMBA and crUdNET will allow for the inclusion of other optimization objectives such as the core crud mass or maximum density of crud on fuel assemblies. Lastly, Figure 15 showed that there is a significant amount of variance between loading pattern designs in the total mass of boron that uptakes into the crud distribution. This provides the motivation for developing a surrogate model dedicated to predicting the boron uptake into the crud layer. The development of such a model would allow for the direct analysis and inclusion within the optimization of a loading patterns risk to CIPS using the methods demonstrated in this work.
Author Contributions
Conceptualization, J.H., A.G. and D.K.; Methodology, B.A., J.H., A.G. and D.K.; Software, J.H. and A.G.; Formal analysis, B.A.; Investigation, B.A. and D.K.; Data curation, B.A.; Writing—original draft, B.A.; Writing—review & editing, J.H. and D.K.; Visualization, B.A.; Supervision, D.K.; Funding acquisition, D.K. All authors have read and agreed to the published version of the manuscript.
Funding
This research was supported by the Consortium for Advanced Simulation of LightWater Reactors (www.casl.gov), an Energy Innovation Hub (http://www.energy.gov/hubs) for Modeling and Simulation of Nuclear Reactors under US Department of Energy (DOE) contract no. DE-AC05-00OR22725. This research used resources of the Compute and Data Environment for Science at the Oak Ridge National Laboratory, which is supported by the DOE Office of Science under contract no. DE-AC05-00OR22725. This research used the resources of the High Performance Computing Center at Idaho National Laboratory, which is supported by the DOE Office of Nuclear Energy and the Nuclear Science User Facilities under contract no. DE-AC07-05ID14517.
Data Availability Statement
Not applicable.
Acknowledgments
The authors wish to express their thanks to researchers at Oak Ridge National Laboratory for their work on VERA and MAMBA, as well as for their help on this project.
Conflicts of Interest
The authors declare no conflict of interest.
References
- Thomas Wellock, U.S. NRC Blog, Crud: Another Acronym Bites the Dust. Available online: https://public-blog.nrc-gateway.gov/2015/03/31/crud-another-acronym-bites-the-dust/ (accessed on 10 September 2022).
- Frattini, P.L.; Blok, J.; Chauffriat, S.; Sawicki, J.A. Axial offset anomaly: Coupling PWR primary chemistry with core design. Nucl. Energy 2001, 40, 123–135. [Google Scholar] [CrossRef]
- Uchida, S.; Asakura, Y.; Suzuki, H. Deposition of boron on fuel rod surface under subcooled boiling conditions- An approach toward understanding AOA occurrence. Nucl. Eng. Des. 2011, 241, 2398–2410. [Google Scholar] [CrossRef]
- Johnson, N.; Wu, J.; Morrison, J.; Connolly, B.; Banks, A. Mechanisms of Crud Deposition in Pressurised Water Nuclear Plant. In Proceedings of the 17th International Conference on Environmental Degradation of Materials in Nuclear Power Systems—Water Reactors, Ottawa, Canada, 9–13 August 2015. [Google Scholar]
- Roe, J. Effects of Crud Buildup and Boron Deposition on Power Distribution and Shutdown Margin. Available online: https://www.nrc.gov/reading-rm/doc-collections/gen-comm/info-notices/1997/in97085.html (accessed on 10 September 2022).
- Joe, J.H.; Kim, S.J.; Jones, B.G. A study of solute transport of radiolysis products in crud and its effects on crud grown on PWR fuel pin. Nucl. Eng. Des. 2016, 300, 433–451. [Google Scholar] [CrossRef]
- Sawicki, J.A. Evidence of Ni2FeBO5 and m-ZrO2 precipitates in fuel rod deposits in AOA-affected high boiling duty PWR core. J. Nucl. Mater. 2008, 374, 248–269. [Google Scholar] [CrossRef]
- Dumnernchanvanit, I.; Zhang, N.Q.; Robertson, S.; Delmore, A.; Carlson, M.B.; Hussey, D.; Short, M.P. Initial Experimental evaluation of crud-resistant materials for light water reactors. J. Nucl. Mater. 2018, 498, 1–8. [Google Scholar] [CrossRef]
- Collins, B.; Galloway, J.; Salko, R., Jr.; Clarno, K.; Wysocki, A.; Okhuysen, B.; Andersson, A.D. Whole Core Crud-Induced Power Shift Simulations Using VERA. In Proceedings of the Physor 2018: Reactor Physics Paving the Way towards More Efficient Systems, Cancun, Mexico, 22–26 April 2018. [Google Scholar]
- Short, M.P.; Hussey, D.; Kendrick, B.K.; Besmann, T.M.; Stanek, C.R.; Yip, S. Multiphysics modeling of porous CRUD deposits in nuclear reactors. J. Nucl. Mater. 2013, 443, 579–587. [Google Scholar] [CrossRef]
- Jin, M.; Short, M. Multiphysics modeling of two-phase film boiling within porous corrosion deposits. J. Comput. Phys. 2016, 316, 504–518. [Google Scholar] [CrossRef]
- Park, M.-S.; Shim, H.-S.; Baek, S.H.; Kim, J.G.; Hur, D.H. Effects of oxidation states of fuel cladding surface on crud deposition in simulated primary water of PWRs. Ann. Nucl. Energy 2017, 103, 275–281. [Google Scholar] [CrossRef]
- Short, M.P. The particulate nature of the crud source term in light water reactors. J. Nucl. Mater. 2018, 509, 478–481. [Google Scholar] [CrossRef]
- Shim, H.-S.; Park, M.-S.; Baek, S.H.; Hur, D.-H. Effect of aluminum oxide coated on fuel cladding surface on crud deposition in simulated PWR primary water. Ann. Nucl. Energy 2018, 121, 607–614. [Google Scholar] [CrossRef]
- Pawel, A.; Collins, B.; Maldonado, G.I. Machine Learning Algorithms for Nodal Method Cross-Section Functionalization. In Proceedings of the Physor 2018: Reactor Physics Paving the Way towards More Efficient Systems, Cancun, Mexico, 22–26 April 2018. [Google Scholar]
- Tano, M.E.; Ragusa, J.C. Accelerating Radiation Sn Transport Solves Using Artificial Neural Networks. In Proceedings of the Transactions of the American Nuclear Society, Washington, DC, USA, 17–21 November 2019; Volume 121, pp. 825–827. [Google Scholar]
- Mena, P.; Kirby, L. Machine Learning Accident Classification Using Nuclear Reactor Data. In Proceedings of the Transactions of the American Nuclear Society, Washington, DC, USA, 17–21 November 2019; Volume 121, pp. 825–827. [Google Scholar]
- Ortiz, J.J.; Requena, I. Using a multi-state recurrent neural network to optimize loading patterns in BWRs. Ann. Nucl. Energy 2004, 31, 789–803. [Google Scholar] [CrossRef]
- Erdogan, A.; Geckinli, M. A PWR reload optimisation code (XCore) using artificial neural networks and genetic algorithms. Ann. Nucl. Energy 2003, 30, 35–53. [Google Scholar] [CrossRef]
- Ortiz-Servin, J.J.; Pelta, D.A.; Cadenas, J.M.; Castillo, A.; Montes-Tadeo, J.L. Methodology for integrated fuel lattice and fuel load optimization using population-based metaheuristics and decision trees. Prog. Nucl. Energy 2018, 104, 264–270. [Google Scholar] [CrossRef]
- Poon, P.W.; Parks, G.T. Optimizing PWR reload core design. In Proceedings of the Parallel Problem Solving from Nature, 2, Brussels, Belgium, 28–30 September 1992. [Google Scholar]
- Alim, F.; Ivanov, K.; Levine, S.H. New genetic algorithms to optimize PWR reactors Part I: Loading Pattern and burnable poison placement optimization techniques for PWRs. Ann. Nucl. Energy 2008, 35, 93–112. [Google Scholar] [CrossRef]
- Israeli, E.; Gilad, E. Novel genetic algorithm for loading pattern optimization based on core physics heuristics. Ann. Nucl. Energy 2018, 118, 35–48. [Google Scholar] [CrossRef]
- Martin-del-Campo, C.; Francois, J.-L.; Avendano, L.; Gonzalez, M. Development of a BWR loading pattern design system based on modified genertic algorithms and knowledge. Ann. Nucl. Energy 2004, 31, 1901–1911. [Google Scholar] [CrossRef]
- Martin-del-Campo, C.; Palomera-Perez, M.-A.; Francois, J.-L. Advanced and flexible genetic algorithms for BWR fuel loading pattern optimization. Ann. Nucl. Energy 2009, 36, 1553–1559. [Google Scholar] [CrossRef]
- Kobayashi, Y.; Aiyoshi, E. Optimization of a Boiling Water Reactor Loading Pattern Using an Improved Genetic Algorithm. Nucl. Technol. 2003, 143, 144–151. [Google Scholar] [CrossRef]
- Francois, J.L.; Lopez, H.A. SOPRAG: A system for boiling water reactors reload pattern optimization using genetic algorithms. Ann. Nucl. Energy 1999, 26, 1053–1063. [Google Scholar] [CrossRef]
- Mawdsley, M.; Parks, G. In-Core PWR Loading Pattern Optimization Via Tabu Search. In Proceedings of the Physor 2018: Reactor Physics Paving the Way towards More Efficient Systems, Cancun, Mexico, 22–26 April 2018. [Google Scholar]
- Hill, N.J.; Parks, G.T. Pressurized water reactor in-core nuclear fuel management by tabu search. Ann. Nucl. Energy 2015, 75, 64–71. [Google Scholar] [CrossRef]
- Safarzadeh, O.; Zolfaghari, A.; NOrouzi, A.; Minuchehr, H. Loading pattern optimization of PWR reactors using Artificial Bee Colony. Ann. Nucl. Energy 2011, 38, 2218–2226. [Google Scholar] [CrossRef]
- Khoshahval, F.; Minuchehr, H.; Zolfaghari, A. Performance evaluation of PSO and GA in PWR core loading pattern optimization. Nucl. Eng. Des. 2011, 241, 799–808. [Google Scholar] [CrossRef]
- Francois, J.-L.; Ortiz-Servin, J.J.; Martin-del-Campo, C.; Castillo, A.; Esquivel-Estrada, J. Comparison of metaheuristic optimization techniques for BWR fuel reloads pattern design. Ann. Nucl. Energy 2013, 51, 189–195. [Google Scholar] [CrossRef]
- Andersen, B.; Godfrey, A.; Hou, J.; Kropaczek, D.J. Application of Deep Learning Networks to Surrogate Modeling of Crud Deposition. In Proceedings of the International Conference on Mathematics and Computational Methods Applied to Nuclear Science and Engineering, Raleigh, NC, USA, 3–7 October 2021. [Google Scholar]
- Andersen, B.; Delipei, G.; Kropaczek, D.; Hou, J. MOF: A Modular Framework for Rapid Application of Optimization Methodologies to General Engineering Design Problems. arXiv 2022, arXiv:2204.00141. [Google Scholar]
- Turner, J.A.; Clarno, K.; Sieger, M.; Bartlett, R.; Collins, B.; Pawlowski, R.; Schmidt, R.; Summers, R. The Virtual Environment for Reactor Applications (VERA): Design and architecture. J. Comput. Phys. 2016, 326, 544–568. [Google Scholar] [CrossRef]
- Kochunas, B.; Collins, B.; Stimpson, S.; Salko, R.; Jabaay, D.; Graham, A.; Liu, Y.; Kim, K.-S.; Wieselquist, W.; Godfrey, A.; et al. VERA Core Simulator Methodology for Pressurized Water Reactor Cycle Depletion. Nucl. Sci. Eng. 2017, 185, 616–628. [Google Scholar] [CrossRef]
- Salko, R.; Lange, T.L.; Kucukboyaci, V.; Sung, Y.; Palmtag, S.; Gehin, J.C.; Avromova, M. Development of COBRA-TF for modeling full-core, reactor operating cycles. In Proceedings of the Advances in Nuclear Fuel Management V (ANFM 2015), Hilton Head Island, SC, USA, 29 March–1 April 2015. [Google Scholar]
- Ronneberger, O.; Fischer, P.; Brox, T. U-NET: Convolutional Networks for Biomedical Image Segmentation. arXiv 2015, arXiv:1505.04597. [Google Scholar]
- Chollet, F. Deep Learning with Python; Manning Publications Co.: Shelter Island, NY, USA, 2018. [Google Scholar]
- Andersen, B. A Machine Learning Based Approach to Minimize Crud Induced Effects in Pressurized Water Reactors. Ph.D. Dissertation, North Carolina State University, Raleigh, NC, USA, 2021. [Google Scholar]
- Goldberg, D.E. Genetic Algorithms in Search, Optimization, and Machine Learning; Pearson India Education, Inc.: Noida, India, 1989. [Google Scholar]
- Miller, B.; Goldberg, D. Genetic Algorithms, Tournament Selection, and the Effects of Noise. Complex Syst. 1995, 9, 193–212. [Google Scholar]
- Godfrey, A. CASL-U-2012-0131-004, VERA Core Physics Benchmark Progression Problem Specifications; U.S. Department of Energy: Washington, DC, USA, 2014.
Publisher’s Note: MDPI stays neutral with regard to jurisdictional claims in published maps and institutional affiliations. |
© 2022 by the authors. Licensee MDPI, Basel, Switzerland. This article is an open access article distributed under the terms and conditions of the Creative Commons Attribution (CC BY) license (https://creativecommons.org/licenses/by/4.0/).