Article

An Investigation into Current Sand Control Testing Practices for Steam Assisted Gravity Drainage Production Wells

Department of Civil and Environmental Engineering, University of Alberta, Edmonton, AB T6G 2E3, Canada
*
Author to whom correspondence should be addressed.
Eng 2021, 2(4), 435-453; https://doi.org/10.3390/eng2040027
Submission received: 12 August 2021 / Revised: 22 September 2021 / Accepted: 24 September 2021 / Published: 8 October 2021
(This article belongs to the Special Issue Feature Papers in Eng)

Abstract

:
Sand control screens (SCD) have been widely installed in wells producing bitumen from unconsolidated formations. The screens are typically designed using general rules-of-thumb. The sand retention testing (SRT) technique has gained attention from the industry for the custom design and performance assessment of SCD. However, the success of SRT experimentation highly depends on the accuracy of the experimental design and variables. This work examines the impact of the setup design, sample preparation, near-wellbore stress conditions, fluid flow rates, and brine chemistry on the testing results and, accordingly, screen design. The SRT experiments were carried out using the replicated samples from the McMurray Formation at Long Lake Field. The results were compared with the test results on the original reservoir samples presented in the literature. Subsequently, a parametric study was performed by changing one testing parameter at a test, gradually making the conditions more comparable to the actual wellbore conditions. The results indicate that the fluid flow rate is the most influential parameter on sand production, followed by the packing technique, stress magnitude, and brine salinity level. The paper presents a workflow for the sand control testing procedure for designing the SCD in the steam-assisted gravity drainage (SAGD) operations.

1. Introduction

1.1. Background

Steam-assisted gravity drainage (SAGD) is a thermal production technique for oil extraction from bituminous reservoirs. A pair of horizontal wells are drilled into the reservoir formation. Steam is injected into the reservoir through the injection well to form a steam chamber, heat the bitumen, and reduce its viscosity through conduction and convection (Figure 1). An emulsified water-in-oil bitumen along with condensed water flow by gravity toward the lower well to be pumped out to the surface [1,2].
The in-situ bitumen reserves in Canada are located in unconsolidated oil sands. These naturally loose reservoirs require sand control devices (SCD) to simultaneously support the well, avoid excessive sand production, and let the fine particles pass through the slots and avoid plugging [2,3,4]. Different types of standalone screens (SAS) have been employed to complete the SAGD wells. The slotted liner (SL), wire-wrapped screen (WWS), and punched screen (PS) are the main options [5,6,7]. The slotted liner has been the most common SAS in SAGD operations due to its lower cost, mechanical strength, and reasonable performance in unconsolidated and high-permeable oil sands [4]. The sand control screen’s success can be measured by its ability to control sand production and prevent formation permeability impairment [4].

1.2. Existing Testing Setups

Sand control testing generally aims to evaluate the performance of SCDs under lab conditions emulating in-situ wellbore conditions for screen selection and design purposes. The screens’ performance is usually assessed considering sand production and permeability variations.
A few sand control testing setups and procedures are introduced in the literature, attempting to simulate SAGD production wells. The testing devices in the literature can be categorized into two groups: slurry sand retention testing [8,9,10,11,12,13,14] and pre-pack sand retention testing [3,4,7,13,15,16,17,18,19,20,21,22,23,24,25]. In the slurry testing, a low concentration slurry of sand and fluids is pumped into an empty cell towards the SCD coupon at a constant flow rate. In contrast, in the pre-pack testing, the sand is already packed in the testing cell before flowing fluids towards the SCD coupon. The pre-pack test can represent SAGD well conditions more realistically as the formation collapses onto the liner at the early stages of production. The formation collapse occurs as bitumen melts when exposed to the steam, destroying the oil sand’s intergranular cementation [26].
The first pre-pack setup and procedure for SAGD wells were introduced by Bennion et al. [27] and modified by Romanova et al. [19] and O`Hara [21]. They prepared the sand pack by pouring clean and dry sand particles to fill a cylindrical cell (diameter 6.36 cm, length 40 cm) and then saturating the sand pack with brine. The sand was packed by applying a 500-psi axial load (35.15 kg/m2). Subsequently, flowing fluids (oil, brine, and gas) were injected into the sand pack in 12 stages by incrementally increasing the flow rate. The flow program consisted of four single-phase oil stages, four two-phase stages, three three-phase stages, and a final stage of single-phase oil. The produced solids and pressure drops across the sand pack and near the SCD coupon region were recorded. Bennion et al. [27] employed single-slot coupons underneath the sand pack sample to evaluate the slotted liners’ performance.
Devere-Bennett [3] employed the same testing equipment and procedure while scaling down the fluid flow rates used by Bennion et al. [4]. The author argued that the fluid flow rates in past testing were much higher than those expected for SAGD production wells.
Mahmoudi [22] introduced a new testing facility with larger dimensions, accompanied by a modified testing procedure and multi-slot coupons. Commercial sands were used to replicate the oil sands based on the characterization of core samples. The sand was packed layer by layer using the moist tamping method [28] to create a uniform pack. Then, the sample was saturated under 2 psi (0.14 kg/cm2) axial stress to avoid fluidization, and the low stress was maintained during the flow test to simulate the worst-case scenario of sand production. Brine with a controlled pH and salinity was injected at seven incremental flow rates. Mahmoudi [22] reported the pressure drop across the sand pack and the near-coupon region, the amount of produced fines and sand, and the concentration of fines along the sand pack to develop design criteria for slotted liners.
Anderson [23] developed a large-scale setup to simulate the radial flow regime around the SAGD wells. The work showed a general agreement between the results obtained from the linear and radial flow setups.
Wang et al. [24], Fattahpour et al. [25], and Guo et al. [29] introduced a scaled completion testing (SCT) facility to evaluate the performance of different SCDs at various axial and lateral stress conditions. They used the moist tamping technique and representative brine pH and salinity.
Haftani et al. [30] developed a prepacked full-scale completion testing (FCT) apparatus to simulate the radial-flow regime around the production wells. This facility utilizes a cylindrical-shaped screen to replace a disk-shaped screen coupon employed in other testing devices.
In summary, no standard testing setup and procedure have been established to evaluate the SCD for SAGD wells. It appears that the testing setup and procedure are subjective to the researcher’s understanding of the wellbore conditions being simulated.

1.3. Essential Factors in SCD Design

Different design criteria have been introduced to select the proper sand control device and design the optimum opening size [8,14,31,32]. Particle size distribution (PSD) of the sand in the reservoir is considered the main factor for selecting the SCD type and aperture size [33,34]. Coberly [8] found that stable bridges would always form when the SCD aperture is below D10, and instability would occur at the sizes above 2 × D10. Rogers [35] and Suman et al. [36] also suggested D10 for WWS and SL aperture sizing. Gillespie et al. [10] recommended that 2 × D50 and 2.5 × D50 can be considered as the maximum aperture width for WWS and PS, respectively. Fermaniuk [31] suggested 2 × D70 as the lower band to let the fine particles freely pass the slot and 3.5 × D50 as the largest slot size to avoid excessive sand production. More recent design criteria incorporate the plugging tendency and sanding level to graphically provide a safe slot window for the slotted liner [24,29,32,37].
High fluid flow rates have been linked to SCD failure due to sand production [38] and near-screen plugging caused by fines migration [13,39]. Excessive sanding [38] and fines migration [40] may occur when the flow velocity exceeds the critical velocity. Therefore, in SRT experiments, injecting the fluids at representative flow rates, reflecting the operational condition, is substantial for design purposes.
Mahmoudi et al. [41] and Haftani et al. [42] reported a significant effect of the brine’s pH and salinity on the fines migration from the sensitivity analysis on sand production through several sand retention tests. These observations are consistent with the experimental findings in the relation between fines migration and permeability impairment with the salinity and pH levels of the injected brine [4,40,43]. It has been found that fines migration and permeability reduction are more significant at the lower brine salinity and higher pH levels. Khilar and Fogler [44] introduced a critical salt concentration (CSC) as a certain salinity level below which fine particles detach from the pore walls and migrate inside the porous media. Moreover, it is reported that fines migration is more sensitive to monovalent cations concentration than divalent cations [44]. Therefore, due to the significant effect of the chemical properties of the producing water on the fines migration and permeability variation, it is recommended to conduct the experimental tests emulating the salinity and pH level of the producing water from the wellbores.
Clearly et al. [45] investigated the sand arches’ stability at different stress levels and concluded that more stable sand arches could form in higher stress levels. Coskuner and Maini [46] reported that high-stress levels decrease the critical velocity and mobilize the fine particles at a lower flow rate. Wang et al. [24] and Guo et al. [29] performed experimental studies to evaluate SCD performance and found less sanding and more fines migration at the higher stress magnitudes. Several scholars have applied different axial stress levels in SRT experiments from 2 psi to 500 psi [3,22,47]. The low-stress condition at the screen–oil sands interface has been noted at early SAGD well life when the formation sand collapses over the screen [26].
The sand pack preparation method has also significantly impacted the stress-strain behavior [48,49,50] and liquefaction resistance of sands [51]. Multiple techniques have been proposed to compact the sands and produce homogenous sand pack samples [28,51,52,53,54]. Two packing methods have been employed for SAGD sand control testing in the literature, including dry packing and moist tamping methods. The dry technique involves pouring dry sand into the core holder and applying stress over the sand for compaction [4,19,21]. In the moist tamping method developed by Ladd [28], the sand mixture is packed layer by layer to achieve minimal density and porosity variations [55]. The moist tamping method was employed for sand control testing by Montero et al. [7], Guo et al. [29], and Mahmoudi et al. [56,57].
The literature review reveals that no appropriate protocol has been standardized for sand retention testing to evaluate the SCD’s performance. The testing procedures seem to be subjective, leading to uncertainties in the testing outcomes and interpretation. This paper quantifies and compares the relative impact of testing parameters on sand control test results. The paper proposes a workflow for sand control testing that can be used for SRT experimentation of the sand control screens for SAGD production wells.

2. Experimental Design

This section describes the experimental setup specifications, testing plan, and testing parameters employed in this research.

2.1. Experimental Setup

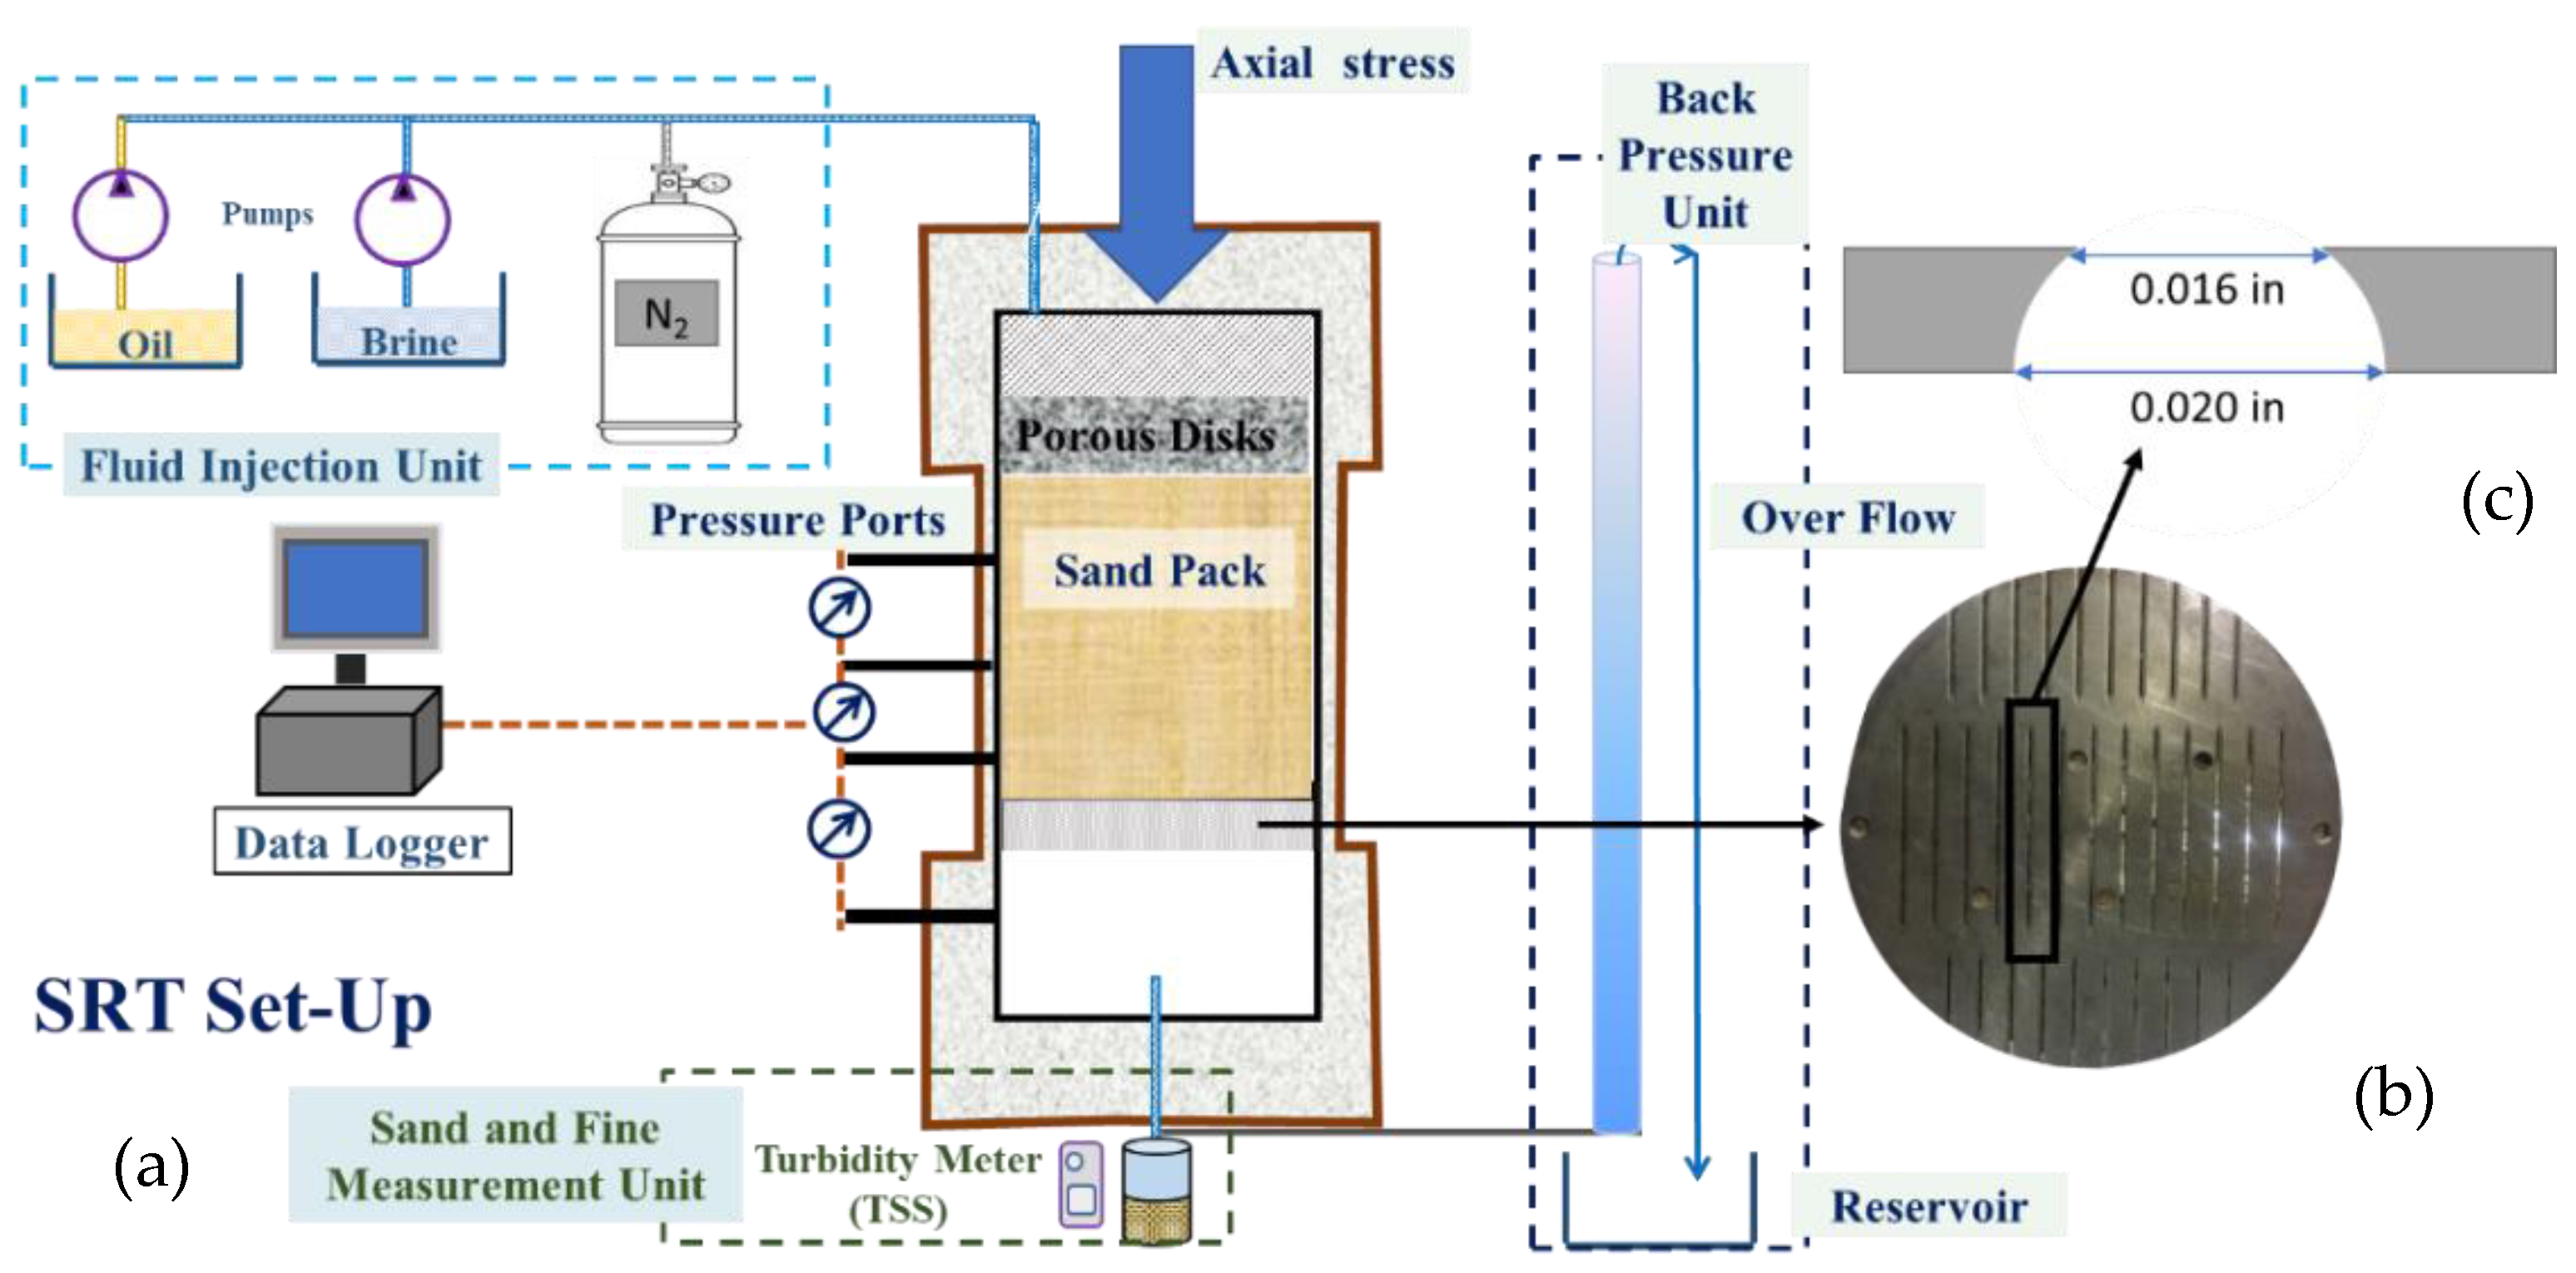
As shown in Figure 2, the SRT facility employed in this study includes six units of (1) sand pack holder/cell, (2) fluid injection unit, (3) loading frame, (4) data acquisition and monitoring unit, (5) sand and fines production measurement unit, and (6) back-pressure unit.
The SRT cell comprises a core holder (inner diameter of 17.1 cm and length of 47 cm), top platen, and base plate. The sand is packed inside the core holder made of aluminum with working pressure up to 690 kPa at 20 °C. Three ports are installed on the cell circumference at 5.08, 17.78, and 30.48 cm from the bottom to measure the differential pressure at the bottom, middle, and top intervals of the sand pack. The setup allows using 17.1-cm-diameter SCD coupons, such as the slotted liner (SL) coupon shown in Figure 2. The top platen transfers the load from the load frame to the sand pack and hydraulically seals the core holder using O-rings. In combination with a porous disk, the top platen provides the conduit for fluid injection, mixing, and uniform distribution into the sand pack. The cell’s outlet is connected to a 185-cm-long back-pressure column to generate minor back-pressure (2.5 psi) on the sand pack during the saturation and flow phases. Low flow rates are introduced into the sand pack during the saturation phase through this back-pressure column to avoid the flow channeling.
The fluid injection unit consists of two mechanically actuated triplex diaphragm pumps. Both pumps can inject brine and mineral oil at rates of up to 18 L per hour with an adjustment range of 1:50 and flow rate adjustment of ±1%. The flow rate output is controlled by adjusting the stroke length and the pump frequency through a variable frequency drive. The triplex design couples with a pulse damper to introduce pulsation-free fluid flow into the cell. Gas is delivered through a high-pressure nitrogen tank connected to a pressure regulator and gas rotameter with a choke to simulate the steam breakthrough in SAGD wells. Stress is applied to the sand pack from the load frame through the top platen. The load frame can apply a maximum force of 8 metric tons.
Three differential transducers with a maximum range of 74 kPa (10.8 psi) and accuracy of ±0.022% of the full range are installed to record the pressure difference in certain intervals of the sand pack. The transducers are connected to the National Instruments Data Acquisition System Model USB-6002 to continuously record the differential pressures on a computer using DAQ express software.
The sand and fines production measurement unit consists of a sand trap to collect the produced sand and fines. The sand trap is a flanged cylinder with a blind flange at the bottom to collect the produced sand. A narrow pipe is installed beneath the coupon to take fluid samples for quantifying the concentration of fines inside the produced water using a turbidity meter.

2.2. Sand Pack Material Preparation

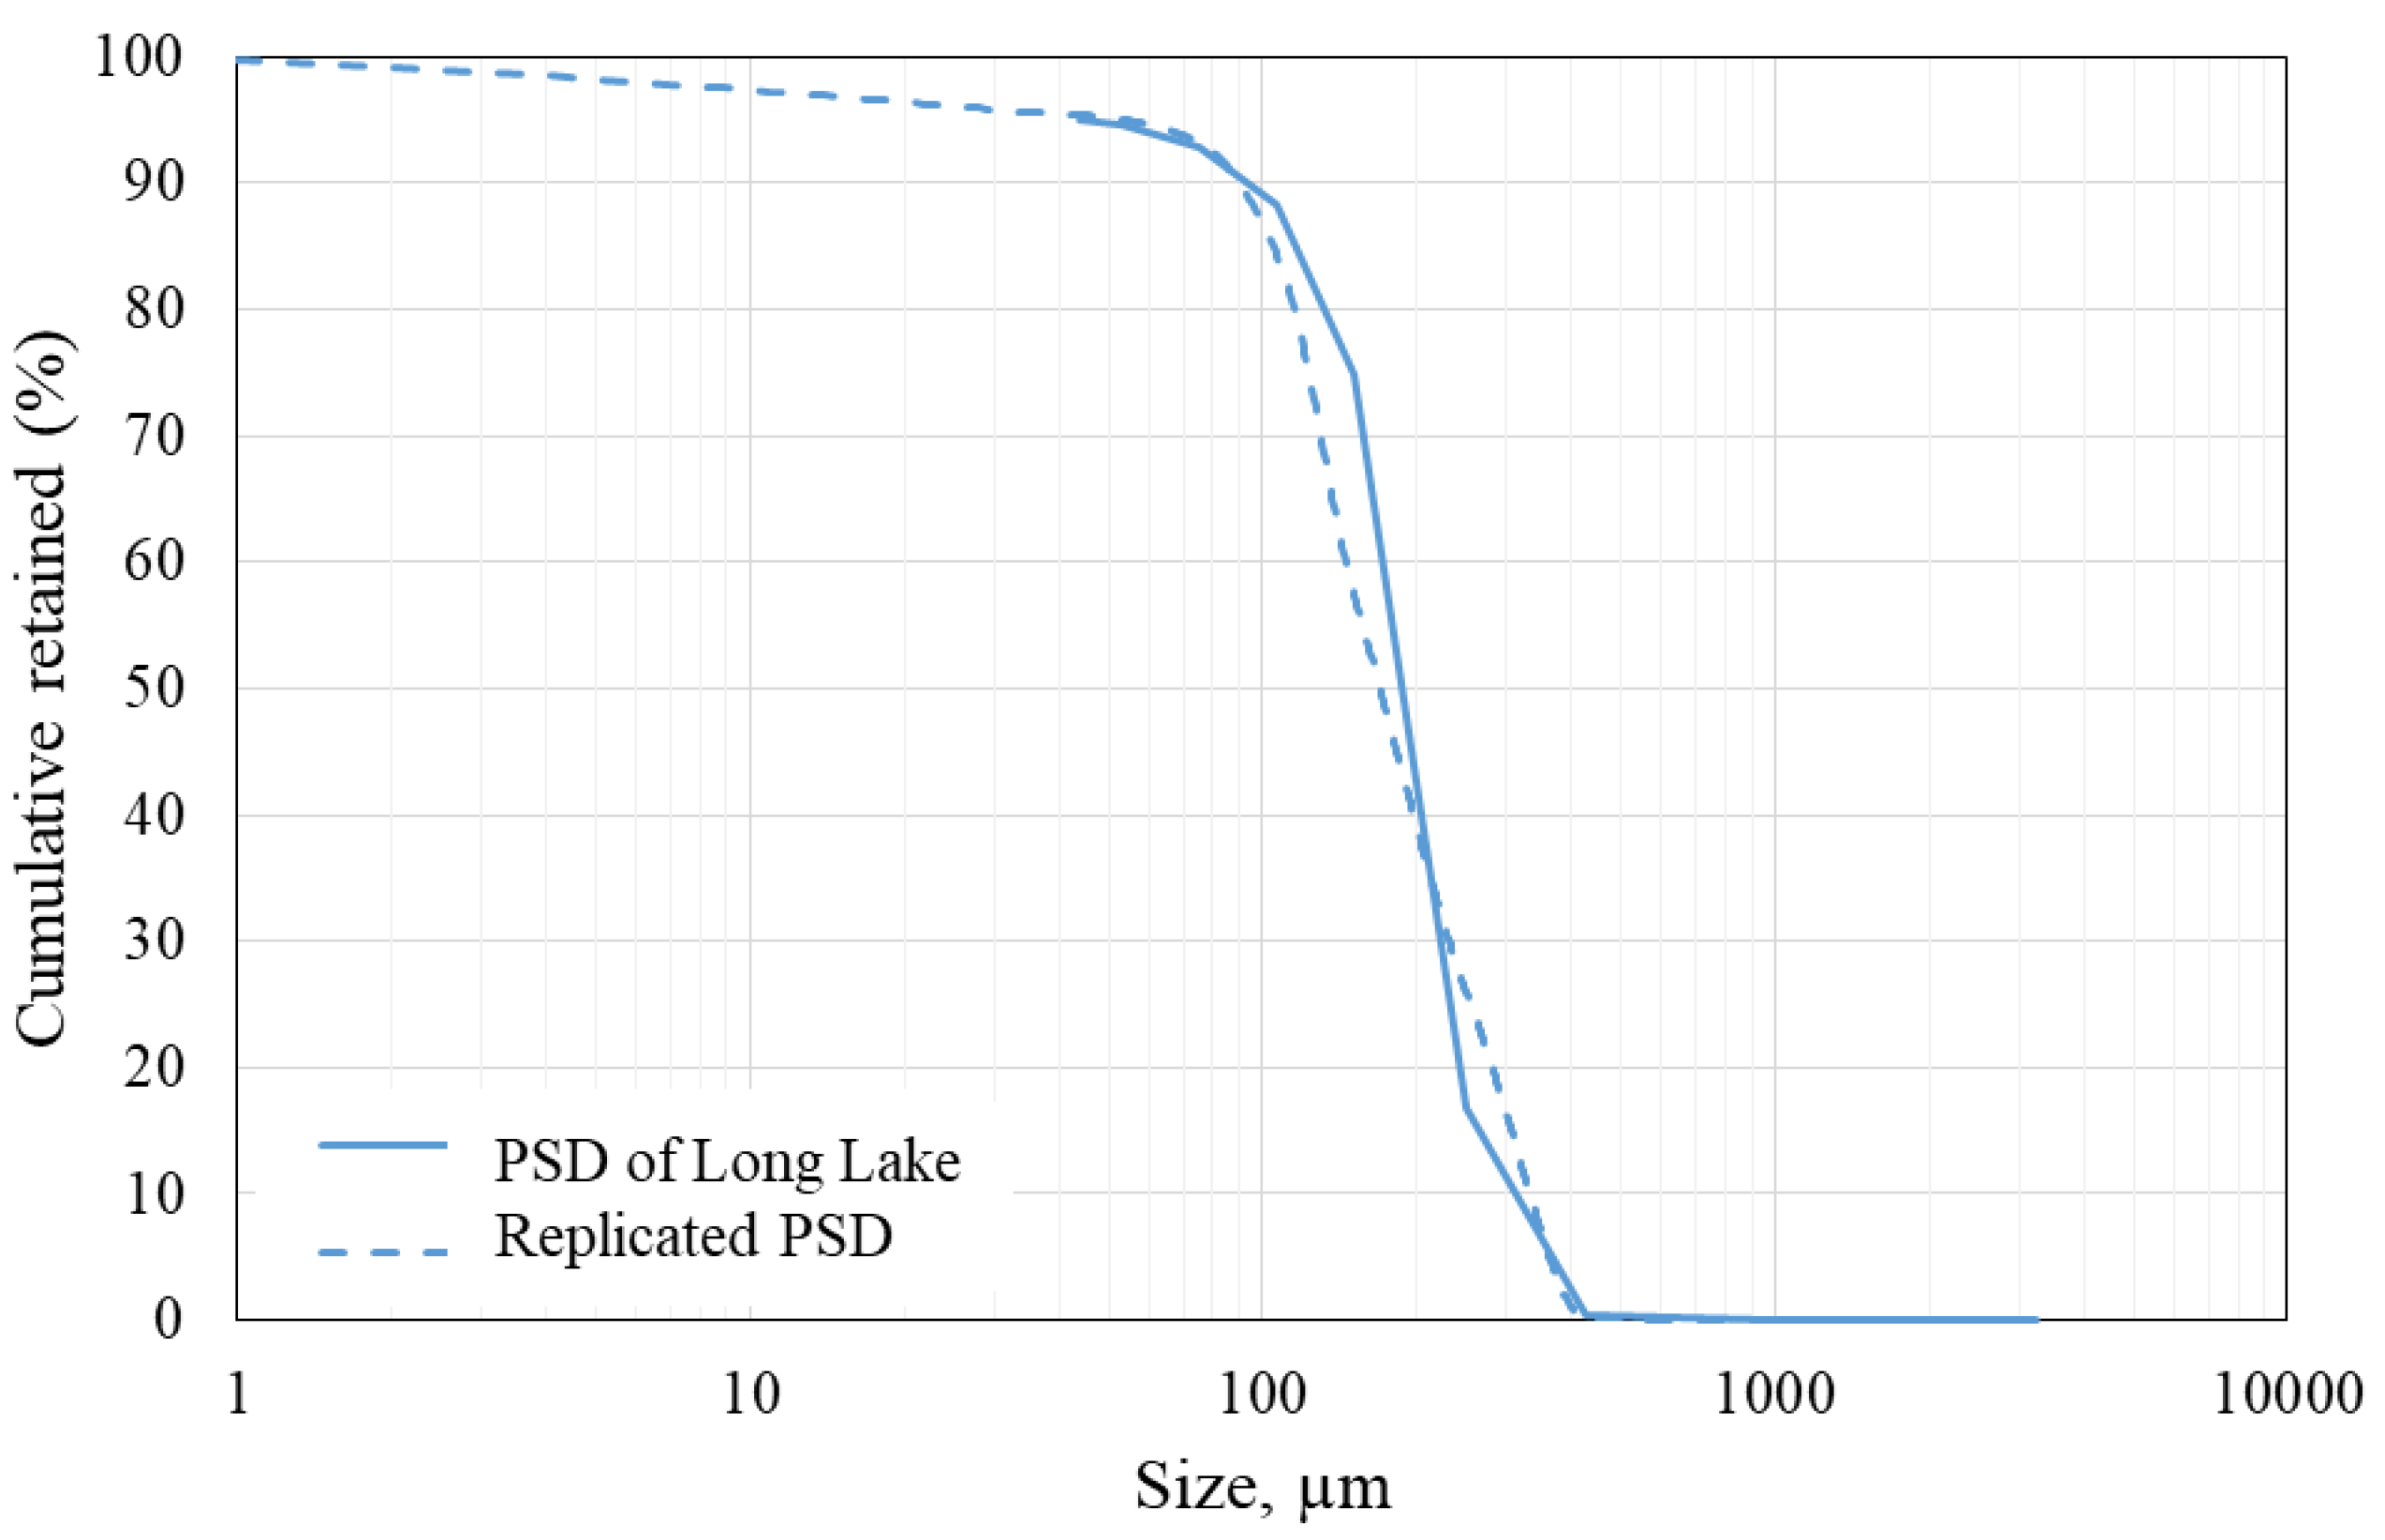
Commercial sands were used to replicate Long Lake, Alberta’s sand prints, as reported in Devere-Bennett [3]. The replica sand was prepared by mixing commercial sands and fines in specific proportions following the technique proposed by Mahmoudi et al. [57]. Figure 3 presents the cumulative PSD curves of the original PSD of Long Lake and the pertinent replica sand mixture. The replicated PSD shows a maximum deviation of 13 µm (0.0005 inches) from the original sand. This deviation is acceptable since it is within the ±50 µm (±0.002 inches) tolerance in the slotted liner manufacturing.

2.3. Testing Matrix

The testing matrix in Table 1 is designed to investigate the effect of the experimental setup and testing parameters on evaluating the liner performance for the SAGD operations. Test #1 aims to assess the variations in the testing results due to using a different testing device than the one used by Devere-Bennett [3] while using the same testing procedure. Hence, one of the tests reported by Devere-Bennett [3] is repeated with the setup used in this investigation. This test uses the replica sand with the same PSD as the oil sand used in Devere-Bennett [3].
In Tests #2 through #6, testing parameters are changed, one at a time, from those used in Devere-Bennett [3] to parameters believed to be more representative of SAGD producer conditions. The aim is to assess the effect of testing parameters on sanding and plugging of a rolled top slotted liner with the slot width of 406–508 µm (0.016–0.020 inches), see Figure 2c for the slot cross-section.
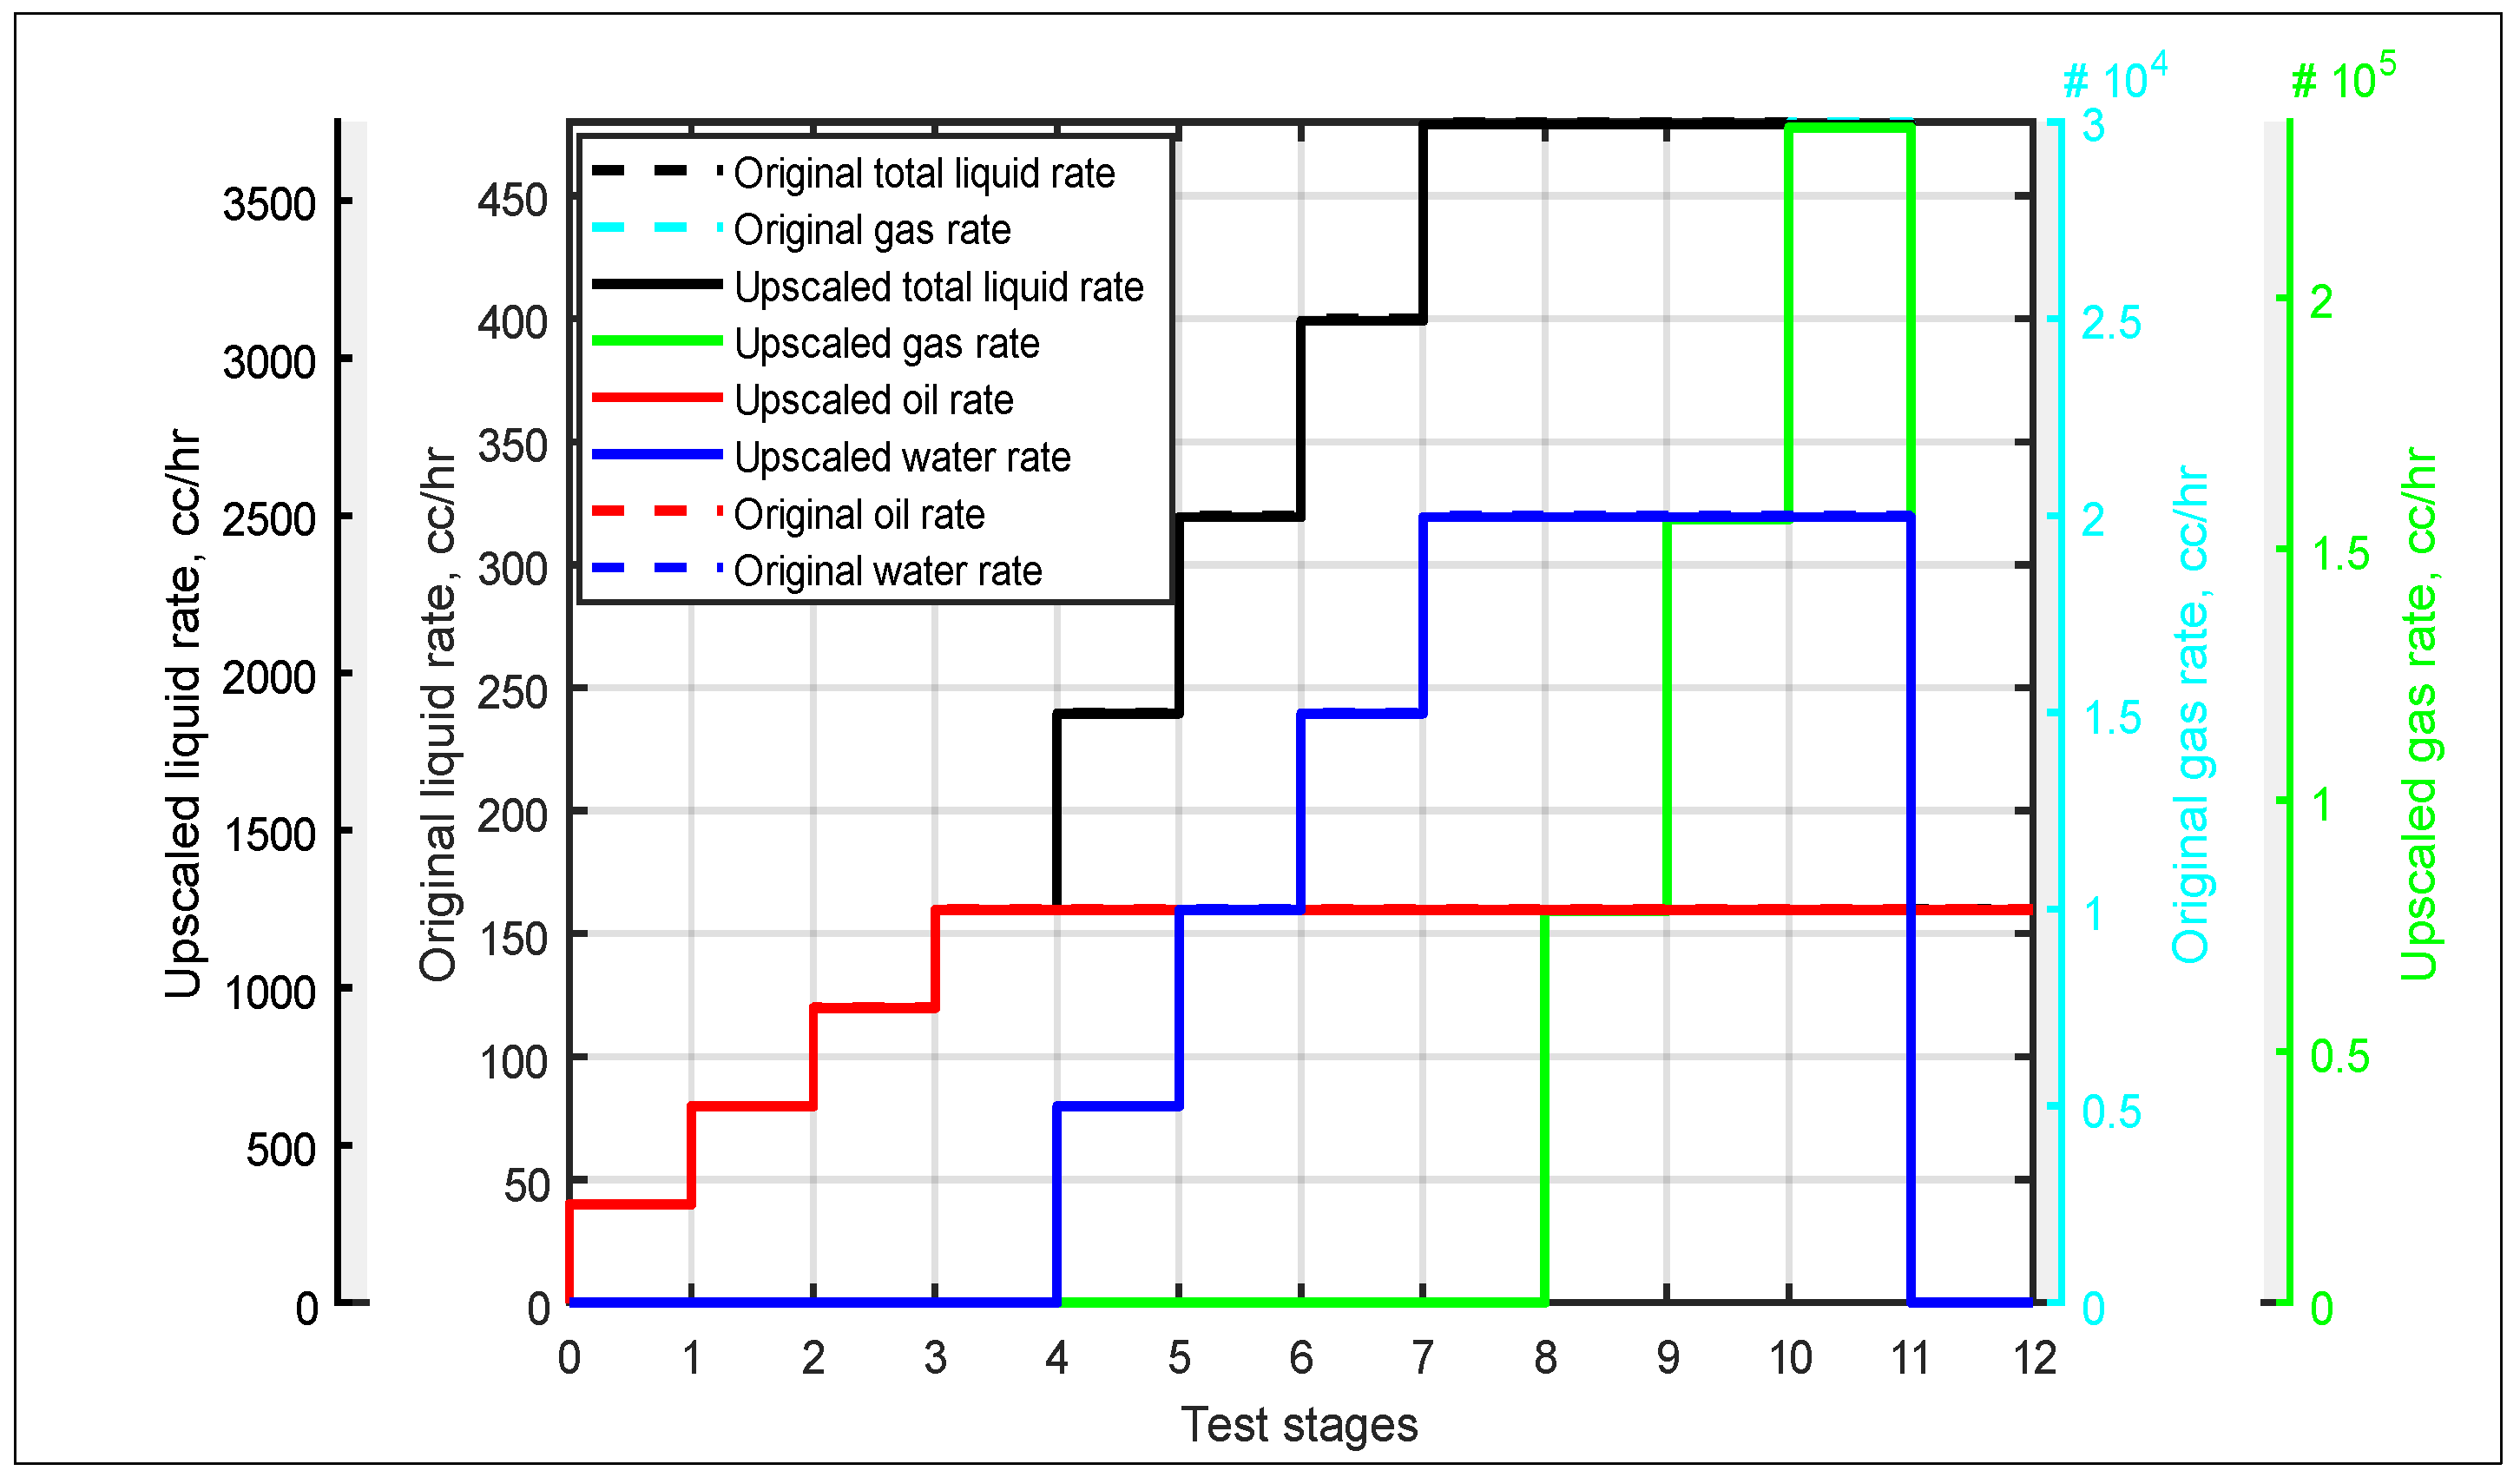
In Test #1, the testing procedure and parameters such as the sand packing technique, axial stress magnitude, fluid properties, and flow rates were matched with those reported in Devere-Bennett [3]. Test #1 was performed using a WWS coupon. Owing to the smaller size of the testing specimen and screen coupon utilized by Devere-Bennett [3], the original flow rate (Figure 4) was upscaled for the larger screen coupon area used in this work by Equation (1):
Q D e v e r e B e n n e t t = Q D e v e r e B e n n e t t   o r i g n i a l × A r e a   N e w   s e t u p A r e a D e v e r e B e n n e t t s   s e t u p
Test #2 accommodated an SL coupon instead of the WWS in Test #1. Test #3 included all the testing specifications of Test #2, except for the packing procedure. In Test #3, the moist tamping technique [57] was used to pack the sand instead of the dry packing technique used in Tests #1 and 2 and Devere-Bennett’s [3] experiments. Rhodes [58] stated that dry packing could cause the segregation of particles across the sample as the finer particles settle at the bottom by the percolation of fine particles or vice versa due to elutriation segregation.
SAGD wells experience a low-stress condition at the early production period [26,29]. Applying excessive stress in the SRT underestimates sand production and overestimates the fines migration [24,29]. However, a minimum magnitude of stress is required during the sand pack saturation to avoid fluidization, which can be estimated using fluidized bed theory [59]. A relatively high magnitude of stress was applied on the sand pack (350 psi or 2413 kPa) in Devere-Bennett’s [3] experiment and Tests #1 to 3 in this work. However, Test #4 used a lower stress of 60 psi (413 kPa), which is deemed more representative of the early SAGD wellbore life.
Typical production well flow rates, well length, and water cut levels were extracted from public regulatory reports for the Long Lake Field [60] to determine representative flow rates of the production wells for experimentation. Subsequently, a range of factors was considered to account for the non-uniformity in fluid flow, slot plugging, and non-contributing liner sections. The non-uniformity of production throughout the wellbore could originate from non-uniform steam chamber growth due to reservoir heterogeneity [61], lack of flow control devices [62], and undulations in the wellbore trajectory [63]. In a case study, Beshry et al. [64] stated that non-uniformity in a SAGD production well could reach up to 50%. Furthermore, the non-contributing sections due to the liner connections of the sand control completion could be approximately 20% of the well length. Plugging of sand control devices as a result of scale deposition [65], corrosion products, and fouling by fines deposition can cause plugging of up to 90% of the slots [66].
Table 2 presents the range of values assigned to each factor affecting the effective flow. For the effective flow rates calculation, the assumption and information presented in Table 3 and Table 4 were used as laboratory testing parameters, typical Long Lake well specifications, and field production parameters.
Table 5 presents different fluid flow scenarios to calculate the flow rates for the experimental tests (Table 5). Table 6 shows the parameters for the estimation of the field equivalent stream rates in the lab setup. Steam properties [67] are estimated based on the production wells’ downhole pressure and injection wells’ temperature conditions in Long Lake Field to simulate the steam breakthrough. As it is difficult to assess the in-situ steam quality in the reservoir, a steam quality of 25% is assumed. The steam properties at downhole conditions are applied to estimate the downhole rates based on the average surface injection rates in Long Lake Field. Subsequently, the influx per unit area is calculated for a typical SAGD with a length of 800 m and liner diameter of 17.1 cm. The influx is then multiplied by the SRT coupon area to determine the test flow rate before applying the effective flow factors.
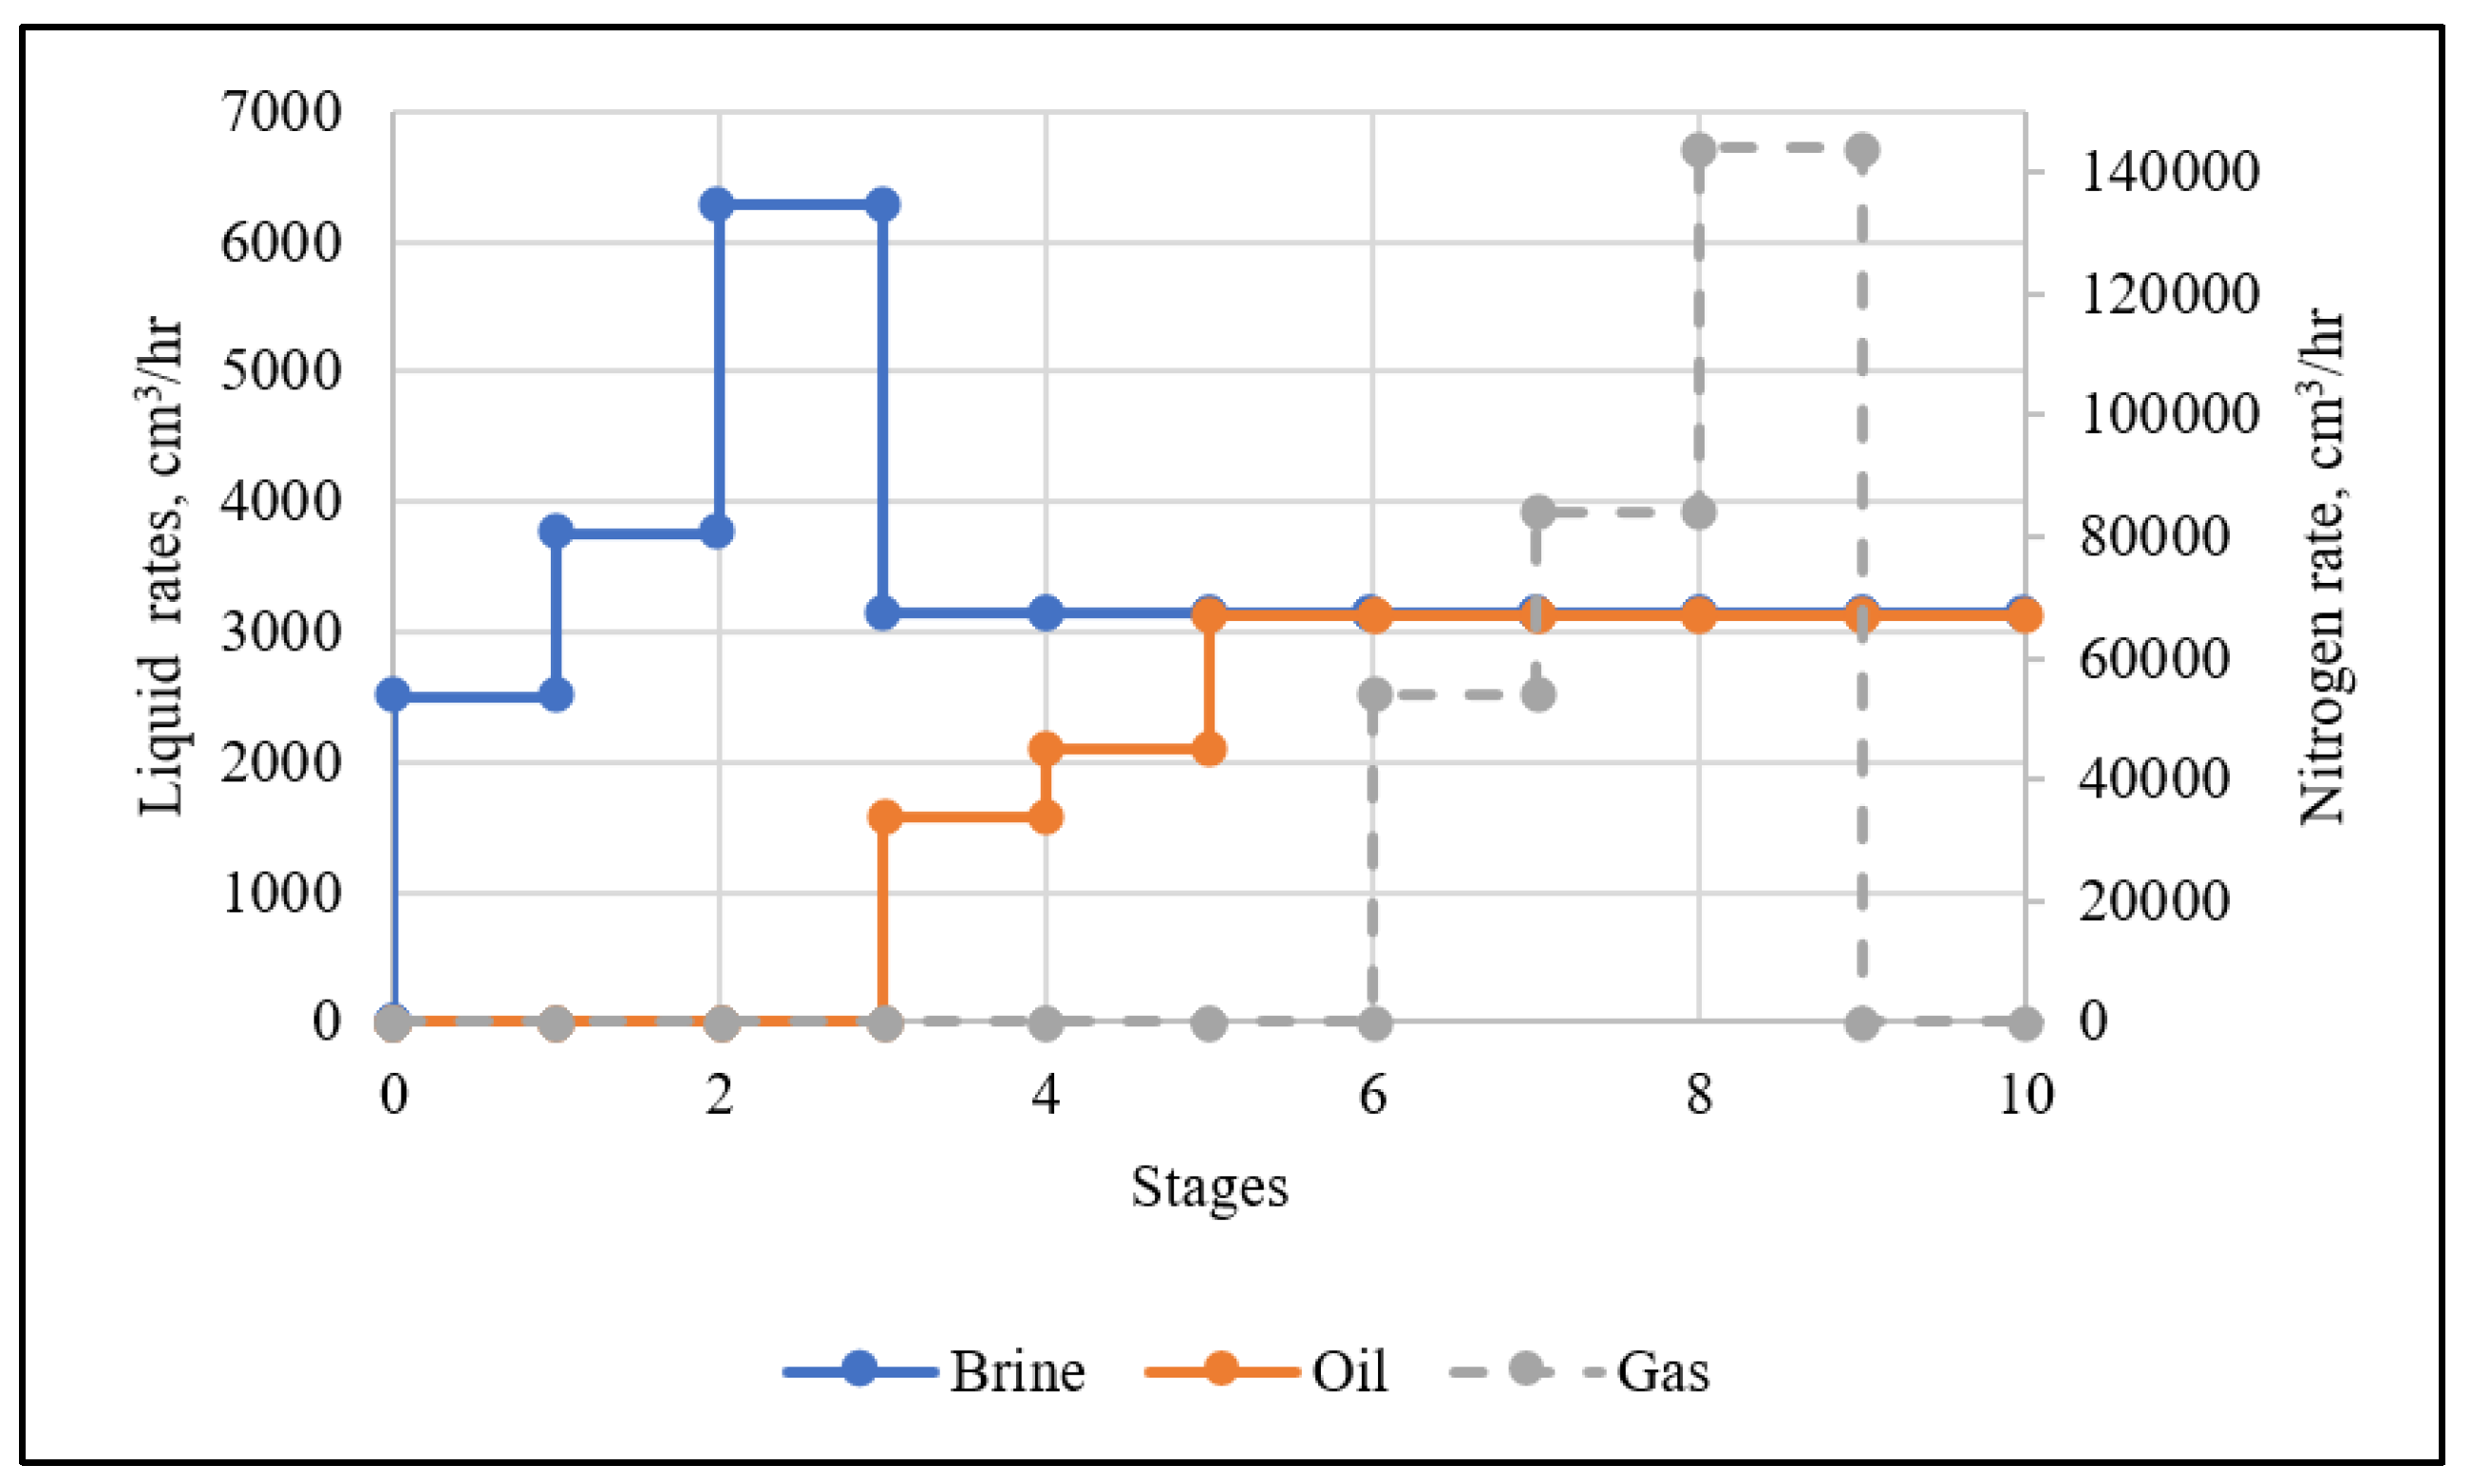
The calculated injection flow rates for representative tests are shown in Figure 5. However, the effect of flow rate on the sanding and plugging levels was investigated by comparing the SRT results conducted at the low flow rates in Test #4 and the customized flow rates for the Long Lake Field in Test #5.
The brine composition of 10,000 ppm employed in Devere-Bennett [3] does not agree with the salinity reported for the produced brine from the Long Lake reservoir, as shown in Table 7. Therefore, the effect of salinity was studied by comparing sanding and plugging under excessively high salinity in Test #5 used by Devere-Bennett [3] with recreated brine composition based on produced brine from the well in Test #6.

3. Results and Discussions

Produced sand and pressure gradients are used as the main comparative parameters in the SRT experiments. The pressure gradient, which is the pressure difference over the distance between the pressure ports, allows comparing the sand pack’s plugging tendency during the tests. Plugging results in higher pressure drops (dp in Figure 6), and consequently, higher pressure gradients.

3.1. Replication Test

Figure 7 compares the pressure gradients across the cell reported in Devere-Bennett [3] with the replication test (Test #1) on the replicated sand pack. In the first four stages of the replication test, the pressure gradients increase linearly as the flow rate gradually increases. Subsequently, the pressure gradients in the next four stages increase at a more gentle rate than the first four stages. In stages 5 to 8, the pressure drop is affected by the injected water and its associated relative permeability. However, in these stages, the water’s lower viscosity compared to the oil overshadows the relative permeability effects. Finally, the pressure gradients steeply increase when gas is introduced, which is attributed to the relative permeability effects. Then, the pressure gradients become stable or show a slight increase as the gas rate increases. The stabilized pressure gradients in the last three stages can be attributed to the liquid expelling from flow channels as the gas injection rate is increased. This occurrence results in a higher gas relative permeability, consequently reducing the effect on pressure gradients.
Figure 7 compares the pressure gradient in Devere-Bennett’s [3] experiments with the one obtained from the replication test. At the first look on Figure 7b, it seems that the near-coupon pressure gradient in the replication test (WWS with 152 µm [0.006 inches] sloth size) is not quantitatively comparable with the corresponding data in Devere-Bennett [3]; however, the trends are comparable. This is expected since the pressure ports are located at different distances from the coupon: 2 cm above the coupon in Devere-Bennett [3] and 5 cm above the coupon in the setup used in the current investigations (Figure 6). Some inconsistencies in the pressure gradient data were observed in Devere-Bennett [3] when conducting the test with different SCD coupons, as shown in Figure 8. For instance, the test results on 406 µm (0.016 inches) straight cut slotted liner (SC) show a significant reduction in the pressure gradient after gas injection, which is not consistent with other test results. The test with 304 µm (0.012 inches) WWS also shows a sharp drop in the pressure gradient when brine is introduced and continues to decrease with the increasing water rate.
The produced sand, which is normalized by the coupon area, is 0.0083 g/cm2 (0.017 lb/ft2) for the replication test, while it was 0.012 g/cm2 (0.024 lb/ft2) in Devere-Bennett [3]. The replication test produces 25% less sand than the one in Devere-Bennett [3]. This variation can be attributed to the different procedures in collecting produced sand. Devere-Bennett [3] reported the total produced solids while the produced sands and fines are separated in the replication test. Although sanding in SAGD is usually considered a problematic phenomenon and is avoided, fines production is desired and should be encouraged to reduce near-wellbore plugging. Hence, it is required to individually measure the produced sand and fines in sand control testing.

3.2. Effect of Packing Technique

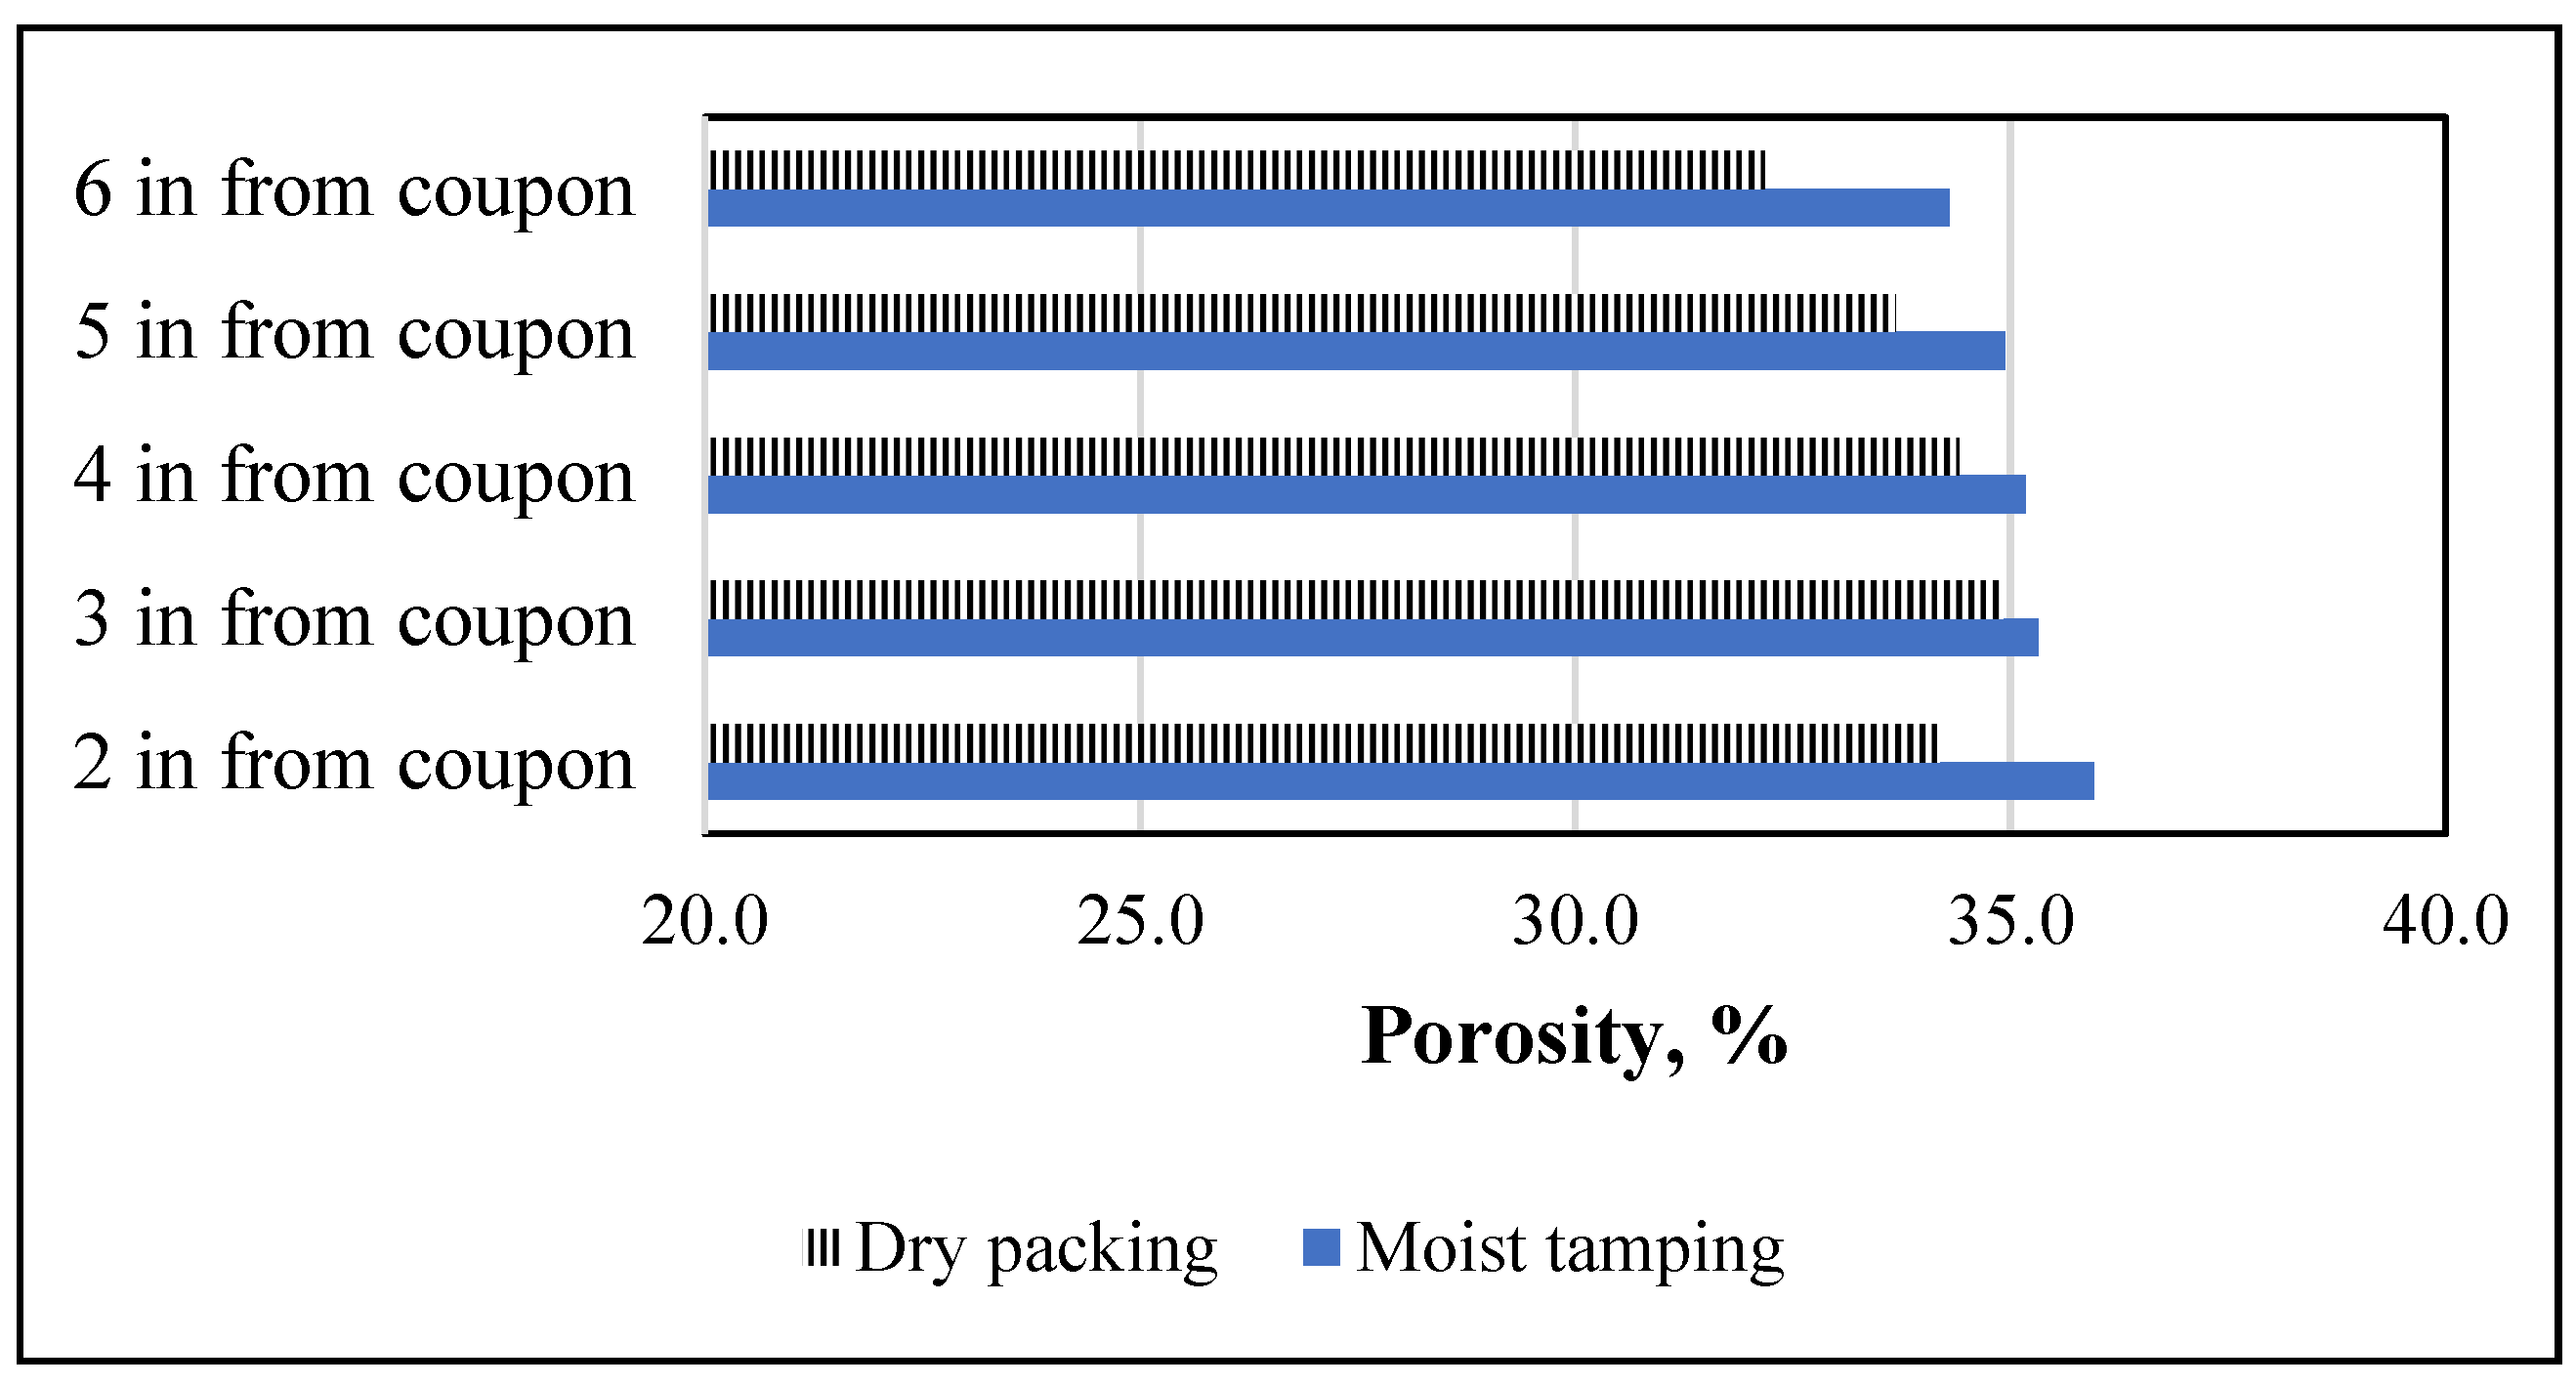
Two packing methods were used to investigate the impact of packing on SRT results, dry packing (used by [3]) and moist tamping (suggested by [57]). Five core plugs with equal sizes of 5 cm (2 inches) were taken from each sand pack after dry and moist packing to find the porosity distribution along the sand pack (Figure 9). In this Figure, one can notice that the moist tamping shows less porosity variability than the dry packing technique. The porosity of the dry-packed sample shows a standard deviation of 1.05, which is 74% higher than the one for the sand pack prepared by moist packing.
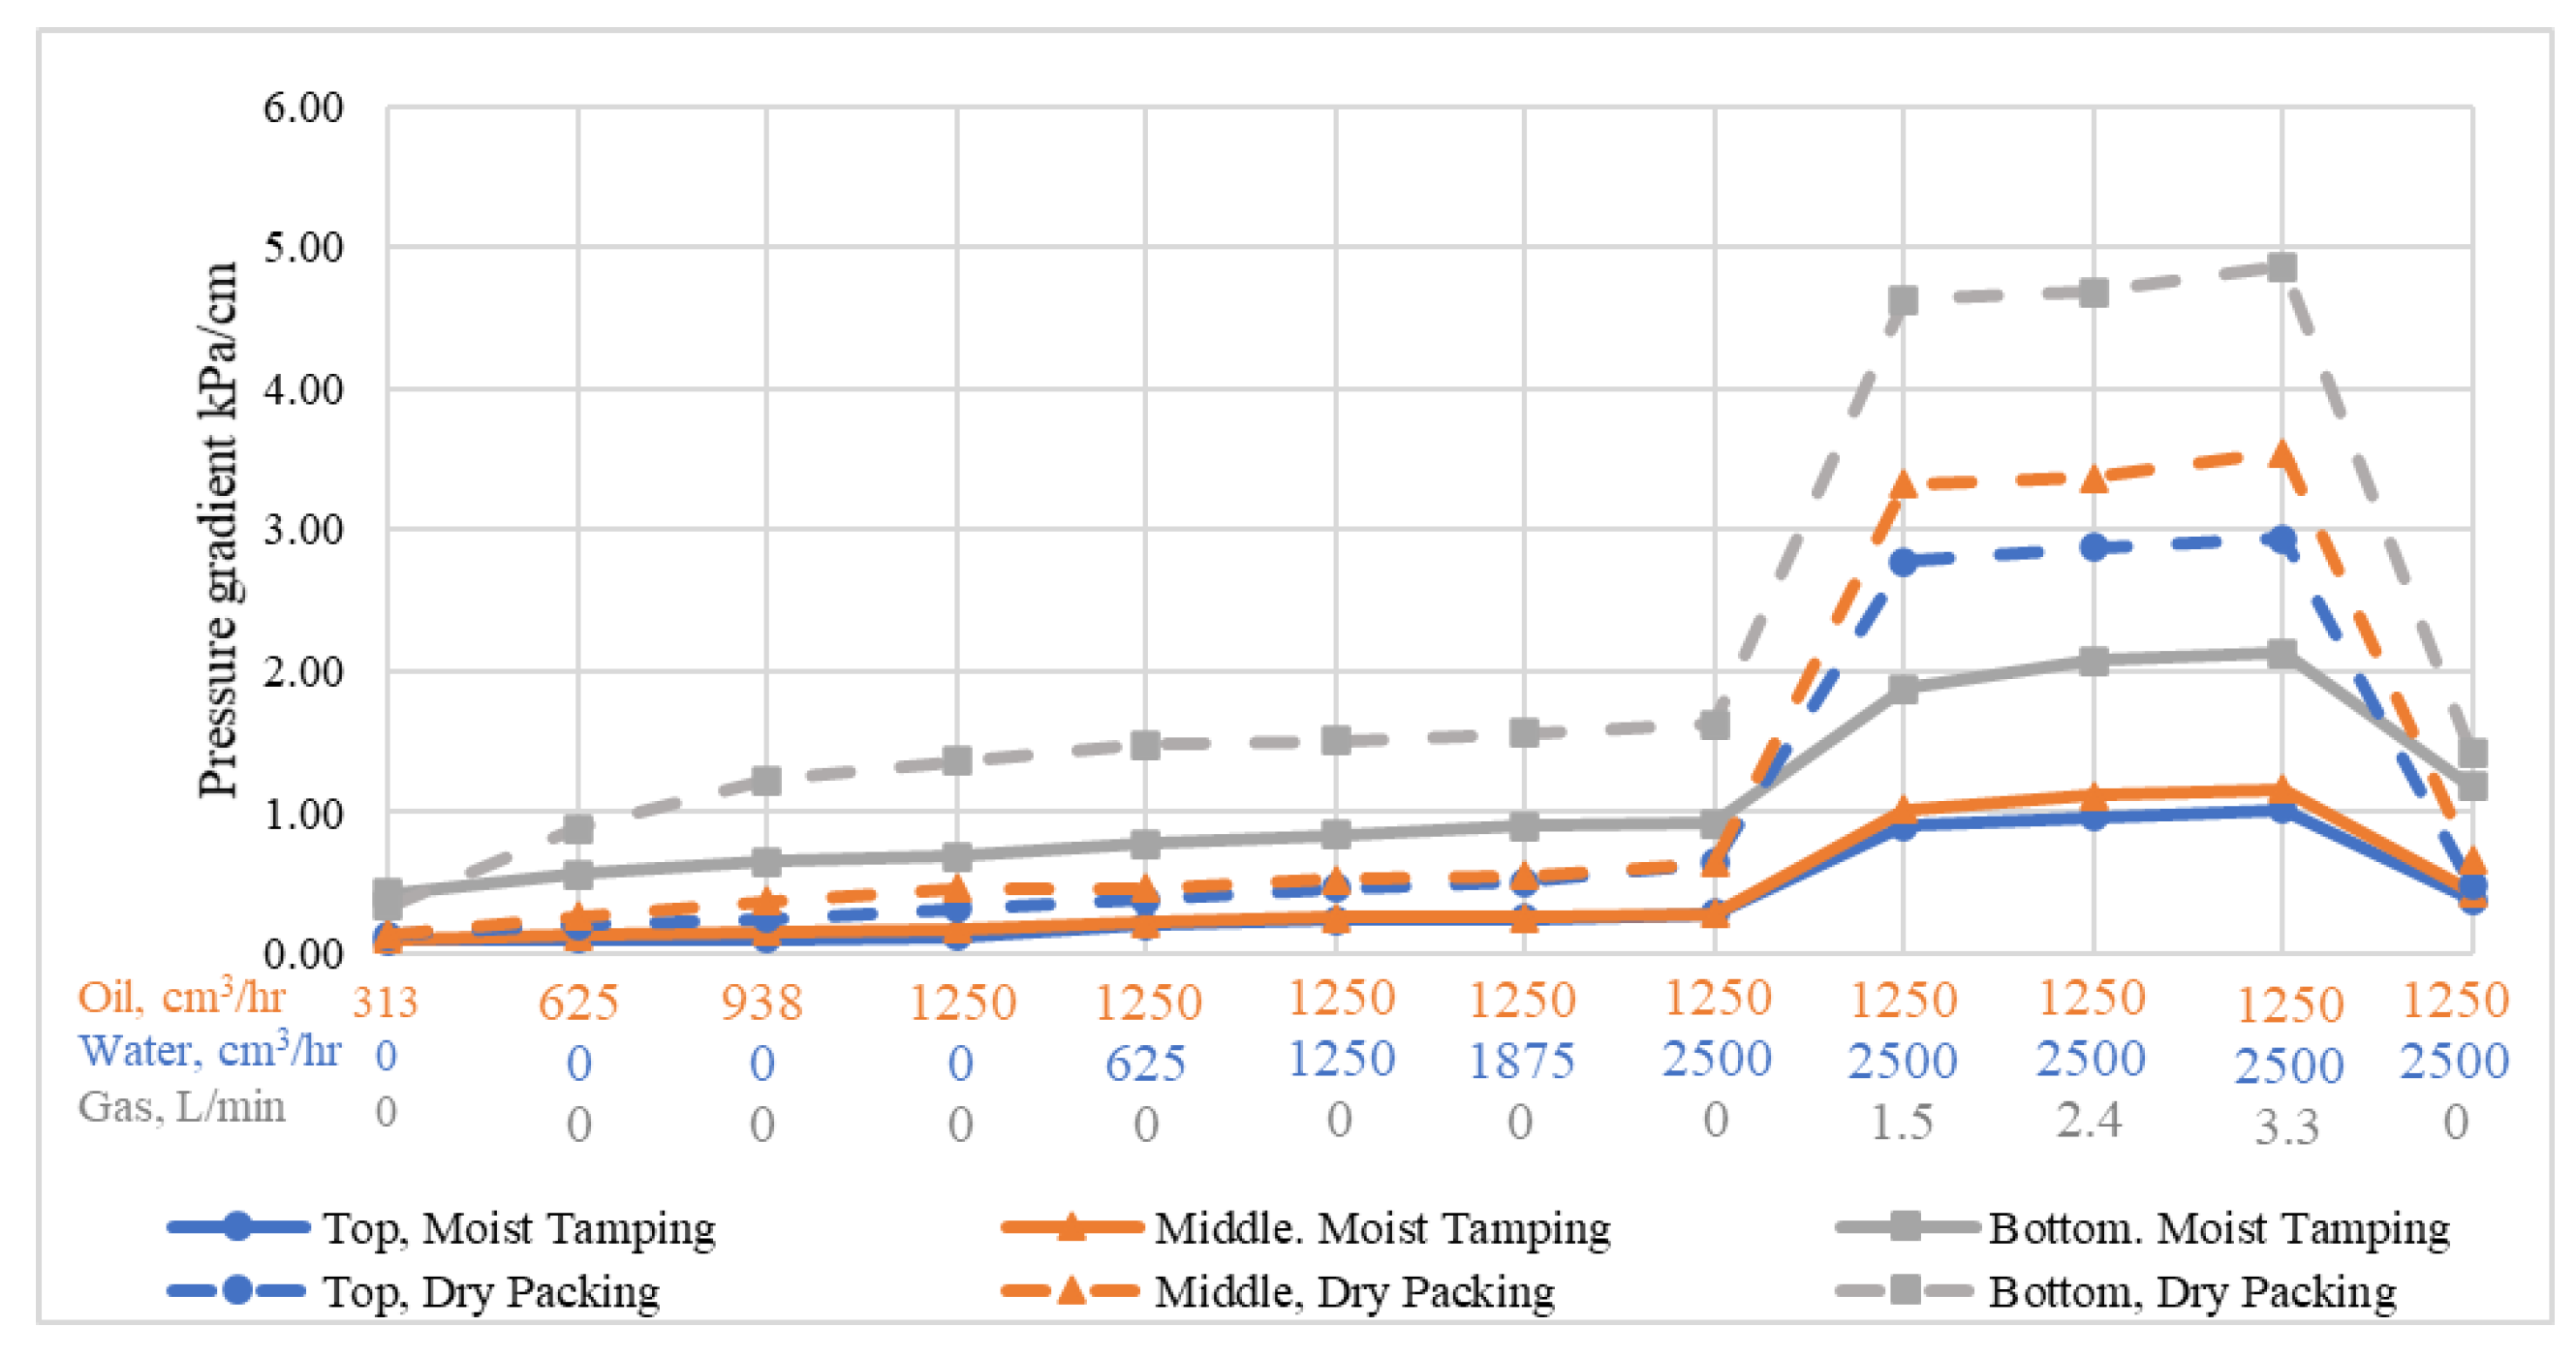
Figure 10 illustrates that the SRT packed with the moist tamping method has a lower pressure drop, attributed to the higher average porosity of the sand pack. Both tests show a higher pressure gradient (almost two times) at the region near the coupon than other sections inside the sand pack. The higher pressure gradient in the near-coupon area is generated due to flow convergence at the slots [32] and pore plugging due to fines migration at this vicinity.
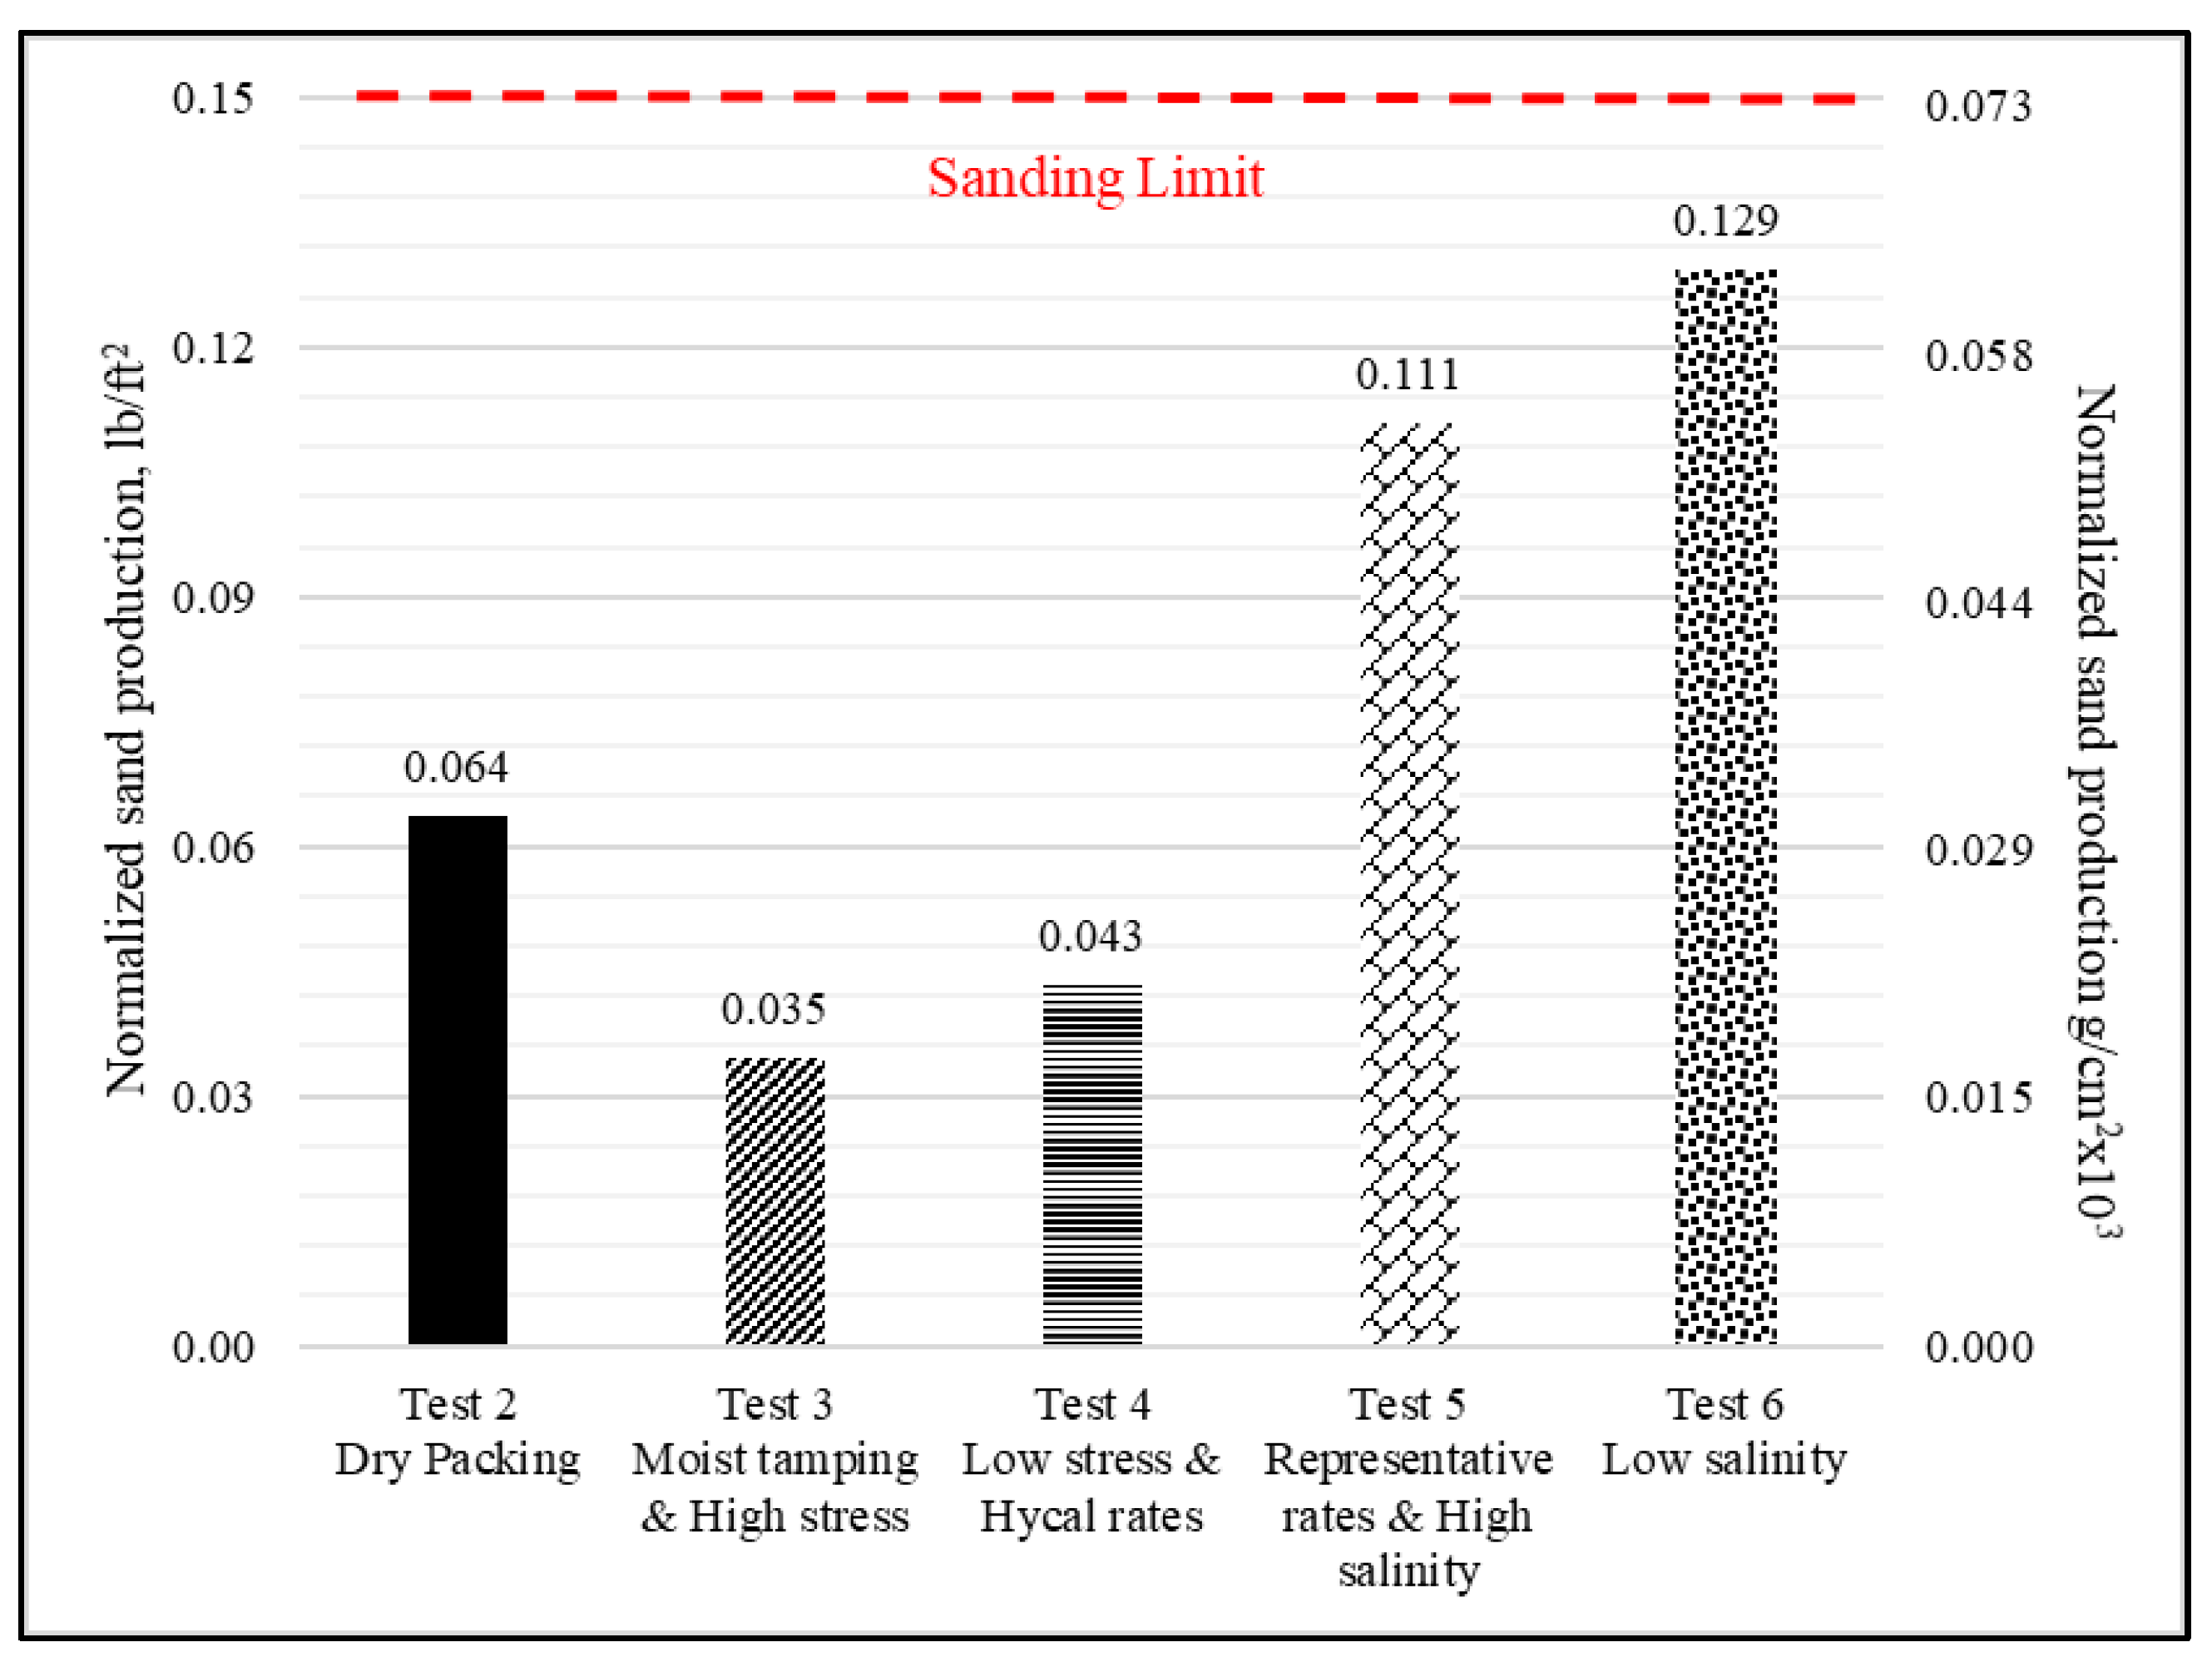
The cumulatively produced sand in the moist tamping is 45% less than in the dry packing (Figure 11). The lower produced sand in the moist tamping method can be attributed to the lower interstitial flow velocity in the near-coupon region due to the higher porosity in the moist tamping method. In the test with the moist tamping method, the smaller interstitial velocity creates weaker drag force on grain particles causing lower sand production in the moist tamping method. Furthermore, as Rhodes [58] showed a higher possibility of segregation in dry packing, the SRT packed by dry technique is more vulnerable to segregation, causing more concentration of smaller-sized particles at the bottom of the cell and consequently more sand production.

3.3. Effect of Stress Magnitude

Figure 11 shows that the produced sand in the test with the lower axial stress over the sand pack (413 kPa) is almost 23% higher than that observed in a test with higher axial stress (2413 kPa). Less sand production at a higher stress level agrees with the testing results published in the literature [28,68]. This behavior can be attributed to the higher friction coefficient and the strength of the sample at the higher normal effective stresses [69], which construct more stable sand bridges.
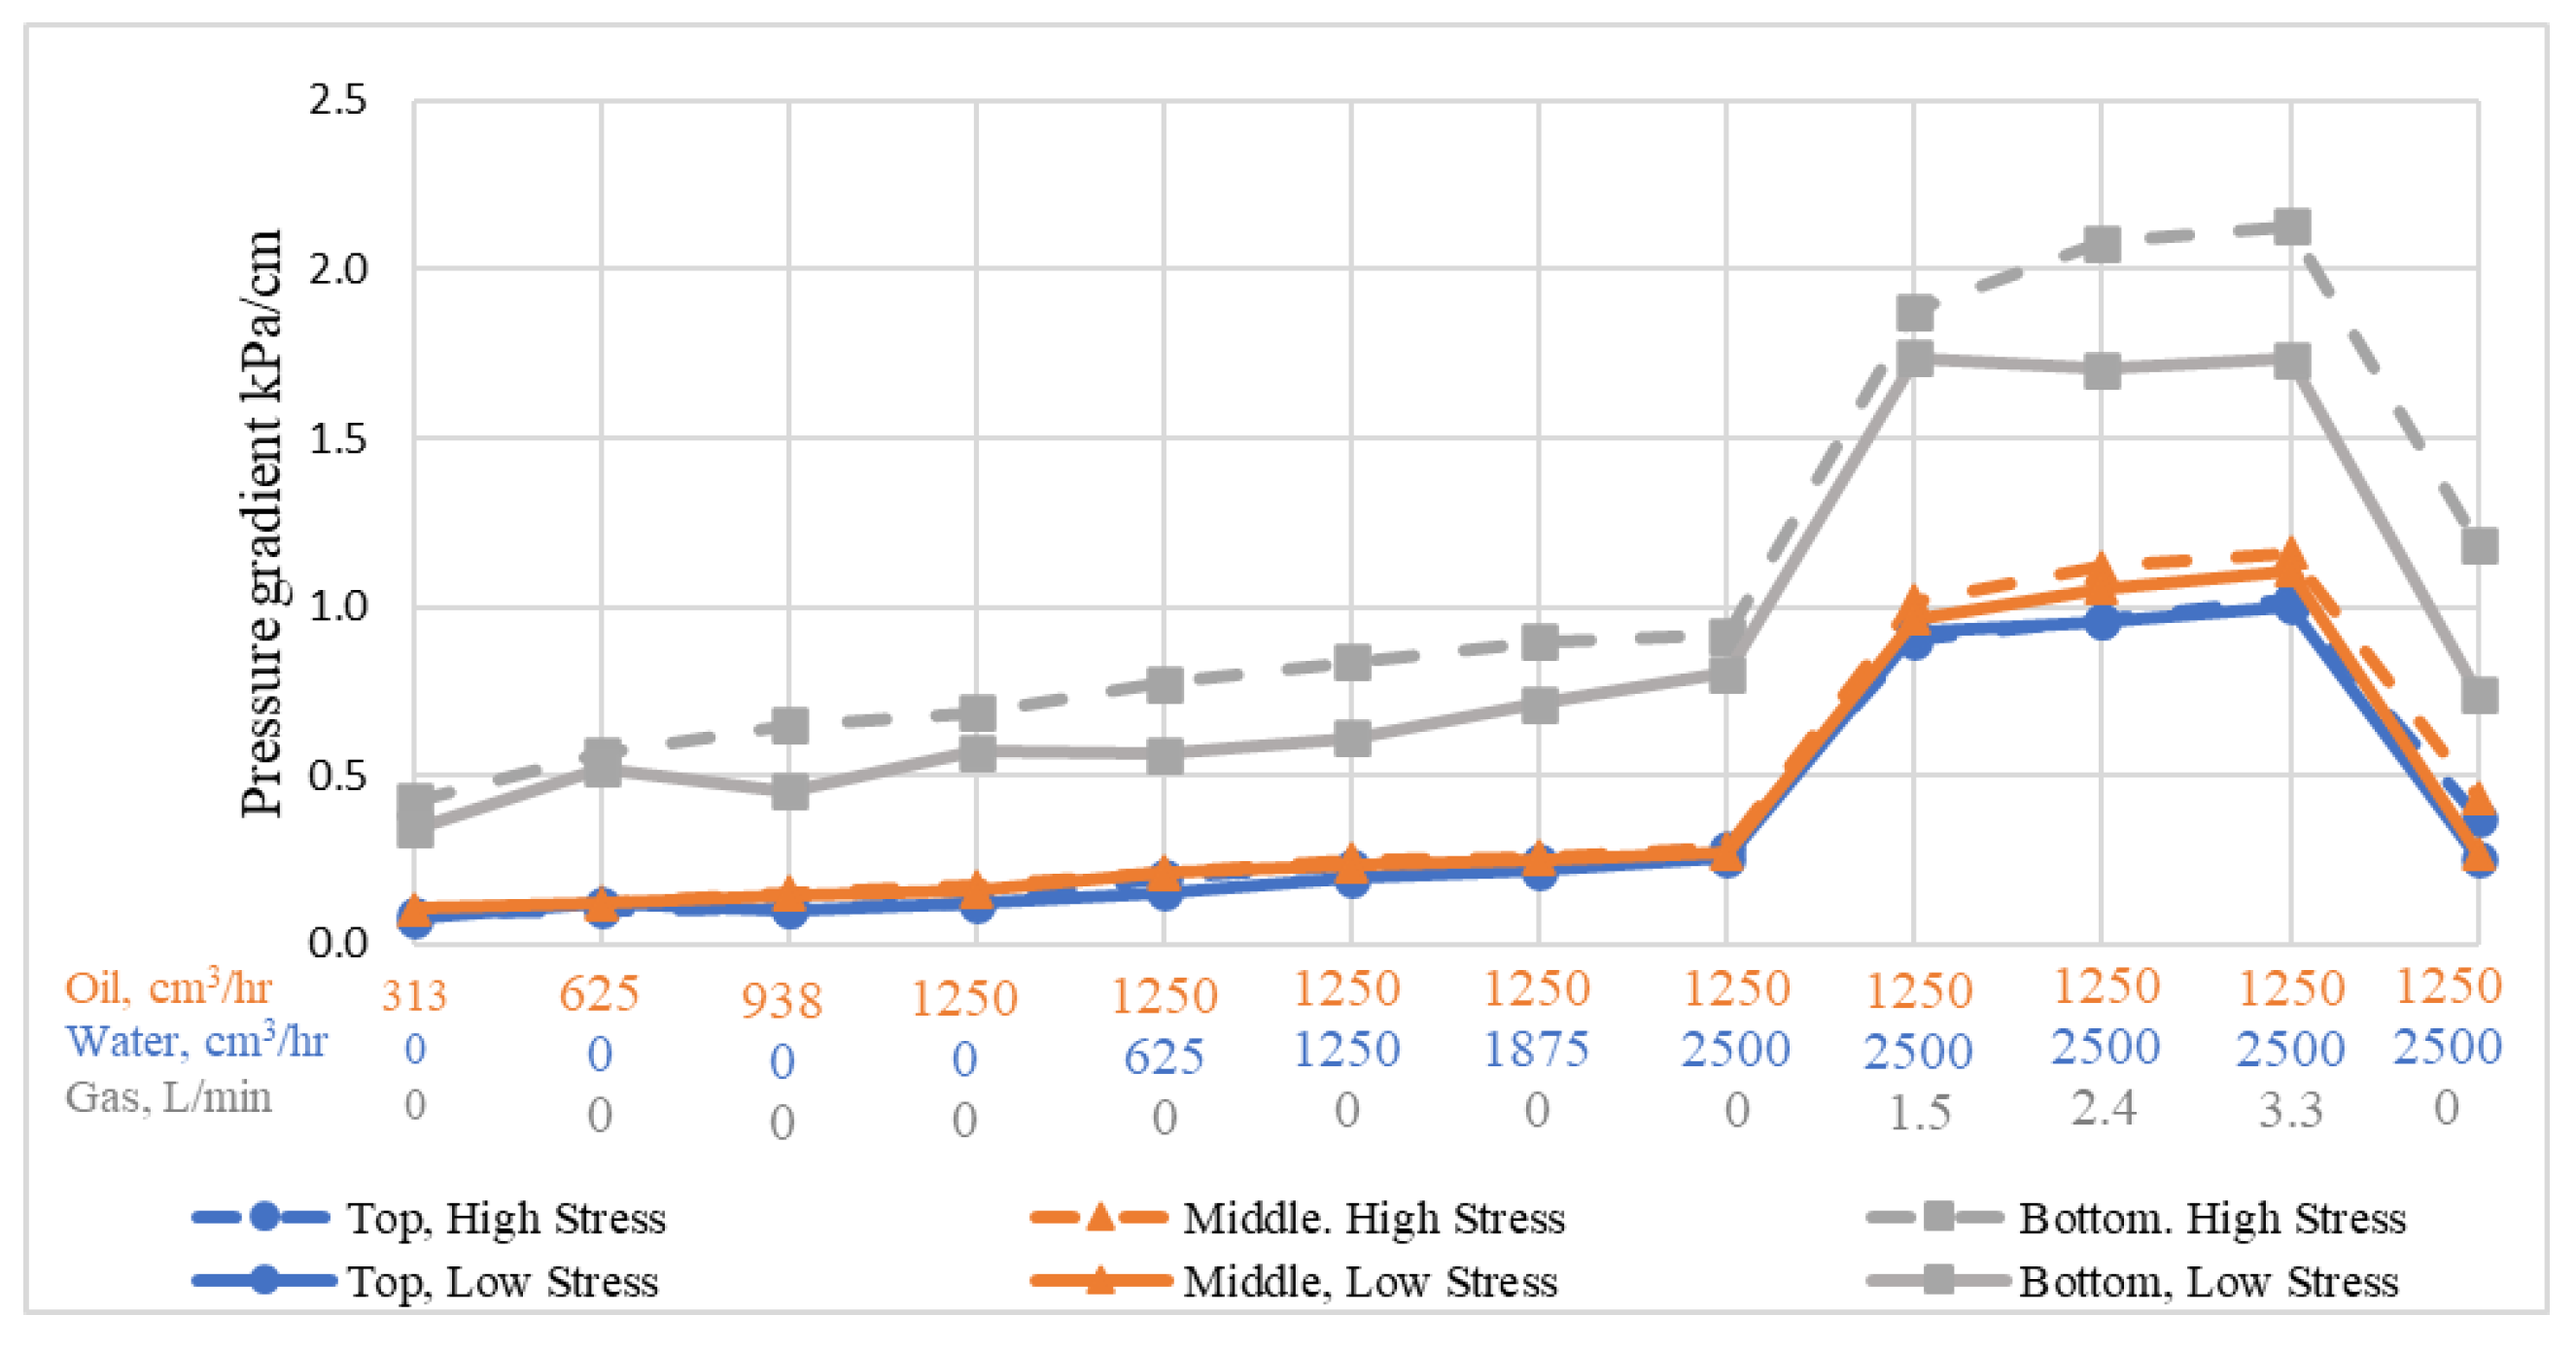
The pressure gradients across the sand pack for two different axial stress levels are presented in Figure 12. In the test with 413 kPa axial stress, the pressure gradient at the near-coupon section is, on average, 23% less compared to the test with 2413 kPa axial stress. Lower stress on the sand pack results in higher porosity and permeability, hence, lower pressure gradients. Further, the sample with higher porosity allows a more effective production of fines, hence, less plugging and lower pressure gradients.

3.4. Effect of Fluid Flow Rates

The maximum liquid rates in Devere-Bennett [3], adopted from Bennion et al. [4], were upscaled to the new testing setup diameter and normalized by the OFA for the same aperture-size slotted liner (Figure 13). The results show that the normalized maximum liquid flow rate used in this work is approximately 65% lower than one employed by Bennion [4] (Figure 13). The normalized fluid rate by the OFA in a single-slot coupon results in the maximum liquid flux of 3410 cm3/hr/cm2, while it is about 1166 cm3/hr/cm2 when using a larger setup with a multi-slot coupon. Using single-slot coupons and ignoring the slot density with constant flow rates causes excessively high flow velocities for SL testing compared to WWS. Thus, the testing setup and procedure become biased against SL owing to the large drag forces and flow convergence experienced at a single slot.
The water cuts of 50–100% in the testing procedure used in this work are higher than those considered in Devere-Bennett’s [3] and Bennion et al. [4] (water cuts of 0–67%). The water cuts applied in this investigation are comparable with the values observed in the SAGD production wells for the Long Lake Field in 2017, where the average water cut was recorded at about 79% [60].
Considering the challenges in quantifying the steam flux during the steam breakthrough events in SAGD wells, it was assumed that all injected steam flows toward the production well during a steam breakthrough. In this regard, the steam properties are determined for the production well at typical thermodynamic conditions using steam tables such as Dahm and Visco [70].
The higher flow rates in Test #4 produced 153% more sand than Test #5 with a low rate, as shown in Figure 11. The higher flow rate generates higher drag forces on sand particles near the slot, enhances the destabilizing forces on sand bridges, and consequently causes more sand production.
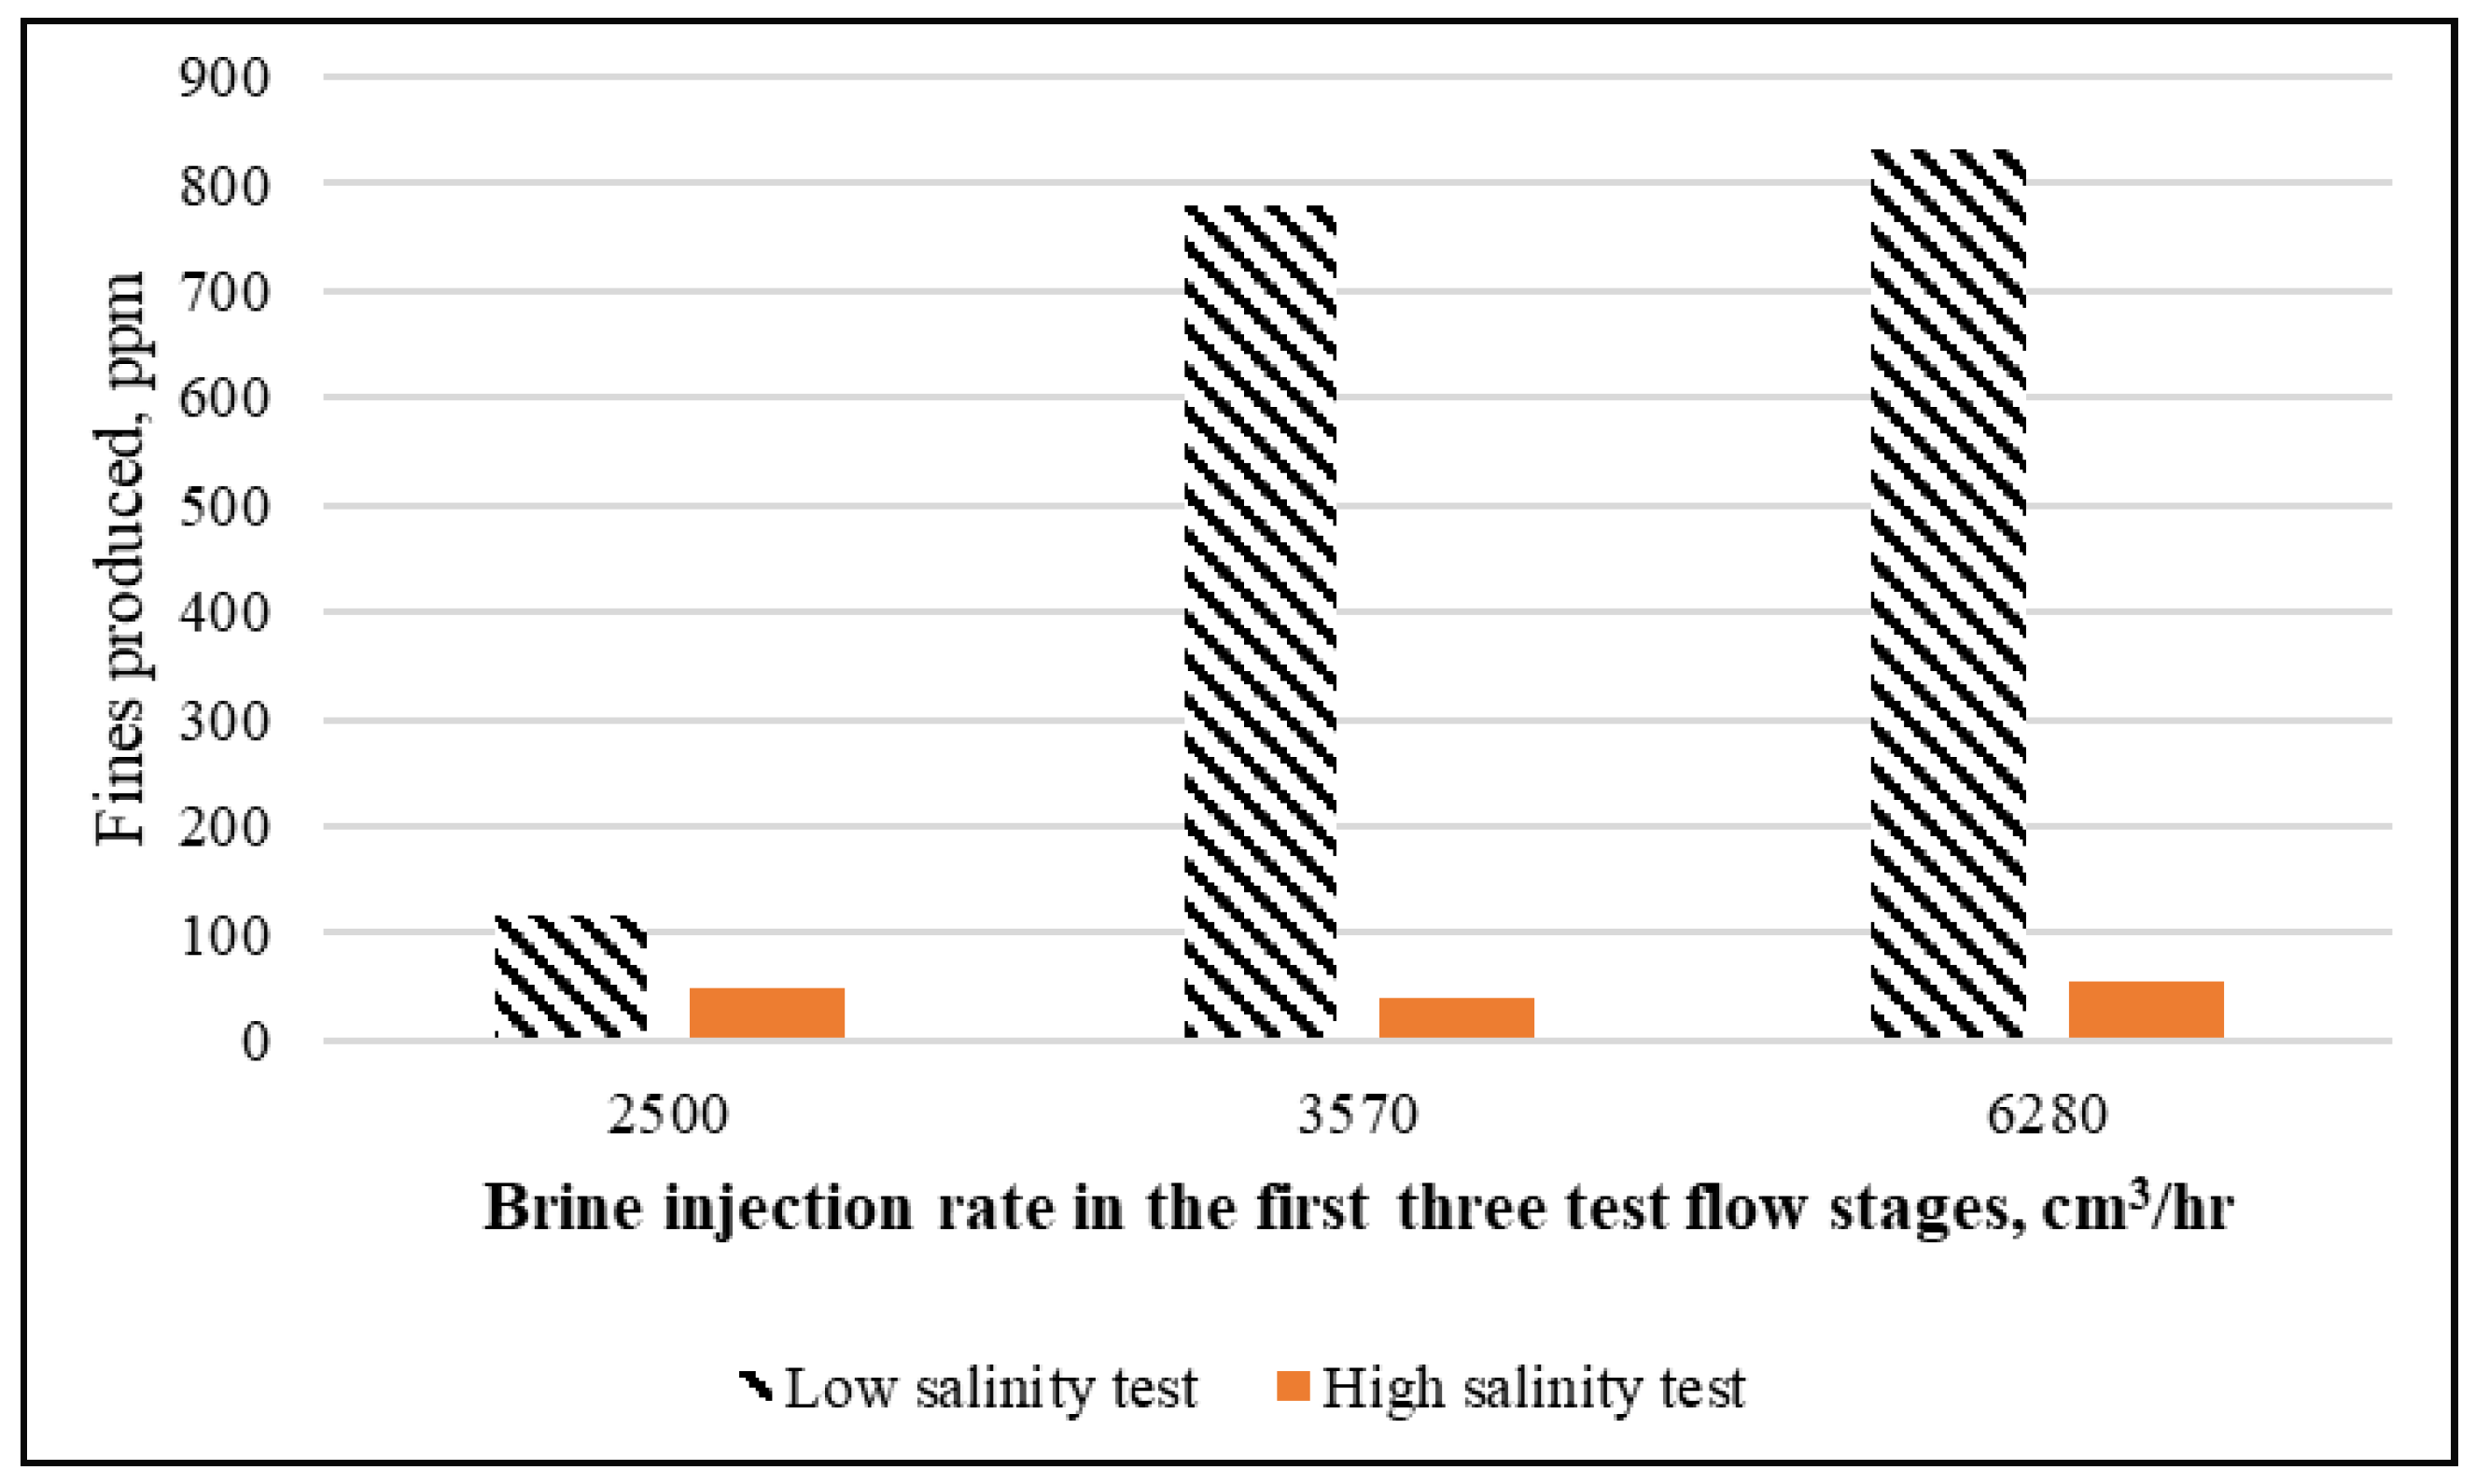
As shown in Figure 14, the concentration of the fine in the discharge fluid at stages 1 to 3 of the SRT tests shows an increasing trend correlated with the increasing flow rate. Judging from a significant variation of fines concentration between the first and second stages, one can deduce that the critical flow rate for fines mobilization in these tests is between 2500 and 3570 cm3/hr.

3.5. Effect of Brine Salinity

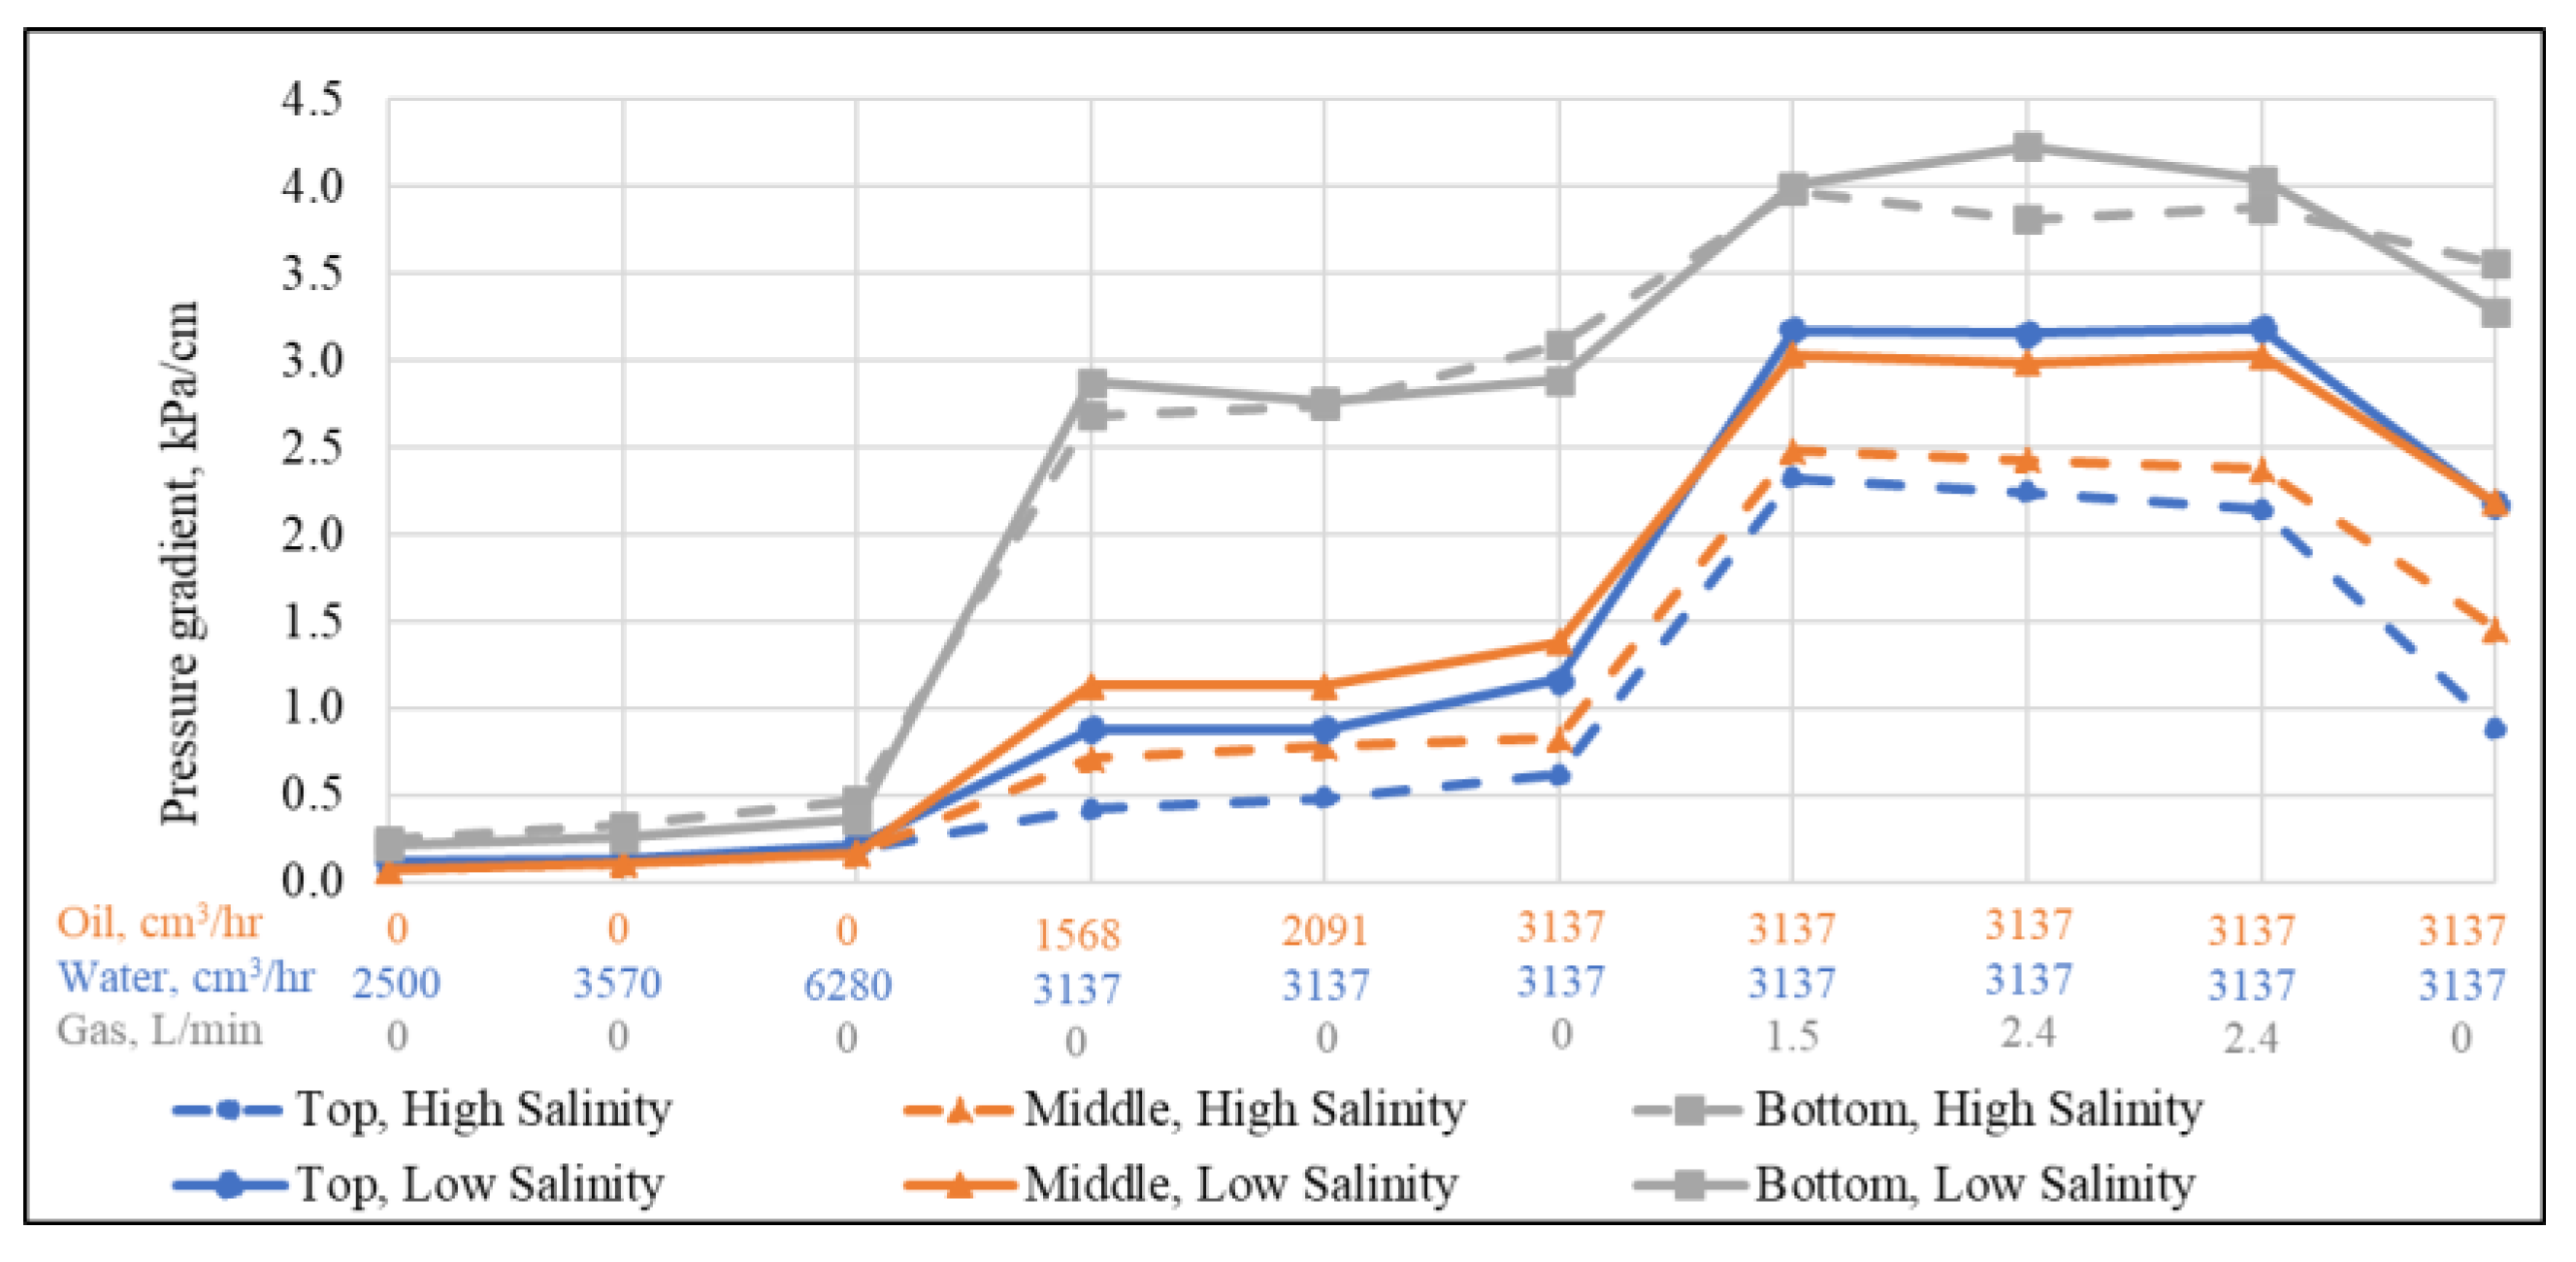
The pressure gradient of both high- and low-salinity tests across the sand pack is compared in Figure 15. As expected, a higher fines production is observed in the low salinity injection scenario (Figure 14). The low salinity brine increases the fines particle mobilization compared to the high salinity brine. The mobilized fines become suspended in the flowing fluid and migrate by the fluid. Furthermore, the suspended particles reduce the open flow paths in the porous media and increase the pressure drop in the top and middle intervals, as shown in Figure 15. These sections at the low salinity test exhibit a 45% higher pressure gradient, which can be attributed to the more substantial fines mobilization.
The bottom section not only experiences the fines mobilization but also receives some fines from the upper sections. However, the bottom section could discharge the mobilized and receive fines through the screen. Therefore, both tests show similar pressure drops in the near-coupon region.
However, it is believed that if the test is continued for a longer time, the mobilized fines can migrate from the top section to the middle and bottom sections, resulting in a pressure drop reduction in this section. The middle section receives fine particles from the top section and passes them to the bottom section, causing neutral behavior or insignificant pressure drop changes. The bottom section would simultaneously receive and discharge the fine particles. Regarding the pore throat and migratory particle sizes, the fines particles would plug the pore spaces or pass through the screen to the discharge fluid. Therefore, in the bottom section, pressure drop would be increased or reduced.

4. Conclusions

This paper investigates the impact of the testing setup and procedure using replicated sands on the sand retention testing results. Sand production, fines production, and pressure gradients within the sand pack and across the coupon are the primary evaluation factors. The replication tests’ results support replicating PSD from the commercial sands for sand retention tests.
The results show that the different SRT setups and testing procedures may yield different liner performance results in sanding and plugging. This paper improves the existing SRT setups and testing procedures and introduces a modified SRT apparatus along with an experimental workflow. The packing technique, axial stress magnitude, fluid flow rates, and salinity parameters on test performance were investigated among the influential parameters, and their effects were quantified. The proposed experimental workflow and testing variables’ determination procedure enable a more accurate and representative evaluation of sand control devices considering SAGD downhole conditions.
Gradually modifying the testing variables from the ones reported in Devere-Bennett [3] to the new procedure brings several conclusions. (1) The fluid flow rate is the most effective testing parameter on sand production, followed by packing technique, axial stress magnitude, and salinity. (2) The impact of stress is minimal on the pressure drop under the stress conditions applied in this work. (3) Lowering salinity from 10,000 ppm to 350 ppm raises the fines migration and production significantly, causing a higher pressure drop across the sand pack.

Author Contributions

Conceptualization, methodology, validation, investigation, writing—original draft preparation, O.K.; Investigation, resources, writing—review and editing, visualization, M.H.; Validation, writing—review and editing, funding acquisition, supervision, A.N. All authors have read and agreed to the published version of the manuscript.

Funding

This research was funded by RGL Reservoir Management Inc. and The Natural Sciences and Engineering Research Council of Canada (NSERC) through their CRD program.

Data Availability Statement

Not applicable.

Acknowledgments

The authors acknowledge the support and feedback provided by Noel Devere-Bennett and Mahdi Mahmoudi during this research.

Conflicts of Interest

The authors declare no conflict of interest.

Acronyms

CSCCritical Salt Concentration
PpmPart Per Million
PSDParticle Size Distribution
SAGD Steam Assisted Gravity Drainage
SCDSand Control Devices
SCTScaled Completion Test
SLSlotted Liner
SRTSand Retention Test
UCUniformity Coefficient
WWSWire-Wrapped Screen

References

  1. Gates, I.D.; Leskiw, C. Impact of steam trap control on performance of steam-assisted gravity drainage. J. Pet. Sci. Eng. 2010, 75, 215–222. [Google Scholar] [CrossRef]
  2. Shen, J. Enhanced Oil Recovery Field Case Studies, 1st ed.; Gulf Professional Publishing: Oxford, UK, 2013; pp. 413–445. [Google Scholar]
  3. Devere-Bennett, N. Using Pre-Pack Sand-Retention Tests (SRT’s) to Narrow Down Liner/Screen Sizing in SAGD Wells. In Proceedings of the SPE Thermal Well Integrity and Design Symposium, Banff, AB, Canada, 23 November 2015. [Google Scholar]
  4. Bennion, D.B.; Gupta, S.; Gittins, S.; Hollies, D. Protocols for Slotted Liner Design for Optimum SAGD Operation. J. Can. Pet. Technol. 2009, 48, 21–26. [Google Scholar] [CrossRef]
  5. Xie, J. Slotted Liner Design Optimization for Sand Control in SAGD Wells. In Proceedings of the SPE Thermal Well Integrity and Design Symposium, Banff, AB, Canada, 23 November 2015. [Google Scholar]
  6. Zhang, Z. An Advanced Sand Control Technology for Heavy Oil Reservoirs. Master’s Thesis, University of Calgary, Calgary, AB, Canada, 2017. [Google Scholar]
  7. Montero, J.D.; Chissonde, S.; Kotb, O.; Wang, C.; Roostaei, M.; Nouri, A.; Mahmoudi, M.; Fattahpour, V. A Critical Review of Sand Control Evaluation Testing for SAGD Applications. In Proceedings of the SPE Canada Heavy Oil Technical Conference, Calgary, AB, Canada, 13–14 March 2018. [Google Scholar]
  8. Coberly, C.J. Selection of Screen Openings for Unconsolidated Sands. In Proceedings of the Drilling and Production Practice, New York, NY, USA, 1 January 1937. [Google Scholar]
  9. Underdown, D.R.; Dickerson, R.; Vaughan, W. The Nominal Sand-Control Screen: A Critical Evaluation of Screen Performance. SPE Drill. Complet. 2001, 16, 252–260. [Google Scholar] [CrossRef]
  10. Gillespie, G.; Deem, C.K.; Malbrel, C. Screen Selection for Sand Control Based on Laboratory Tests. In Proceedings of the SPE Asia Pacific Oil and Gas Conference and Exhibition, Brisbane, Australia, 16 October 2000. [Google Scholar]
  11. Hodge, R.M.; Burton, R.C.; Constien, V.; Skidmore, V. An Evaluation Method for Screen-Only and Gravel-Pack Completions. In Proceedings of the International Symposium and Exhibition on Formation Damage Control, Lafayette, LA, USA, 20 February 2002. [Google Scholar]
  12. Constien, V.G.; Skidmore, V. Standalone Screen Selection Using Performance Master Curves. In Proceedings of the SPE International Symposium and Exhibition on Formation Damage Control, Lafayette, LA, USA, 15 February 2006. [Google Scholar]
  13. Chanpura, R.A.; Hodge, R.M.; Andrews, J.S.; Toffanin, E.P.; Moen, T.; Parlar, M. A Review of Screen Selection for Standalone Applications and a New Methodology. SPE Drill. Complet. 2011, 26, 84–95. [Google Scholar] [CrossRef]
  14. Ballard, T.J.; Beare, S.P. An Investigation of Sand Retention Testing With a View To Developing Better Guidelines for Screen Selection. In Proceedings of the SPE International Symposium and Exhibition on Formation Damage Control, Lafayette, LA, USA, 15 February 2012. [Google Scholar]
  15. Markestad, P.; Christie, O.; Espedal, A.; Rorvik, O. Selection of Screen Slot Width to Prevent Plugging and Sand Production. In Proceedings of the SPE Formation Damage Control Symposium, Lafayette, LA, USA, 14 February 1996. [Google Scholar]
  16. Ballard, T.; Beare, S. Media Sizing for Premium sand Screens: Dutch Twill Weaves. In Proceedings of the SPE European Formation Damage Conference, The Hague, The Netherlands, 13 May 2003. [Google Scholar]
  17. Ballard, T.; Beare, S. Sand Retention Testing: The More You Do, the Worse It Gets. In Proceedings of the SPE International Symposium and Exhibition on Formation Damage Control, Lafayette, LA, USA, 15 February 2006. [Google Scholar]
  18. Williams, C.F.; Richard, B.M.; Horner, D. A New Sizing Criterion for Conformable and Nonconformable Sand Screens Based on Uniform Pore Structures. In Proceedings of the SPE International Symposium and Exhibition on Formation Damage Control, Lafayette, LA, USA, 15 February 2006. [Google Scholar]
  19. Romanova, U.G.; Gillespie, G.; Sladic, J.; Ma, T.; Solvoll, T.A.; Andrews, J.S. A Comparative Study of Wire Wrapped Screens vs. Slotted Liners for Steam-Assisted Gravity Drainage Operations. In Proceedings of the World Heavy Oil Congress, New Orleans, LA, USA, 5–7 March 2014. [Google Scholar]
  20. Romanova, U.G.; Piwowar, M.; Ma, T. Sand Control for Unconsolidated Heavy Oil Reservoirs: A Laboratory Test Protocol and Recent Field Observations. In Proceedings of the International Symposium of the Society of Core Analysts, St. John’s, NL, Canada, 16–21 August 2015. [Google Scholar]
  21. O’Hara, M. Thermal Operations in the McMurray: An Approach To Sand Control. In Proceedings of the SPE Thermal Well Integrity and Design Symposium, Banff, AB, Canada, 23 November 2015. [Google Scholar]
  22. Mahmoudi, M. New Sand Control Design Criteria and Evaluation Testing for Steam-Assisted Gravity Drainage (SAGD) Wellbores. Ph.D. Thesis, University of Alberta, Edmonton, AB, Canada, 2016. [Google Scholar]
  23. Anderson, M. SAGD Sand Control: Large Scale Testing Results. In Proceedings of the SPE Canada Heavy Oil Technical Conference, Calgary, AB, Canada, 15 February 2017. [Google Scholar]
  24. Wang, C.; Pang, Y.; Montero, J.; Haftani, M.; Fattahpour, V.; Mahmoudi, M.; Nouri, A. Impact of Anisotropic Stresses on the Slotted Liners Performance in Steam Assisted Gravity Drainage Process. In Proceedings of the SPE Thermal Well Integrity and Design Symposium, Banff, AB, Canada, 27 November 2018. [Google Scholar]
  25. Fattahpour, V.; Mahmoudi, M.; Wang, C.; Kotb, O.; Roostaei, M.; Nouri, A.; Fermaniuk, B.; Sauve, A.; Sutton, C. Comparative Study on the Performance of Different Stand-Alone Sand Control Screens in Thermal Wells. In Proceedings of the SPE International Conference and Exhibition on Formation Damage Control, Lafayette, LA, USA, 7 February 2018. [Google Scholar]
  26. Fattahpour, V.; Azadbakht, S.; Mahmoudi, M.; Guo, Y.; Nouri, A.; Leitch, M. Effect of Near Wellbore Effective Stress on the Performance of Slotted Liner Completions in SAGD Operations. In Proceedings of the SPE Thermal Well Integrity and Design Symposium, Banff, AB, Canada, 28 November 2016. [Google Scholar]
  27. Bennion, D.B.; Gupta, S.; Gittins, S.; Hollies, D. Protocols for Slotted Liner Design for Optimum SAGD Operation. In Proceedings of the Canadian International Petroleum Conference, Calgary, AB, Canada, 17 June 2008. [Google Scholar]
  28. Selig, E.; Ladd, R.S. Preparing Test Specimens Using Undercompaction. Geotech. Test. J. 1978, 1, 16. [Google Scholar] [CrossRef]
  29. Guo, Y.; Roostaei, M.; Nouri, A.; Fattahpour, V.; Mahmoudi, M.; Jung, H. Effect of stress build-up around standalone screens on the screen performance in SAGD wells. J. Pet. Sci. Eng. 2018, 171, 325–339. [Google Scholar] [CrossRef]
  30. Haftani, M.; Kotb, O.; Nguyen, P.H.; Wang, C.; Salimi, M.; Nouri, A. A Novel sand control testing facility to evaluate the impact of radial flow regime on screen performance and its verification. J. Pet. Sci. Eng. 2020, 195, 107903. [Google Scholar] [CrossRef]
  31. Fermaniuk, B. Sand Control in Steam-Assisted Gravity Drainage (SAGD) Wellbores and Process of Slotted Liner Design and Process. Master’s Thesis, University of Calgary, Calgary, AB, Canada, 2013. [Google Scholar]
  32. Mahmoudi, M.; Nejadi, S.; Roostaei, M.; Olsen, J.; Fattahpour, V.; Lange, C.F.; Zhu, D.; Fermaniuk, B.; Nouri, A. Design Optimization of Slotted Liner Completions in Horizontal Wells: An Analytical Skin Factor Model Verified by Computational Fluid Dynamics and Experimental Sand Retention Tests. In Proceedings of the SPE Thermal Well Integrity and Design Symposium, Banff, AB, Canada, 28 November 2017. [Google Scholar]
  33. Tiffin, D.L.; King, G.E.; Larese, R.E.; Britt, L.K. New Criteria for Gravel and Screen Selection for Sand Control. In Proceedings of the SPE International Symposium on Formation Damage Control, Lafayette, LA, USA, 18 February 1998. [Google Scholar]
  34. Price-Smith, C.; Parlar, M.; Bennett, C.; Gilchrist, J.M.; Pitoni, E.; Burton, R.C.; Hodge, R.M.; Troncoso, J.; Ali, S.A.; Dickerson, R. Design Methodology for Selection of Horizontal Open-Hole Sand-Control Completions Supported by field Case Histories. SPE Drill. Completion 2003, 18, 235–255. [Google Scholar] [CrossRef]
  35. Rogers, E.B. Sand Control in Oil and Gas Wells. Oil Gas J. 1971, 54–60. [Google Scholar]
  36. Suman, G.O.; Ellis, R.C.; Snyder, R.E. Sand Control Handbook, 2nd ed.; Gulf Publishing Company, Book Division: Houston, TX, USA, 1983. [Google Scholar]
  37. Wang, C.; Pang, Y.; Mahmoudi, M.; Haftani, M.; Salimi, M.; Fattahpour, V.; Nouri, A. A Set of Graphical Design criteria for Slotted Liners in SteamAssisted Gravity Drainage Production Wells. J. Pet. Sci. Eng. 2020, 185, 106608. [Google Scholar] [CrossRef]
  38. Stein, N.; Odeh, A.; Jones, L. Estimating Maximum Sand-Free Production Rates From Friable Sands for Different Well Completion Geometries. J. Pet. Technol. 1974, 26, 1156–1158. [Google Scholar] [CrossRef]
  39. Spronk, E.M.; Doan, L.T.; Matsuno, Y.; Harschnitz, B. SAGD Liner Evaluation and Liner Test Design for JACOS Hangingstone SAGD Development. In Proceedings of the SPE Canada Heavy Oil Technical Conference, Calgary, AB, Canada, 9 June 2015. [Google Scholar]
  40. Khilar, K.C. Fogler, H.S. Migration of Fines in Porous Media; Springer Science & Business Media: Berlin/Heidelberg, Germany, 1998; p. 12. [Google Scholar]
  41. Mahmoudi, M.; Fattahpour, V.; Nouri, A.; Leitch, M. An Experimental Investigation of the Effect of pH and Salinity on Sand Control Performance for Heavy Oil Thermal Production. In Proceedings of the SPE Canada Heavy Oil Technical Conference, Calgary, AB, Canada, 7 June 2016. [Google Scholar]
  42. Haftani, M.; Wang, C.; Pallares, J.D.M.; Mahmoudi, M.; Fattahpour, V.; Nouri, A. An Investigation into the Effect of Brine Salinity on Fines Migration in SAGD Operations. In Proceedings of the SPE Western Regional Meeting, San Jose, CA, USA, 22 April 2019. [Google Scholar]
  43. Kia, S.; Fogler, H.; Reed, M. Effect of pH on colloidally induced fines migration. J. Colloid Interface Sci. 1987, 118, 158–168. [Google Scholar] [CrossRef]
  44. Khilar, K.; Fogler, H. The existence of a critical salt concentration for particle release. J. Colloid Interface Sci. 1984, 101, 214–224. [Google Scholar] [CrossRef] [Green Version]
  45. Clearly, M.P.; Melvan, J.J.; Kohlhaas, C.A. The Effect of Confining Stress and Fluid Properties on Arch Stability in Unconsolidated Sands. In Proceedings of the SPE Annual Technical Conference and Exhibition, Las Vegas, NV, USA, 23 September 1979. [Google Scholar]
  46. Coşkuner, G.; Maini, B. Effect of net confining pressure on formation damage in unconsolidated heavy oil reservoirs. J. Pet. Sci. Eng. 1990, 4, 105–117. [Google Scholar] [CrossRef]
  47. Pallares, J.D.M.; Wang, C.; Haftani, M.; Nouri, A. Experimental Correlations for the Performance and Aperture Selection of Wire-Wrapped Screens in Steam-Assisted Gravity Drainage Production Wells. SPE Prod. Oper. 2020, 35, 537–548. [Google Scholar] [CrossRef]
  48. Oda, M. Initial Fabrics and their Relations to Mechanical Properties of Granular Material. Soils Found. 1972, 12, 17–36. [Google Scholar] [CrossRef] [Green Version]
  49. Arthur, J.R.F.; Menzies, B.K. Inherent anisotropy in a sand. Géotechnique 1972, 22, 115–128. [Google Scholar] [CrossRef]
  50. Vaid, Y.P.; Sivathayalan, S. Fundamental Factors Affecting Liquefaction Susceptibility of Sands. Can. Geotech. J. 2000, 37, 592–606. [Google Scholar] [CrossRef]
  51. Miura, S.; Toki, S. A Sample Preparation Method and its Effect on Static and Cyclic Deformation-Strength Properties of Sand. Soils Found. 1982, 22, 61–77. [Google Scholar] [CrossRef] [Green Version]
  52. Kuerbis, R.; Vaid, Y. Sand Sample Preparation—The Slurry Deposition Method. Soils Found. 1988, 28, 107–118. [Google Scholar] [CrossRef] [Green Version]
  53. Suits, L.D.; Sheahan, T.; Ueng, T.-S.; Wang, M.-H.; Chen, M.-H.; Chen, C.-H.; Peng, L.-H. A Large Biaxial Shear Box for Shaking Table Test on Saturated Sand. Geotech. Test. J. 2006, 29, 1–8. [Google Scholar] [CrossRef]
  54. Huang, Y.-H.; Yang, S.-Q.; Hall, M.R.; Zhang, Y.-C. The Effects of NaCl Concentration and Confining Pressure on Mechanical and Acoustic Behaviors of Brine-Saturated Sandstone. Energies 2018, 11, 385. [Google Scholar] [CrossRef] [Green Version]
  55. Suits, L.D.; Sheahan, T.C.; Bradshaw, A.S.; Baxter, C.D.P. Sample Preparation of Silts for Liquefaction Testing. Geotech. Test. J. 2007, 30, 324–332. [Google Scholar] [CrossRef]
  56. Mahmoudi, M.; Fattahpour, V.; Nouri, A.; Rasool, S.; Leitch, M. The Effect of Screen Aperture Size on Fines Production and Migration in SAGD Production Wells. In Proceedings of the 2016 World Heavy Oil Congress, Calgary, AB, Canada, 6–9 September 2016. [Google Scholar]
  57. Mahmoudi, M.; Fattahpour, V.; Nouri, A.; Rasoul, S.; Yao, T.; Baudet, B.A.; Leitch, M.; Soroush, M. Investigation Into the Use of Commercial Sands and Fines to Replicate Oil Sands for Large-Scale Sand Control Testing. In Proceedings of the SPE Thermal Well Integrity and Design Symposium, Banff, AB, Canada, 28 November 2016. [Google Scholar]
  58. Rhodes, M. Introduction to Particle Technology; John Wiley & Sons Ltd.: Chichester, UK, 2008. [Google Scholar]
  59. Michaelides, E.; Crowe, C.T.; Schwarzkopf, J.D. Multiphase Flow Handbook; CRC Press: Boca Raton, FL, USA, 2016. [Google Scholar]
  60. CNOOC. Long Lake Kinosis Oil Sands Project Annual Performance Presentation. 2018. Available online: https://static.aer.ca/prd/documents/oilsands/insitu-presentations/2018AthabascaNexenLongLakeSAGD9485.pdf (accessed on 10 August 2021).
  61. Le Ravalec, M.; Morlot, C.; Marmier, R.; Foulon, D. Heterogeneity Impact on SAGD Process Performance in Mobile Heavy Oil Reservoirs. Oil Gas Sci. Technol.-Rev. L’ifp 2009, 64, 469–476. [Google Scholar] [CrossRef]
  62. Stone, T.W.; Bailey, W.J. Optimization of Subcool in SAGD Bitumen Processes. In Proceedings of the World Heavy Oil Congress, New Orleans, La, USA, 5–7 March 2014. [Google Scholar]
  63. Sidahmed, A.K. Optimization of Outflow Control Devices Design in Steam-Assisted Gravity Drainage Models with Wellbore Trajectory Excursions. Master’s Thesis, University of Alberta, Edmonton, AB, Canada, 2018. [Google Scholar]
  64. Beshry, M.A.; Krawchuk, P.; Brown, G.A.; Brough, B. Predicting the Flow Distribution on Total E&P Canada’s Joslyn Project Horizontal SAGD Producing Wells Using Permanently Installed Fiber-Optic Monitoring. In Proceedings of the SPE Annual Technical Conference and Exhibition, San Antonio, TX, USA, 24 September 2006. [Google Scholar]
  65. Brand, S. Results From Acid Stimulation in Lloydminster SAGD Applications. In Proceedings of the SPE International Symposium and Exhibition on Formation Damage Control, Lafayette, LA, USA, 10 February 2010. [Google Scholar]
  66. Romanova, U.G.; Ma, T. An Investigation of the Plugging Mechanisms in a Slotted Liner from the steam-Assisted Gravity Drainage Operations. In Proceedings of the SPE European Formation Damage Conference & Exhibition, Noordwijk, The Netherlands, 5 June 2013. [Google Scholar]
  67. Harvey, A.H. Thermodynamic Properties of Water: Tabulation from the IAPWS Formulation 1995 for the Thermodynamic properties of Ordinary Water Substance for General and Scientific Use, NISTIR 5078. United States Department of Commerce, 1995. Available online: https://nvlpubs.nist.gov/nistpubs/Legacy/IR/nistir5078.pdf (accessed on 10 August 2021).
  68. Guo, Y. Effect of Stress Build-Up around SAGD Wellbores on the Slotted Liner Performance. Master’s Thesis, University of Alberta, Edmonton, AB, Canada, 2018. [Google Scholar]
  69. Jafarpour, M.; Rahmati, H.; Azadbakht, S.; Nouri, A.; Chan, D.; Vaziri, H. Determination of mobilized strength properties of degrading sandstone. Soils Found. 2012, 52, 658–667. [Google Scholar] [CrossRef] [Green Version]
  70. Dahm, K.; Visco, D. Fundamentals of Chemical Engineering Thermodynamics. In Cengage Learning; Cengage: Boston, MA, USA, 2015. [Google Scholar]
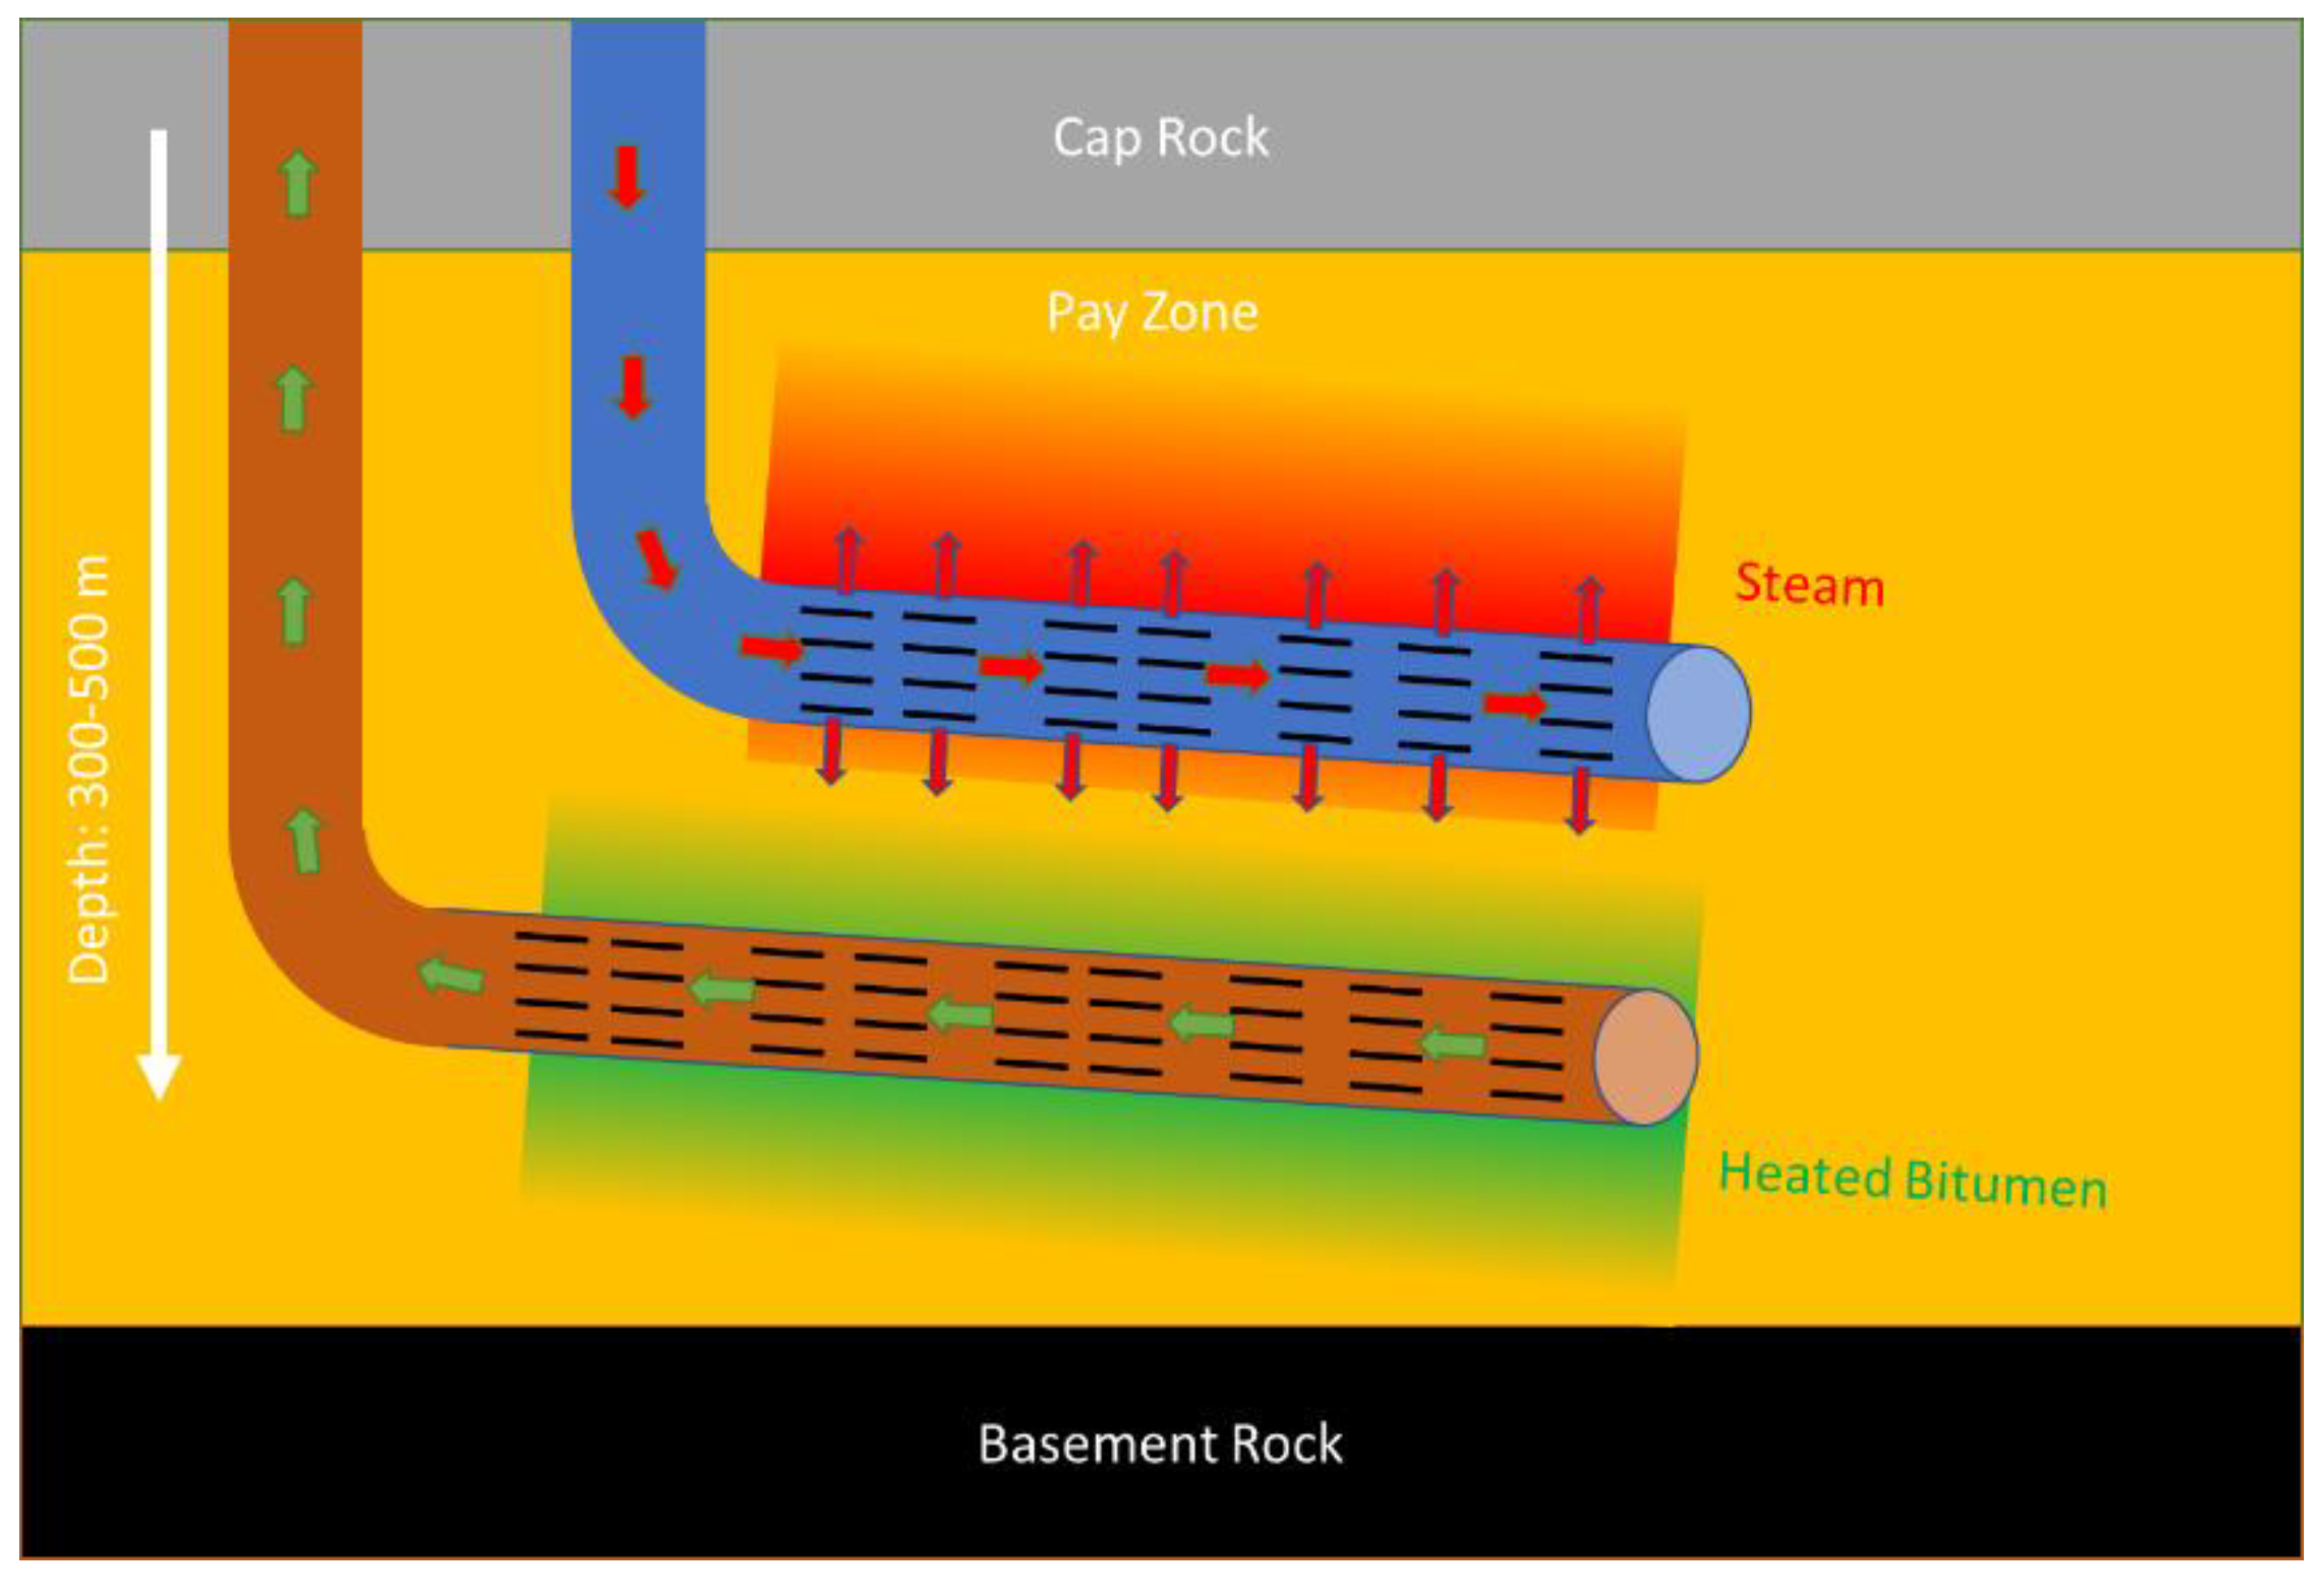
Figure 1. Schematic of a pair of horizontal wells in SAGD operations.
Eng 02 00027 g001
Figure 2. (a) Schematic of the SRT setup, (b) slotted liner coupon, and (c) cross-section of a rolled top slot.
Eng 02 00027 g002
Figure 3. Cumulative PSD of Long Lake oil sand print and the relevant replicated sample.
Eng 02 00027 g003
Figure 4. Original flow rate employed by Devere-Bennett [3] and upscaled fluid flow rates to the new testing setup (note: the original flow rates presented in the dash lines on the graph are covered by the relevant upscaled flow rates. For instance, the original water rate is covered by the upscaled water rate.).
Eng 02 00027 g004
Figure 5. Testing stages and associated fluid rates of the testing procedure used herein, used for Tests #5 and #6.
Eng 02 00027 g005
Figure 6. Pressure gradient in the context of the testing setups used in; (a) Devere-Bennett [3]; and (b) the current investigation.
Eng 02 00027 g006
Figure 7. Comparison between the pressure gradients across the sand pack from Devere-Bennett [3] with the pressure gradients of the replication test on the replicated sand pack, (a) pressure drop in the middle interval, and (b) pressure drop near the screen.
Eng 02 00027 g007
Figure 8. Near-coupon pressure gradients of SRT experiments reported in Devere-Bennett [3], where different SCDs were used.
Eng 02 00027 g008
Figure 9. Porosity distribution measured across the sand pack using the samples taken from the different intervals.
Eng 02 00027 g009
Figure 10. Comparison of the pressure gradient across the sand pack in SRT testing packed by moist tamping and dry packing techniques.
Eng 02 00027 g010
Figure 11. Normalized cumulative produced sand in the SRTs with a rolled top SL, slot width was 406–508 µm (0.016–0.020 inch).
Eng 02 00027 g011
Figure 12. Effect of axial stress on the pressure gradient across the sand pack at high-stress (2413 kPa) and low-stress (413 kPa) conditions.
Eng 02 00027 g012
Figure 13. Liquid flux employed in the test reported in Devere-Bennett [3] and this study for SL testing.
Eng 02 00027 g013
Figure 14. Total fines concentration in discharged brine at different testing stages.
Eng 02 00027 g014
Figure 15. Pressure gradient of different sections of the sand pack while injecting brine with different salinities.
Eng 02 00027 g015
Table 1. Testing plan.
Test
No.
SCD CouponFlow RatesPacking
Technique
Water CompositionStress
BrineOilNitrogen
1WWS 0.006 in/152 µmDevere-Bennett [3]Dry packing1% NaCl350 psi 2413 kPa
2Slotted Liner RT OFA 2.33%, 0.016 in/ 406 µmDevere-Bennett [3] ratesDry packing1% NaCl350 psi 2413 kPa
3Slotted Liner RT OFA 2.33%, 0.016 in/406 µmDevere-Bennett [3] ratesMoist tamping1% NaCl350 psi 2413 kPa
4Slotted Liner RT OFA 2.33%, 0.016 in/406 µmDevere-Bennett [3] ratesMoist tamping1% NaCl60 psi
413 kPa
5Slotted Liner RT OFA 2.33%, 0.016 in/406 µmRepresentative ratesMoist tamping1% NaCl60 psi
413 kPa
6Slotted Liner RT OFA 2.33%, 0.016 in/406 µmRepresentative ratesMoist tampingField representative ion composition60 psi
413 kPa
Table 2. Effective flow coefficients for calculating representative rates in the testing.
ScenariosNon-Uniform Flow ConditionPlugging FactorNon-Contributing
Liner Sections
Effective Flow Coefficient
Favorable condition scenario0.80.50.80.32
Non-uniform flow scenario0.50.50.80.20
Plugged and non-uniform flow scenario0.50.30.80.12
Table 3. Lab and field parameters.
Calculation Parameters
Coupon diameter *17.1cm
Coupon area *229.7 (0.023)cm2 (m2)
Average steam injection rate **270m3/day
Injected water density1000kg/m3
Mass of injection water 270,000kg/day
Well length **0.8km
Assumed steam quality0.5 -
* Testing setup specifications, ** Data source CNOOC [60].
Table 4. Field production information.
Field Information
Oil rate *80m3/d
Water rate **270m3/d
Liquid rate350m3/d
Liquid rate2201bbl/d
WOR *3.38-
Length of wells *0.80Km
Oil rate/length0.10m2/d
Water rate/length0.34m2/d
Liquid rate/length0.44m2/d
Oil rate/liner surface area0.18m/d
Water rate/liner surface area0.60m/d
Liquid rate/liner surface area0.78m/d
Liquid rate/liner surface area0.46bbl/ft2
* Data source CNOOC [60], ** Provided by CNOOC for this investigation.
Table 5. Scenarios of effective flow represented in the testing.
ScenariosEffective FlowLab Equivalent Oil Rate, cc/hLab Equivalent Water Rate, cc/hLab Equivalent Liquid Rate, cc/h
Perfect SAGD well condition1.0171578749
Favorable condition0.3253518072342
Non-uniform flow0.2085728913747
Plugged and non-uniform flow 0.12142848186246
Table 6. Steam rate calculations.
Steam Rate Calculations
Temperature 210°C
Pressure 1600kPag
Density of steam8.42kg/m3
Steam viscosity0.016cp
Steam rate 31,544m3/d
Length of wells0.8km
Steam rate/length 39.4m3/m
Steam rate/surface area 70.6m3/m2
Lab equivalent steam rate67,548cm3/h
Lab equivalent steam rate1.1L/min
Steam quality25%
Good scenario steam rate0.9L/min
Non-uniform scenario steam rate1.4L/min
Plugged and non-uniform scenario steam rate2.3L/min
Table 7. Chemical composition of produced water in Long Lake reservoir and brine used in testing reported by Devere-Bennett [3].
DescriptionUnitField Data *Brine Composition
pH-8.04N/A
CationsSodium (Na)mg/L1943935
Potassium (K)mg/L3.6-
Calcium (Ca)mg/L56.7-
Magnesium (Mg)mg/L21.4-
AnionsBicarbonate (HCO3)mg/L708-
Carbonate (CO3)mg/L0.5-
Hydroxide (OH)mg/L0.5-
Chloride (Cl)mg/L40.46065
Sulfate (SO4)mg/L46.1-
* Provided by CNOOC for this investigation.
Publisher’s Note: MDPI stays neutral with regard to jurisdictional claims in published maps and institutional affiliations.