Abstract
The surface roughening (Ra), martensitic phase transformation (MPT), and grain misorientation (GMO) behavior of stainless steel 304 and 316 in various grain sizes (Dg) were studied experimentally, including five cycles of sequential uniaxial tensile stress testing and Scanning Electron Microscope-Electron Back Scattered Diffraction (SEM-EBSD) investigation. The MPT and GMO characteristics were sequentially investigated using tensile testing and SEM-EBSD analysis. The correlation between MPT, GMO, martensitic volume fraction (Mf), and Ra behavior were investigated. The experimental results showed that increasing the total strain from 5.0% to 25.0% increased the MPT, GMO, and Mf, which were transformed from the metastable austenitic phase in stainless steel (SUS) 304. The increasing total strain increased Ra for all kinds of Dg. Furthermore, SUS 304 and SUS 316 were used to compare the roughening mechanism. The MPT was very high and spread uniformly in fine grain of SUS 304 thin foil, but the MPT was low and not uniform in coarse grain of SUS 304 thin foil. There was no MPT in SUS 316 thin foil, both in coarse and fine grain. The GMO in fine grains, both in SUS 304 and SUS 316 thin foils, spread uniformly. The GMO in coarse grains, both in SUS 304 and SUS 316 thin foils, did not spread uniformly. Surface roughness increased higher in coarse grain than fine grain for both of SUS 304 and SUS 316 thin foil. SUS 304 increased higher than SUS 316 thin foil. The effect of inhomogeneous deformation due to the MPT is a more important factor than GMO in coarse grain.
1. Introduction
Micro metal forming, particularly for austenitic stainless steel (ASS), is a promising approach in the biomedical, electronic, chemical, electrical power, food, and nuclear industries [1], ASS has excellent corrosion resistance and processability [1,2]. In addition, the high demand for microparts has received significant attention in recent decades [2,3]. However, microforming technology has a number of challenges, such as the limitation of material applications and the high cost of mass production [1,2,3]. When ASS is subjected to plastic deformation, martensitic-induced transformation occurs in the ASS [1]. The transformed martensitic volume fraction increases with the increase in plastic deformation [1,2,3]. Martensitic transformation reduces the toughness but increases the strength of ASS [4,5]. When subjected to plastic deformation, austenitic stainless steel, as a metastable phase, undergoes a transformation from Face Centered Cubic (FCC) austenite to Body Centered Tetragonal (BCT) martensite at room temperature [1,2,3,4]. The martensitic transformation enhances the strength of thin metal foils and results in elongation because an increasing work hardening rate can delay the occurrence of plastic instability in thin metal foils [1,2,3,4,5]. Factors that may result in martensitic transformations are chemical composition, strain path, grain size, strain level, and strain rate [6]. Xue et al. [1] found that the martensitic-transformed volume fraction can be controlled by controlling the stainless strip steel deformation. Martensitic transformation on the surface is larger than that in the interior with the same strain [1,2,3,4]. When ASS is subjected to plastic deformation, in addition to martensitic phase transformation (MPT), dislocation interaction and twinning also occur [1,5]. Twinning is greater on the surface than in the interior of ASS [1,6]. Increasing martensitic transformation results in the increasing stacking fault energy (SFE) of martensite; hence, the martensitic transformation occurs more readily on the surface than in the interior [1]. Furthermore, surface roughening also occurs more readily on the surface than in the interior of thin metal foils [1,2,3]. It is necessary to investigate the dependency between surface roughening behavior and MPT in ASS thin metal foils. Peng et al. [7] concluded that MPT is caused by an increasing strain rate, which results in an increase in the local temperature. A large increase in the strain rate suppresses MPT [7,8]. The Olson and Cohen model, called the OC model, is fundamental to the description of the kinetics of strain induced in martensite [1,7,9,10]. The shear band intersection, as a dominant nucleation site, is considered [7,11]. The transformation curve is constructed only as a function of the plastic strain and a constant environmental temperature in the OC model [7,10,12]. Tomita et al. [8] found that the number of shear band intersections, as the location of the nucleation site, increases as the strain rate increases, while the probability that a shear band intersection forms an embryo decreases. This conclusion was considered only for a constant temperature, and the increasing temperature caused by self-heating in the tensile test was ignored. Zandrahimi et al. [9], concluded that transformation of austenite to martensite (MPT) in AISI 304 resulted in surface hardening, which led to deterioration of the wear resistance. It is necessary to investigate the surface roughness caused by MPT because surface roughening is caused by grain deformation on the surface and affects thin metal foil properties, particularly on the surface. Zihao et al. [10] concluded that uniform elongation (UEL), ultimate tensile strength (UTS), and martensitic volume fraction decreased because of increasing strain rate and temperature. Jeom et al. [11] concluded that, in duplex stainless steel, strain-induced martensitic transformation (SIMT) occurred after plastic deformation. The transformation from austenite to ε martensite occurred at a low strain level, and transformation from austenite to α′ martensite occurred at a high strain level [10,11].
In addition, in miniaturization and metal forming processes, with decreasing sheet thickness, the ratio of surface roughness to thickness increases in metal foils, and this is known as a non-uniform thickness [12,13,14]. The surface roughening phenomena of the sheet material have a strong effect on necking and fracture behavior of materials [12,13]. The inhomogeneous deformation of each grain located near the free surface will cause surface roughening phenomena on the free surface of polycrystalline metals [13,14]. Thus, surface roughening is highly important in the field of microforming technology using sheet or thin metal foils [12,13,14]. Surface roughening results in the size effect of thin metal foils [15]. Furushima et al. [3] concluded that fracture behavior at the microscale is the major factor causing surface roughening. The failure behavior and material flow of thin sheet metals are influenced by the size effect, which is mainly caused by the low number of grains in the straining zone [16]. Meng et al. [17] found that, when the surface non-uniformity increases to the same magnitude as the sample thickness, the effect of the free surface roughening on fracture strain and flow behavior is significant. Stoudt et al. [18] found that a linear dependency exists between grain size and roughening rate, as well as demonstrated that the roughening rate was dependent on Mg-Al alloy grain size. Furushima et al. [19] found that pure titanium and pure copper dramatically decrease the fracture strain for thicknesses from 0.3 to 0.1 mm. Fracture strain is significantly affected by material thickness [18,19]. The size effect is challenging for micro metal forming of ultra-thin metal foils [17,18,19]. When plastic strain increases, the ratio of the surface roughness to the thickness for each material linearly increases [16,17,18,19]. Rabee et al. [20] found that clarification is needed in respect of the relationship between deformation-induced surface roughness and the local microstructure. Furushima et al. [21] concluded that fractures were caused by free surface roughening because dimpling did not occur for pure copper thin foil in the range of thicknesses from 0.05 to 0.1 mm. Surface roughness increased under uniaxial deformation because of decreased thickness in the same area [19,20,21]. This indicates that, when the number of grains is decreased, the surface roughness increases, as shown by uniaxial tensile testing with the same strain level. The fracture strain was low and surface roughness significantly increased in a uniaxial tensile test with the same strain level due to the five-fold decrease in the quantity of grain size (Dg) [20,21]. Lei Zhang et al. [22] found that investigation is limited regarding the quantitative description of the evolution of the surface roughness of FCC polycrystalline metals. Research and investigation of surface roughness, other than that of FCC structure polycrystalline metals, is, therefore, needed [18,19,20,21,22]. Kengo Yoshida [23] found that surface roughness is mainly governed by the Dg, and investigation is needed in respect of surface roughness behavior with Dg below 10 μm. Shimizu et al. [24] concluded that the mutuality of grains affects the surface roughening behavior. Different individual deformations of grains affect the surface roughening behavior [16,17,18,19,20,21,22,23,24]. It is necessary to investigate surface roughness behavior with different Dg, which may result in different mechanisms of surface roughness behavior. Linfa Peng et al. [25] found that the individual grains, and particularly the surface grains, are less restricted due to the decrease in grain boundary density caused by the increasing Dg. As the grain orientation and the structures of individual grains are randomly distributed, the inhomogeneity of grains is more significant, which leads to a significant increase in surface roughness [24,25]. Thus, investigation and understanding are needed in respect of surface roughening behavior with various Dg.
Furushima et al. [26] found that plastic deformation preferentially occurs in weak grains, which have lower flow stress in pure copper (C 10220-O) ultra-thin metal foil with a thickness of 0.05 mm. The roughening phenomena on the free surface of polycrystalline metals are affected by the inhomogeneous deformation in each grain located near the free surface [14,26]. P. Groche et al. [27] found that, due to the Hall–Petch theory, the flattening of the surface asperities is hindered by the increase in yield stress. Cheng et al. [28] found that the mechanical properties are affected by free surface roughening in thin metal foils, rather than the growth of the voids in the side materials, in thin sheet metal or thin metal foils. Thus, research and study of surface roughening is needed to understand the mechanisms of surface roughening, particularly for small Dg. Aziz et al. [29] found that surface roughening increased proportionally without annealing in coarse grains of SUS 304. The increase in surface roughening was not proportional without annealing in fine grains in either SUS 304 or SUS 316 thin metal foils. Furushima et al. [30] found that the grain strength variation is a representation parameter that determines material inhomogeneity. The decrease in the ratio of thickness to grain size, t/d, leads to inhomogeneous deformation, which affects the surface roughness behavior [26,27,28,29,30]. As a result, the increase in Dg in the same thickness leads to inhomogeneity of the grain strength [26,27,28,29,30,31].
For stainless steel (SUS) 304, the grain has high volume fraction of MPT induced by plastic deformation, and the grain strength increases, and grain deformation becomes more difficult, compared to grains with lower MPT. Furthermore, the effect of MPT on the surface roughness could depend on the microstructure, which means that the effect of MPT depends on the grain size. However, the effect of the MPT for different grain size on the surface roughness is unclear yet. The aim of this study was to clarify how the MPT and GMO result in inhomogeneous grain strength which is shown by the surface roughening behavior of thin metal foils with various Dg. In this study, ASS SUS 304 and SUS 316 thin metal foils were subjected to five cycles of sequential uniaxial tensile stress state testing to measure surface roughening behavior, and the MPT, GMO, and grain deformation mechanisms were analyzed using SEM-EBSD.
2. Materials and Research Method
2.1. Materials
According to Table 1 and Table 2, SUS 304 thin metal foil has a higher quantity of carbon and chromium. As a result, the MPT occur more easily in SUS 304 thin metal foil, and a low volume of carbide compound may occur in the grain matrix. The other element, such as silicon, mangan, phosphor, and sulfur, have the same quantity that gives the same effect in mechanical properties. MPT increase the strength of thin metal foils that occur in the grain matrix. Plastic deformation promotes dislocation motion. MPT occurs because of the dislocation motion during plastic deformation, which changes the crystal structure from face center cubic (FCC) to body center tetragonal (BCT). The amount of nickel in SUS 316 is almost 4–5% higher than in SUS 304 thin metal foils. This indicates that austenite in SUS 316 thin metal foils is more stable than austenite in SUS 304 thin metal foils. However, the quantity of the chromium element as a ferrite former in SUS 304 is higher than that in SUS 316 thin metal foils. This means chromium carbide is more easily formed in the grain matrix or at the boundary, as well as increases the strength of thin metal foils when they are subjected to plastic deformation. The greater the quantity of nickel in stainless steel, the more difficult the transformation from austenite to martensite. This is because nickel is an austenitic stabilizer, and higher energy is required for the transformation of the austenitic phase into martensite [29,31,32,33].

Table 1.
Chemical composition thin metal foils of SUS 304 (wt%).
Table 2.
Chemical composition thin metal foils of SUS 316 (wt%).
Figure 1 shows typical microstructures of various grain size (Dg) after annealing at 400 °C for one hour. The reason of annealing is to remove residual stress after rolling. The grain size (Dg) did not change before and after annealing treatment. Annealing subjected to various Dg ranging from fine grain to coarse grain. According to the Hall–Petch theory and equation, it is well known that grains size affects the mechanical properties of thin foil materials. Thin metal foils having fine grains have higher tensile and yield strength than thin metal foils having coarse grains. SUS 304 and SUS 316 thin metal foils exhibit different surface roughness values in a uniaxial tensile test applied with the same strain level in both thin metal foils. In previous research, a uniaxial tensile test was applied to thin metal foils without annealing. The strength of thin foil SUS 304 and SUS 316 were similar after annealing at 400 °C compared to as received materials [29,34].
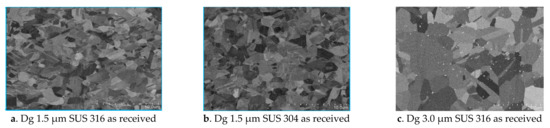
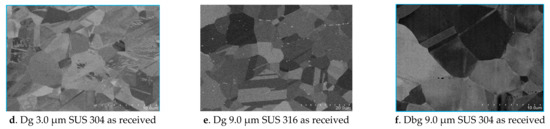
Figure 1.
SUS 304 (b,d,f) and 316 (a,c,e) thin metal foils with different grain sizes (Dg) as received.
Figure 2a shows thin metal foils of commercially available SUS 304 and 316 with a width of 4.0 mm, thickness of 0.1 mm, and gauge length of 20 mm, using the DIN 50125 standard. The sample was made as a dog bone type, as shown in Figure 2a. The grain size measurement technique is shown in Figure 2b.
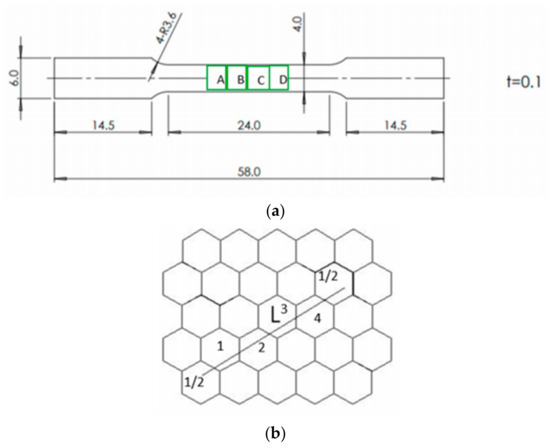
Figure 2.
(a). Technical drawing specimen of tensile test. (b). The crystal structure photo micrograph analogy.
2.2. Method
Before each sample was subjected to the uniaxial tensile stress test, cleaning was performed using ethanol combined with ultrasonic vibration for 30 min to increase the cleanliness of the surface. The sample was subjected to five cycles of tensile stress with constant strain. After the sample was subjected to uniaxial tensile stress, surface roughness was measured using a confocal laser microscope (OLS-5000, produced by Olympus, Co., Tokyo, Japan. The samples were subjected to five cycles of uniaxial tensile stress using a commercial Tensile Machine.
The uniaxial tensile test was performed sequentially for five cycles with a constant strain level on SUS 304 and SUS 316 stainless steel thin metal foils with various Dg. Then, the surface roughening behavior was measured sequentially until stage five. Thin metal foils of SUS 304 and SUS 316 were sequentially subjected to the uniaxial tensile test over the yield point using a constant strain level. The thin metal foils of SUS 304 and SUS 316 had a 20 mm gauge length, and the thickness of the thin foil was 0.1 mm. The width of thin foil was 4.0 mm. The fillet radius was 3.6 mm. This experiment used an Autograph AGX-50 KNVD Shimadzu commercial tensile test machine, produced by Shimadzu Corporation, Japan. This machine was used to ensure experimental consistency in the tensile test. During the tensile test, the strain rate was 1.6 × 10⁻³ m s−1. After the tensile test, the surface roughness was observed and measured for different materials, different Dg, and constant thickness. The tensile test and surface roughness investigation were repeated until stage five. As the contact extensometer could not be pasted onto the metal foils, the elongation was measured optically with a video non-contact extensometer (DVE-201, Shimadzu corp). The tensile test was sequentially applied to thin metal foils of SUS 304 and SUS 316. At each step, the tensile test was halted, and the specimen was taken from the chuck of the universal tensile test machine. Then, the surface roughness behavior was measured using a confocal laser microscope (OLS-5000, produced by Olympus Co., Japan). Surface roughness was observed at the center point of the A, B, C, and D area in the rolling direction of each step, as shown in Figure 2a. The area of the surface roughness measurement had a length of 0.7 mm, and the surface roughness was measured at the same position until stage five using the same strain level.
A SEM SU-70, produced by Hitachi High Technology corp, Japan, was used in normal mode to investigate the microstructure behavior after the tensile test. During the microstructure investigation, the SEM SU-70 acceleration voltage was 5 kV, the working distance was 10 mm, and the emission current was 16 μA. Phase transformation was investigated using an EBSD Digi View (EDAX) in field-free mode, with an emission current of 16 μA, acceleration voltage of 15 KV, and working distance of 20 mm. The pixel binning was 8 × 8, and the step (resolution) of the EBSD machine was 0.1 µm.
A JIS G0551 standard was used for measuring Dg in both SUS 304 and SUS 316 thin metal foils. As shown in Figure 2b, Dg was measured using the draw line (length is L) on a photomicrograph. Then, from the line, the number of crystals could be counted, including ½ at the end of the line. The crystal structure photomicrograph was an analogy, as shown in Figure 2b. The Dg can be calculated using the following formula. The average Dg was calculated as = .
3. Experimental Results of Tensile Test
Figure 3 shows the stress–strain curves of SUS 304 and SUS 316 thin metal foils with various Dg. In SUS 304 thin metal foils, fracture strain is influential factor in this study. In contrast, tensile strength decreases with increasing Dg in SUS 304 thin metal foils. The strength and ductility of SUS 304 are higher than those of SUS 316 thin metal foils, as shown in Figure 3. According to the Hall–Petch theory, materials with fine grains exhibit higher strength than materials with coarse grains. The strength significantly improved when the grain size decreased from coarse to fine [34]. The correlations between surface roughness behavior with strain level without annealing have been revealed in previous study, showing that surface roughness increases proportional in coarse grain and does not increase proportional in fine grain during uniaxial tensile test [29].
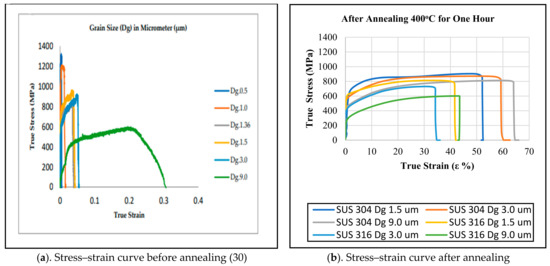
Figure 3.
Stress–strain curve of SUS 304 and SUS 316 thin foil before (a) and after annealing (b).
Figure 4 indicates the relation between the surface roughness and true strain at a low strain level of 5% (1.0% at one stage of the tensile test) and at a high strain level of 25% (5.0% at one stage). The samples of both SUS 304 and SUS 316 thin metal foils were subjected to five stages of a tensile test at low strain and high strain levels. Thus, the accumulation of the strain level for low strain was 5.0%, and the accumulation of the strain level for high strain was 25.0%.
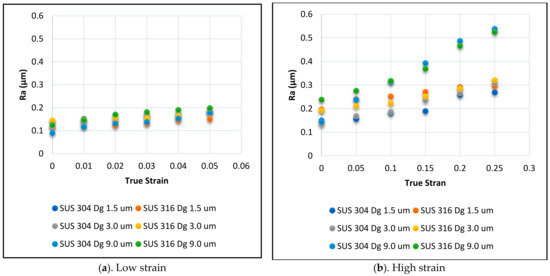
Figure 4.
Surface roughening behavior in SUS 304 and SUS 316, low strain (a) and high strain (b).
According to Figure 3a,b, Dg 1.3 µm was SUS 316 thin foil without annealing, and Dg 0.5 µm, Dg 1.0 µm, Dg 1.5 µm, Dg 3.0 µm, Dg 9.0 µm were SUS 304 thin foil without annealing [29]. The strength of thin foils between SUS 304 and SUS 316 as received and after annealing are similar, as shown in Figure 3a,b.
The correlation between surface roughness and true strain is shown in Figure 4a,b, in both low and high strain level. Surface roughness (Ra) increased proportional both in low and high strain level. Based on Figure 4a, the surface roughness increased proportionally in the low strain level in both the fine and coarse grains. The tendency of surface roughness behavior is similar in fine and coarse grains at the low strain level. Based on Figure 4B, the surface roughness increased proportionally at the high strain level in both fine and coarse grains. The increase in surface roughness was higher for coarse grain than fine grain, in both SUS 316 and SUS 304 thin metal foils.
Figure 5 indicates the relation between the increase in surface roughness (ΔRa) and the true strain instead of Ra. ΔRa means the difference between the initial surface roughness and the surface roughness after the five steps of the tensile test. At a high strain level, ΔRa was proportional to true strain in both fine and coarse grains, and ΔRa increased to a higher value in coarse grains than in fine grains. The greater increase in Ra in coarse grains under high strain conditions indicates that the mechanisms of fine and coarse grains are different at a high strain level.
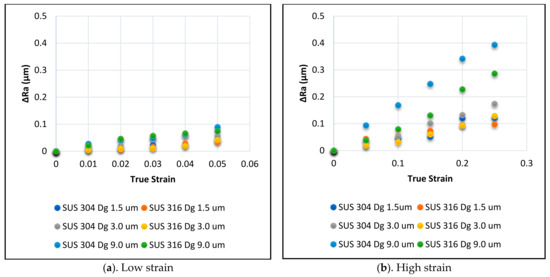
Figure 5.
The increase in surface roughening behavior in SUS 304 and SUS 316, low strain (a) and high strain (b).
Figure 6 indicates the ΔRa values for SUS 304 and SUS 316 thin metal foils at a high strain level with various grain sizes. The ΔRa increased proportional to Dg, but the gradient depends on the material.
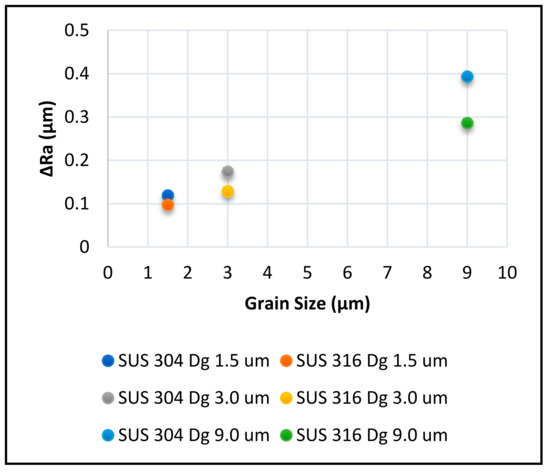
Figure 6.
Increasing Ra at high strain level.
Since the grain strength of fine grains is higher than that of coarse grains, the grain strength may have an effect on surface roughness increasing. The higher the strength in fine grains, the more difficult it is to deform them. According to the Hall–Petch effect, the higher strength in fine grains than coarse grains is also indicated by the higher tensile strength in fine grains compared to coarse grains, as shown in Figure 3.
The surface roughness also depends on the inhomogeneity of the grains; higher inhomogeneity of grains will result in higher surface roughness after plastic deformation with the same strain level [26].
The ΔRa of SUS 304 coarse grains is higher than the ΔRa of SUS 316 coarse grains because the grain strength in SUS 304 is higher than that of SUS 316, as indicated by the higher tensile strength in SUS 304 than SUS 316 thin metal foil fine grains, as shown in Figure 3.
Based on previous studies [30], increases linearly to product of grain size (Dg) and strain levels or true strain (ε), as shown in Equation (1),
where is initial surface roughness, and is the material constant. Since, we could write the equation as:
The equation means that coefficient only depends on the material but not on Dg and ε. By substituting the results shown in Figure 5 into Equation (2), the correlation between product of grain size (Dg), true strain (ε), and can be plotted as shown in Figure 7. The increase proportional with the increasing . However, there are differences in the gradients. The difference of the gradients may depend on the homogeneous and inhomogeneous grain strength of thin metal foils due to the grain sizes. Different mechanisms may also result in different tendencies in surface roughness behavior in SUS 304 and SUS 316 s.
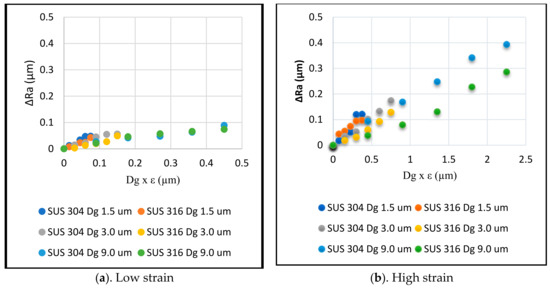
Figure 7.
The increase in surface roughening due to grain size and true strain of SUS 304 and SUS 316, low strain (a) and high strain (b).
For investigation of the different in deformation mechanisms, microstructures of the material after the tensile test was analyzed by using SEM-EBSD, discussed in next section.
4. Results of SEM-EBSD and Discussion
In this research, SEM-EBSD was used to obtain a phase map, IPF map, and KAM map before and after the sequential uniaxial tensile test. The Phase map consists of austenite and martensite phases in the SEM-EBSD result. The inverse pole figure (IPF) map derived by EBSD reflects the locally discovered orientation. From the IPF map, we could obtain grain deformation behavior with the changing of a color in a grain. The kernel average misorientation (KAM) map is a map that shows grains orientation by changing collective color in the EBSD result. The KAM map comes from the calculation and averaged grain misorientation in the center with the surroundings.
The microstructures, consisting of MPT derived from phase map and GMO derived from KAM map, were obtained using SEM-EBSD analysis. The MPT and GMO were investigated in fine and coarse grains of SUS 304 and SUS 316 thin metal foils at both low and high strain levels and related to surface roughness behavior. In Figure 8(A1–A4), the phase map is shown. The red color is the gamma (γ) or austenite phase, and the green color is martensite phase transformation (MPT), also known as alpha (α) iron; Figure 8(B1–B4) show the IPF normal direction (ND) map. Grain deformation is more severe in coarse grains, as shown in Figure 8(B3,B4), than fine grains, as shown in Figure 8(B1,B2), in both SUS 304 and SUS 316 thin metal foils. There was no MPT in SUS 316 fine grain and coarse grain, as shown in Figure 8(A1,A4), even after 25% total strain level. The grain deformation in coarse grain of SUS 316 was more severe, as shown in Figure 8(B4), compared to fine grain, as shown in Figure 8(B1). The MPT was very high and spread uniformly in fine grain of SUS 304, as shown in Figure 8(A2). The MPT was low and not uniformly spread in coarse grain, as shown in Figure 8(A3).
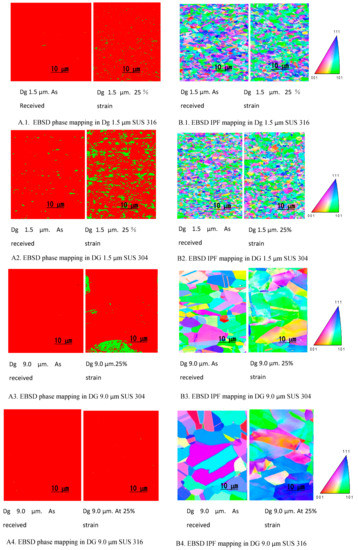
Figure 8.
SEM-EBSD mapping for SUS 304 and SUS 316 thin metal foils.
During the tensile test with the same strain level, the slip band intersection was higher in fine-grain SUS 304 thin metal foils than the coarse grains of SUS 304 thin metal foils [8,9,10]. As a result, MPT in fine grains was greater than that in coarse grains of SUS 304 thin metal foils. The slip band intersection is the location of the martensitic embryo and nucleation [10,11,35]. Fine grains have a higher probability of the slip band intersection than coarse grains [10], thus, MPT is greater in fine grains than coarse grains with the same strain level. Therefore, fine grains have greater grain strength than coarse grains, and fine grains have lower inhomogeneous grain strength than coarse grains. As a result, coarse grains with lower MPT become inhomogeneous grains, and fine grains that consist of higher MPT become homogeneous grains, which indicates the higher surface roughening behavior in coarse grains than in fine grains of SUS 304 thin metal foils at the same strain level.
As shown in Figure 9(A1–A4), it was known that the KAM map consists of three kinds of color, the blue one was 0° misorientation, the green one was 2° misorientation, and the red one was 5° misorientation [29]. The effect on the grain strength of 5° misorientation was higher than 2° grain misorientation, and the effect on the grain strength of 2° misorientation was higher than 0° grain misorientation [24,27,29]. There was no effect on 0° grain misorientation in grain strength [24,29]. According to the grain misorientation, the grain strength of SUS 316 thin foil was high, and the grain strength of SUS 304 fine grain was very high. Figure 9(A1,A2) show that the amount of 5° grain misorientation was similar between SUS 304 and SUS 316 fine grain thin foils, but 2° green misorientation in SUS 316 thin metal foils was lower than the green misorientation in SUS 304 thin metal foils. This means that a grain of SUS 316 is weaker than a grain of SUS 304.
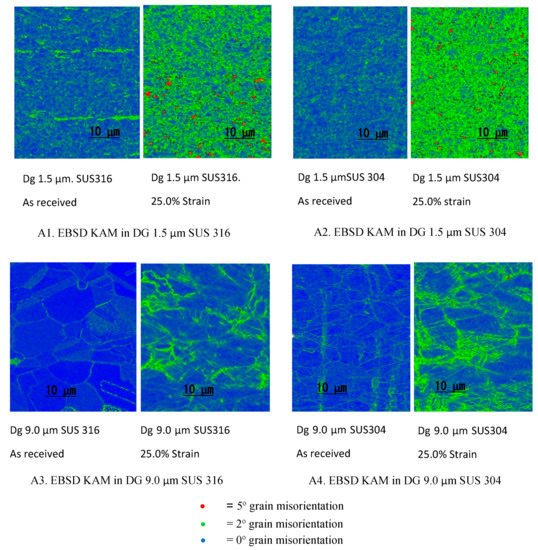
Figure 9.
KAM mapping for SUS 304 and SUS 316 thin metal foils.
The type of grain deformation mechanism, in both SUS 304 and SUS 316 fine grain thin metal foils, was intergrain deformation [24,27]. Intergrain deformation results in a small change in the surface roughness in fine grain SUS 304 and SUS 316 thin metal foils because the intergrain deformation affects the low inclination of a grain from the normal direction that affects more homogeneous grain strength values [22,24,25,36]. The surface roughness in fine-grain SUS 304 thin metal foils was almost the same as that of fine grain SUS 316 thin metal foils because the grain inclinations were similar after plastic deformation, even though the grain strength of SUS 316 thin metal foil is weaker than that of SUS 304 thin metal foil.
5. Conclusions
First, surface roughness increased proportionally with true strain until a high strain level (25%) in SUS 304 and SUS 316 thin metal foils with both coarse and fine grains. The increase in surface roughness for coarse grain was greater in SUS 304 than in SUS 316 thin metal foil because the deformation in SUS 304 thin metal foils are more inhomogeneous than SUS 316 thin metal foils due to the MPT.
Second, the effect of MPT on the inhomogeneous grain deformation in coarse grain was larger than GMO, as shown by the higher surface roughness in SUS 304 coarse grain thin foil, compared to SUS 316 thin foil coarse grain, at the same strain level.
Third, MPT is the important factor that enhances the surface roughness in coarse grain of SUS 304. On the other hand, MPT has little effect in increasing the surface roughness of fine grain SUS 304 thin metal foil due to different deformation mechanisms.
Fourth, the coefficient for relation of and does not depend only on material but also on microstructure-dependent deformation.
Author Contributions
A.A. was responsible for making the research plan, doing the experiment, analyzing the data, conducting the discussion, and drawing the conclusion. M.Y. was responsible for supervising the author through making the research plan, doing the experiment, and conducting the discussion until the result was obtained. T.S. was responsible for supervising the author through making the research plan. T.F. was responsible for supervising the author through making the research plan. All authors have read and agreed to the published version of the manuscript.
Funding
This research was not financed by external funding sources.
Data Availability Statement
In this research, there was not data availability statement.
Acknowledgments
The authors would like to express their sincere gratitude and appreciation to Komatsuseiki Kosakusho Co. Ltd., especially to Yohei Suzuki San and Tomoaki Yoshino San for supplying samples, and to Sato Oshima, Tokyo Metropolitan University (TMU), for loan of the Shimadzu Tensile Machine. The present work was supported by the Advanced Materials Processing Engineering Laboratory (AMPEL), TMU, Japan and IsDB Untirta-Indonesia.
Conflicts of Interest
The authors hereby declare that there is no conflict of interest that needs to be disclosed in connection with the publication of this study.
References
- Xue, Z.-Y.; Zhou, S.; Wei, X.-C. Influence of pre-transformed martensite on work-hardening behavior of SUS 304 metastable austenitic stainless steel. J. Iron Steel Res. Int. 2010, 17, 51–55. [Google Scholar] [CrossRef]
- Engel, U.; Eckstein, R. Microforming—From basic research to its realization. J. Mater. Process. Technol. 2002, 125–126, 35–44. [Google Scholar] [CrossRef]
- Furushima, T.; Hitomi, T.; Yutaro, H. Fracture and surface roughening behaviors in micro metal forming. In Proceedings of the 17th International Confrence on Metal Forming, Metal Forming 2018, Toyohashi, Japan, 16–19 September 2018; Procedia Manufacturing. Volume 15, pp. 1481–1486. [Google Scholar]
- Milad, M.; Zreiba, N.; Elhalouani, F. The effect of Cold Work on Structure and Properties of AISI 304 Stainless Steel. J. Mater. Process. Technol. 2008, 203, 80. [Google Scholar] [CrossRef]
- Jha Abhay, K.; Sivakumar, D.; Sreekumar, K. Role of Transformed Martensite in the Cracking of Stainles Steel Plumbing Lines. Eng. Fail. Anal. 2008, 15, 1042. [Google Scholar]
- Huang, J.X.; Ye, X.N.; Xu, Z.J. Corrosion Resistance of High Performance Weathering Steel for Bridge Building Applications. Iron Steel Res. Int. 2012, 19, 59–63. [Google Scholar] [CrossRef]
- Peng, F.; Dong, X.H.; Liu, K.; Xie, H.Y. Effects of strain rate and plastic work on martensitic transformation kinetics of austenitic stainless steel 304. J. Iron Steel Res. Int. 2015, 22, 931–936. [Google Scholar] [CrossRef]
- Tomita, Y.; Iwamoto, T. Constitutive modeling of TRIP steel and its application to the improvement of mechanical properties. Int. J. Mech. Sci. 1995, 37, 1295–1305. [Google Scholar] [CrossRef]
- Zandrahimi, M.; Bateni, M.R.; Poladi, A.; Szpunar, J.A. The formation of martensite during wear of AISI 304 stainles steel. Wear 2007, 263, 674–678. [Google Scholar] [CrossRef]
- Zihao, Q.; Yong, X. Role of strain—Induced martensitic phase transformation in mechanical response of 304L steel at different strain—Rates and temperatures. J. Mate. Process. Tech. 2020, 280, 116613. [Google Scholar]
- Jeom, Y.C.; Jung, H.J.; Si, W.H.; Kyung, T.P. Strain induced martensitic transformation of Fe-20Cr-5Mn-0,2Ni duplex stainless steel during cold rolling: Effects of nitrogen addition. Mater. Sci. Eng. A 2011, 528, 6012–6019. [Google Scholar]
- Yamaguchi, K.; Mellor, P.B. Thickness and Grain Size Dependence of Limit Strains in Sheet Metal Stretching. Int. J. Mech. Sci. 1976, 18, 85–90. [Google Scholar] [CrossRef]
- Osakada, K.; Oyane, M. On the Roughening Phenomena of Free Surface in Deformation Process. Trans. Jpn. Soc. Mech. Eng. 1970, 36, 1017–1022. [Google Scholar] [CrossRef][Green Version]
- Fukuda, M.; Yamaguchi, K.; Takakura, N.; Sakano, Y. Roughening Phenomenon on Free Surface of Products in Sheet Metal Forming. J. Jpn. Soc. Technol. Plast. 1974, 15, 994–1002. [Google Scholar]
- Yamaguchi, K.; Takakura, N.; Fukuda, M. FEM simulation of surface roughening in FCC metals Using Direct Numerical Simulation. Acta Mater. 2004, 52, 5791–5804. [Google Scholar]
- Vollertsen, F.; Schulze Nichoff, H.; Hu, Z. State of the art in micro forming. Int. J. Mach. Tools Manuf. 2006, 46, 1172–1179. [Google Scholar] [CrossRef]
- Meng, B.; Fu, M.W. Size effect on deformation behavior and ductile fracture in microforming of pure copper sheets considering free surface roughening. Mater. Des. 2015, 83, 400–412. [Google Scholar] [CrossRef]
- Stoudt, M.R.; Hubbard, J.B.; Leigh, S.D. On the relationship between deformation-induced surface roughness and plastic strain in AA5052. Met. Mater. Trans. A 2011, 42, 2668–2679. [Google Scholar] [CrossRef]
- Tsuyoshi, F.; Hitomi, T.; Manabe, K.-I.; Yang, M.; Sergei, A. Influence of Free Surface Roughening on Ductile Fracture Behavior Under Uni-axial Tensile State For Metal Foils. In Proceedings of the 13th International Conference on Fracture, Beijing, China, 16–21 June 2013. [Google Scholar]
- Raabe, D.; Scahtleber, M.; Weiland, H.; Scheele, G.; Zhao, Z. Grain-scale micromechanics of polycrystal surfaces during plastic straining. Acta Mater. 2003, 51, 1539–1560. [Google Scholar] [CrossRef]
- Furushima, T.; Tsunezaki, H.; Manabe, K.; Alexandrov, S. Ductile fracture and free surface roughening behaviors of pure copper foils for micro/meso-scale forming. Int. J. Mach. Tools Manuf. 2014, 76, 34–48. [Google Scholar] [CrossRef]
- Zhang, L.; Xu, W.; Cheng, L.; Ma, X.; Long, J. Quantitative Analysis of Surface Roughness Evolution in FCC Polycrystalline Metal During Uniaxial Tension. Comput. Mater. Sci. 2017, 132, 19–29. [Google Scholar] [CrossRef]
- Kengo, Y. Effect of Grain Scale Heterogeneity on Surface Roughness and Sheet Metal Necking. Int. J. Mech. Sci. 2014, 83, 48–56. [Google Scholar]
- Ichiro, S.; Takao, O.; Takeji, A.; Hideaki, T. Surface Roughening and Deformation of Grains during Uniaxial Tension of Polycrystalline Iron. JSME Int. J. Ser. A 2001, 44, 499–506. [Google Scholar]
- Peng, L.; Xu, Z.; Gao, Z.; Fu, M. A Constitutive Model for Metal Plastic Deformation At Micro/Meso Scale With Consideration of Grain Orientation And Its Evolution. Int. J. Mech. Sci. 2018, 138–139, 74–85. [Google Scholar] [CrossRef]
- Tsuyoshi, F.; Hitomi, T.; Tomoko, N.; Manabe, K.-I.; Alexandrov, S. Prediction of Surface Roughening and Necking Behavior for Metal Foils by Inhomogeneous FE material Modelling. Key Eng. Mater. 2013, 554–557, 169–173. [Google Scholar]
- Groche, P.; Schafer, R.; Justinger, H.; Ludwig, M. On the correlation between crystallographic grain size and surface evolution in metal forming process. Int. J. Mech. Sci. 2010, 52, 523–530. [Google Scholar] [CrossRef]
- Cheng, C.; Wan, M.; Meng, B. Size Effect on the forming limit of sheet metal in micro-scaled plastic deformation considering free surface roughening. Procedia Eng. 2017, 207, 1010–1015. [Google Scholar] [CrossRef]
- Abdul, A.; Yang, M. Effect of Martensitic Transformation on The Surface Roughening of SUS 304 and 316 thin metal foils. Eng 2020, 1, 167–182. [Google Scholar]
- Tsuyoshi, F.; Tomoko, N.; Kanta, S. A new theoretical model of material inhomogeneity for prediction of surface roughening in micro metal forming. CIRP Ann.-Manuf. Technol. 2019, 68, 257–260. [Google Scholar]
- Stoudt, M.R.; Ricker, R.E. The relationship between grain size and the surface roughening behavior of Al-Mg Alloys. Metall. Mater. Trnsactions A 2002, 33, 2883–2889. [Google Scholar] [CrossRef]
- Tsuyoshi, F.; Tetsuro, M.; Manabe, K.-I.; Alexandrov, S. Prediction of Free Surface Roughening by 2D and 3D model considering Material Inhomogeneity. J. Solid Mech. Mater. Eng. 2011, 5, 978–990. [Google Scholar]
- Tetsuhide, S.; Masahiro, O.; Ming, Y.; Manabe, K.-I. Plastic anisotropy of ultra thin rolled phosphor bronze foils and its thickness strain evolution in micro-deep drawing. Mater. Des. 2014, 56, 604–612. [Google Scholar]
- Su, Y.; Song, R.; Wang, T.; Cai, H.; Wen, J.; Guo, K. Grain size refinement and effect on tensile properties of a novel low-cost stainless steel. Mater. Lett. 2020, 260, 126919. [Google Scholar] [CrossRef]
- Olson, G.B.; Cohen, M. The formability of austenitic stainless steels. Met. Trans. 1975, 6, 791–795. [Google Scholar] [CrossRef]
- Xu, J.; Guo, B.; Shan, D.; Li, M.; Wang, Z. Specimen Dimension, Grain Size Effect and Deformation Behavior in Micro Tensile of SUS 304 Stainless Steel Foil. Mater. Trans. 2013, 54, 984–989. [Google Scholar] [CrossRef]
Publisher’s Note: MDPI stays neutral with regard to jurisdictional claims in published maps and institutional affiliations. |
© 2021 by the authors. Licensee MDPI, Basel, Switzerland. This article is an open access article distributed under the terms and conditions of the Creative Commons Attribution (CC BY) license (https://creativecommons.org/licenses/by/4.0/).