1. Introduction
In 2000, the United Nations (UN) crafted eight Millennium Development Goals (MDGs) to battle the multiple poverty dimensions. One of the targets of the seventh goal (Ensure Environmental Sustainability) is “to halve, by 2015, the proportion of the population without sustainable access to safe drinking water and basic sanitation.” Based on the 2015 Millennium Development Goals Report [
1], “147 countries have met the drinking water target, 95 countries have met the sanitation target, and 77 countries have met both.” Despite this progress, two billion people still lack basic sanitation services [
2]. As defined by the UN (2012), an improved sanitation facility is a facility that hygienically separates human excreta from human, animal, and insect contact. As a response, in September 2015, the UN created the 17 Sustainable Development Goals (SDGs) with one goal focusing on access to water and sanitation—sixth goal [
3]. One of its targets is “by 2030, to achieve access to adequate and equitable sanitation and hygiene for all and end open defecation, paying special attention to the needs of women and girls and those in vulnerable situations.” Unlike the MDG which only used the proportion of the population with improved toilet facilities as an indicator, SGD will be using the percentage of wastewater (sewage and fecal sludge) safely treated as an indicator, giving importance to fecal sludge management [
4].
For developing countries to improve their sanitation conditions, they would have to choose between two sanitation systems: centralized and decentralized. Centralized systems convey wastewater to a central location for treatment and disposal. It is the case where households (HHs) are connected to a network of pipes directed to a central wastewater treatment facility. These systems could provide a complete treatment of wastewater, but are costly because of pipe network construction, energy requirements, and other engineering interventions that they require [
5,
6]. This is the main reason why most developing countries use decentralized systems that treat and dispose of wastewater onsite or near the point of generation [
7]. One of the most commonly used decentralized systems is the septic tank, a settling tank where toilet wastewater is temporarily stored. Compared to centralized systems, septic tanks are cheaper and have a simpler design [
8]. However, one problem is that septic tank design in developing countries does not usually include a leach field—a series of trenches where the water from the tank is further treated as it slowly seeps through the soil. When the tanks get full, a part of the contents drains directly to nearby canals or water bodies, posing health and environmental risks. A solution is to desludge the septic tanks regularly and to treat the collected septage. Septage is the partially decomposed fecal waste in a septic tank.
An emerging problem now in developing countries is that more and more HHs are using septic tanks, but septage management systems to desludge tanks and to treat collected septage are not well established. This results in a very small percentage of septage treated effectively and a considerable percentage of septage disposed of into the environment, leading to water pollution and health problems.
In the Philippines, only 10% of the 98 million people are connected to a piped sewerage, and 84% of the population is disposing toilet wastewater to septic tanks. The inconvenient fact is that only 30% of septage is treated in Metro Manila, and only 5% outside Metro Manila [
9]. Based on USAID and the Philippine Department of Interior and Local Government (DILG) assessment in 2007, more than 11,338 Filipinos die yearly from diarrhea and about 55 daily from all water-borne diseases [
10]. Moreover, up to 58% of groundwater is contaminated with coliform, and 64% of rivers fail water quality standards (mainly coliform and BOD) for Class C water (for fisheries, agriculture, or recreational activities). These are several reasons why, in 2013, the Philippines implemented a national strategy for sewage and septage management that requires local government units (LGUs) to establish septage management systems [
11]. To guide these LGUs in deciding the appropriate septage management system for them, it is of great significance to assess and understand existing systems’ strengths and weaknesses.
Several tools have been developed to assess the overall state of sanitation in an area (e.g., SaniPath, Urban Sanitation Status Index), but only a few have been devised to focus on septage management. For example, the SaniPath Tool (developed by Emory University) is designed to evaluate public health risks from poor sanitation to better plan sanitation investments [
12]. The Urban Sanitation Status Index, on the other hand, is used to measure the sanitation status of the lowest administrative unit within a city, through several indicators [
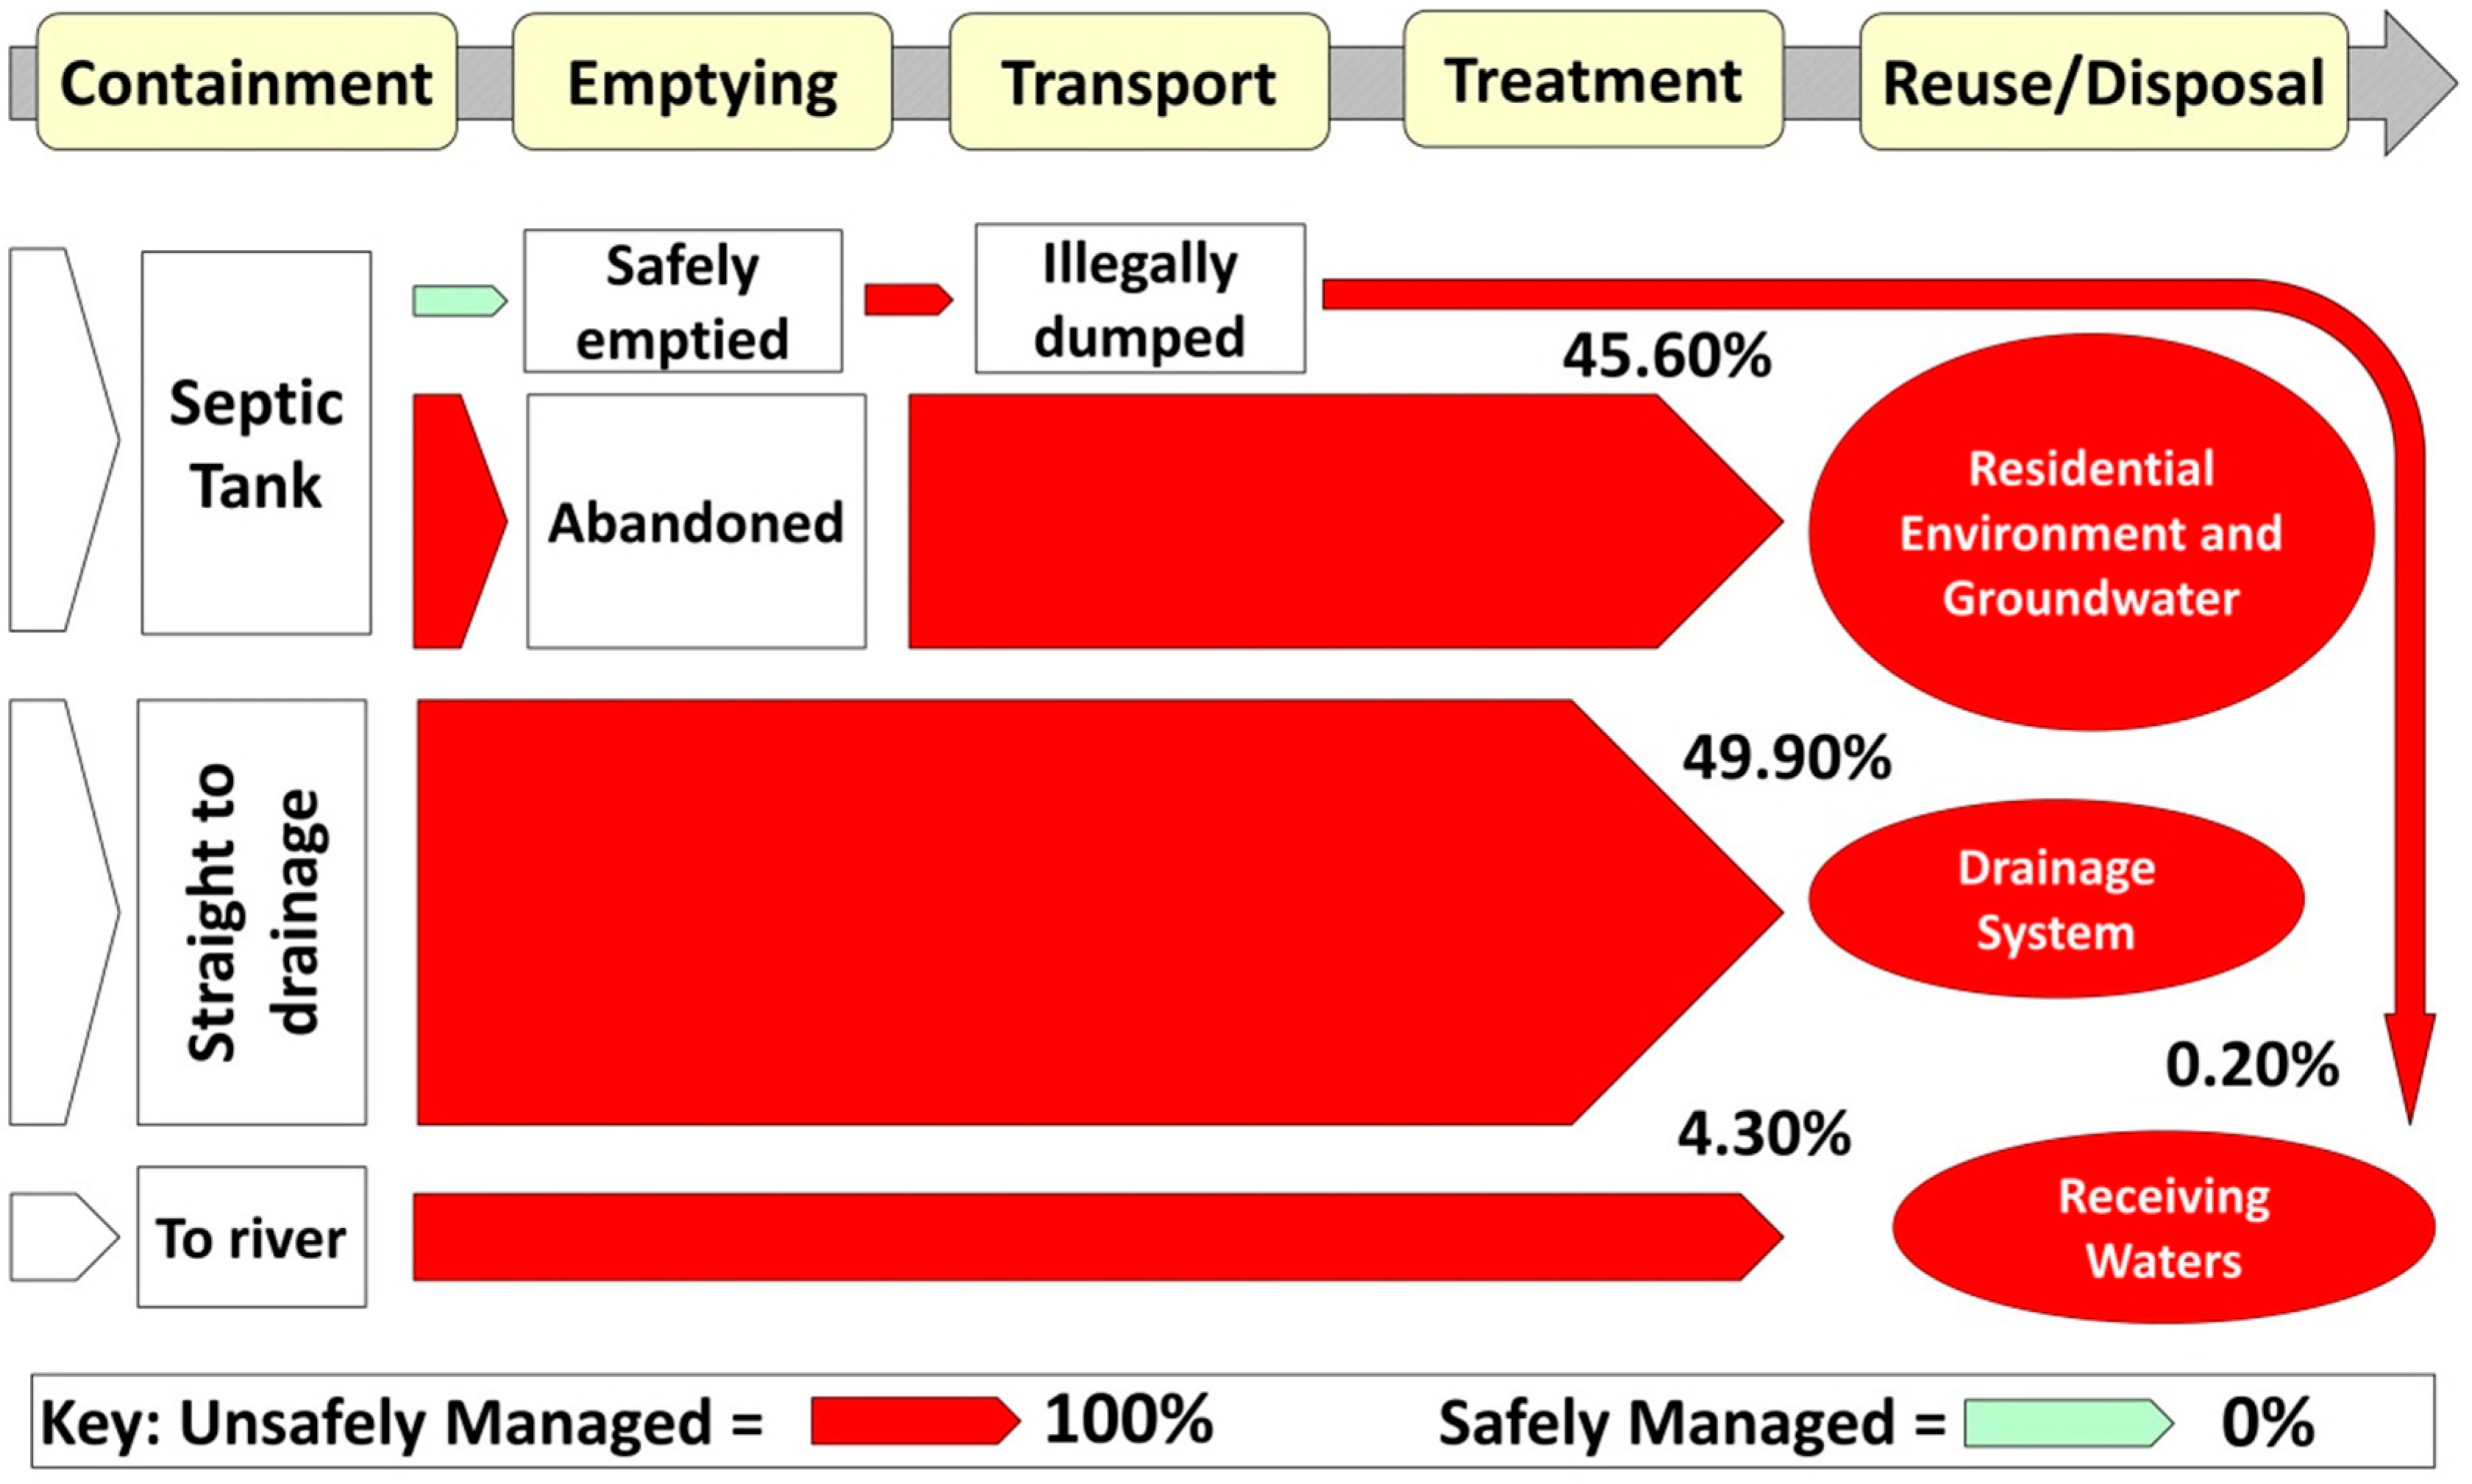
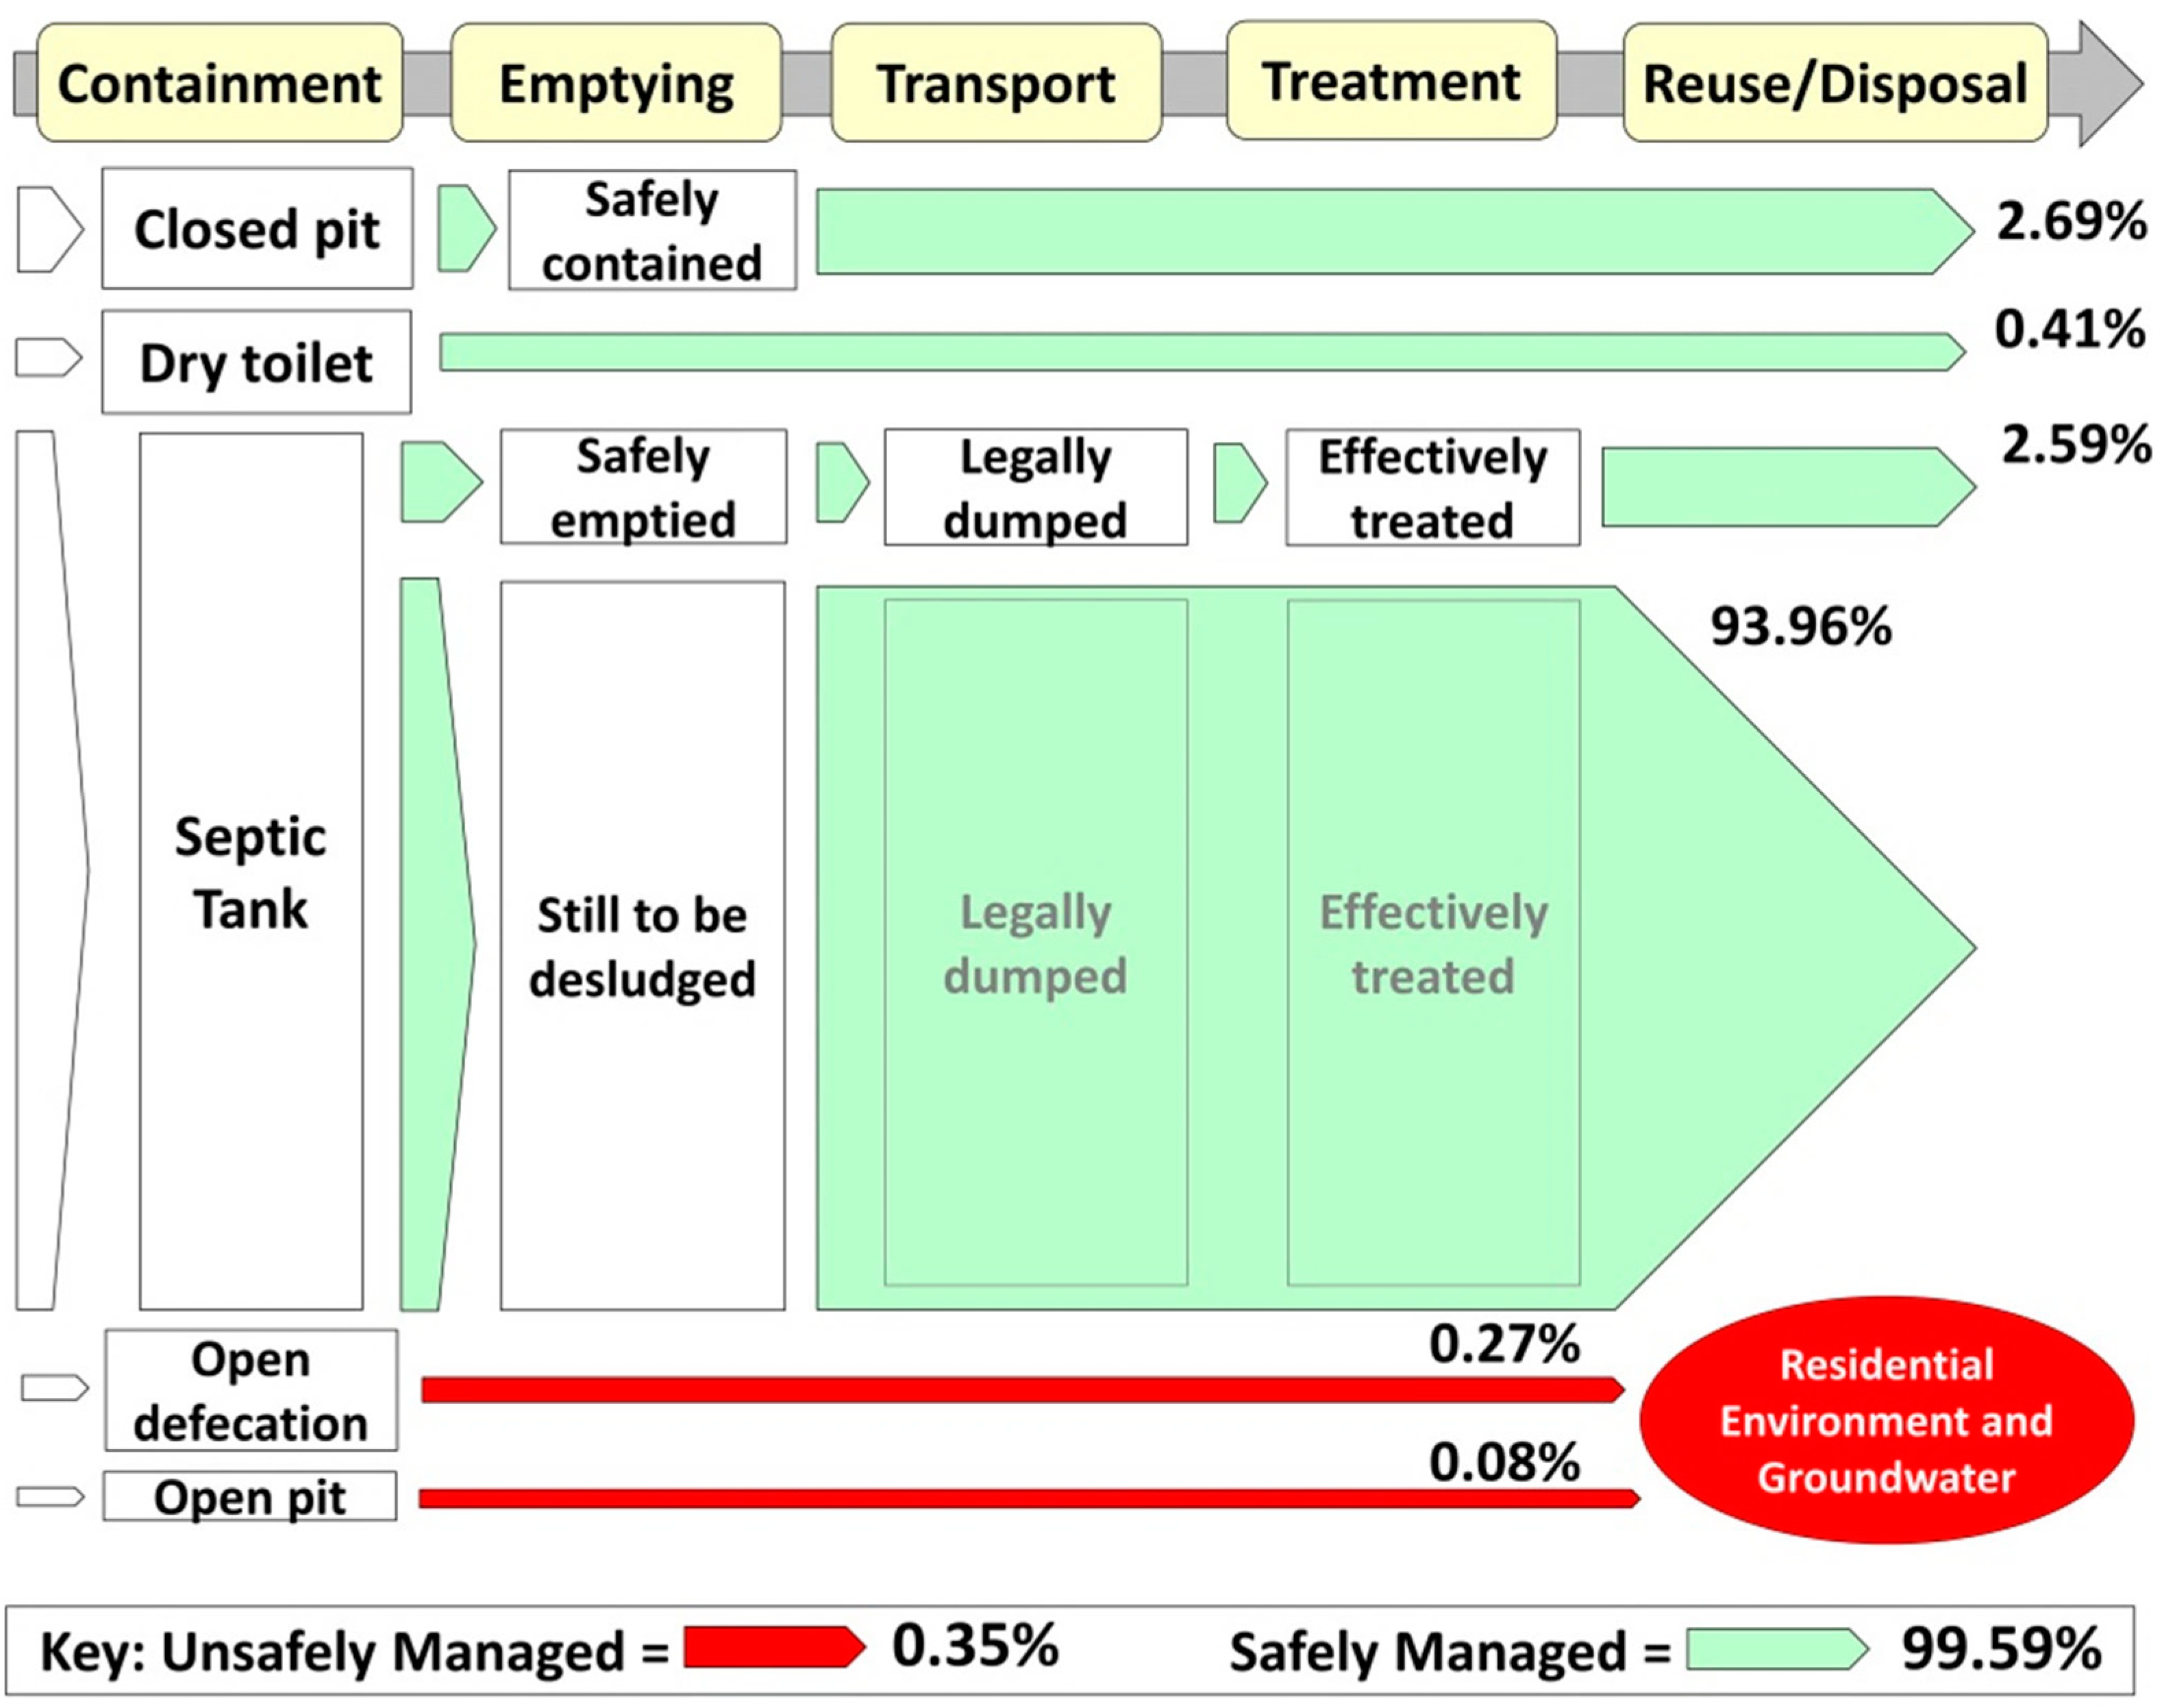
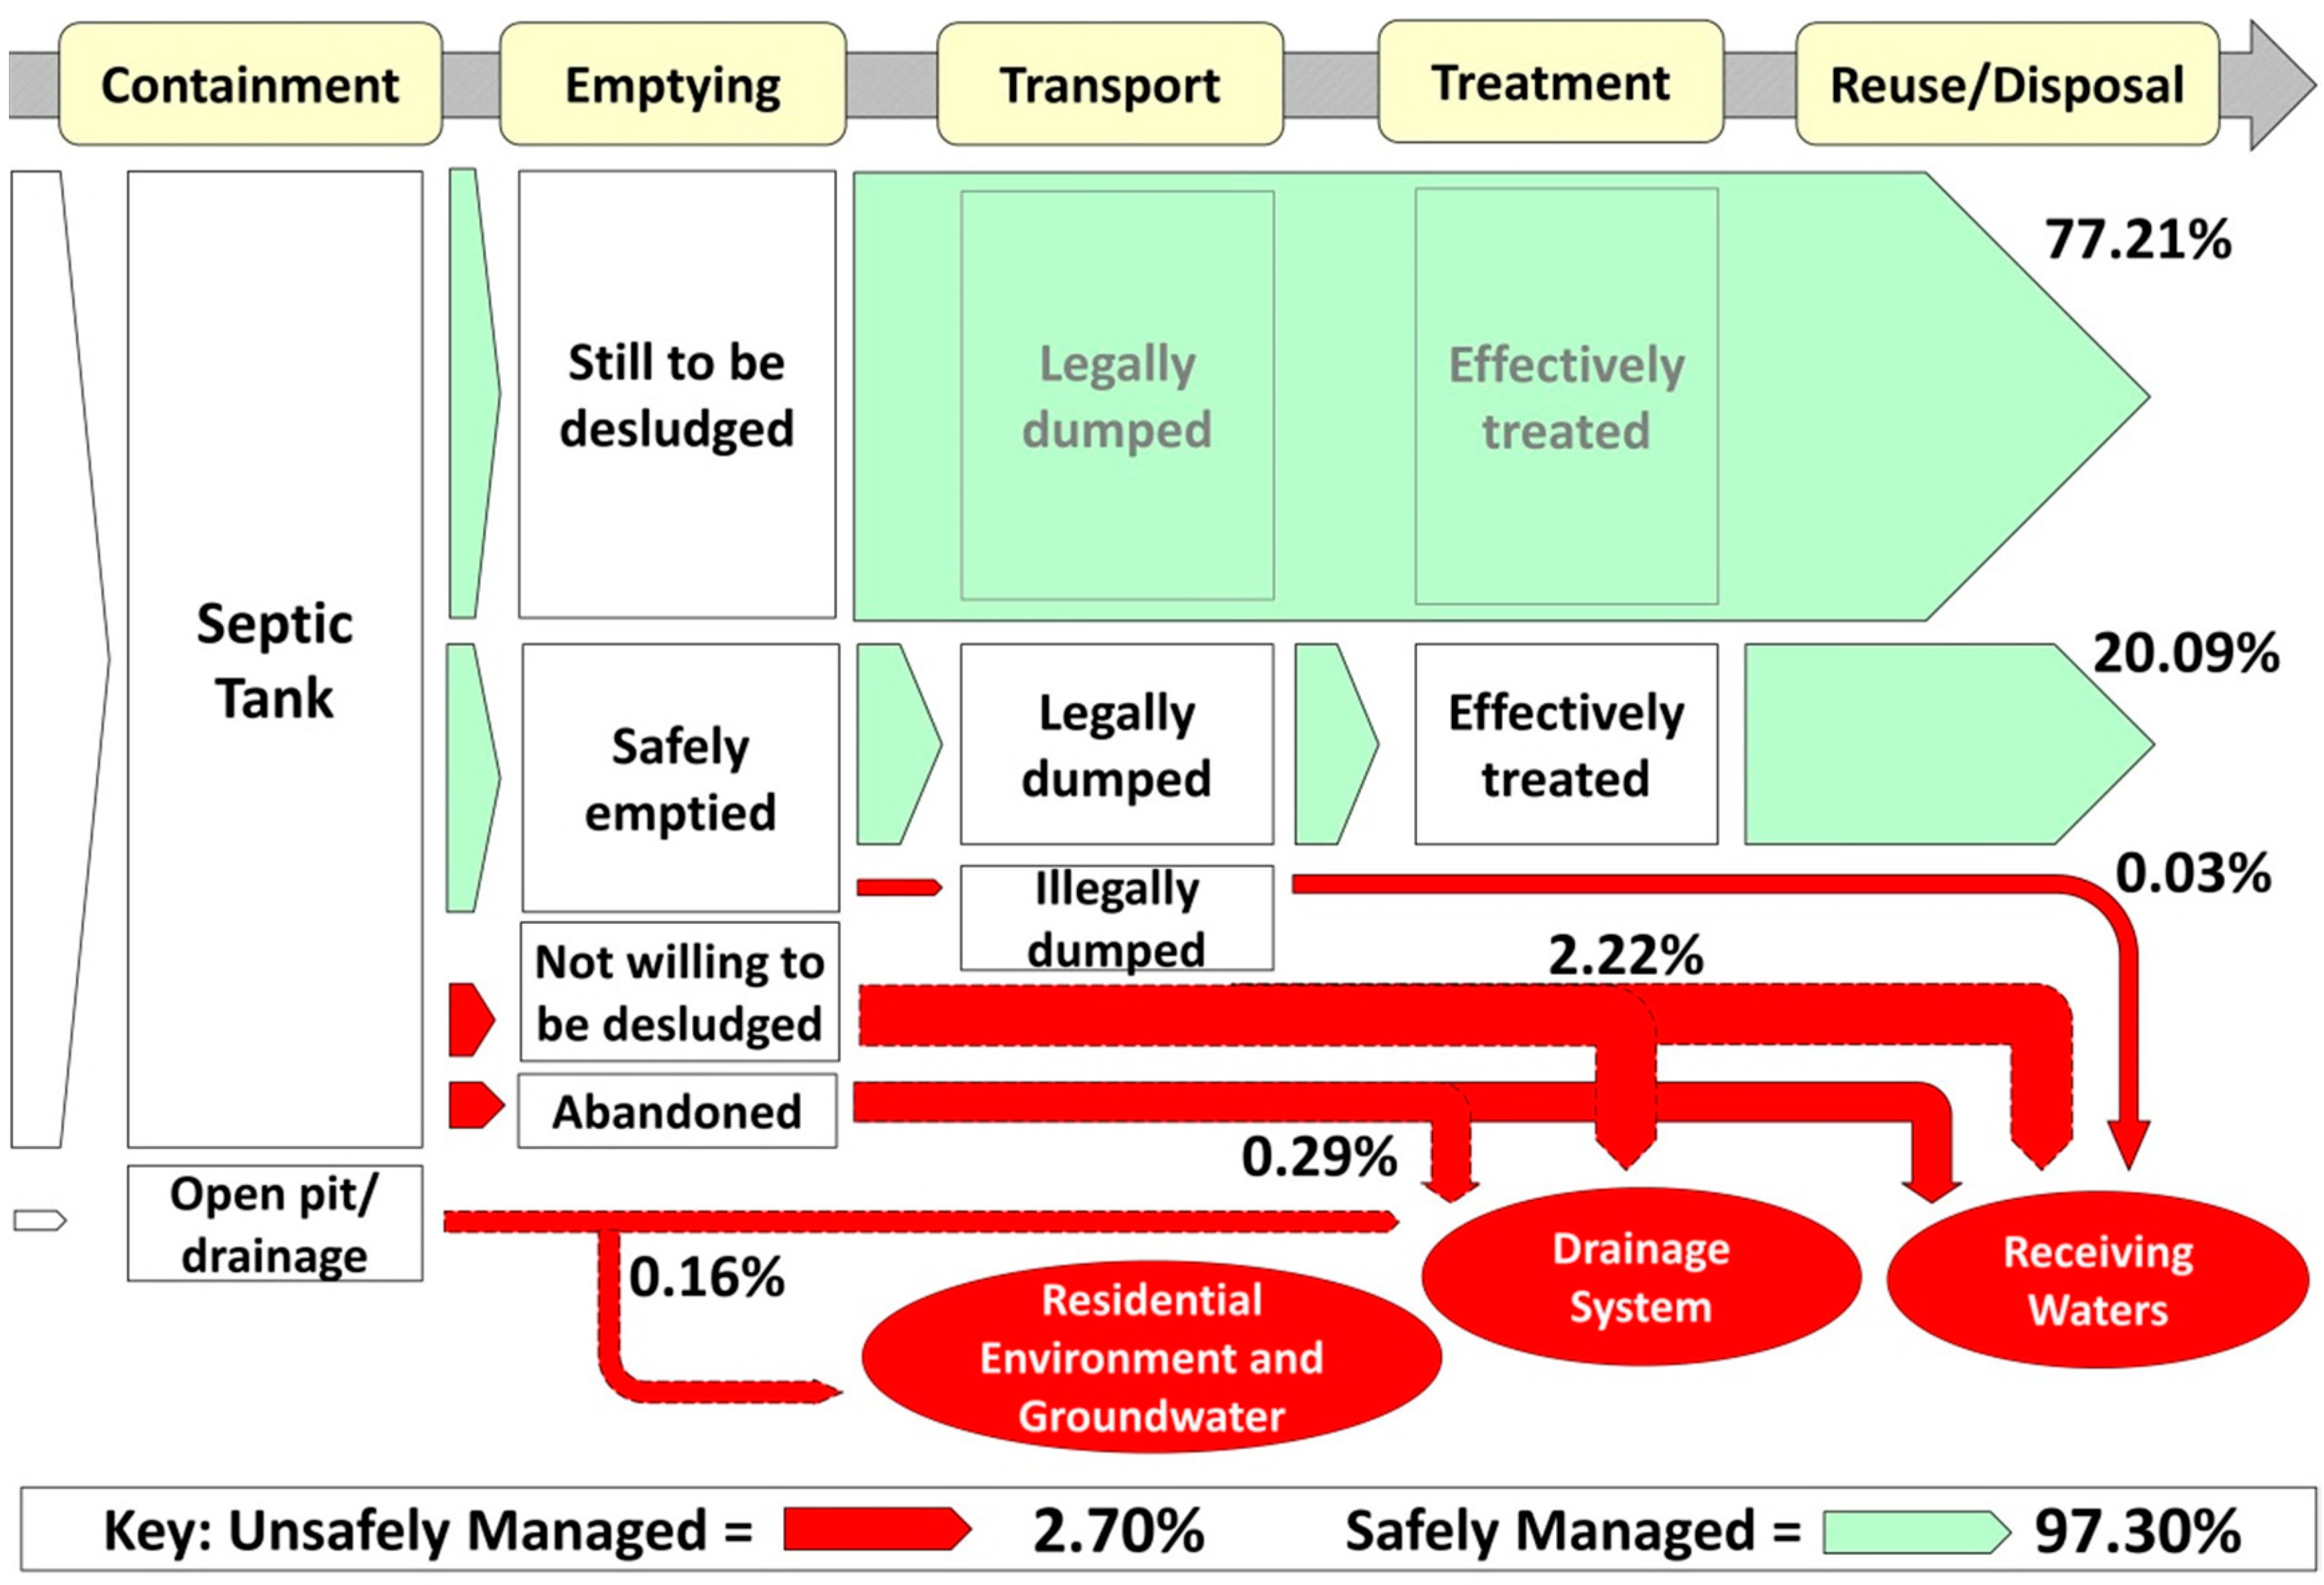
13]. This research hopes to provide insights on the usefulness and limitations of adapted versions of two World Bank Water and Sanitation Program (WSP) tools, Fecal Waste Flow Diagram and Service Delivery Scorecard, developed by Peal et al. in 2014 [
14] to assess septage management specifically. The Fecal Waste Flow Diagram is now named Shit Flow Diagram by a promotion initiative managed by Deutsche Gesellschaft für Internationale Zusammenarbeit (GIZ) under the umbrella of the Sustainable Sanitation Alliance (SuSanA) [
15].
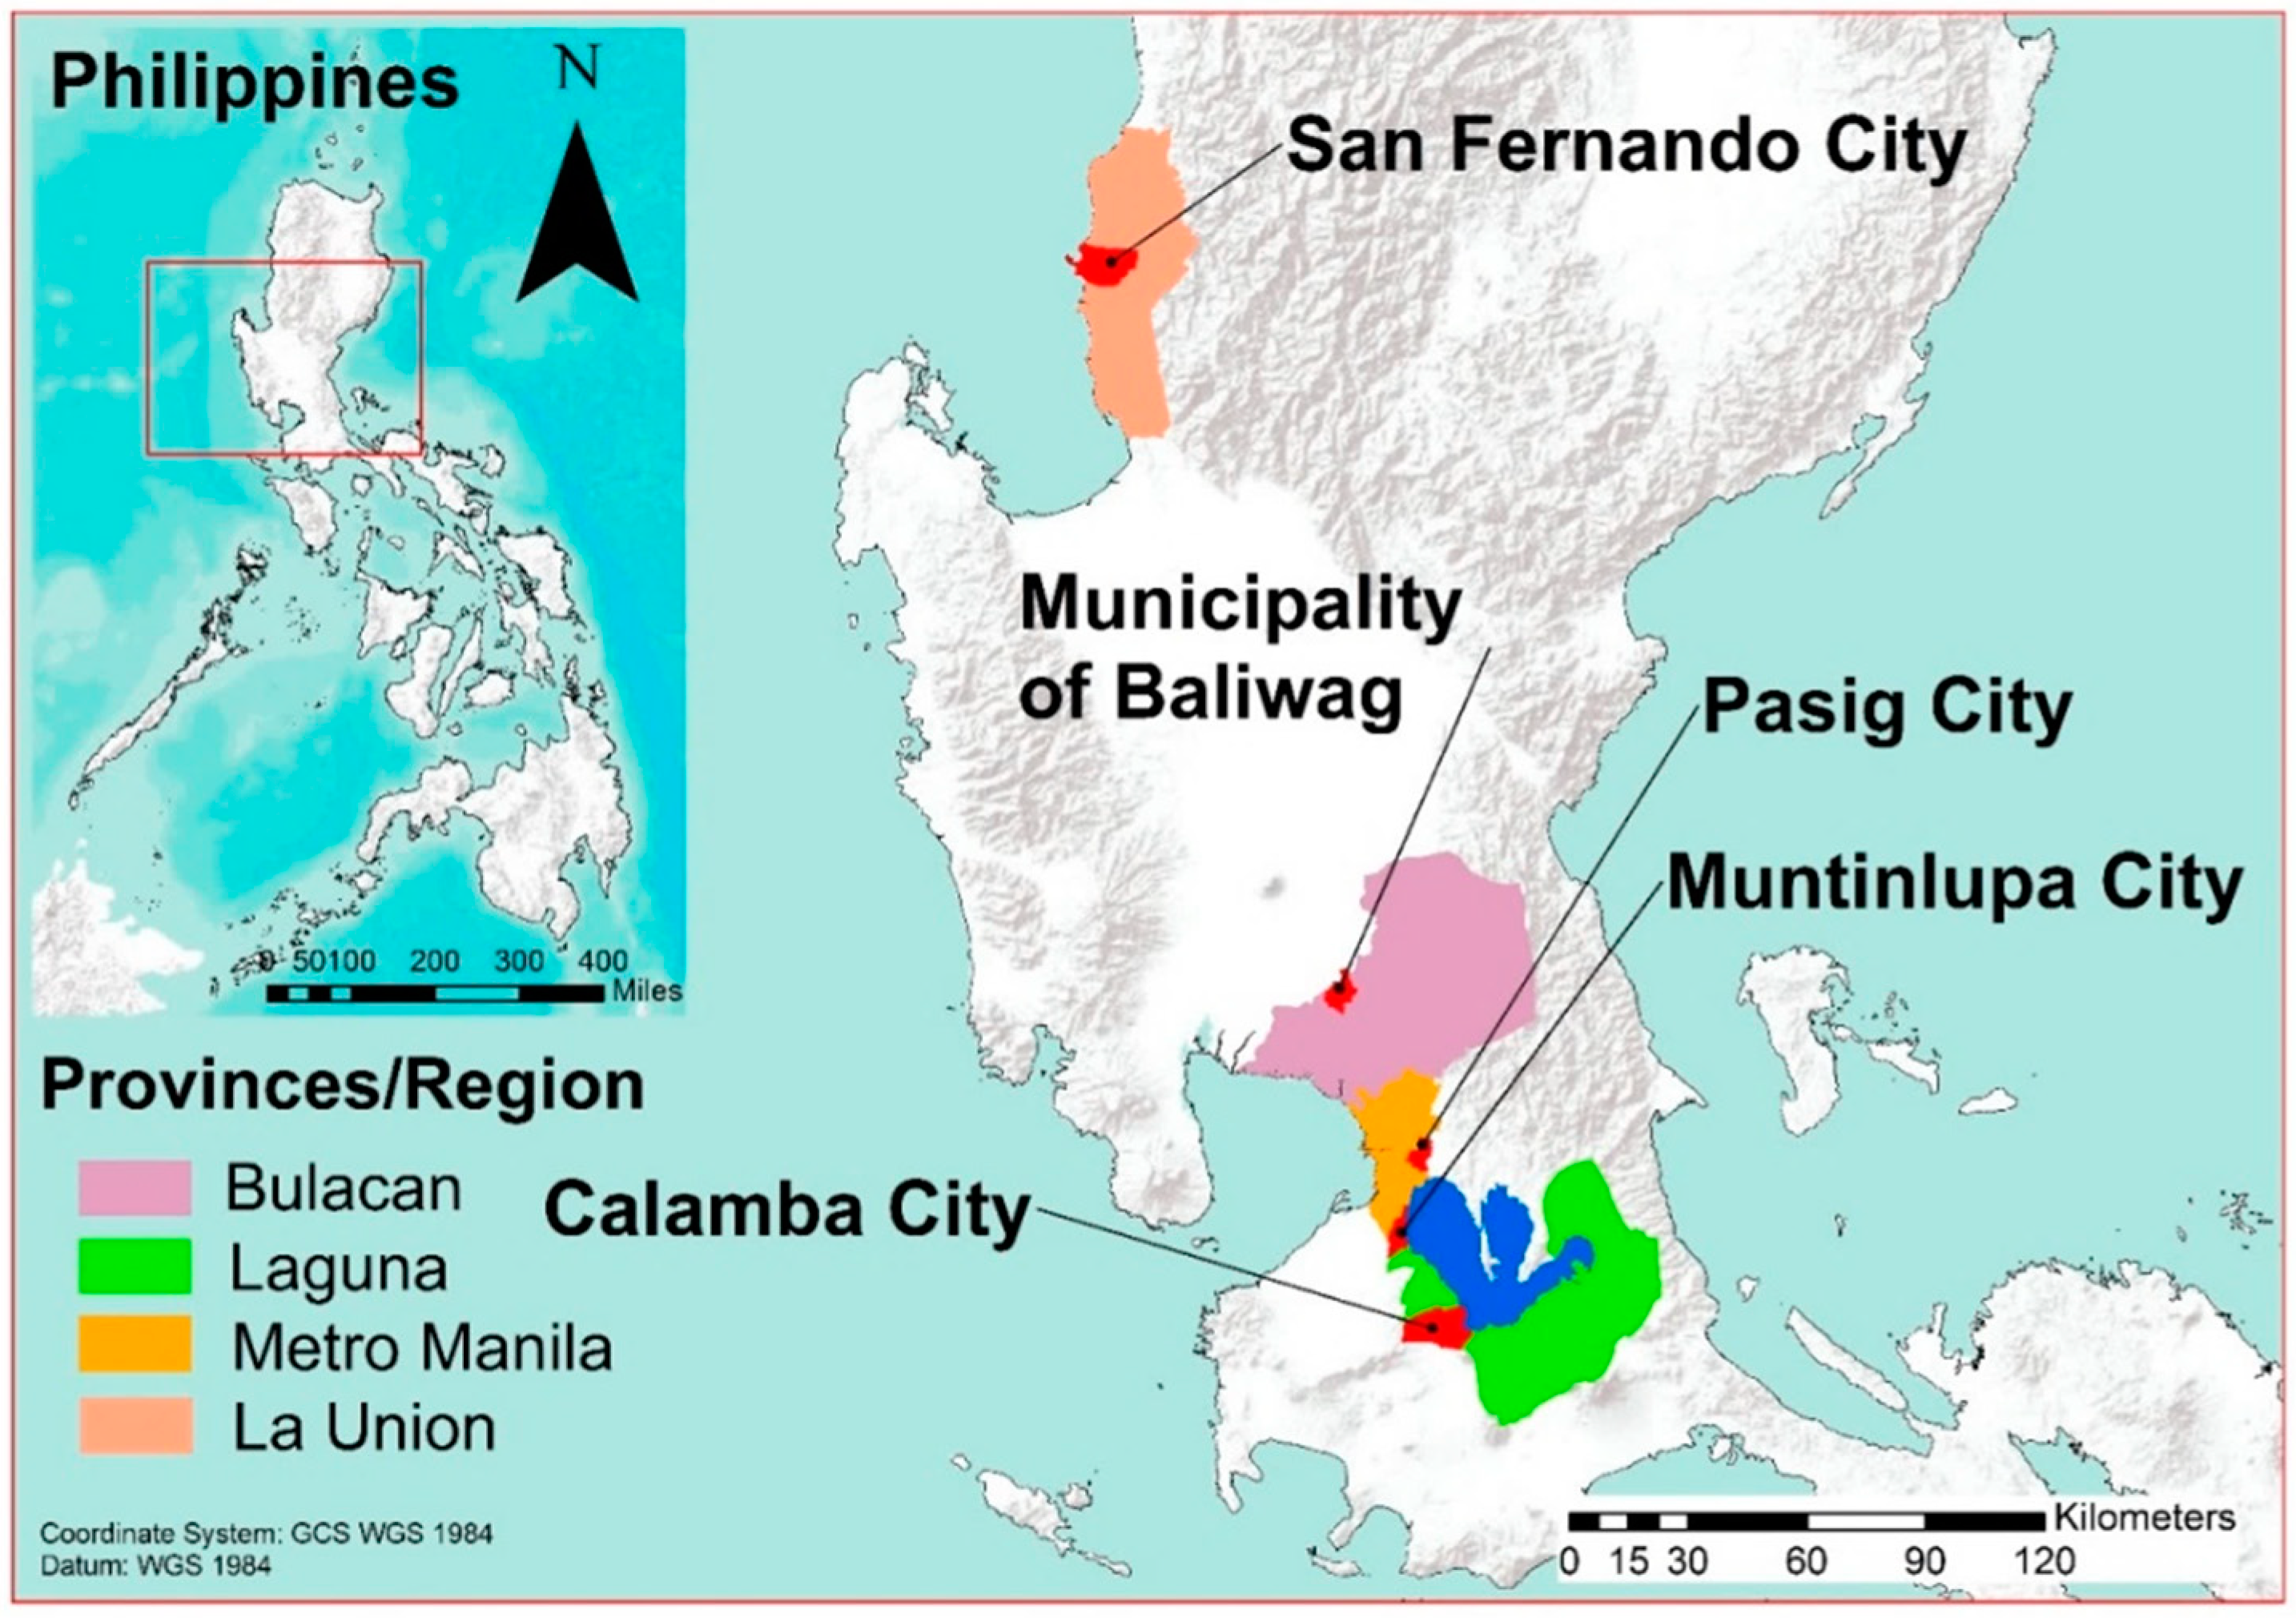
This study aimed to (1) assess and compare existing septage management systems in the municipality of Baliwag, Bulacan and the cities of Calamba, Muntinlupa, Pasig, and San Fernando; (2) determine the configuration of factors leading to the success or failure of the septage management systems; and (3) propose interventions for improving the septage management systems.
4. Conclusions
Among the five areas, San Fernando can be considered to have the most efficient septage management system as it had the highest percentage of safely managed fecal waste (99.65%) and high scores in the scorecards. It might have been an advantage that the whole system is being managed by the city itself—from implementing rules for septic tank plans to the collection, treatment, and disposal of septage. This completely eliminates possible institutional conflicts and makes system monitoring centralized for efficiency. Comparing the two cities in Metropolitan Manila (Muntinlupa and Pasig), managed by the two concessionaires of MWSS, it can be said that MWCI is more successful than MWSI. It is reasonable since MWSI just started its desludging service in 2009 [
31]. There might be a need for these two concessionaires to align sector targets and interventions to achieve a wider coverage of septage management services. Baliwag just needs to continue investing in the expansion of the service since it already has a progressing system. On the other hand, Calamba City already has enabling policies for the system; thus, it should start driving investments to the development of the service.
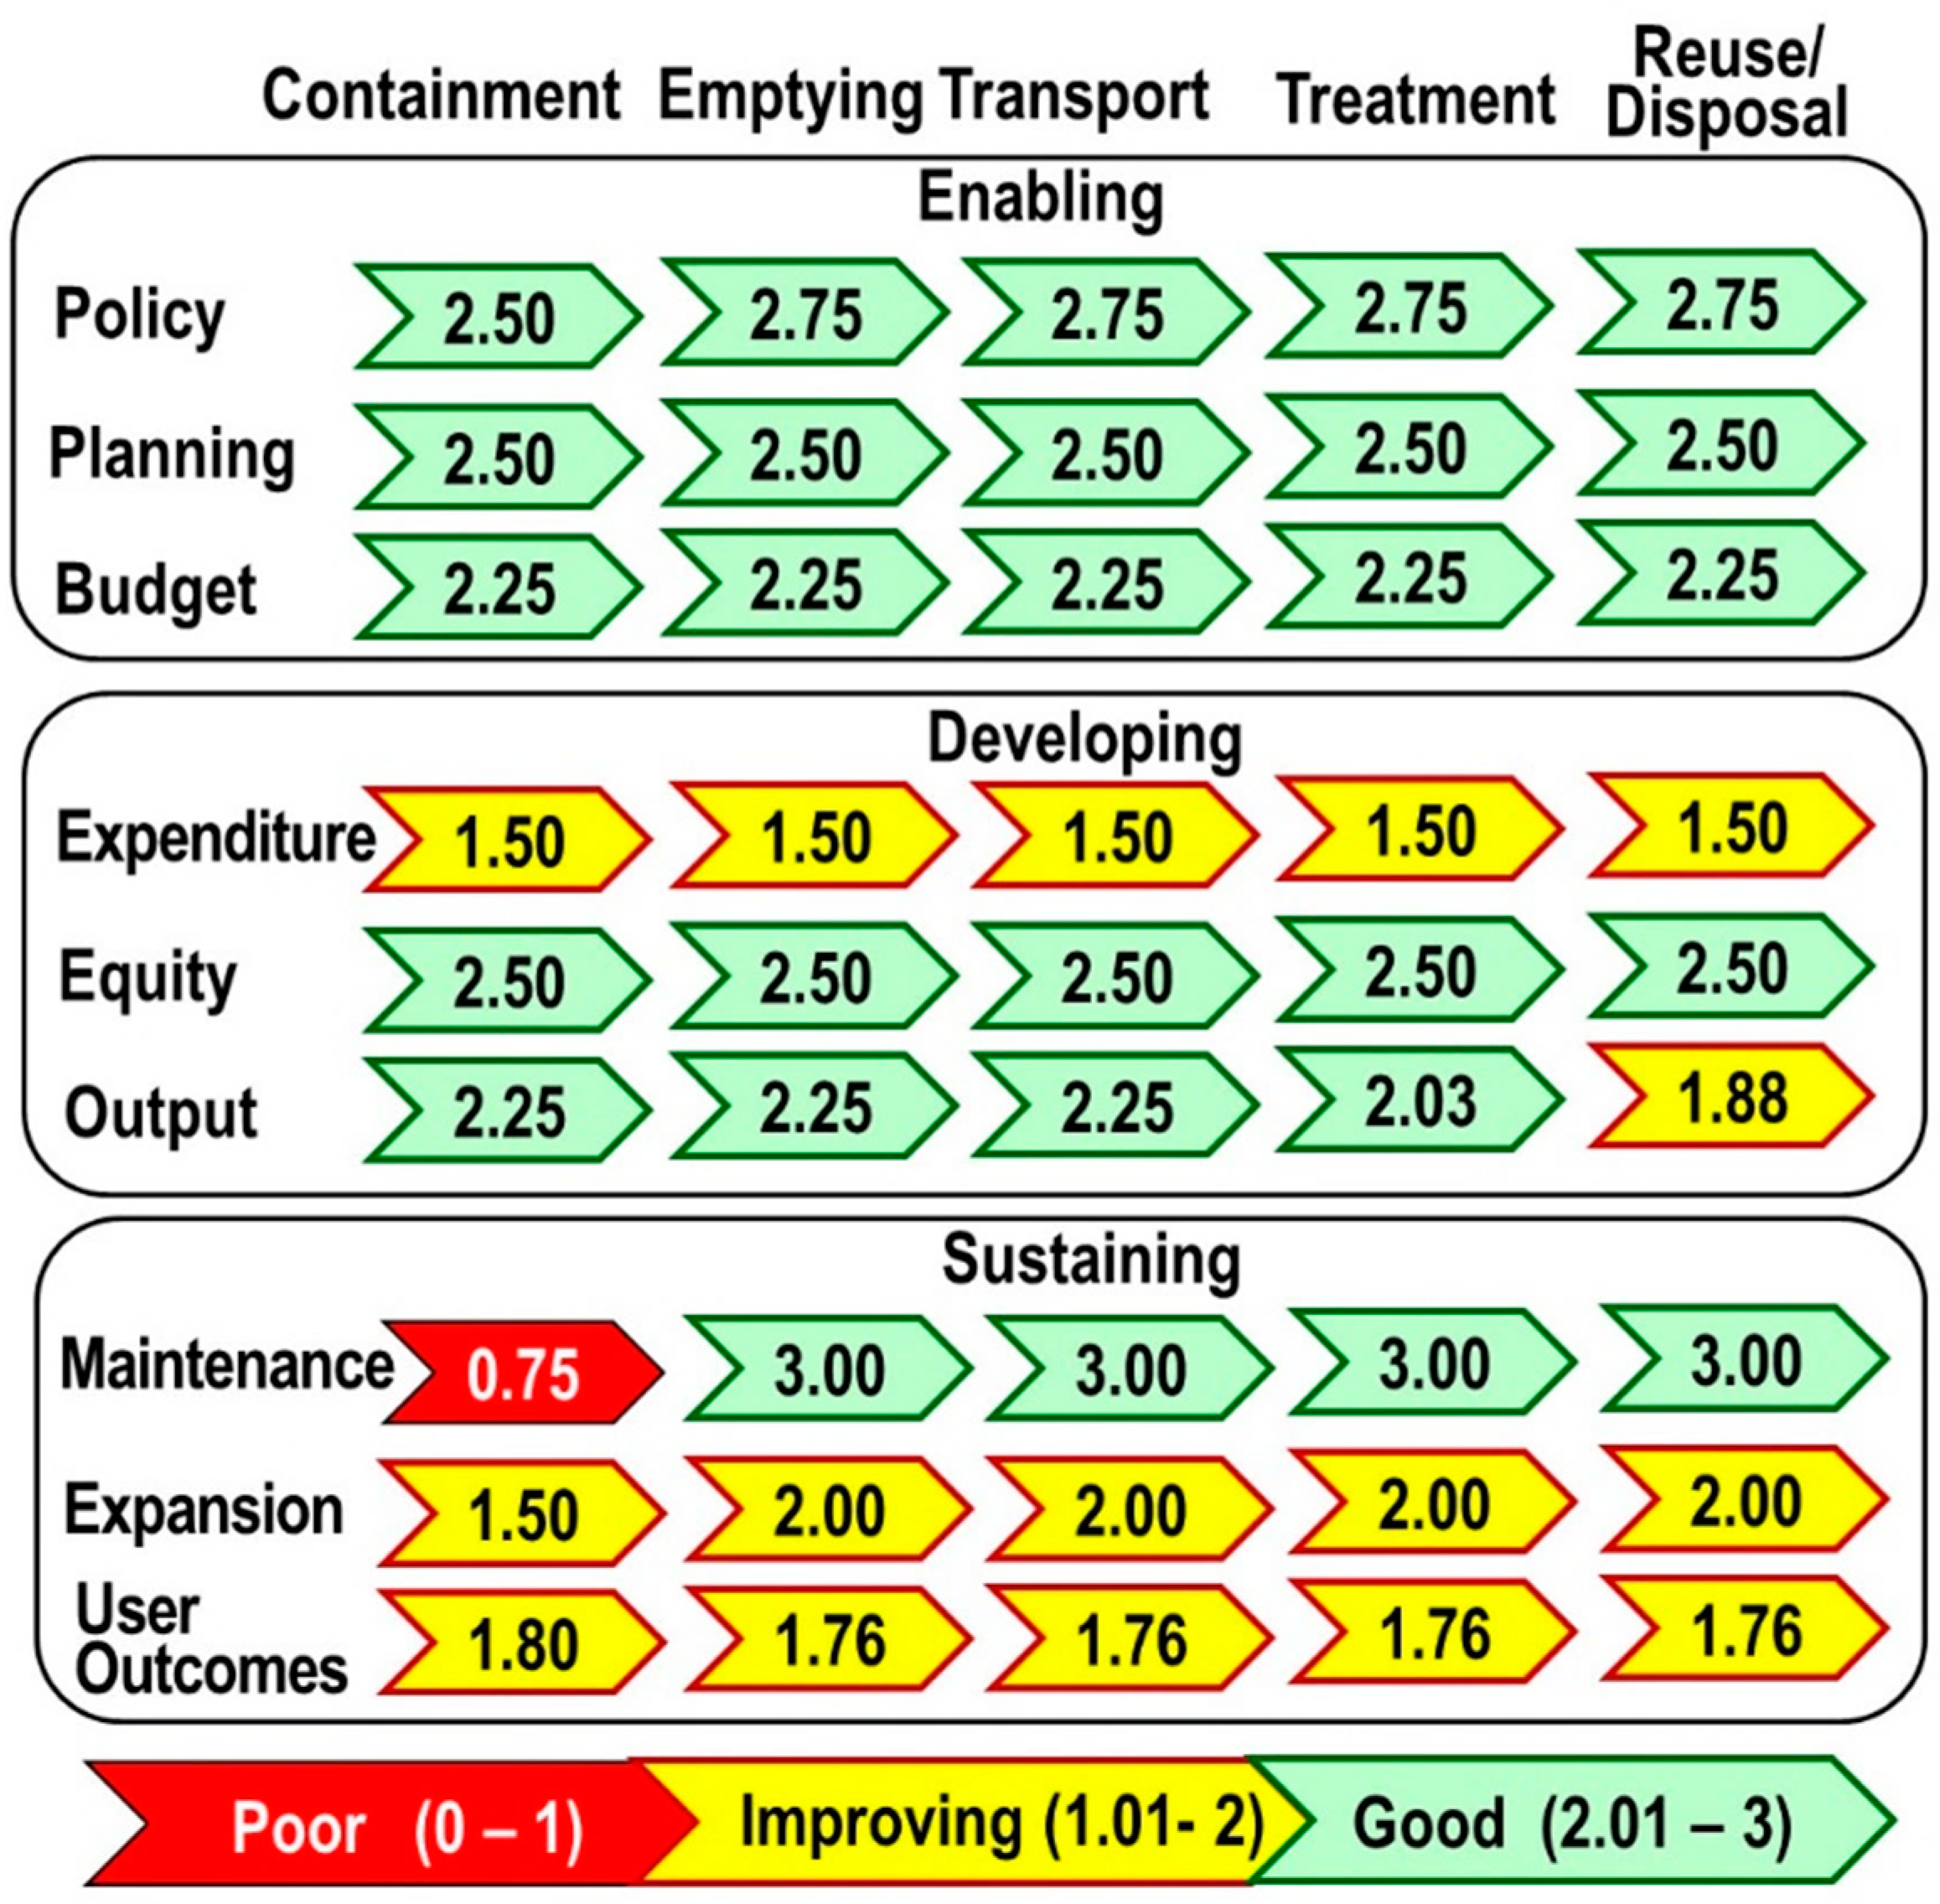
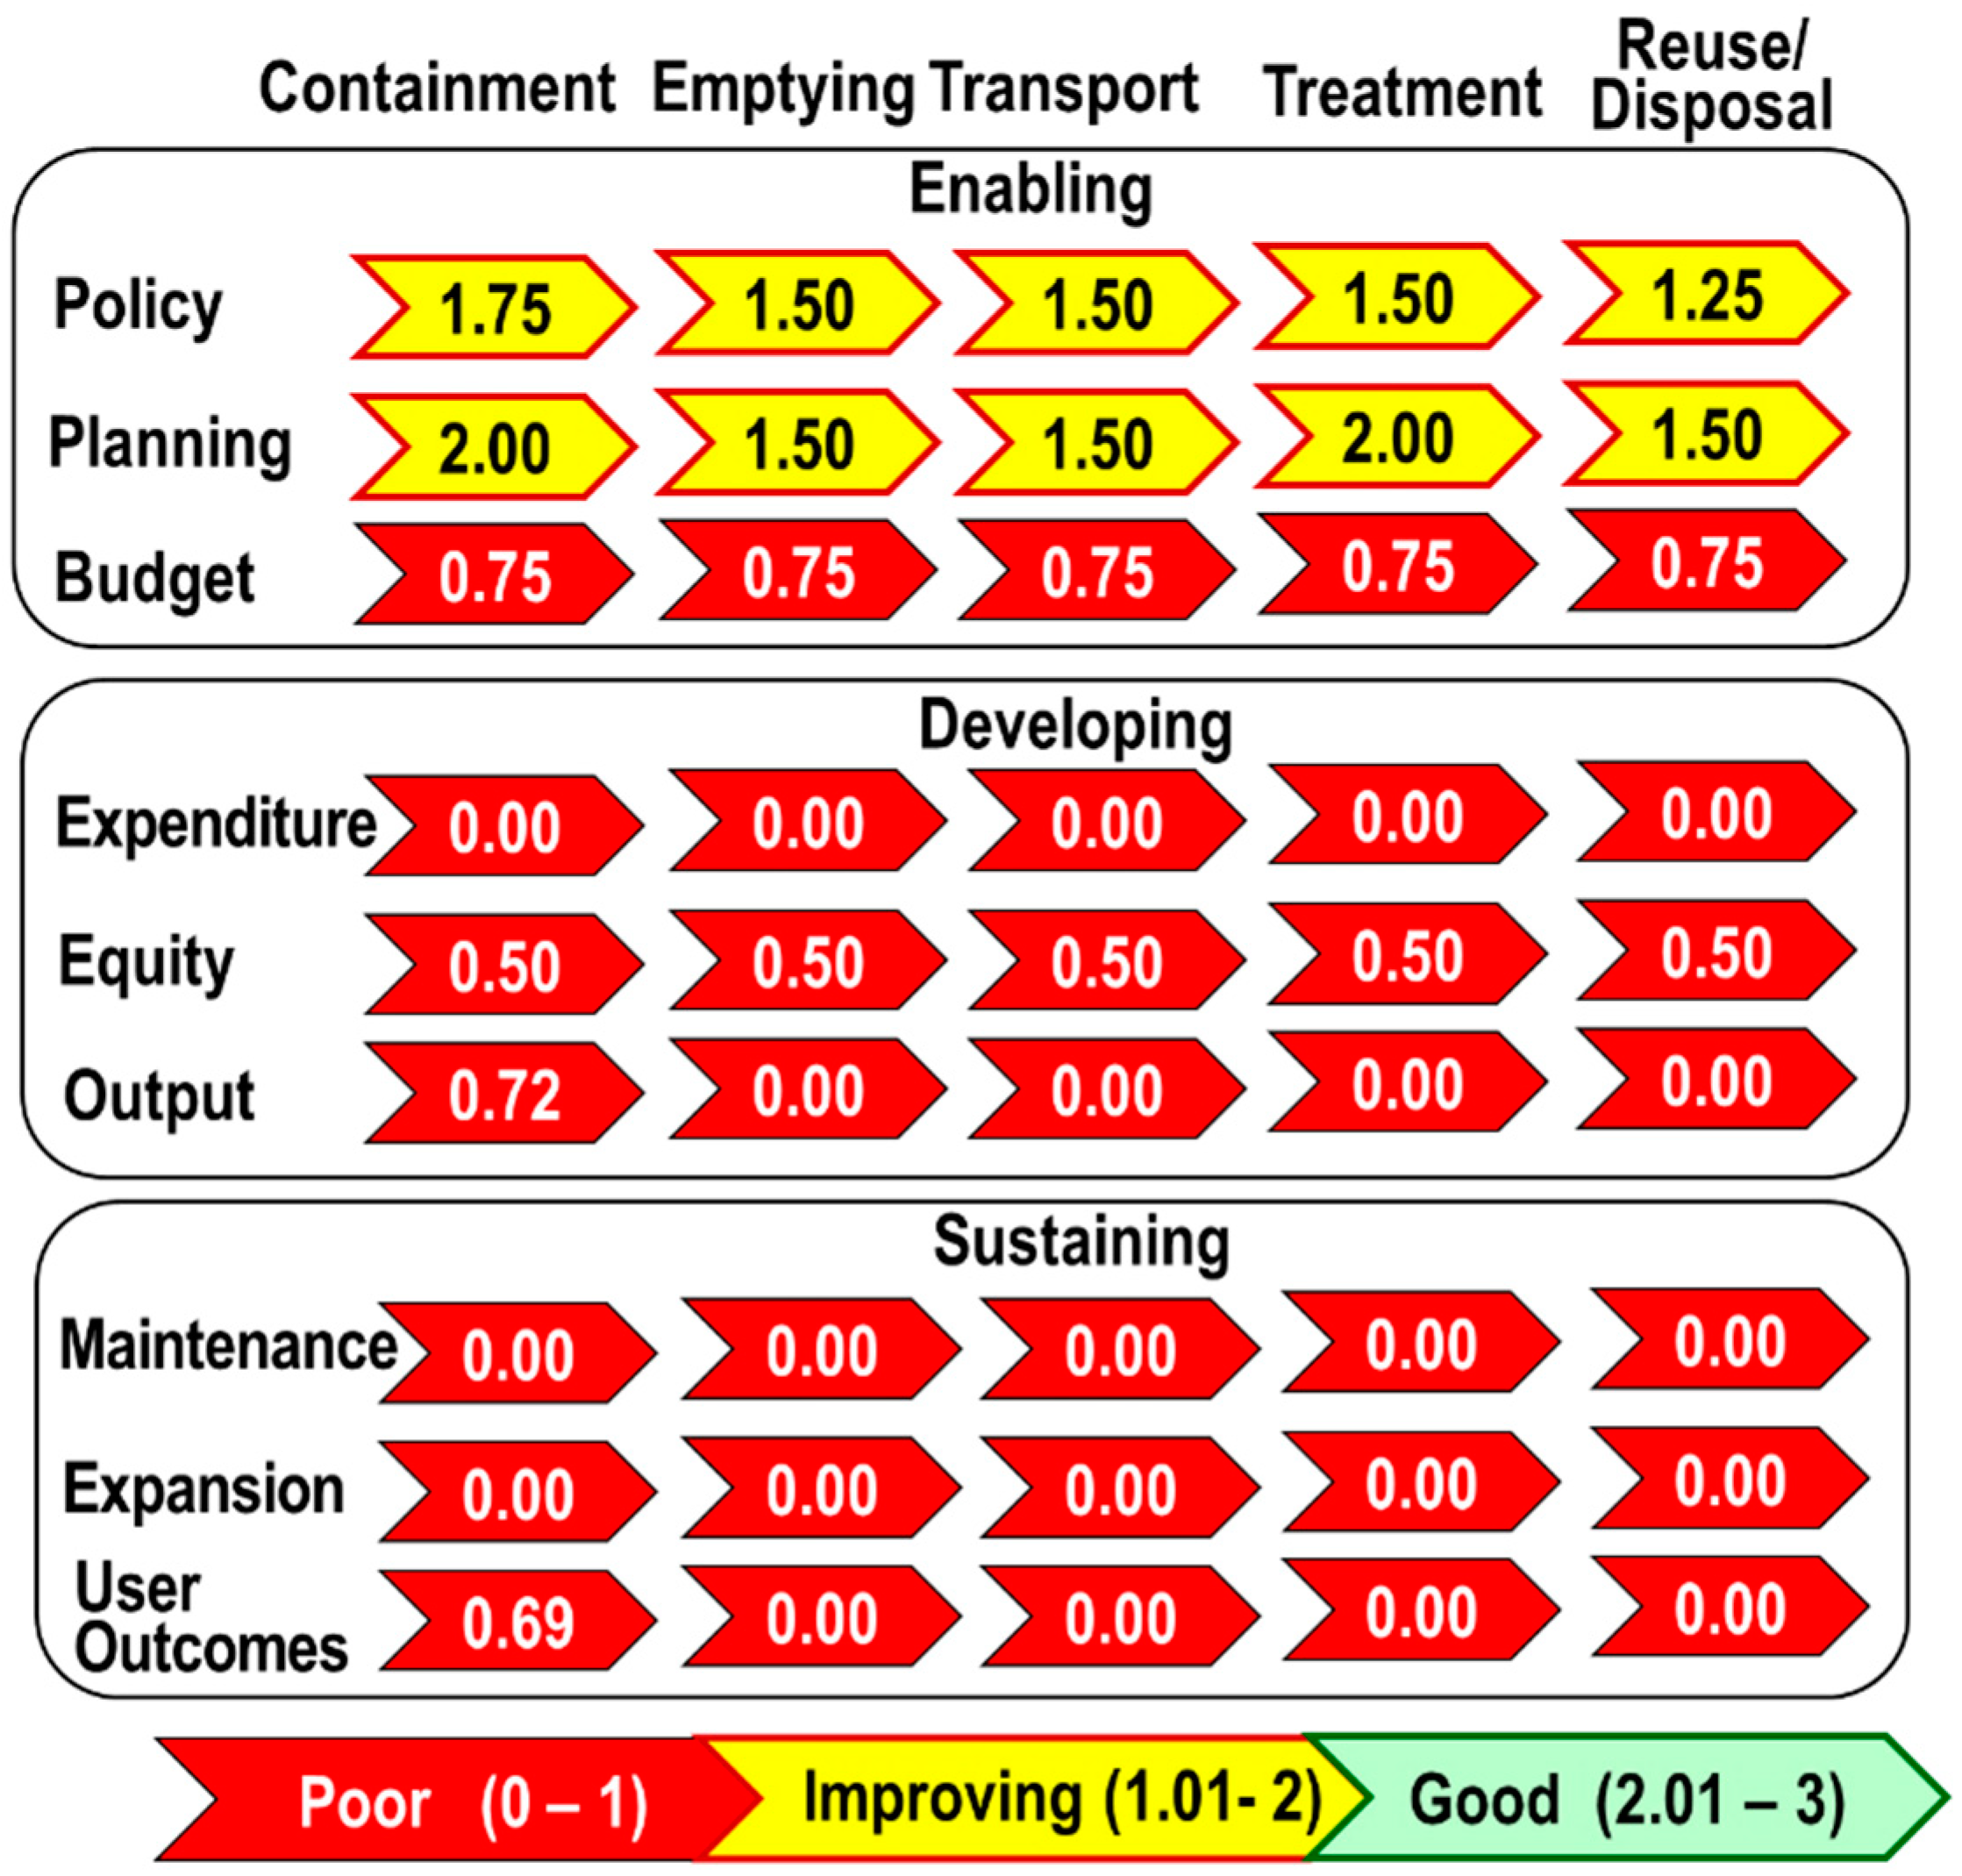
This study demonstrates that the fecal waste flow diagram and the service delivery scorecard can be effective tools to compare septage management in cities/municipalities. The two tools are complementary as the scorecard could give insights to why cities have a high or low percentage of safely managed fecal waste (based on the enabling and developing pillar scores). The fecal waste flow diagrams were effective in elucidating the overall flow of fecal waste. However, the precision of these diagrams would still depend on the available data from the city. Local government units should be encouraged to monitor toilet, septic tank, and desludging characteristics of HHs under their jurisdiction. The scorecards were also able to point out the strengths and weaknesses of the current septage management service delivery in each stage of the service chain. The score descriptions for the scorecard should be continually improved for more uniform assessments. More case studies could be done to explore the use of other indicators.

 ,
, 


