Effect of Martensitic Transformation and Grain Size on the Surface Roughening Behavior in SUS 304 and SUS 316 Thin Metal Foils


Abstract
1. Introduction
2. Materials and Research Methods
2.1. Materials
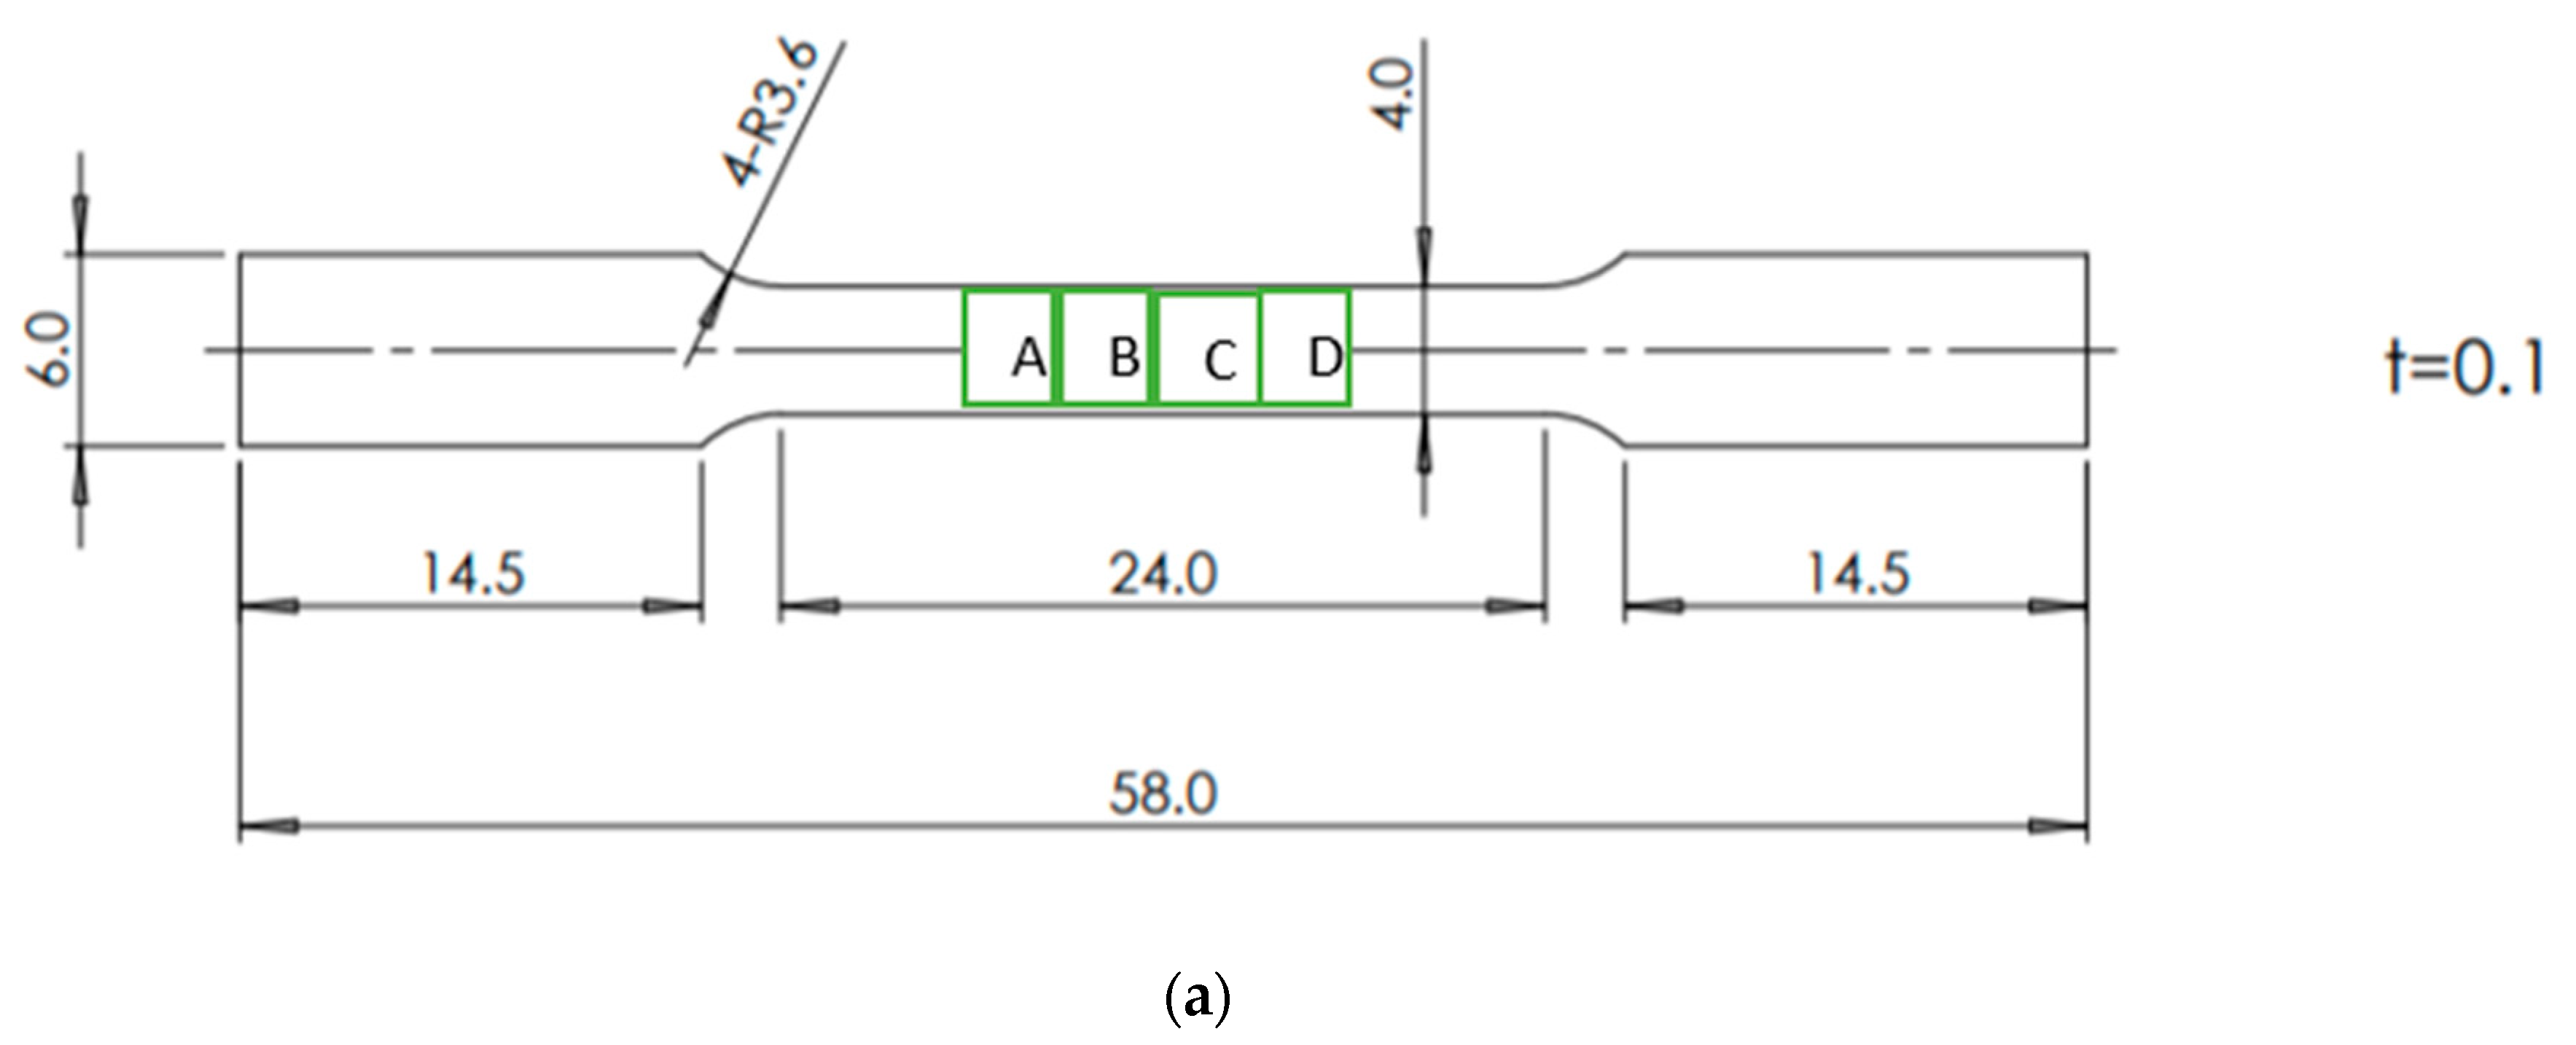
2.2. Method
3. Result and Discussion
3.1. Result
3.2. Discussion
4. Conclusions
- MPT only occurs in SUS 304 thin metal foils, both with a fine or coarse grain, because of the high chromium element, as the ferrite stabilizer, and the carbon element, as the martensite element. Chromium could become a carbide compound that increases the strength of a grain.
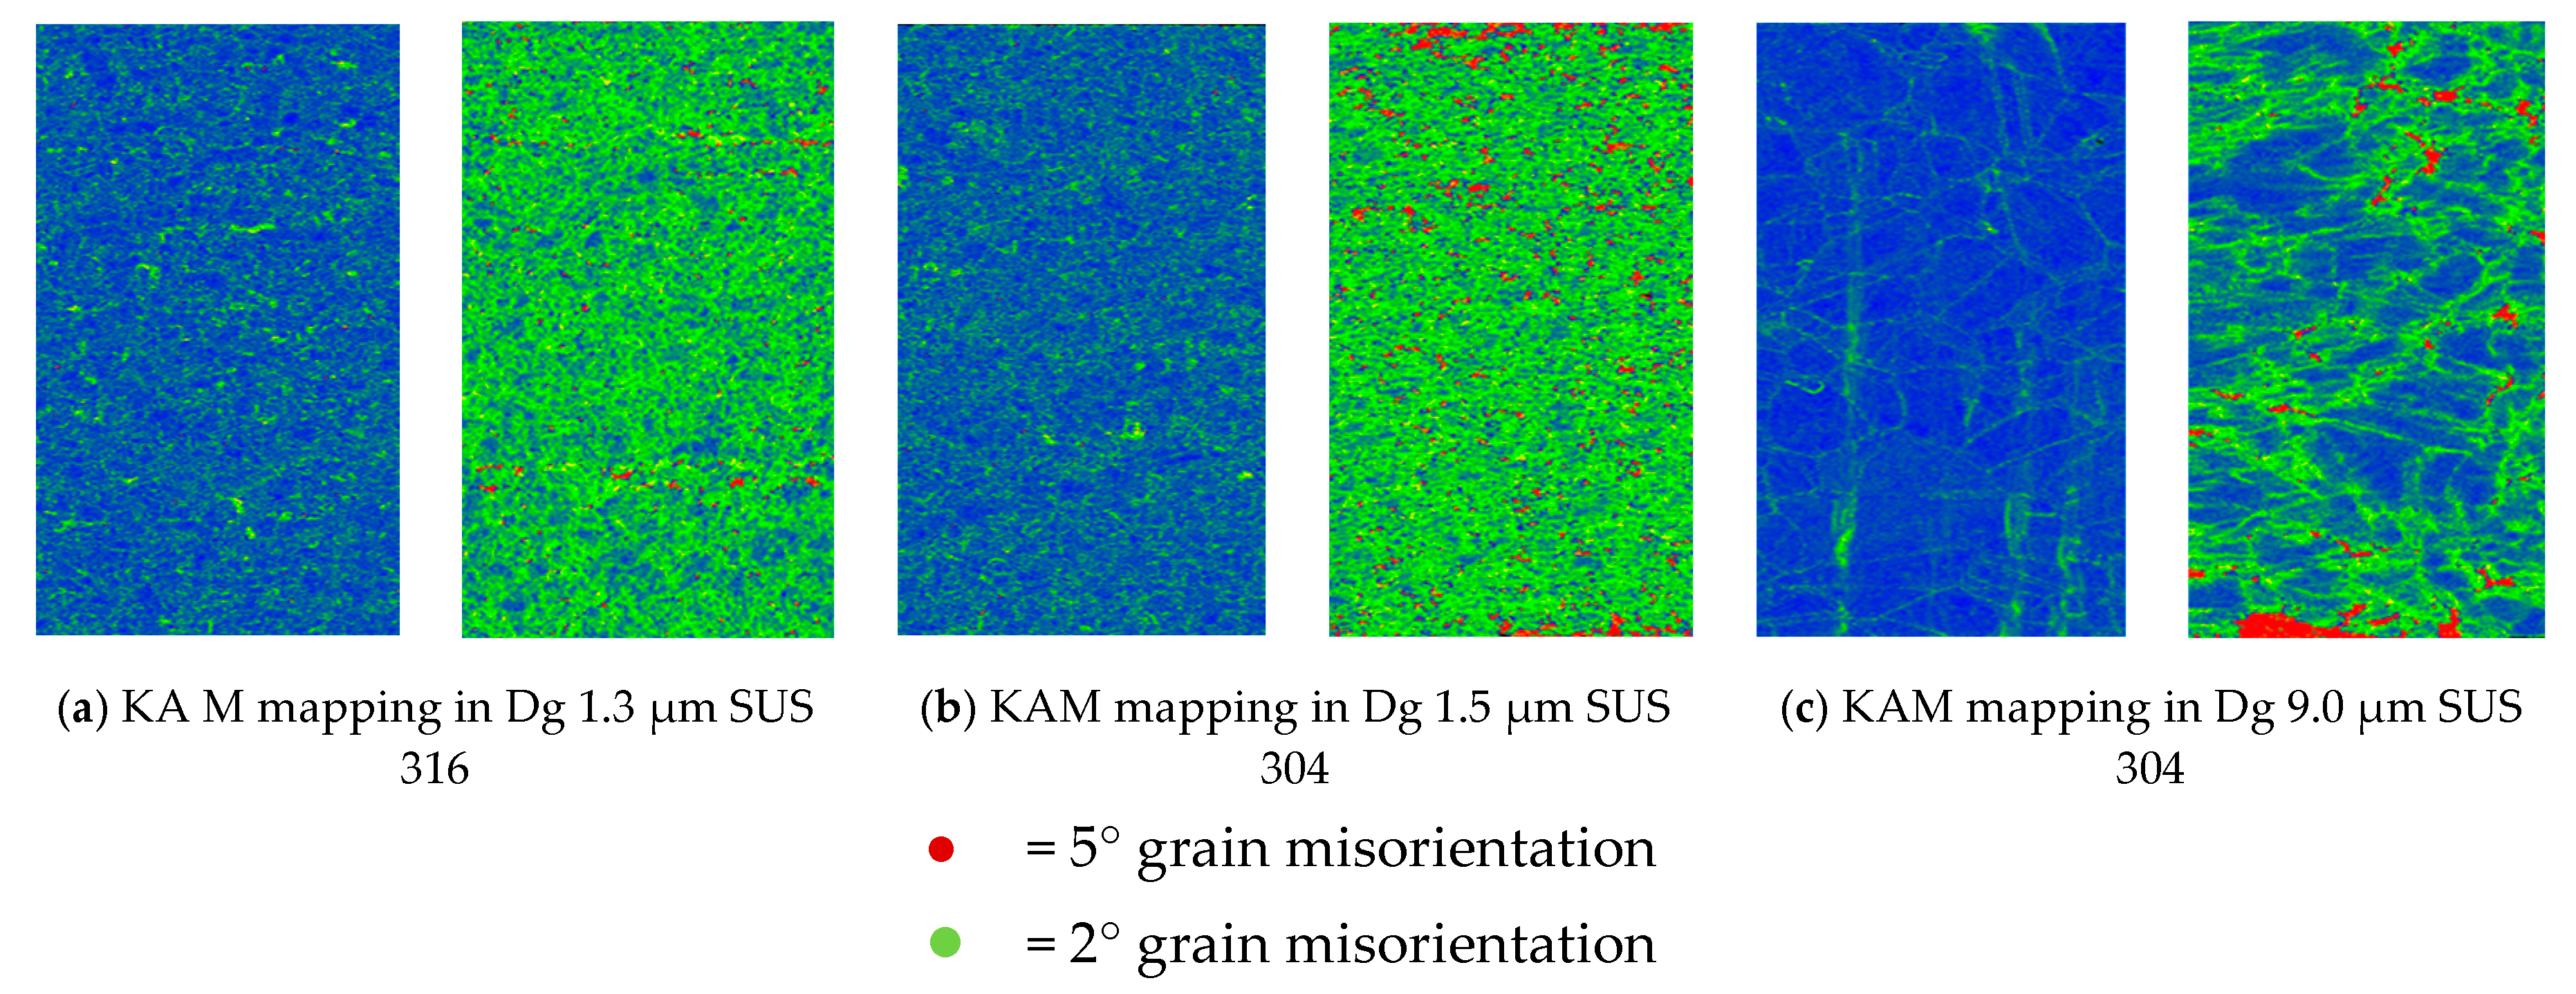
- MPT does not occur in SUS 316 up to a strain level of 1.0% because of the high nickel element, as an austenite stabilizer. It is very difficult to transform austenite into MPT at the same strain level. The local misorientation in SUS 316 thin metal foils is high. This indicates that the mechanical property of a grain is hard. The local misorientation in SUS 304 thin metal foils is very high. This indicates that the mechanical property of the grain in SUS 304 thin metal foils is very hard.
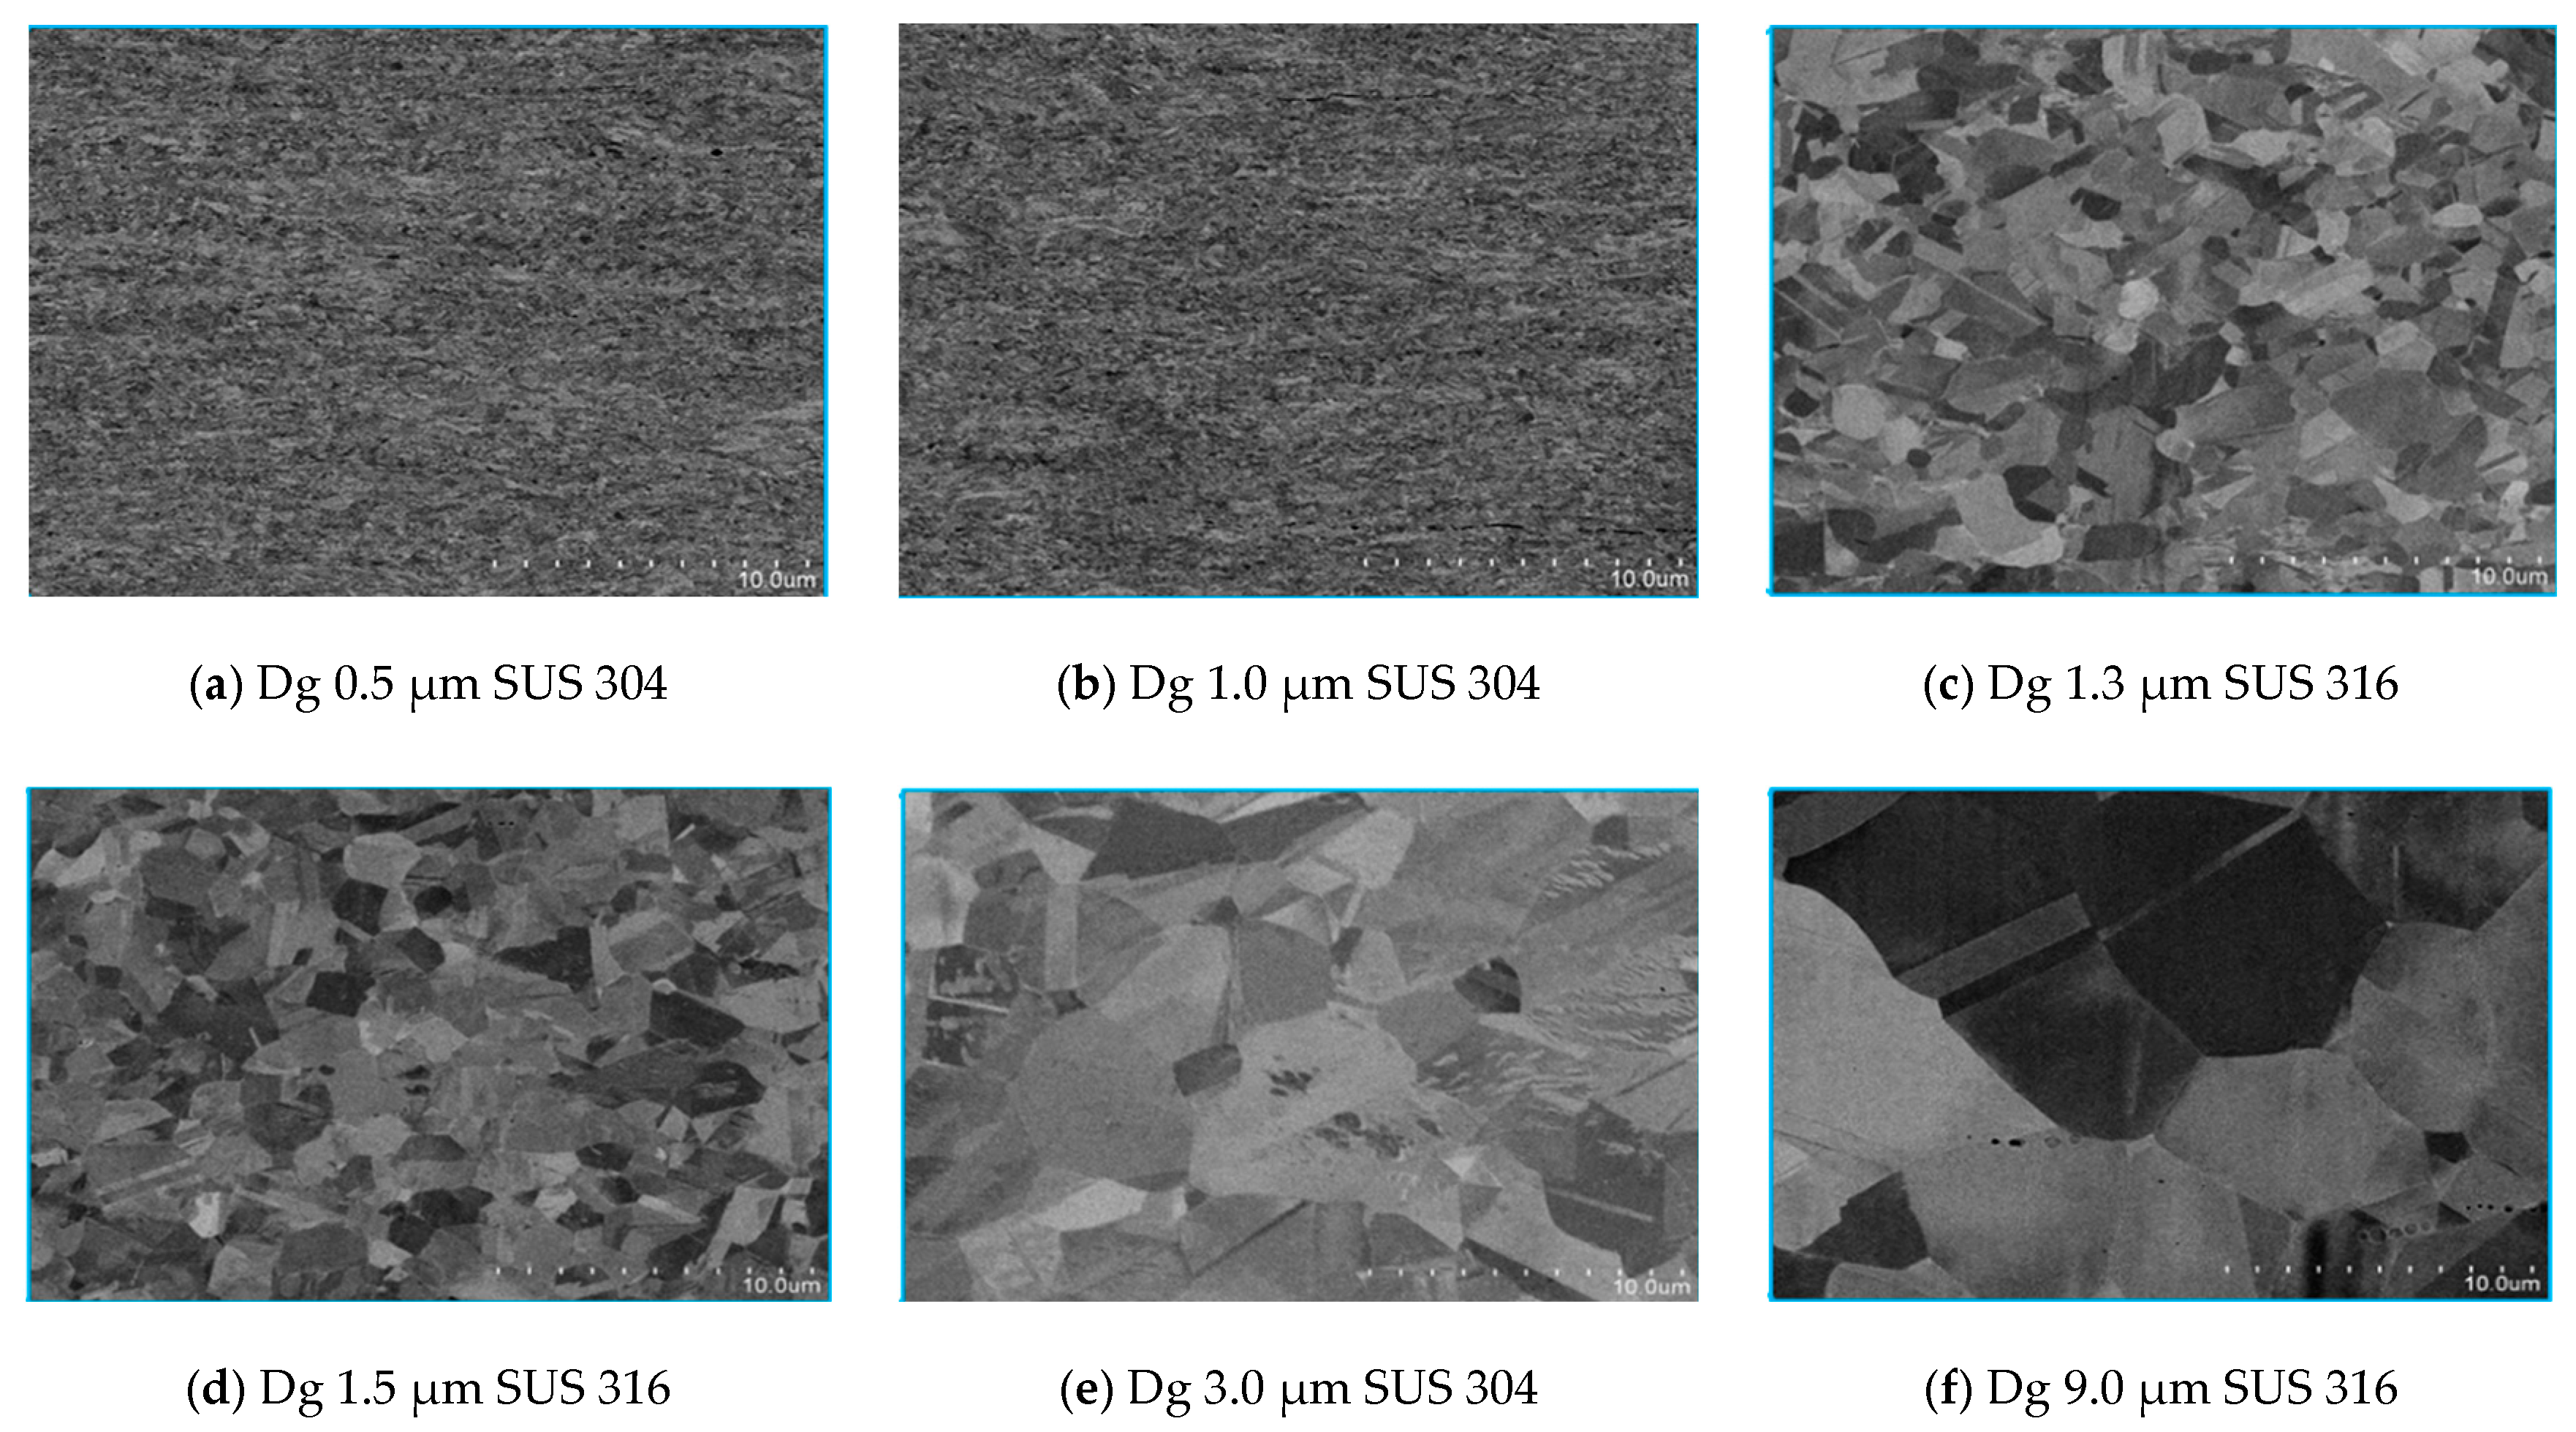
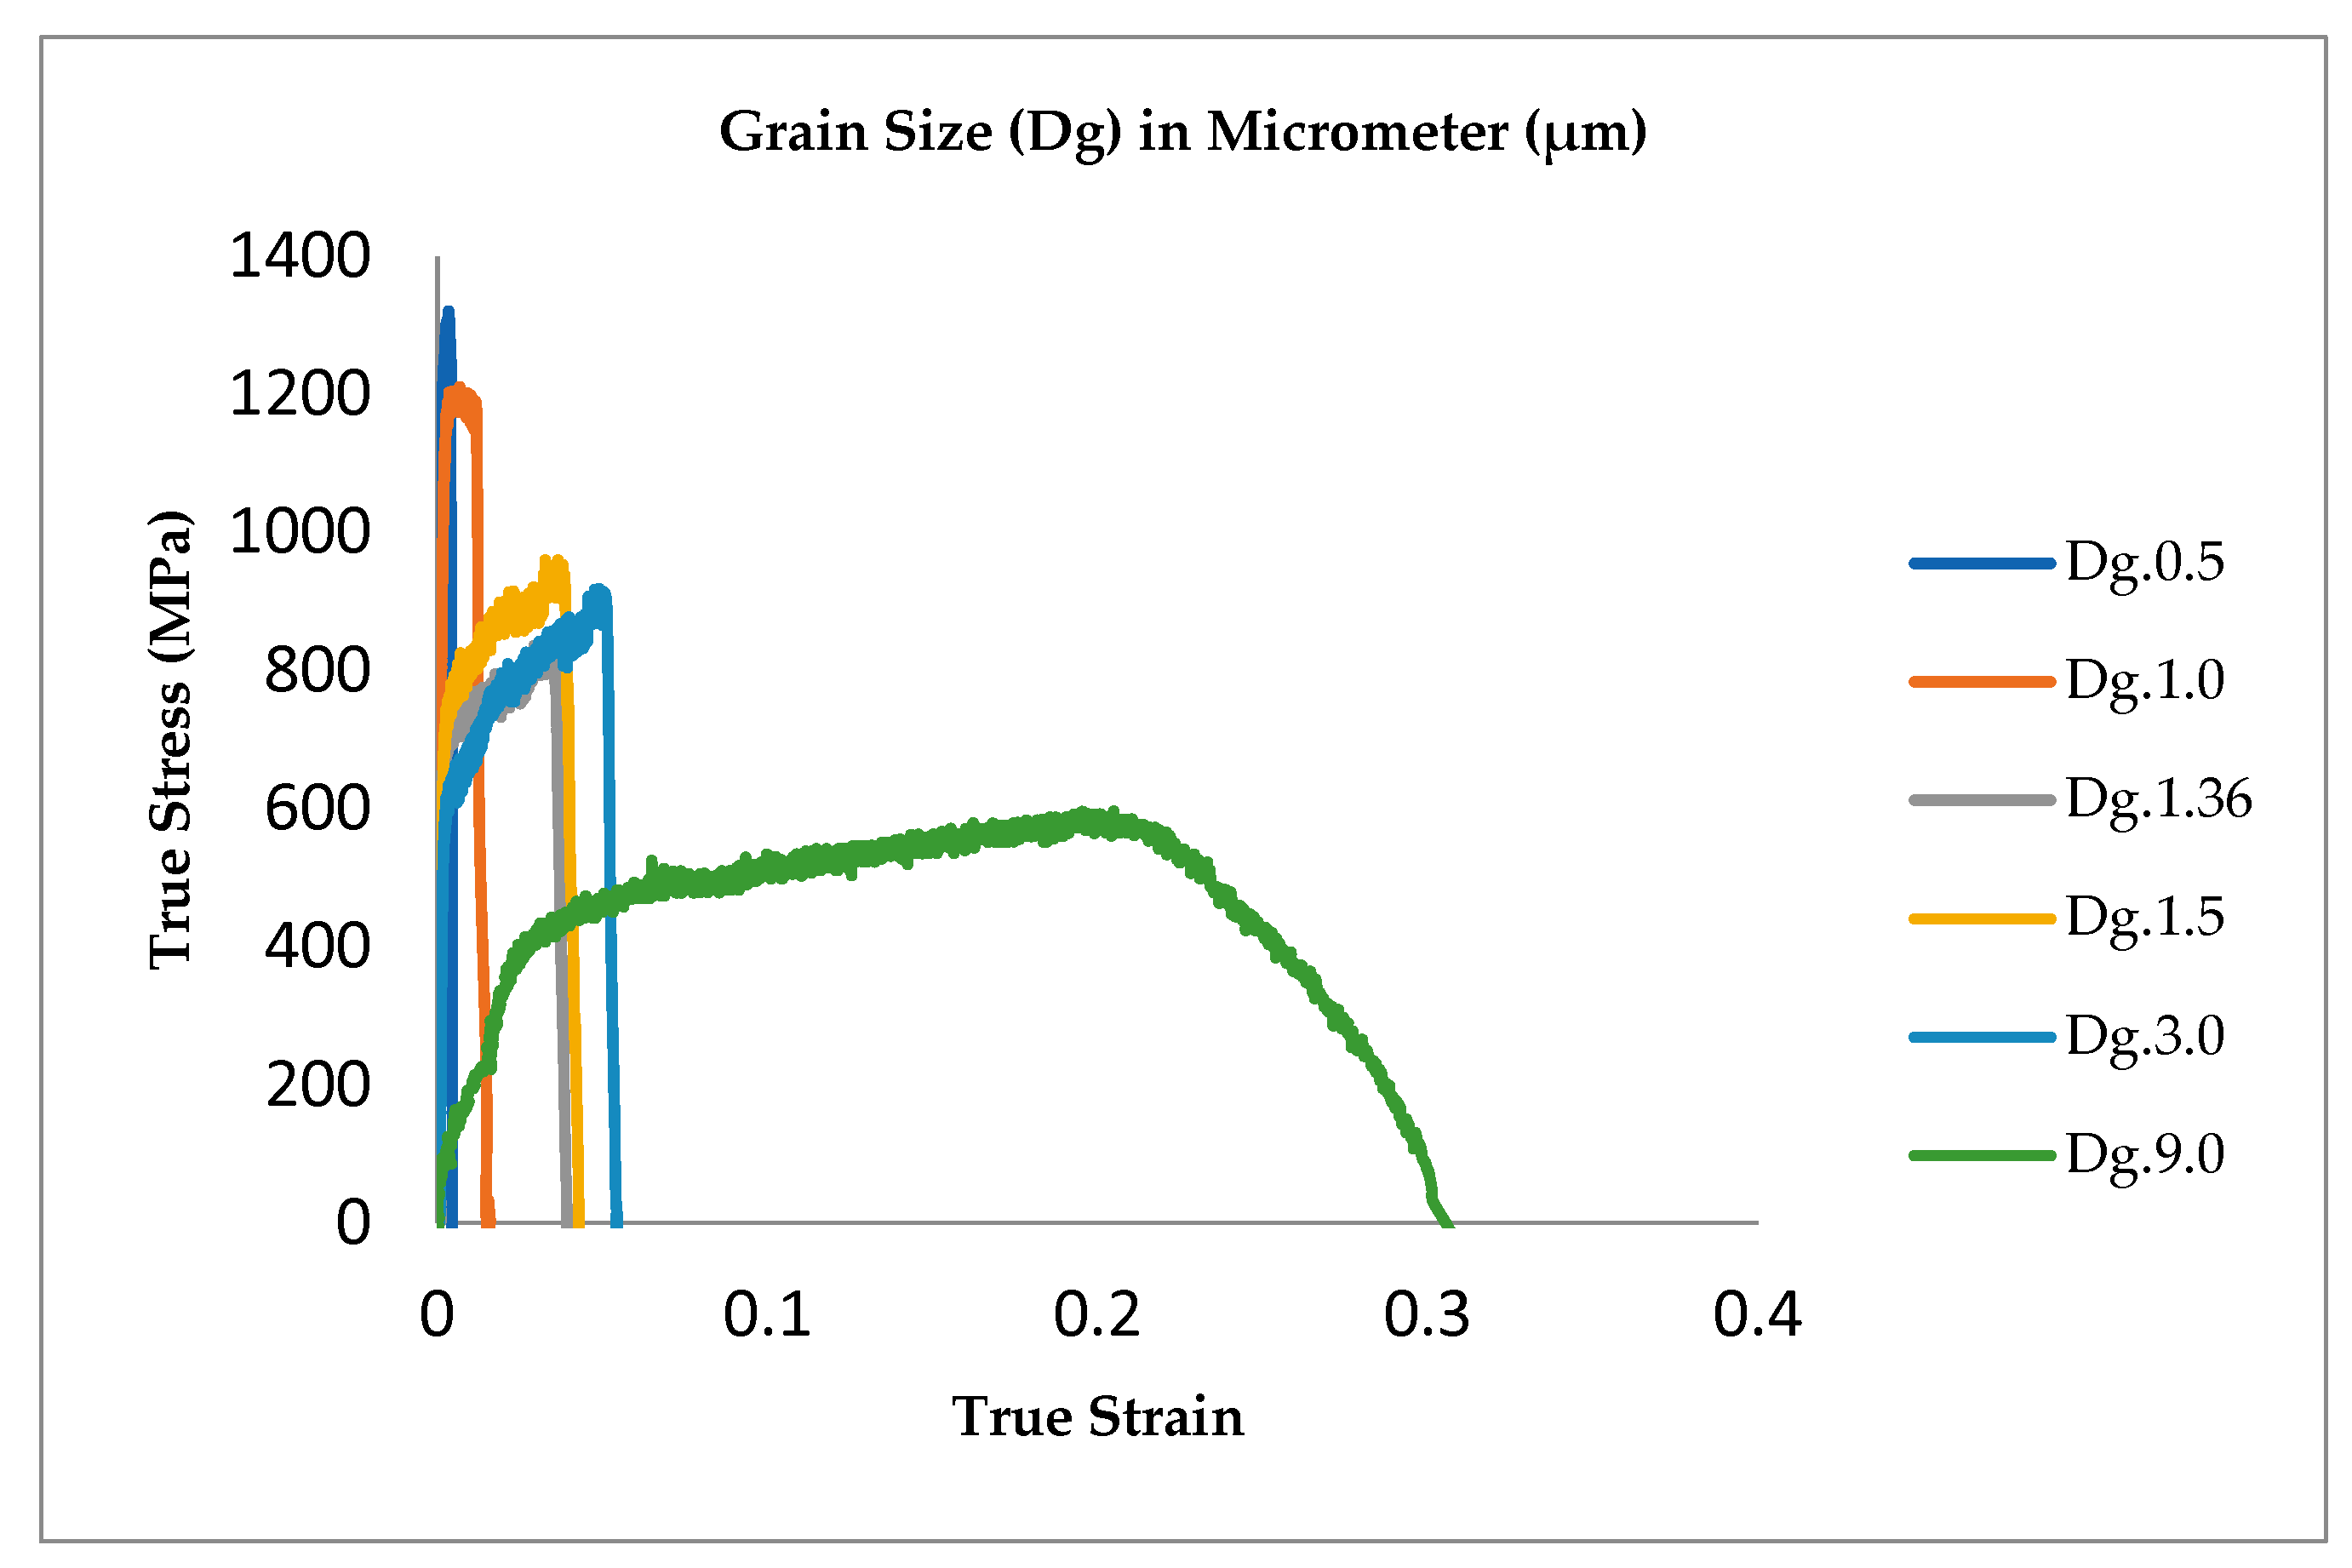
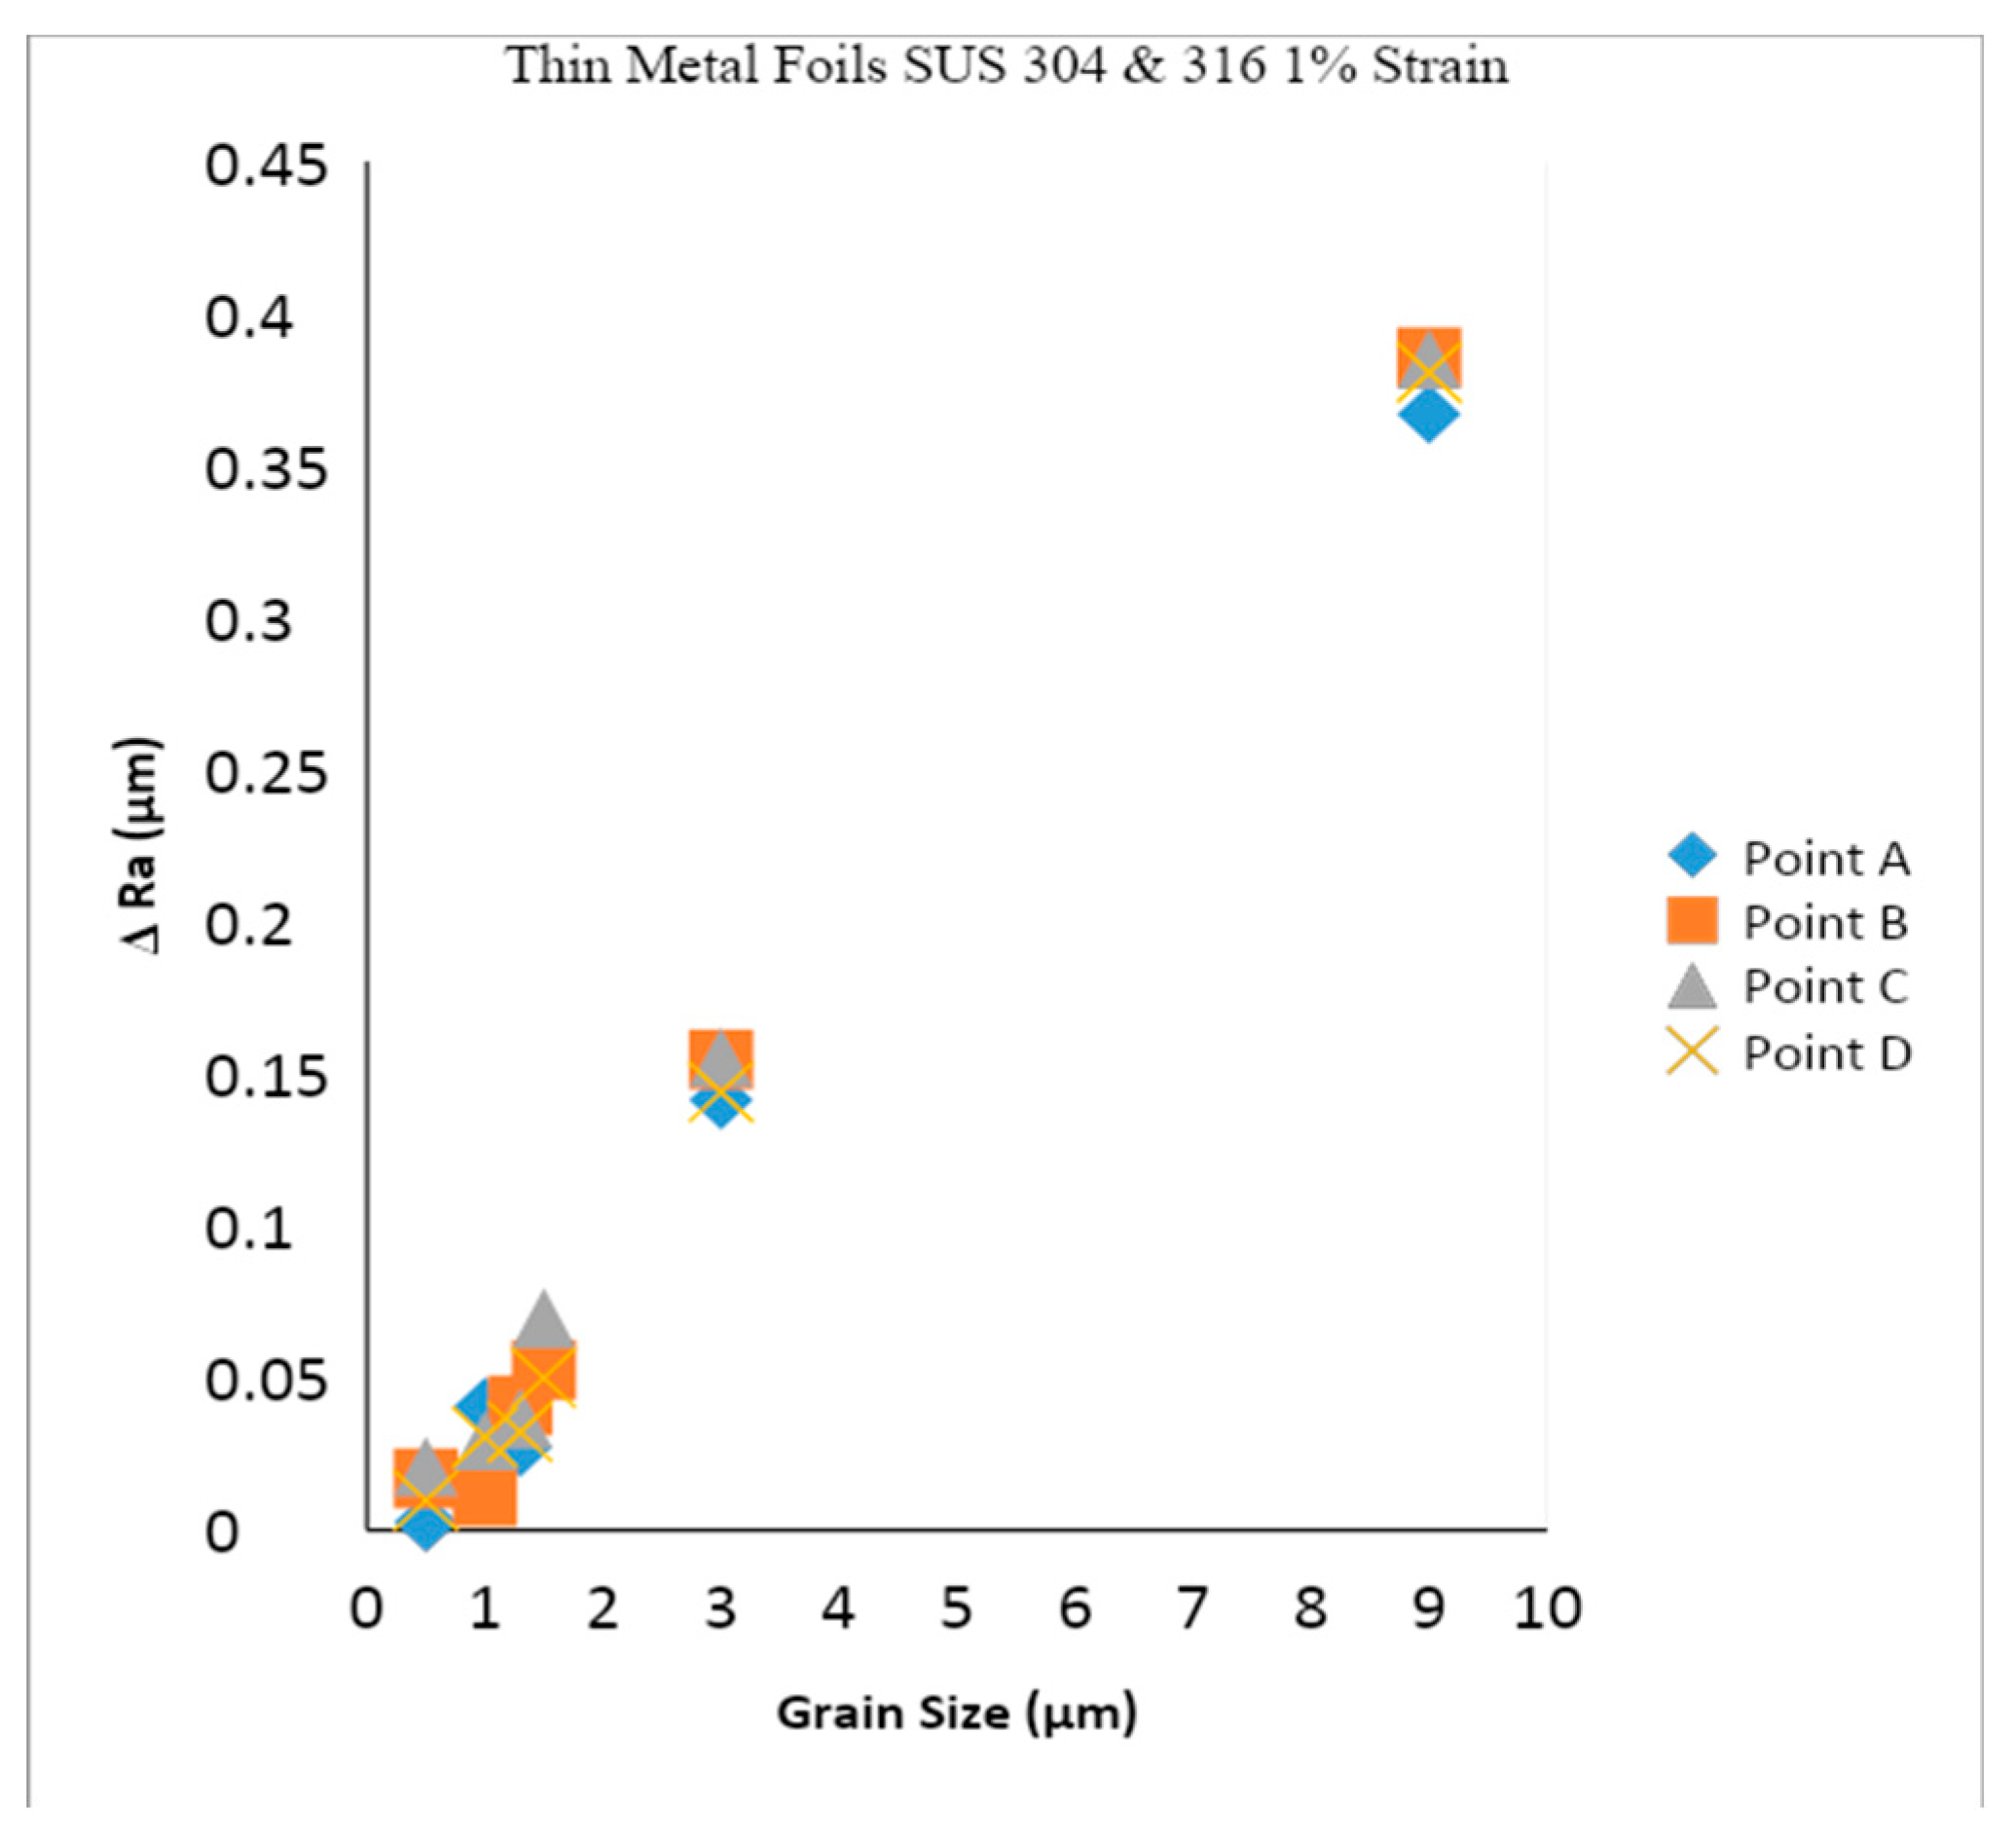
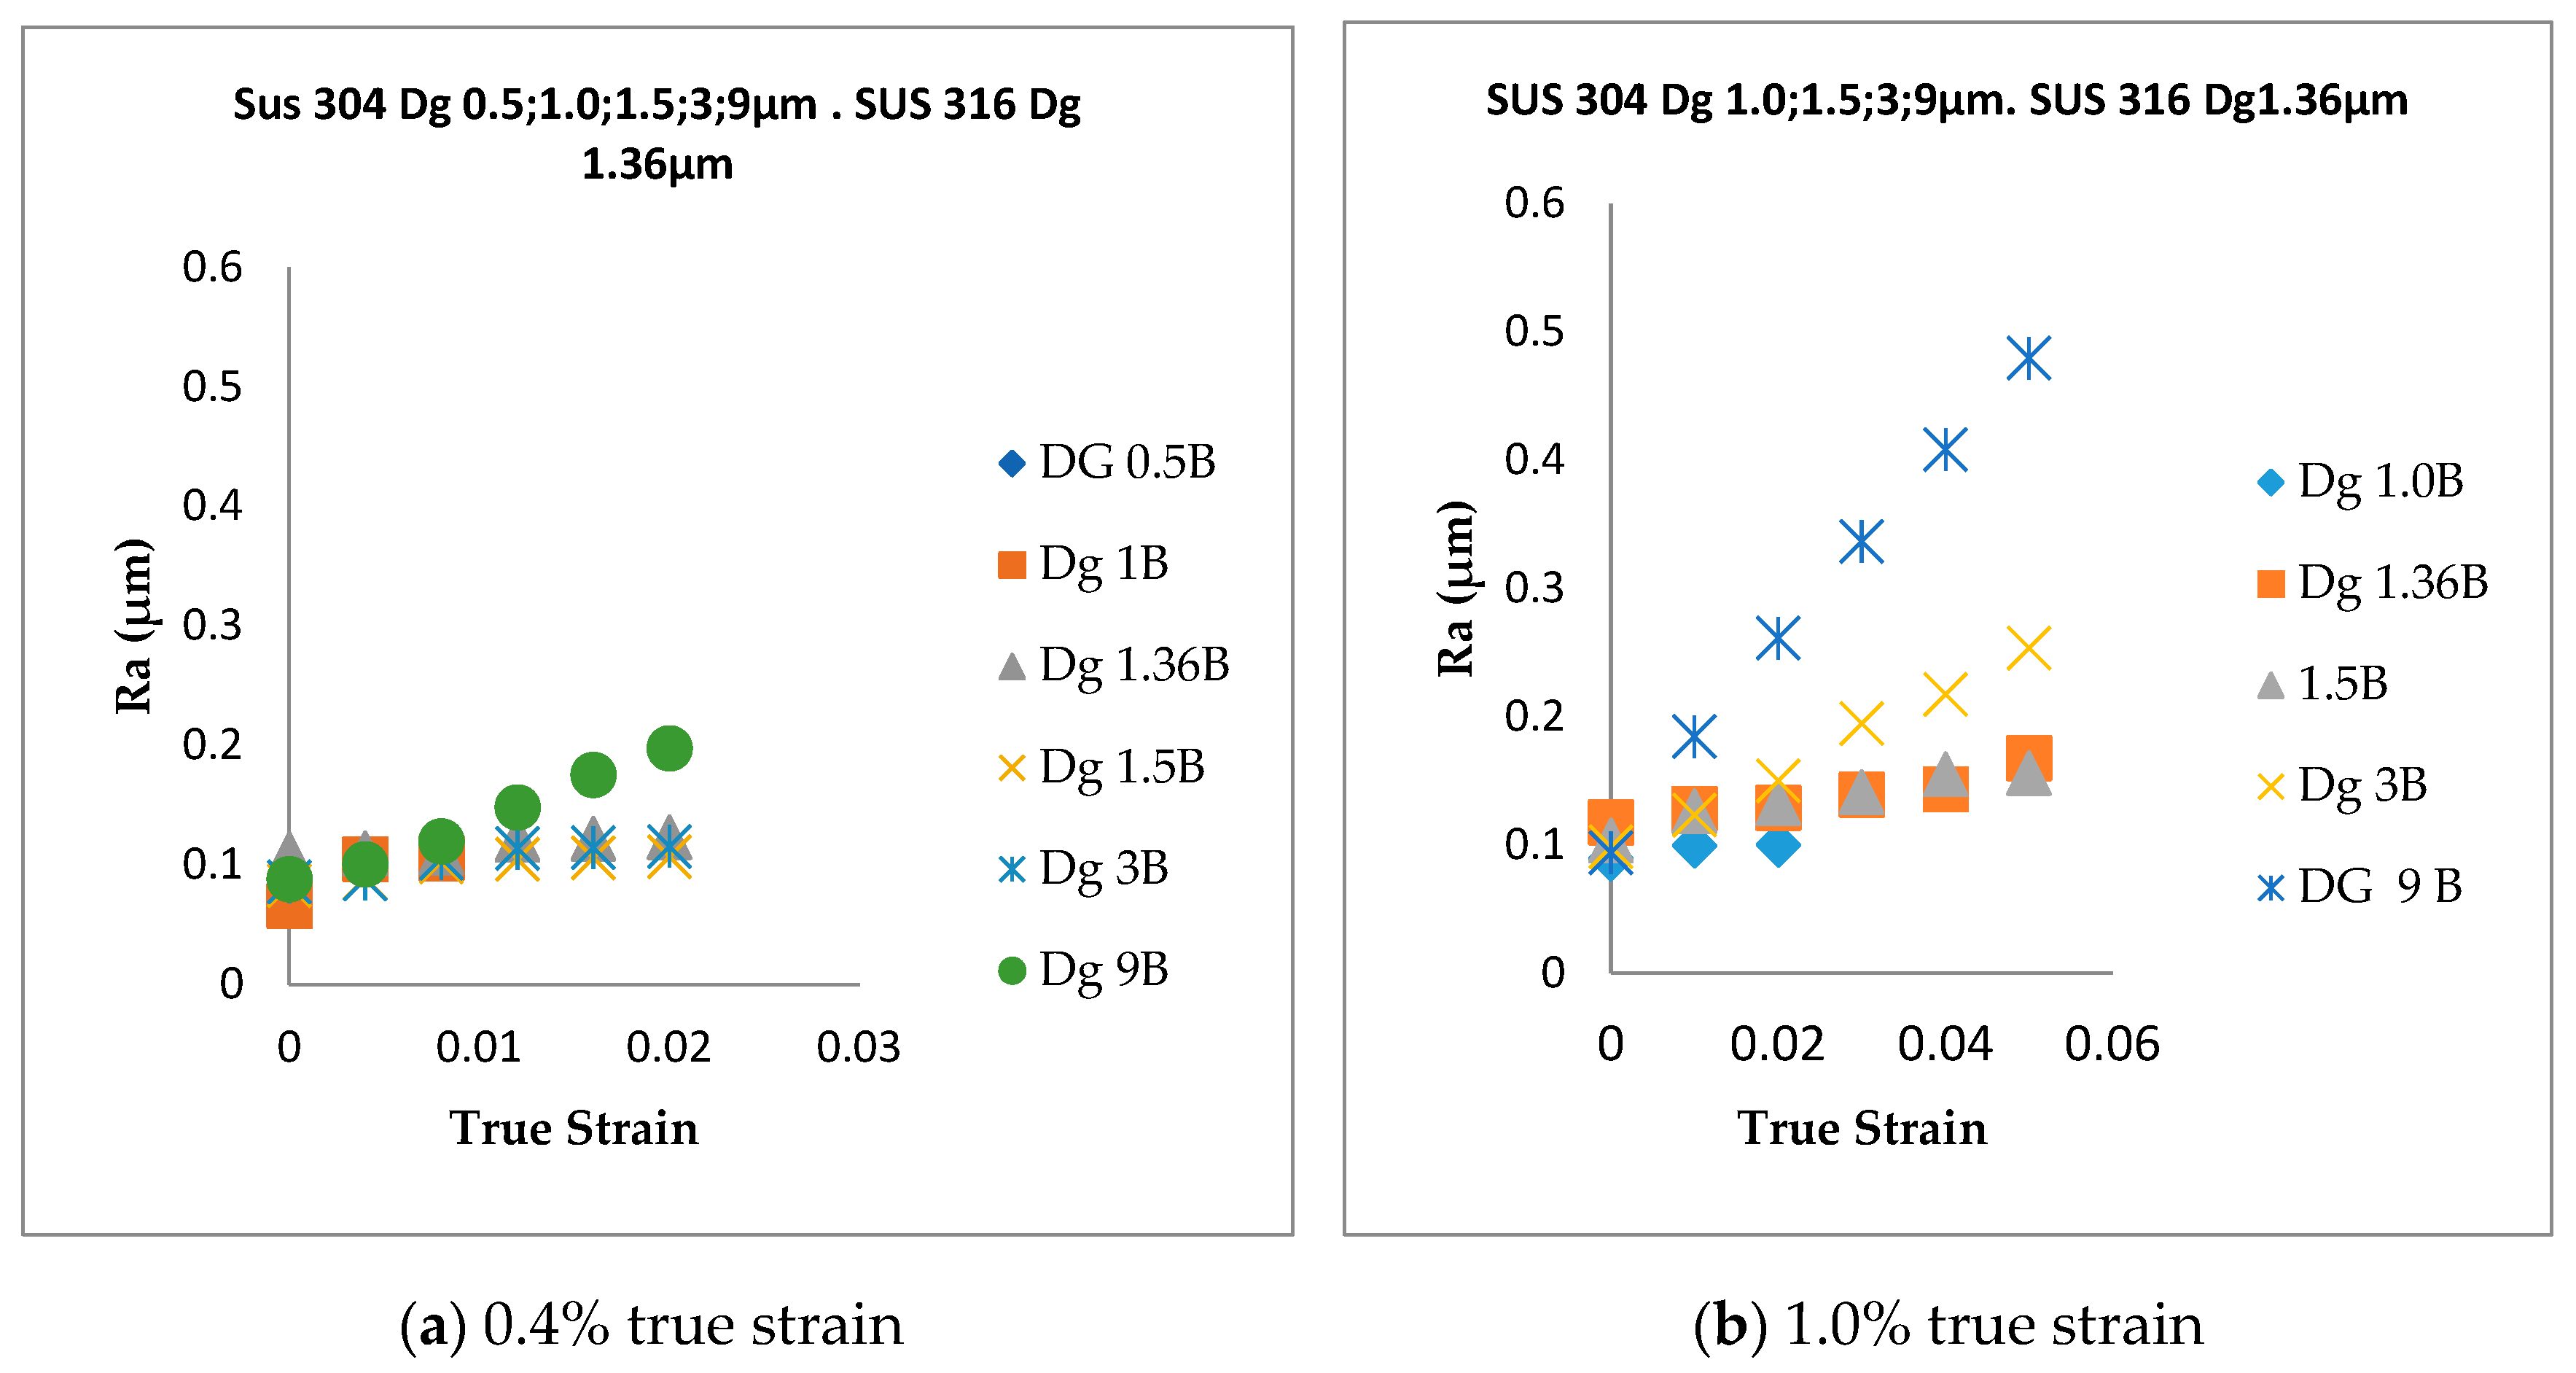
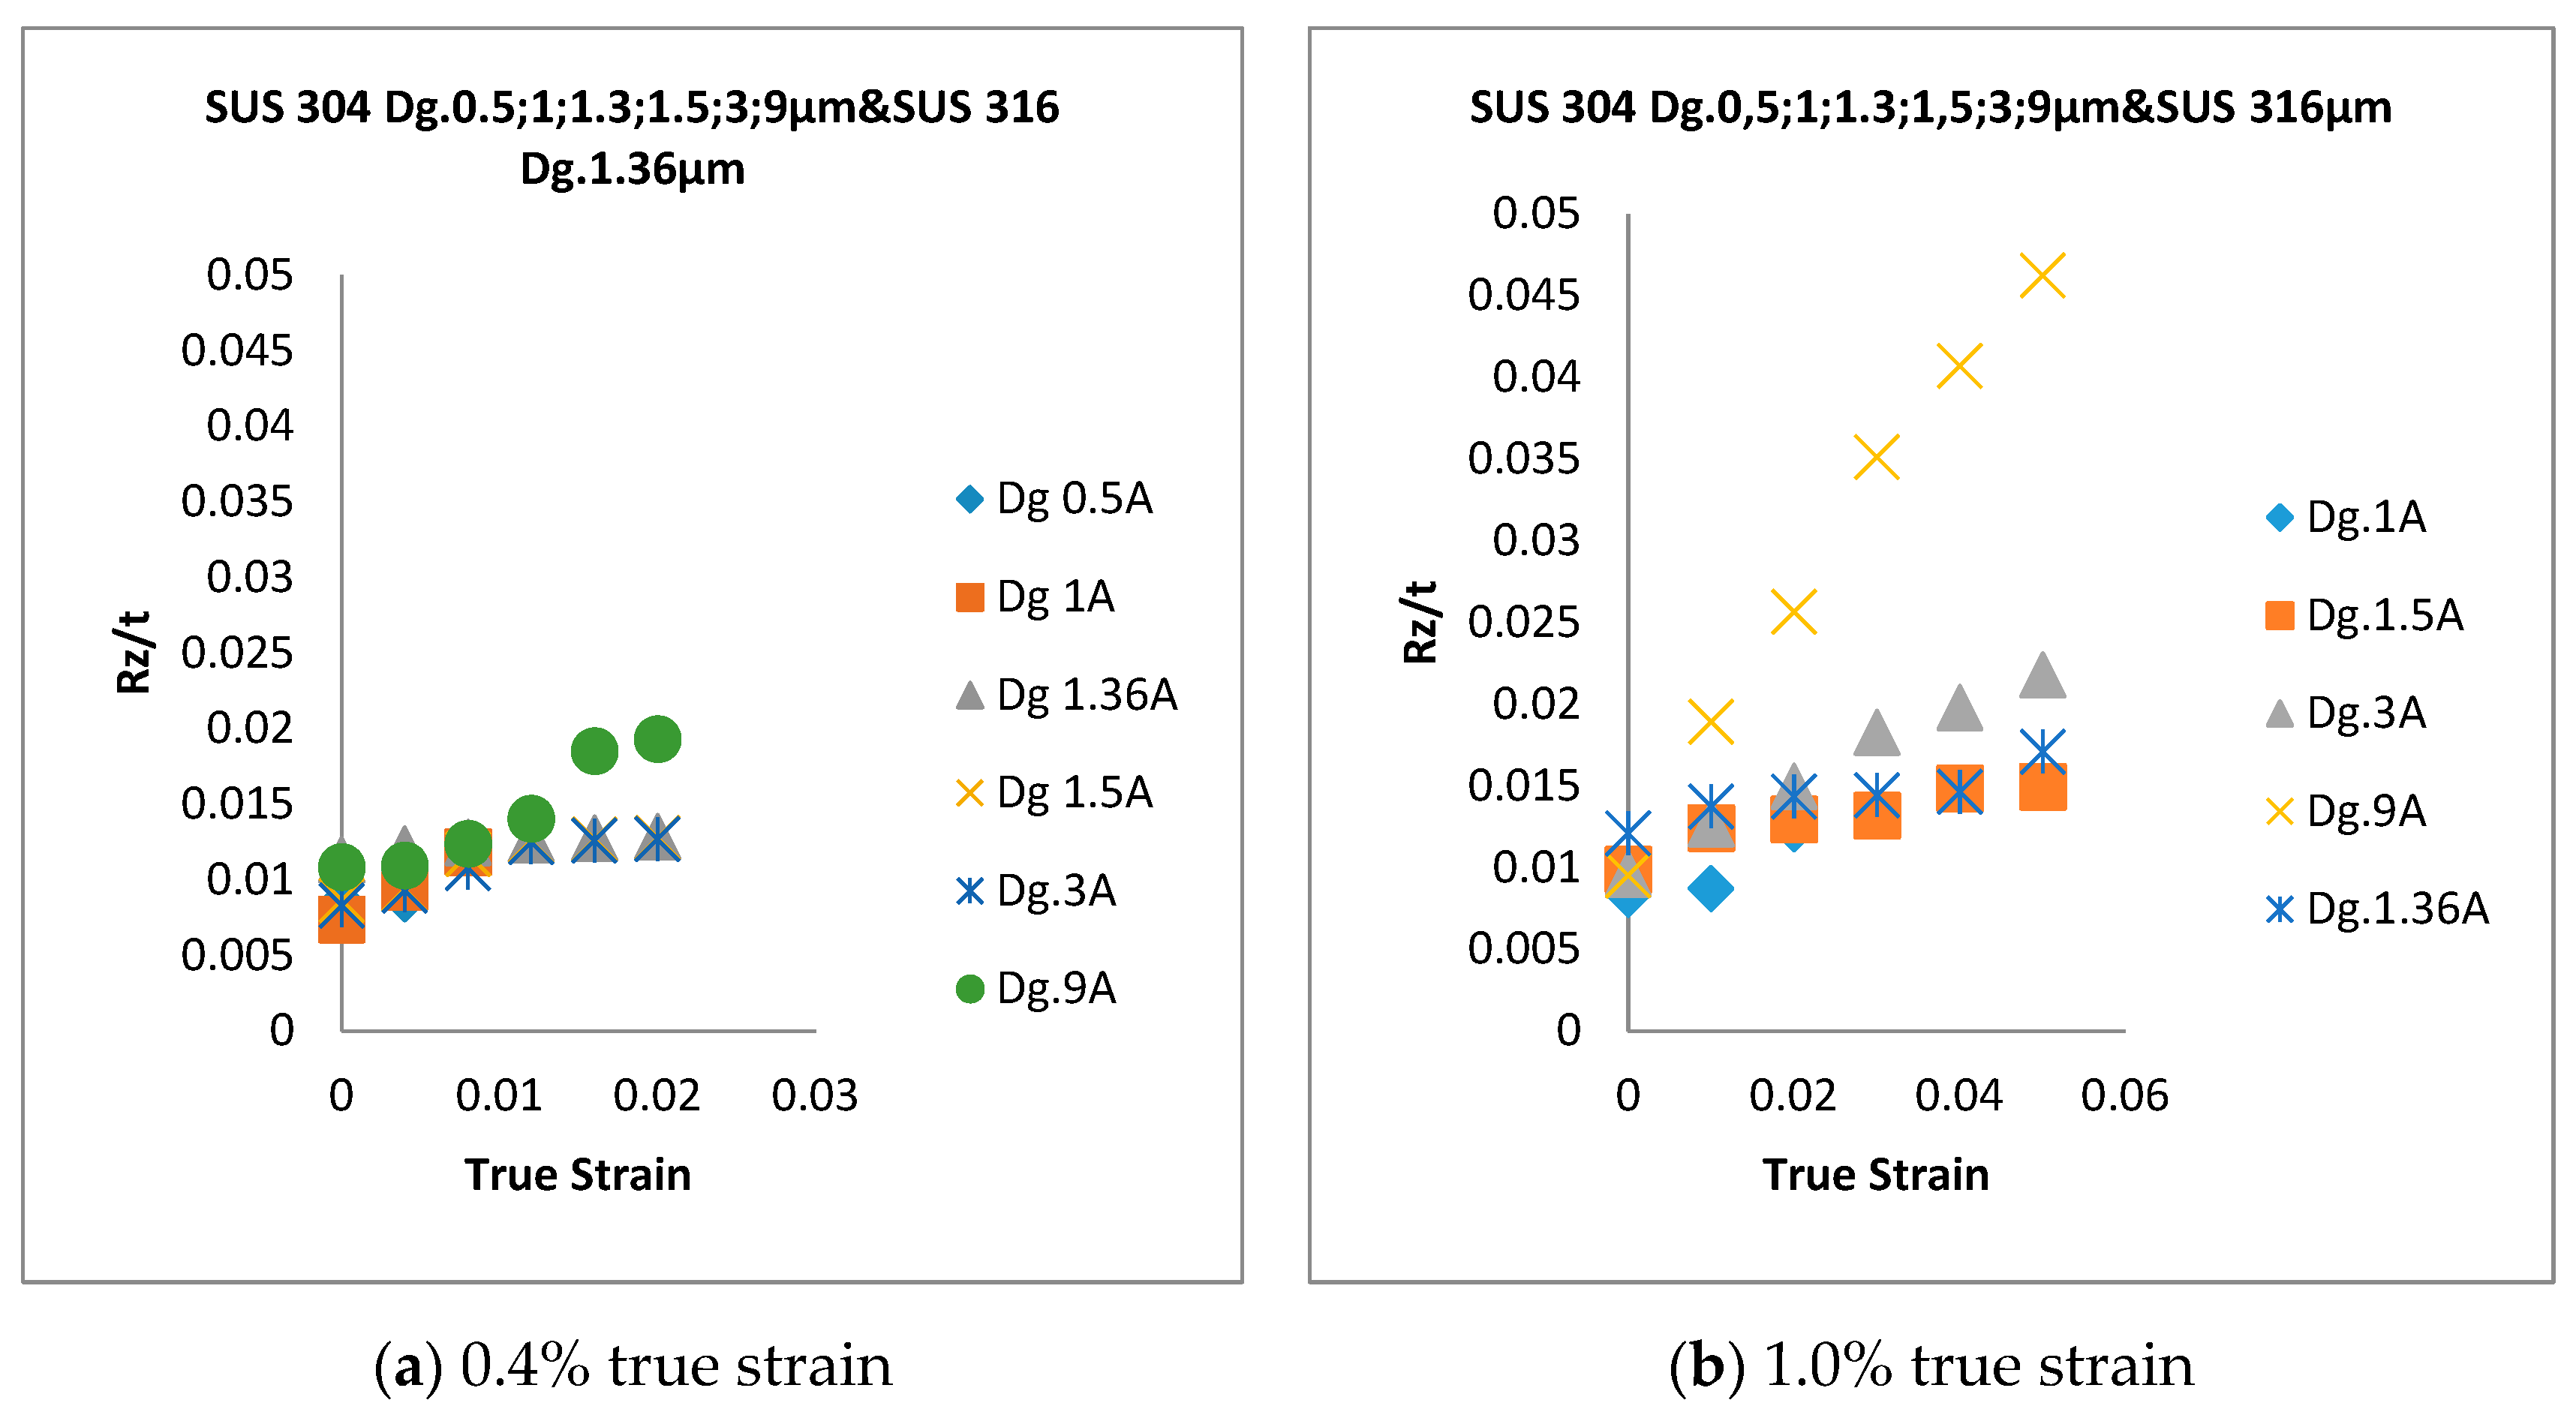
- In SUS 304 thin foils, the surface roughness increases proportionally in coarse grain because of the lower slip band intersection, which lowers the MPT and Mf in coarse grain, compared to fine grain. The slip band intersection increases more in fine grain, compared to coarse grain. As result, the MPT increases more in fine grains than in coarse grains. As the MPT increases, the Mf increases.
- The surface roughness does not increase proportionally in fine grain because of the higher slip band intersection and higher MPT in SUS304. There are higher local misorientations both in fine-grain SUS 316 and SUS 304 thin metal foils, compared to the coarse-grain foils. The higher MPT or higher local misorientation in the fine grain gives the grain higher strength, compared to the coarse grain, with a lower MPT or lower local misorientation, which weakens the grain. Based on the SEM EBSD analysis, the MPT and Mf increase in proportion with the increase of the strain level. The MPT and Mf decrease in proportion with the increase of Dg. MPT and Mf increase in proportion with the decrease of Dg.
- The local grain misorientation in SUS 304 thin metal foils is higher than in SUS 316 thin metal foils.
Author Contributions
Funding
Acknowledgments
Conflicts of Interest
References
- Xue, Z.Y.; Zhou, S.; Wei, X.C. Influence of pre-transformed martensite on work-hardening behavior of SUS 304 metastable austenitic stainless steel. J. Iron Steel Res. Int. 2010, 17, 51–55. [Google Scholar] [CrossRef]
- Engel, U.; Eckstein, R. Microforming—From basic research to its realization. J. Mater. Process. Technol. 2002, 125–126, 35–44. [Google Scholar] [CrossRef]
- Furushima, T.; Manabe, K. Experimental and Numerical Study on Deformation Behavior in Dieless Drawing Process of Superplastic Microtubes. J. Mater. Process. Technol. 2007, 191, 59–63. [Google Scholar] [CrossRef]
- Milad, M.; Zreiba, N.; Elhalouani, F.; Baradai, C. The effect of Cold Work on Structure and Properties of AISI 304 Stainless Steel. J. Mater. Process. Technol. 2008, 203, 80–85. [Google Scholar] [CrossRef]
- Jha, A.K.; Sivakumar, D.; Sreekumar, K.; Mittal, M.C. Role of Transformed Martensite in the Cracking of Stainless Steel Plumbing Lines. Eng. Fail. Anal. 2008, 15, 1042–1051. [Google Scholar] [CrossRef]
- Lo, K.H.; Shek, C.H.; Lai, J.K.L. Recent developments in stainless steels. Mater. Sci. Eng. R 2009, 65, 39–104. [Google Scholar] [CrossRef]
- Nohara, K.; Ono, Y.; Ohashi, N. Composition and grain size dependencies of strain-induced martensitic transformation in metastable austenitic stainless steels. Tetsu-To-Hagane 1977, 63, 772–782. [Google Scholar] [CrossRef]
- Diani, J.M.; Parks, D.M. Effects of strain state on the kinetics of strain-induced martensite in steels. J. Mech. Phys. Solids 1998, 46, 1613–1635. [Google Scholar] [CrossRef]
- Iwamoto, T.; Tsuta, T.; Tomita, Y. Investigation on deformation mode dependence of strain-induced martensitic transformation in TRIP steels and modelling of transformation kinetics. Int. J. Mech. Sci. 1998, 40, 173–182. [Google Scholar] [CrossRef]
- Iwamoto, T.; Tsuta, T. Computational simulation of the dependence of the austenitic grain size on the deformation behavior of TRIP steels. Int. J. Plast. 2000, 16, 791–804. [Google Scholar] [CrossRef]
- Huang, J.X.; Ye, X.N.; Xu, Z. Effect of cold rolling on microstructure and mechanical properties of AISI 301LN metastable austenitic stainless steels. Iron Steel Res. Int. 2012, 19, 59–63. [Google Scholar] [CrossRef]
- Qin, Z.; Xia, Y. Role of strain–induced martensitic phase transformation in mechanical response of 304L steel at different strain–rates and temperatures. J. Mater. Process. Technol. 2020, 280, 116613. [Google Scholar] [CrossRef]
- Peng, F.; Dong, X.H.; Liu, K.; Xie, H.Y. Effects of strain rate and plastic work on martensitic transformation kinetics of austenitic stainless steel 304. J. Iron Steel Res. Int. 2015, 22, 931–936. [Google Scholar] [CrossRef]
- Tomita, Y.; Iwamoto, T. Constitutive modeling of TRIP steel and its application to the improvement of mechanical properties. Int. J. Mech. Sci. 1995, 37, 1295–1305. [Google Scholar] [CrossRef]
- Zandrahimi, M.; Bateni, M.R.; Poladi, A.; SJerzy, A.S. The formation of martensite during wear of AISI 304 stainless steel. Wear 2007, 263, 674–678. [Google Scholar] [CrossRef]
- Choi, J.Y.; Ji, J.H.; Hwang, S.W.; Park, K.T. Strain induced martensitic transformation of Fe-20Cr-5Mn-0,2Ni duplex stainless steel during cold rolling: Effects of nitrogen addition. Mater. Sci. Eng. A 2011, 528, 6012–6019. [Google Scholar] [CrossRef]
- Yamaguchi, K.; Mellor, P.B. Thickness and Grain Size Dependence of Limit Strains in Sheet Metal Stretching. Int. J. Mech. Sci. 1976, 18, 85–90. [Google Scholar] [CrossRef]
- Osakada, K.; Oyane, M. On the Roughening Phenomena of Free Surface in Deformation Process. Trans. Jpn. Soc. Mech. Eng. 1970, 36, 1017–1022. [Google Scholar] [CrossRef][Green Version]
- Fukuda, M.; Yamaguchi, K.; Takakura, N.; Sakano, Y. Roughening Phenomenon on Free Surface of Products in Sheet Metal Forming. J. Jpn. Soc. Technol. Plast. 1974, 15, 994–1002. [Google Scholar]
- Yamaguchi, K.; Takakura, N.; Fukuda, M. FEM simulation of surface roughening in FCC metals Using Direct Numerical Simulation. Acta Mater. 2004, 52, 5791–5804. [Google Scholar]
- Vollertsen, F.; Nichoff, H.S.; Hu, Z. State of the art in micro forming. Int. J. Mach. Tools Manuf. 2006, 46, 1172–1179. [Google Scholar] [CrossRef]
- Meng, B.; Fu, M.W. Size effect on deformation behavior and ductile fracture in microforming of pure copper sheets considering free surface roughening. Mater. Des. 2015, 83, 400–412. [Google Scholar] [CrossRef]
- Cheng, C.; Wan, M.; Meng, B. Size Effect on the forming limit of sheet metal in micro-scaled plastic deformation considering free surface roughening. Procedia Eng. 2017, 207, 1010–1015. [Google Scholar] [CrossRef]
- Stoudt, M.R.; Hubbard, J.B.; Leigh, S.D. On the relationship between deformation-induced surface roughness and plastic strain in AA5052. Metall Mater. Trans A 2011, 42A, 2668–2679. [Google Scholar] [CrossRef]
- Furushima, T.; Tsunezaki, H.; Manabe, K.I.; Yang, M.; Alexandrov, S. Influence of Free Surface Roughening on Ductile Fracture Behavior Under Uni-axial Tensile State For Metal Foils. In Proceedings of the 13th International Conference on Fracture, Beijing, China, 16–21 June 2013. [Google Scholar]
- Raabe, D.; Sachtleber, M.; Weiland, H.; Scheele, G.; Zhao, Z. Grain-scale micromechanics of polycrystal surfaces during plastic straining. Acta Mater. 2003, 51, 1539–1560. [Google Scholar] [CrossRef]
- Furushima, T.; Tsunezaki, H.; Manabe, K.-I.; Alexandrov, S. Ductile fracture and free surface roughening behaviors of pure copper foils for micro/meso-scale forming. Int. J. Mach. Tools Manuf. 2014, 76, 34–48. [Google Scholar] [CrossRef]
- Zhang, L.; Xu, W.; Liu, C.; Ma, X.; Long, J. Quantitative Analysis of Surface Roughness Evolution in FCC Polycrystalline Metal during Uniaxial Tension. Comput. Mater. Sci. 2017, 132, 19–29. [Google Scholar] [CrossRef]
- Yoshida, K. Effect of Grain Scale Heterogeneity on Surface Roughness and Sheet Metal Necking. Int. J. Mech. Sci. 2014, 83, 48–56. [Google Scholar] [CrossRef]
- Shimizu, I.; Okuda, T.; Abe, T.; Tani, H. Surface Roughening and Deformation of Grains during Uniaxial Tension of Polycrystalline Iron. JSME Int. J. Ser. A 2001, 44, 499–506. [Google Scholar] [CrossRef]
- Peng, L.; Xu, Z.; Gao, Z.; Fu, M.W. A Constitutive Model for Metal Plastic Deformation At Micro/Meso Scale With Consideration of Grain Orientation And Its Evolution. Int. J. Mech. Sci. 2018, 138–139, 74–85. [Google Scholar] [CrossRef]
- Furushima, T.; Tsunezaki, H.; Nakayama, T.; Manabe, K.; Alexandrov, S. Sergei Alexandrov, Prediction of Surface Roughening and Necking Behavior for Metal Foils by Inhomogeneous FE material Modelling. Key Eng. Mater. 2013, 554–557, 169–173. [Google Scholar] [CrossRef]
- Groche, P.; Schafer, R.; Justinger, H.; Ludwig, M. On the correlation between crystallographic grain size and surface evolution in metal forming process. Int. J. Mech. Sci. 2010, 52, 523–530. [Google Scholar] [CrossRef]
- Olson, G.B.; Cohen, M. Kinetics of strain-induced martensitic nucleation. Met. Trans. 1975, A6, 791–795. [Google Scholar] [CrossRef]
- Xu, J.; Guo, B.; Shan, D.; Li, M.; Wang, Z. Specimen Dimension, Grain Size Effect and Deformation Behavior in Micro Tensile of SUS 304 Stainless Steel Foil. Mater. Trans. 2013, 54, 984–989. [Google Scholar] [CrossRef]


| Cr | Ni | S | P | C | Si | Mn | |
|---|---|---|---|---|---|---|---|
| Min | 18.00 | 8.00 | - | - | - | - | - |
| Max | 20.00 | 10.50 | 0.030 | 0.045 | 0.08 | 1.00 | 2.00 |
| - | 18.01 | 8.03 | 0.004 | 0.030 | 0.05 | 0.39 | 1.10 |
| Mo | Cr | Ni | P | S | C | Si | Mn | |
|---|---|---|---|---|---|---|---|---|
| Min | 2.00 | 16.00 | 12.00 | - | - | - | - | - |
| Max | 3.00 | 18.00 | 15.00 | 0.045 | 0.030 | 0.030 | 1.00 | 2.00 |
| - | 2.07 | 17.41 | 12.22 | 0.035 | 0.001 | 0.012 | 0.66 | 1.20 |
Publisher’s Note: MDPI stays neutral with regard to jurisdictional claims in published maps and institutional affiliations. |
© 2020 by the authors. Licensee MDPI, Basel, Switzerland. This article is an open access article distributed under the terms and conditions of the Creative Commons Attribution (CC BY) license (http://creativecommons.org/licenses/by/4.0/).
Share and Cite
Aziz, A.; Yang, M. Effect of Martensitic Transformation and Grain Size on the Surface Roughening Behavior in SUS 304 and SUS 316 Thin Metal Foils. Eng 2020, 1, 167-182. https://doi.org/10.3390/eng1020011
Aziz A, Yang M. Effect of Martensitic Transformation and Grain Size on the Surface Roughening Behavior in SUS 304 and SUS 316 Thin Metal Foils. Eng. 2020; 1(2):167-182. https://doi.org/10.3390/eng1020011
Chicago/Turabian StyleAziz, Abdul, and Ming Yang. 2020. "Effect of Martensitic Transformation and Grain Size on the Surface Roughening Behavior in SUS 304 and SUS 316 Thin Metal Foils" Eng 1, no. 2: 167-182. https://doi.org/10.3390/eng1020011
APA StyleAziz, A., & Yang, M. (2020). Effect of Martensitic Transformation and Grain Size on the Surface Roughening Behavior in SUS 304 and SUS 316 Thin Metal Foils. Eng, 1(2), 167-182. https://doi.org/10.3390/eng1020011