1. Introduction
Recycled asphalt pavement (RAP) is used to make sustainable and cost-effectiveness pavements. A great number of laboratory studies have been conducted to determine the appropriate RAP content and its impact on the performance of asphalt pavements [
1,
2,
3]. The drawbacks of RAP can also be modified to some extent by rejuvenators to achieve a better workability, moisture susceptibility, fatigue and rutting performances in HMA or even WMA products [
4,
5,
6,
7,
8,
9,
10,
11]. Yu et al. [
12] evaluated the performance of WMA mixtures by adding 0%, 20%, 40%, 60% or 80% RAP to mixtures. The results revealed that the addition of RAP to WMA mixtures increased the high-temperature performance of samples at all RAP contents, but an increase in RAP content from 60% to 80% decreased the low-temperature performance and fatigue life of the samples. Thus, the long-term pavement performance (LTTP) database has been of paramount importance to verify the laboratory investigations [
13].
Specific Pavement Study-10 (SPS10), in the USA, contains the data pertaining to the effect of different RAP contents on WMA overlays. West et al. [
14] used seven types of failure as performance indicators to compare the performance of RAP overlay with that of virgin asphalt. The results showed that a thicker overlay performed better than a thinner one for all failures except rutting distress. Dong et al. [
15] created a survival model for asphalt cracking on SPS-5. Pavements aged more than 10 years showed less alligator cracking than longitudinal cracking. The results show that adding 30% RAP to the mixtures expanded longitudinal cracking on the wheel path, which could be considered early-age fatigue; however, this type of fatigue failure was not as common as alligator cracking [
16]. Jia et al. [
17] evaluated the long-term performance of Preventive Maintenance Treatments (PMTs) of pavement using LTPP-SPS-3 experimental data. These included a thin overlay, slurry seal, crack seal and chip seal. Analyses of scatterplots, cumulative frequency distributions, mean long-term effectiveness increments, and paired-sample
t-tests were performed to evaluate the long-term effectiveness. The results demonstrated that the results of the four analysis methods were similar, so the proposed new index was able to evaluate the long-term effectiveness of PMTs. Furthermore, the thin overlay and crack seal provided the best and worst PMTs, respectively, in terms of any performance measure.
Few studies have focused on the field performance of a RAP mixture with overlay. Therefore, this study was conducted in nine states, which included 31 sections in dry and wet areas based on the LTPP. Hence, this research aimed to evaluate the performance of WMA overlays. Besides the overlay characteristics, climatic conditions were also considered to explore the effects of RAP on field performance. So, SPS-10 was used to evaluate the performance of WMA overlays in terms of rutting, the International Roughness Index (IRI), transverse cracking, longitudinal cracking, and fatigue (in terms of alligator cracking).
The response surface method (RSM), which is a numerical optimization method, was also used. This method obtains the most appropriate values of variables and responses as optimal values simultaneously. The RSM was used to determine the optimal amounts of RAP and binder needed to minimize rutting, IRI, and transverse and longitudinal cracking. This study investigated the field performance and optimization of WMA mixtures since no RSM optimization studies have been conducted on WMA containing RAP that are based on LTPP data.
2. Input Data
The LTPP program was used to collect road data for analyses, as planned by the Strategic Highway Research Program (SHRP). The LTPP program is a large research project that includes two basic classes of studies and several smaller studies to examine pavement details that are critical to pavement performance. The main study classes are: General Pavement Studies (GPS) and Specific Pavement Studies (SPS). The main difference between GPS and SPS is that GPS use selected in-service pavements, while SPS use specific sections constructed or rebuilt for experimental purposes, such as for evaluating the effectiveness of rehabilitation strategies (SPS-10) and the effectiveness of PMTs [
17,
18]. The GPS and SPS programs include more than 2500 test sections located on active high-ways across North America.
The SPS-10 program includes WMA overlay, crack sealing, patching and shoulder restoration treatments. Existing WMA overlays include nine states containing 31 sections and aged under 15 years. RAP content is the main parameter of interest in investigating WMA overlays. The specifications of the pavement sections are presented in
Table 1. There were 31 sites used to investigate the effects of WMA overlays containing RAP on long-term pavement performance, including 18 sites in dry weather conditions and 13 sites in wet areas.
3. Methodology
In this research, the data were derived from
https://infopave.fhwa.dot.gov (accessed on 10 September 2020). These data include many factors that can be extracted to monitor pavement performance. Data were categorized based on the two climatic regions. Therefore, the failure data were analyzed to find the best values of RAP and binder content. RSM was used to optimize this value so that distress was minimized.
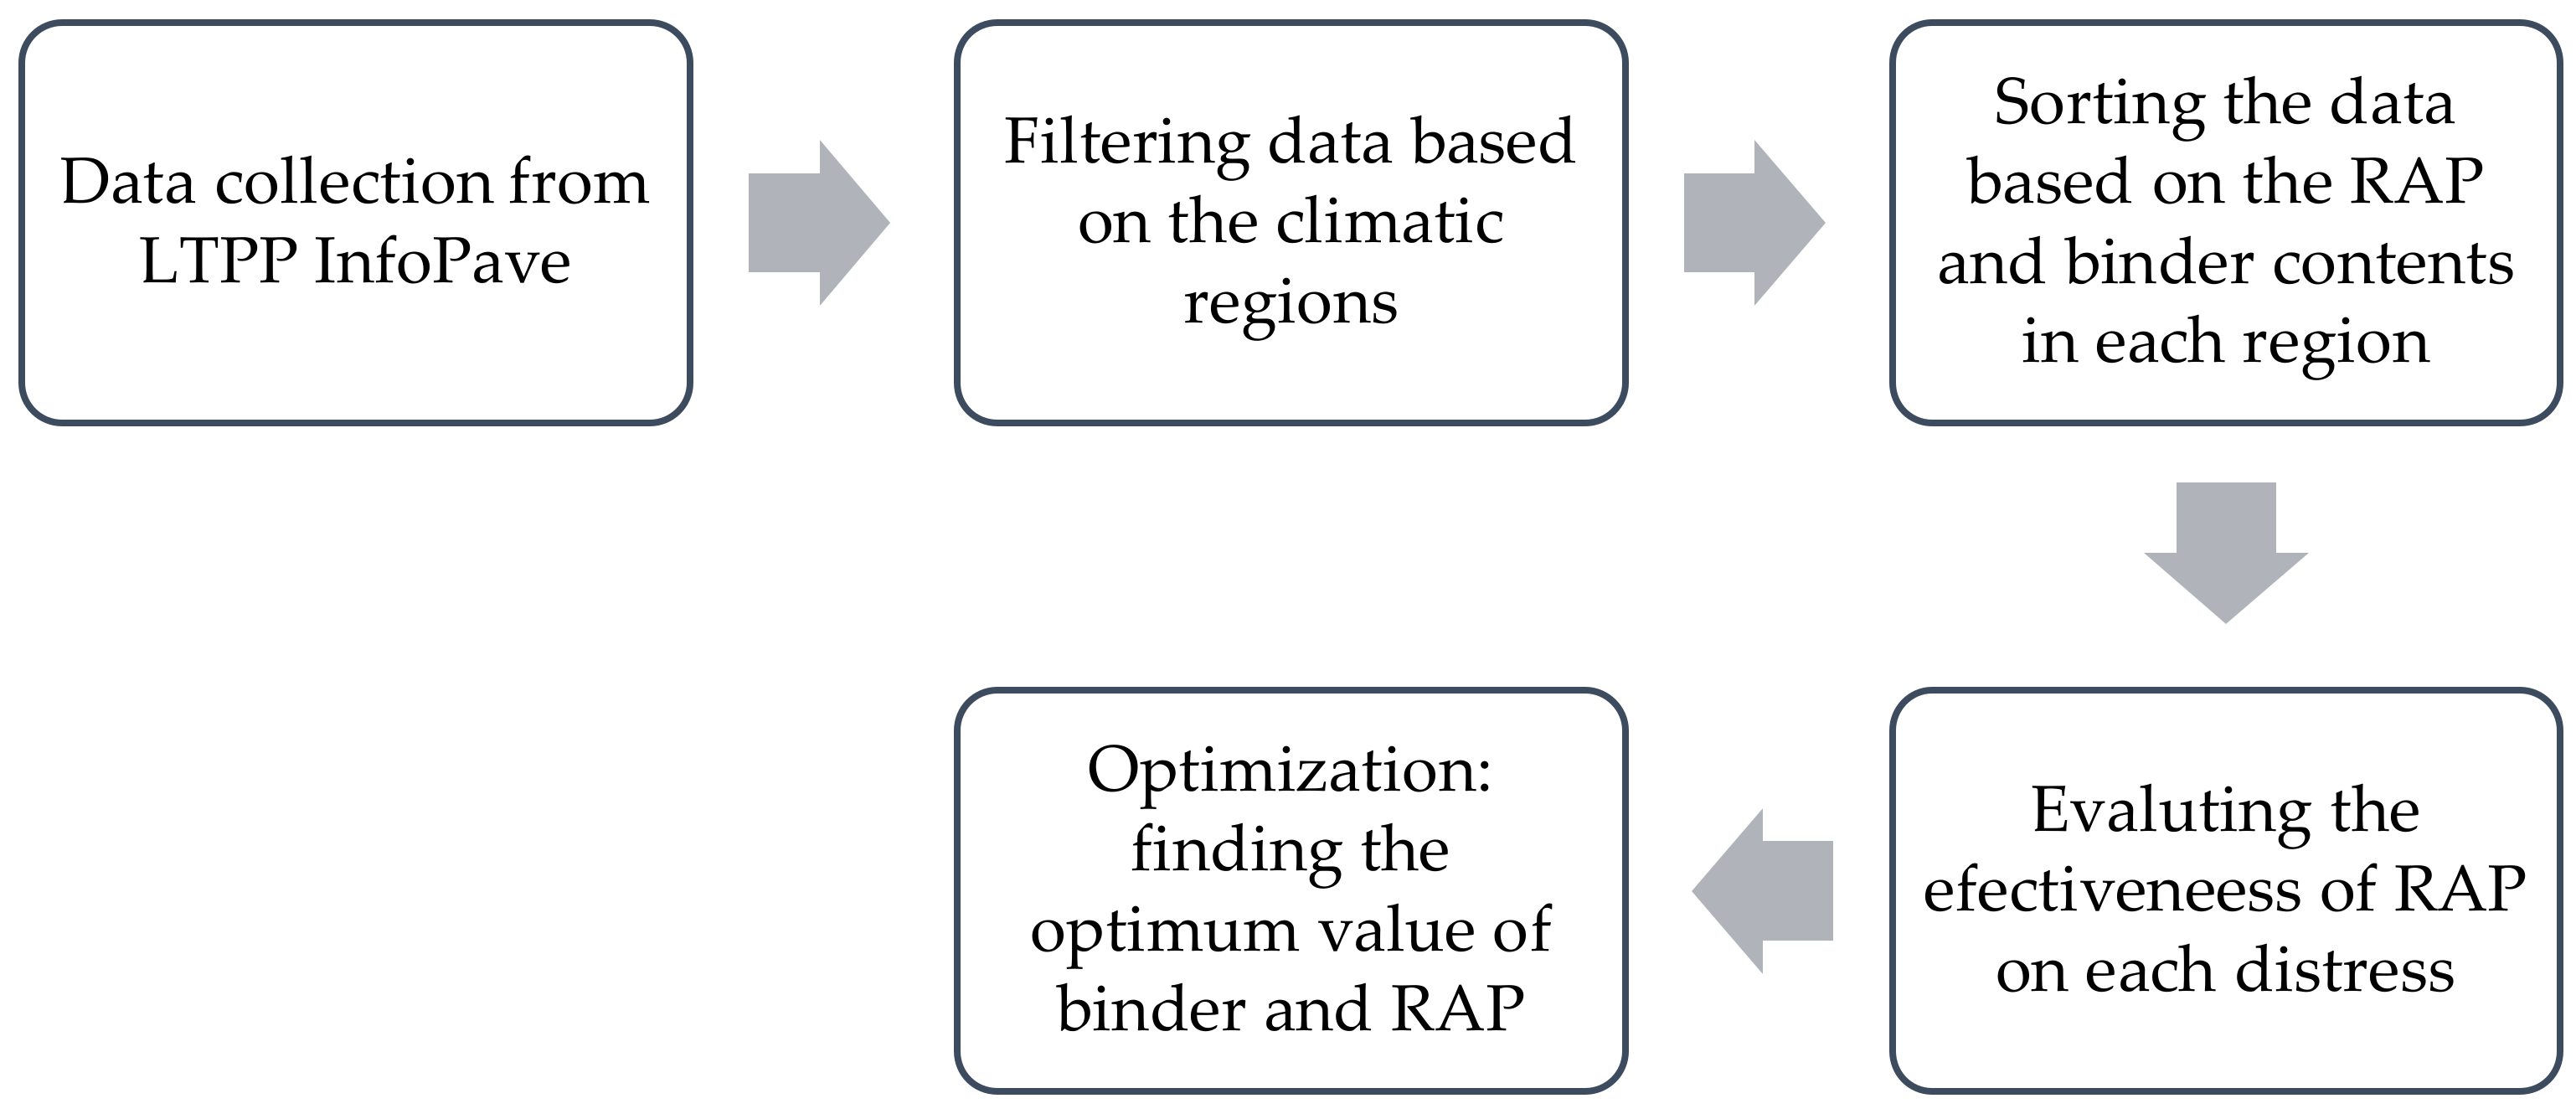
Figure 1 shows a flowchart of the research process.
4. Results and Discussion
4.1. Effect of WMA Overlay on Rutting
The rutting was measured and recorded at 31 sites before the placement of the WMA overlay in dry and wet climatic regions. Hence, the rutting improvement was calculated by subtracting the initial value from the 1- and 4-year values. Therefore, the positive values indicated that the initial rutting was more than the final recorded values. So, the WMA overlay improved the anti-rutting behavior of the pavements, while the negative values made the pavements vulnerable to the rutting phenomena. The effects of the WMA overlay on rutting performance in dry and wet climates are shown in
Figure 2 and
Figure 3, respectively.
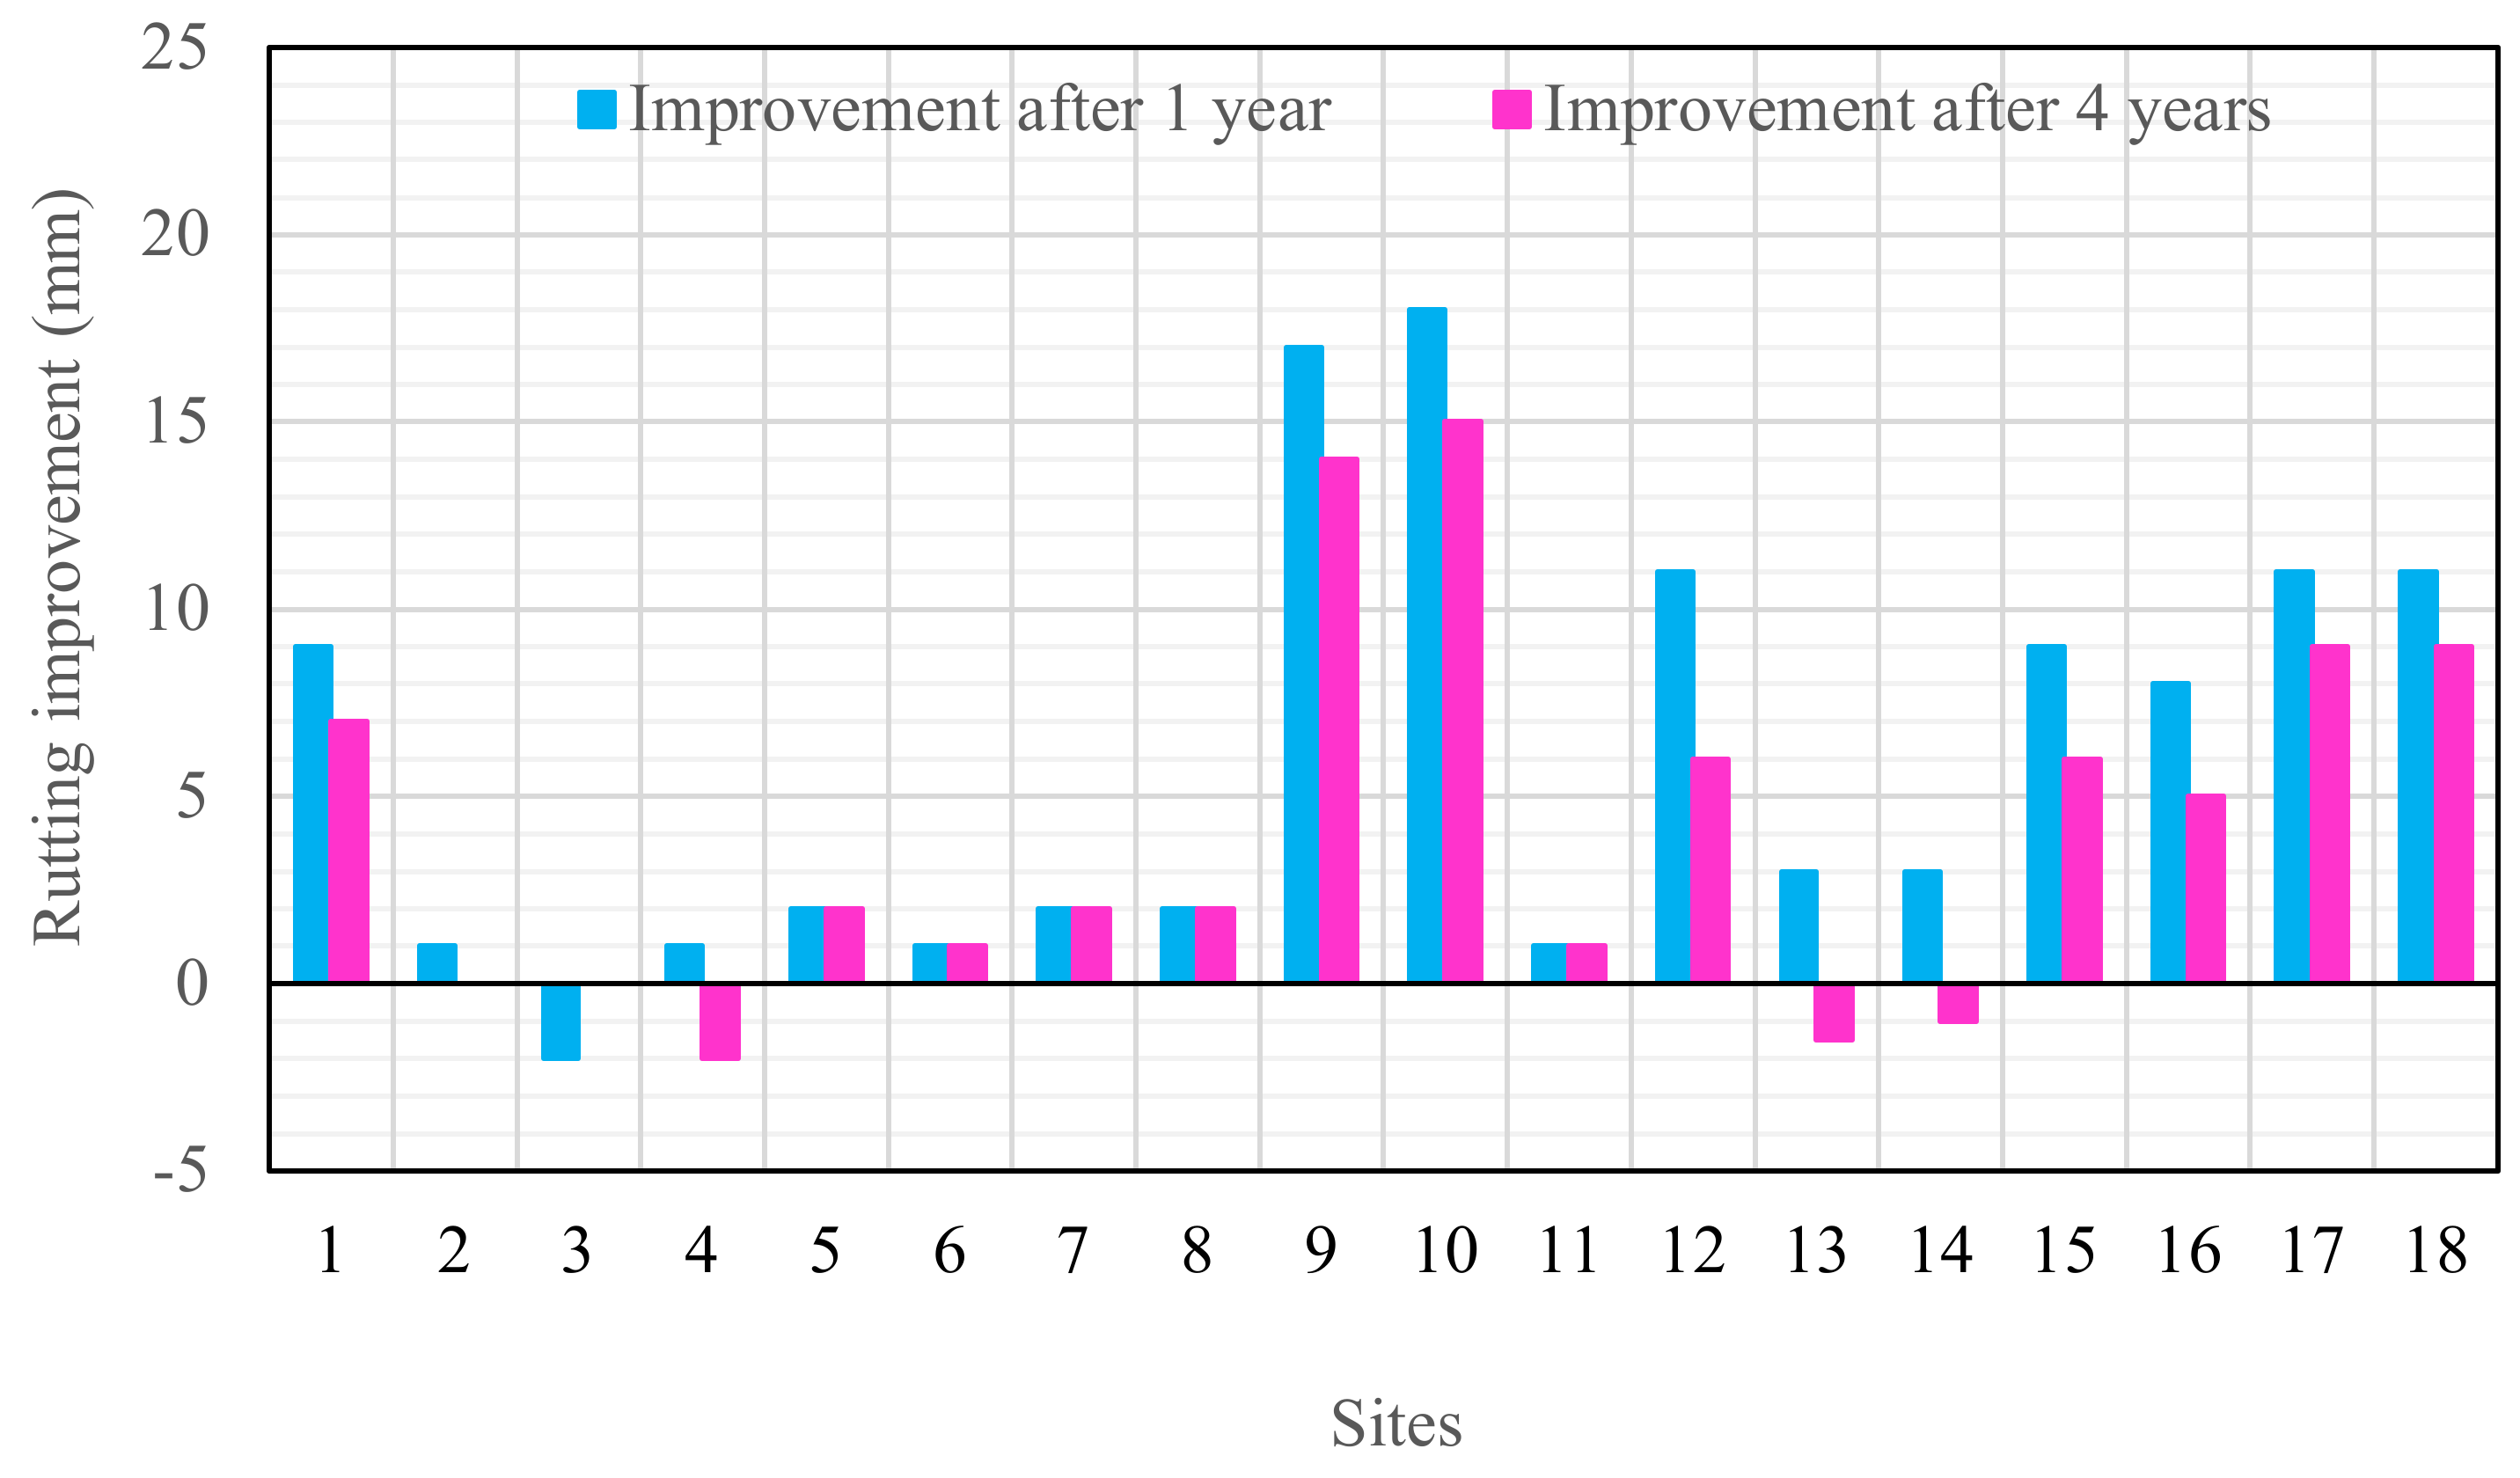
Figure 2 shows that the effect of a WMA overlay on rutting improvement in dry conditions decreases with the age of the warm mix asphalt (WMA). The greatest rutting improvement was associated with site 10 (AA62 for Nevada). Additionally,
Figure 2 shows that the best rutting resistance performance in dry regions occurred when 15% RAP and 4.5% binder were added to the mixtures. This approach may be due to the stiffness of the RAP, which increases the rutting resistance of the mixtures [
19]. In
Figure 2, it can be seen that the rutting resistance after 1 and 4 years decreased with increases in the RAP content from 15% to 30%. The long-term performance of the mixtures was reduced significantly by adding a high percentage of RAP. When a high percentage of RAP was added to the mixtures, the homogeneity decreased, as did the adhesion between the virgin material and RAP. Hence, as can be seen from
Figure 2, the anti-rutting behavior of mixtures containing 30% RAP was reduced drastically after 4 years. The effects of overlays containing 15%, 20% and 25% RAP were still positive after 4 years. At site 4 (BA59 for Arizona), adding 30% RAP to a WMA overlay containing 3.9% binder reduced the rutting depth from 1 mm to −2 mm.
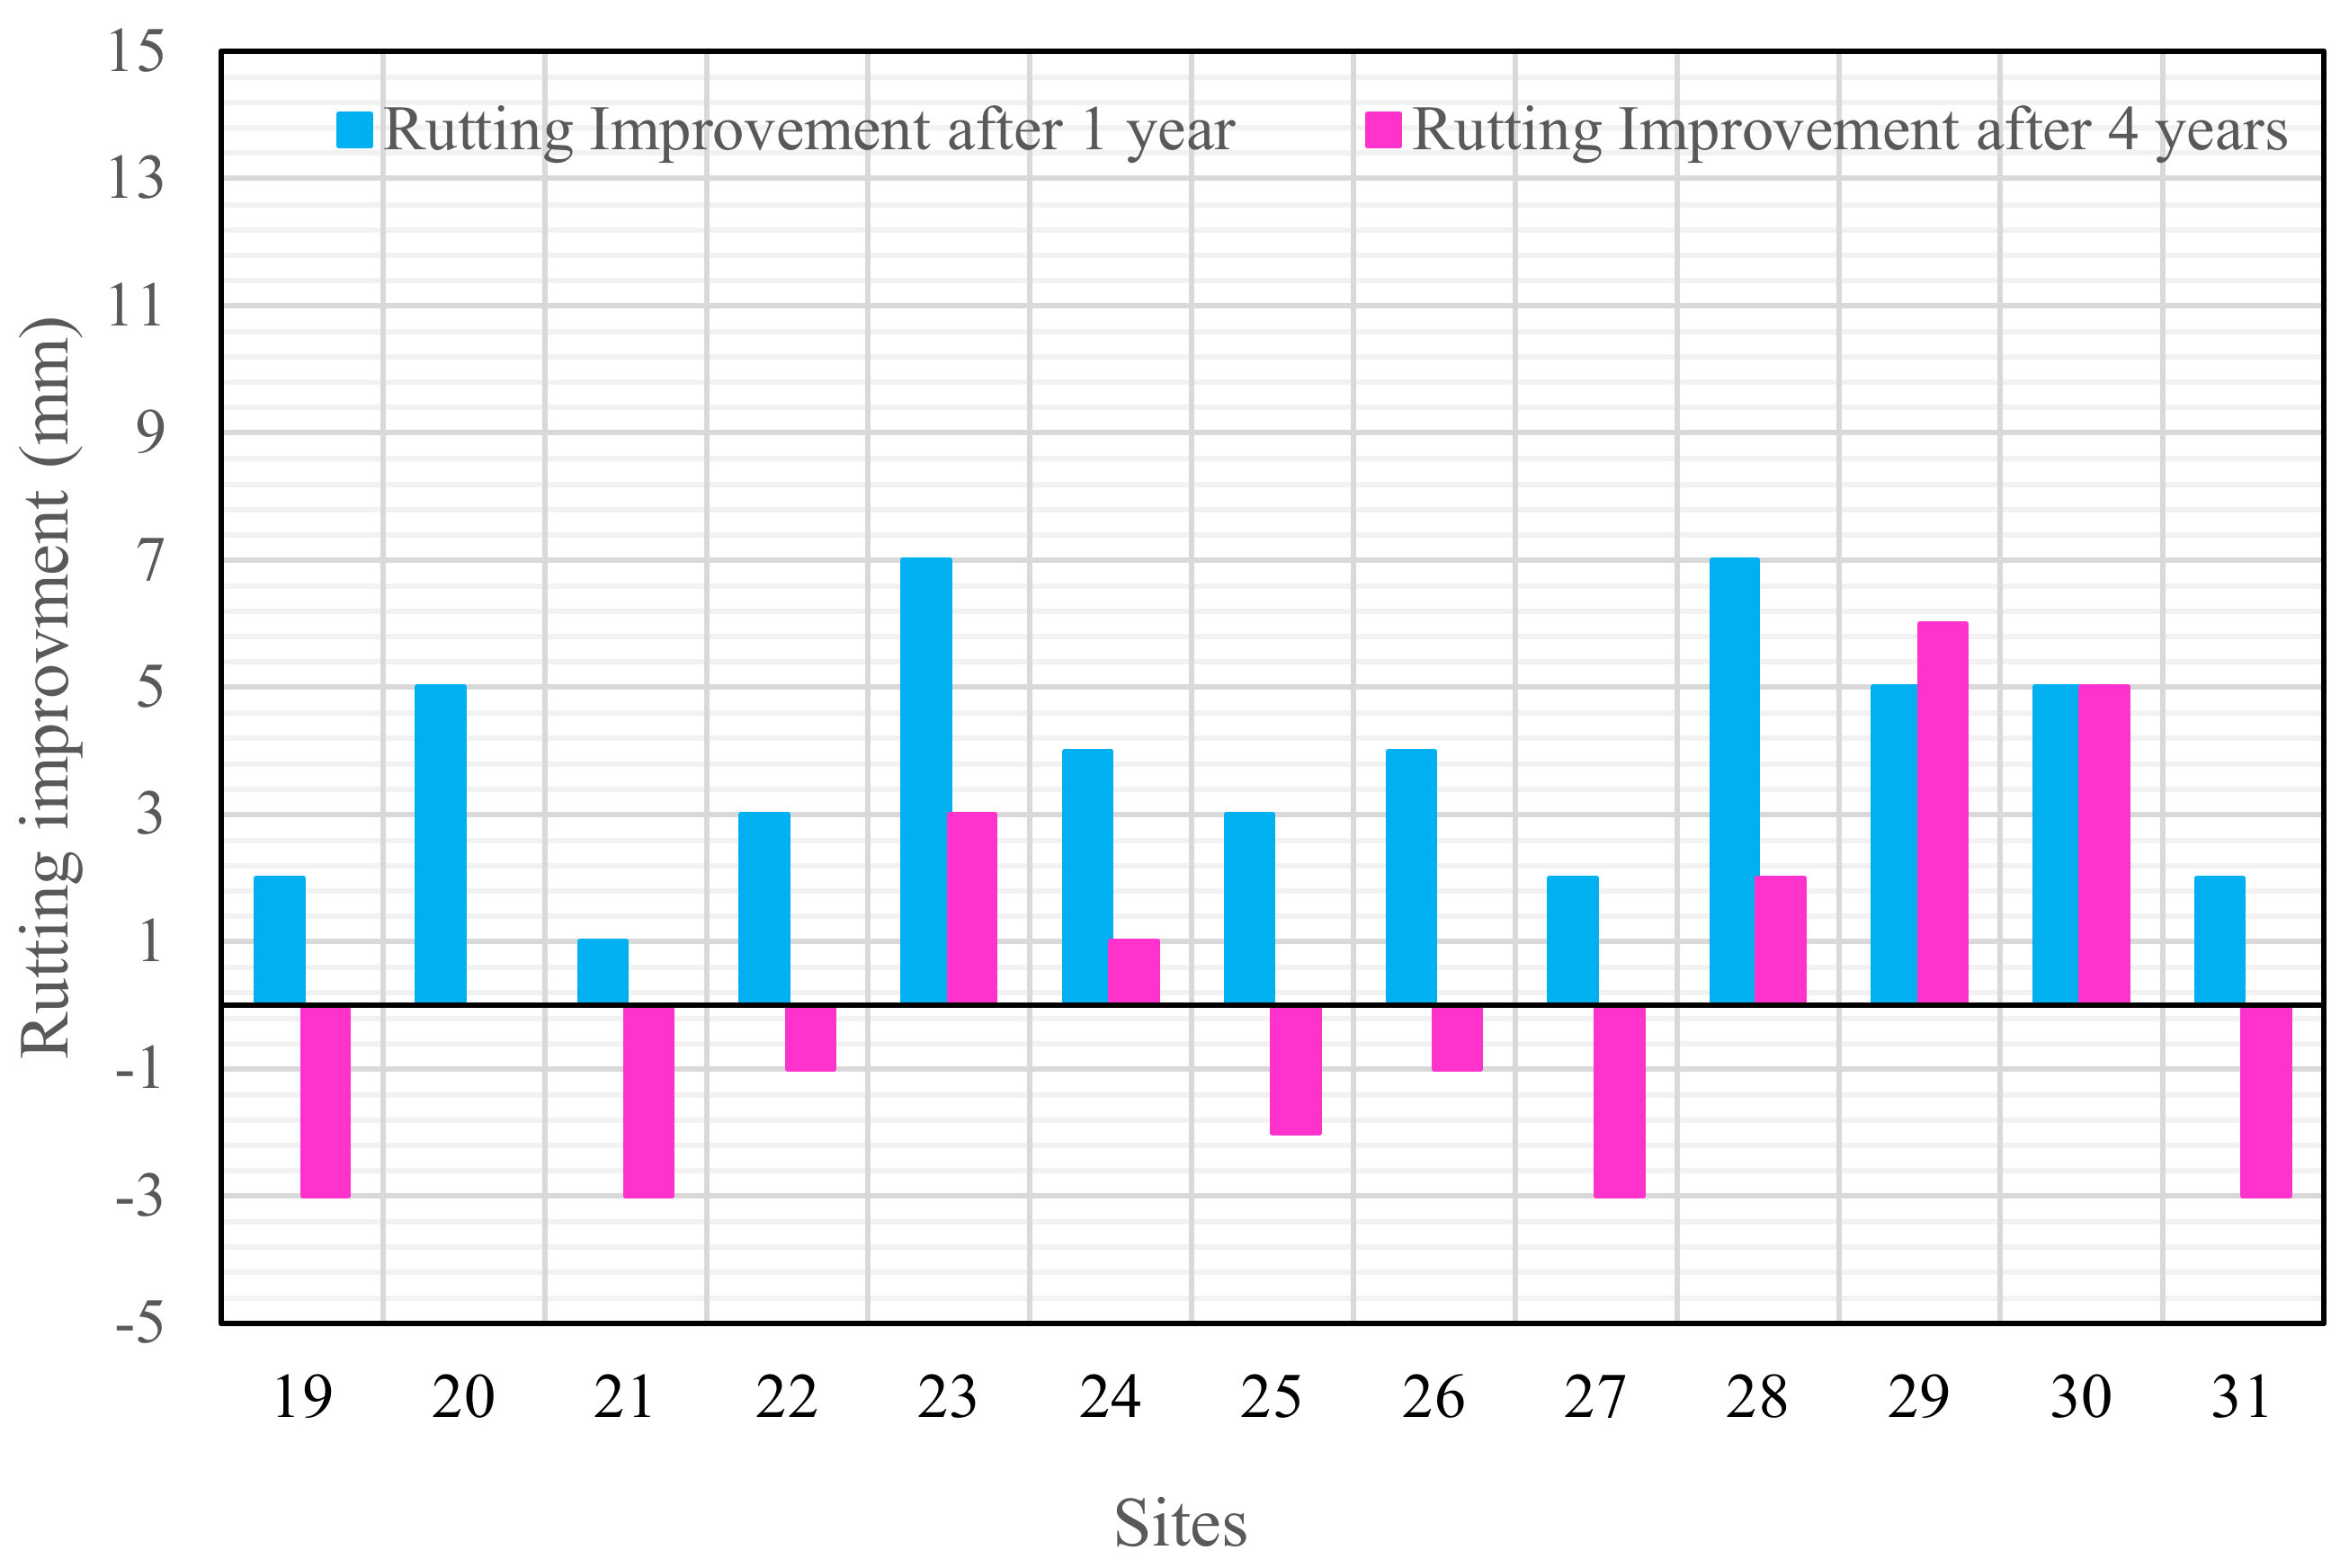
Figure 3 shows the rutting resistance potential of 13 sites in wet climates, including four sites without RAP and nine WMA sites containing 12%, 17%, 19%, 20%, 25%, 34%, and 36% RAP with different binder percentages. As can be clearly seen from
Figure 3, the effects of RAP and binder percentages in wet areas were quite different to those in dry areas. This difference may be due to the freeze–thaw cycle that occurs in wet regions. It can be seen from
Figure 3 that sites 19, 21, 27 and 31 with 25%, 25%, 17% and 20% RAP and 4%, 3.8%, 3% and 5.2% binder, respectively, have negative values.
Figure 3 also shows that the most effective contents of RAP and binder for improving rutting in wet areas were 12% and 3.7%, respectively. The improvement was 6 mm at site 29 (AA01 for Oklahoma) after 4 years.
4.2. Effect of WMA Overlay on IRI
Previous research has shown that IRI is one of the main indicators used to judge the optimal timing and costs vs. benefits of preventive maintenance [
20,
21]. In this study, IRI was evaluated simultaneously with the effects of RAP and binder.
Figure 4 and
Figure 5 show the effect of WMA overlay on IRI improvement after 1 and 4 years from the construction of overlay in dry and wet climates, respectively.
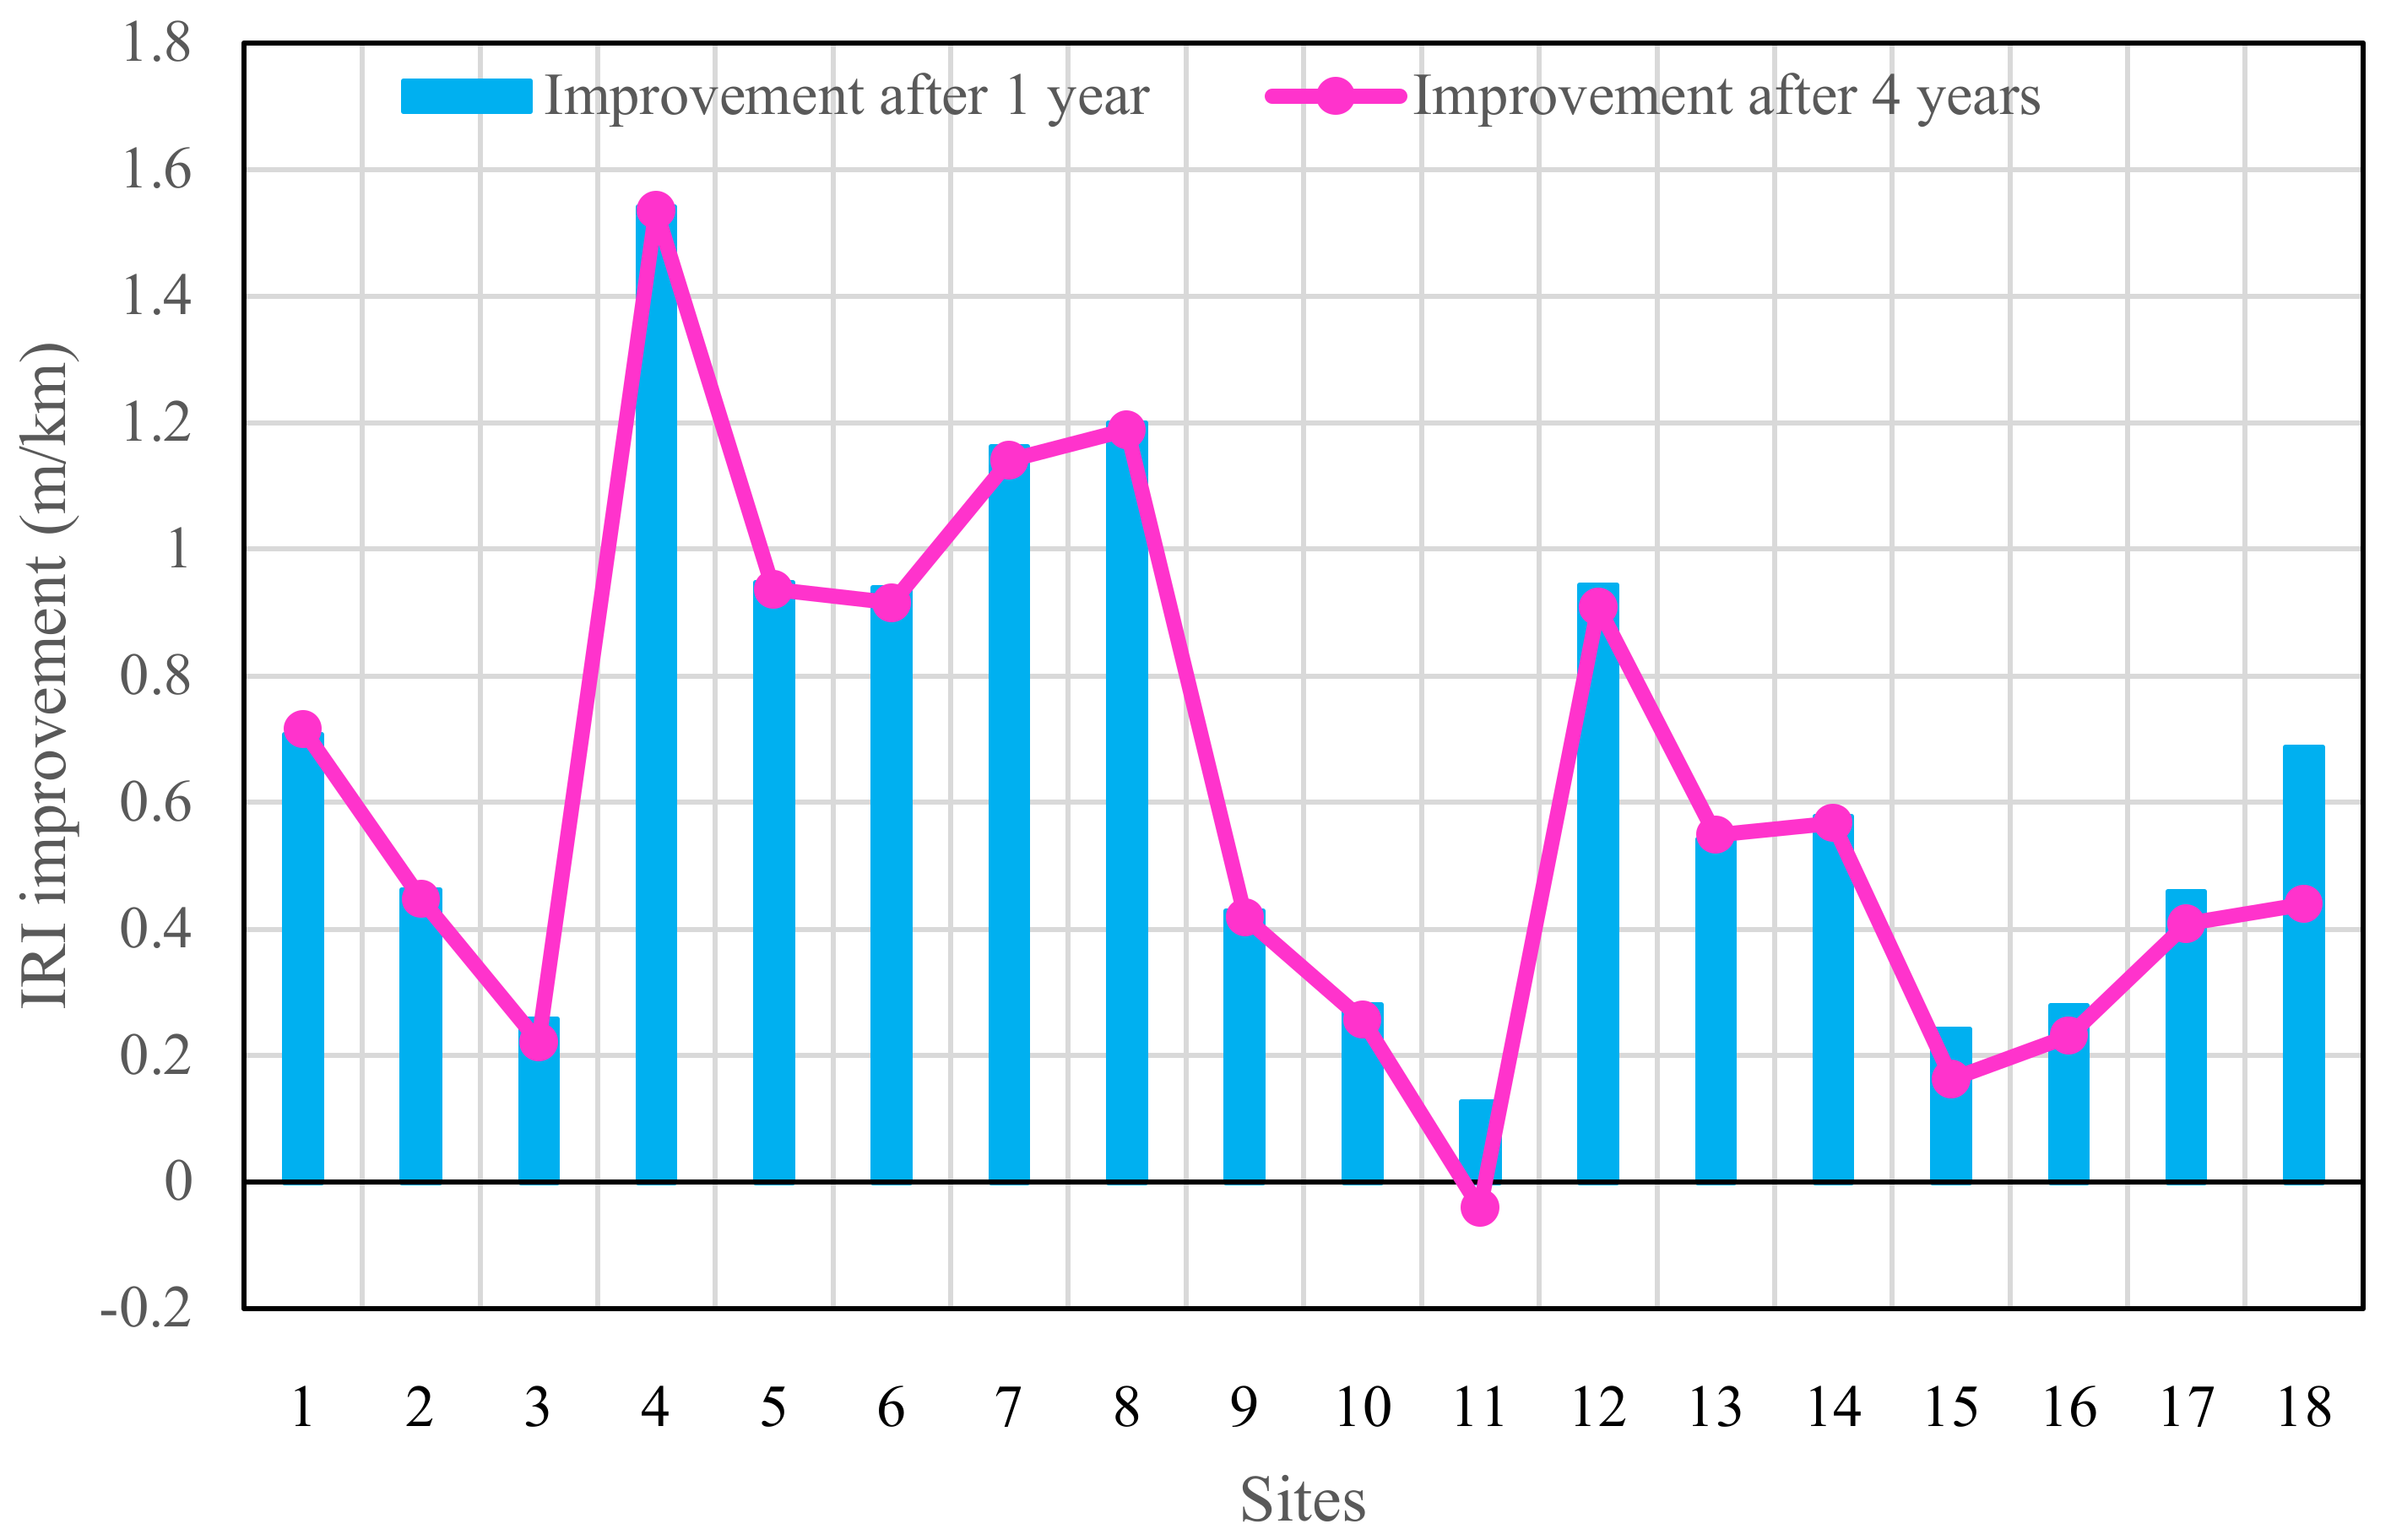
Figure 4 shows that the effect of WMA overlay on IRI improvement in dry conditions after 1 year was about 0.13–1.54 m/km, while after 4 years, it was −0.04 to 1.54 m/km, with the lowest and highest IRI improvements associated with site 11 (AA01 for New Mexico) and site 4 (BA59 for Arizona). Additionally, it can be seen from
Figure 4 that the best IRI improvement in dry regions occurred when 30% RAP and 3.9% binder were added to the mixtures, while the worst performance occurred with RAP and binder contents of 20% and 6%, respectively. In addition, the IRI of the mixtures changed significantly over a relatively short period of time, but this change was less for site 11 than for other sites so that the IRI at site 11 after 4 years decreased from 0.13 to −0.04.
Figure 5 shows the resistance potential of IRI at wet sites. As can be clearly seen from
Figure 3, the effects of RAP and binder content differed between wet and dry areas. This discrepancy may be due to high humidity and frost in areas with wet climates.
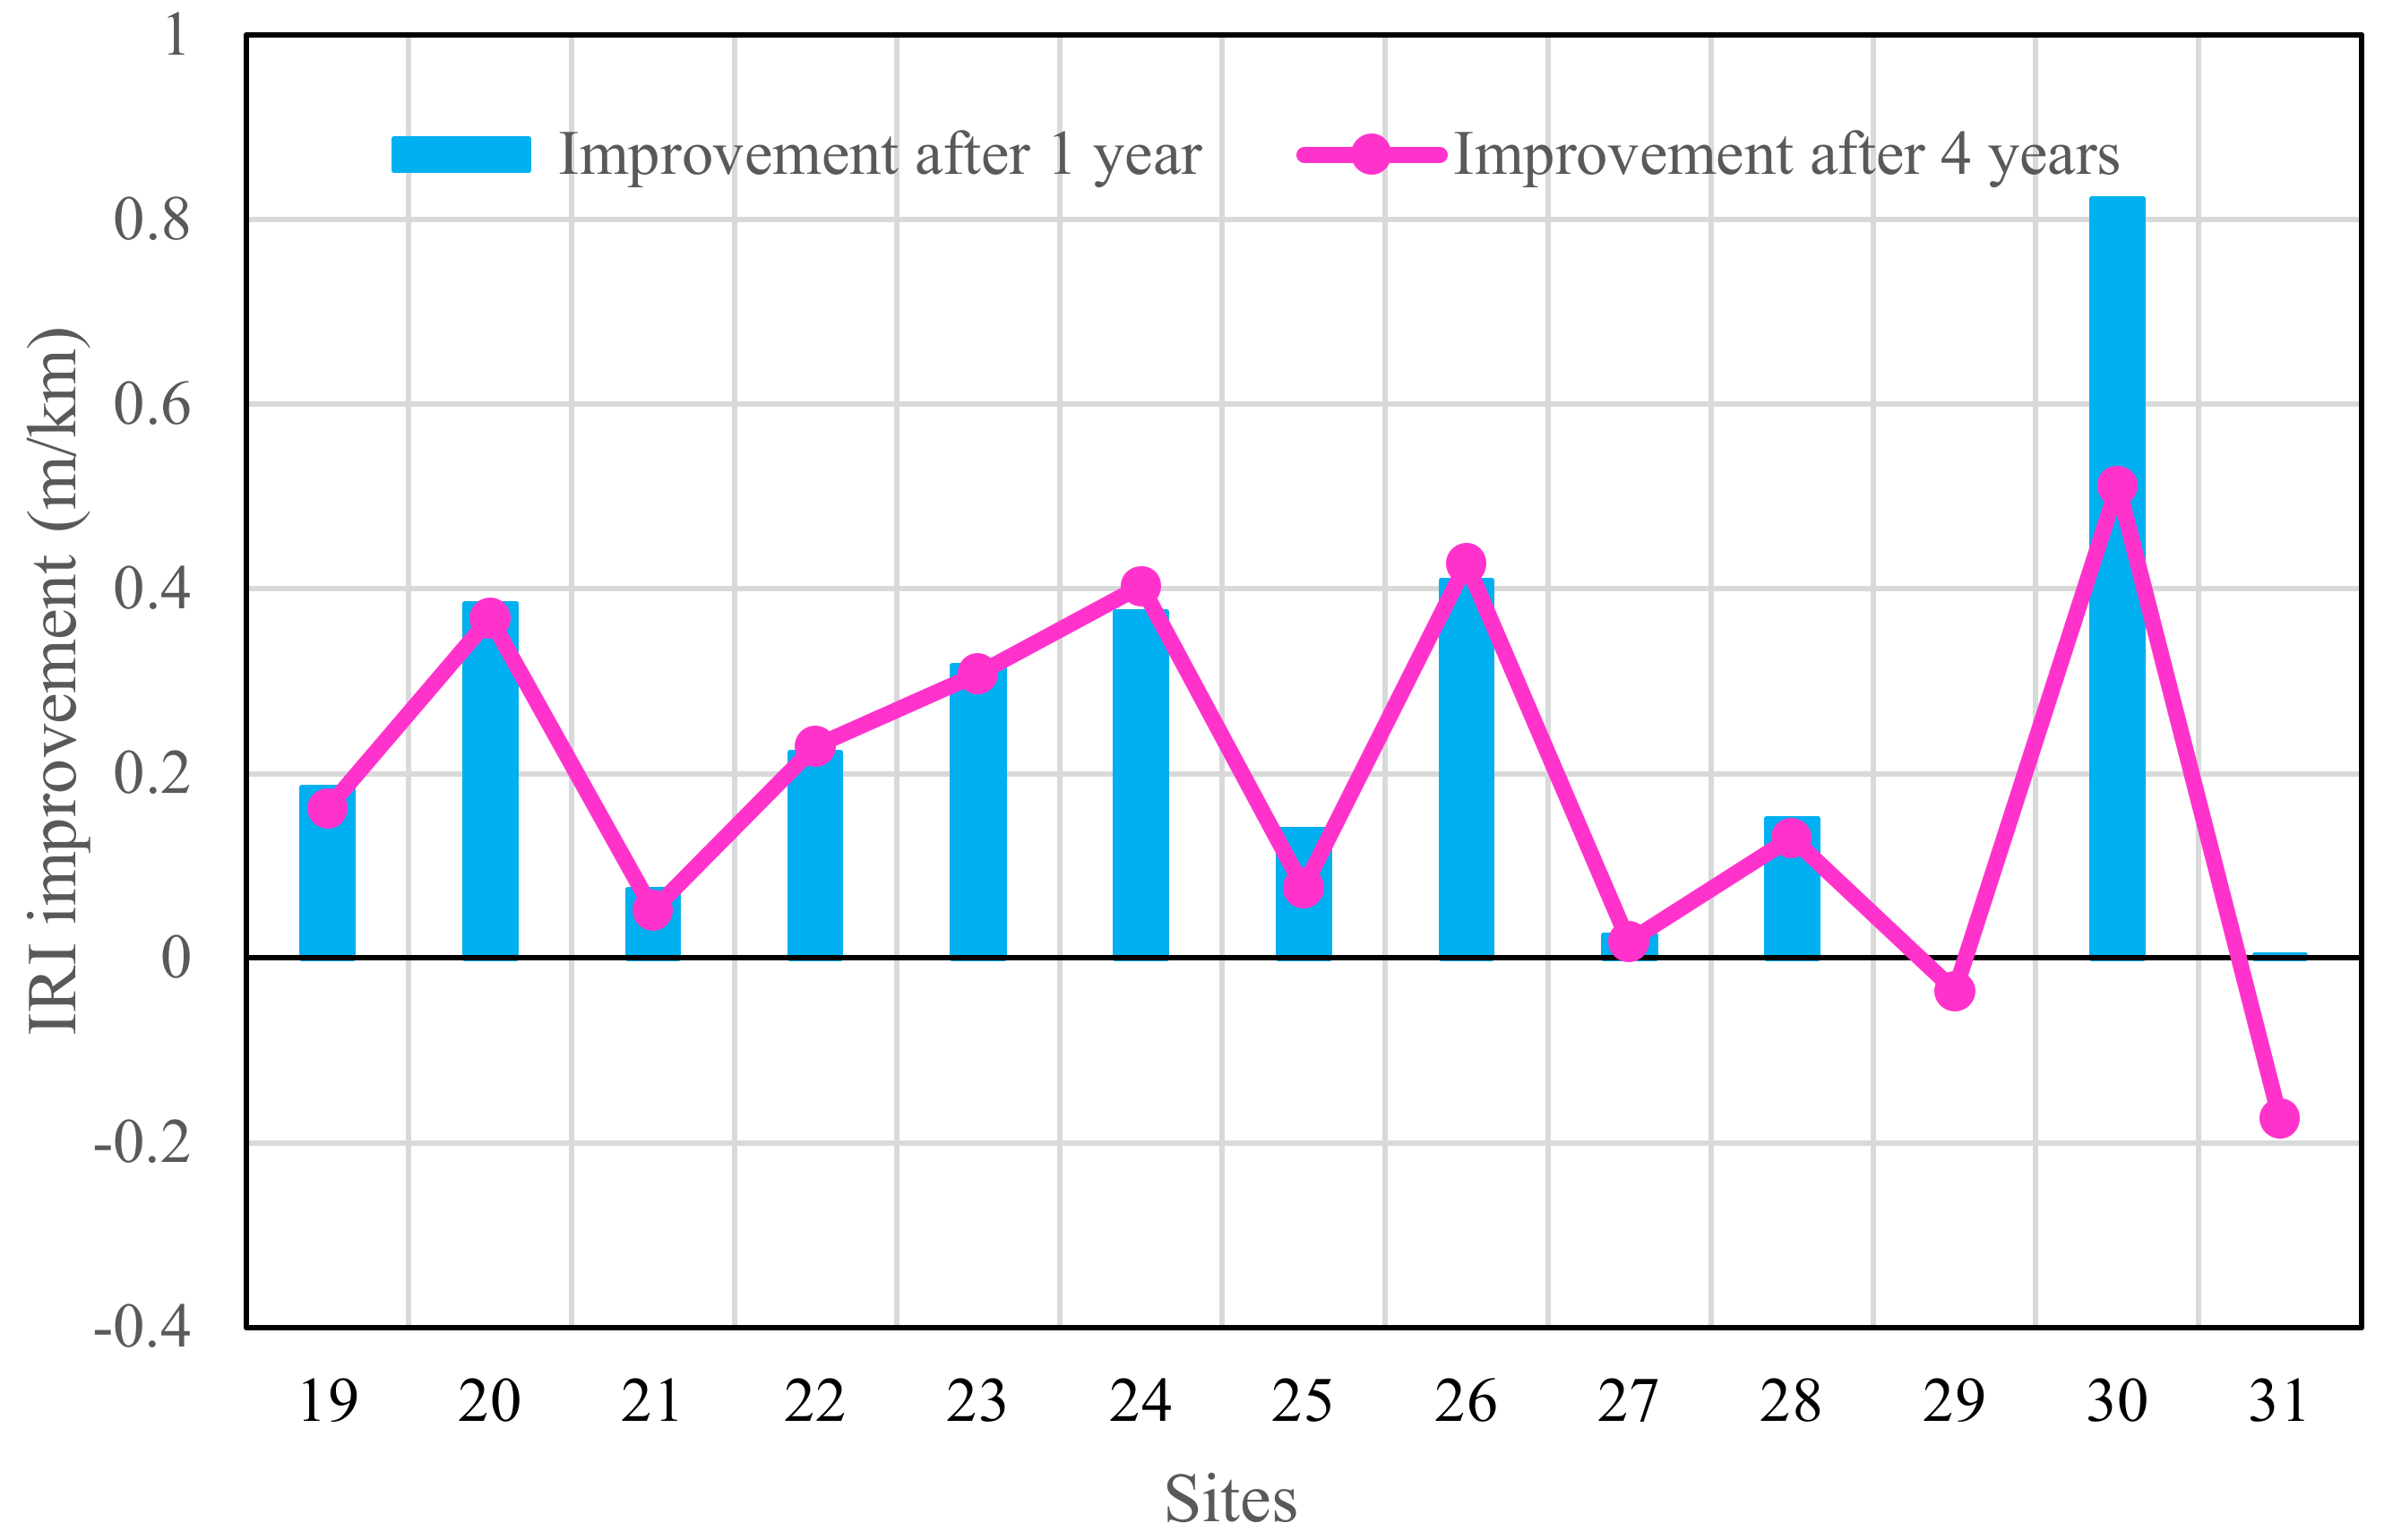
Figure 5 shows that the effect of WMA overlay on IRI improvement in wet regions after 1 year fluctuated between around 0 and −0.82 m/km and, after 4 years, between −0.17 and 0.51 m/km. The highest rate of IRI improvement in wet areas occurred at site 30 (AA63 for Oklahoma). The best IRI improvement in wet sections occurred when only 6.6% binder was used in the mixture. Adding RAP to the mixtures reduced homogeneity and adhesion between the virgin material and RAP, which decreased the IRI value at the sites. In addition,
Figure 5 shows sites 29 and 31, which had 12% and 20% RAP contents and 3.7% and 5.2% binder contents, respectively. The worst IRI performance occurred with RAP and binder contents of 20% and 5.2%, respectively, where the IRI value at site 31 (AA01 for Florida) after 4 years was negative, with its value decreasing to −0.17 m/km.
4.3. Effect of WMA Overlay on Transverse Cracking
The transverse cracking was calculated as the cumulative length of the cracks along the section as listed in
Table 1.
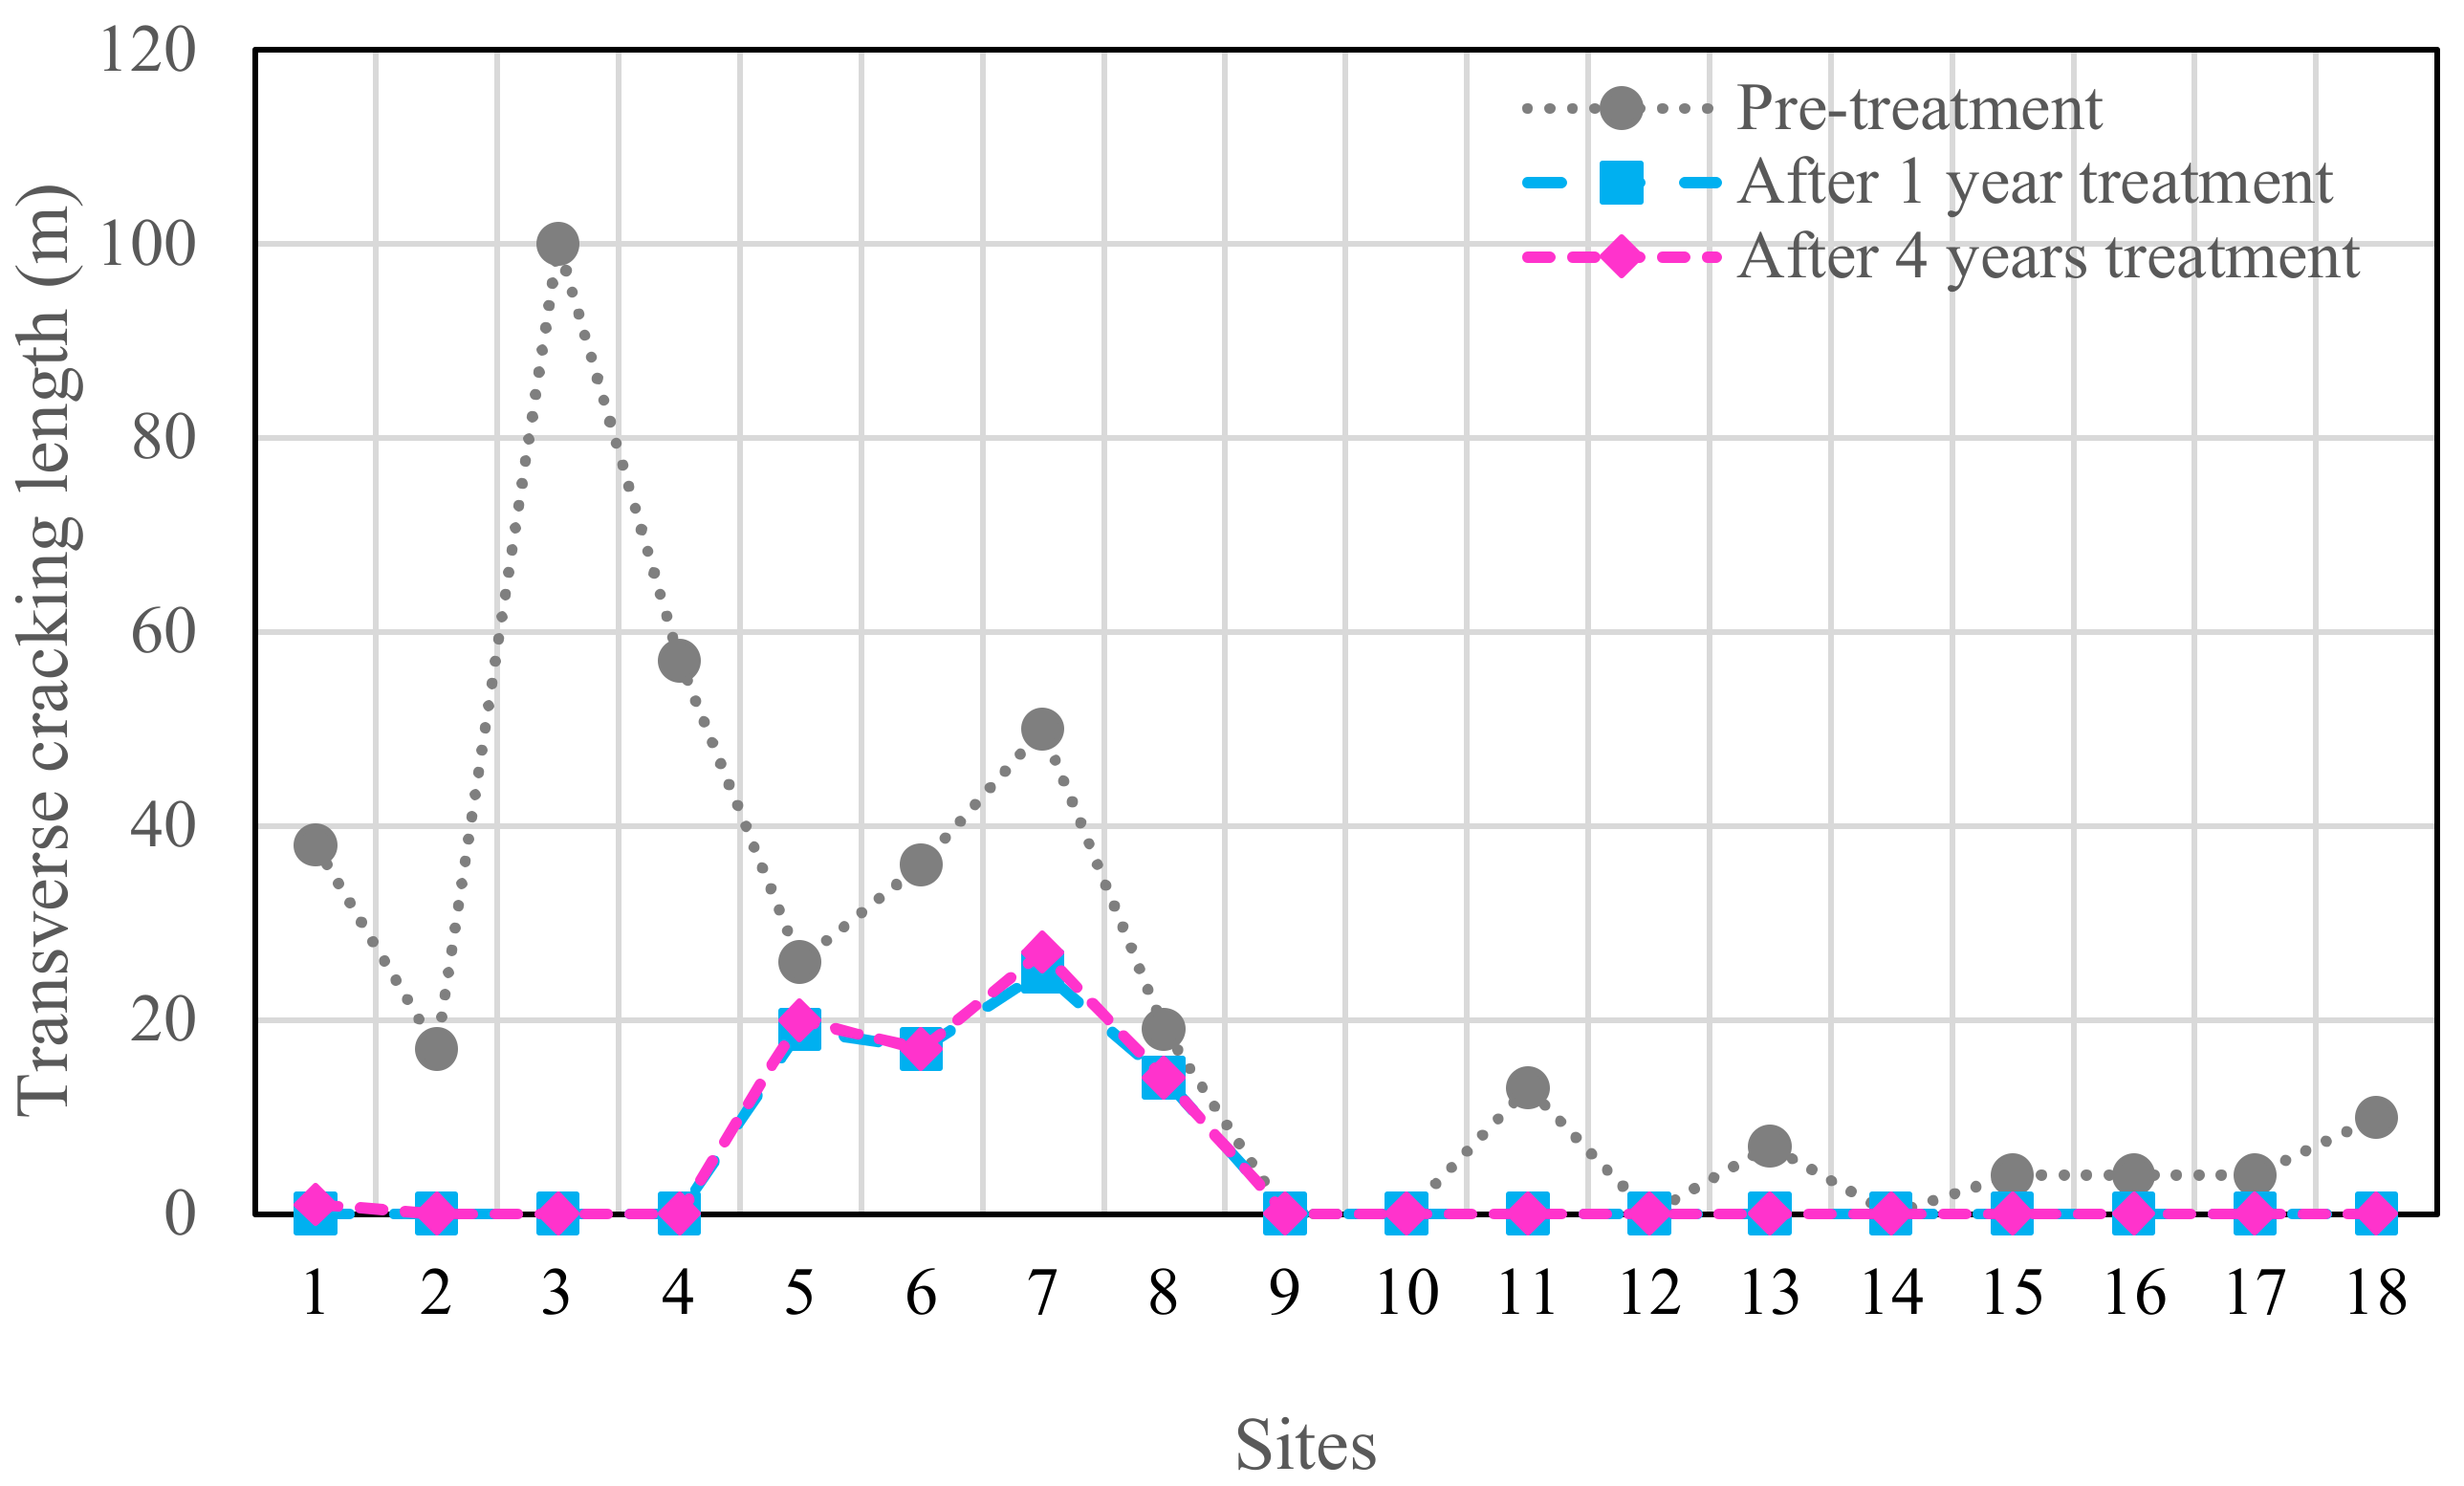
Figure 6 shows the effectiveness of WMA overlays containing RAP on the length of transverse cracks at dry sites by comparing pre-treatment and post-treatment observations. It can be seen from
Figure 6 that the length of transverse cracks at each site (except site 3) before treatment was less than 60 m, while after 1 and 4 years of overlay construction, the total length decreased considerably. In addition, according to
Figure 6, the improvement of the WMA overlay is almost the same at each site after 1 and 4 years. The addition of RAP to the WMA mixture reduced the length of transverse cracks. The improvement in transverse cracking may be due to the presence of larger wax crystals in the asphalt bitumen that contained RAP, which forms a lattice structure in the asphalt bitumen and improves the stability of the mixture, thus reducing the crack length.
On the other hand, the use of RAP in a WMA mixture reduces heat production and, consequently, increases viscosity, which reduces the length of transverse cracking. The best performance for improving transverse cracking in dry areas occurred with RAP and binder contents of 20% and 4.1%, respectively. Therefore, the highest amount of transverse crack healing was associated with site 3 (BA01 for the state of Arizona), so that 4 years after treatment, the transverse crack length decreased from 100 m to 0 m.
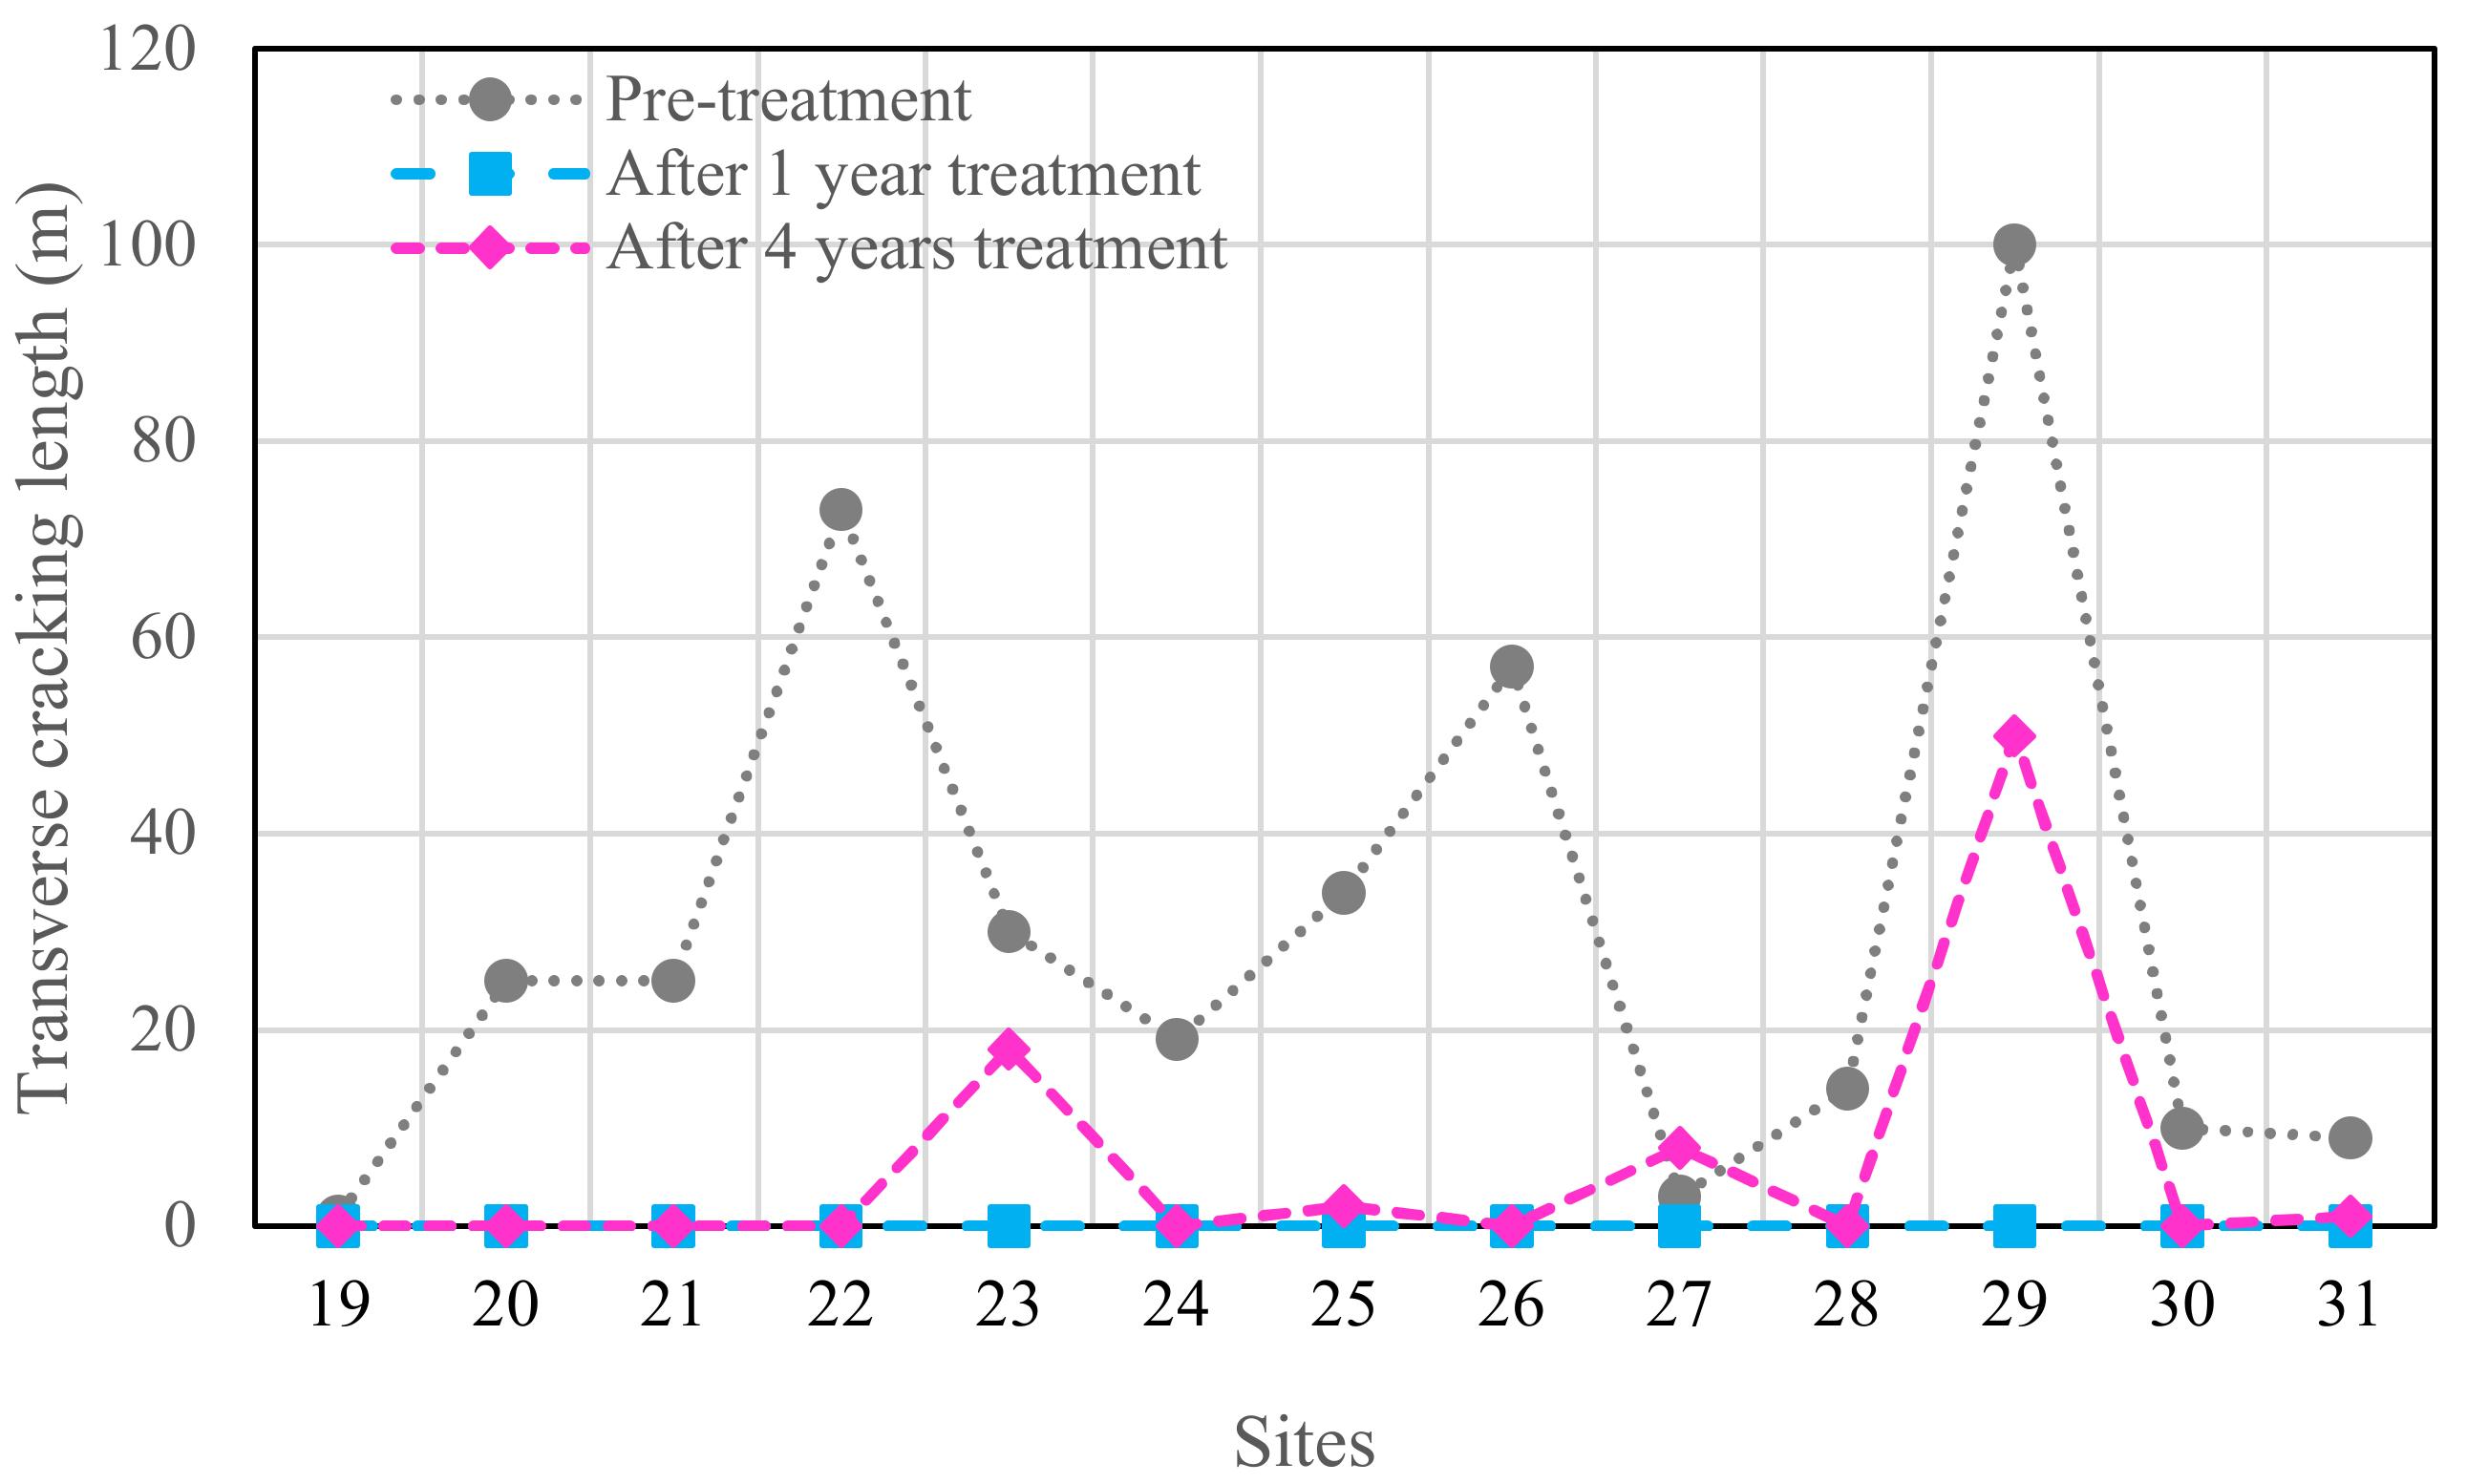
Figure 7 compares the pre- and post-treatment transverse crack lengths in wet cli-mates. The initial impression is that the WMA overlay containing RAP at all wet sites can eliminate transverse cracking 1 year post-treatment. Therefore, the best amount of RAP and binder cannot be recommended for mixtures after 1 year in wet areas. For long-term evaluation, the results in
Figure 7 demonstrate that the greatest amount of transverse crack recovery was at site 22 (AA61 for Missouri) because it had a greater reduction in crack length than other sites 4 years post-treatment; its transverse cracking length decreased from 73 m to 0 m. Therefore, the most effective RAP and binder contents for improving transverse cracking in wet weather are 0% and 5.4%, respectively. Transverse cracking is also named thermal cracking because it is caused by moisture that penetrates the layers during freeze–thaw cycling. Adding RAP to a mixture can make it vulnerable due to reductions in homogeneity and adhesion. In addition, compared to the pre-treatment case, the cracking length at site 27 (AA66 for Missouri; wet area) increased 2.7-fold at 4 years post-treatment, from 3 m to 8 m. Therefore, the worst performance was for site 27 with RAP and binder contents of 17% and 3%, respectively.
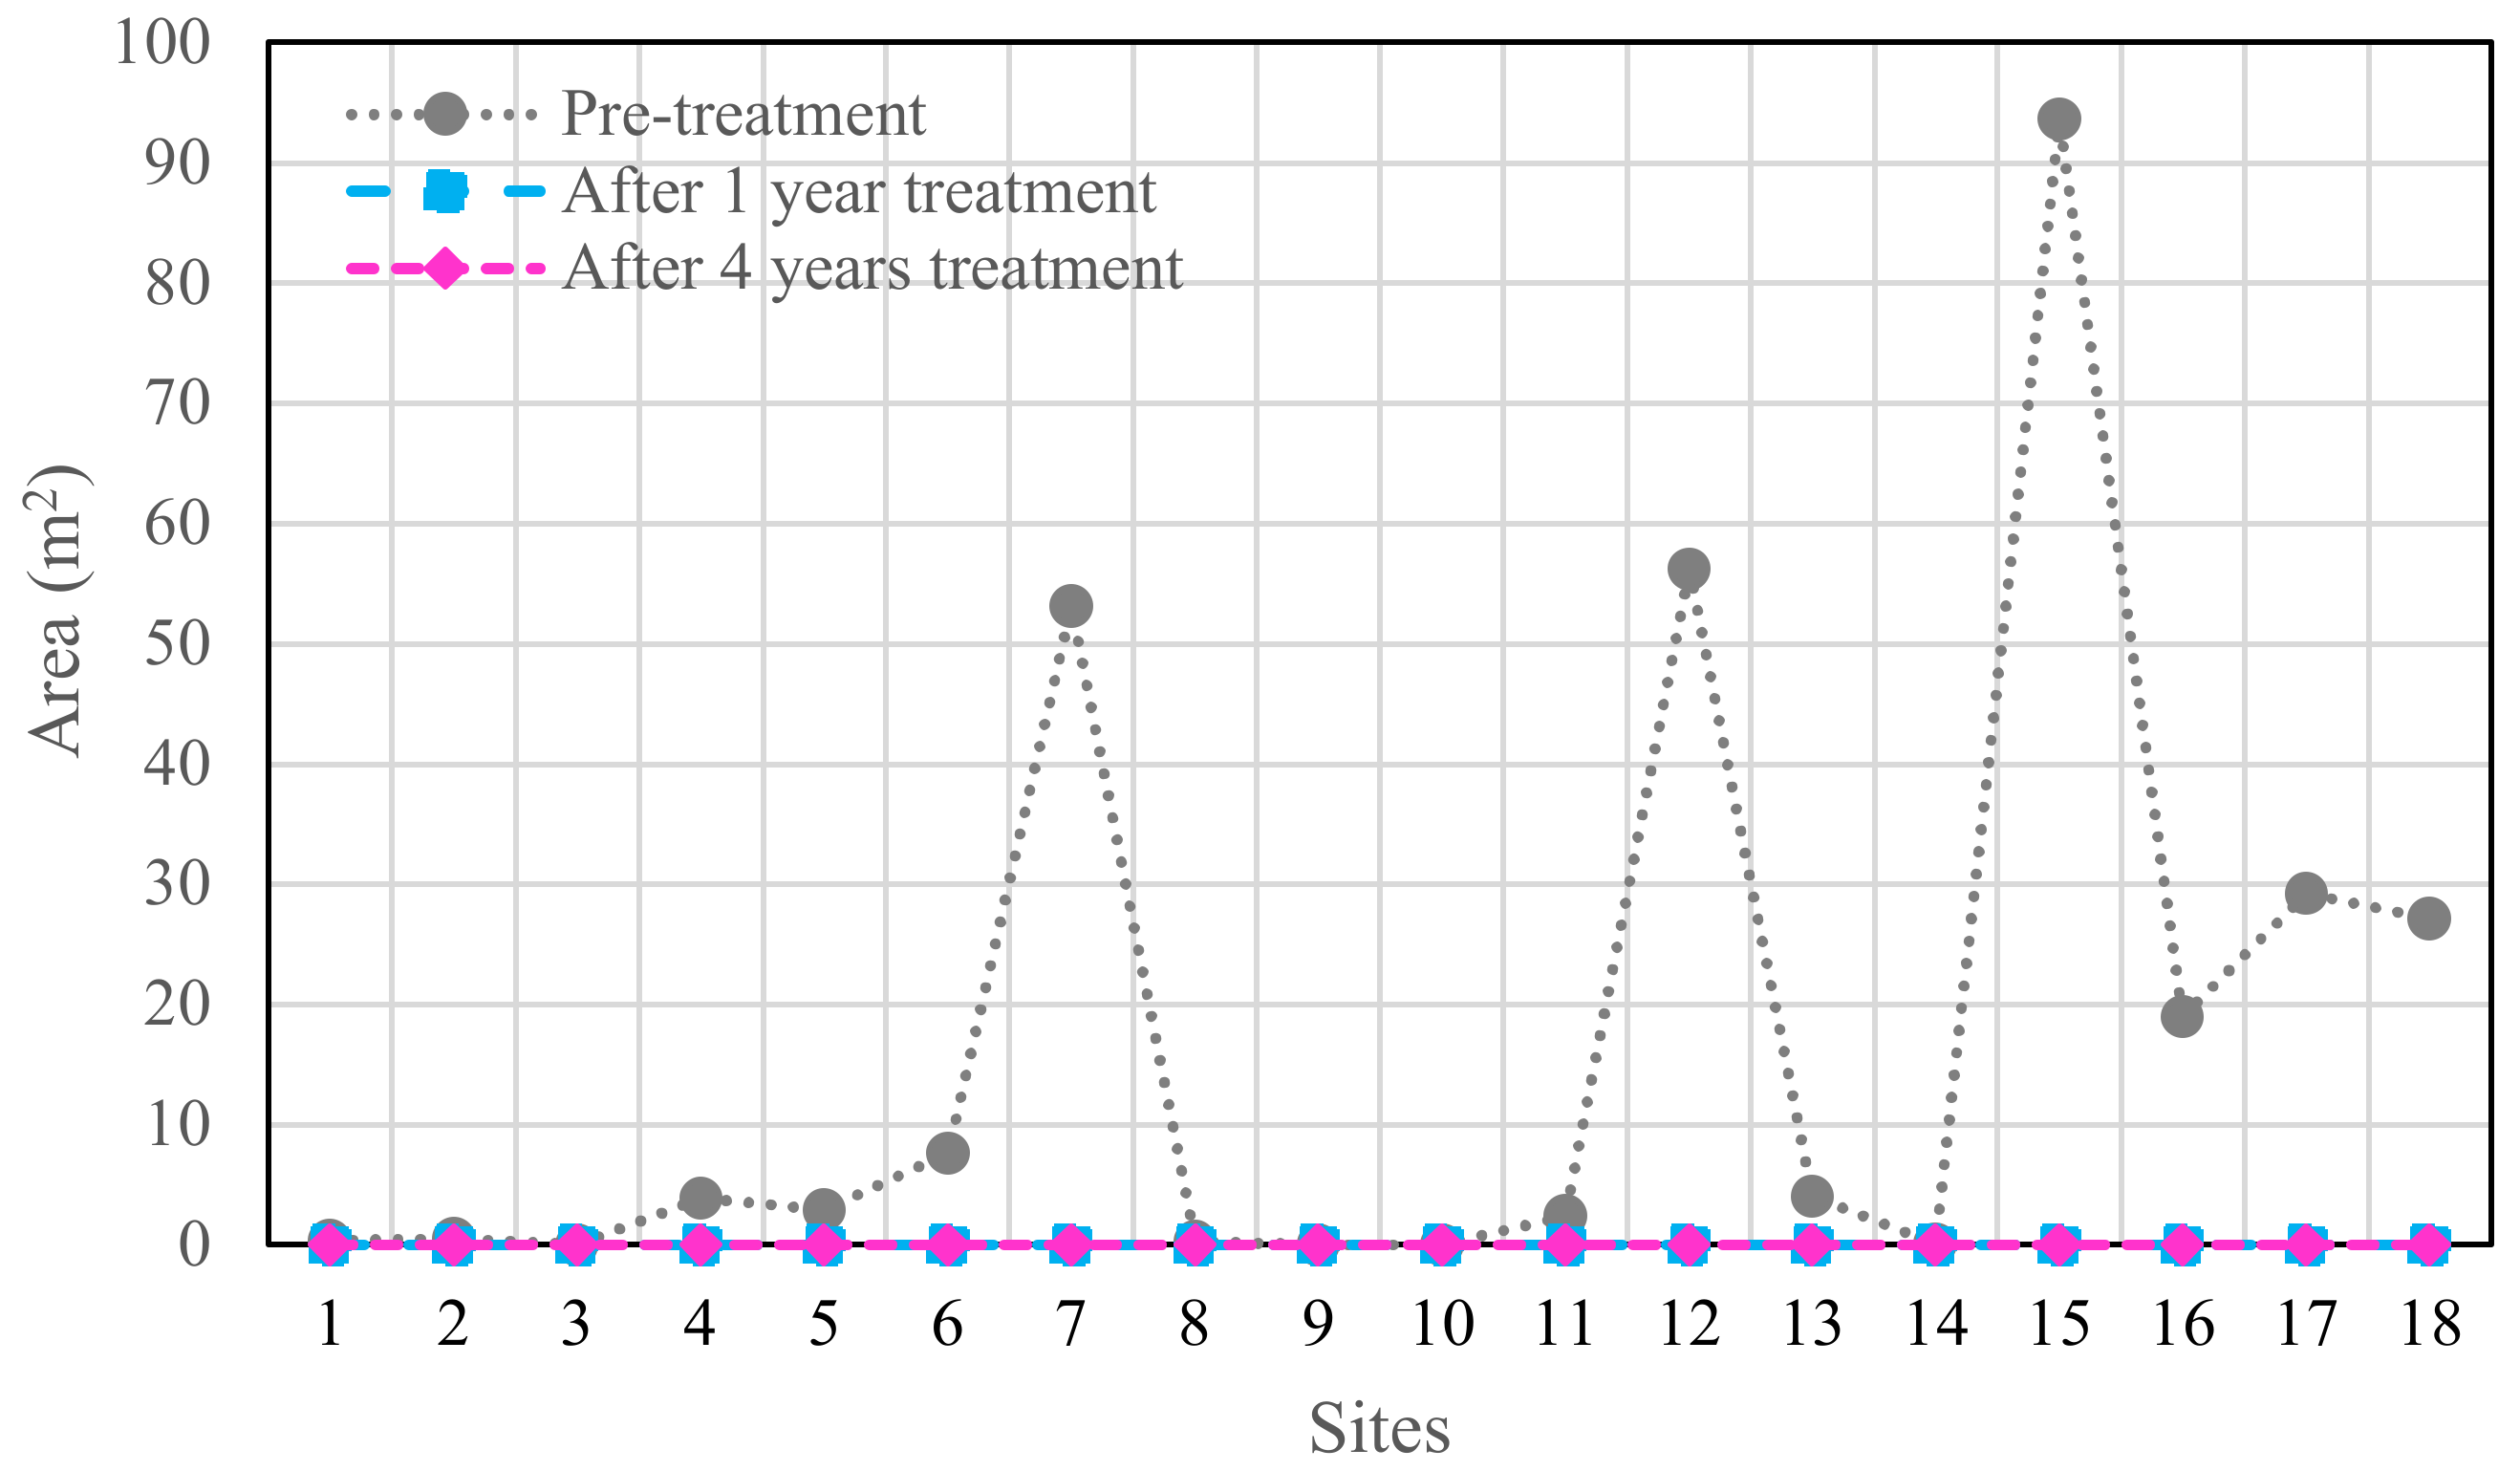
4.4. Effect of WMA Overlay on Alligator Cracking
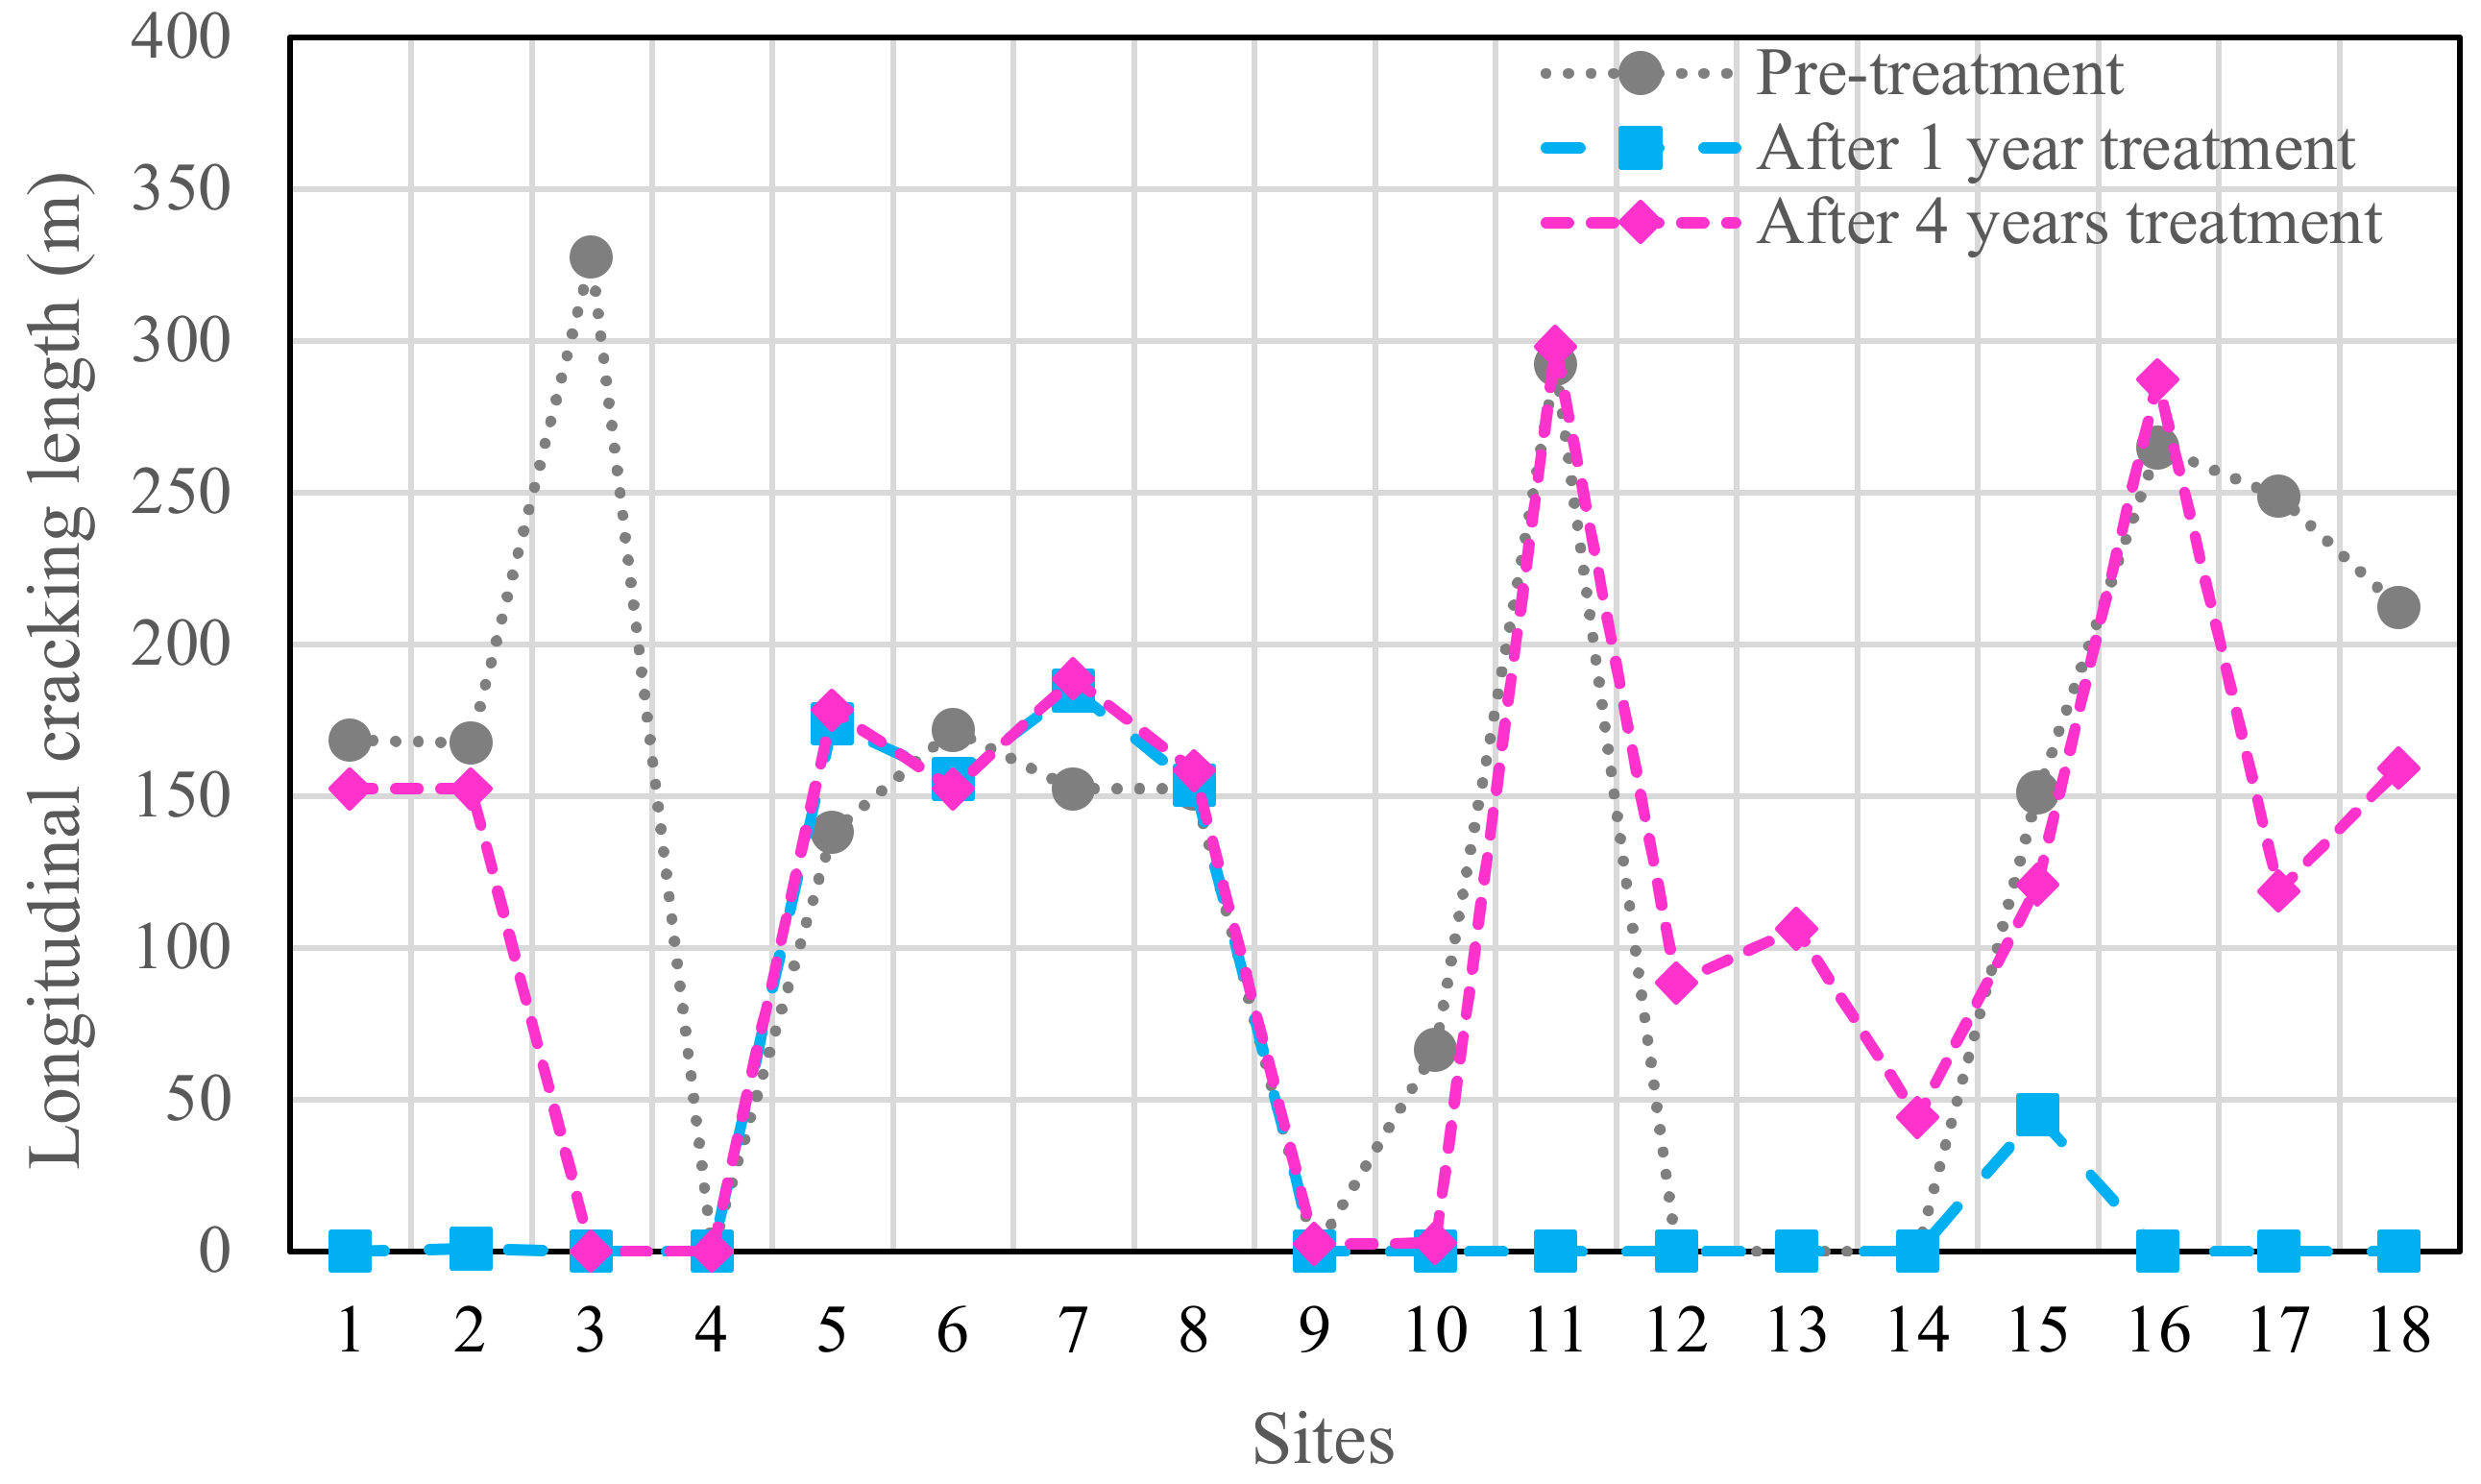
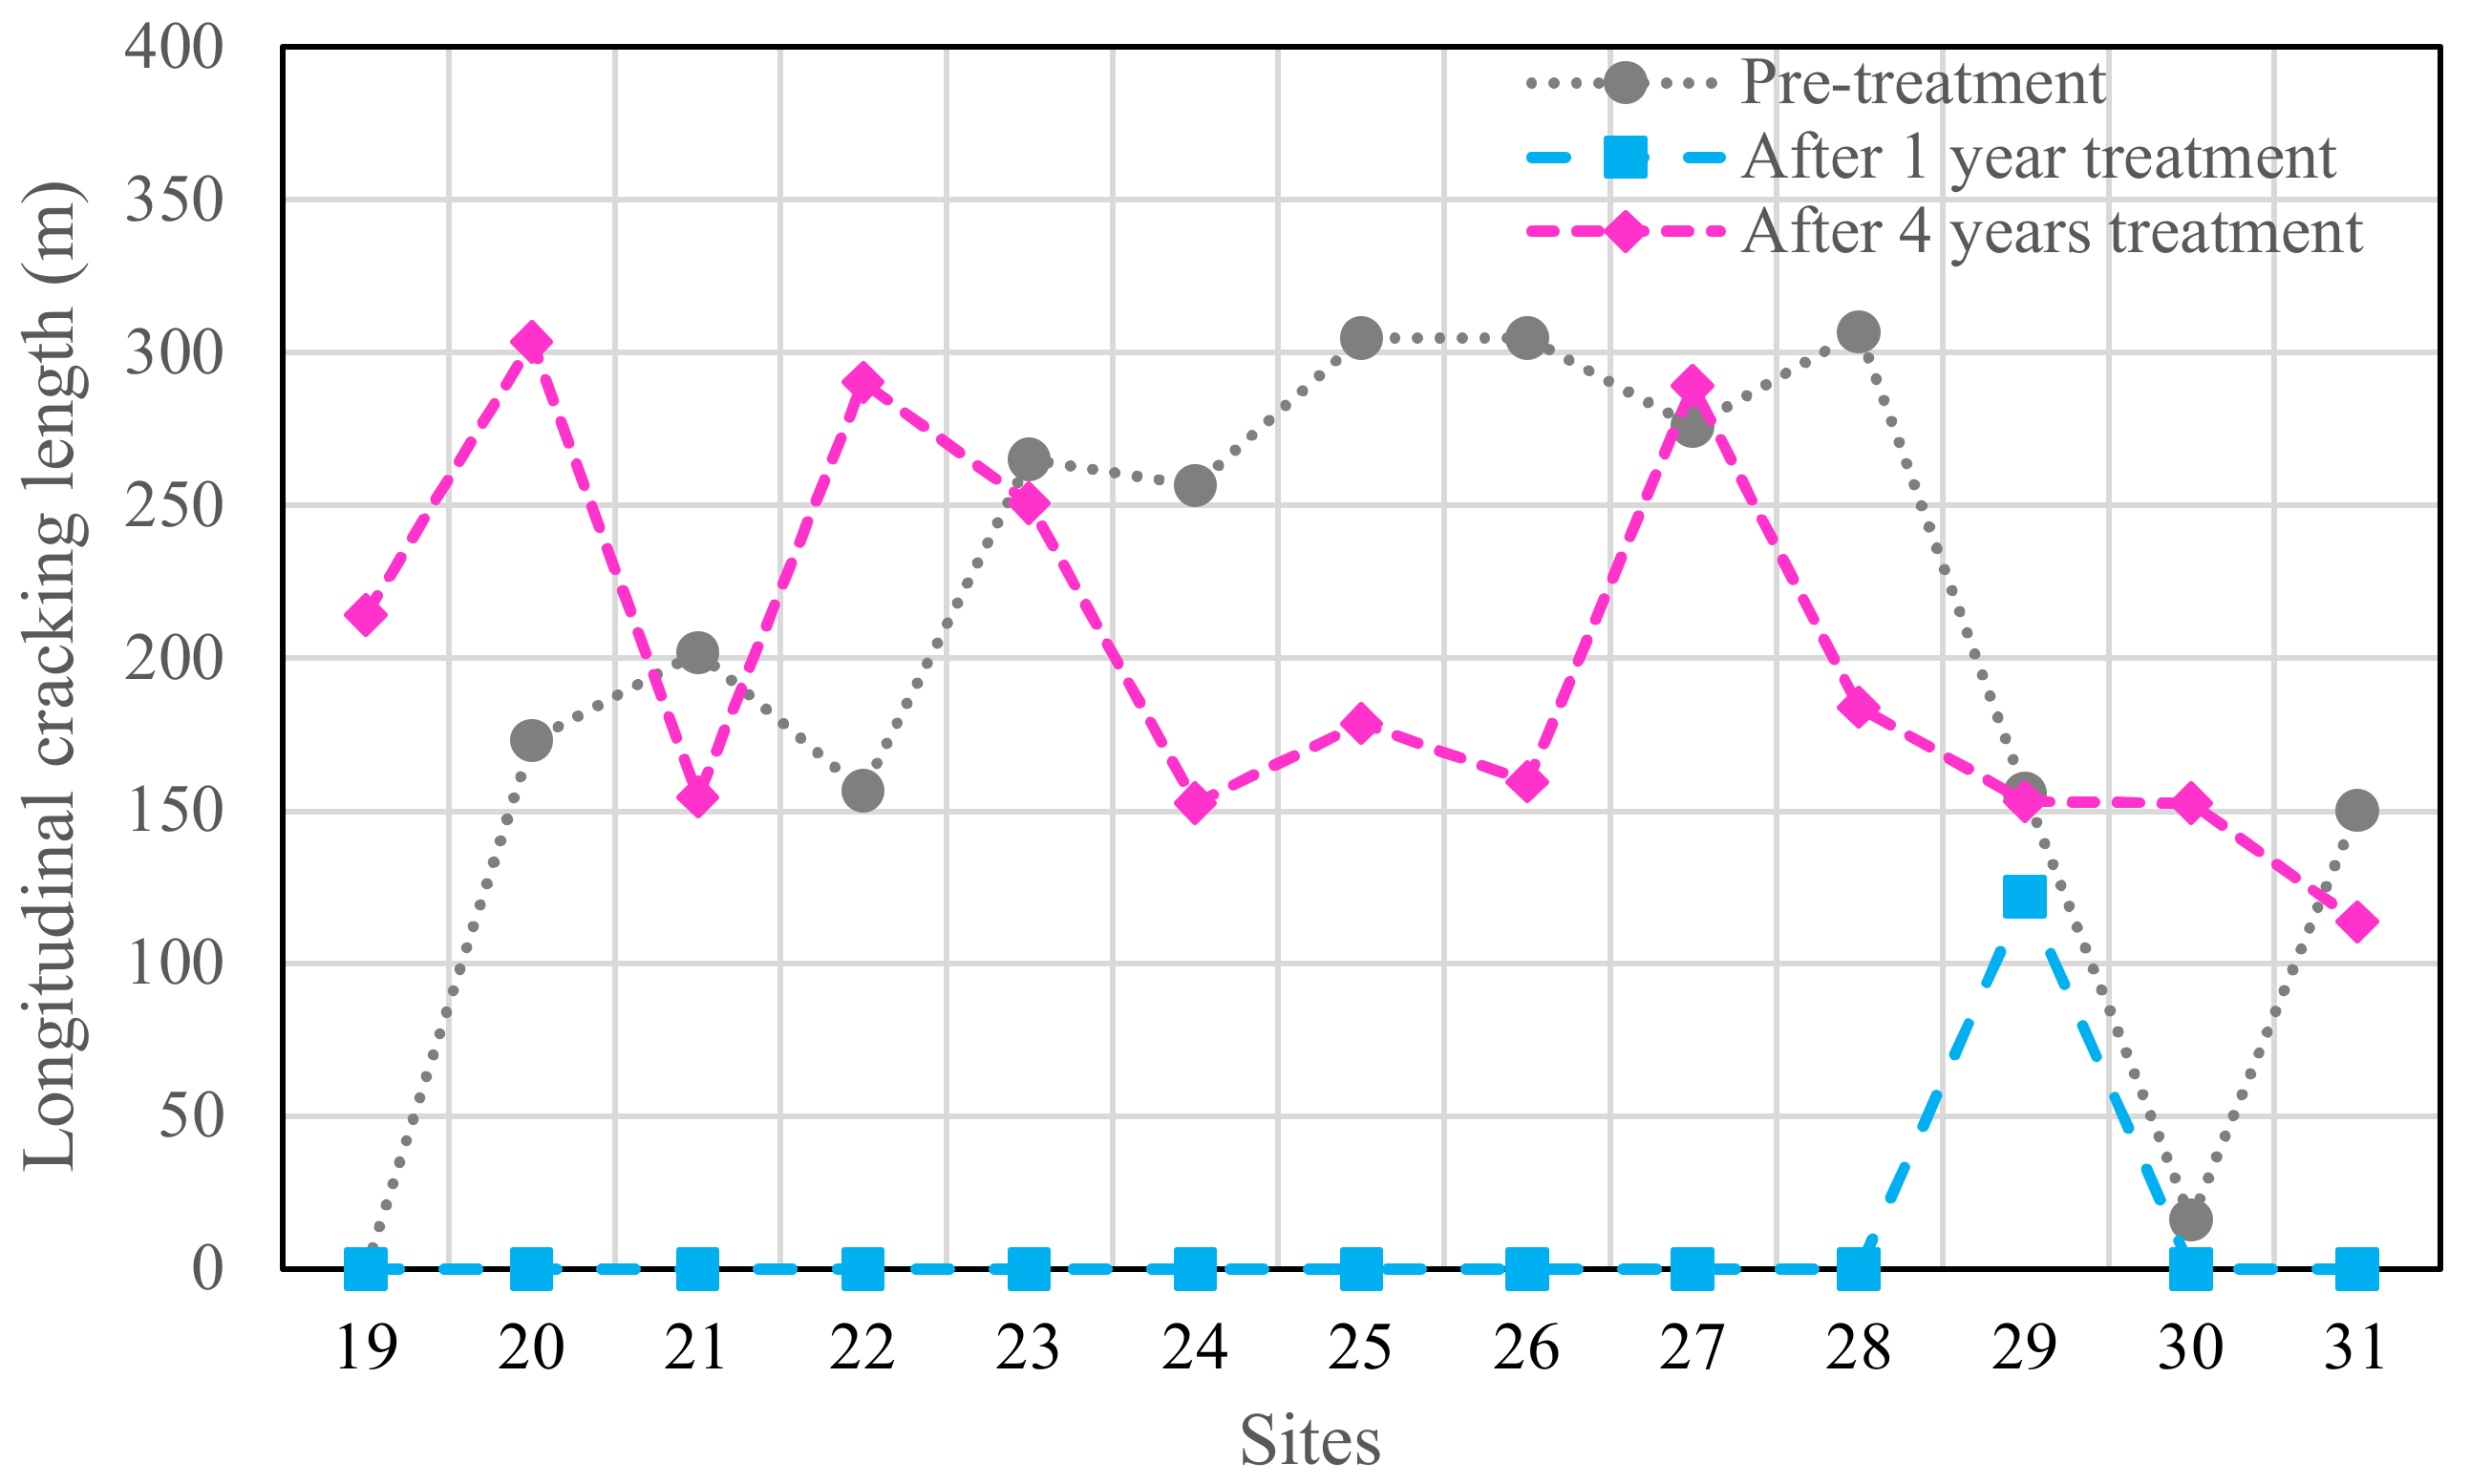
Figure 8 shows the effect of WMA overlay on longitudinal cracking in dry locations. It shows that there were no longitudinal cracks after one year of WMA overlay, but after 4 years of WMA overlay, the length of longitudinal cracks changed significantly. The best improvement in longitudinal cracking in dry regions occurred with RAP and binder contents of 20% and 4.1%, respectively. Therefore, the maximum amount of longitudinal crack healing was at site 3 (BA01 for Arizona) where, 4 years after treatment, the crack healing length was 327.5 m. In addition, as can be seen from
Figure 8, the cracking length at site 13 (AA59 for Oregon; dry area) increased significantly 4 years after treatment compared to before treatment, from 0 m to 106 m. Hence, the worst performance was at site 13, with RAP and binder contents of 25% and 5.4%, respectively.
Figure 9 shows the pre- and post-treatment longitudinal cracking lengths in wet climates.
Figure 9 shows that the WMA overlay containing RAP at all wet sites (except site 29) eliminated longitudinal cracking 1 year post-treatment, whereas 4 years after treatment, the effect of WMA overlay did not follow any specific pattern. For long-term evaluation, the results in
Figure 9 show that the greatest improvement in longitudinal crack was at site 26 (AA65 for Missouri), because the reduction in crack length was more than at other sites, with a decrease from 304.8 m to 159.6 m. Hence, the best performance was at site 26 with RAP and binder contents of 36.6% and 3.6%, respectively. Moreover, at site 19 (AA01 for Missouri; wet region), the crack length increased from 0 m to 214 m 4 years post-treatment. So, the worst performance occurred at site 19 with RAP and binder contents of 25% and 40%, respectively.
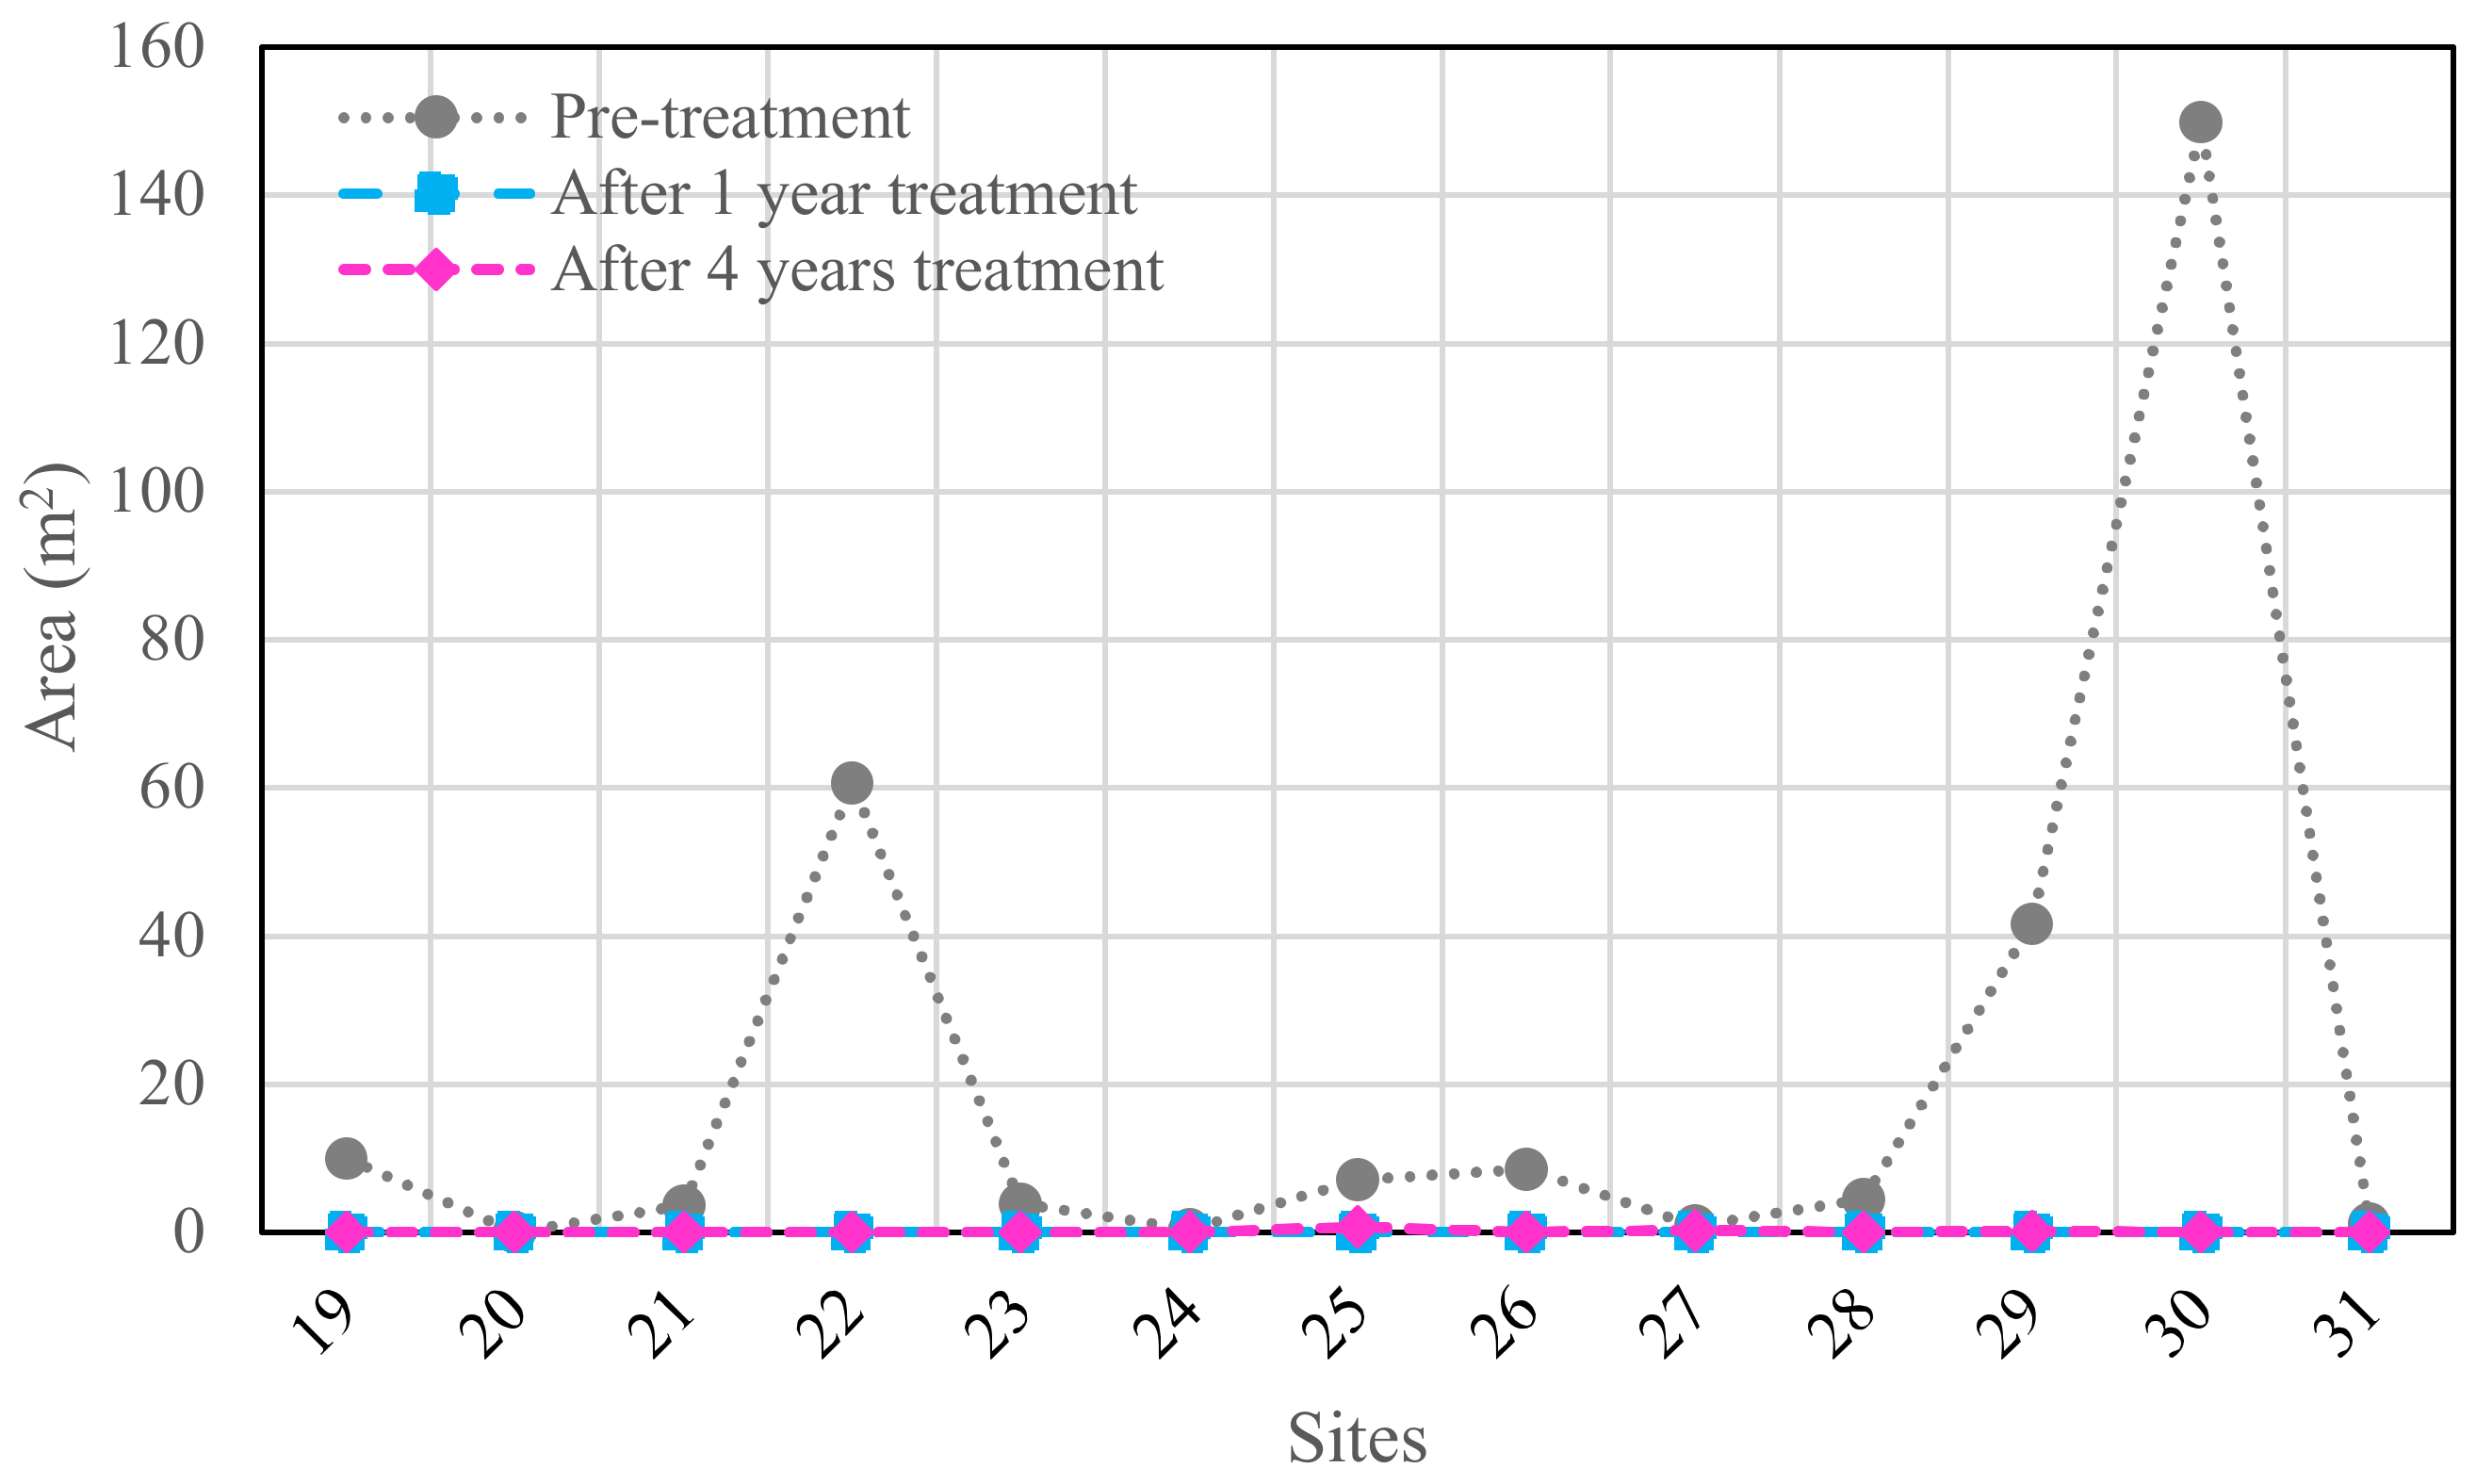
4.5. Effect of WMA Overlay on Longitudinal Cracking
Figure 10 shows the effectiveness of WMA overlay on alligator cracking in dry climates sites after treatment. It shows that alligator cracking did not occur at 1 and 4 years post-treatment. The greatest improvement in the total area of alligator cracks was at site 15 (AA01 for Washington state) because the reduction in crack area at this site was greater than at other sites. Four years post-treatment, the improvement was 93.6 m
2.
Figure 11 shows the effect of WMA overlay on alligator cracking in wet locations. It shows that WMA overlay containing RAP eliminated alligator cracking at all wet sites 1 year post-treatment. For long-term evaluation, the results in
Figure 11 show that the greatest improvement in the alligator cracking area was 149.8 m
2 at site 30 (AA63 for Oklahoma). Therefore, the best performance in alligator cracking in wet zones occurred at site 30 with RAP and binder contents of 0% and 6.6%, respectively.
5. Optimization
The goal of optimization is to find the best balance between financial constraints, environmental effects, and the needs of a study.
One of the goals of research and statistics is to identify the relationships between in-dependent and dependent variables. If a mathematical model can be used to describe such relationships, then it can be used to predict the trends and maximum and minimum values of a variable of interest.
In a specific study, different answers might be reached, so in order to compare them and select the optimal solution, an objective function is defined, which depends on the nature of the problem.
The response surface methodology (RSM) and neural network method (NNM) are two of the most important methods of data optimization and analysis when there are multiple variables. Among these two methods, the response at level 1 is outstanding due to the ease of presenting the equations related to the responses in terms of several variables and accurate data analysis in order to present the optimal values of the variables.
In this study, several parameters were optimized simultaneously using RSM. This method was used as a basis for finding the best solution, for which the Design-Expert soft-ware was used [
22]. The RSM is commonly used due to its ability to present equations related to the answers in terms of several variables and accurately analyze the data in order to present the optimal values of the variables [
23,
24,
25]. The RSM test program used in this study determined the optimal values of two independent variables: binder (B) content and RAP content. A complete factorial laboratory design was used.
The data were fitted by analysis of variance (ANOVA) with the aim of obtaining a polynomial model based on variables and defined surfaces to determine the improvement in rutting (R), improvement in the International Roughness Index (IRI), the length of transverse cracks (TC), and the length of longitudinal cracks (LC). The fits of the regression model responses for WMA containing RAP are presented in
Table 2 and
Table 3 for dry and wet conditions, respectively.
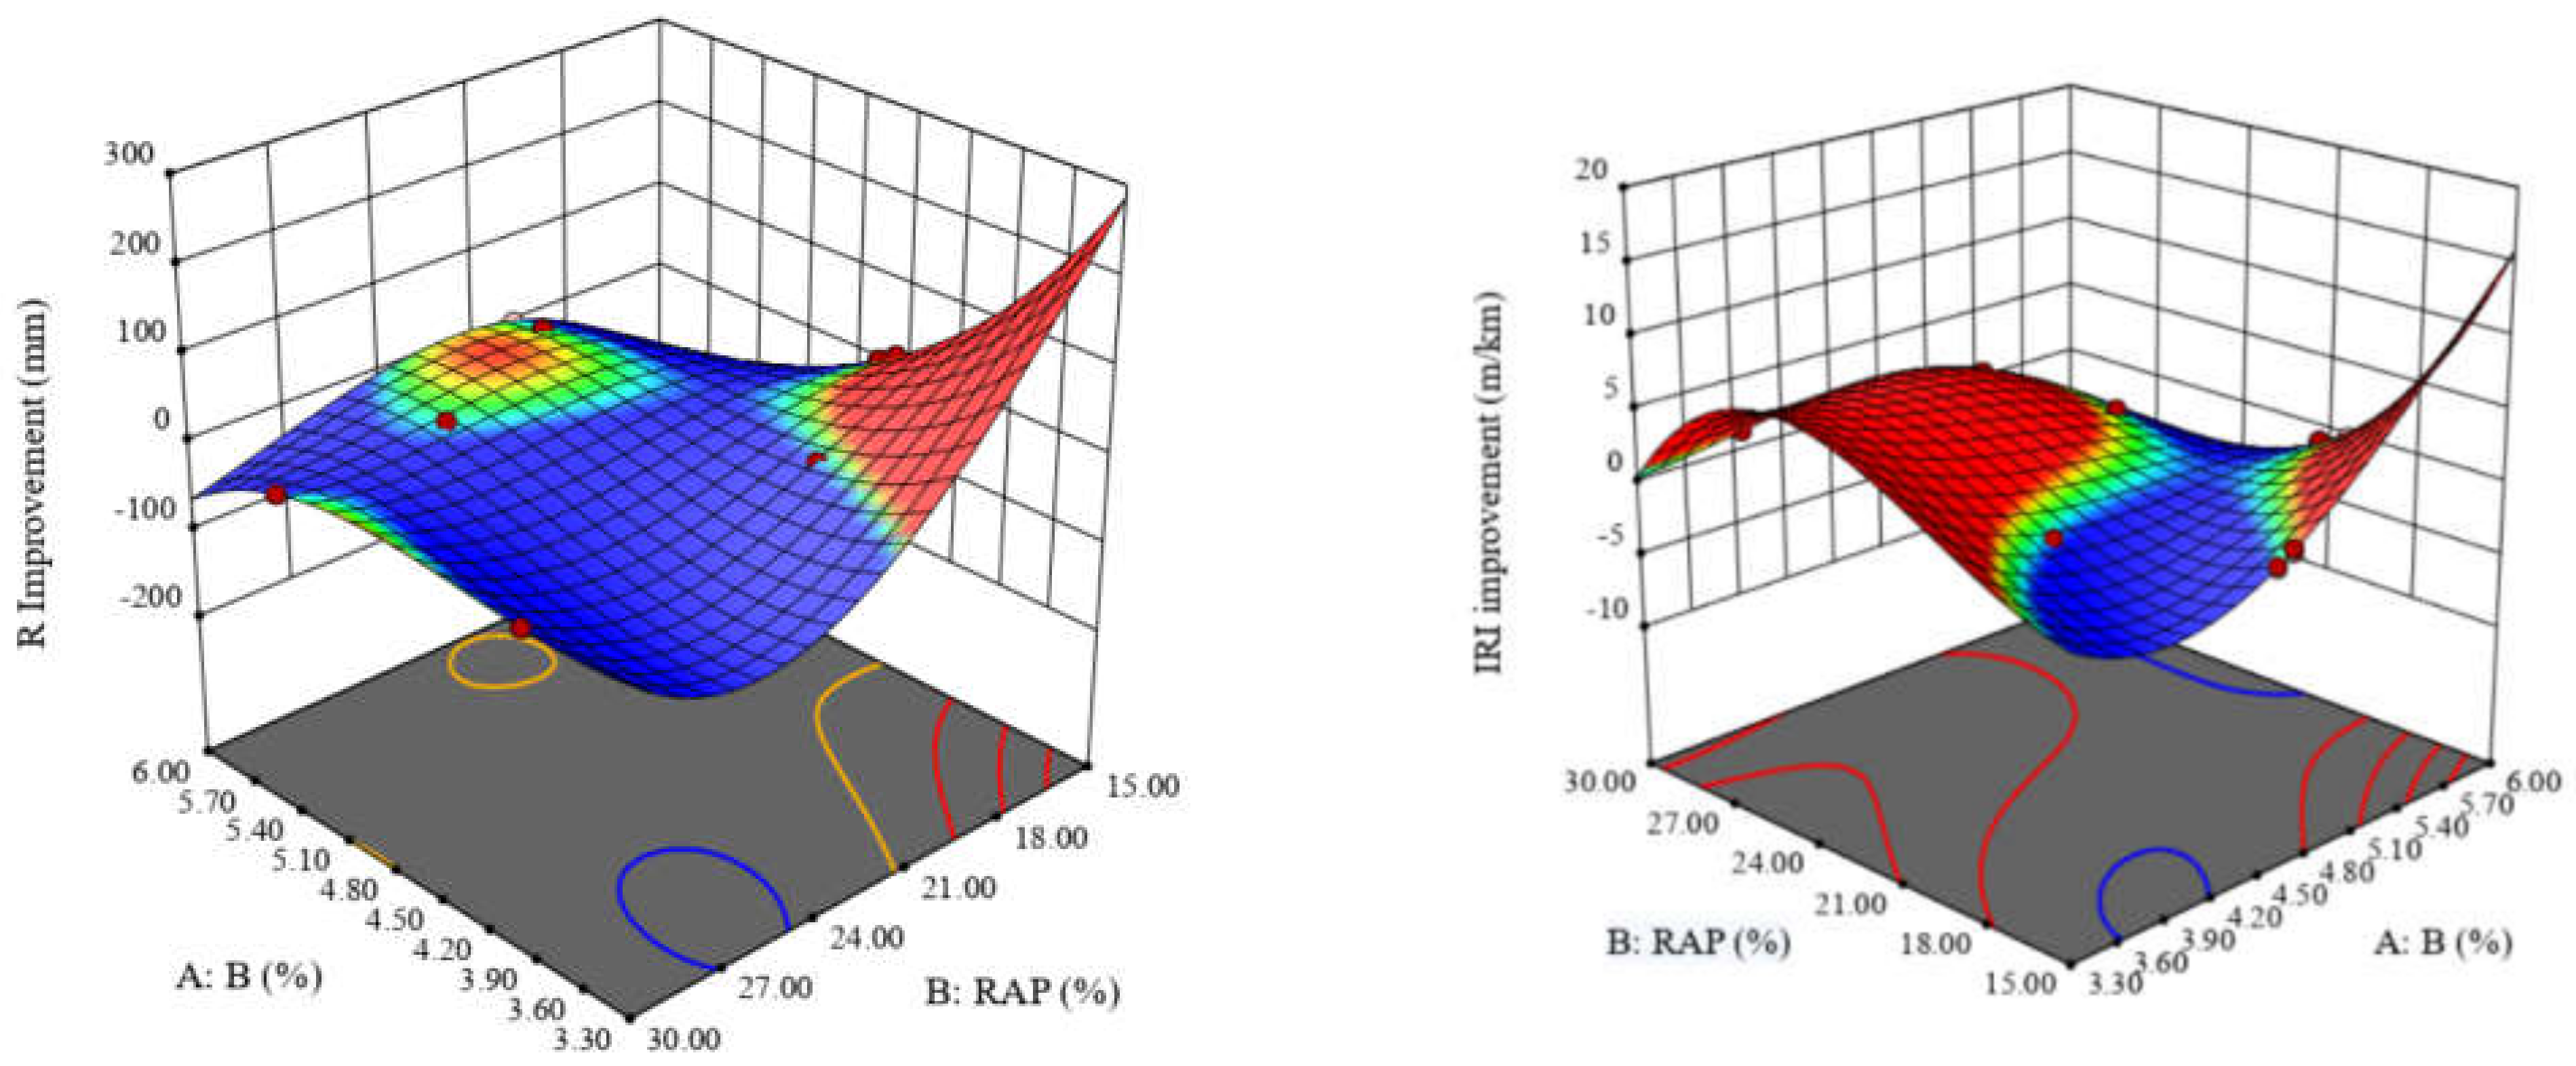
There is a numerical optimization using the
desirability functions in this method, which use this function to obtain the most appropriate values of variables and responses as optimal values simultaneously. The desirability function (
) is a parameter that has a value between zero and one; values closer to one indicate that the proposed optimal conditions are more desirable and appropriate. To solve a multi-objective optimization problem, we require a Desirable Response (DR), which is obtained from the geometric mean of the desirable functions (where n is the number of responses considered in the optimization). The desirable response can be calculated with Equation (1):
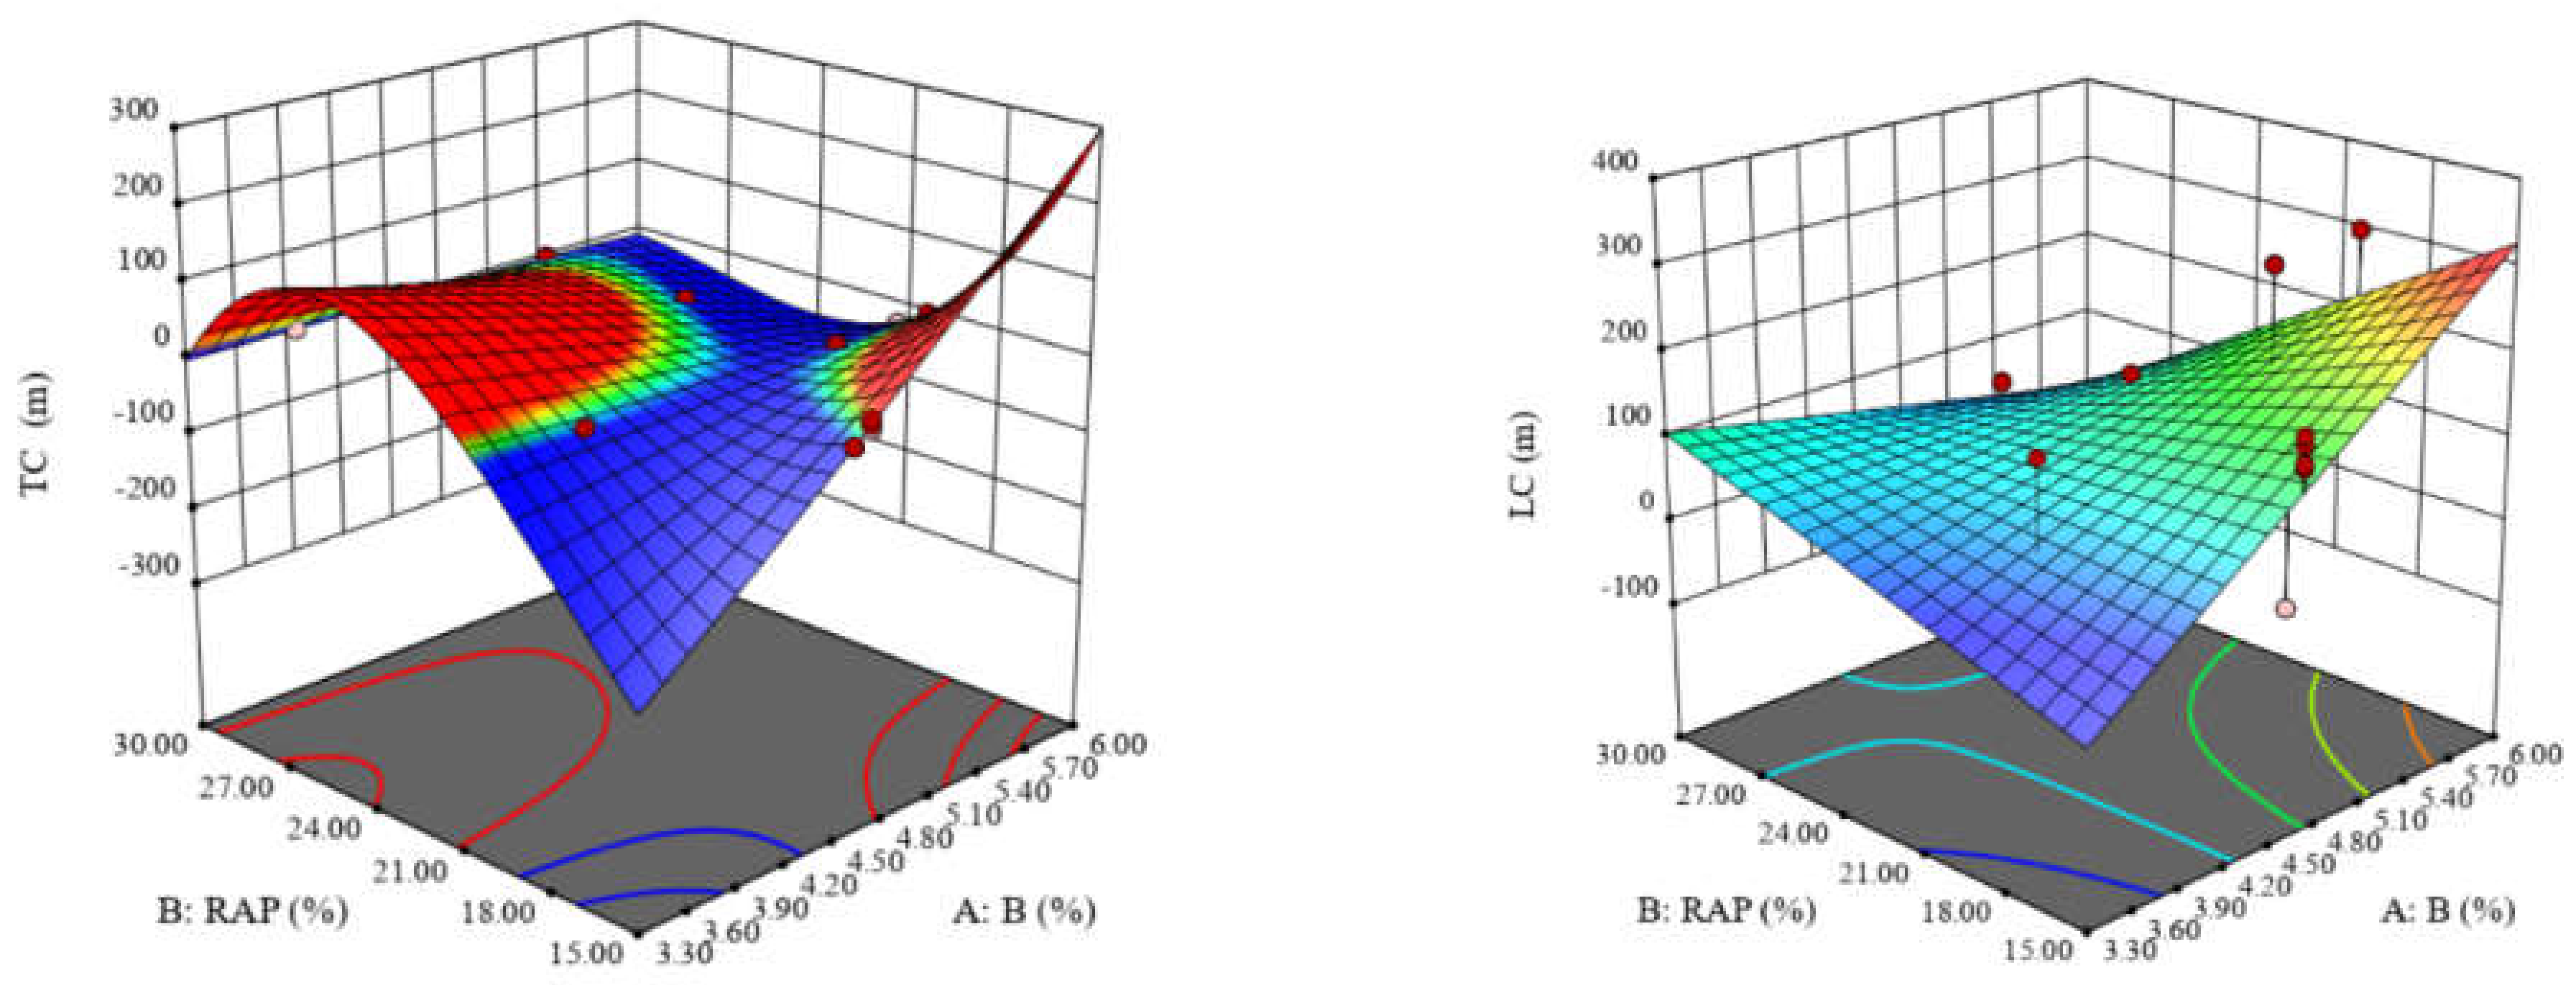
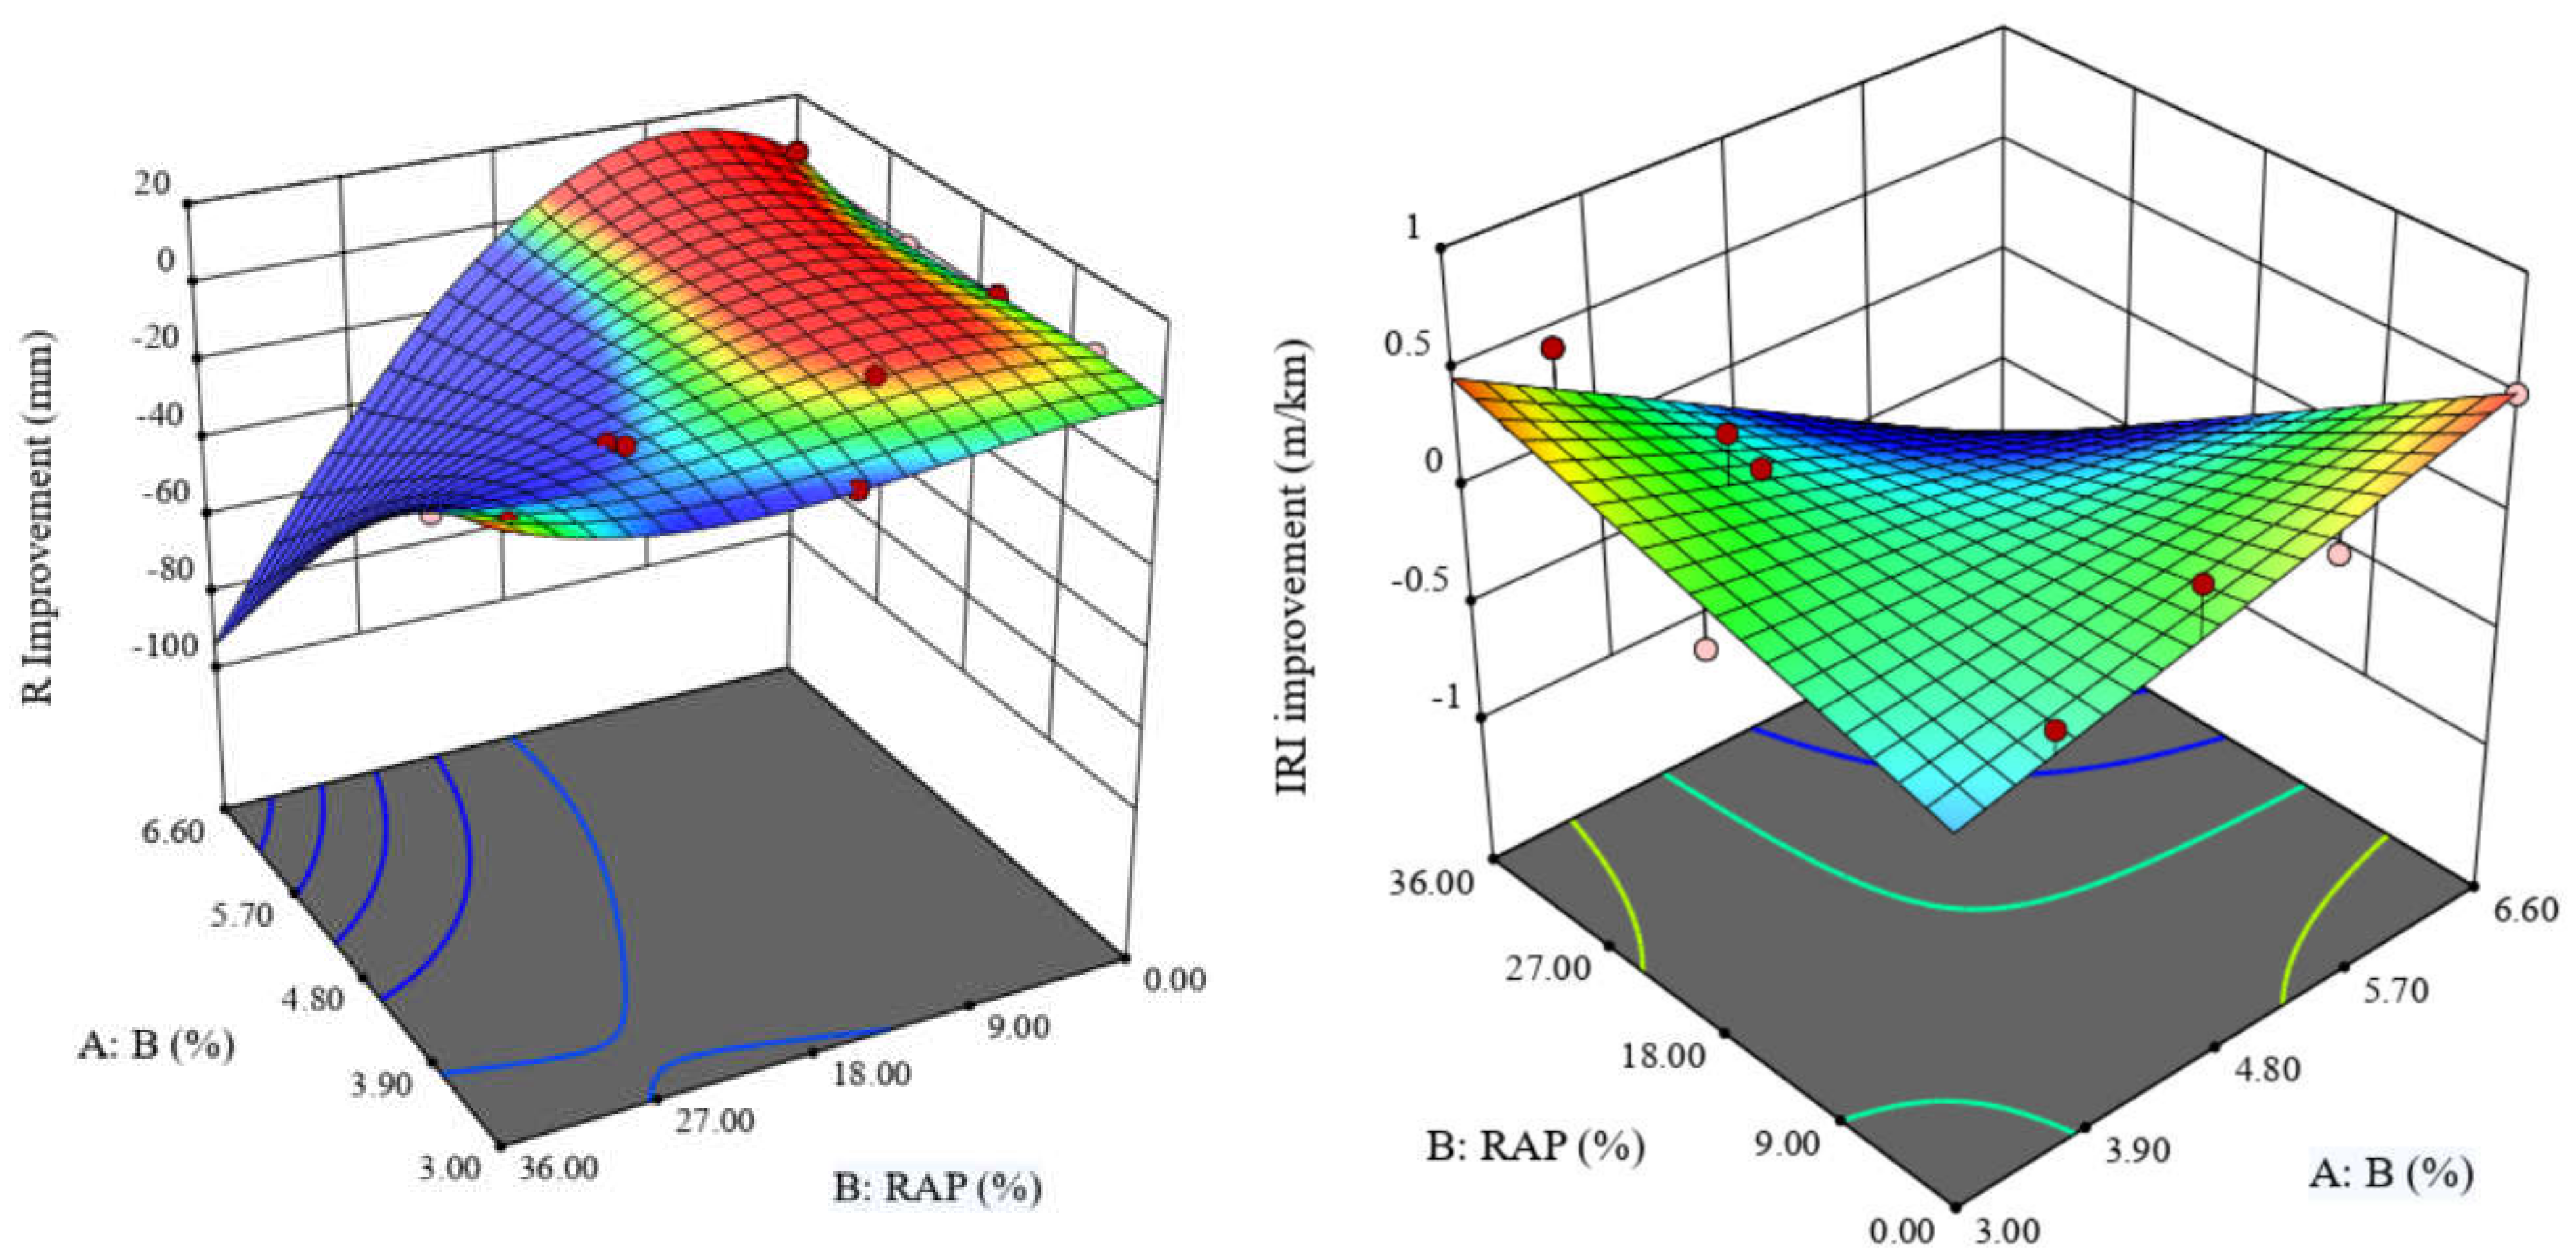
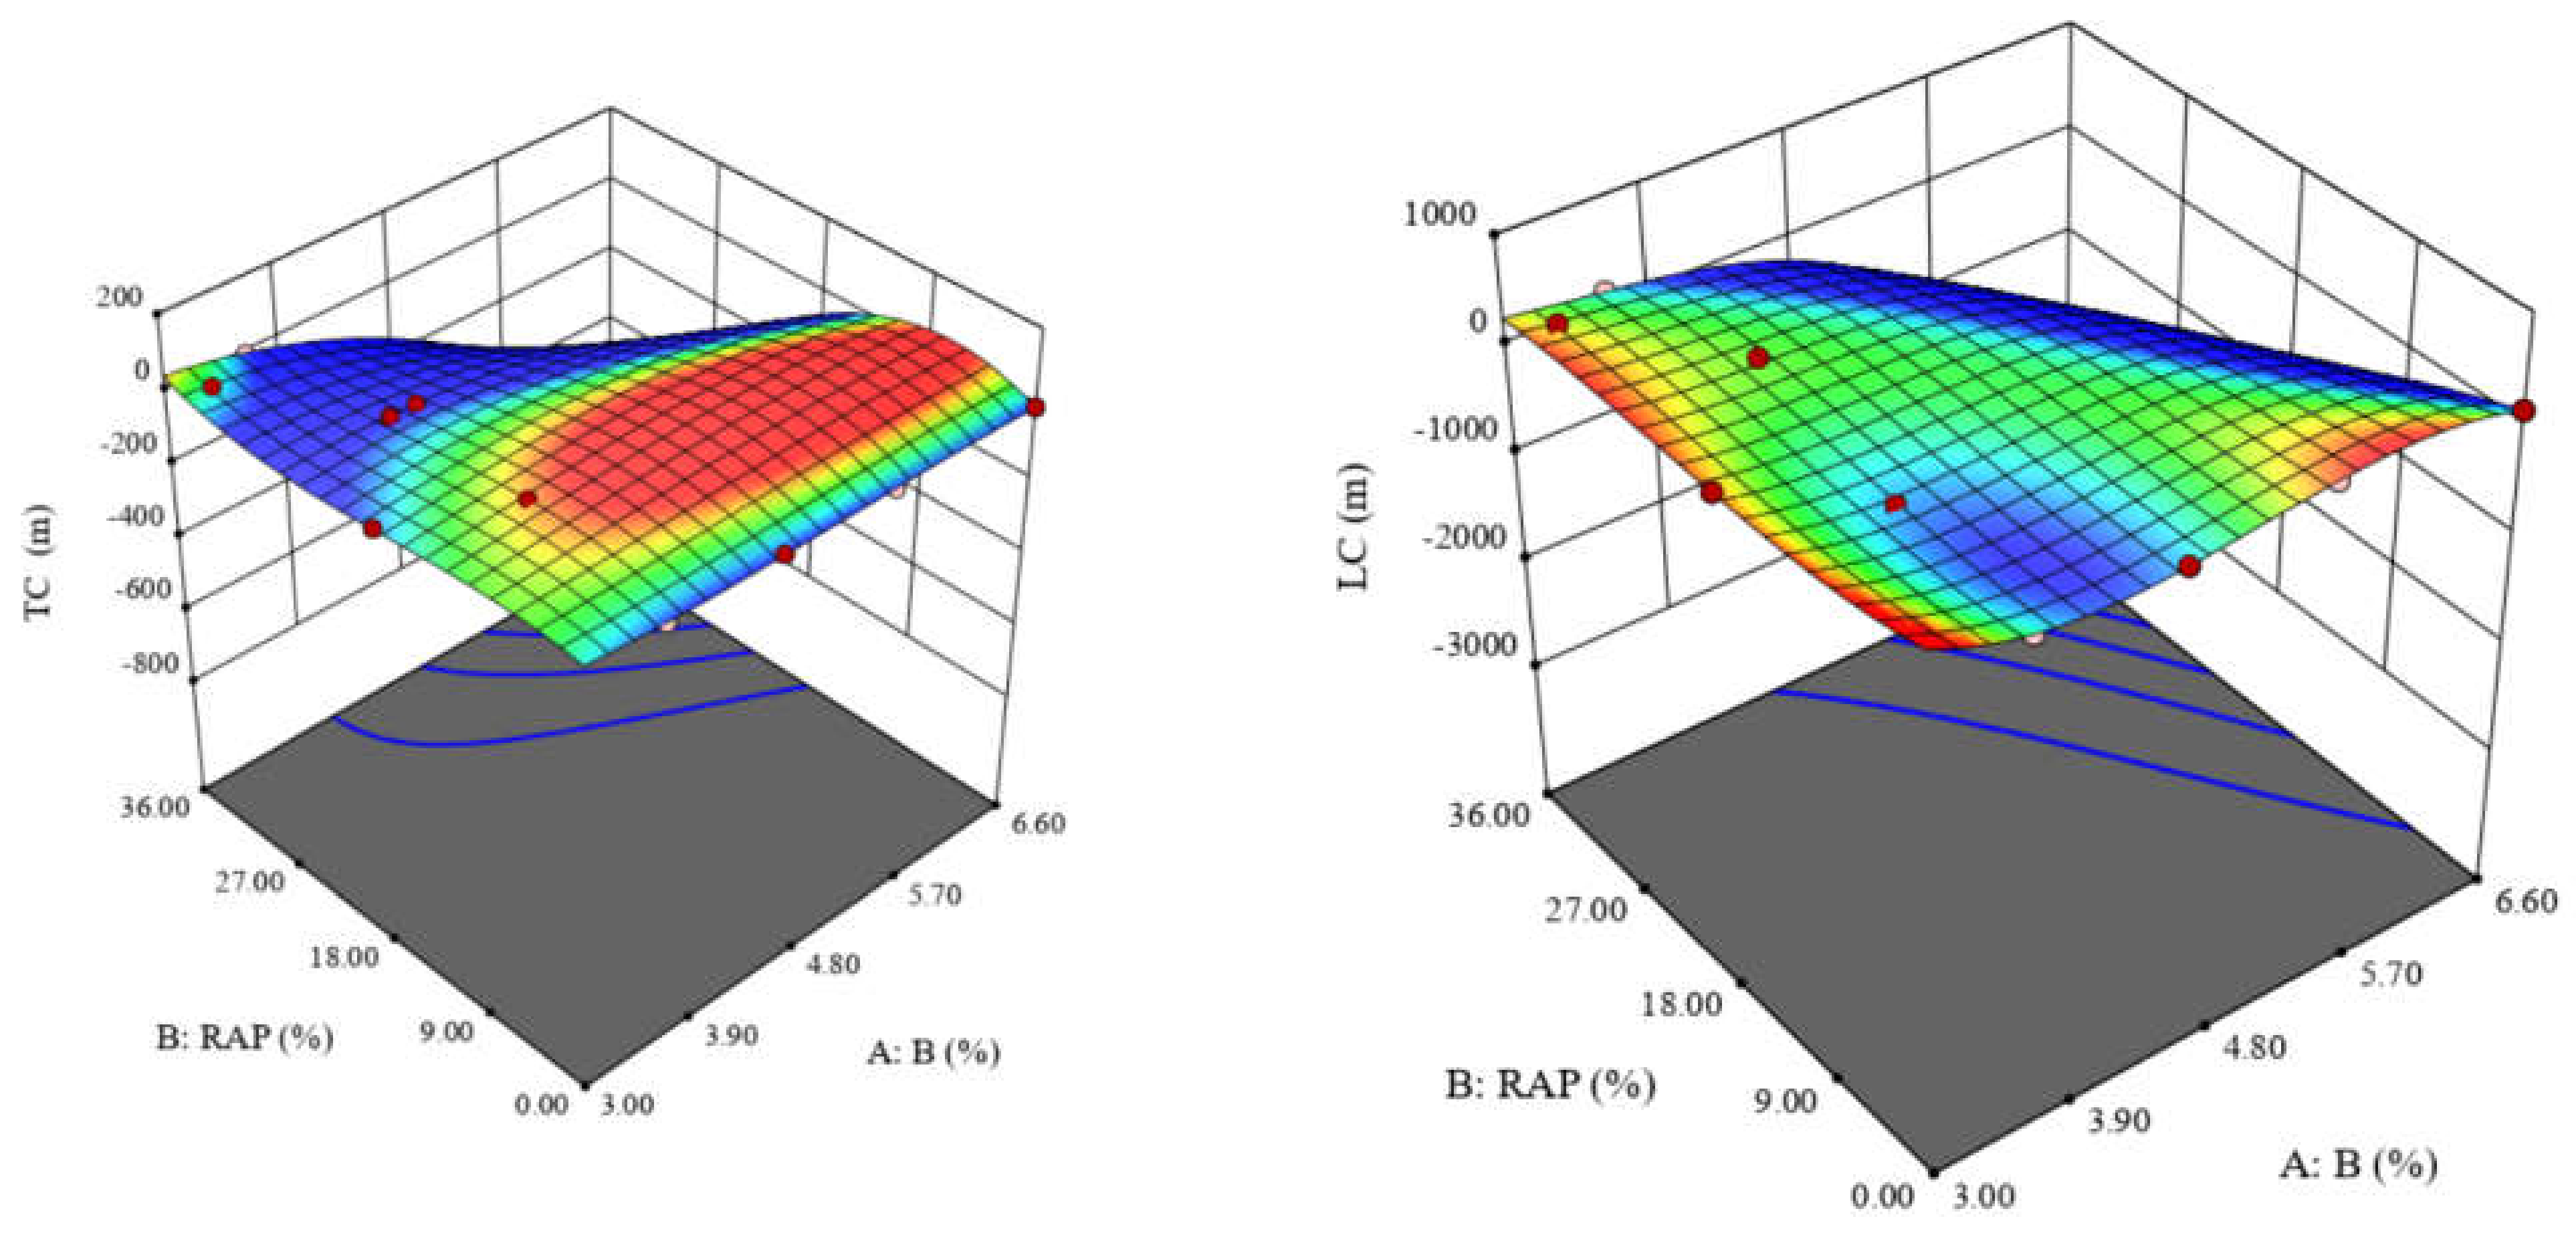
The independent variables were binder and RAP contents, which had ranges of 3.3–6.0 and 15–30%, respectively, for dry conditions and 3.0–6.6% and 0.0–36%, respectively, for wet conditions. Since alligator cracking did not occur at all sites with WMA overlay 4 years after treatment, it could not be optimized.
A high load-bearing capacity, low IRI and low cracking length and area under applied stresses are very important to pavement longevity. To optimally design an asphalt containing RAP, conditions were determined to maximize improvements in R and IRI while minimizing TC and LC lengths. Binder is used in pavement mixtures to fill the voids between aggregates and improve adhesion. However, its use at contents above the standard range will reduce the durability of pavement. Hence, the B value should be considered in range. The RAP values should be considered at their maximum due to the importance of waste and environment discussion, and the corresponding importance factor of 5 in the software should be selected (from 1 to 5). On the other hand, due to the importance of all parameters (rutting, IRI, length of transverse and longitudinal cracking), the coefficient of importance of the answers of this study in the optimization software is equal to 5 (from 1 to 5).
By solving the optimization problem with the software with the values
,
, the optimal values of the mentioned desirable functions (
,
,
,
and
) were determined.
Figure 12 and
Figure 13 show the RSM optimization models. The results for dry and wet regions are presented in
Table 4 and
Table 5, respectively.
6. Conclusions
The aim of this study was to investigate the effect of the RAP content in a WMA overlay on performance improvements in existing pavements in terms of rutting, IRI, transverse cracking, longitudinal cracking and alligator cracking in the Specific Pavement Study-10 (SPS-10). This research was based on the LTPP database in nine states, including 18 and 13 sections in dry and wet areas, respectively. The effects were evaluated at initial recovery (after one year) and after 4 years of overlay placement. The results of this study are summarized as follows:
The best rutting resistance performance in dry regions occurred with 15% RAP and 4.5% binder added to the mixtures. In wet areas, these values were 12% and 3.7%, respectively.
For dry locations, the minimum and maximum IRI improvements were associated with site 11 (AA01 for New Mexico) and site 4 (BA59 for Arizona), while in wet areas, these were associated with site 31 (AA01 for Florida) and site 30 (AA63 for Oklahoma).
The improvements in transverse cracking under dry conditions were similar at 1 and 4 years post-treatment. This trend was also applicable to wet regions except at sites 23, 27, and 29, for which the differences between years 1 and 4 were 18, 8, and 50 m, respectively.
The maximum amounts of longitudinal crack healing occurred at site 3 (BA01 for Arizona; dry) and site 26 (AA65 for Missouri; wet).
Since alligator cracking did not occur 1 and 4 years after WMA overlay, the optimal RAP and binder contents cannot be suggested. However, the greatest improvements in dry and wet regions were for site 15 (AA01 for Washington state) and site 30 (AA63 for Oklahoma).
According to RSM, the optimal binder content and RAP were 4.88% and 30% in dry regions and 3.42% and 36% in wet areas, respectively. The desirable optimization values were 93% and 71% for dry and wet sections, respectively.


