Article

Liquid-Phase Hydrogenation over a Cu/SiO2 Catalyst of 5-hydroximethylfurfural to 2,5-bis(hydroxymethyl)furan Used in Sustainable Production of Biopolymers: Kinetic Modeling

by
Juan Zelin
*,
Hernán Antonio Duarte
,
Alberto Julio Marchi
and
Camilo Ignacio Meyer
*
Catalysis Science and Engineering Research Group (GICIC), Instituto de Investigaciones en Catálisis y, Petroquímica (INCAPE), Universidad Nacional del Litoral (UNL)-Consejo Nacional de Investigaciones, Científicas y Técnicas (CONICET), Colectora Ruta Nacional No. 168 Km 0, Santa Fe 3000, Argentina
*
Authors to whom correspondence should be addressed.
Sustain. Chem. 2025, 6(3), 22; https://doi.org/10.3390/suschem6030022
Submission received: 25 June 2025 / Revised: 31 July 2025 / Accepted: 1 August 2025 / Published: 6 August 2025

Abstract

2,5-bis(hydroxymethy)lfuran (BHMF), a renewable compound with extensive industrial applications, can be obtained by selective hydrogenation of the C=O group of 5-hydroxymethylfurfural (HMF), a platform molecule derived from lignocellulosic biomass. In this work, we perform kinetic modeling of the selective liquid-phase hydrogenation of HMF to BHMF over a Cu/SiO2 catalyst prepared by precipitation–deposition (PD) at a constant pH. Physicochemical characterization, using different techniques, confirms that the Cu/SiO2–PD catalyst is formed by copper metallic nanoparticles of 3–5 nm in size highly dispersed on the SiO2 surface. Before the kinetic study, the Cu/SiO2-PD catalyst was evaluated in three solvents: tetrahydrofuran (THF), 2-propanol (2-POH), and water. The pattern of catalytic activity and BHMF yield for the different solvents was THF > 2-POH > H2O. In addition, selectivity to BHF was the highest in THF. Thus, THF was chosen for further kinetic study. Several experiments were carried out by varying the initial HMF concentration (C0HMF) between 0.02 and 0.26 M and the hydrogen pressure (PH2) between 200 and 1500 kPa. In all experiments, BHMF selectivity was 97–99%. By pseudo-homogeneous modeling, an apparent reaction order with respect to HFM close to 1 was estimated for a C0HMF between 0.02 M and 0.065 M, while when higher than 0.065 M, the apparent reaction order changed to 0. The apparent reaction order with respect to H2 was nearly 0 when C0HMF = 0.13 M, while for C0HMF = 0.04 M, it was close to 1. The reaction orders estimated suggest that HMF is strongly absorbed on the catalyst surface, and thus total active site coverage is reached when the C0HMF is higher than 0.065 M. Several Langmuir–Hinshelwood–Hougen–Watson (LHHW) kinetic models were proposed, tested against experimental data, and statistically compared. The best fitting of the experimental data was obtained with an LHHW model that considered non-competitive H2 and HMF chemisorption and strong chemisorption of reactant and product molecules on copper metallic active sites. This model predicts both the catalytic performance of Cu/SiO2-PD and its deactivation during liquid-phase HMF hydrogenation.

Graphical Abstract

1. Introduction

Over the last century, the development of society has been largely driven by fossil resources, which have been used as raw materials in the production of fuels, chemicals, pharmaceuticals, and especially plastics [1]. Specifically, the use of plastics has grown exponentially, in line with improvements in quality of life. However, this growth has brought about a strong dependence on fossil resources [2]. Furthermore, it has generated increasing concern about its environmental impact, particularly in relation to climate change [3,4]. In this context, scientific and technological efforts have intensified toward processing biomass-derived compounds, such as sugars, to obtain platform molecules that are building blocks for producing bio-based plastics [5].
Currently, there is a consensus that platform molecules derived from lignocellulosic biomass should be explored as alternatives to fossil-derived molecules, as they are widely available, are low-cost, and do not compete with food [6]. Among them, 5-hydroxymethylfurfural (HMF) stands out for its great potential to replace petroleum-based molecules due to its high chemical reactivity, which allows it to be converted into a variety of valuable compounds [7,8,9,10]. One of the compounds to which HMF can be converted is 2,5-bis(hydroxymethyl)furan (BHMF). This compound could be used in the production of biopolymers, such as polyurethanes and polyesters, which are among the most widely used plastics in the world [9,10]. A reaction scheme showing the selective HMF hydrogenation to BHMF is shown in Scheme 1.
Processes based on heterogeneous catalysis satisfy green chemistry principles such as reducing pollution and dangerous chemicals and minimizing waste and by-products [11]. Moreover, to enable the industrial viability of such transformation routes, it is necessary to develop efficient production processes based on heterogeneous catalysis. These processes require catalysts that are not only active, selective, and stable under reaction conditions but also inexpensive and prepared through simple methods. Moreover, catalysts should be easily recoverable and reusable to ensure process sustainability. So, it is expected that heterogeneous catalysis will play a central role in the search for sustainable solutions to issues related to the production of biopolymers, such as polyurethanes and polyesters, from BHMF.
Several research works on liquid-phase heterogeneous catalytic conversion of HMF into BHMF have been published [12,13,14,15,16,17,18,19,20,21,22,23,24,25,26,27,28,29]. Among them, supported monometallic catalysts based on noble metals, such as Pt [12,13], Au [14], and Ir [15], have been used. However, the high cost of these metals compromises the economic viability of technologies that rely on them. Supported metal catalysts based on non-noble metals have also been employed with the aim of finding a possible solution to this issue. Ni-based catalysts have been shown to be active in the hydrogenation of both the carbonyl group and the aromatic ring of HMF [16,17]. In particular, under certain reaction conditions or combined with a specific support, Ni-based catalysts were active in the hydrogenolysis of C-OH bonds and, as a consequence, 2,5-dimethylfuran (DMF) was obtained [18,19]. NiGa and NiPt bimetallic systems supported on hydrotalcite and SBA-15 have also been used, reaching BHMF selectivities of 96% and 82%, respectively [20,21]. However, despite this high selectivity, a major drawback of this study lies in the complexity of the catalyst’s preparation methods, which may hinder its scalability and practical application. Co-based catalysts exhibited high activity in HMF hydrogenation, but low selectivities to BHMF were obtained due to the occurrence of hydrogenolysis reactions [22,23]. Srifa et al. added Pt to a Co/Al2O3 catalyst to increase selectivity to BHMF. Although the catalyst achieved a high BHMF yield (99%), it was not stable under the reaction conditions, exhibiting loss of activity and selectivity, and leaching of the metallic phase [23]. Cu-based catalysts are the non-noble metal catalysts most selective to BHMF, and under mild reaction conditions, they promote selective carbonyl hydrogenation, preventing the cleavage of C-O or C-C bonds [24,25,26,27,28,29]. HMF conversions greater than 95%, with selectivities to BHMF between 95 and 98%, were reached using supported Cu monometallic catalysts, such as Cu/ZnO [24], Cu/SiO2 [25,26], and Cu/MgAlOX [27]. A copper-based catalyst supported on CeO2 modified with trace amounts of Pd showed high selectivity to BHMF (99.9%) at 80% conversion of HMF under the conditions used in the work [28]. However, its preparation involved intricate synthesis strategies aimed at achieving spatially controlled metal species on the support, which may pose challenges for large-scale implementation. Rezayan et al. reported the production of BHMF using a bimetallic CuCoAl catalyst, prepared via a co-precipitation method, which was cost-effective and scalable. Although the catalyst showed good stability, the BHMF selectivity (~91%) was lower than that of the monometallic Cu catalysts due to the presence of hydrogenolysis products [29]. So, bimetallic Cu-based catalysts showed better stability than monometallic ones, but HMF conversions and selectivities to BHMF were lower than those observed with monometallic Cu catalysts.
Regarding kinetic studies of liquid-phase HMF hydrogenation using heterogeneous catalysts, very few works have been reported to date. In this sense, it is worth mentioning the work of Jain and Vaidya, since these authors used a commercial Ru(5%)/C catalyst to perform kinetic modeling of the catalytic hydrogenation of HMF to BHMF in the liquid phase, applying power law and LHHW models [30]. They used water as a solvent and H2 gas as the hydrogenating agent, analyzing the effect of initial HMF concentration, H2 pressure, catalyst concentration, and reaction temperature on the rate of reaction. In general, the reaction conditions were similar but not identical to the ones used in the present work. In addition to how the catalysts used in each work are different, it is very important to highlight that Jain and Vaidya performed an analysis considering only the initial HMF conversion rates. This partial analysis is very useful, especially for determining the intrinsic activity of the catalyst, but it is insufficient for establishing a complete kinetic expression that allows the prediction or modeling of the actual behavior of the catalyst throughout a complete run. This becomes important when the catalyst is used in a production reactor.
In our previous work, we found that a monometallic Cu/SiO2 catalyst prepared by the precipitation–deposition method showed the best performance, with high HMF final conversion (~91%) and BHMF selectivity (~99%) at 393 K and 1500 kPa of H2 pressure [31]. This catalyst, prepared by a simple synthesis method, can be easily recovered and reused in reaction. This makes it highly attractive for use in the development of green processes, such as the production of BHMF. Now, in this work, we focus on a detailed kinetic study for the selective production of BHMF from HMF using this Cu/SiO2 catalyst (Scheme 1). Therefore, this study allows us to deepen the knowledge on HMF hydrogenation over metallic copper silica-supported catalysts, directly contributing to the design of efficient and environmentally friendly processes, in accordance with the principles of sustainable chemistry.

2. Materials and Methods

2.1. Catalyst Preparation and Characterization

A Cu/SiO2-PD catalyst precursor was prepared by the precipitation–deposition method at a controlled pH and temperature, as detailed in Zelin et al. [31]. Summarizing, aqueous solutions of Cu(NO3)2.3H2O and K2CO3 were simultaneously added to a stirred suspension of SiO2 (Sigma-Aldrich) in milli-Q® water. The temperature was adjusted and controlled at 338 K, while the pH of the solution was maintained at 7.2 ± 0.2. The slurry obtained was separated by filtration, dried at 358 K overnight, and finally calcined in air flow at 673 K for 4 h.
The metallic load of the oxide precursor achieved in the calcined sample was determined by atomic absorption spectroscopy (AAS) using a Perkin-Elmer 3110 spectrometer. The specific surface area (Sg), pore volume (Vg), and pore diameter (dm) were measured using a N2 physisorption at 77 K in a Quantachrome Autosorb I sorptometer.
The crystalline structure of the hydrated precursor, the oxide precursor, and a reduced sample in hydrogen flow at 523 K and passivated in O2 (1%)/N2 flow at room temperature were studied via X-ray diffraction (XRD), employing an Empyrean Serie 2 X-ray system (Panalytical) with Ni-filtered Cu-Kα radiation (λ = 0.1540 nm) and a 2°/min speed scan.
The temperature-programmed reduction (TPR) profiles of the Cu/SiO2-PD oxide precursors were obtained in H2(5%)/Ar flow (60 cm3/min) using a Hiden Analytical QGA system equipped with a quadrupole mass analyzer.

2.2. Catalytic Tests

The liquid-phase catalytic hydrogenation of HMF (AVA Biochem, purity ≥ 99%) was carried out in a 500 cm3 stainless steel autoclave at 200–1500 kPa of H2 pressure, 393 K, using 150 cm3 of solvent: tetrahydrofuran (THF) (Cicarelli, pro-analysis + 99.0%), 2-propanol (2-POH) (Cicarelli, pro-analysis +99.0%), and water (H2O). The initial HMF concentration (C0HMF) was between 0.02 M and 0.26 M and the mass of the catalyst was adequate to obtain a relationship of W/n0HMF = 25 g/mol. Prior to the catalytic tests, the samples were activated ex situ in H2 (100%) flow (60 cm3/min) for 2 h at 523 K, then were cooled down in H2 flow and transferred to a high-pressure reactor under an inert atmosphere (N2). Next, a predetermined amount of HMF and 1 cm3 of hexadecane, used as an internal standard, were added to the solvent. Afterwards, the system was purged and pressurized with 100 kPa of N2. Then, the reaction mixture was stirred at 760 rpm and heated up to the reaction temperature at 5 K/min. Once the reaction temperature was reached, H2 was added to the reactor in order to set the previously established partial pressure of H2.
Liquid samples were periodically collected during the reaction, at intervals of 15–30 min. Off-line analysis of these samples was conducted employing gas chromatography in a Shimadzu 2014 GC (Jenck S.A., Buenos Aires, Argentina) chromatograph equipped with an ALPHA DEXTM 120 column (30 m × 0.25 mm × 0.25 μm film thickness) and a flame ionization detector. Mass spectroscopy analyses were also performed, employing a Thermo Scientific Trace 13000 (Thermo Fisher Scientific, Buenos Aires, Argentina) spectrometer coupled with a Thermo Scientific Trace 1300 gas chromatograph equipped with a TR 5MS column (30 m × 0.25 mm × 0.25 μm film thickness) to identify unknown products.
The HMF conversion was calculated as XHMF = ( n HMF 0 − nHMF)/n0HMF, where n0HMF is the initial number of HMF moles and nHMF is the number of HMF moles at a given reaction time. The product yields (yj) were calculated as yj = (njj)/(n0HMFHMF), where nj is the number of moles of product j and υHMF and υj are the stoichiometric factors of HMF and product j, respectively. Selectivity to product j (Sj) was obtained as Sj = yj/ XHMF.
The initial rates of HMF hydrogenation (r0HMF, mol/h·g) are determined from the slope at the zero time of the HMF conversion vs. W·t/n0HMF curves, where W is the total catalyst weight (g) and t is time of reaction (h).
The carbon balance (CB) is defined as follows:
C B = ( α H M F · n H M F + α B H M F · n B H M F ) / ( α H M F · n H M F 0 )
where α H M F and α B H M F are the number of carbon atoms in HMF and BHMF, which is 6 for both molecules. Thus, the CB expression simplifies to the following:
C B = ( n H M F + n B H M F ) / n H M F 0

2.3. Procedure for Numerical Calculus and Fittings

The differential HMF mass balance is presented in Equation (A1) and was resolved by numerical integration using an algorithm based on the fourth-order Runge–Kutta method. This numerical resolution is performed simultaneously with the optimization of the parameters to be adjusted using the General Reduced Gradient (GRG) algorithm for non-linear optimization problems (Solver) that minimizes the sum of the squared errors (SSE). Finally, the confidence intervals of the optimized estimators, obtained as a result of fitting and numerical integration, are obtained using macro ExcelR, developed by Robert de Levie [32].

3. Results

3.1. Textural and Physicochemical Properties of Cu/SiO2-PD Catalyst

The results obtained from the physicochemical characterization of the Cu/SiO2-PD catalyst and SiO2 used in this work are summarized in Table 1. The Cu load, determined by AAS, was 8 wt%. The BET surface area (Sg), pore volume (Vp), and pore diameter (dp) of the catalyst were approximately 10% lower than those of the support. This indicates that the textural properties of the support did not change significantly following Cu precipitation–deposition on it.
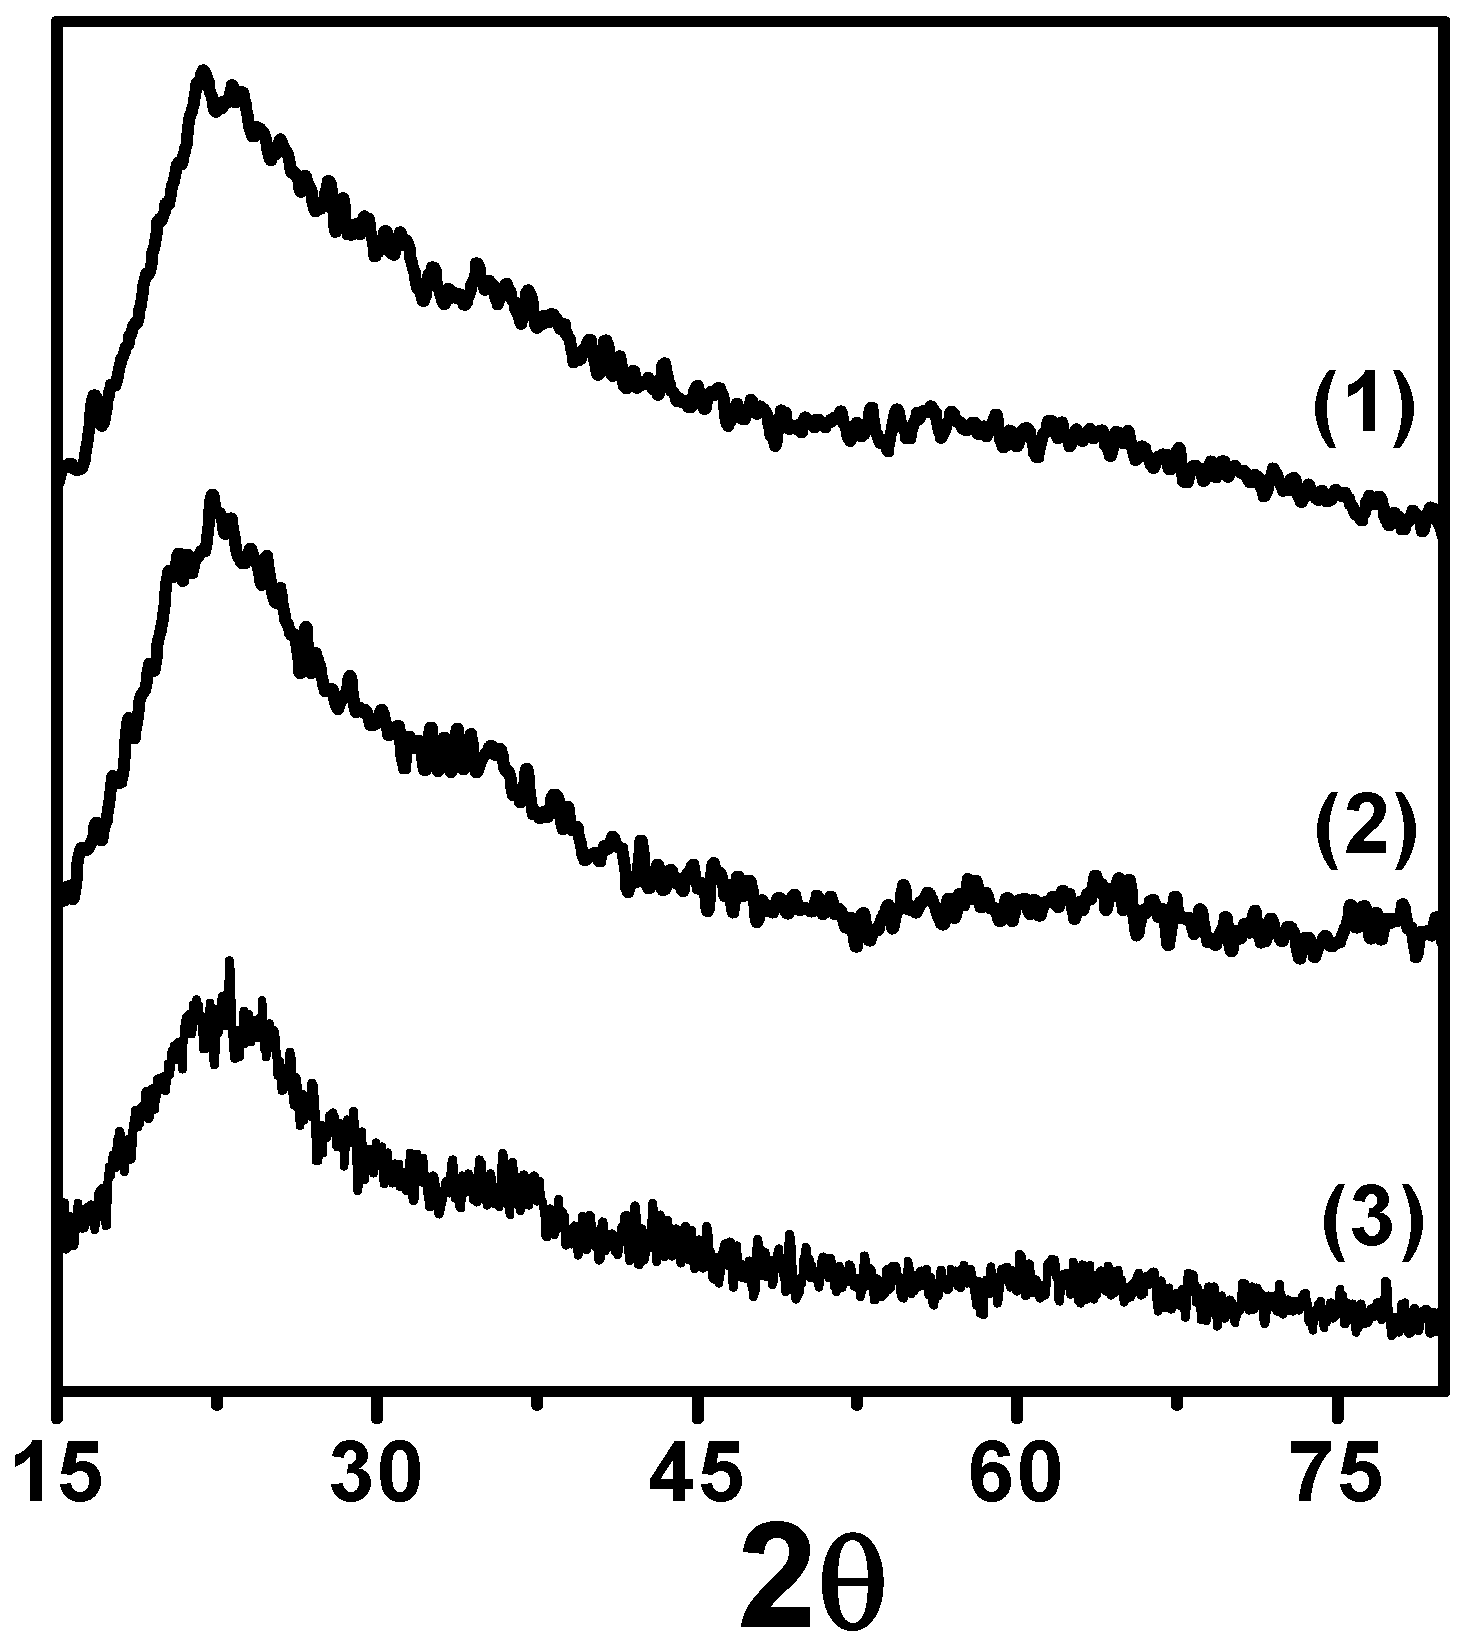
The X-ray powder diffractograms for Cu/SiO2-PD are shown in Figure 1. For the hydrated, calcined, and reduced–passivated samples of Cu/SiO2-PD (Figure 1, diffractograms (1), (2), and (3)), only the amorphous halo in the 2θ range 20–30°, attributed to the SiO2 support, was observed. This indicates that the Cu phase is supported on the internal surface of silica pores forming crystalline domains smaller than 4 nm, as previously reported [31].
The TPR of the calcined sample (Figure S1) showed a peak at 566 K with a small shoulder at 590 K, which may be due to reduction of Cu species with different support interactions, i.e., to silica species of different natures. In previous works, we assigned the peak at 566 K to the reduction of CuO, and the signal at 590 to the reduction of copper phyllosilicates [31].
In previous studies, we verified by TEM and N2O chemisorption that Cu/SiO2-PD is composed of nanoparticles between 3 and 5 nm in size, which are highly dispersed on the silica surface [31,33]. N2O chemisorption measurements showed that metal dispersion (DN2O) on Cu/SiO2-PD is about 21%, with the mean metallic copper particles size (dN2O) of 3.6 nm. On the other hand, the estimated mean size found by TEM was dTEM = 4.7 nm, very similar to that obtained by N2O chemisorption.

3.2. Catalytic Test

3.2.1. Solvent Influence on Catalytic Performance

The influence of the solvent on the catalytic activity and selectivity of BHMF during HMF hydrogenation was investigated at 393 K and 1500 kPa of H2 pressure. Three different solvents were tested: tetrahydrofuran (THF), 2-propanol (2-POH), and water (H2O).
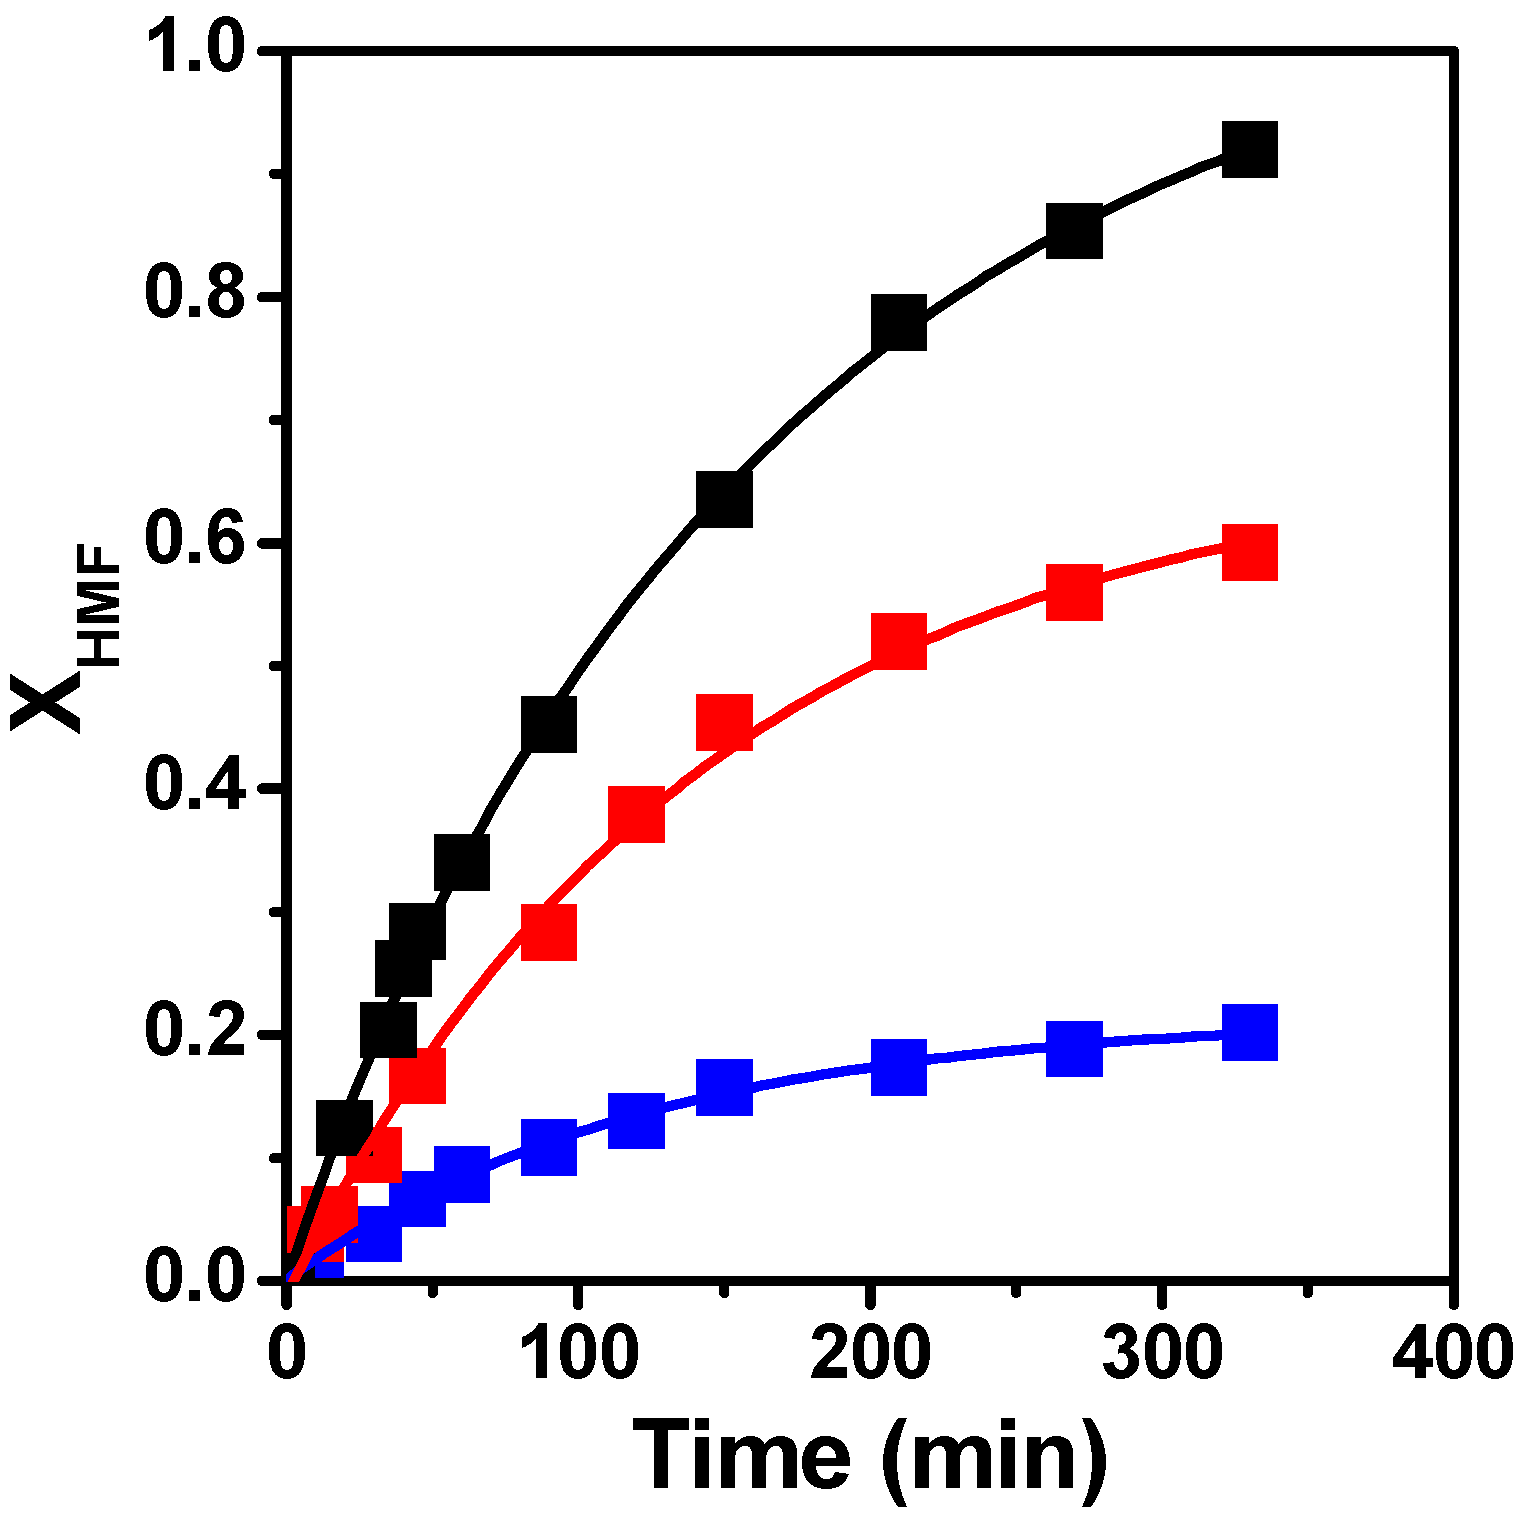
Figure 2 shows the conversion of HMF as a function of time for these three solvents, while Table 2 summarizes the obtained values of the initial HMF hydrogenation rate (r0HMF), HMF conversion (XHMF), and BHMF selectivity (SBHMF) at a 20% conversion level. The Cu/SiO2-PD catalyst was active for the hydrogenation of HMF in all solvents, presenting the following activity order: THF > IPA > H2O. The HMF conversion achieved at the end of the reaction for the different solvents followed the same pattern as that observed for the initial catalytic activity. XHMF was higher than 90% when THF was used as the solvent, and with 2-POH, the conversion recorded was close to 60%, while with water, it did not exceed 20%. The balance of carbon (CB) with Cu/SiO2-PD in the liquid-phase HMF hydrogenation was higher than 97% for all experiments.
Regarding product distribution, BHMF was the only product detected when THF and 2-POH were used as solvents, achieving selectivities of 98%, respectively. However, BHMF selectivity was only 45% when H2O was used as a solvent, with 1-hydroxy-2,5-hexanedione and 2,5-hexanedione as by-products coming from the ring-opening reaction of the HMF molecules with water. These two compounds were identified by GC-MS of samples taken from the reactor during the run (Figures S2 and S3). These results are in agreement with those obtained by other authors, who report that the catalytic hydrogenation of HMF in water produces a ring-opening reaction [34,35,36].
These results confirm that solvent selection is extremely important to achieve high hydrogenation rates and BHMF selectivity in the liquid phase when molecular H2 is used as a reducing agent. On the other hand, the application of BHMF in the field of polymers to obtain polyurethane foams, self-healing materials, and resins is usually carried out using THF as a solvent [9,36,37]. The use of the same solvent in both steps allow the potential implementation of a “one-pot” process involving the sequential hydrogenation and polymerization reactions in a single reactor. The efficiency of these “one-pot” processes lies in their ability to reduce auxiliary and intermediate stages, such as the separation and purification of intermediate products. This saves time and resources in production leading to the implementation of a more sustainable process.

3.2.2. Kinetic Modeling of HMF Hydrogenation with the Cu/SiO2-PD Catalyst

Hypothesis and Principal Model Rate Equations Used
A summary of the set of experimental conditions, number of runs,   r H M F   0 values determined from the slope of the curves X H M F   v s W · t / n H M F   0 , and turnover frequency (TOF) is given in Table 3.
Based on the complete set of experimental data obtained in this work, primarily the concentration of HMF and BHMF in solution at varying reaction times and under different experimental conditions, we performed several analyses of HMF hydrogenation kinetics in the liquid phase over a Cu/SiO2-PD catalyst. We began with an analysis of the initial rates, r0HMF, estimated from the slope of the curves   X H M F   v s W · t / n H M F   0 at time zero, to determine the effects of H2 pressure and the initial concentration of HMF on the reaction rate, i.e., to estimate the apparent orders with respect to both reactants. Then, based on a pseudo-homogeneous power law-like model (Equation (1)), we fitted and estimated the apparent reaction orders now considering a subset of data obtained along the whole run, i.e., not only from the initial data ( r H M F 0 ). Next, we fitted the experimental data using distinct heterogeneous LHHW-like models to finally select the model that gave the best fitting with kinetic parameters significantly different from zero. It is essential to know the mathematical expression that fully describes the model and the estimates obtained by fitting with the corresponding confidence intervals to express the uncertainty associated with the estimation.
The power law model for the HMF hydrogenation rate is given in Equation (1).
r H M F = k p h · C H M F n · C H 2 m  
where kph is the pseudo-homogeneous kinetic constant of the reaction, n is the kinetic order with respect to HMF, and m is the kinetic order with respect to H2.   C H M F   and   C H 2 are the H2 and HMF liquid concentrations, respectively. The orders are empirical or apparent, taking virtually all possible values: integer, fractional, positive, negative, or zero. These apparent kinetic orders, as a pseudo-homogeneous model, will generally assume positive fractional values that are only valid within the narrow range of conditions where they are estimated. This model is named model 1.
To analyze and determine insights into the results obtained with the heterogeneous catalytic reaction system under study, we propose a classical Langmuir–Hinshelwood–Hougen–Watson (LHHW)-type approach. From this analysis, two heterogeneous models were proposed. The first heterogeneous model considered that all adsorption sites are identical for the adsorption of H2, HMF, and BHMF, i.e., competitive chemisorption (model 2). The second heterogeneous model considered two different types of chemisorption sites: an S1 type for H2 adsorption and S2 for adsorption of HMF and BHMF (model 3), i.e., non-competitive chemisorption.
The hypotheses made for the formulation of both LHHW mechanisms used in this work are the following:
  • The reactants, namely H2 and HMF, can be adsorbed on the adsorption sites (S, or S1 and S2) with 1:1 stoichiometry;
  • The H2 chemisorption is non-dissociative;
  • The reaction product, BHMF, can be adsorbed on the adsorption sites (S, or S1 and S2) with 1:1 stoichiometry;
  • The surface irreversible reaction between adsorbed H2 and HMF is the controlling step of the reaction;
  • The adsorptions of H2, HMF, and BHMF on the catalyst sites are reversible steps in equilibrium;
  • According to the experimental conditions, for each catalytic run, the H2 concentration in the liquid phase is constant and determined by the H2 pressure and the Henry constant in THF.
Considering the first hypothesis, the main elementary reaction steps for the proposed LHHW reaction mechanism are the following:
H2(g) ⇌ H2(l)H = PH2(g)/CH2(l)
H2(l) + S1 ⇌ H2S1KH = CH2S1/(CH2(l)·CS1)
HMF + S2 ⇌ HMFS2KA = CHMFS2/(CHMF·CS2)
HMFS2 + H2S1 ⇀ BHMFS2 + S1rHMF = ksr·CHMFS2·CH2S1
BHMFS2 ⇌ BHMF + S2KB = CBHMFS2/(CBHMF·CS2)
For the particular case corresponding to model 2, where both catalytic sites are identical (S1 = S2 = S), only one total site balance needs to be performed, leading to Equation (2):
C T S = C S + C H 2 S + C H M F S + C H M F S  
In the case of model 3, two total active balance sites should be considered for the catalyst, C T S 1 and C T S 2 , given by Equations (3) and (4).
C T S 1 = C S 1 + C H 2 S 1
C T S 2 = C S 2 + C H M F S 2 + C H M F S 2
Appendix A presents the mathematical development necessary to deduce the final rate of reaction expressions of each model. The catalytic reaction rate expression for model 2 is given in Equation (5).
r H M F = k s r · K A · K H · C T S 2 H · C H M F 0 · P H 2 · C * 1 + K H · P H 2 H + K A · C H M F 0 · C * + K B · C H M F 0 · 1 C * 2  
For model 3, the corresponding catalytic reaction rate expression is given in Equation (6).
r H M F = k s r · K A · K H · C T S 1 · C T S 2 H · C H M F 0 · P H 2 · C * 1 + K H · P H 2 H · 1 + K A · C H M F 0 · C * + K B · C H M F 0 · 1 C *  
In both equations, the HMF concentration is expressed in a dimensionless way (C* = C H M F / C H M F 0 ) to make explicit the presence of the initial HMF concentration ( C H M F 0 ) as a parameter for consideration.
Influence of Hydrogen Pressure
The influence of hydrogen pressure ( P H 2 ) was investigated at 393 K and varying   P H 2 between 200 and 1500 kPa at two different initial HMF concentrations ( C H M F 0 = 0.13 M and C H M F 0 = 0.04 M). Figure 3a,b show the HMF conversion as a function of W · t / n H M F   0 for different P H 2   and two different C H M F 0 . For C H M F 0 = 0.13 M (Figure 3a), the conversion profiles did not show significant differences between them, especially at HMF conversion levels below 30%. The   r H M F   0 calculated for these runs showed approximately the same values (run 4,9–11; Table 3). In contrast, when the initial HMF concentration was 0.04 M (Figure 3b), the r H M F   0 increased as   P H 2   increased (run 2,6–8; Table 3). The apparent reaction order of H2 (m) at the two C H M F   0 concentrations was estimated by applying a linear regression over the plot of ln r H M F 0 v s   ln P H 2 , as shown in Figure 3c. The estimated m was (0.06 ± 0.08) at a 0.13 M initial HMF concentration, explaining the lack of influence of H2 pressure on the initial rate of the HMF hydrogenation. However, the estimated m for an initial HMF concentration of 0.04 M was (0.81 ± 0.07), in agreement with the positive effect of H2 pressure on the HMF hydrogenation rate (Figure 3c) at this level of HMF concentration.
Influence of HMF Concentration
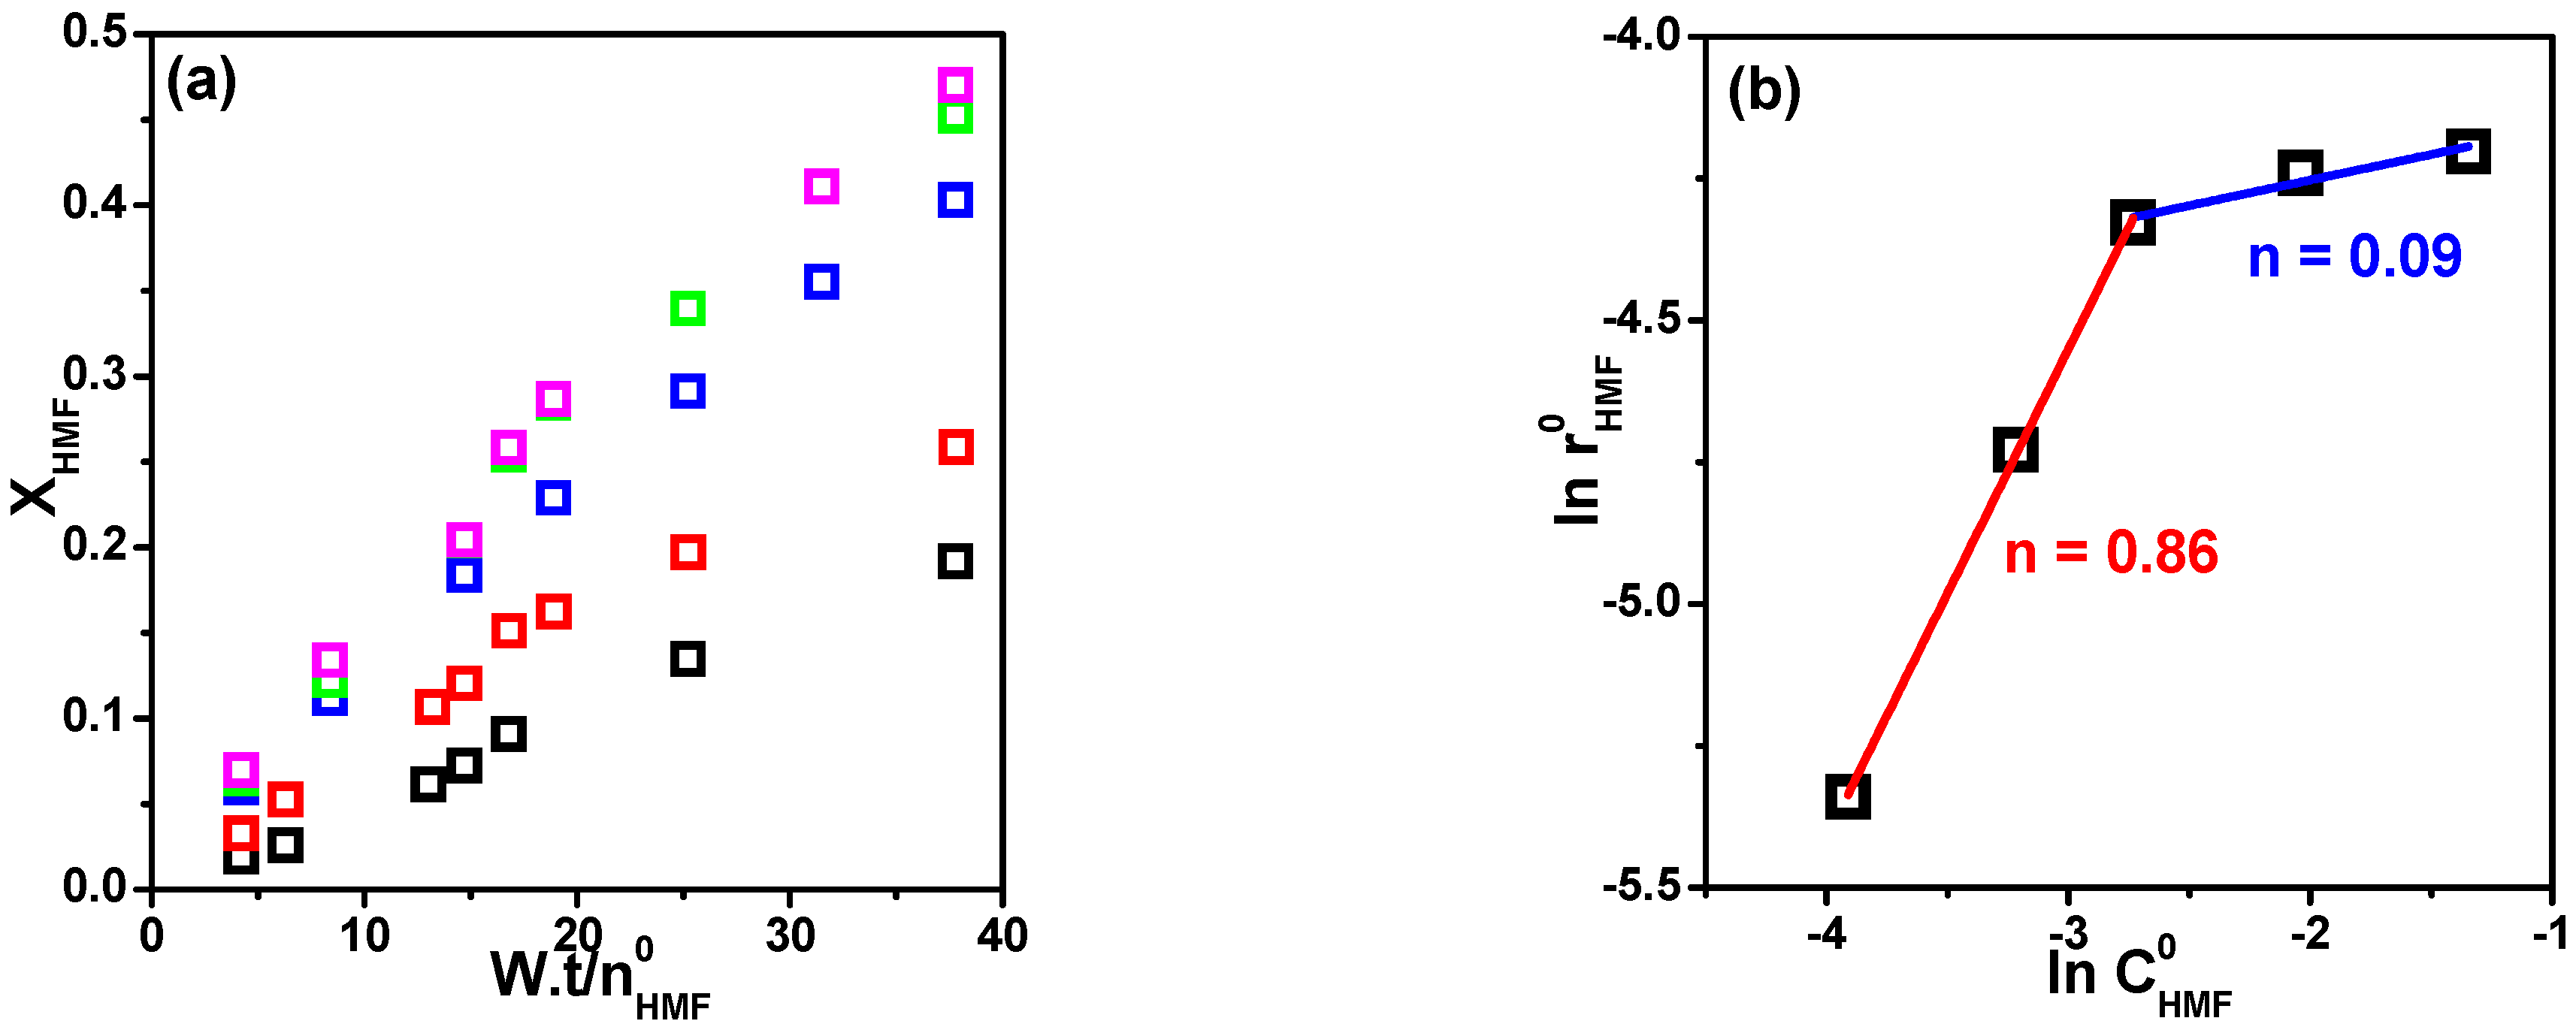
The effect of initial HMF concentration ( C H M F 0 = 0.02 M − 0.26 M) on the catalytic activity and HMF conversion was studied at T = 393 K and P H 2 = 1500 kPa, while keeping the W / n H M F   0 ratio constant. Figure 4a shows the influence of C H M F 0 on the HMF conversion rate (runs 1–5). Precisely, the r H M F 0 increased with rising initial HMF concentration, as can be seen in Table 3. This increase in the initial hydrogenation rate diminishes in importance for concentrations above 0.065 M. From the plot representing ln r H M F 0   as a function of ln C H M F 0 and applying lineal regression, the apparent reaction order with respect to HMF (n) was estimated (Figure 4b). In agreement with the above, the value of n depended on the range of initial concentrations analyzed. In the 0.02 M-to-0.065 M range (run 1 to 3; Table 3), the estimate for n was (0.86 ± 0.07), a positive apparent order with respect to HMF. For initial concentrations above 0.065 M (run 3 to 5; Table 3), the estimate for n was (0.09 ± 0.9), indicating that the reaction became independent of HMF concentration. These findings suggest that HMF molecules can be strongly chemisorbed on a Cu/SiO2-PD catalyst and total coverage of the metallic active sites occurs at a high HMF concentration.
Pseudo-Homogeneous Modeling
First of all, we estimate the apparent order in H2 (m) by fitting dimensionless concentration data C *   v s   W · t / n H M F   0 with Equation (1) (model 1). This fit was performed on a subset of data corresponding to a maximum conversion level of 30% from runs 2, 4 and 6 to 11. These calculations allowed the estimation of the reaction order in H2 when the initial HMF concentrations were 0.04 and 0.13, respectively. The parameter estimates and the 95% confidence intervals are presented in Table 4. Figure 5a shows both the experimental data using the dimensionless concentration and the regression curve obtained with model 1. Table 4 also presents the determination coefficient (DC) of each regression, indicating the quality of the fitting.
An acceptable agreement between estimates for the apparent order with respect to H2 (m) with model 1 (Figure 5) and from the plots of ln r H M F 0 (Figure 3c) was obtained (Table 4). Indeed, with both fittings, a positive effect of H2 pressure on the hydrogenation rate for an initial HMF concentration of 0.04 M (runs 2, 6–8) was found. In contrast, the linear regression of ln r H M F   0 (Figure 3c) when the HMF concentration was 0.13 M (runs 4, 9–11) gave a 95% confidence interval greater than the estimate of m, while the fitting with model 1 produced an apparent order in H2 that was significantly different from zero. However, this estimate was considerably smaller than the one found for an initial HMF concentration of 0.04 M, indicating a lower influence of H2 pressure on the HMF hydrogenation rate as the HMF concentration increases.
These first outcomes indicate that the apparent reaction order in H2 on the HMF rate of reaction depends to some extent on the initial HMF concentration. Moreover, the estimates of m lower than 1 indicate a possible strong interaction of HMF with the catalyst surface. In other words, the HMF molecules may be strongly adsorbed on the surface of the Cu/SiO2-PD catalyst. Consequently, the higher the initial HMF concentration, the less accessible the metallic sites will be for H2. This will influence the catalytic activity and the apparent order with respect to H2.
Table 4 also presents the apparent orders of reaction with respect to HMF obtained from the non-linear regression of C *   v s   W · t / n H M F 0 data for conversions below 30% (Figure 5b) and using Equation (1) (model 1). The estimate for n obtained from this fitting was (0.78 ± 0.11), which is in good agreement with that obtained from the linear regression of l n   r H M F 0   v s   l n   C H M F   0 (0.86 ± 0.07).
LHHW Heterogeneous Modeling
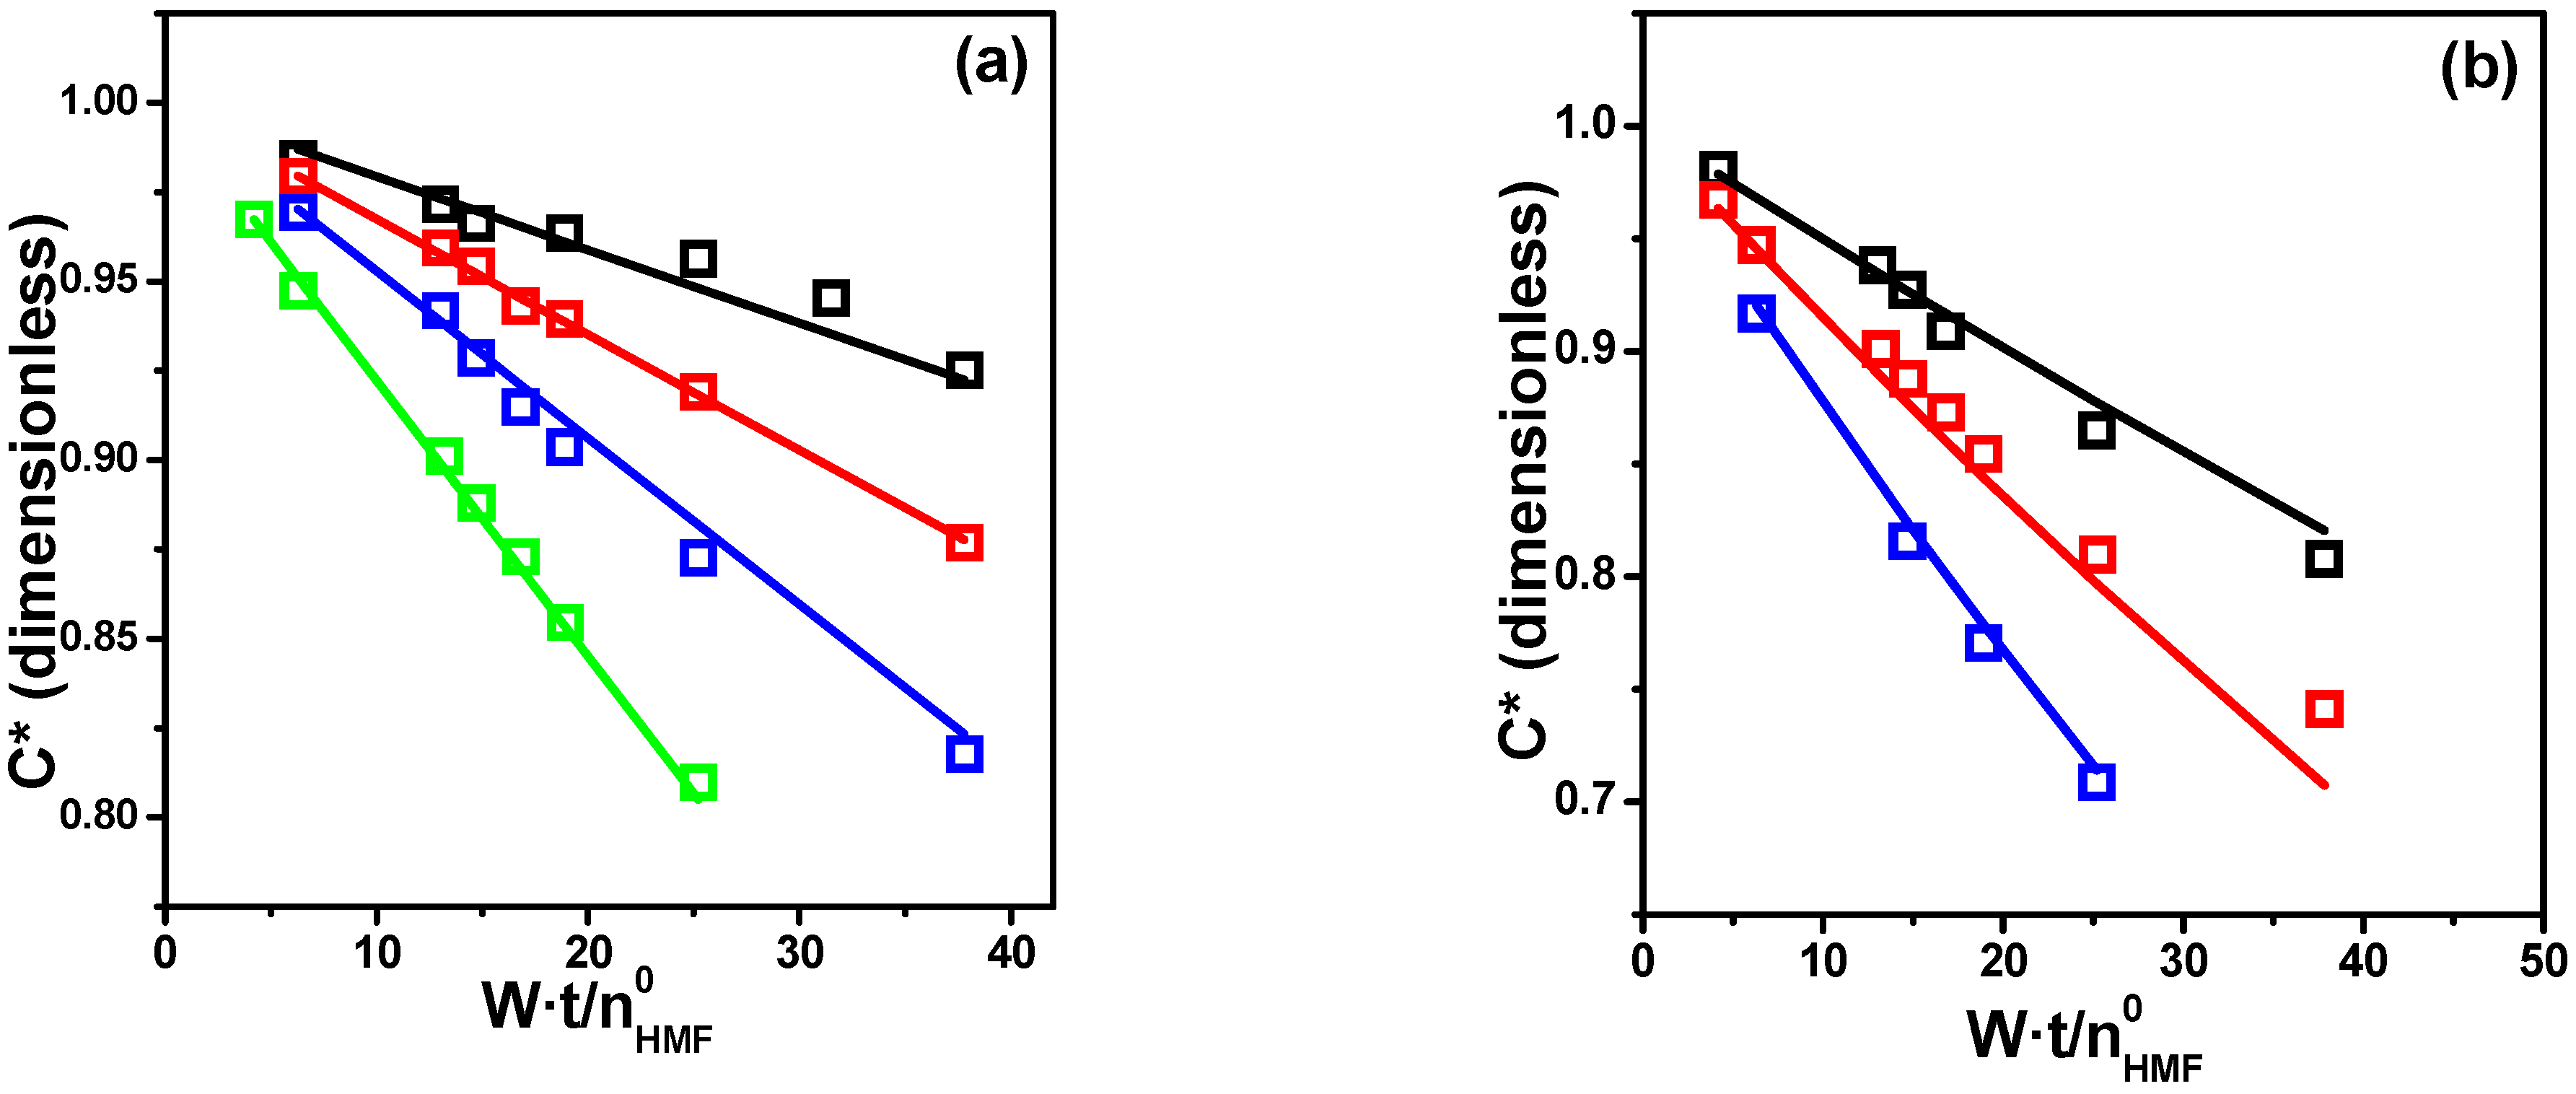
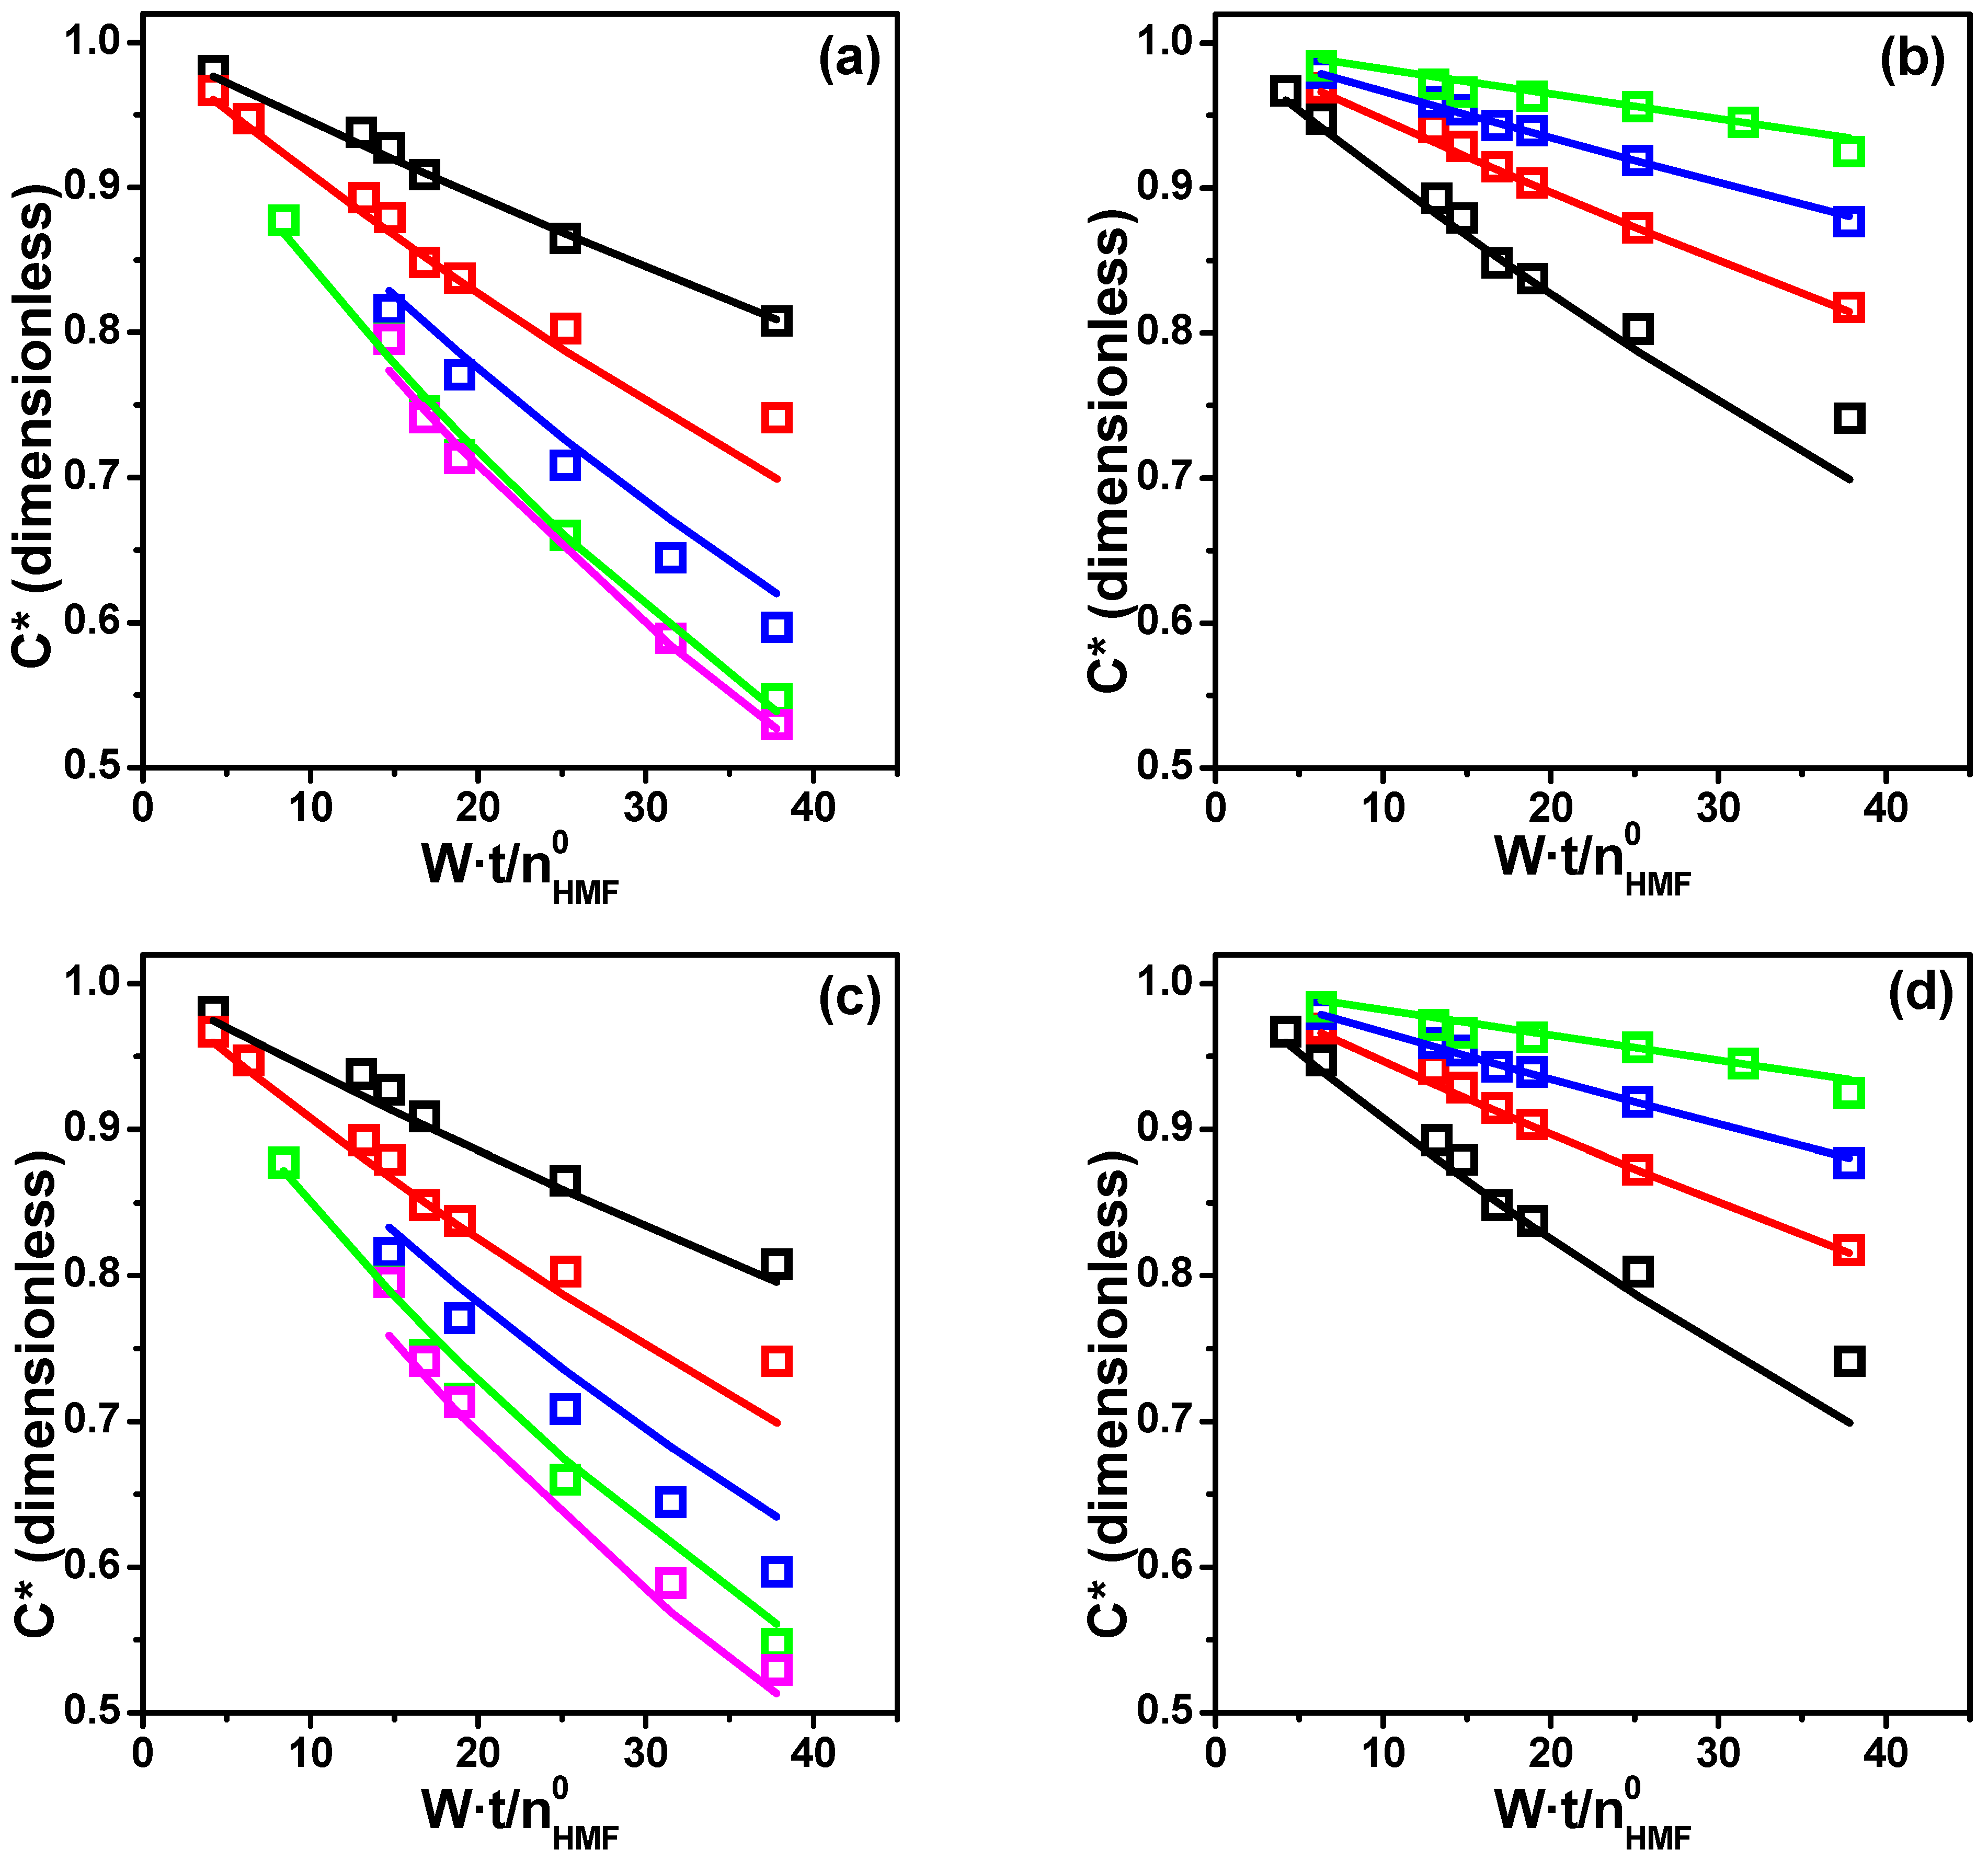
The results obtained when the regression of the experimental data was carried out using LHHW models (model 2 and model 3) are presented in Figure 6 and Table 5. It is worth clarifying that in this case, runs 1 through 8 were fitted using the entire data set simultaneously, but for conversions lower than 45%. This allowed for individual, uncorrelated estimates of the kinetic parameters (not as lumped parameters). The estimates and their confidence intervals are presented in Table 5, as well as the determination coefficient (DC) obtained after fitting the data with both models.
Both LHHW models yielded similar fits, which did not show major discrepancies graphically. However, for the data subset under analysis, model 2 showed a slightly better fit (0.9920 vs. 0.9849) than model 3. It is worth noting that both models yielded positive parameter estimates, which were significantly different from zero with a 95% CI. Nevertheless, it is evident that both models deviated from the experimental results at high HMF concentrations (Figure 6).
If we use the estimates obtained from the data set of runs 1 to 8 (Table 5) as initial values to fit the full data set, i.e., runs 1 to 11 and for the entire time range analyzed, the estimates remain positive but their 95% CIs as well as DCs worsen (Table S2). This is because for high conversions or high reaction times, the considered models deviate from the experimental data (Figures S4 and S5). One of the possible causes could be the loss of catalytic activity of Cu/SiO2-PD due to the blockage of active sites by strong adsorption of HMF or BHMF [31].
Since the proposed LHHW models fail to provide an adequate fit when considering the high HMF conversion, i.e., low HMF concentrations, we decided to incorporate a term into the model that involves the observed activity diminution. With this aim in mind, we considered the decrease in active sites available due to the strong adsorption of BHMF (HMF) through an additional adsorption term. Considering this hypothesis, and following the same procedure as with LHHW, two new rate expressions were derived. Modified model 2 (Equation (7)) and modified model 3 (Equation (8)) are now used to solve the mass balance and perform the regression analysis.
r H M F = k s r · K A · K H · C T S 2 H · C H M F 0 · P H 2 · C * · 1 K B S · C H M F 0 · 1 C * 2 1 + K H · P H 2 H + K A · C H M F 0 · C * + K B · C H M F 0 · 1 C * 2  
r H M F = k s r · K A · K H · C T S 1 · C T S 2 H · C H M F 0 · P H 2 · C * · 1 K B S · C H M F 0 · 1 C * 1 + K H · P H 2 H · 1 + K A · C H M F 0 · C * + K B · C H M F 0 · 1 C *  
These two modified models incorporate a new parameter KBS that considers the irreversible adsorption of BHMF on the S or S2 sites, i.e., sites remaining unavailable for the surface reaction because they are covered by BHMF.
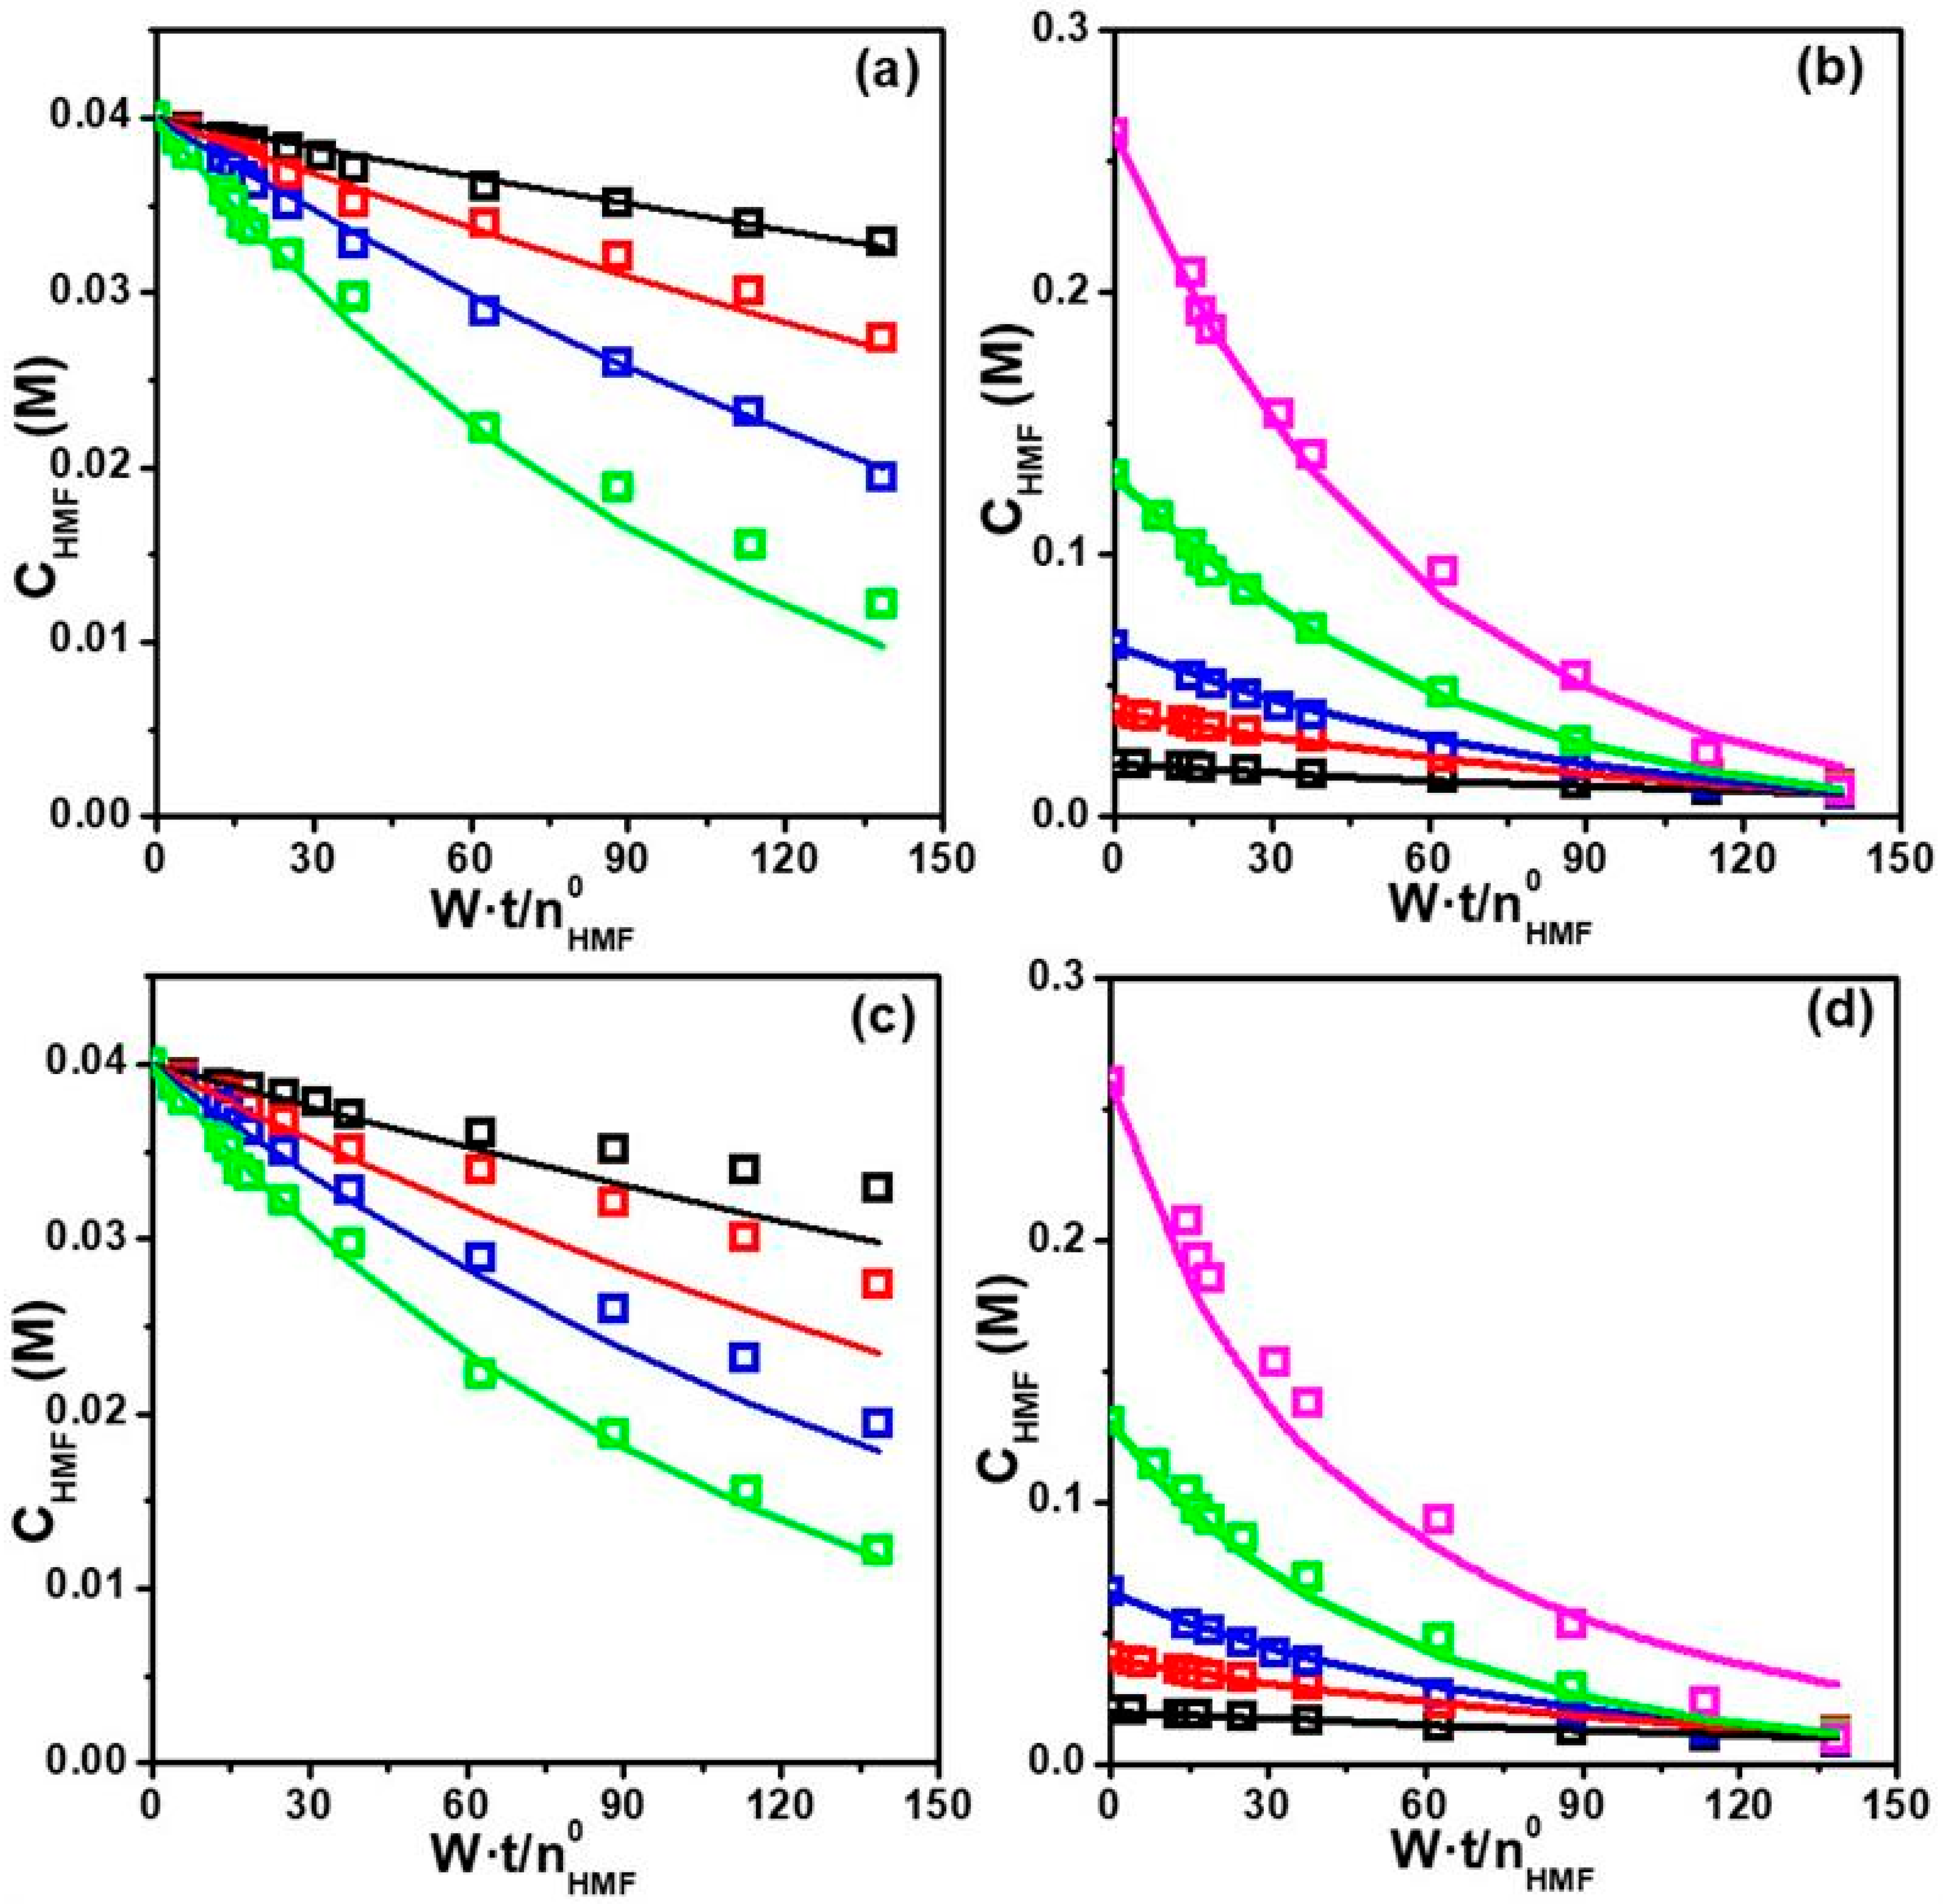
The figures showing the results of the fittings using modified models 2 and 3, which consider the loss of active sites due to BHMF adsorption, are presented in Figure 7. The parameter estimates and their 95% CIs are summarized in Table 6. It was found for modified model 2 that the estimates of two parameters (KB and KBS) are non-significantly different from zero with 95% confidence. In addition, the DC for the modified model 3 is higher than the one for the modified model 2. In addition, all the parameter estimates with modified model 3 are significantly different from zero with 95% confidence. It is worth noting that for this model, the estimates for the adsorption constants of HMF and BHMF (parameters KA and KB) reflect an important level of interaction of these molecules with the catalyst surface. Thus, it can be concluded that modified model 3 fits the experimental data better in its whole range than modified model 2.
Figure 7 presents the complete experimental data and the fits achieved when fitting was carried out considering modified models 2 and 3. The good quality of the fit for model 3 can be seen, which is consistent with the DC value obtained (Table 6).
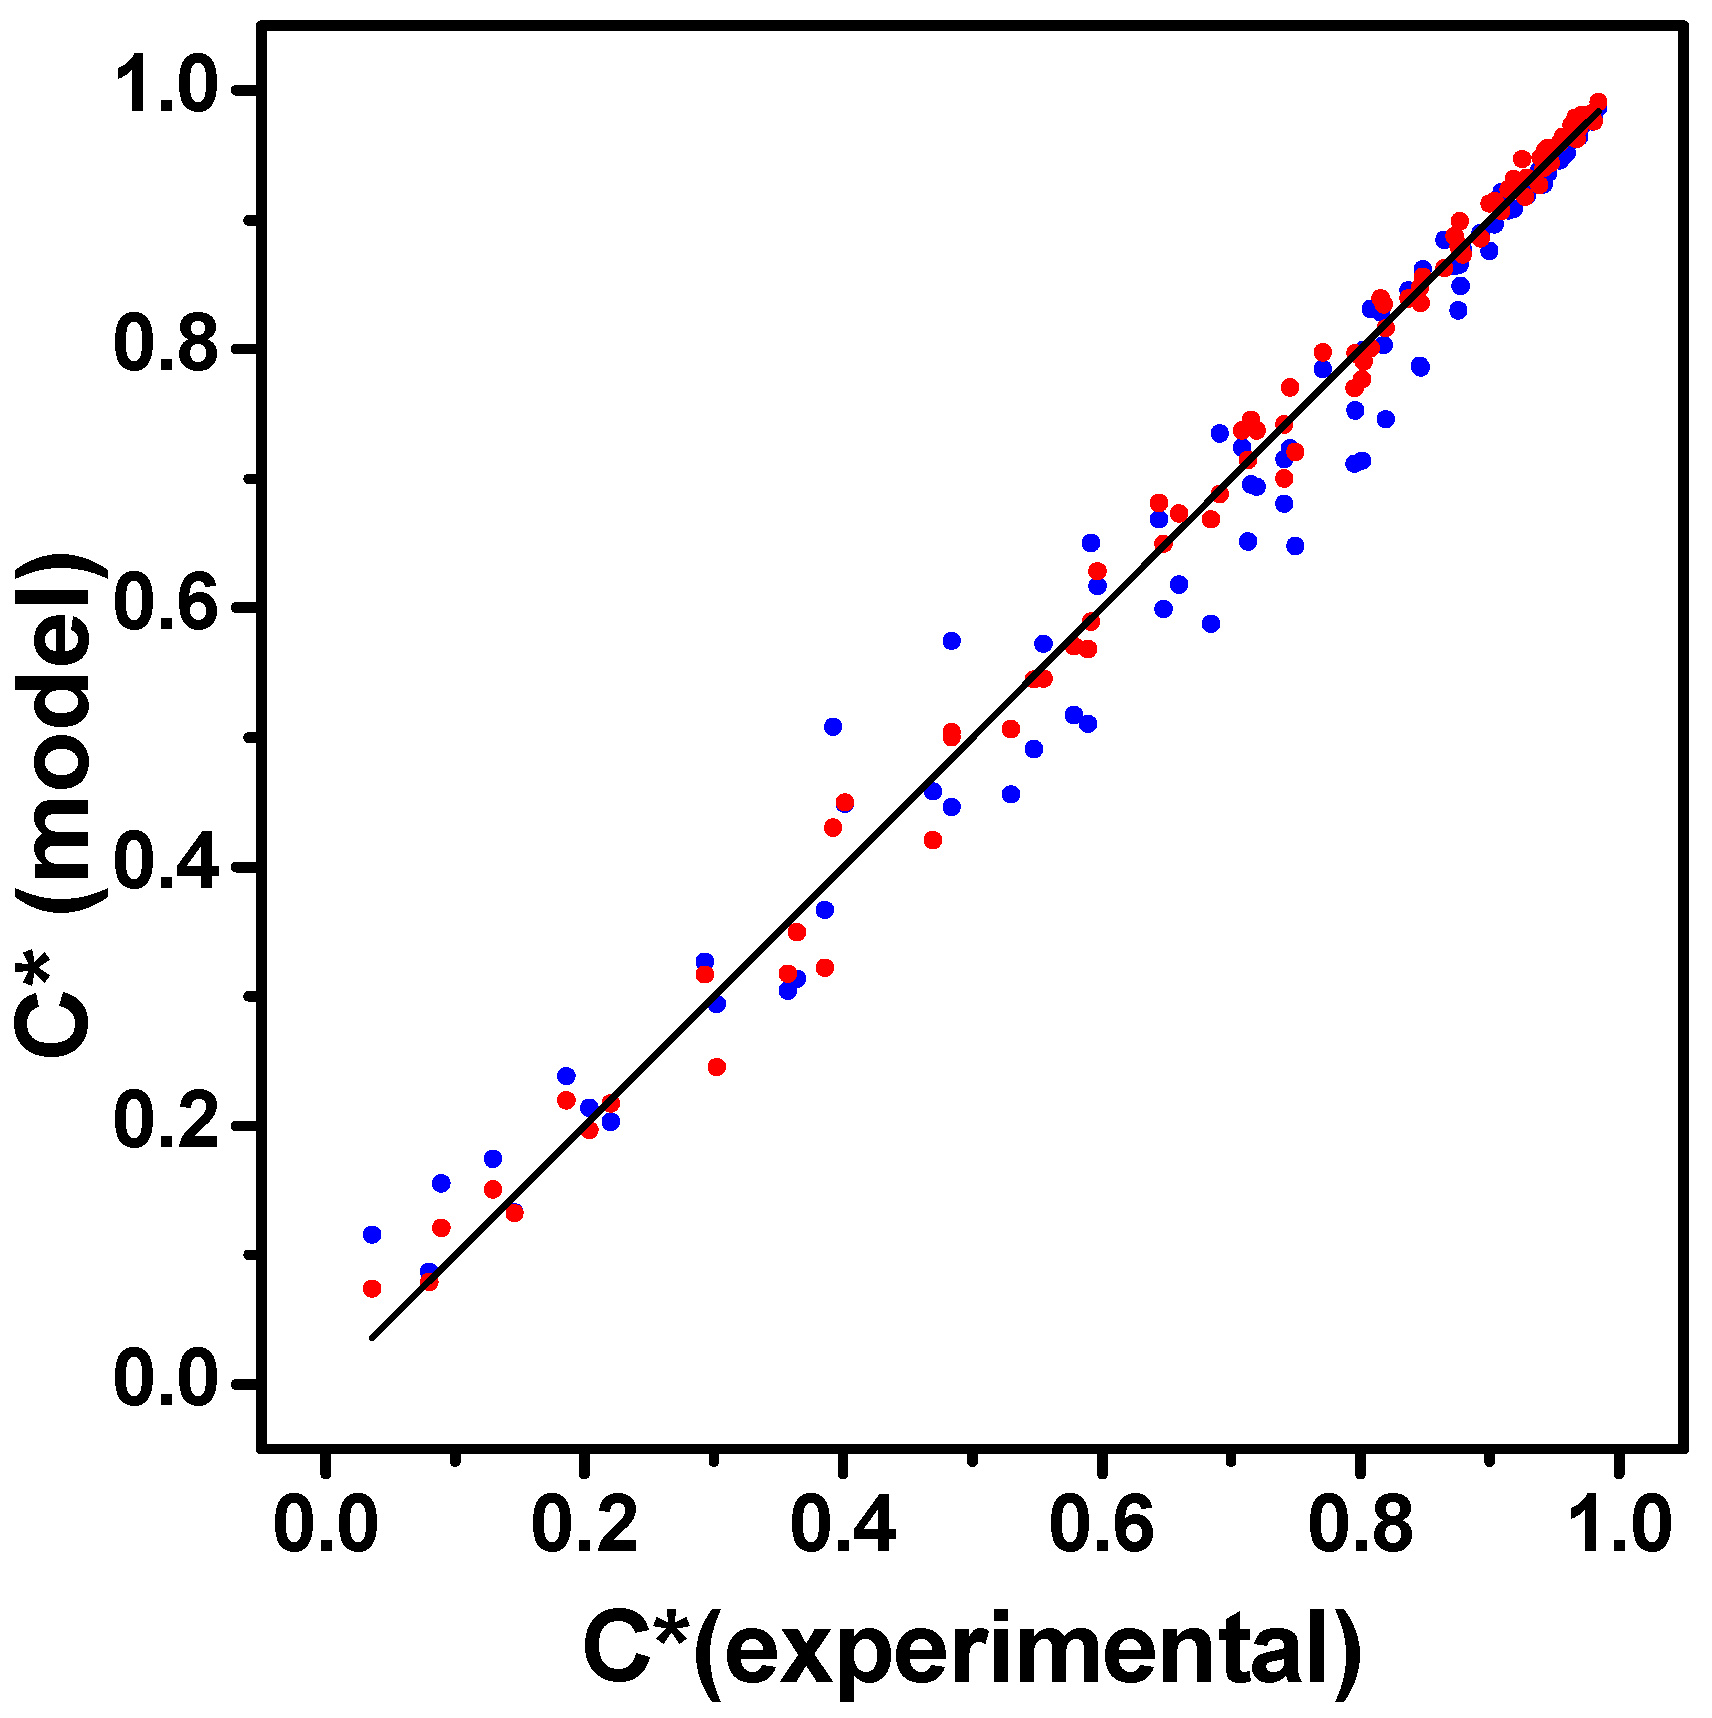
As a measure of the goodness of fit from modified models 2 and 3, Figure 8 presents a parity plot showing the relation between the experimental and model data. It can be seen from the parity plot, on the one hand, that the data predicted by modified model 3 (red circles) fit the experimental data better than modified model 2 (blue circles). On the other hand, it can also be seen how the discrepancy between the experimental data and the data fitted by the models increases for higher HMF conversions or reaction times.

4. Discussion

Characterization by XRD, TPR, TEM, and N2O chemisorption revealed that the Cu/SiO2-PD catalyst is composed of a highly dispersed metallic copper phase on the large specific surface area of silica. The high selectivity to BHMF observed in the liquid-phase hydrogenation of HMF using this Cu/SiO2-PD catalyst was attributed to a combined effect of the highly dispersed metallic copper phase and low surface acidity. However, partial catalyst deactivation, caused by a blockage of the active phase with strongly chemisorbed surface carbonaceous compounds, was observed [31].
In this work, it was found that the highest activity for the liquid-phase HMF hydrogenation over the Cu/SiO2-PD catalyst was reached when THF was used as a solvent. The activity pattern obtained was THF > 2-POH > H2O. In order to explain this pattern, the solvent–copper surface, solvent–H2, and solvent–HMF interactions must be taken into account. In a previous paper, it was found that solvent–copper surface interactions with polar and non-polar solvents are, in general, very low [38]. Thus, they were not considered in this analysis. The higher activity ( r H M F 0 ) observed with organic solvents compared to H2O may be strongly influenced by the more elevated solubility of H2 in organic solvents, which is approximately five times that in water (Table S1, [39,40]). However, the difference in r H M F   0 when comparing THF and 2-POH cannot be attributed to H2 solubility, as it is very similar in both solvents. Therefore, the possible influencing factor on catalytic activity would be the solvation of HMF molecules by the solvent. One way to describe the reactant–solvent interaction is through solvatochromic scales of polarity, as already developed in previous works [40,41,42]. Kamlet et al. [43] introduced the solvatochromic parameters α and β, which measure the ability of a solvent to donate or accept hydrogen bonds. The values of α and β for 2-POH are higher than those for THF (Table S1), suggesting that the interaction between 2-POH and HMF is stronger than the interaction between THF and HMF. In other words, hydrogen bonds between HMF and 2-POH are stronger than those of HMF with THF. As a consequence, the HMF dissolved into 2-POH would be more stabilized in the liquid phase and less available to interact with the metal copper surface, influencing the reaction kinetics. Finally, it is likely that strong water–HMF interactions hinder HMF chemisorption on the metal copper surface, thus contributing to the very low activity during HMF hydrogenation on Cu/SiO2-PD when water is used as the solvent. On the other hand, HMF and BHMF can interact with water molecules, forming intermediates that finally lead to ring opening, according to that proposed in previous works [34,35,36]. The last would explain the low selectivity to BHMF when water is used as a solvent.
It was determined that the HMF conversion rate increases with H2 pressure when the HMF initial concentration is 0.04 M, and a reaction order with respect to H2 near unity was estimated (0.81 ± 0.07) by linear regression. Instead, for an HMF initial concentration of 0.13 M, the estimate for the reaction order with respect to H2 was not significantly different from zero (0.06 ± 0.08), confirming that the changes in the HMF hydrogenation rate with H2 pressure depend in turn on the initial concentration of HMF. These results indicate that it is very likely that interactions between HMF molecules and metallic copper sites are important because they remain chemisorbed on them, hindering H2 chemisorption. Therefore, no effect on the catalytic HMF hydrogenation can be observed as the H2 pressure is raised when HMF concentration is high enough.
Experiments performed by varying the initial concentration of HMF, while keeping the H2 pressure constant, showed that the estimate for the reaction order in HMF changes from a value close to unity (0.86 ± 0.07), for initial concentrations between 0.02 and 0.065 M, to a value close to zero (0.09 ± 0.90) in the concentration range of 0.065 to 0.26 M. Since this estimated reaction order varies according to the initial concentration range of HMF, the hypothesis of high HMF–active metal copper site interaction is proven. As a consequence of this high HMF–metallic copper interaction, at initial reagent concentrations greater than 0.065 M, the metallic copper surface is almost completely covered with HMF molecules. This hinders the chemisorption of new HMF molecules, and consequently, the hydrogenation rate is not influenced by increasing the HMF concentration in the liquid phase.
The fit with pseudo-homogeneous model 1 (Equation (1)) of the experimental data, up to a HMF conversion of 30% for different H2 pressures, confirms what was observed in the linear regression for the initial HMF concentrations 0.04 M and 0.13 M. A positive order with respect to H2 was estimated for an initial HMF concentration of 0.04 M, while in the case where initial HMF concentration was 0.13 M, an order of H2 near zero was estimated. In addition, in all of the cases, the reaction order with respect to H2 was less than one, which reinforces the proposal of high interactions between HMF and the active metal surface, leading to high metal surface coverage when the HMF concentration in the liquid phase is high enough. There was also a good agreement between the estimates for the reaction order in HMF at a given pressure, applying linear regression and pseudo-homogeneous modeling for data up to 30% HMF conversion.
In order to obtain better insight into the kinetics of liquid-phase HMF hydrogenation, a fitting of the experimental data up to 45% reactant conversion using heterogeneous LHHW models was carried out. Initially, two heterogeneous models were employed: one model considered the same type of metallic active sites for the chemisorption of H2, HMF, and BHMF, and the other model assumed one type of active site for H2 adsorption and another type for HMF and BHMF chemisorption. A good fitting of the experimental data was attained by applying both models, with all estimates significantly different from zero in both cases and with similar DCs. However, both models failed to fit data for conversions higher than 45%. This may be attributed to the loss of catalytic activity, probably caused by the blockage of metallic active sites by the strong adsorption of the reactant (HMF) or main product (BHMF), which becomes more important at higher HMF conversions. Therefore, two modified LHHW models that considered the strong adsorption of BHMF were proposed to fit the whole range of the experimental data. Modified model 3 gave a better fitting than modified model 2. In addition, all the estimates for the parameters with modified model 3 were significantly different from zero with 95% confidence. Moreover, the estimates for the two adsorption parameters, KA and KB, reflected the strong interactions of HMF and BHMF with active sites. Instead, two parameters that were not significantly different from zero were estimated with modified model 2. In this way, modified model 3 not only gave a better fitting than model 3 and modified model 2 but also may explain the catalyst deactivation due to blockage of active sites S2 by the strong adsorption of HMF and BHMF on them. These compounds can be desorbed by thermal treatment under air flow and catalyst activity can be recovered after subsequent reduction under H2 flow [31].

5. Conclusions

It was found that Cu/SiO2-PD catalytic performance for the liquid-phase hydrogenation of 5-hydroxymethylfurfural (HMF) is higher when tetrahydrofuran (THF), an aprotic molecule with moderate polarity, is used as a solvent instead of 2-propanol or water, both protic molecules of high polarity. This is attributed to both a lower H2 solubility and interactions between the HMF and solvent, which favor HMF adsorption on surface metal copper sites.
Pseudo-homogeneous modeling, by linear and non-linear regression, indicates that there is an important interaction of the reactant and main product molecules with active metallic copper sites. This leads to a change in the reaction orders with respect to HMF and H2, from positive orders to practically order zero, with increasing initial reactant concentrations. The latter means that total coverage of metallic active sites by the reactant and/or product molecules occurs.
Heterogeneous LHHW modeling is in agreement with the above, since the model that best fit the data considered the interaction of both HMF and 2,5-bis(hydroxymethyl)furan (BHMF) with metal copper sites. The estimates for the adsorption parameters are in agreement with the hypothesis of a high interaction of HMF and BHMF with metallic copper sites. The latter would explain the reversible deactivation of Cu/SiO2-PD in the liquid-phase HMF hydrogenation previously found. Thus, this kinetic study allows us to predict not only the Cu/SiO2-PD catalyst’s performance but also its deactivation during liquid-phase HMF hydrogenation.

Supplementary Materials

The following supporting information can be downloaded at https://www.mdpi.com/article/10.3390/suschem6030022/s1, Figure S1: TPR profile of calcined Cu/SiO2-PD (H2 (5%)/Ar; 60 cm3/min; 10 K/min); Figure S2: Mass spectroscopy (MS) of 1-hydroxy-2,5-hexanedione; Figure S3: Mass spectroscopy (MS) of 2,5-hexanedione; Figure S4: HMF dimensionless concentration ( C * ) as a function of parameter W · t / n H M F 0 for entire set of data at 393 K and fitting curves with model 2; Figure S5: HMF dimensionless concentration (C*) as a function of parameter   W · t / n H M F 0 for entire set of data at 393 K and fitting curves with model 3; Table S1. H2 solubilities and solvatochromic parameters (α and β) of the solvents used; Table S2. Estimated values and their 95% CI for the parameters from model 2 and 3 obtained after the fitting of the complete experimental data from runs 1 to 11.

Author Contributions

J.Z. was involved in conceptualization, methodology development, experimental investigation, data curation, and drafting the original manuscript. H.A.D. was responsible for experimental execution, data collection, visualization, and critical revision of the manuscript. A.J.M. contributed to supervision, funding acquisition, and overall project coordination, as well as to manuscript review and editing. C.I.M. participated in conceptualization, formal analysis, modeling, and application of quantitative techniques, and contributed to supervision and methodology design. All authors have read and agreed to the published version of the manuscript.

Funding

This research was funded by CONICET (Consejo Nacional de Investigaciones Científicas y Técnicas), grant number PIP 2017-767; ANPCyT (Agencia Nacional de Promoción Científica y Tecnológica), grant number PICT 2015-1892; and UNL (Universidad Nacional del Litoral), grant number CAI+D 2020-50620190100066LI.

Institutional Review Board Statement

Not applicable.

Informed Consent Statement

Not applicable.

Data Availability Statement

The data presented in this study are available upon request from the corresponding author.

Acknowledgments

The authors thank CONICET (Consejo Nacional de Investigaciones Científicas y Técnicas) for their financial support of this research. The authors especially thank MDPI for the invitation to publish in the Sustainable Chemistry Journal (MDPI).

Conflicts of Interest

The authors declare no conflicts of interest.

Abbreviations and Nomenclature

The following abbreviations are used in this manuscript:
HMF5-hydroxymethylfurfural
BHMF2,5-bis-(hydroxymethyl)furan
H2OWater
2-POH2-propanol
THFTetrahydrofuran
LHHWLangmuir–Hinshelwood–Hougen–Watson
WMass of Cu/SiO2 catalyst charged in the reactor (g)
tTime of reaction (h)
njMoles of species j (mol)
n0HMFInitial moles of HMF charged in the reactor (mol)
XHMFFractional conversion of HMF
yjFractional yield of reaction product j
SjSelectivity to reaction product j
CBCarbon balance of reaction
r0HMFInitial HMF reaction rate (mol/g·h)
rHMFHMF reaction rate (mol/g·h)
CHMFHMF concentration in the liquid phase (mol/L)
CBHMFBHMF concentration in the liquid phase (mol/L)
CH2Hydrogen concentration in the liquid phase (mol/L)
PH2Hydrogen pressure in the gas phase (kPa)
C*Experimental or model-calculated dimensionless HMF concentration (CHMF/C0HMF)
mApparent order of reaction for H2
nApparent order of reaction for HMF
HHenry constant of H2 in the liquid solvent (kPa·L/mol))
kphForward rate constant for pseudo-homogeneous model (mol1−n·Ln/(h·g·kPam))
ksrForward rate constant for solid surface elemental reaction (g/h·mol)
KHAdsorption equilibrium constant for H2 on the catalytic site (L/mol)
KAAdsorption equilibrium constant for HMF on the catalytic site (L/mol)
KBAdsorption equilibrium constant for BHMF on the catalytic site (L/mol)
CTSiTotal surface concentration of site Si (S1 or S2) (mol/g)
CjSiSurface concentration of species j adsorbed on site Si (S1 or S2) (mol/g)
kLumped kinetic constant for LHHW model ((L/(h·g·kPa))
KBSParameter considering the irreversible adsorption of BHMF on the S or S2 sites (L/mol)
SSESquared sum of errors
DCDetermination coefficient
IC95% confidence interval

Appendix A

The stirring speed and particle size used, 760 rpm and less than 75 μm, respectively, over all runs were suitable to ensure that external and intraparticle mass transfer were not controlling the reaction rate. Under these conditions and for modeling purposes, any possible mass transfer limitations could be ruled out [44,45]. It is also important to remark that all experiences for kinetic modeling were performed with a constant W/n0HMF ratio (catalyst mass/HMF initial moles) equal to 25 g/mol and the same fluid dynamics conditions. The mass balance of HMF corresponding to the type of reactor used in this work can be expressed by Equation (A1).
d X H M F d W · t n H M F 0 = d C * d W · t n H M F 0 = r H M F  
Solving this differential equation for a particular rate expression, whose initial condition is given in Equation (A2), allows the procurement of the HMF concentration values.
W · t n H M F 0 = 0   C * = 1  
Under the consideration of the LHHW hypothesis of the surface reaction as an elementary controlling step, with the remaining steps in equilibrium, the rate of the HMF reaction is Equation (A3) for model 2 and Equation (A4) for model 3.
r H M F = k · C H M F S · C H 2 S  
r H M F = k · C H M F S 2 · C H 2 S 1  
where the concentrations of adsorbed H2 and HMF (and eventually BHMF) are obtained from the adsorption steps considered in equilibrium. So, CH2S and CHMFS are explicitly expressed in Equations (A5) and (A6) for model 2, and Equations (A7) and (A8) for model 3.
C H 2 S = K H · C H 2 ( l ) · C S  
C H M F S = K A · C H M F · C S  
C H 2 S 1 = K H · C H 2 ( l ) · C S 1  
C H M F S 2 = K A · C H M F · C S 2  
The BHMF formed is considered adsorbed on the S or S2 sites according to the model, and through its adsorption constant, its concentration in the liquid phase can be obtained using Equation (A9) or (A10).
C B H M F S = K B · C B H M F · C S  
C B H M F S 2 = K B · C B H M F · C S 2  
Now, Equations (A5)–(A10) are used in the total active site balance for model 2 (Equation (2)) to obtain Equation (A11), and for model 3 (Equations (3) and (4)) to obtain Equations (A11)–(A13), respectively.
C T S = C S · 1 + K H · C H 2 ( l ) + K A · C H M F + K B · C B H M F  
C T S 1 = C S 1 · 1 + K H · C H 2 ( l )  
C T S 2 = C S 2 · 1 + K A · C H M F + K B · C B H M F  
Finally, all concentrations of species adsorbed and CS can be replaced on the corresponding rate expression (Equation (A3) or (A4)) to obtain the rate expression for HMF corresponding to models 2 and 3, namely Equations (5) and (6), respectively.

References

  1. Mülhaupt, R. Green Polymer Chemistry and Bio-based Plastics: Dreams and Reality. Macromol. Chem. Phys. 2013, 214, 159–174. [Google Scholar] [CrossRef]
  2. Singh, N.; Ogunseitan, O.A.; Wong, M.H.; Tang, Y. Sustainable materials alternative to petrochemical plastics pollution: A review analysis. Sustain. Horiz. 2022, 2, 100016. [Google Scholar] [CrossRef]
  3. Kumar, R.; Verma, A.; Shome, A.; Sinha, R.; Sinha, S.; Jha, P.K.; Kumar, R.; Kumar, P.; Shubham; Das, S.; et al. Impacts of Plastic Pollution on Ecosystem Services, Sustainable Development Goals, and Need to Focus on Circular Economy and Policy Interventions. Sustainability 2021, 13, 9963. [Google Scholar] [CrossRef]
  4. Naser, A.Z.; Deiab, I.; Darras, B.M. Poly(lactic acid) (PLA) and polyhydroxyalkanoates (PHAs), green alternatives to petroleum-based plastics: A review. RSC Adv. 2021, 11, 17151–17196. [Google Scholar] [CrossRef]
  5. Abrha, H.; Cabrera, J.; Dai, Y.; Irfan, M.; Toma, A.; Jiao, S.; Liu, X. Bio-Based Plastics Production, Impact and End of Life: A Literature Review and Content Analysis. Sustainability 2022, 14, 4855. [Google Scholar] [CrossRef]
  6. Wan, Y.; Lee, J.M. Recent Advances in Reductive Upgrading of 5-hydroxymethylfurfural via Heterogeneous Thermocatalysis. ChemSusChem 2022, 15, 1864–5631. [Google Scholar] [CrossRef]
  7. Khoonsap, S.; Buengkitcharoen, L.; Amnuaypanich, S.; Thongnoppakhun, N.; Patdhanagul, N.; Suthirakun, S.; Sukpattanacharoen, C.; Amnuaypanich, S. Synergistic effect of silanols in mesopores leading to unexpected catalysis of dendritic mesoporous silica particles in the aqueous-phase synthesis of 5-hydroxymethylfurfural from fructose. Chem. Eng. J. 2023, 477, 147074. [Google Scholar] [CrossRef]
  8. Chacón-Huete, F.; Messina, C.; Cigana, B.; Forgione, P. Diverse applications of biomass-derived 5-hydroxymethyl furfural and derivatives as renewable starting materials. ChemSusChem 2022, 15, 1–17. [Google Scholar] [CrossRef]
  9. Zhang, J.; Wang, T.; Tang, X.; Peng, L.; Wei, J.; Lin, L. Methods in the synthesis and conversion of 2,5-Bis-(hydroxymethyl)furan from bio-derived 5-hydroxymethylfurfural and its great potential in polymerization. Bioresources 2018, 13, 7137–7154. [Google Scholar] [CrossRef]
  10. Mou, Z.; Chen, E.Y. Polyesters and Poly(ester-urethane)s from Biobased Difuranic Polyols. ACS Sustain. Chem. Eng. 2016, 4, 7118–7129. [Google Scholar] [CrossRef]
  11. Friend, C.M.; Xu, B. Heterogeneous Catalysis: A Central Science for a Sustainable Future. Acc. Chem. Res. 2017, 50, 517–521. [Google Scholar] [CrossRef]
  12. Chatterjee, M.; Ishizaka, T.; Kawanami, H. Selective hydrogenation of 5-hydroxymethylfurfural to 2,5-bis-(hydroxymethyl)furan using Pt/MCM-41 in an aqueous medium: A simple approach. Green Chem. 2014, 16, 4734–4739. [Google Scholar] [CrossRef]
  13. Vikanova, K.; Redina, E.; Kapustin, G.; Chernova, M.; Tkachenko, O.; Nissenbaum, V.; Kustov, L. Advanced Room-Temperature Synthesis of 2,5-Bis(hydroxymethyl)furan-A Monomer for Biopolymers-From 5-Hydroxymethylfurfural. ACS Sustain. Chem. Eng. 2021, 9, 1161–1171. [Google Scholar] [CrossRef]
  14. Ohyama, J.; Esaki, A.; Yamamoto, Y.; Arai, S.; Satsuma, A. Selective hydrogenation of 2-hydroxymethyl-5-furfural to 2,5-bis(hydroxymethyl)furan over gold sub-nano clusters. RSC Adv. 2013, 3, 1033–1036. [Google Scholar] [CrossRef]
  15. Cai, H.; Li, C.; Wang, A.; Zhang, T. Biomass into chemicals: One-pot production of furan-based diols from carbohydrates via tandem reactions. Catal. Today 2014, 234, 59–65. [Google Scholar] [CrossRef]
  16. Kong, X.; Zhu, Y.; Zhen, H.; Dong, F.; Zhu, Y.; Li, Y.W. Switchable synthesis of 2,5-dimethylfuran and 2,5-dihydroxymethyltetrahydrofuran from 5-hydroxymethylfurfural over Raney Ni catalyst. RSC Adv. 2014, 4, 60467–60472. [Google Scholar] [CrossRef]
  17. Lima, S.; Chadwick, D.; Hellgardt, K. Towards sustainable hydrogenation of 5-(hydroxymethyl)furfural: A two-stage continuous process in aqueous media over RANEY® catalysts. RSC Adv. 2017, 7, 31401–31407. [Google Scholar] [CrossRef]
  18. Brandi, F.; Bäumel, M.; Shekova, I.; Molinari, V.; Al-Naj, M. 5-Hydroxymethylfurfural Hydrodeoxygenation to 2,5-Dimethylfuran in Continuous-Flow System over Ni on Nitrogen-Doped Carbon. Sustain. Chem. 2020, 1, 106–115. [Google Scholar] [CrossRef]
  19. Deussen, P.; Galvanin, F. A model-based experimental design approach toassess the identifiability of kinetic models ofhydroxymethylfurfural hydrogenation in batchreaction systems. Chem. Eng. Res. Des. 2022, 178, 609–622. [Google Scholar] [CrossRef]
  20. Gao, G.; Jiang, Z.; Hu, C. Selective Hydrogenation of the Carbonyls in Furfural and 5-Hydroxymethylfurfural Catalyzed by PtNi Alloy Supported on SBA-15 in Aqueous Solution Under Mild Conditions. Front. Chem. 2021, 9, 759512. [Google Scholar] [CrossRef]
  21. Zhang, Y.; Rezayan, A.; Wang, K.; Wang, J.; Xu, C.C.; Nie, R. On-demand, highly tunable, and selective 5-hydroxymethylfurfural hydrogenation to furan diols enabled by Ni and Ni3Ga alloy catalysts. ACS Catal. 2023, 13, 803–814. [Google Scholar] [CrossRef]
  22. Xiang, S.; Dong, L.; Wang, Z.; Han, X.; Daemen, L.; Li, J.; Cheng, Y.; Guo, Y.; Liu, X.; Hu, Y.; et al. A unique Co@CoO catalyst for hydrogenolysis of biomass-derived 5-hydroxymethylfurfural to 2,5-dimethylfuran. Nat. Comm. 2022, 13, 3657. [Google Scholar] [CrossRef] [PubMed]
  23. Srifa, A.; Kalong, M.; Praikaew, W.; Ratchahat, S.; Chaiwat, W.; Koo-Amornpattana, W.; Klysubun, W.; Limphirat, W.; Assabumrungrat, S.; Kaw, S. Regulation of Pt Loading on Co/Al2O3 Catalysts for Selective Hydrogenation and Hydrogenolysis of 5- Hydroxymethylfurfural to 2,5-Bis(hydroxymethyl)furan and 2,5-Dimethylfuran. ChemCatChem 2024, 16, 22–25. [Google Scholar] [CrossRef]
  24. Zhu, Y.; Kong, X.; Zheng, H.; Ding, G.; Zhu, Y.; Li, Y.W. Efficient synthesis of 2,5-dihydroxymethylfuran and 2,5-dimethylfuran from 5-hydroxymethylfurfural using mineral-derived Cu catalysts as versatile catalysts. Catal. Sci. Technol. 2015, 8, 4208–4217. [Google Scholar] [CrossRef]
  25. Upare, P.P.; Hwang, Y.K.; Hwang, D.W. An integrated process for the production of 2,5-dihydroxymethylfuran and its polymer from fructose. Green Chem. 2018, 20, 875–889. [Google Scholar] [CrossRef]
  26. Zhu, X.; Wang, F.; Yang, L.; Chen, Z.; Zhao, K.; Liu, X.; Xu, Q.; Yin, D.; Yu, N. Silica-supported non-precious copper catalyst for catalytic hydrogenation of 5-hydroxymethylfurfural to 2,5-bis(hydroxymethyl)furan. Mol. Catal. 2024, 553, 113794. [Google Scholar] [CrossRef]
  27. Wang, Q.; Feng, J.; Zheng, L.; Wang, B.; Bi, R.; He, Y.; Liu, H.; Li, D. Interfacial Structure-Determined Reaction Pathway and Selectivity for 5-(Hydroxymethyl)furfural Hydrogenation over Cu-Based Catalysts. ACS Catal. 2020, 10, 1353–1365. [Google Scholar] [CrossRef]
  28. Kang, B.; Chen, Z.; Yang, J.; Hongli He, M.L.; Chen, G.; Huai, L.; Chen, C.; Zhang, J. Boosting hydrogenation properties of supported Cu-based catalysts by replacing Cu0 active sites. Appl. Catal. B Environ. Energy 2025, 361, 124563. [Google Scholar] [CrossRef]
  29. Rezayan, A.; Wu, D.; Zhang, Z.; Yang, X.; Nie, R.; Wang, J.; Lu, T.; Zhang, Y.; Si, X.; Zhang, Y.; et al. Efficient and switchable production of bio-diol/triol chemicals from 5-hydroxymethylfurfural. Green Chem. 2025, 2578–2591. [Google Scholar] [CrossRef]
  30. Jain, A.B.; Vaidya, P.D. Kinetics of Catalytic Hydrogenation of 5-Hydroxymethylfurfural to 2,5-bis-Hydroxymethylfuran in Aqueous Solution over Ru/C. Int. J. Chem. Kinet. 2015, 848, 318–328. [Google Scholar] [CrossRef]
  31. Zelin, J.; Meyer, C.I.; Duarte, H.A.; Marchi, A. A Stable and Reusable Supported Copper Catalyst for the Selective Liquid-Phase Hydrogenation of 5-Hydroxymethylfurfural to 2,5-Bis(hydroxymethyl)furan. Catalysts 2022, 12, 1476. [Google Scholar] [CrossRef]
  32. de Levie, R. Advanced Excel for Scientific Data Analysis; Oxford University Press: Oxford, MS, USA, 2004; pp. 423–512. [Google Scholar]
  33. Zelin, J.; Meyer, C.I.; Duarte, H.A.; Marchi, A.A. Selective liquid-phase hydrogenation of fructose to D-mannitol over copper-supported metallic nanoparticles. Chem. Eng. J. 2017, 319, 48–56. [Google Scholar] [CrossRef]
  34. Xu, Z.; Yan, P.; Xu, W.; Liu, X.; Xia, Z.; Chung, B.; Jia, S.; Zhang, Z.C. Hydrogenation/Hydrolytic Ring Opening of 5-HMF by Cp*-Iridium(III) Half-Sandwich Complexes for Bioketones Synthesis. ACS Catal. 2015, 5, 788–792. [Google Scholar] [CrossRef]
  35. Hurtado, B.; Arias, K.S.; Climent, M.J.; Concepción, P.; Corma, A.; Iborra, S. Selective Conversion of HMF into 3-Hydroxymethylcyclopentylamine through a One-Pot Cascade Process in Aqueous Phase over Bimetallic NiCo Nanoparticles as Catalyst. ChemSusChem 2015, 5, 2–11. [Google Scholar] [CrossRef] [PubMed]
  36. Du, Z.; Yang, D.; Cao, O.; Dai, J.; Yang, R.; Gu, X.; Li, F. Recent advances in catalytic synthesis of 2,5-furandimethanol from 5-hydroxymethylfurfural and carbohydrates. Bioresour. Bioprocess. 2023, 10, 52. [Google Scholar] [CrossRef]
  37. Ragno, D.; Di Carmine, G.; Brandolese, A.; Bortolini, O.; Giovannini, P.; Fantin, G.; Bertoldo, M.; Mass, A. Oxidative NHC-Catalysis as Organocatalytic Platform for the Synthesis of Polyester Oligomers by Step-Growth Polymerization. Chem. Eur. J. 2019, 25, 14701–14710. [Google Scholar] [CrossRef]
  38. Trasarti, A.F.; Bertero, N.M.; Apesteguía, C.R.; Marchi, A.J. Liquid-phase hydrogenation of acetophenone over silica-supported Ni, Co and Cu catalysts: Influence of metal and solvent. Appl. Catal. A 2014, 475, 282–291. [Google Scholar] [CrossRef]
  39. Zhu, Z.; Cao, Y.; Zheng, Z.; Chen, D. An accurate model for estimating H2 solubility in pure water and aqueous NaCl solutions. Energies 2022, 15, 5021. [Google Scholar] [CrossRef]
  40. Bertero, N.; Trasarti, A.; Apesteguía, C.; Marchi, A. Solvent effect in the liquid-phase hydrogenation of acetophenone over Ni/SiO2: A comprehensive study of the phenomenon. Appl. Catal. A 2011, 394, 228–238. [Google Scholar] [CrossRef]
  41. Duarte, H.A.; Luggren, P.J.; Zelin, J.; Sad, M.E.; Diez, V.K.; Di Cosimo, J.I. Selective aerobic oxidation of benzyl alcohol on inexpensive and reusable ZnO/MnCO3 catalyst. Catal. Today 2022, 394, 178–179. [Google Scholar] [CrossRef]
  42. Bertero, N.; Trasarti, A.; Acevedo, M.; Apesteguía, C.; Marchi, A. Solvent effects in solid acid-catalyzed reactions: The case of the liquid-phase isomerization/cyclization of citronellal over SiO2-Al2O3. Mol. Catal. A 2020, 481, 110192. [Google Scholar] [CrossRef]
  43. Kamlet, M.J.; Abboud, J.L.; Abraham, M.H.; Taft, R.W. Linear Solvation Energy Relationships. 23. A Comprehensive Collection of the Solvatochromic Parameters, π*, α, and β, and Some Methods for Simplifying the Generalized Solvatochromic Equation. Jor. Org. Chem. 1983, 48, 2877–2887. [Google Scholar] [CrossRef]
  44. Meyer, C.I.; Regenhardt, S.A.; Zelin, J.; Sebastian, V.; Marchi, A.J.; Garetto, T.F. A kinetic modelling of the liquid-phase oxidation of lactose over Pt- and Au- Supported catalysts. Top. Catal. 2016, 59, 168–177. [Google Scholar] [CrossRef]
  45. Bianchi, G.S.; Meyer, C.I.; Duarte, H.; Sanz, O.; Montes, M.; Marchi, A.J.; Regenhardt, S.A. Catalytic and kinetic study of the liquid-phase oxidation of lactose over Au/Al2O3 nanostructured catalyst in a monolithic stirrer reactor. Cat. Today 2022, 383, 299–307. [Google Scholar] [CrossRef]
Scheme 1. Transformation reaction of HMF into BHMF by hydrogenation.
Suschem 06 00022 sch001
Figure 1. X-ray diffractograms of Cu/SiO2-PD: (1) hydrated precursor, (2) calcined oxide precursor; and (3) reduced–passivated samples [31].
Suschem 06 00022 g001
Figure 2. Effect of solvent on catalytic HMF hydrogenation over Cu/SiO2-PD catalyst (T = 393 K; P H 2 = 1500 kPa; W / n H M F 0 = 25 g/mol ;   C H M F 0 = 0.13 M; VSOLV = 150 cm3). ■ THF, 2-POH, H2O.
Suschem 06 00022 g002
Figure 3. Effect of hydrogen pressure on catalytic activity in liquid-phase HMF hydrogenation on Cu/SiO2-PD catalyst (T = 393 K, VSOLV = 150 cm3 of THF). HMF conversion profiles as function of   W · t / n H M F   0 at different hydrogen pressure ( P H 2 ) for (a) C H M F 0 = 0.13 M, 200 kPa (), 500 kPa (), 1000 kPa (), and 1500 kPa (), as well as (b) C H M F 0 = 0.0.4 M, 200 kPa (), 400 kPa (), 700 kPa (), and 1500 kPa (). (c) Double logarithmic graph dependence of initial hydrogenation rate C H M F 0 on H2 pressure.
Suschem 06 00022 g003
Figure 4. Effect of initial HMF concentration on catalytic activity in liquid-phase HMF hydrogenation on Cu/SiO2-PD catalyst (T = 393 K, PH2 = 1500 kPa, VSOLV = 150 cm3 of THF). (a) HMF conversion profiles as function of   W · t / n H M F   0 at different initial HMF concentrations ( C H M F 0 ): () 0.02 M, () 0.04 M, () 0.065 M, () 0.13 M, and () 0.26 M. (b) Double logarithmic graph dependence of initial hydrogenation rate r0HMF with initial HMF concentration.
Suschem 06 00022 g004
Figure 5. HMF dimensionless concentration C * as function of parameter W · t / n H M F   0 at 393 K, with Cu/SiO2-PD catalyst for (a) C H M F 0 = 0.04 M and different H2 pressures of () 200 kPa, () 400 kPa, () 700 kPa, and () 1500 kPa (HMF data for conversion less than 20%), and for (b) 1500 kPa of H2 pressure and different C H M F 0 of () 0.02 M, () 0.04 M, and () 0.065 M (HMF data for conversion less than 30%). Solid lines represent fitting with model 1 (pseudo-homogeneous model).
Suschem 06 00022 g005
Figure 6. HMF dimensionless concentration C* as function of parameter   W · t / n H M F   0 at 393 K with Cu/SiO2-PD catalyst and HMF conversion less than 45% for (a,c) 1500 kPa H2 pressure and different C H M F 0 () 0.02 M, () 0.04 M, () 0.065 M, () 0.13M, and () 0.26M, and (b,d) C H M F 0 = 0.04 M and different H2 pressures () 200 kPa, () 400 kPa, () 700 kPa, and () 1500 kPa. Solid lines on (a,b) fitting curves from model 2 and (c,d) fitting curves from model 3.
Suschem 06 00022 g006
Figure 7. HMF concentration as function of parameter W·t/n0HMF at 393 K, with Cu/SiO2-PD catalyst for (a) C H M F 0 =   0.04   M and different H2 pressures () 200 kPa, () 400 kPa, () 700 kPa, and () 1500 kPa, and for (b) 1500 kPa H2 pressure and C H M F 0 () 0.02 M, () 0.04 M, () 0.065 M, and () 0.13 M and () 0.26 M. Solid lines are fitting curves from (a,b) modified model 3 and (c,d) modified model 2.
Suschem 06 00022 g007
Figure 8. Parity plot of calculated dimensionless concentration vs. experimental dimensionless concentration after fitting complete data set of runs 1 to 8. Modified model 2 and modified model 3. Black solid line represents perfect parity.
Suschem 06 00022 g008
Table 1. Physicochemical characterization of the Cu/SiO2-PD catalyst and support [31].
SamplesCu(a)
(%w/t)
Sg
(m2/g)
Vp
(cm3/g)
dp
(nm)
TPR(b)
(K)
D N 2 O (c)
(%)
D N 2 O (d)
(nm)
dTEM(e)
(nm)
SiO2-2961.0614.3----
Cu/SiO2-PD8.02700.9412.7566213.64.7
(a) Copper content determined by atomic absorption spectroscopy. (b) Temperature at maximum hydrogen consumptions in temperature programed reduction experiments. (c) Metallic copper dispersion determined by titration with nitrous oxide at 363 K. (d) Copper metal particle size estimated from metallic dispersion assuming cubic geometry. (e) Copper metal particle size estimated from transmission electron microscopy.
Table 2. Liquid-phase HMF hydrogenation over Cu/SiO2-PD catalysts at 393 K and 1500 kPa of H2 pressure (W = 0.5 g; VSolv = 150 cm3).
Solvent r H M F 0 102 a (mol/h.g)XHMF b
(%)
y B H M F c
(%)
SBHMF d
(%)
CB e
(%)
THF1.4491909899
2-POH0.9459589898
H2O0.352094598
a Initial conversion rate of HMF hydrogenation. b HMF conversion after 5.5 h reaction. c Yield in BHMF after 5.5 h reaction. d Selectivity to BHMF at 20% of HMF conversion. e Carbon balance.
Table 3. Number of independent catalytic runs performed with W / n H M F 0 = 25 g/mol. Initial HMF hydrogenation rate are estimated from the slope of the curve X H M F   v s   W · t / n H M F   0 a t = 0 and the corresponding TOF values.
Run C H M F 0 (M)PH2
(kPa)
T
(K)
r H M F 0 ·102 (mol/h.g)TOF
(1/h)
10.02015003930.48227
20.04015003930.70333
30.06515003931.32624
40.13015003931.44680
50.26015003931.50707
60.0407003930.39185
70.0404003930.23110
80.0402003930.1464
90.13010003931.27601
100.1305003931.31620
110.1302003931.24586
Table 4. Estimates for the apparent reaction orders (n and m) from model 1 by fitting the experimental data and the initial rates ( r H M F 0 ) from Table 3, with 95% confidence intervals.
Runs From   r H M F 0 From Model 1
m  an  am  an  aDC b
2, 6–80.81 ± 0.07n.a.0.66 ± 0.04−0.09 ± 0.900.9916
4, 9–110.06 ± 0.08n.a.0.10 ± 0.030.80 ± 0.930.9803
1–3 (4–5)n.a.0.86 ± 0.07n.a.0.78 ± 0.110.9782
a m and n are the apparent orders with respect to H2 and HMF, respectively (model 1). b DC: Determination coefficient, n.a.: not applicable.
Table 5. Parameter estimates and their 95% confidence intervals from model 2 and 3 obtained by fitting experimental data from runs 1 to 8 considering HMF conversions less than 45%.
ParameterModel 2Model 3
EstimateCI aEstimateCI a
k0.0360.0060.0400.008
KH0.0180.0070.0310.019
KA5.930.9416.85.2
KB7.012.2926.511.7
DC b0.99200.9849
a Confidence interval of the estimator for a 95% confidence level. b DC: Determination coefficient.
Table 6. Parameter estimates and their 95% CI for modified models 2 and 3 obtained after the fitting of the complete experimental data from runs 1 to 8 considering the loss of active sites. DC: Determination coefficient.
ParameterModified Model 2Modified Model 3
EstimateCI aEstimateCI a
k0.0390.0100.0320.003
KH0.0310.0120.0150.008
KA3.771.5718.83.0
KB0.0227.916.245.44
KBS2.462.571.901.08
CD0.97440.9936
a Confidence interval of the estimator for a 95% confidence level.
Disclaimer/Publisher’s Note: The statements, opinions and data contained in all publications are solely those of the individual author(s) and contributor(s) and not of MDPI and/or the editor(s). MDPI and/or the editor(s) disclaim responsibility for any injury to people or property resulting from any ideas, methods, instructions or products referred to in the content.