Article

Studying the Difference Between Mapping Accuracy of Non-RTK Ultra-Lightweight and RTK-Enabled Survey-Grade Drones

by
Mostafa Arastounia
Department of Geography, Kennesaw State University, Marietta, GA 30060, USA
Automation 2025, 6(4), 60; https://doi.org/10.3390/automation6040060
Submission received: 1 August 2025 / Revised: 27 September 2025 / Accepted: 15 October 2025 / Published: 21 October 2025
(This article belongs to the Section Robotics and Autonomous Systems)

Abstract

This study compares the mapping accuracy of a non-RTK ultra-lightweight drone (DJI Mini2) with two survey-grade RTK-enabled drones (DJI Mavic3E and Phantom4) in three different sites. Flight parameters and weather conditions were the same on each site. The outputs were orthomosaics and digital surface models, whose accuracies were inspected by descriptive statistics and variance analysis tools. The data of the ultralight drone on the first site could not be processed due to strong wind, but its results for the second site (11 hectares) were comparable to those of survey-grade drones, i.e., the range and average of checkpoint errors for Mini2 were 0.17 m and 0.04 m, respectively, while those were 0.10 m and 0.02 m for Phantom4 and Mavic3E. In the third site (34 hectares), survey-grade drones produced accurate results with a checkpoint error range of 0.26 m, while that was 0.87 m for the ultralight drone, implying lower accuracy results. The results obtained suggest that ultralight drones under certain circumstances can produce reliable mapping products depending on weather conditions, the number and distribution of ground control points, and area size. Their biggest drawback is their vulnerability to wind, and in calm weather conditions, due to non-RTK error accumulation, their mapping accuracy degenerates as the area size increases.

1. Introduction

In recent years, unmanned aircrafts (UAs) have been widely used as reality capture instruments in both academia and industry for various applications such as mapping of ground surface, material stockpiles, railroads, tunnels, industrial sites, urban environments, etc., [1,2,3]. The field of drone mapping has seen rapid innovation with the emergence of ultra-lightweight UAVs, offering low-cost and agile alternatives to commercial drones [4]. This shift has broadened access to surveying and mapping applications across industries, including employing UAV technology for mining applications [5] and urban planning [6]. Unmanned aircrafts can have various types of sensors, including Light Detection and Ranging (LiDAR) sensors, RGB, thermal, and multispectral cameras. This study is mainly focused on drones with RGB cameras for which photogrammetry solutions are typically applied to generate mapping products like orthomosaics and digital surface models (DSMs). Orthomosaics are aerial photographs that provide an accurate representation of the entire flight site whose geometrical errors (introduced by terrain relief, lens distortions, camera tilt) have been corrected. Orthomosaics can be in various formats, of which Geo TIFF, ECW, and JPG are among the most common formats. Geo TIFF and ECW are considered more specialized formats that preserve both geospatial and RGB data and are more suitable for mapping purposes. Whereas JPG format is deemed more appropriate for general-purpose applications that typically do not include geospatial data and have a reduced file size and lower quality. DSMs are normally generated in Geo TIFF format. However, since they contain elevation data, they can be converted into other three-dimensional (3D) data formats such as point clouds or meshes, depending on the intended application. DSMs can be further processed to obtain Digital Terrain Models (DTMs), which are widely used in industry for volume calculations, change detection, landslide inspection, etc.
There is a wide range of unmanned aircrafts in the market, from ultra-lightweight drones to more professional survey-grade ones. The Federal Aviation Administration (FAA) of the United States has classified drones based on their weight. Ultralight drones include the ones weighing up to 0.249 kg and UAs with weights from 0.249 kg to 24.9 kg have been classified as “commercial drones” [4]. This wide spectrum is reflected in their prices as well, i.e., an ultralight drone can be purchased for a few hundred dollars, while a survey-grade drone can easily cost over ten thousand dollars. Even though the ultralight drones do not have real-time kinematic (RTK) capabilities, they still do have cameras that are able to capture high-quality aerial photographs. This suggests that ultralight drones might be able to produce high-quality mapping products (orthomosaic and DSM) in certain conditions. This study aims to investigate the mapping accuracy of a non-RTK ultralight drone in different conditions compared to two RTK-enabled survey-grade drones. This way, mapping potentials of ultralight drones can be explored, considering their very affordable price.

2. Literature Review

Low-cost UAVs have shown effectiveness in 3D topographic mapping and air quality monitoring, as demonstrated in Vietnam’s Coc Sau coal mine, where dust sensor-equipped UAVs simultaneously captured spatial and environmental data [7]. In the mining industry, in hazardous or inaccessible areas where data collection might not be possible, UAVs present a safe, cost-effective, and practical alternative for data acquisition [8]. Research into optimal UAV deployment strategies has also addressed the importance of ground control points (GCP) placement. DJI Phantom 2 Vision, a consumer-grade quadcopter, was able to produce high vertical accuracy when combined with strategic GCP placement [9]. One study considered the impact of the number and distribution of GCPs on mapping accuracy and found out that achieving high planimetric accuracy requires distributing the GCPs around the edge of the flight area, and for high elevation accuracy, GCPs need to be placed inside the flight area [10]. Two commercial drones (DJI Inspire 2 and DJI Matrice 210) were used for mapping of a 400-hectare area with dense vegetation coverage [11]. Even though Global Navigation Satellite System (GNSS) receivers were used for observing the GCPs, their mapping accuracy reached a 0.3 m error, which was due to bad weather conditions, complex site topography, and the fact that the utilized drones were not RTK-enabled. In small- to medium-sized open-pit mines, findings suggest that strategic placement of five to seven GCPs strikes a balance between accuracy and efficiency [12]. In construction and earthwork projects, UAV-based mobile 3D mapping systems have shown substantial gains in efficiency and positional accuracy compared to traditional techniques such as using GNSS receivers and laser scanners [5]. Similarly, UAVs have been instrumental in assessing consolidation settlement in large land reclamation projects, offering automated and wide-area coverage with minimal human intervention [13]. Also, adaptive real-time flight path planning methods have been developed to address mapping challenges over uneven terrain, improving area coverage, and minimizing travel distance without compromising spatial resolution [14]. Accuracy remains a critical concern, particularly in corridor mapping. Factors such as GCP distribution and camera calibration have been found to influence mapping precision more than other factors [15].
UAVs facilitate precise monitoring and crop assessment in maize farming, optimizing harvest timing and improving decision-making processes despite limited adoption [16]. For city planning, UAVs provide flexible and cost-effective surveying options, although regulatory barriers continue to affect their broader use, especially in regions like India [17]. UAVs have also demonstrated value in monitoring recreational trails within protected natural areas, where high-resolution Structure-from-Motion (SfM) data paired with GIS analysis offers efficient and accurate trail condition assessments [18]. This SfM technique was also employed by another study to mitigate limitations of ultralight drones’ cameras [19]. The role of UAVs in infrastructure inspection has grown, particularly in bridge damage assessments. In the broader context of construction, UAVs enhance site monitoring, logistics, and safety, though their integration necessitates rigorous risk management and protocol development [20]. Work has also been performed toward standardizing drone operations at expressway construction sites, further bridging the gap between experimentation and industry application [21]. Equipped with various sensors and imaging technologies such as high-resolution RGB cameras or LiDAR sensors, drones offer detailed structural analysis and support maintenance planning while minimizing risk to human inspectors [22]. Strategies for drone fleet deployment in large-scale agriculture and forestry further emphasize the need for multi-drone coordination, efficient data processing, and robust communication frameworks to enhance coverage and reduce operational costs [23,24].
Some studies focused on mapping accuracy of drones and compared the Digital Elevation Model (DEM) generated from the drone data to the ground points collected by an RTK-enabled GNSS receiver [25,26]. Izere et al. [27] evaluated the mapping accuracy of RTK-enabled drones, and they concluded that despite the high accuracy of such drones, GCPs are still required [27]. Their focus was to indicate how RTK-enabled drones are able to produce accurate DEMs, but they did not compare different drones with one another. Madawalagama et al. [28] inspected the mapping accuracy of a consumer-grade quadcopter and a survey-grade fixed-wing drone. Despite their differences, both drones were classified in the same category (“Micro-UAV”) based on their weight, endurance, and range. None of the drones had RTK capabilities, and the mapping results were not very accurate, i.e., 0.13 m and 0.27 m for the survey-grade and consumer-grade drones, respectively. Jiménez-Jiménez et al. [29] explored DTM generation with low-cost UAVs from four different perspectives, i.e., UAV platforms and cameras, flight planning and image acquisition, software, and land cover. This is more a review study, and it very briefly discusses different drones only in terms of platform (quadcopter or fixed wing) and the impact of the camera calibration. They also discussed the effect of flight parameters and choice of software on different terrain types. Torres-Sánchez et al. [30] explored various flight altitudes and image overlaps to achieve the shortest processing time with the highest mapping accuracy, which was obtained at a flight altitude of 100 m and front overlap of 95%. Nagendran et al. [31] investigated the impact of GCPs on different flight altitudes. They used only one drone for their study, which was non-RTK and was not ultra-lightweight either. However, no low-cost drones were compared to survey-grade ones in terms of mapping accuracy in these two works. Kalacska et al. [32] compared the accuracy of fourteen drones, from low-cost consumer-grade to enterprise-level, without using GCPs. However, the accuracy of their low-cost consumer-grade drone was quite low (over one meter), which is primarily due to not using GCPs.
Most studies mentioned above investigated the impact of various factors, such as flight parameters and drones’ specifications, on mapping accuracy, and some focused only on innovative applications of mapping with drone data. A few studies compared different drones, but their drones belonged to the same class (with similar RTK capabilities) or lacked an in-depth analysis of the results and sources of error. Also, none of them compared the mapping accuracy of non-RTK ultra-lightweight drones with RTK-enabled survey-grade ones using GCPs. In this study, the potential of non-RTK ultra-lightweight drones for mapping purposes is explored by comparing the mapping accuracy of two RTK-enabled survey-grade drones and a non-RTK ultra-lightweight drone. This comparison is performed on three different sites with the same flight parameters, weather conditions, and number of GCPs. The mapping products are compared in terms of coverage, clarity, and accuracy, considering the properties of mapping sites such as area size and topographic characteristics.

3. Datasets and Methodology

The three drones that were used in this work were a Mini 2 SE, a Phantom 4 RTK, and a Mavic 3 Enterprise RTK (all of which were manufactured by SZ DJI Technology Co., Ltd. in the city of Shenzhen in China). The Mini 2 SE (hereinafter referred to as M2) is an ultralight drone to which Part 107 regulations do not apply. The Phantom 4 RTK and Mavic 3 Enterprise RTK (hereinafter referred to as P4 and M3) are survey-grade commercial drones that can be flown only under Part 107 regulations. While M2 does not have RTK capabilities, P4 and M3 are RTK-enabled, and their RTK capability was enabled for flights in this study using a DJI D-RTK 2 Base Station. Table 1 below indicates the specifications of these three drones. As can be seen in this table, while the camera resolution of the M3 and P4 are the same, i.e., 20 Mega Pixel (MP), the M2 has a lower-resolution camera (12 MP). On the other hand, the nominal wind tolerance, maximum flight time, and speed of P4 and M2 are quite similar. Whereas the maximum flight time and speed of M3 are considerably more than those of P4 and M2. Figure 1 depicts these three drones.
Three sites were mapped using three different drones. The sites were mainly public parks in the state of Georgia, US. Table 2 presents the information about these three sites, including their area size and the meteorological conditions, which could significantly affect the accuracy of the resulting mapping products. As is evident in Table 2, these three flight sites were chosen in a way to have different area sizes and different weather conditions in order to better investigate the mapping accuracy of the utilized drones. Oregon Park has the smallest size (about 8 hectares), Mt. Tabor Park has a medium size (11 hectares), and White Oak Park has the largest size (34 hectares) among the three flight sites. While generally there is no limit in flight area sizes, the sizes of the selected areas are the typical area sizes in urban areas. Another difference in the flight sites was the wind speed, i.e., while Mt. Tabor Park and White Oak Park were slightly windy with no gusts, Oregon Park was quite windy with strong gusts on the flight day. The impact of the following will be discussed on the mapping products obtained.
Table 2 below indicates the number of ground points collected comprising GCPs and checkpoints. GCPs were used in the geo-referencing process, while checkpoints were not used for geo-referencing and were utilized only to verify the final produced surface. Even though the area sizes are different, a very similar number of GCPs were used to create similar conditions for better comparisons of these drones. However, for a thorough assessment of the obtained DSMs, more checkpoints were observed in larger flight sites. All ground points were acquired using a Trimble SP80 GNSS receiver with an RTK subscription with 2 cm horizontal and 3 cm vertical accuracy.
Figure 2 indicates the spatial distribution of GCPs by white rectangles on each flight site. The flight parameters were also held the same for all flights in this work again to better understand the mapping strengths and shortcomings of the utilized drones. The flight height was 100 m; the front overlap was 80%, the side overlap was 75%, and data of all flights were processed in PIX4Dmapper software (version 1.73.0).
The resulting elevation differences between the DSMs and ground points were inspected with descriptive statistics (mean and standard deviation) as well as analysis of variance (ANOVA), which is a statistical hypothesis test. ANOVA is a statistical tool to compare the average of three or more sets of data. Descriptive statistics (average and standard deviation) within each set of data provide an understanding of data distribution within each dataset. Whereas comparing multiple datasets and their average and standard deviation would require further analysis. In other words, ANOVA measures the difference between the average of multiple datasets and better indicates how significantly they are different from one another. The variable in this case is the elevation difference between a DSM and each ground point, which would be a single factor, or, alternatively, called one-way ANOVA. In single-factor ANOVA, a hypothesis test is formed in which the F distribution is used to analyze the datasets’ variance. Equation (1) indicates the hypothesis test where it assumes that the averages of all three datasets are equal. In Equation (1), μ 1 , μ 2 , μ 3 denote the average elevation difference using data of M3, P4, and M2 drones, respectively. The alternative hypothesis is that at least one dataset’s average is different from the other two averages. Degrees of freedom within and between datasets are calculated using Equations (2) and (3), respectively, in which k denotes the number of datasets (that is 3 in this study), and n represents the total number of samples, which is all elevation differences between ground points and DSMs on each flight site. The Fvalue is calculated as variance between samples ( S b e t w e e n 2 ) divided by the variance within samples ( S w i t h i n 2 ) as indicated in Equation (4). The variance between and variance within samples are calculated in Equations (5)–(9), in which x i denotes a given sample (each elevation difference), and μ i represents the average within each group (average of elevation differences for each drone’s DSM) and μ G r a n d denotes the average of all samples (average of all elevation differences on each flight site). Once the F v a l u e is calculated, it would be compared to F t a b l e based on which it can be determined if the null hypothesis can be rejected or not. F t a b l e is obtained from F distribution tables based on DF1, DF2, and significance level (α):
H 0 : μ 1 = μ 2 = μ 3
D F b e t w e e n = D F 1 = k 1
D F w i t h i n = D F 2 = n k  
F v a l u e = V a r i a n c e   b e t w e e n   s a m p l e s V a r i a n c e   w i t h i n   s a m p l e s = S b e t w e e n 2 S w i t h i n 2
S b e t w e e n 2 = S S b e t w e e n D F b e t w e e n
S w i t h i n 2 = S S w i t h i n D F w i t h i n
S S b e t w e e n = S S T o t a l   S S w i t h i n
S S T o t a l = ( x i μ G r a n d ) 2
S S w i t h i n = ( x i μ i ) 2
i f   F v a l u e < F t a b l e   n u l l   h y p o t h e s i s   H 0   c a n n o t   b e   r e j e c t e d : i . e .   μ 1 = μ 2 = μ 3 i f   F v a l u e > F t a b l e   n u l l   h y p o t h e s i s   H 0   i s   r e j e c t e d : i . e .   a t   l e a s t   o n e   a v e r a g e   i s   d i f f e r e n t   f r o m   o t h e r s

4. Results and Discussion

Two main products of these mapping flights were orthomosaics and DSMs. The following observations were made of the obtained results for quality control (QC):
  • Orthomosaics were inspected in terms of coverage and clarity.
  • Generated DSMs were compared to each other and to the ground points observed with a GNSS receiver. Then, descriptive statistics and analysis of variance (ANOVA) were applied to the elevation differences for further analysis.

4.1. Results of Oregon Park

As was mentioned in Table 2 of Section 3, Oregon Park on the flight day was quite windy (with an average wind speed of 21 km/h) with strong gusts, which had a significant adverse effect on the M2 drone. Even though the specifications of M2 and P4 indicate that they have the same wind tolerance, M2 turned out to be much more susceptible to wind, so much so that its data could not even be processed. Figure 3 depicts the flight lines (green lines) and aerial photographs (red circles) of three employed drones in Oregon Park. As is evident in Figure 3a,b, the flight lines of M3 and P4 were parallel and consistent with planned flight lines. However, flight lines of M2 were quite different from and inconsistent with the planned flight lines. Since the wind direction on that flight day was from northwest to southeast, two flights were conducted with M2: one flight with lines along north–south and one along east–west. Despite that, both M2 flights ended up with very distorted flight lines, some of which are highlighted with yellow rectangles in Figure 3c,d. Due to these significantly distorted flight lines, aerial photos captured by M2 did not have the required minimum overlap, and as a result could not be processed, and its DSM and orthomosaic could not be generated. That said, the background images in Figure 3 below are Google Images to provide a better view of the distorted flight lines of M2 on this site.
On the other hand, the captured aerial photos of P4 and M3 were successfully processed, and the following orthomosaics and DSMs were generated with a ground sampling distance (GSD) of 0.031 m and 0.029 m for M3 and P4, respectively. Figure 4a,c indicate the orthomosaic of Oregon Park using M3 and P4 data, respectively, and Figure 4b,d show their associated DSMs. As is evident in Figure 4, the resulting DSMs and orthomosaics covered the entire flight site, and the orthomosaics are both clear and of high quality. Some elevation distortions on DSMs can be seen, which are mainly in vegetated areas. This type of elevation distortion is anticipated since the terrain is typically not captured well by aerial photos in vegetated areas. In other words, tree canopies and vegetation introduce elevation distortion as they block line of sight from the drone camera to the ground surface. The remaining parts of the flight site were captured well in the DSM, though. The elevation accuracy of DSMs is checked in Section 4.4.

4.2. Results of Mt. Tabor Park

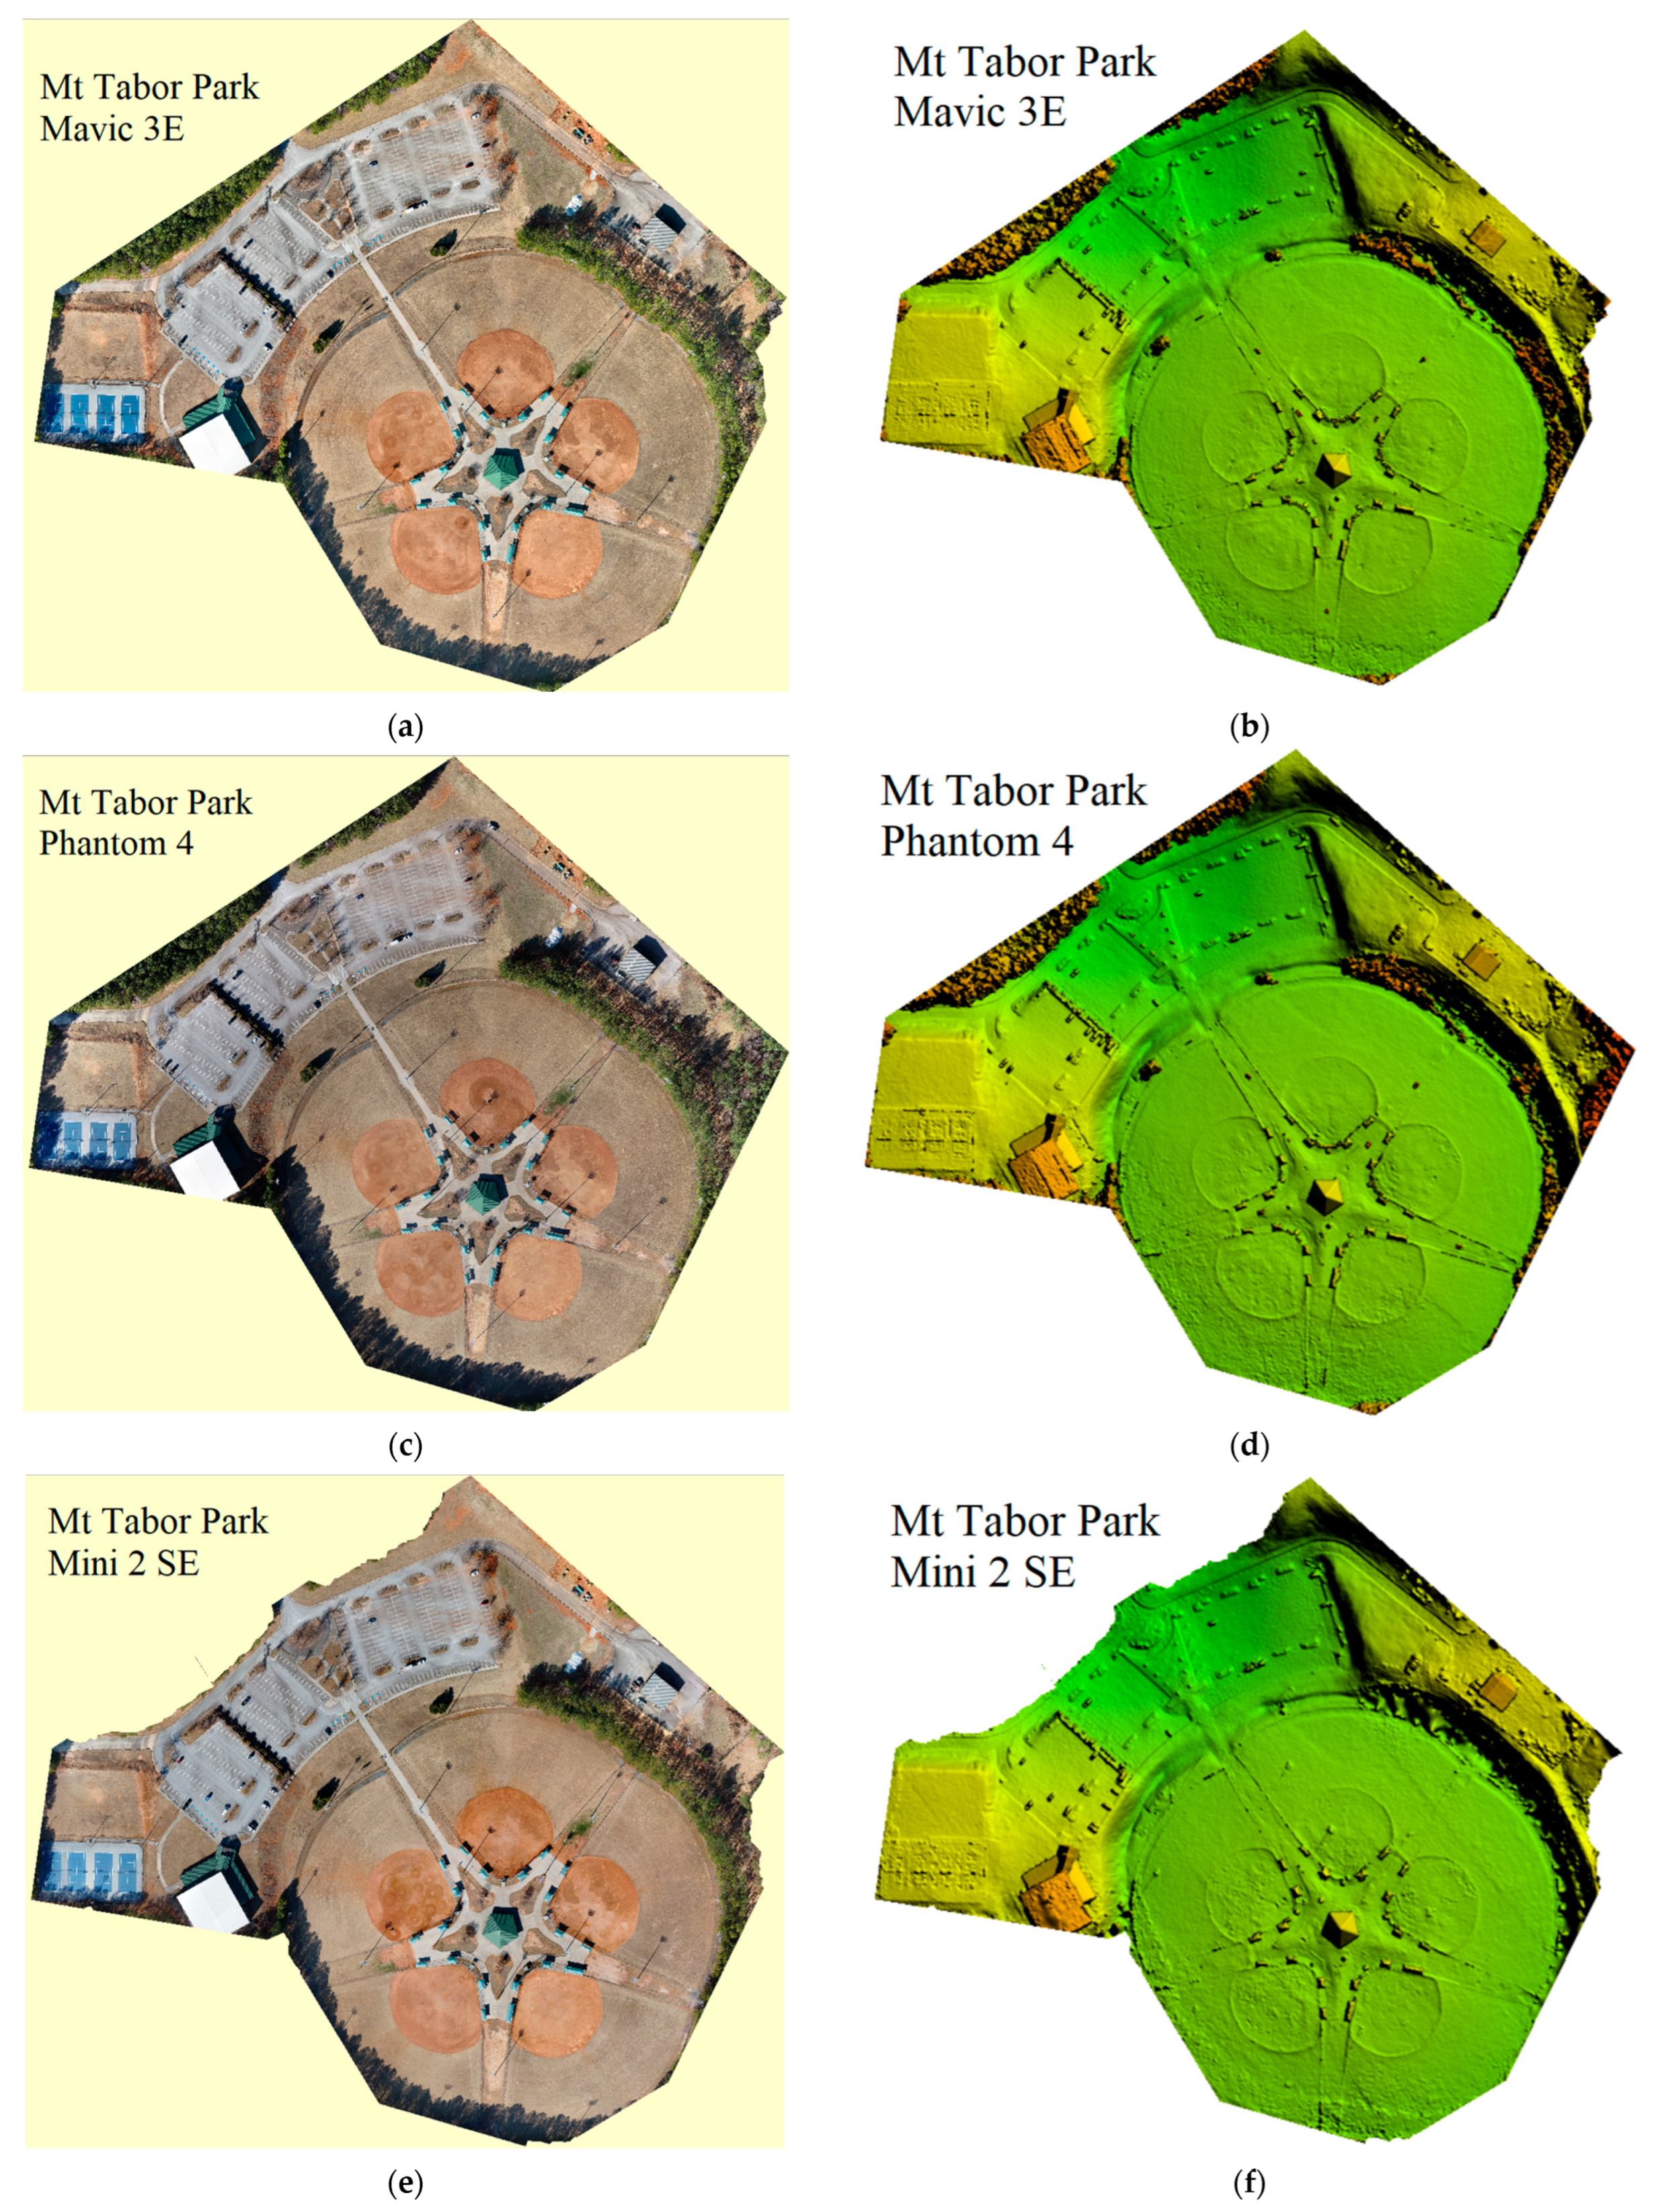
The orthomosaics and DSMs produced from data of Mt. Tabor Park are presented in the following. As is evident in Figure 5a,c,e, the orthomosaic of all three drones completely covered the targeted site, and even though the resolution of the M2 camera is lower than that of the two drones, its orthomosaic has very high clarity. Figure 5b,d,f show the obtained DSMs, which are colorized based on point elevations. The produced DSMs clearly have covered the site completely, but distorted elevation can be visualized in the vegetated areas, which is expected as it was explained in Section 4.1. The GSD of the orthomosaic and DSM of M3, P4, and Mini2 were also 0.027 m, 0.029 m, 0.031 m, respectively.

4.3. Results of White Oak Park

The White Oak Park’s orthomosaics and DSMs are indicated in the figures below, with a GSD of 0.028 m, 0.030 m, 0.034 m for M3, P4, and Mini 2 drones, respectively. Figure 6a,c,e depict that the orthomosaics have covered the entire site with very similar high clarity. Also, the DSMs (Figure 6b,d,f) show the elevation of the whole site with some expected distortion in water bodies and vegetated areas.

4.4. Quality Control of the Generated DSMs

In this section, the produced surfaces will be checked against the ground points collected by an RTK-enabled GNSS receiver with 2 cm horizontal and 3 cm vertical accuracy.

4.4.1. Quality Control of Oregon Park’s DSM

Due to the very large number of ground points used for all flights in this study, only statistical measures and histograms of elevation differences are presented in Section 4.4.1, Section 4.4.2 and Section 4.4.3, and the full details of coordinates and elevation differences can be found in Supplementary Materials. Tables S1–S8 in Supplementary Materials show the elevation difference between each ground point and its projection on the DSM produced using drone data collected from each flight site. As mentioned earlier, GCPs were used in creating the DSM, but the checkpoints were not used in that process, and instead, they were only used as an external check to verify the produced surface. It must be noted that all ground points were collected in the Georgia West State Plane coordinate system, i.e., NAD 83 (2011) for horizontal surface and NAVD 88 for vertical datum.
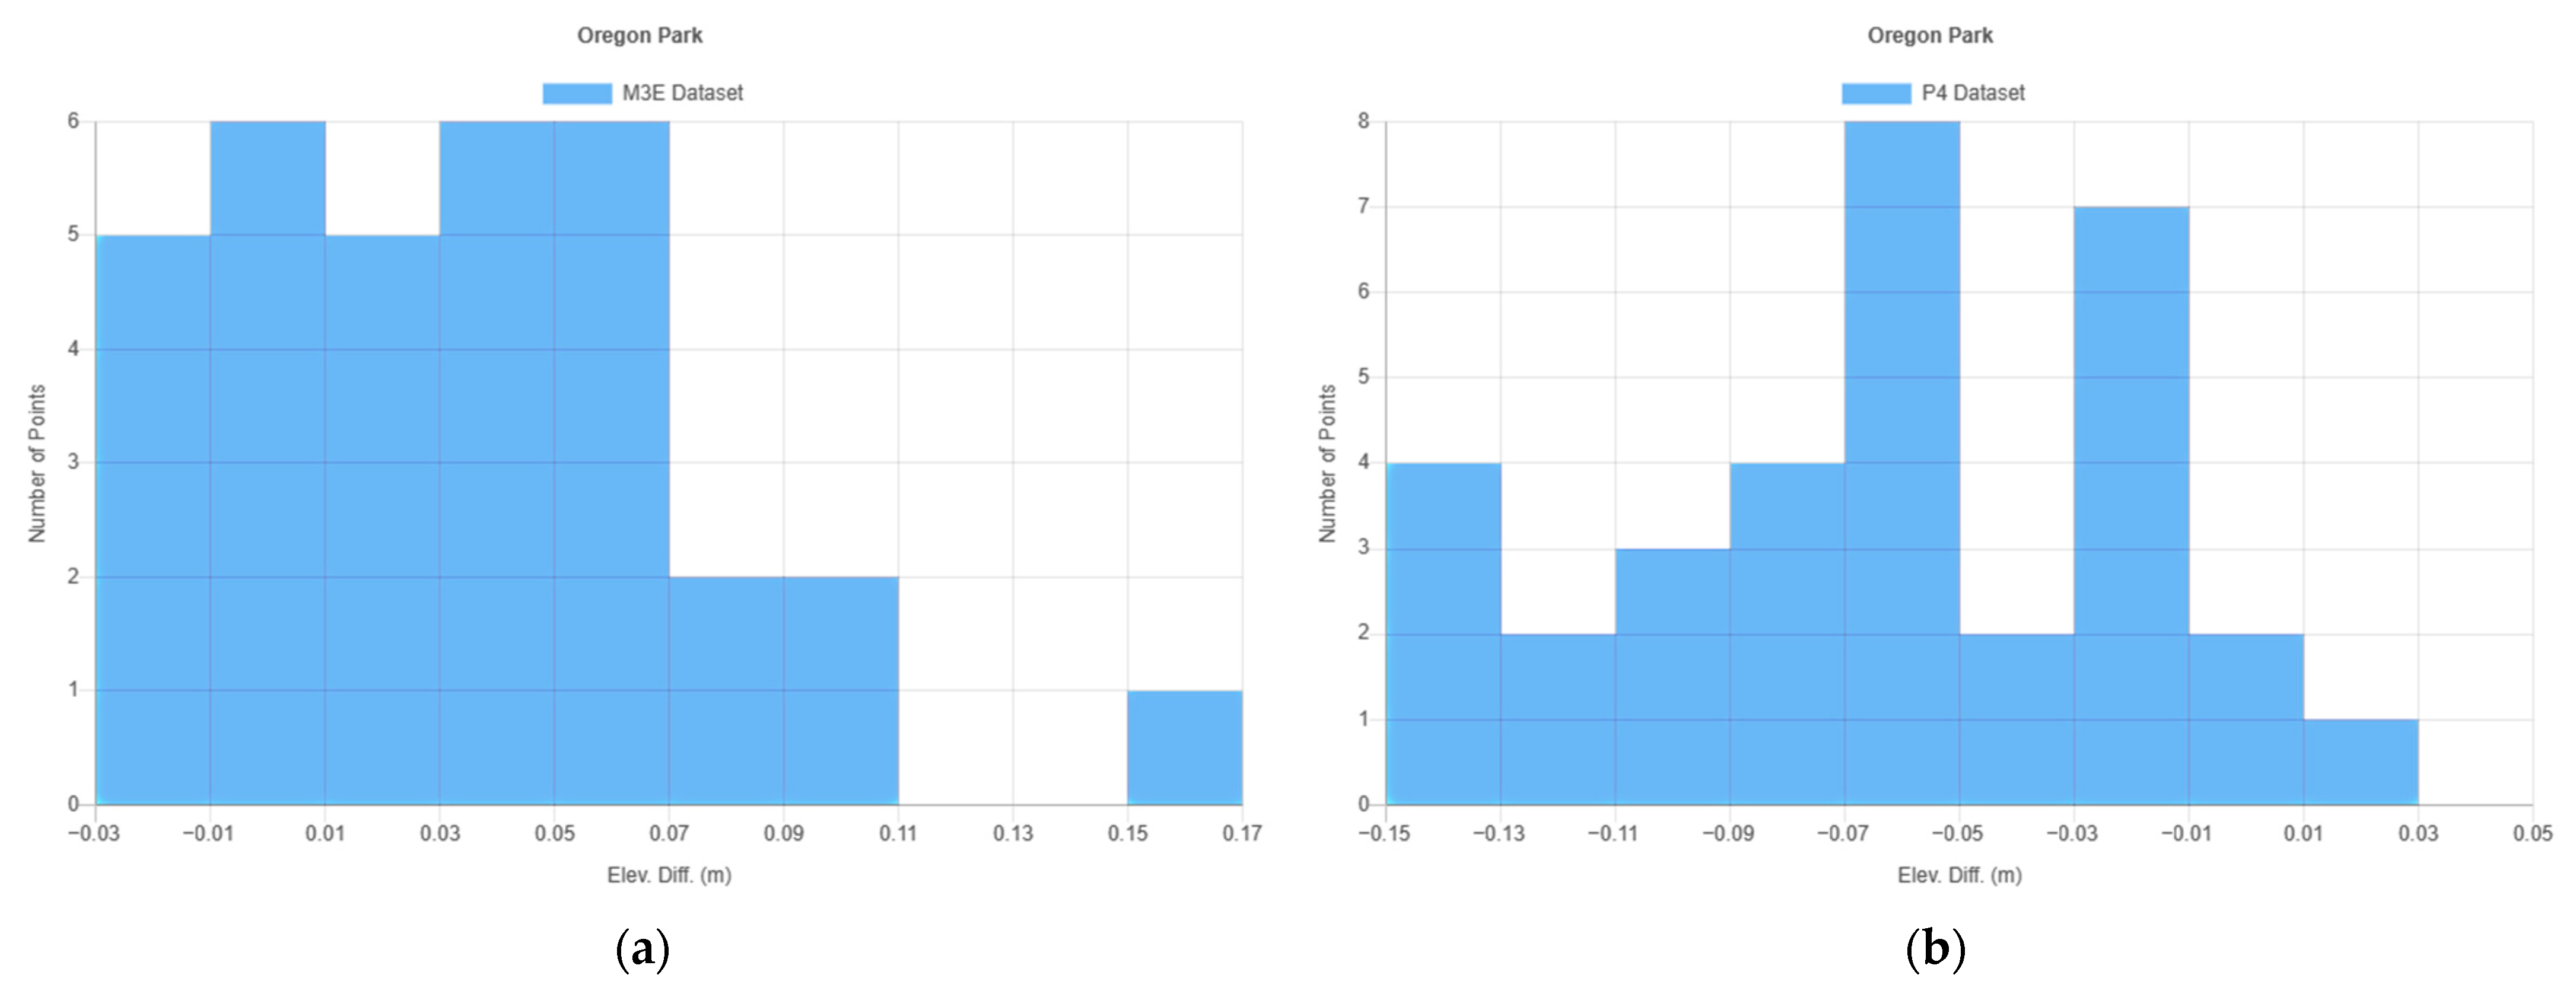
Figure 7 and Table 3 present the histogram and statistical measures of elevation differences between the ground points and DSM of Oregon Park. The histograms in Figure 7 indicate the number of ground points whose elevation differences from Oregon Park’s DSM fall within a certain range. For instance, Figure 7a shows that in the results of M3, the largest elevation difference in ground points occurred at the 0.15 m to 0.17 m interval with only one ground point, while most ground points (28 out of 33) had an elevation difference in the range of −0.03 m to 0.07 m. Similarly, Figure 7b indicates that in the results of P4, almost half (16 out of 33) of the ground points had an elevation difference between −0.07 m and −0.01 m, while four ground points had the largest elevation difference between −0.15 m and −0.13 m.
As can be seen in Table 3, the DSMs produced from M3 and P4 data for this 8-hectare site are slightly different but are still within allowable tolerance. That is the average elevation difference. In the M3, the surface is 0.03 m, which is very accurate, and that of P4 is −0.07 m, which is slightly higher than expected. This and the large elevation difference range of both drones’ surfaces are due to strong wind and gusts, which had a significant adverse effect on the drones’ ability to stay on the planned flight lines. As can be visualized in Figure 7, the elevation difference had a range of 0.14 m in M3 results (discarding an outlier at 0.16 m elevation difference), and this range was 0.18 m in the results of the P4 drone. Furthermore, the ANOVA test could not be applied to the results of Oregon Park, as it requires a minimum of three datasets, but since results of Mini2 could not be obtained due to windy conditions, the two remaining datasets from P4 and M3 are not sufficient for the ANOVA test.

4.4.2. Quality Control of Mt. Tabor Park’s DSM

Figure 8 and Table 4 below present the histogram and statistical measures of elevation differences between the ground points and DSM of Mt. Tabor Park. Figure 8a indicates that in the results of M3, the majority of ground points (35 out of 38) had an elevation difference between 0 m and 0.08 m. The histogram in Figure 8b shows that in the results of P4, most ground points (36 out of 38) had an elevation difference between −0.04 m and 0.04 m. Results of M2 in Figure 8c depict that even though the range of elevation differences is rather large (0.17 m), 25 out of 38 ground points had an elevation difference between 0 m and 0.06 m. As can be seen in this table, the DSM produced from M2 data for this 11-hectare site has an acceptable accuracy, which is completely comparable to the DSM accuracy of M3, even for high-precision applications. As is evident in Figure 8, while the DSM of M2 has a large range of elevation differences (0.17 m), the range of elevation differences in M3 and P4 are both 0.10 m. The average elevation differences in all three drones are within acceptable tolerance, though (GNSS data accuracy).
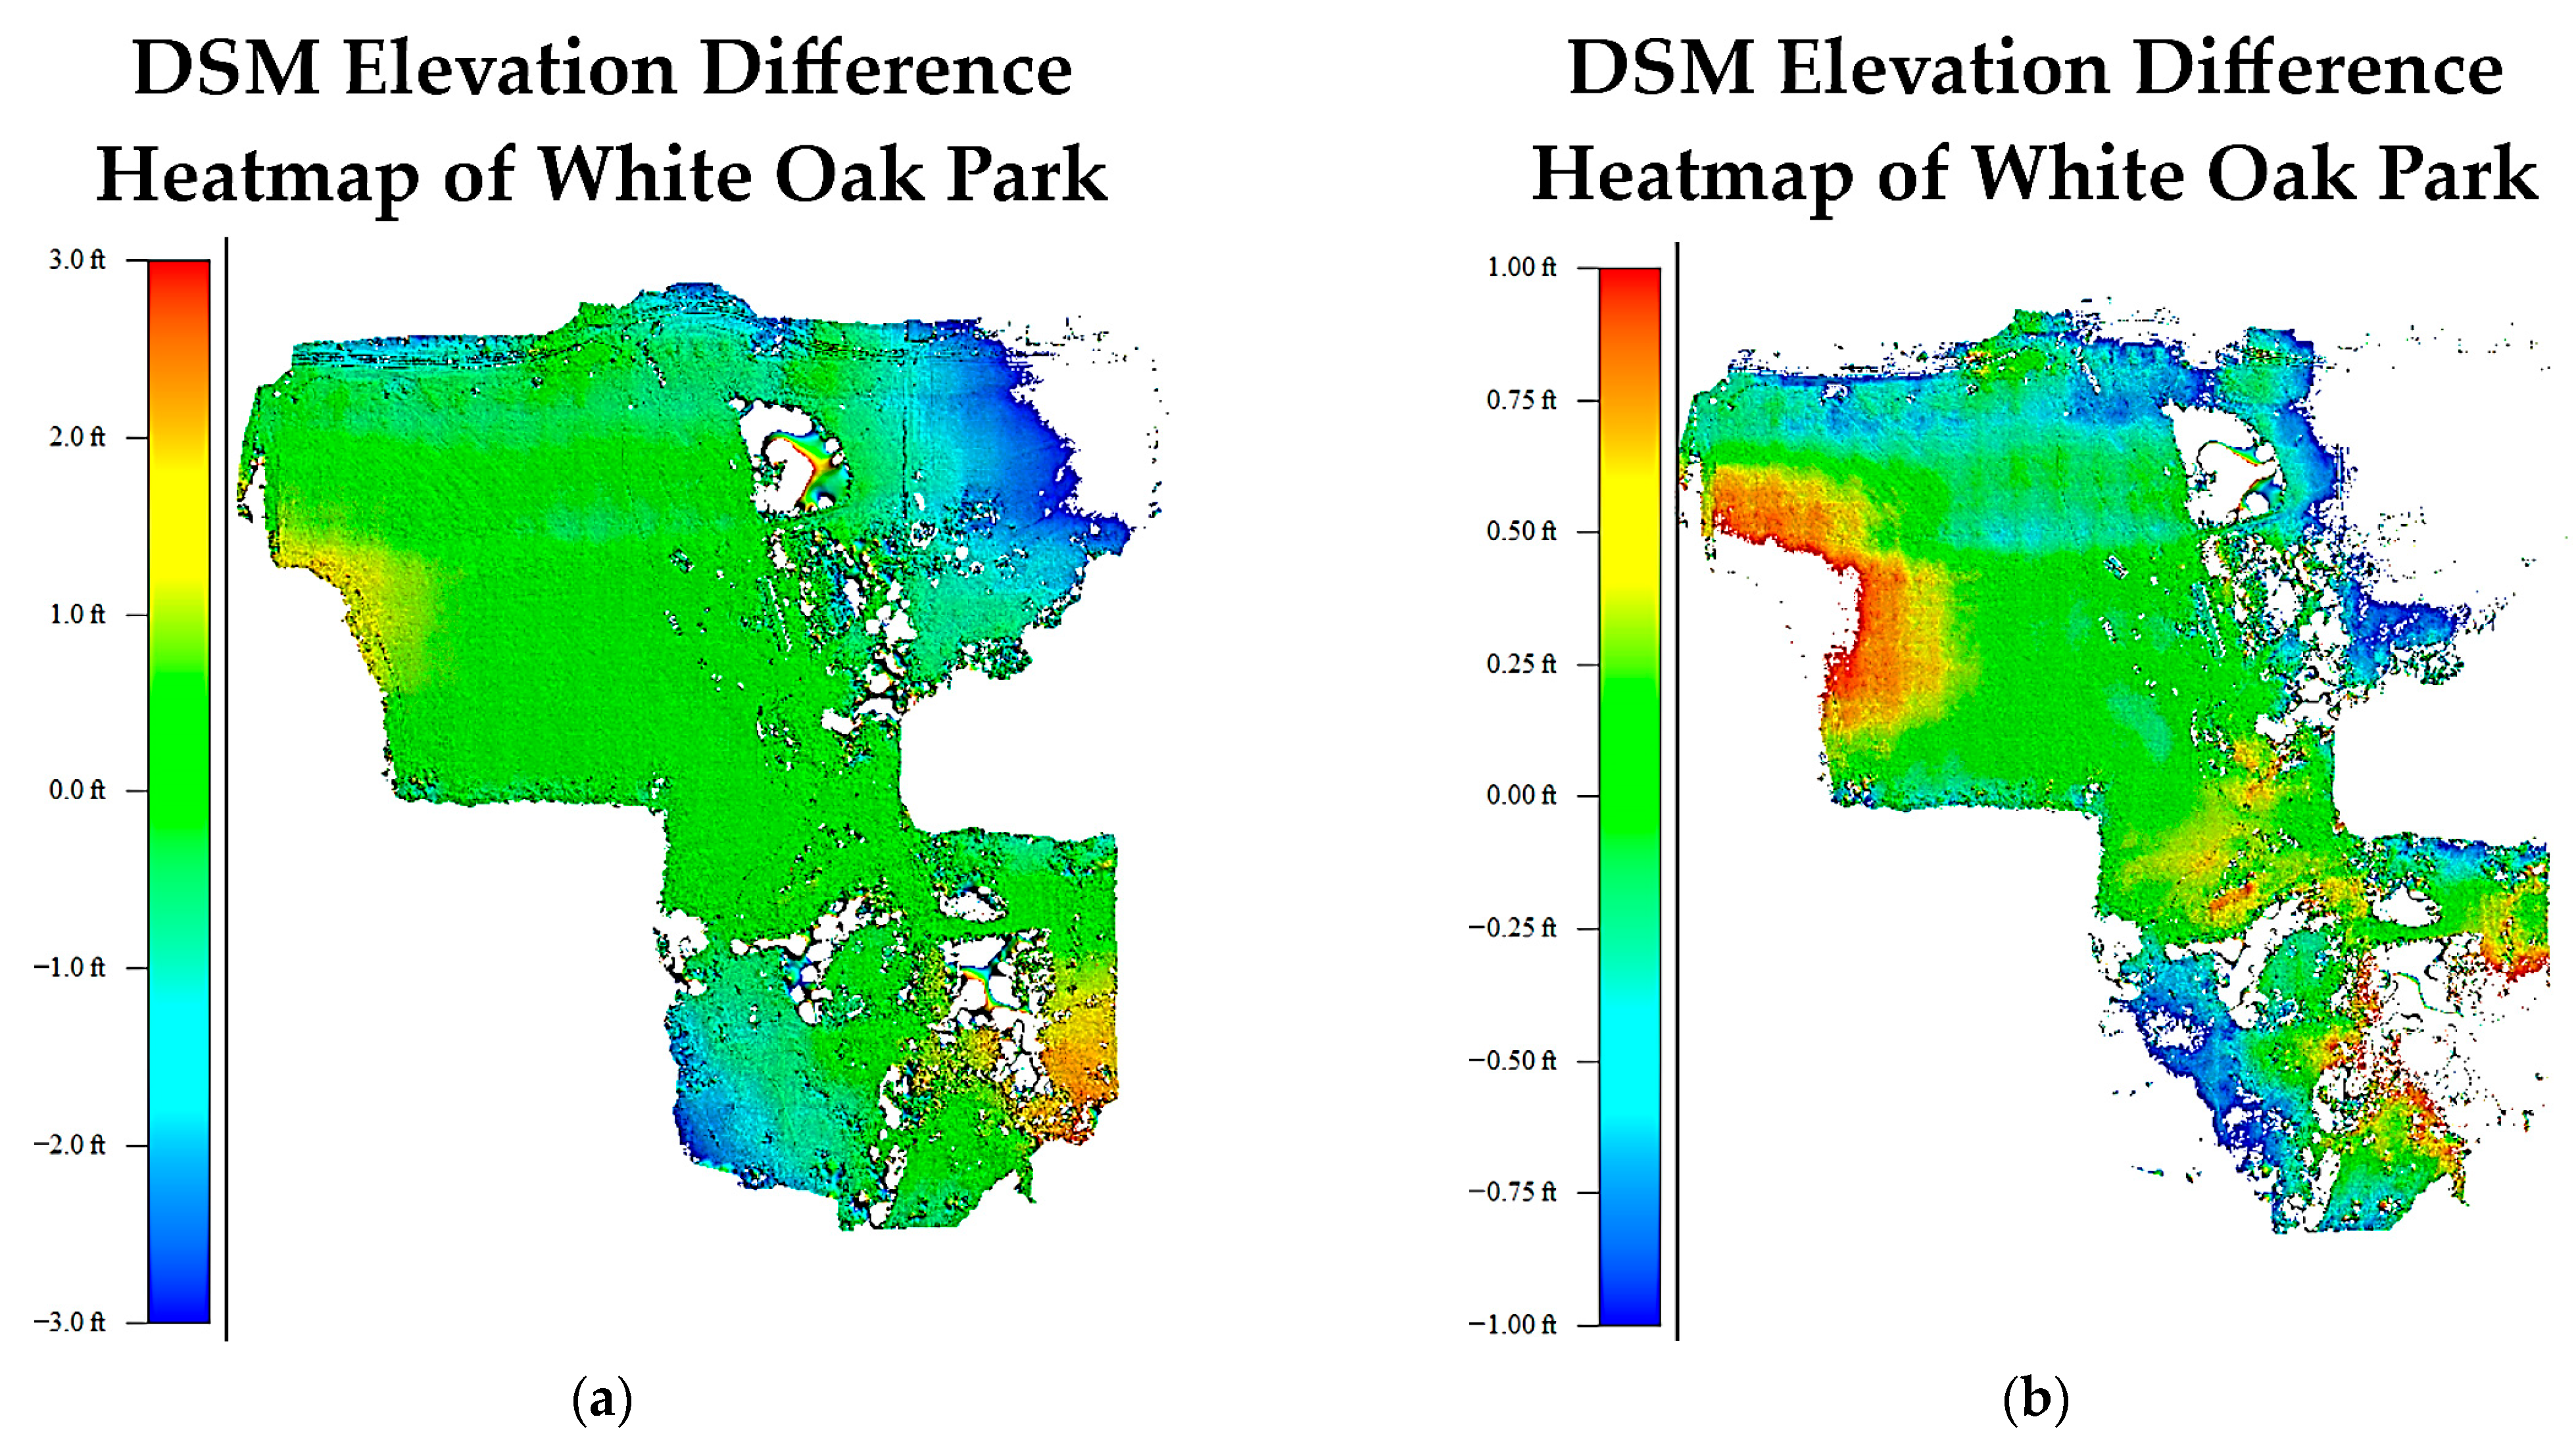
In order to compare the DSM of M2 and M3, they are superimposed, and their elevation difference is shown below as a heat map. As is evident in Figure 9a, two DSMs are within 0.9 m (3 ft.) of one another almost everywhere except for the vegetated areas (appearing as gaps), whose terrain cannot be accurately mapped with photogrammetry methods anyways. The yellow color in Figure 9a, representing elevation difference between −0.9 m and +0.9 m, constitutes a very large portion of this dataset, which includes road pavements and low vegetation areas. Figure 9b depicts that still the vast majority of two DSMs are within 0.30 m (1 ft.) of each other. While DSM of M2 is slightly higher than DSM of M3 in the central area (appearing as orange and red colors), areas close to the site border follow the opposite trend (represented by green and blue colors). Furthermore, M3 and P4 were both RTK-enabled survey-grade drones, so the DSM of P4 and M2 were not compared since the main focus of this study is to compare the DSM of an ultralight drone (M2) to a survey-grade one (either M3 or P4), and results presented in Table 4 confirm that the DSM created from data of M3 and P4 have similar accuracy.
To further analyze the elevation differences among three flights on this site, the ANOVA test was applied as shown in Equations (11)–(20), in which n denotes the total number of elevation differences in three drones on this site (n = 114) and k represents the number of datasets (k = 3). The null hypothesis is that the average elevation differences in these three drones are equal. The remaining parameters are calculated as follows, leading to the F v a l u e of 8.37. The F t a b l e for three levels of confidence (99%, 95%, and 90%) are indicated in Equation (19) for the given degrees of freedom, which are all smaller than F v a l u e . This suggests that the null hypothesis is rejected, and it can be concluded that the average elevation differences in three drones on this site are different with a 99% confidence level. This result of the ANOVA test is consistent with the results presented in Table 4 and is anticipated, as the Mini2 is a less precise drone compared to the other two survey-grade drones:
D F b e t w e e n = D F 1 = k 1 = 3 1 = 2  
D F w i t h i n = D F 2 = n k = 114 3 = 111
S S T o t a l = ( x i μ G r a n d ) 2 = 0.5624
S S w i t h i n = ( x i μ i ) 2 = 0.4887
S S b e t w e e n = S S T o t a l   S S w i t h i n = 0.0737
S b e t w e e n 2 = S S b e t w e e n D F b e t w e e n = 0.0737 2 = 0.0369
S w i t h i n 2 = S S w i t h i n D F w i t h i n = 0.4887 111 = 0.004
F v a l u e = S b e t w e e n 2 S w i t h i n 2 = 0.0369 0.004 = 8.37
F o r   D F 1 = 2 ,   D F 2 = 111 ,   α = 0.01 = > F t a b l e = 4.79 F o r   D F 1 = 2 ,   D F 2 = 111 ,   α = 0.05 = > F t a b l e = 3.07 F o r   D F 1 = 2 ,   D F 2 = 111 ,   α = 0.10 = > F t a b l e = 2.35
F v a l u e > F t a b l e   n u l l   h y p o t h e s i s   H 0   i s   r e j e c t e d   i . e .   a t   l e a s t   o n e   a v e r a g e   i s   d i f f e r e n t   f r o m   o t h e r s

4.4.3. Quality Control of White Oak Park’s DSM

Figure 10 and Table 5 present the histogram and statistical measures of elevation differences between the ground points and DSM of White Oak Park. Figure 10a shows that in the results of M3, the elevation difference in most ground points (42 out of 69) was quite small, ranging from −0.02 m to +0.02 m. Even though results of P4 in Figure 10b depict that elevation differences had a slightly larger range, 50 out of 69 ground points had an elevation difference between −0.02 m and +0.06 m. Figure 10c shows that in the results of M2, all elevation differences were larger than 0.26, with 50 out of 69 ground points having an elevation difference larger than 0.30 m. As can be seen in Table 5, the accuracy of M3 and P4 DSMs is quite similar and higher than that of M2. Whereas, as can be seen in Figure 10, the range of elevation difference between ground points and the M2 surface has a wide range (0.87 m), which is almost 3.5 times as large as that of RTK-enabled M3 and P4 drones. The range of elevation differences for M3 and P4 drones are 0.23 m and 0.26 m, respectively. One must note that considering only the maximum, minimum, and range of elevation differences could be misleading since only one checkpoint with inaccurate elevation could lead to such a wide range. That said, considering other measures such as average and standard deviation as well as a heat map of the superimposed DSMs will portray a more thorough picture. In this case, the average elevation difference is actually quite small (0.01 m), and the standard deviation is 16 cm, which is not accurate enough for high-precision mapping but is sufficient for some less accurate applications like earthwork and excavation for construction.
Figure 11 indicates the DSMs of M3 and M2 overlaid on one another. Figure 11a shows that both DSMs are within 0.9 m (3 ft.) of each other in almost the entire flight site except for the vegetated areas. It can be seen in this figure that a large portion of the site, especially in the central part, has an elevation difference between −0.3 m and +0.3 m (shown in green color), while the outskirts of the site represented by blue and red colors have larger elevation differences. This is confirmed in Figure 11b, which shows that elevation differences larger than 0.3 m (1 ft.) are primarily on the edge of the site, and a large portion of DSMs have elevation differences less than 0.3 m.
To better inspect the variance of elevation differences, the ANOVA test was applied to the results of this site too, in which the total number of elevation differences (n) is 207 and the number of sample groups (k) is 3. The null hypothesis is that the average elevation differences in these three drones are equal. The parameters of the ANOVA test are calculated as in Equations (21)–(30), resulting in a F v a l u e of 26.34. The F t a b l e for three levels of confidence (99%, 95%, and 90%) are indicated in Equation (29) for the calculated degrees of freedom, which are all smaller than F v a l u e . This suggests that the null hypothesis is rejected and the average elevation differences in three drones on this site are different with a 99% confidence level. This result of the ANOVA test is consistent with the results provided in Table 5 and is expected since the Mini2 drone was anticipated to create less precise mapping products compared to the other two survey-grade drones.
One must note that the null hypothesis of the ANOVA test was rejected in the results of both Mt. Tabor Park and White Oak Park, which confirms the other obtained results and indicates the lesser accuracy of the Mini2 ultra-lightweight drone. However, the F v a l u e of White Oak Park is much larger than F v a l u e of Mt. Tabor Park. The main difference between these flight sites was their area size, as White Oak Park was 34 hectares and Mt. Tabor Park was 11 hectares:
D F b e t w e e n = D F 1 = k 1   = 3 1 = 2
D F w i t h i n = D F 2 = n k = 207 3 = 204
S S T o t a l = ( x i μ G r a n d ) 2 = 15.2157
S S w i t h i n = ( x i μ i ) 2 = 12.0933
S S b e t w e e n = S S T o t a l   S S w i t h i n = 3.1225
S b e t w e e n 2 = S S b e t w e e n D F b e t w e e n = 3.1225 2 = 1.5612
S w i t h i n 2 = S S w i t h i n D F w i t h i n = 12.0933 204 = 0.059
F v a l u e = S b e t w e e n 2 S w i t h i n 2 = 1.5612 0.059 = 26.34
F o r   D F 1 = 2 ,   D F 2 = 204 ,   α = 0.01 = > F t a b l e = 4.61 F o r   D F 1 = 2 ,   D F 2 = 204 ,   α = 0.05 = > F t a b l e = 3.00 F o r   D F 1 = 2 ,   D F 2 = 204 ,   α = 0.10 = > F t a b l e = 2.30
F v a l u e > F t a b l e   n u l l   h y p o t h e s i s   H 0   i s   r e j e c t e d   i . e .   a t   l e a s t   o n e   a v e r a g e   i s   d i f f e r e n t   f r o m   o t h e r s
Generally, the final mapping accuracy depends on many factors that can generally be categorized into four groups: drone specifications, weather conditions, flight parameters, and site characteristics. Drone specifications include camera resolution, wind resistance, RTK capability, weight, size, maximum flight speed and time, etc. Weather conditions such as temperature, precipitation, wind speed, and wind direction could significantly affect the outputs. Flight parameters like flight altitude, number and distribution of GCPs, and image front and side overlaps can affect the results substantially, and finally the site characteristics, including land cover, topography, and the flight site size and shape, can certainly have a major impact on the results. This categorization assumes that the drone pilot is qualified and experienced and reliable software with the best available algorithm is used for data processing. That said, it seems to be impossible to define a precise quantitative relationship between each of the above-mentioned factors and the final mapping accuracy due to the large number of factors playing a role in the accuracy of results. In real-world projects in industry, depending on site characteristics, weather conditions, and the required deliverables, a drone pilot normally chooses a drone model and the flight parameters that can produce the most accurate results possible.
In this study, the obtained results indicated that, after strong wind, the site size is the second major reason for lower accuracy of ultralight drones. That is primarily due to the accumulation of errors. Survey-grade drones are able to capture aerial photographs with accurate geolocation regardless of site size by taking advantage of their RTK capabilities. However, the geolocation accuracy of photographs acquired by ultralight drones deteriorates during longer flight times on larger sites. Some potential solutions include but are not limited to the following results:
  • Increasing the number of GCPs;
  • Changing flight parameters, such as increasing the front and side overlap of images or reducing the flight altitude;
  • Flying in grid pattern, rather than single flight lines;
  • Dividing the site into smaller parts and flying and processing each part separately;
  • Using a LiDAR sensor instead of a camera for densely vegetated areas;
  • Employing photogrammetric algorithms optimized for non-RTK drones;
  • Mounting an external RTK module on the ultralight drone.
The above potential solutions have their own drawbacks, though. The first three recommendations above could substantially increase the time and expenses of the project. Including more GCPs improves the georeferencing accuracy, but it requires a surveyor to travel through the flight site to collect ground data with a GNSS receiver, which can be very time-consuming for sites larger than a hundred hectares. Increasing the image overlaps, reducing flight altitude, or flying in grid patterns enhances relative orientation of images, but it leads to a much larger volume of data, which will consequently increase both field time and office data processing time. Dividing the site into smaller sections and flying and processing its data separately seems to be an effective solution without increasing field or office time. However, it might introduce elevation steps or planimetric inconsistencies on the border of those divided sections or in their overlapping areas. As for densely vegetated areas, neither survey-grade nor ultralight drones generate results as accurate as non-vegetated parts, which is primarily due to limitations of existing photogrammetry algorithms. Even though using a LiDAR sensor could be a potential solution in theory, it is more common for larger survey-grade drones that can carry various sensors. Ultralight drones typically cannot carry LiDAR sensors due to their weight.
One must note that even though the above-mentioned potential solutions could be effective, they are not consistent with the scope of this work. The scope of this study is to investigate the potential of ultralight drones by inspecting whether non-RTK ultralight drones can produce mapping products as accurately as RTK-enabled drones using exactly the same flight and data processing parameters without any auxiliary hardware parts or additional post-processing.

5. Conclusions

The primary objective of this study was to investigate how accurate the mapping capabilities of ultralight non-RTK drones are since they are much more affordable compared to survey-grade RTK-enabled commercial drones. To this end, an ultra-lightweight (DJI Mini 2) drone and two survey-grade commercial drones (Mavic 3E and Phantom 4) were flown in three different areas, and their mapping products were compared. The results indicate that the mapping accuracy of Mini 2 was very similar to that of Mavic 3E and Phantom 4 for an 11-hectare site. Whereas the mapping accuracy of Mini 2 for a 34-hectare site was considerably lower than that of Mavic 3E and Phantom 4, which was sufficient only for low-precision applications such as excavation and groundwork. The biggest shortcoming of the Mini 2 was its susceptibility to wind to a point where its data on a day with strong wind could not even be processed. This is the case for all ultralight drones, as their weak resistance to wind is due to their light weight. For calm weather conditions (with no strong wind or gust), Mini2 was able to generate accurate mapping products for smaller sites (11 hectares), while its accuracy degenerated as the area size increased to 34 hectares. That being said, it can be concluded that ultra-lightweight UAVs, when properly deployed and processed, can achieve mapping accuracies comparable to commercial drones depending on
  • Weather conditions, especially wind (up to 13 km/h);
  • Area size (up to 11 hectares);
  • Number and distribution of GCPs.
Moreover, the following remarks need to be considered:
  • Wind speed is a natural phenomenon and obviously cannot be controlled. Therefore, an exact number for the wind speed threshold cannot be determined. The wind speed mentioned in the bullet points in the above paragraph was the fastest wind speed tested that produced reliably precise results. Furthermore, data regarding wind speed is normally available as an average number in a given area for each hour of the day. Even if one tries to use a separate instrument to record wind speed at a higher frequency in real-time during the flight, it will not be the same wind speed that the drone experiences since the operator would be measuring the wind speed at a fixed location on the ground while the drone is experiencing a different wind speed at an altitude of 100 m above ground. That said, the hourly average wind speed provides a sufficient measure of wind speed impact on the drones’ mapping accuracy.
  • Flight sites were selected to have different sizes, which were 8, 11, and 34 hectares. The ultra-lightweight drone produced survey-grade results for the 11-hectare site and generated less precise results for the 34-hectare site. However, it would not be practical to increase the area size incrementally to reach an exact threshold, and it was not the intent of this work either. The goal of this study was to test whether ultralight drones can produce survey-grade results for small sites or not. Considering that many other factors affect the final mapping accuracy, determining a precise number as the area size threshold would not be correct either. Additionally, the area size of the majority of small projects (in urban areas, industrial sites, etc.) is smaller than 11 hectares, suggesting that an ultra-lightweight drone can potentially be employed for such projects. However, when high-precision results are required for larger sites (over 11 hectares), using a commercial survey-grade drone is recommended.
  • The number of observed GCPs was kept almost the same (10–12 GCPs) for all three sites intentionally to test the ultralight drone’s performance. In White Oak Park, which was the largest site (34 hectares), the mapping accuracy of Mini2 could potentially improve with more GCPs, but as mentioned earlier, in this study, some determining factors such as GCPs were kept the same so that the performance of these three drones could be compared more accurately.
  • It is worth mentioning that while the type of UAVs certainly affects their performance and accuracy, the results obtained in this work indicate the inherent susceptibility of ultra-lightweight drones to wind and the fact that their accuracy degenerates with the area size since they are non-RTK drones. That is, all types of ultra-lightweight drones would struggle to resist strong winds due to their light weight, and they would deviate from the planned flight lines, which consequently decreases the side overlaps and adversely affects mapping accuracy. Moreover, such ultralight drones do not have RTK capability, so their mapping error accumulates with time. Therefore, the larger the flight site, the longer the flight time would be, which decreases mapping accuracy as well.
  • This study was aimed at investigating the mapping accuracy of non-RTK ultralight drones in comparison with RTK-enabled drones using exactly the same flight and data processing parameters. Considering the results obtained in this work and the discussions provided, the seven potential solutions listed at the end of Section 4.4.3 can be explored as follow-up to this work to inspect their impact on the mapping results of non-RTK ultralight drones.
While commercial survey-grade UAVs offer enhanced sensor payloads, lightweight drones excel in cost-efficiency, deployment speed, and operational flexibility. This makes them a powerful tool in the expanding domain of UAV-based surveying and mapping across sectors from surveying and mapping to agriculture, mining, infrastructure monitoring, and environmental science.

Supplementary Materials

The following supporting information can be downloaded at: https://www.mdpi.com/article/10.3390/automation6040060/s1.

Funding

This research received no external funding.

Data Availability Statement

The data presented in this study is available upon request from the corresponding author due to the data being collected from public areas, and there may be individuals within the data who have not consented to its public sharing.

Acknowledgments

Kennesaw State University is appreciated for providing a DJI Mavic 3 Enterprise RTK drone and computing hardware and software for processing the collected data, which was used in this research. The assistance of Caelyn Summers with the literature review is also acknowledged.

Conflicts of Interest

The author declares no conflicts of interest. The funders had no role in the design of the study; in the collection, analyses, or interpretation of data; in the writing of the manuscript; or in the decision to publish the results.

Abbreviations

The following abbreviations are used in this manuscript:
UAUnmanned Aircraft
3DThree-Dimensional
GNSSGlobal Navigation Satellite System
RGBRed, Green, Blue
LiDARLight Detection and Ranging
DSMDigital Surface Model
DTMDigital Terrain Model
FAAFederal Aviation Administration
kgKilo Gram
CFRCode of Federal Regulations
RTKReal-Time Kinematic
UAVUnmanned Aerial Vehicle
MPMega Pixel
GCPGround Control Points
QCQuality Control
ANOVAAnalysis of Variance
SfMStructure-from-Motion
GISGeographic Information System
DEMDigital Elevation Model
NAD 83North American Datum 1983
NAVD 88North American Vertical Datum 1988
SISystem International
LAELow-Altitude Economy

References

  1. Yang, B.; Fang, L. Automated extraction of 3-D railway tracks from mobile laser scanning point clouds. IEEE J. Sel. Top. Appl. Earth Obs. Remote Sens. 2014, 7, 4750–4761. [Google Scholar] [CrossRef]
  2. Arastounia, M. Automated recognition of railroad infrastructure in rural areas from LiDAR data. Remote Sens. 2015, 7, 14916–14938. [Google Scholar] [CrossRef]
  3. Dorninger, P.; Pfeifer, N. A comprehensive automated 3D approach for building extraction, reconstruction, and regularization from airborne laser scanning point clouds. Sensors 2008, 8, 7323–7343. [Google Scholar] [CrossRef]
  4. Federal Aviation Administration. Remote Pilot—Small Unmanned Aircraft Systems Study Guide. Available online: https://www.faa.gov/sites/faa.gov/files/regulations_policies/handbooks_manuals/aviation/remote_pilot_study_guide.pdf (accessed on 10 April 2025).
  5. Shahmoradi, J.; Talebi, E.; Roghanchi, P.; Hassanalian, M. A Comprehensive Review of Applications of Drone Technology in the Mining Industry. Drones 2020, 4, 34. [Google Scholar] [CrossRef]
  6. Nirmal, S.; Kumbhar, V. Applications of drone and unmanned aerial vehicle (UAV) surveying for planning for cities. Int. J. Res. Appl. Sci. Eng. Technol. 2024, 12, 885–888. [Google Scholar] [CrossRef]
  7. Bui, X.; Lee, C.; Long, N.; Ahmed, A.; Cao, X.; Nghia, N.; Canh, L.; Nguyen, H.; Le, Q.; Huong, D.; et al. Use of unmanned aerial vehicles for 3D topographic mapping and monitoring the air quality of open-pit mines. Inżynieria Miner. POL-VIET Test 2022, 2, 223–239. [Google Scholar] [CrossRef]
  8. Long, N.; Dang, M.; Bui, L.; Bui, Q.; Tran, T.X. Application of unmanned aerial vehicles for surveying and mapping in mines: A review. In Advances in Geospatial Technology in Mining and Earth Sciences; Springer: Cham, Switzerland, 2023. [Google Scholar] [CrossRef]
  9. Hugenholtz, C.; Brown, O.; Walker, J.; Barchyn, T.E.; Nesbit, P.; Kucharczyk, M.; Myshak, S. Spatial Accuracy of UAV-Derived Orthoimagery and Topography: Comparing Photogrammetric Models Processed with Direct Geo-Referencing and Ground Control Points. Geomatica 2016, 70, 21–30. [Google Scholar] [CrossRef]
  10. Martínez-Carricondo, P.; Agüera-Vega, F.; Carvajal-Ramírez, F.; Mesas-Carrascosa, F.J.; García-Ferrer, A.; Pérez-Porras, F.J. Assessment of UAV-photogrammetric mapping accuracy based on variation of ground control points. Int. J. Appl. Earth Obs. Geoinf. 2018, 72, 1–10. [Google Scholar] [CrossRef]
  11. Allison, M.; Adcock, S. Drone surveying in a complex area: A case study. In Proceedings of the SEG International Exposition and Annual Meeting, San Antonio, TX, USA, 15 September 2019; pp. 279–282. [Google Scholar] [CrossRef]
  12. Long, N.; Goyal, R.; Bui, L.; Cao, C.; Canh, L.; Minh, N.; Bui, X. Optimal choice of the number of ground control points for developing precise DSM using light-weight UAV in small and medium-sized open-pit mine. Arch. Min. Sci. 2021, 66, 369–384. [Google Scholar] [CrossRef]
  13. Lee, J.; Jo, H.; Oh, J. Application of Drone LiDAR Survey for Evaluation of a Long-term Consolidation Settlement of Large Land Reclamation. Appl. Sci. 2023, 13, 8277. [Google Scholar] [CrossRef]
  14. Kundu, S.; Das, N.; Saha, D.; Biswas, P. Unknown terrain imaging with adaptive spatial resolution using UAV. Ad Hoc Netw. 2022, 135, 102937. [Google Scholar] [CrossRef]
  15. Zhou, Y. Unmanned aerial vehicles based low-altitude economy with lifecycle techno-economic-environmental analysis for sustainable and smart cities. J. Clean. Prod. 2025, 499, 145050. [Google Scholar] [CrossRef]
  16. Rachmawati, S.; Putra, A.; Priyatama, A.; Parulian, D.; Katarina, D.; Habibie, M.; Siahaan, M.; Ningrum, E.; Medikano, A.; Valentino, V.H. Application of Drone Technology for Mapping and Monitoring of Corn Agricultural Land. In Proceedings of the International Conference on ICT for Smart Society (ICISS), Bandung, Indonesia, 2–4 August 2021; pp. 1–5. [Google Scholar] [CrossRef]
  17. Oh, J.; Jang, Y.; Lee, C. Accuracy Analysis of Low-Cost UAV Photogrammetry for Corridor Mapping. J. Korean Soc. Surv. Geod. Photogramm. Cartogr. 2018, 36, 565–572. [Google Scholar] [CrossRef]
  18. Deliry, S.I.; Avdan, U. Accuracy assessment of UAS photogrammetry and structure from motion in surveying and mapping. Int. J. Eng. Geosci. 2024, 9, 165–190. [Google Scholar] [CrossRef]
  19. Nex, F.; Remondino, F. UAV for 3D mapping applications: A review. Appl. Geomat. 2013, 6, 1–15. [Google Scholar] [CrossRef]
  20. Shakhatreh, H.; Sawalmeh, A.; Al-Fuqaha, A.; Dou, Z. Unmanned Aerial Vehicles (UAVs): A Survey on Civil Applications and Key Research Challenges. IEEE Access 2019, 7, 48572–48634. [Google Scholar] [CrossRef]
  21. Lee, S.B.; Jeong, M.; Auh, S.C.; Kim, J.J. Development of standard work type to utilize drone at expressway construction sites. KSCE J. Civ. Environ. Eng. Res. 2021, 41, 461–468. [Google Scholar] [CrossRef]
  22. Mandirola, M.; Casarotti, C.; Peloso, S.; Lanese, I.; Brunesi, E.; Senaldi, I. Use of UAS for damage inspection and assessment of bridge infrastructures. Int. J. Disaster Risk Reduct. 2022, 72, 102824. [Google Scholar] [CrossRef]
  23. Liang, M.; Delahaye, D. Drone fleet deployment strategy for large scale agriculture and forestry surveying. In Proceedings of the IEEE Intelligent Transportation Systems Conference (ITSC), Auckland, New Zealand, 27–30 October 2019; pp. 4495–4500. [Google Scholar] [CrossRef]
  24. Tomczyk, A.; Ewertowski, M.; Creamy, N.; Ancin-Murguzur, R.; Monz, C. The application of unmanned aerial vehicle (UAV) surveys and GIS to the analysis and monitoring of recreational trail conditions. Int. J. Appl. Earth Obs. Geoinf. 2023, 123, 103474. [Google Scholar] [CrossRef]
  25. Barry, P.; Coakley, R. Accuracy of UAV photogrammetry compared with network RTK GPS. ISPRS Int. Arch. Photogramm. Remote Sens. Spat. Inf. Sci. 2013, 2, 27–31. [Google Scholar] [CrossRef]
  26. Uysal, M.; Toprak, A.S.; Polat, N. DEM generation with UAV photogrammetry and accuracy analysis in Sahitler hill. Measurement 2015, 73, 539–543. [Google Scholar] [CrossRef]
  27. Izere, P.; Zhao, B.; Schnable, J.; Ge, Y.; Shi, Y. Positioning accuracy of RTK-GNSS-enabled drones and their performance in agricultural crop sensing. J. Am. Soc. Agric. Biol. Eng. 2025, 68, 559–571. [Google Scholar] [CrossRef]
  28. Madawalagama, S.; Munasinghe, N.; Dampegama, S.; Samarakoon, L. Low-cost aerial mapping with consumer-grade drones. In Proceedings of the 37th Asian Conference on Remote Sensing, Colombo, Sri Lanka, 17–21 October 2016. [Google Scholar]
  29. Jiménez-Jiménez, S.I.; Ojeda-Bustamante, W.; Marcial-Pablo, M.d.J.; Enciso, J. Digital terrain models generated with low-cost UAV photogrammetry: Methodology and accuracy. Int. J. Geo-Inf. 2021, 10, 285. [Google Scholar] [CrossRef]
  30. Torres-Sánchez, J.; López-Granados, F.; Borra-Serrano, I.; Pena, J.M. Assessing UAV-collected image overlap influence on computation time and digital surface model accuracy in olive orchards. Precis. Agric. 2017, 19, 115–133. [Google Scholar] [CrossRef]
  31. Nagendran, S.K.; Tung, W.Y.; Ismail, M.A.M. Accuracy assessment on low altitude UAV-borne photogrammetry outputs influenced by ground control point at different altitudes. IOP Conf. Ser. Earth Environ. Sci. 2018, 169, 012031. [Google Scholar] [CrossRef]
  32. Kalacska, M.; Lucanus, O.; Arroyo-Mora, J.P.; Laliberté, É.; Elmer, K.; Leblanc, G.; Groves, A. Accuracy of 3D landscape reconstruction without ground control points using different UAS platforms. Drones 2020, 4, 13. [Google Scholar] [CrossRef]
Figure 1. Three drones employed in this study, i.e., Phantom 4 RTK (P4), Mini 2 SE (M2), and Mavic 3 Enterprise RTK (M3).
Automation 06 00060 g001
Figure 2. The spatial distribution of ground control points (GCPs) in three flight sites: Oregon Park (a), Mt. Tabor Park (b), and White Oak Park (c).
Automation 06 00060 g002
Figure 3. Flight lines of different drones in Oregon Park. While flight lines of M3 (a) and P4 (b) were parallel and consistent with planned flight lines, those of M2 (c,d) were significantly distorted.
Automation 06 00060 g003
Figure 4. The orthomosaics and DSMs of Oregon Park using data collected by M3 (a,b) and P4 (c,d) drones.
Automation 06 00060 g004
Figure 5. The orthomosaics and DSMs of Mt. Tabor Park using data collected by M3 (a,b), P4 (c,d), and M2 drones (e,f).
Automation 06 00060 g005
Figure 6. The orthomosaics and DSMs of White Oak Park using data collected by M3 (a,b), P4 (c,d), and M2 drones (e,f).
Automation 06 00060 g006
Figure 7. Histogram of elevation differences between ground points and DSMs generated from M3 (a) and P4 (b) drones in Oregon Park. Considering that M3 and P4 are survey-grade drones, their range of elevation differences is larger than expected due to strong wind on the flight day.
Automation 06 00060 g007
Figure 8. Histogram of elevation differences between ground points and DSMs generated from M3 (a), P4 (b), and Mini2 SE (c) drones in Mt. Tabor Park. The range of elevation differences in M2 is considerably larger than that of M3 and P4 drones.
Automation 06 00060 g008
Figure 9. DSM of Mt. Tabor Park created from M3 and M2 data superimposed. The elevation difference between two DSMs is within 0.9 m (3 ft.) in almost the entire flight site except for the vegetated area (a), and it is within 0.3 m (1 ft.) in most of the site (b).
Automation 06 00060 g009
Figure 10. Histogram of elevation differences between ground points and DSMs generated from M3 (a), P4 (b), and Mini2 SE (c) drones in White Oak Park. The range of elevation differences in M2 is significantly larger than that of M3 and P4 drones.
Automation 06 00060 g010
Figure 11. The DSM of White Oak Park created from M3 and M2 data superimposed. Two DSMs in almost the entire flight site, except for the vegetated areas, are within 0.9 m/3 ft. (a). While the central parts of the site are still within 0.3 m/1 ft., the site edge shows a larger discrepancy between two DSMs (b).
Automation 06 00060 g011
Table 1. Specifications of the drones employed in this work.
SpecificationsDrones
Mavic 3E RTKPhantom 4 RTKMini 2 SE
Camera resolution (MP)202012
Image sensor4/3″ CMOS1″ CMOS1/2.3″ CMOS
Weight (g)9151391246
Maximum flight speed with no wind (m/s)211616
Maximum flight time with no wind (min)453030
Maximum wind tolerance (m/s)121010.7
RTK CapabilityYesYesNo
Table 2. Characteristics of the three mapping sites and the meteorological conditions on flight days.
Characteristics and Met ConditionMapping Sites
Oregon ParkMt. Tabor ParkWhite Oak Park
LocationMarietta, GA, USADallas, GA, USADallas, GA, USA
Area (hectares)7.8511.0934.07
Perimeter (km)1.191.343.04
Wind speed (km/h)211113
GustYesNoNo
Temperature (°C)71410
Weather descriptionFew clouds, no rain, windy with strong gustClear sunny sky, mild wind, no strong gustScattered clouds, fairly windy, no strong gust
Number of GCPs101112
Checkpoint No.232757
Front/Side overlap (%)80/7580/7580/75
Flight altitude (m)100100100
Table 3. The statistical measures of elevation difference between the ground points and DSM of Oregon Park.
Statistical Measures of Elevation DifferencesMavic 3EPhantom 4
Minimum (m)−0.03−0.15
Maximum (m)0.160.01
Standard deviation (m)0.040.04
Range (m)0.190.16
Average (m)0.03−0.07
Table 4. The statistical measures of elevation difference between the ground points and DSM of Mt. Tabor Park.
Statistical Measures of Elevation DifferencesMavic 3EPhantom 4Mini 2 SE
Minimum (m)−0.02−0.04−0.08
Maximum (m)0.080.060.08
Standard deviation (m)0.020.020.04
Range (m)0.100.100.17
Average (m)0.04−0.010.02
Table 5. The statistical measures of elevation difference between the ground points and DSM of White Oak Park.
Statistical Measures of Elevation DifferencesMavic 3EPhantom 4Mini 2 SE
Minimum (m)−0.07−0.07−0.40
Maximum (m)0.150.190.46
Standard deviation (m)0.040.050.16
Range (m)0.230.260.87
Average (m)0.010.02−0.01
Disclaimer/Publisher’s Note: The statements, opinions and data contained in all publications are solely those of the individual author(s) and contributor(s) and not of MDPI and/or the editor(s). MDPI and/or the editor(s) disclaim responsibility for any injury to people or property resulting from any ideas, methods, instructions or products referred to in the content.