3.3. Performance of the Five-Coefficient Correction Model
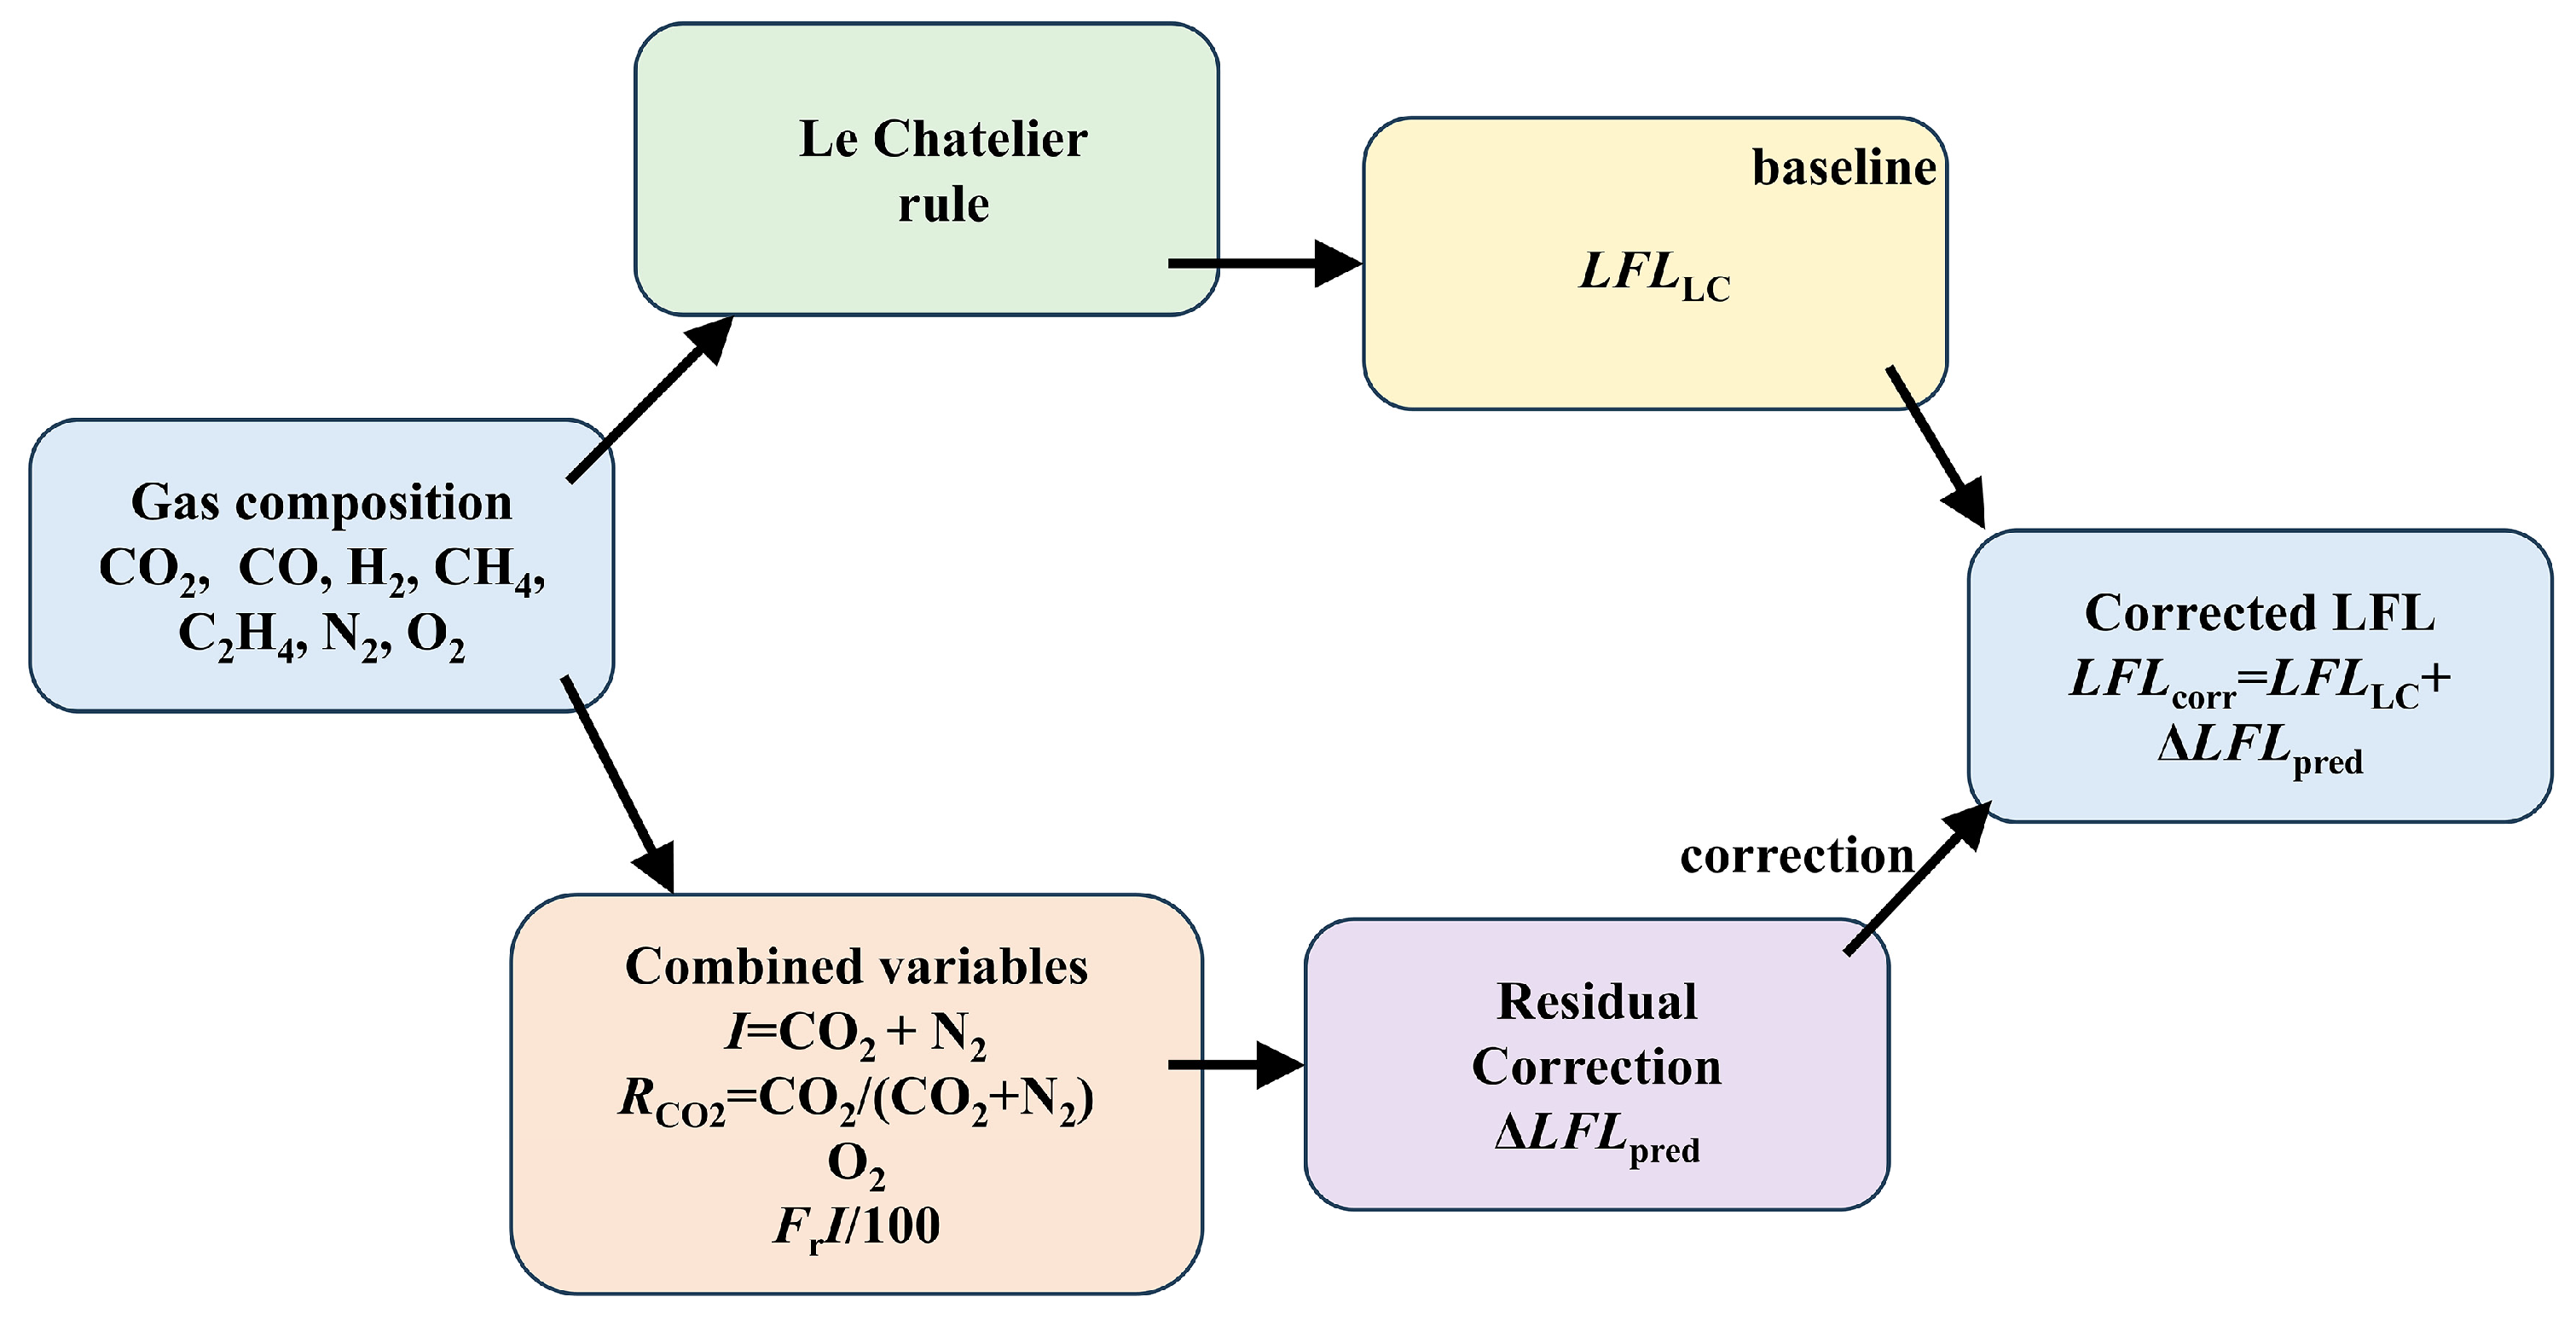
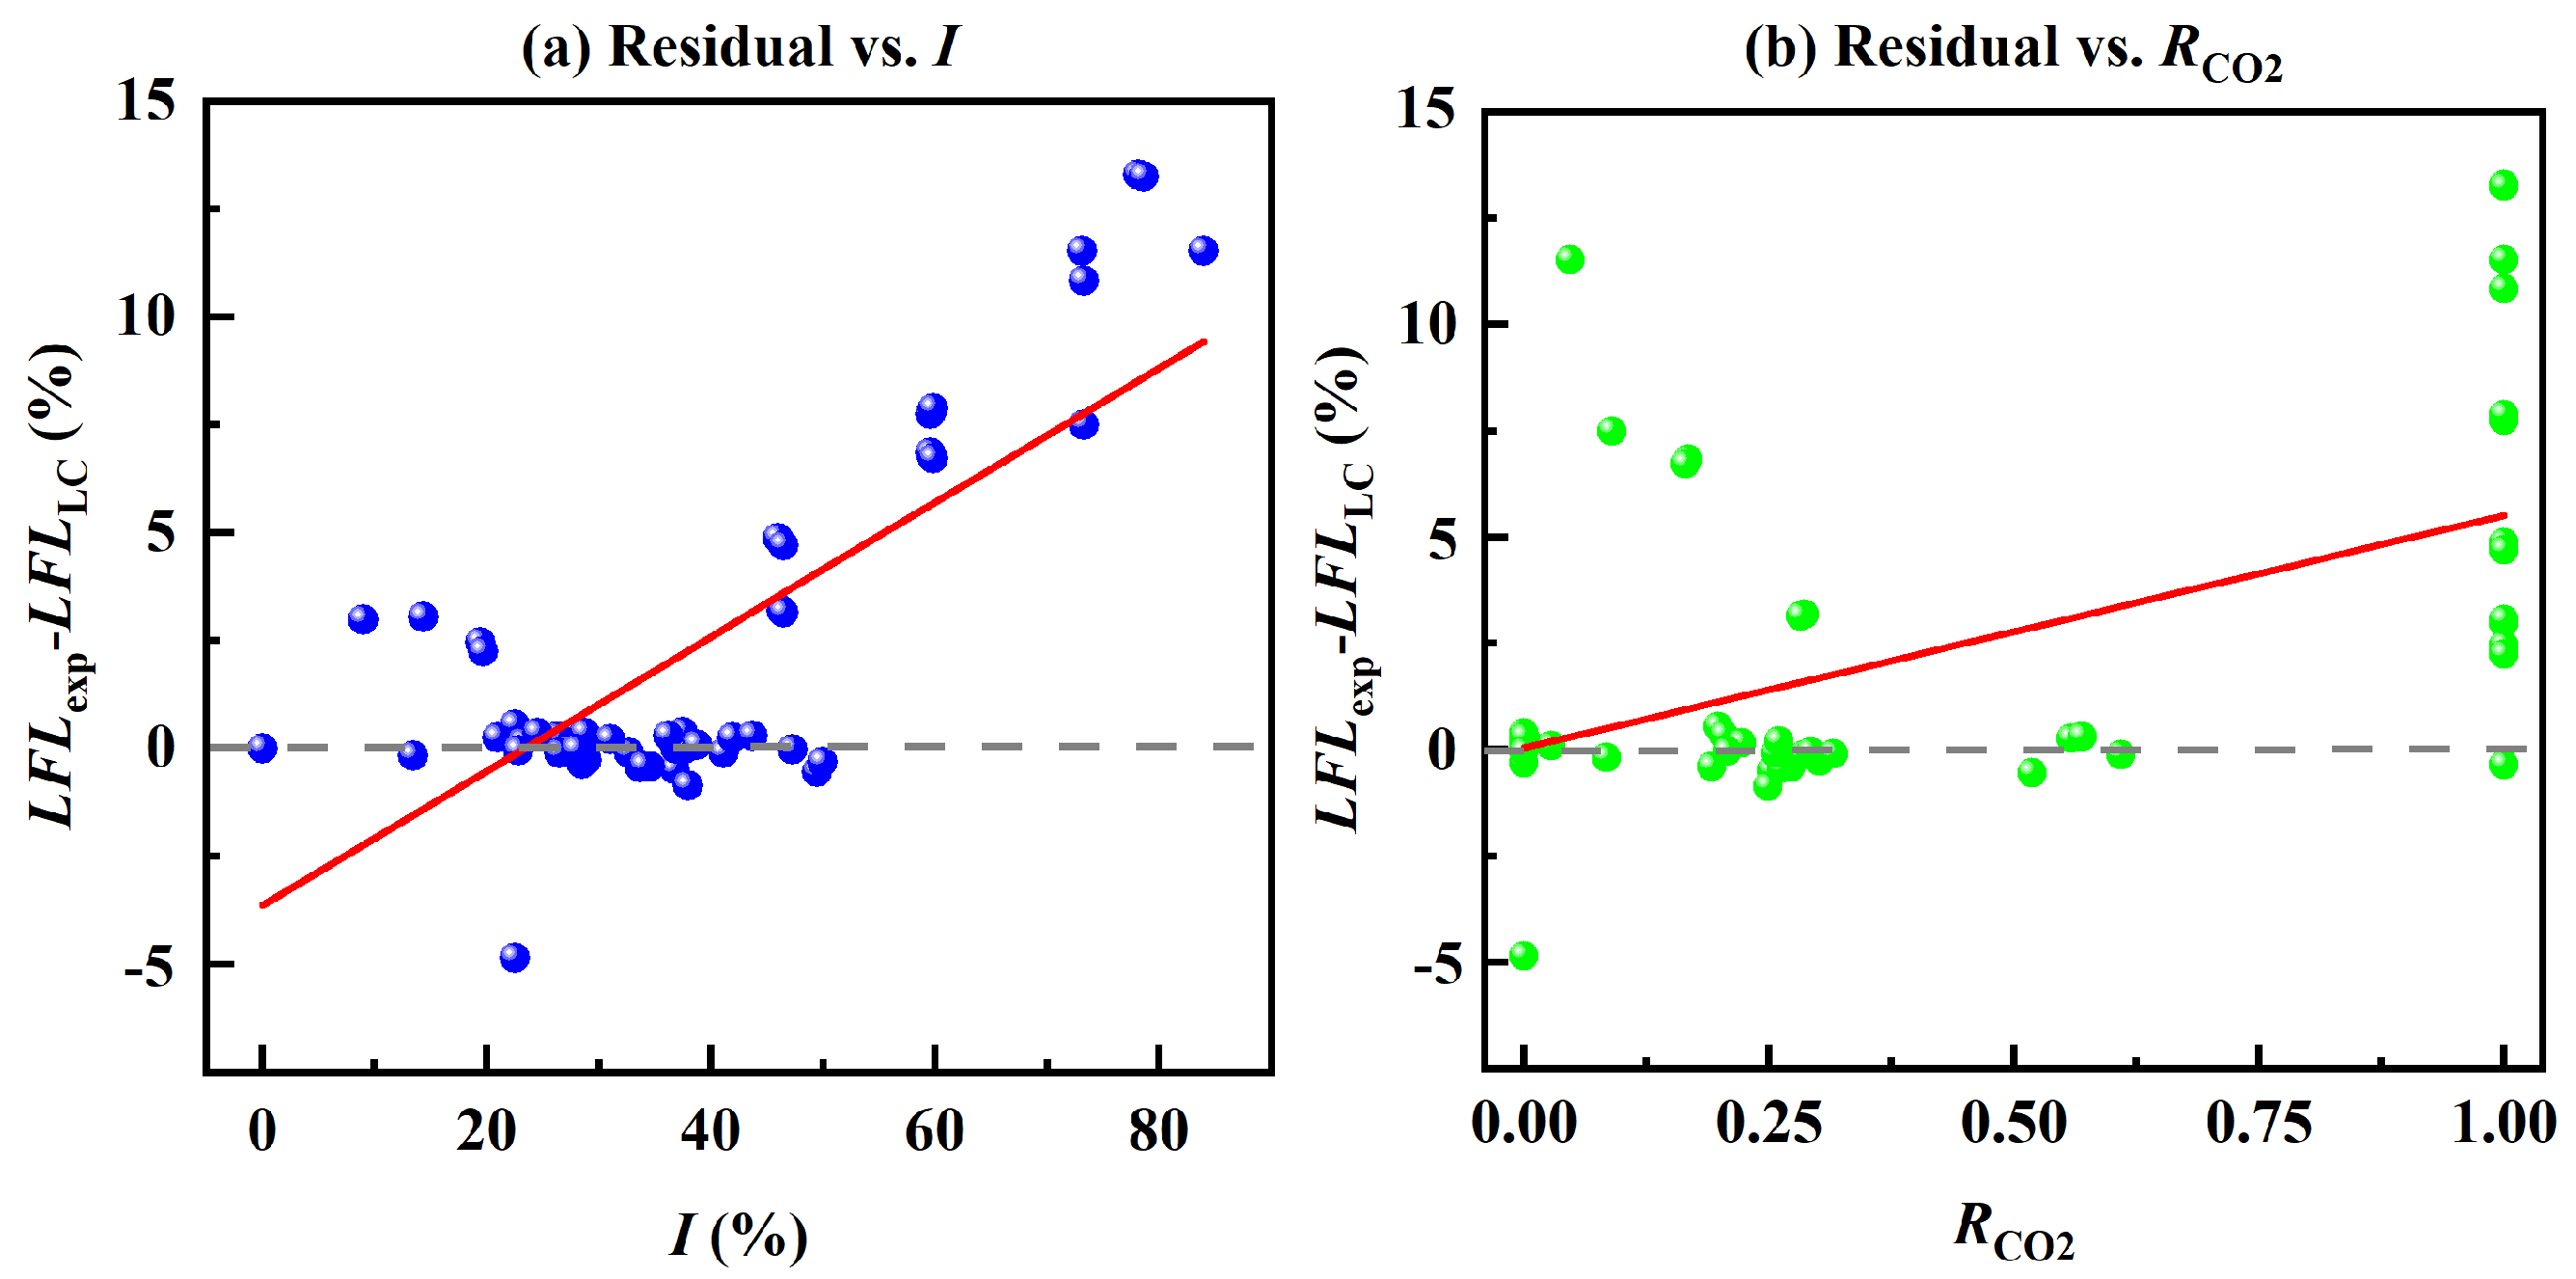
Based on the residual patterns identified above, a parsimonious five-coefficient correction model was established. The fitted coefficients are listed in
Table 6, and the resulting correction equation was expressed as Equation (14):
All gas fractions in Equation (14) are expressed in volume percent, except
RCO2, which is dimensionless. As shown in
Table 6, the correction term increased with the total diluent fraction and the CO
2 fraction in the diluent gases, but decreased with O
2 concentration and the interaction between highly reactive fuels and total dilution. These coefficient signs are physically consistent with the interpretation that CO
2/N
2 dilution raises the LFL beyond the Le Chatelier estimate, whereas highly reactive fuels such as H
2 and C
2H
4 partly offset the dilution effect. To further evaluate coefficient robustness, standard errors and 95% confidence intervals were calculated. The coefficients of I, RCO2, O
2, and FrI/100 were statistically significant, whereas the intercept was not significant but was retained to avoid forcing the residual correction through zero.
The prediction improvement is shown in
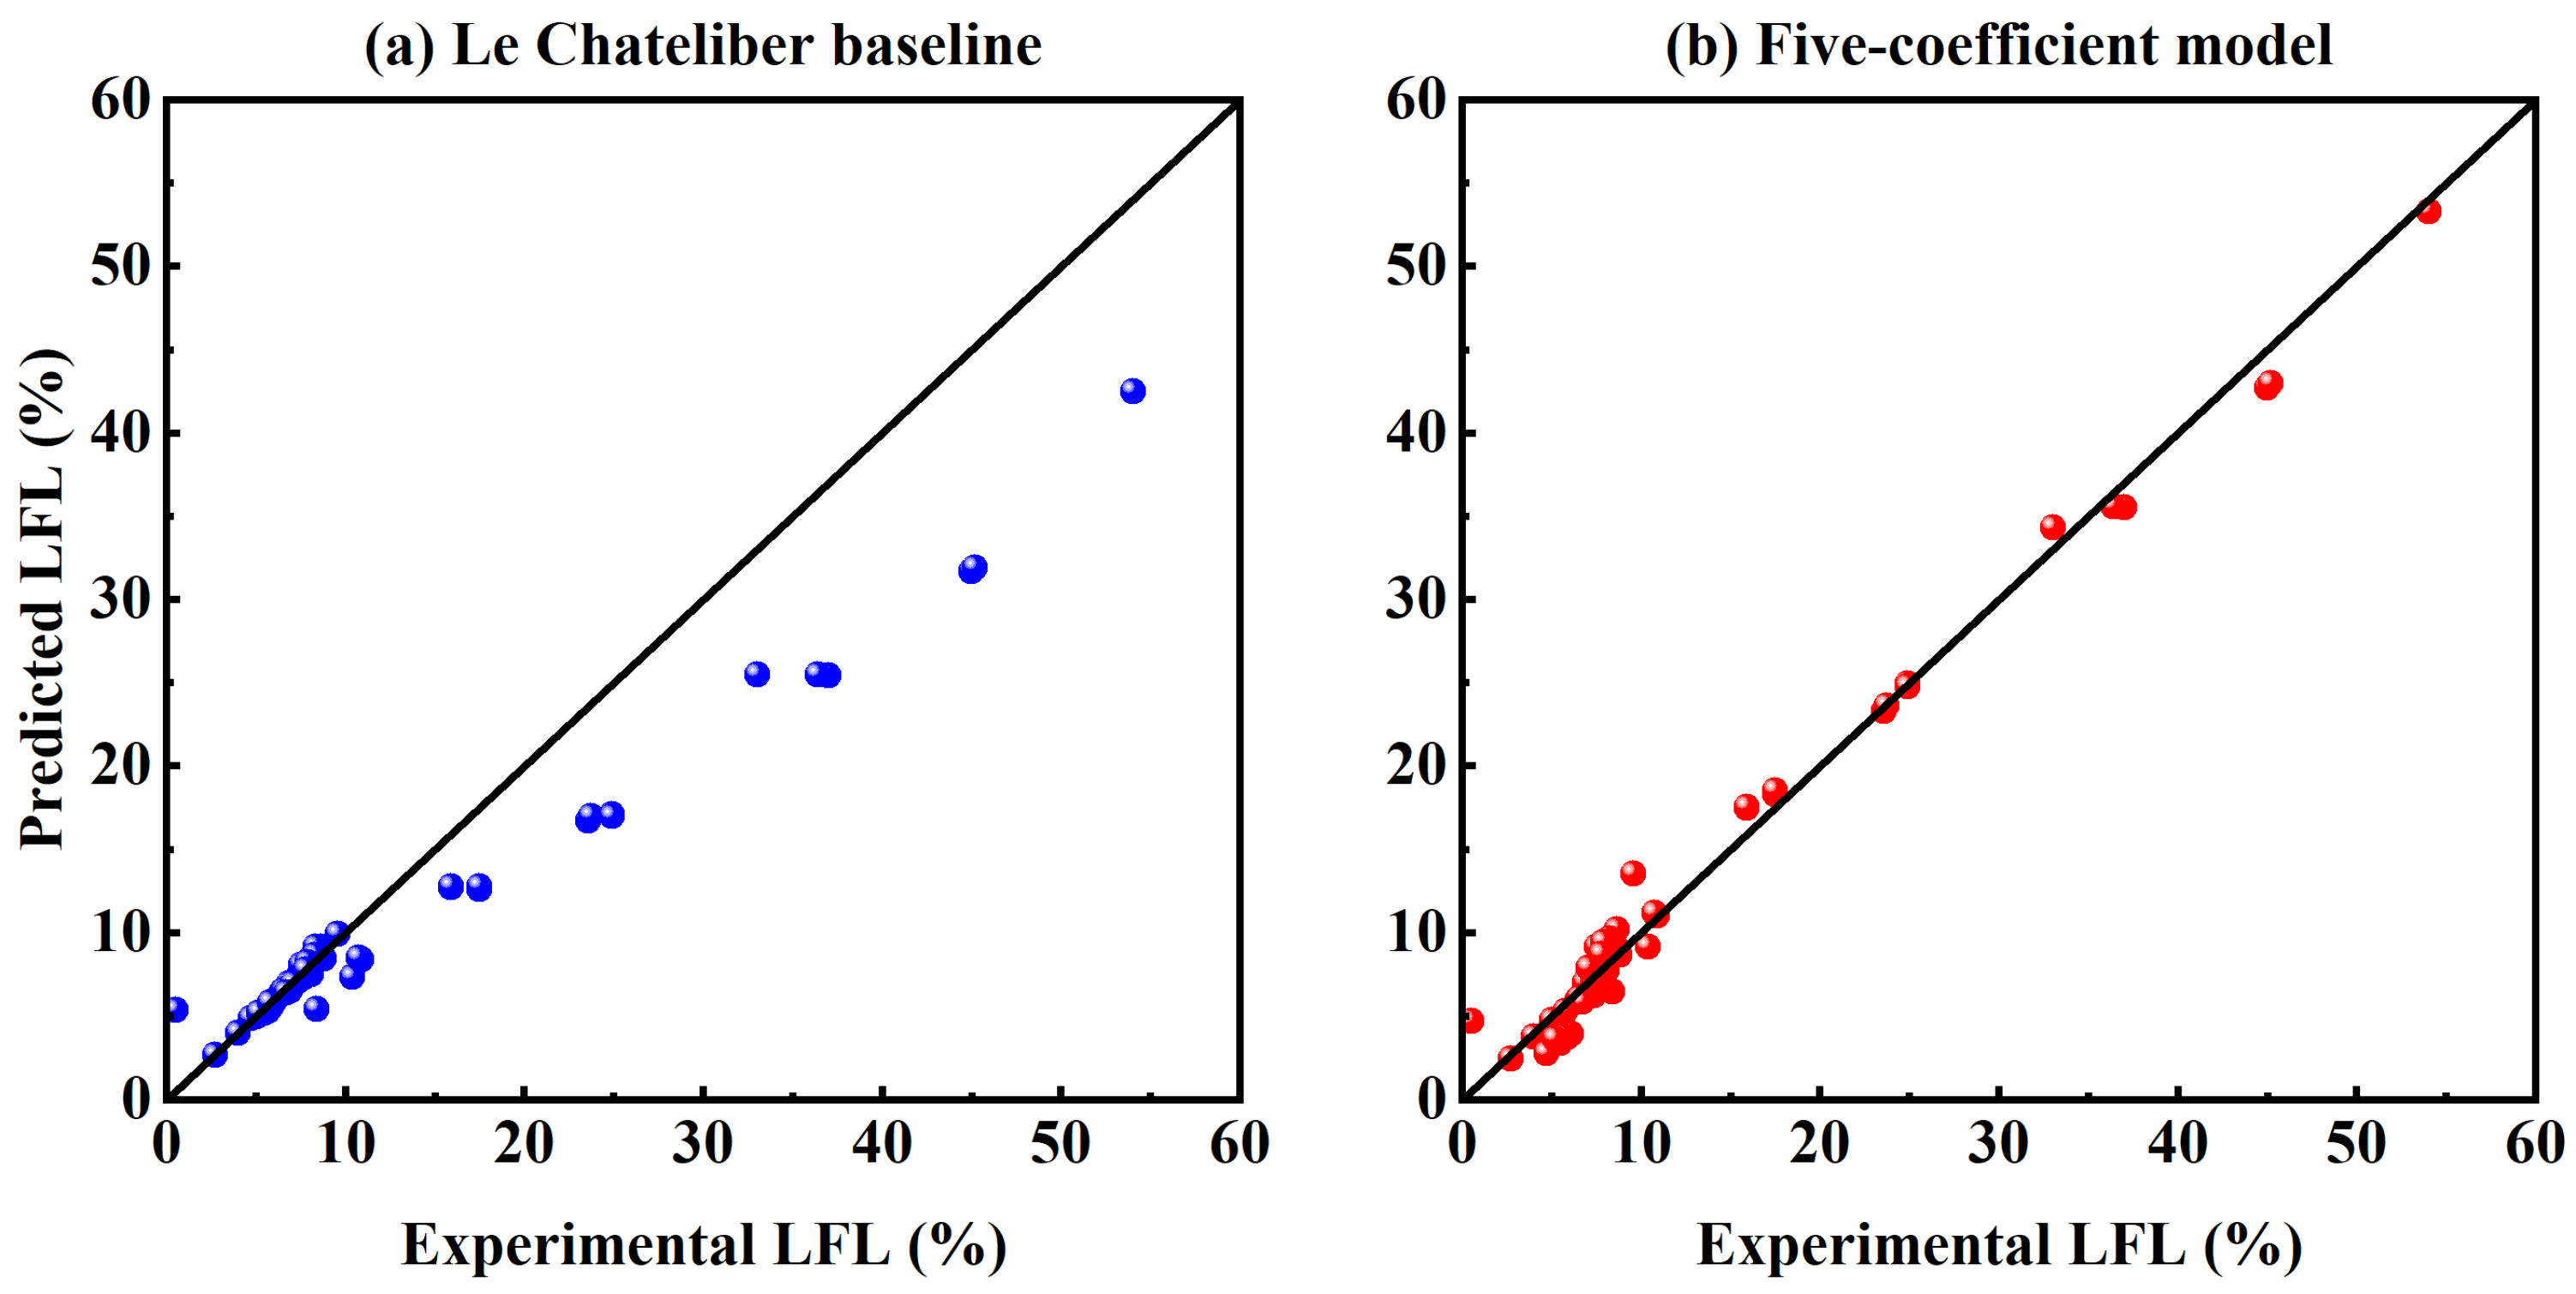
Figure 5. Compared with the baseline prediction, the corrected predictions were much closer to the
y =
x reference line across both low- and high-LFL regions. Quantitatively, the direct-fit performance improved from
R2 = 0.848, RMSE = 4.42%, and MAE = 2.40% for the baseline model to
R2 = 0.986, RMSE = 1.33%, and MAE = 1.00% after correction. The corrected model also remained stable under random five-fold cross-validation and grouped five-fold cross-validation, supporting its robustness within the available composition space.
3.4. Comparison with Black-Box Models and Discussion of Physical Meaning
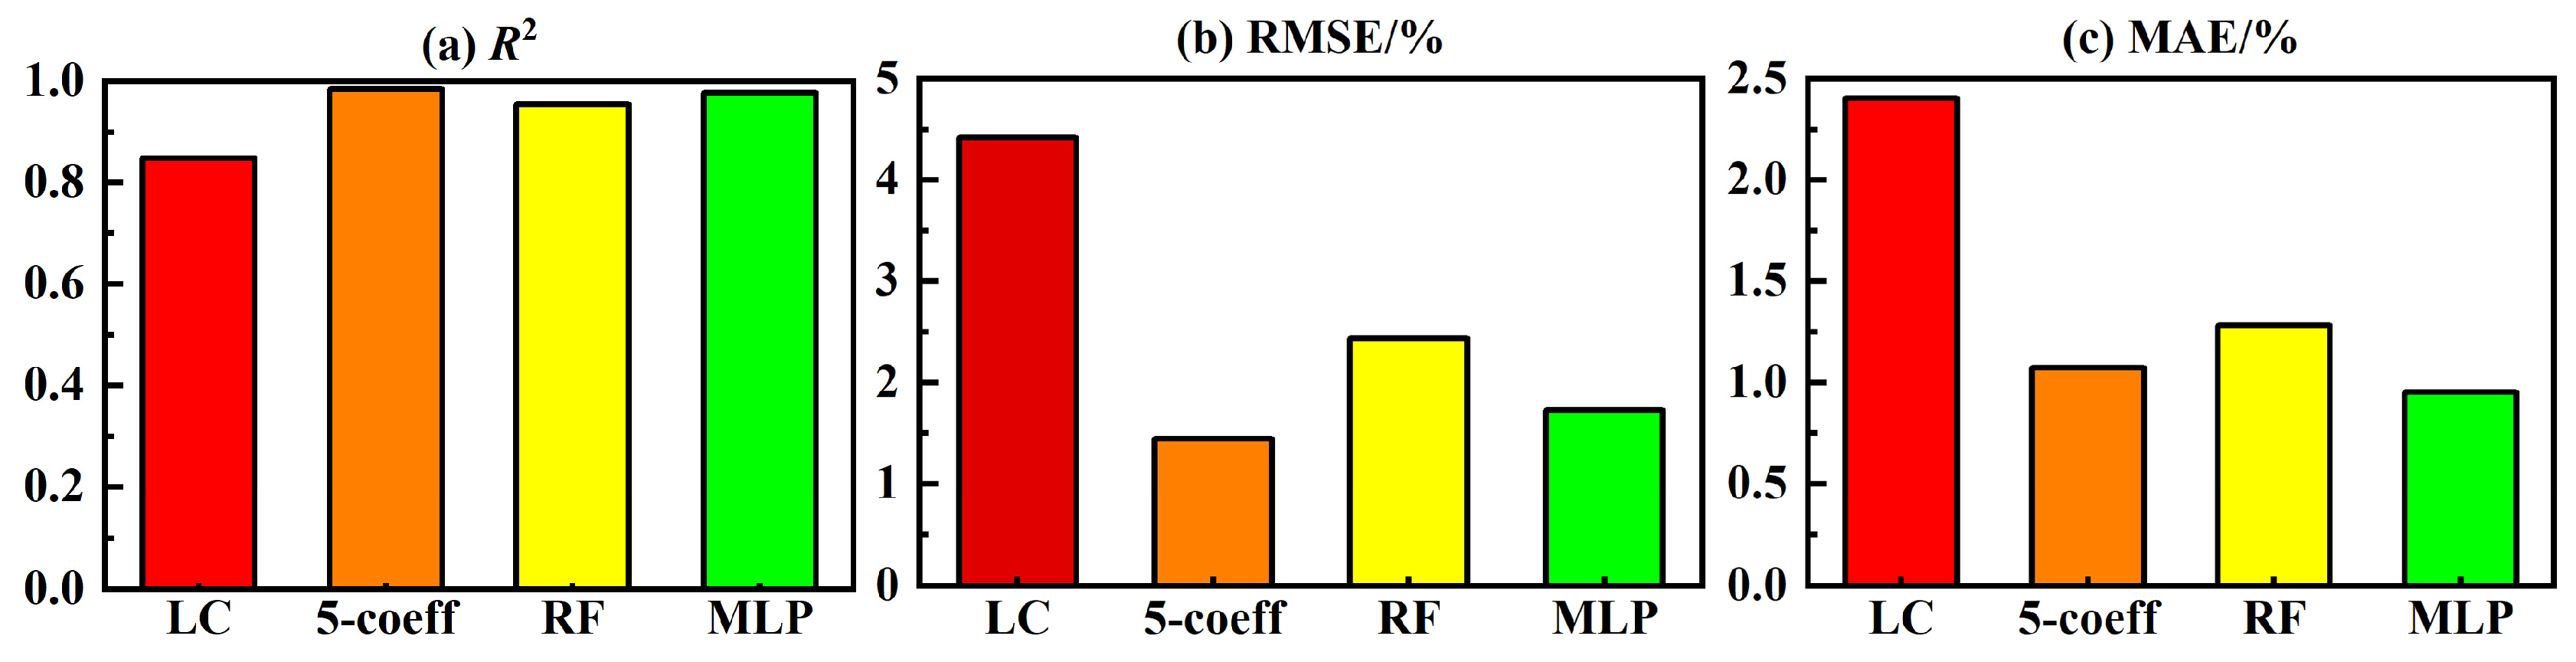
To determine whether a more complex black-box method provided additional benefit, the five-coefficient correction model was compared with random forest regression and a shallow neural network. The complete performance comparison is provided in
Table 7. The proposed correction model achieved
R2 = 0.984, RMSE = 1.44%, and MAE = 1.07% under grouped five-fold validation. In comparison, the random forest model yielded
R2 = 0.954, RMSE = 2.44%, and MAE = 1.28%, whereas the shallow neural network yielded
R2 = 0.977, RMSE = 1.72%, and MAE = 0.95%.
It should be noted that the performance metrics in
Table 7 were calculated exclusively using the 58 data points in the primary database listed in
Table S1. The sample-wise predictions are provided in
Table S5. The external literature data listed in
Tables S8 and S9, as well as the excluded external candidates listed in
Table S10, were not used in the main model fitting, coefficient estimation, cross-validation, or primary performance metrics.
To further assess external applicability, the final correction equation was applied without refitting to selected external literature data with complete gas-composition information and experimentally measured lean-limit values. This analysis was treated as an exploratory external applicability check rather than a formal external validation, because the external data differed in mixture system, propagation direction, apparatus, ignition criterion, and reporting format. As summarized in
Table S11, the corrected model reduced the MAE from 0.945% to 0.624% and the RMSE from 1.310% to 0.691% for the exploratory subset including Burgess upward lean-boundary multicomponent data and one Li-ion premixed battery vent-gas case. These results suggest potential external applicability of the correction equation, but further validation using newly measured real battery vent-gas data is still required.
Figure 6 presents the same comparison graphically.
Figure 6a shows that the corrected model retained a high
R2 under grouped validation, while
Figure 6b,c show that it also produced low RMSE and MAE. Although the shallow neural network achieved a slightly lower MAE than the explicit correction model, it showed a lower
R2 and a higher RMSE under grouped validation. This suggests that the neural network reduced the average absolute error for some samples but produced larger deviations for other underrepresented or high-LFL mixtures. Therefore, the proposed correction model should not be interpreted as universally superior to black-box models. Its main advantage lies in its explicit mathematical form, low computational cost, and physical interpretability. For safety-oriented preliminary LFL estimation under small-sample conditions, transparency and reproducibility are as important as average error reduction. Recent battery-machine-learning studies have emphasized the importance of cross-condition prediction, standardized modeling platforms, and chemistry-aware modeling for improving generalizability and reproducibility in battery data science [
40,
41,
42]. Compared with these large-scale battery-ML frameworks, the present study focuses on a small experimental LFL database and therefore prioritizes an explicit, interpretable, and potentially software-implementable correction equation rather than a highly flexible black-box model. This positioning is consistent with the objective of developing a preliminary screening-level tool for rapid LFL estimation under limited experimental data.
The signs of the fitted coefficients also support the physical consistency of the proposed correction. The positive coefficient of I indicates that stronger dilution increases the correction term, which is consistent with the observed underestimation of the baseline formula in highly diluted mixtures. The positive coefficient of RCO2 suggests that CO2-rich dilution requires a larger upward correction than N2-rich dilution, reflecting the stronger flame-suppressing effect of CO2. Compared with N2, CO2 can more effectively reduce the adiabatic flame temperature because of its higher heat capacity and may also influence the active radical pool near the flammability boundary. In contrast, the negative coefficient of O2 indicates that a higher oxidizer fraction reduces the upward correction required for the Le Chatelier estimate, which is consistent with the tendency of oxygen enrichment to facilitate flame propagation near the lower flammability boundary. The negative coefficient of FrI/100 suggests that the LFL-raising effect of dilution is partly offset when highly reactive fuels, especially H2 and C2H4, are present at higher fractions. This interaction term should be interpreted as an empirical composition-dependent correction within the current dataset rather than as a universal kinetic parameter.
Another limitation is related to data provenance. The main model was developed using 58 experimental LFL data points compiled in the first author’s doctoral dissertation [
36]. Although additional experimental flammability-limit data were identified from external literature and are listed in the
Supplementary Materials, these data were not used for model fitting in the present study because their mixture systems, experimental apparatus, ignition criteria, and reporting formats were not fully consistent with those of the primary database. Future studies should use these external data, after further harmonization, as an independent validation set or as part of an expanded database.
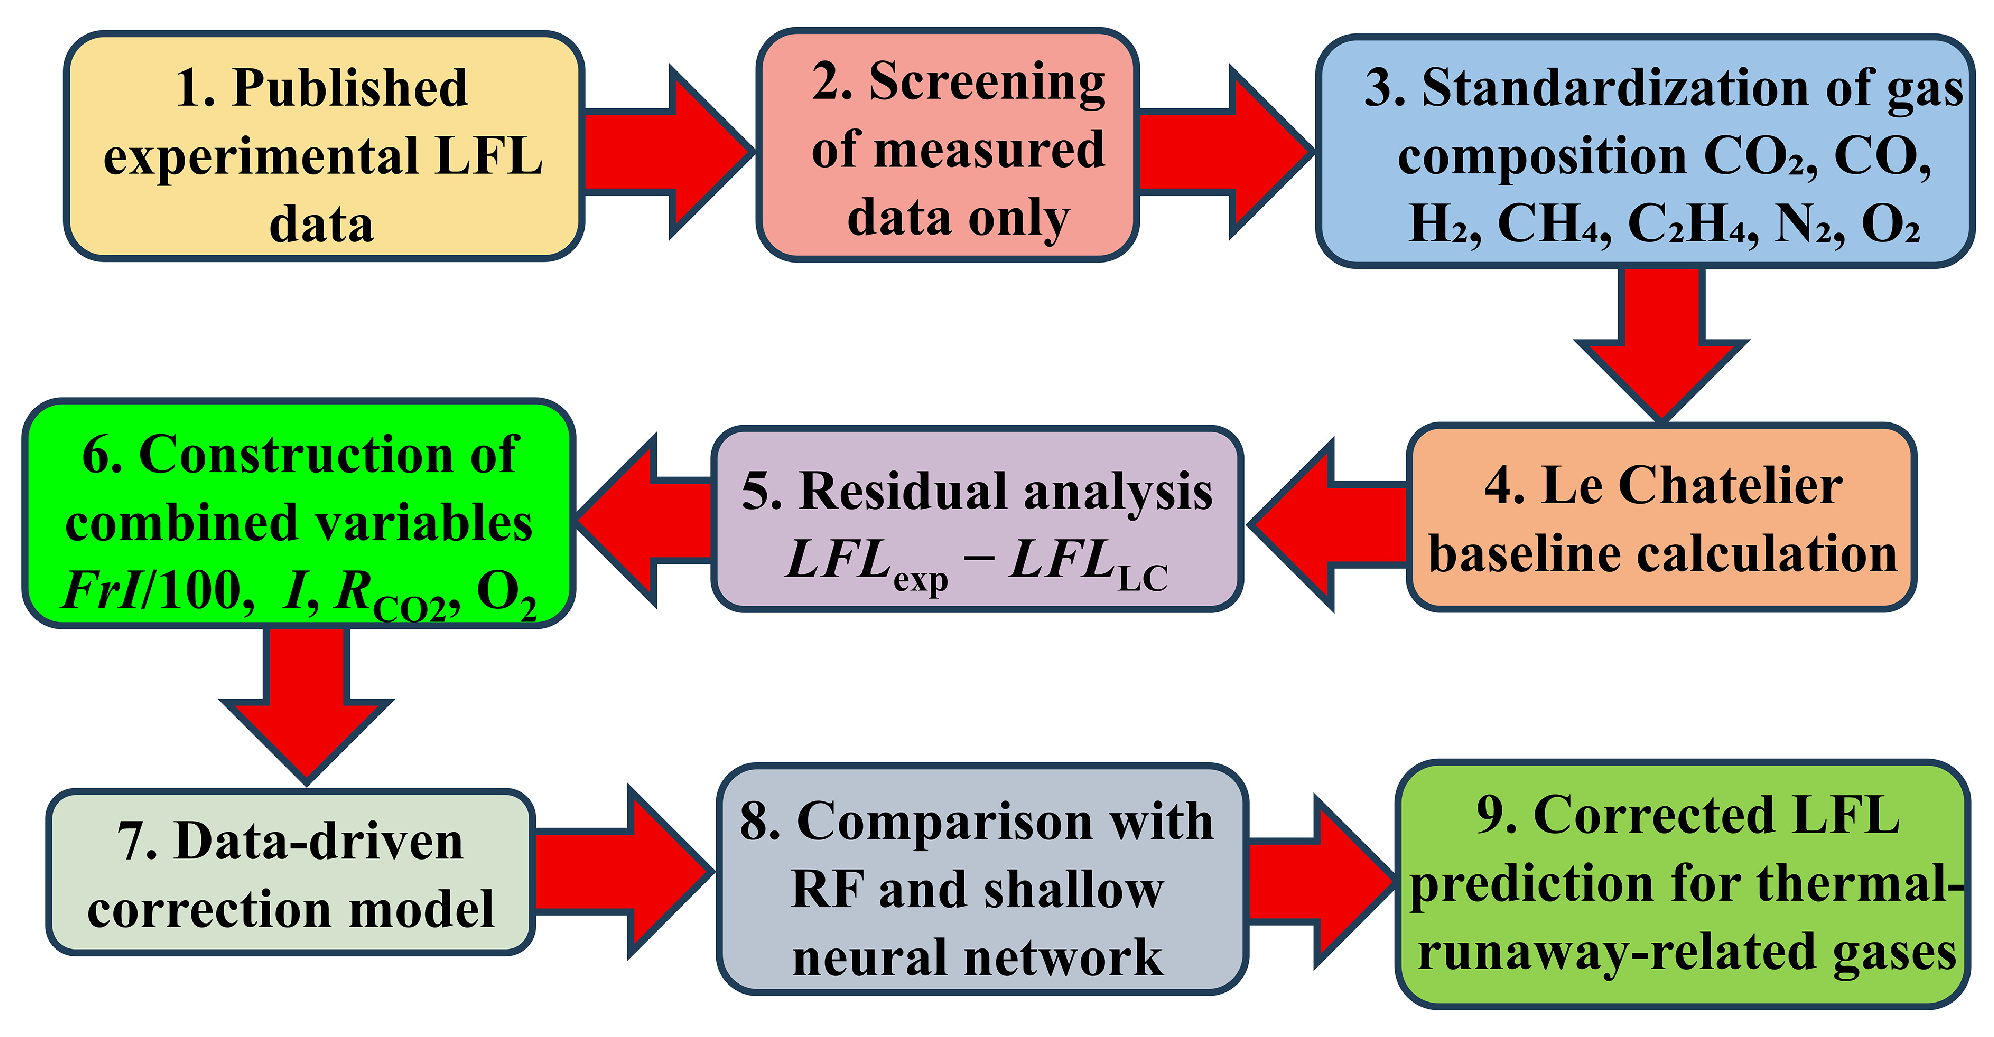
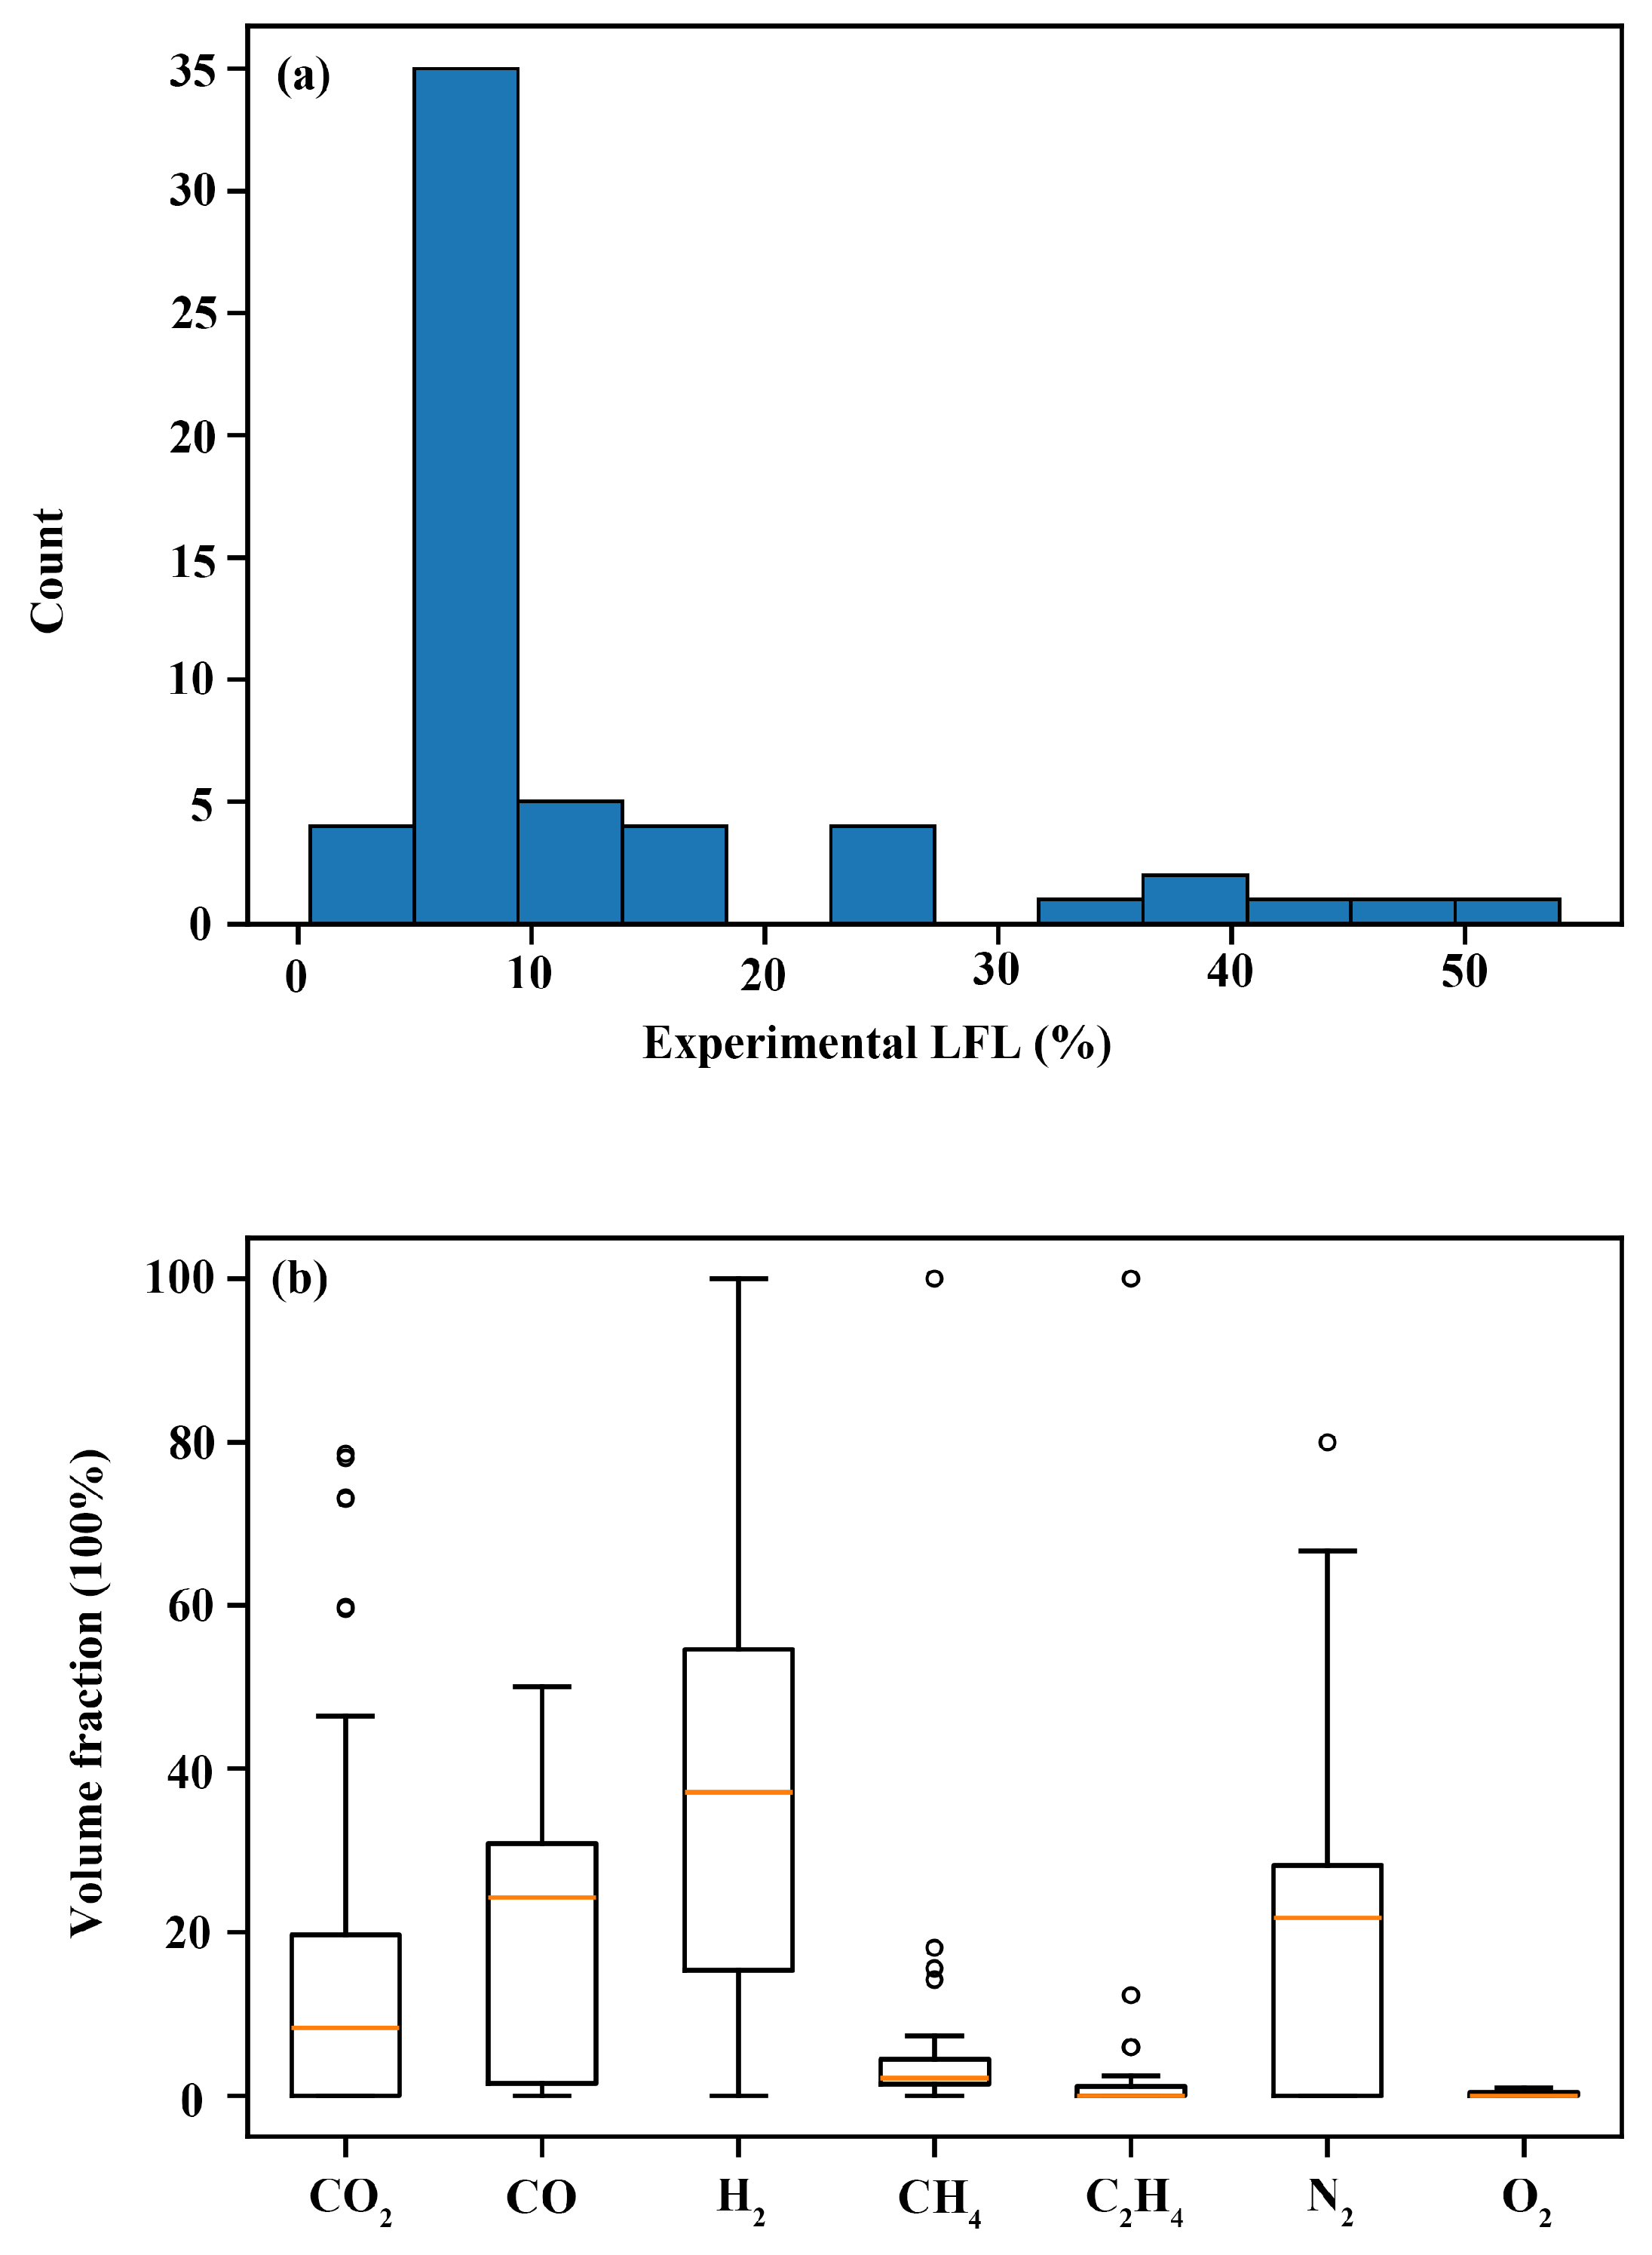
Taken together, the results in
Table 5,
Table 6 and
Table 7 and
Figure 4,
Figure 5 and
Figure 6 indicate that the conventional Le Chatelier calculation can serve as a useful first-order screening tool, but its direct use may introduce non-negligible underestimation when the gas mixture is strongly diluted, especially under CO
2-rich dilution. For lithium-ion battery thermal runaway scenarios, such underestimation may affect the predicted concentration threshold at which accumulated vent gases first enter the flammable range. The proposed correction equation retains the simplicity of the baseline method while explicitly accounting for dilution intensity, CO
2/N
2 dilution characteristics, oxygen fraction, and the interaction between highly reactive fuels and dilution. This makes the model suitable for preliminary engineering calculations related to ventilation design, inerting assessment, and early warning threshold estimation.
Several limitations should be noted. First, although the primary database was compiled from experimentally measured LFL data, the original references may have used different experimental apparatuses, ignition sources or energies, vessel geometries, flame-propagation criteria, temperatures, pressures, and gas-preparation procedures. Detailed experimental protocols were reported in the original references; however, not all parameters could be fully standardized across different sources. Such differences may introduce unavoidable experimental heterogeneity into the measured LFL values and may partly affect the fitted residual-correction relationship.
Second, the primary database contained only 58 experimental data points, which is relatively limited for regression fitting and machine-learning comparison. Although grouped five-fold validation was used to reduce the risk of overly optimistic evaluation, it cannot replace independent external validation using newly measured battery-vent-gas data. Under small-sample conditions, the fitted coefficients may also be affected by data distribution, composition imbalance, and experimental uncertainty, and such uncertainty may propagate into the corrected LFL values, especially for mixtures located near the boundary of the current composition space.
Third, the present model was developed for mixtures represented by H2, CO, CH4, C2H4, CO2, N2, and O2. Therefore, its applicability to mixtures containing substantial fractions of additional hydrocarbons, electrolyte vapors, fluorinated gases, or other volatile organic species remains limited. In addition, the correction model should not be regarded as a substitute for standard flammability testing, particularly under elevated temperature, elevated pressure, oxygen-deficient, or confined-space conditions outside the range of the current database.
Despite these limitations, the experimental-data-driven residual correction strategy provides a useful compromise between empirical accuracy and physical interpretability. Rather than replacing Le Chatelier’s rule, the model adapts it to dilution-dominated gas mixtures relevant to lithium-ion battery thermal runaway. Future work should expand the directly measured LFL database, standardize experimental-condition reporting, perform independent external validation, and quantify uncertainty propagation under controlled and application-relevant battery vent-gas conditions.