Abstract
Fuel cells have become a fundamental technology in the development of clean energy systems, playing a vital role in the global shift toward a low-carbon future. With the growing need for sustainable hydrogen production, perfluoro sulfonic acid (PFSA) ionomer membranes play a critical role in optimizing green hydrogen technologies and fuel cells. This study aims to investigate the effects of different environmental and solvent treatments on the chemical and physical properties of Nafion N−115 membranes to evaluate their suitability for both hydrogen production in proton exchange membrane (PEM) electrolyzers and hydrogen utilization in fuel cells, supporting integrated applications in the local and global green hydrogen economy. To achieve this, Nafion N−115 membranes were partially dissolved in various solvent mixtures, including ethanol/isopropanol (EI), isopropanol/water (IW), dimethylformamide/N-methyl-2-pyrrolidone (DN), and ethanol/methanol/isopropanol (EMI), evaluated under water immersion and thermal stress, and characterized for chemical stability, mechanical strength, water uptake, and proton conductivity using advanced electrochemical and spectroscopic techniques. The results demonstrated that the EMI-treated membrane showed the highest proton conductivity and maintained its structural integrity, making it the most promising for hydrogen electrolysis applications. Conversely, the DN-treated membrane exhibited reduced stability and lower conductivity due to solvent-induced degradation. This study highlights the potential of EMI as an optimal solvent mixture for enhancing PFSA membranes performance in green hydrogen production, contributing to the advancement of sustainable energy solutions.
1. Introduction
Fuel cells have emerged as a cornerstone in the advancement of clean energy technologies, particularly in the transition toward a low-carbon economy [1]. These electrochemical devices convert hydrogen into electricity with high efficiency and minimal environmental impact [2]. According to the International Energy Agency (IEA), global demand for green hydrogen is expected to increase sixfold by 2050, driven by the decarbonization of transport, industry, and energy sectors [3,4]. Electrolyzers, which split water into hydrogen and oxygen, are central to green hydrogen production [5]. Among the various electrolyzer technologies, proton exchange membrane (PEM) electrolyzers offer superior efficiency and faster start-up times [6]. The global push toward net-zero emissions highlights the critical role of hydrogen fuel cells and electrolyzers in future energy systems [7].
A key component of PEM electrolyzers and fuel cells is the membrane electrode assembly (MEA), which governs both ionic conduction and gas separation [8]. At the heart of this assembly lies the perfluoro sulfonic acid (PFSA)-based ionomer membrane, with Nafion being the most widely used due to its excellent proton conductivity and chemical stability [9]. The membrane ensures selective proton transport while preventing fuel crossover, making it indispensable for both fuel cells and hydrogen generation systems [10]. The performance of MEAs is intrinsically linked to the structural and chemical integrity of the ionomer membranes [11]. Under operational stress, including hydration and temperature fluctuations, even Nafion-based membranes may degrade or lose efficiency [12]. Thus, understanding and enhancing membrane durability remains a central focus in electrochemical energy research [13].
Exploring the partial dissolution of Nafion membranes in mixed solvent environments can be used to modify their internal structure and improve performance [14]. This technique disrupts and reorders the ionic clusters within the PFSA matrix, potentially enhancing water uptake and proton transport pathways [15]. Solvent-assisted reorganization has been shown to influence membrane porosity, hydrophilicity, and proton conductivity, which are critical factors for MEA durability and efficiency [16]. Partial dissolution also aids in homogenizing ionomer dispersion during MEA fabrication, which can improve catalyst layer integration [17]. When properly controlled, this method may lead to membranes with both higher mechanical resilience and better electrochemical performance. Thus, investigating solvent-induced modifications has become a promising route for optimizing PEM systems [18].
Gao et al. (2021) reported significant improvements in proton conductivity and durability when Nafion was treated with alcohol-based solvents prior to membrane casting [19]. Similarly, Li et al. (2024) demonstrated that mixed solvents enhanced polymer chain alignment, resulting in better mechanical integrity and ionic conductivity [20]. These findings are directly aligned with this study, where treatment with an EMI mixed solvent improved the electrochemical impedance and Raman spectral stability of Nafion 115 membranes. By comparing the performance of Nafion in different solvent systems, this study validates and extends previous findings with novel combinations and characterization techniques [21]. These precedents affirm the value of solvent-mediated ionomer restructuring for PEM applications [22].
Using single solvents such as pure N,N-dimethylformamide (DMF) or isopropanol has shown limited success in achieving optimal membrane performance [8,23]. Aprotic solvents like DMF often fail to support sufficient proton mobility due to their inability to facilitate hydrogen bonding [24]. On the other hand, single alcohols may cause excessive swelling or incomplete dissolution, resulting in poor film morphology and weakened mechanical strength [14]. Inconsistent solvent–membrane interactions also hinder reproducibility in MEA fabrication, leading to performance variability [25]. This inconsistency underscores the limitations of relying on individual solvents when attempting to enhance PFSA membrane functionality. Therefore, combining solvents to tailor the membrane environment offers a more viable and controlled modification strategy [26].
This study presents a comprehensive evaluation of Nafion® N−115 as a membrane material for both hydrogen production and hydrogen utilization technologies within the context of the local and global green hydrogen economy. The work introduces a comparative investigation into the behavior of Nafion ionomer membranes exposed to four different mixed solvent systems, focusing on key performance parameters such as proton conductivity, water uptake, chemical stability, and mechanical strength. For electrolyzer-relevant conditions, the membrane was examined under water immersion and thermal treatment to assess hydration capacity and mechanical robustness using gravimetric water uptake, Raman spectroscopy, atomic force microscopy (AFM), Fourier transform infrared (FTIR) spectroscopy, and thermogravimetric analysis (TGA). For fuel cell application, the same membrane was dissolved and reconstituted in mixed polar solvents, followed by proton conductivity and electrochemical stability assessment using electrochemical impedance spectroscopy (EIS) and cyclic voltammetry (CV). These complementary characterizations reveal how solvent composition and treatment conditions influence membrane structure and functionality. Among the tested systems, the ethanol–methanol–IPA (EMI) mixture demonstrated superior outcomes, supporting its potential for next-generation electrolyzers and fuel cells. This study contributes valuable insights into the structure performance relationship of PFSA membranes and offers practical guidance for optimizing MEAs in sustainable hydrogen energy systems.
2. Materials and Methodology
Ethanol (EtOH), methanol (MeOH), isopropanol (IPA), dimethylformamide (DMF), and N-methyl pyrrolidone (NMP) were used. The membrane sample used was an ionomer membrane, namely Nafion N−115. These solvents were selected to represent commonly used alcohol-based and aprotic solvent systems relevant to fuel cell applications, particularly in ionomer dispersion, and membrane reconditioning.
A consistent membrane-to-solvent ratio was used across all samples to ensure comparability, based on typical concentrations reported in Nafion–solvent interaction and ionomer dispersion studies. The treatment temperature of 60 °C was selected as a moderate and widely used condition that promotes polymer–solvent interaction while avoiding thermal degradation of the membrane structure.
2.1. Procedure
To a 100 mL, two-neck, round-bottom flask with a stir bar, 50 mL of each selected solvent mixture was added. The flask was placed on a magnetic stirring hot plate and stirred at 300 rpm. Then, 0.5 g ionomer was slowly added to the solvent mixture over 10 s to prevent clumping and improve its dissolution characteristics. The resulting polymer suspension was stirred at 300 rpm with heating at 60 °C for 48 h, yielding a partially dissolved or uniformly dissolve polymer solution. After cooling to room temperature, the solution was filtered through a 55 mm diameter 11 µm pore size Grade 1 Whatman TM (CAT no. 1001-055, Cytiva, Marlborough, MA, USA) filter paper before further use. The extent of dissolution was evaluated visually; solutions were considered fully dissolved when Nafion film fragments were no longer visible, the mixture appeared homogeneous, and a slurry-like consistency formed upon cooling and filtration. Partial dissolution was indicated by the presence of visible membrane pieces in the solution.
2.2. The Solvent System
Various solvent systems were prepared. For instant, 85% ethanol/7.5% methanol/7.5% isopropanol was prepared by mixing 42.5 mL EtOH, 3.75 mL MeOH, and 3.75 mL IPA, and the total volume was 50 mL. The same procedure was used to prepare other mixed solvents, which were 50% ethanol/50% isopropanol, 50% ethanol/50% water, and 55% DMF/45% NMP. The mixed solvents ethanol/methanol/isopropanol, ethanol/isopropanol, isopropanol/water, and DMF/NMP were labelled as EMI, EI, IW, and DN, respectively.
2.3. Characterization
A Lasec pH meter (pH 50 VioLab) was employed to measure the pH, temperature, and electric potential (in millivolts) of the mixed solvents before and after partial dissolution, to provide a clear indication of how the Nafion N−115 membrane interacts with each mixed solvent. Electric potential measurements were conducted using a Lasec pH 50 VioLab meter (Lasec, Cape Town, South Africa) operated in millivolt mode. The meter features an internal reference electrode that records the solution potential relative to a stable baseline, allowing detection of electrochemical changes in the solvent environment. Measurements were taken before and after the partial dissolution of Nafion N−115 in each mixed solvent system. The observed changes in millivolt values are attributed to the release of protons (H+) from the sulfonic acid groups of Nafion into the solvent, thereby altering its electrochemical potential. This approach served as a qualitative indicator of proton dissociation and membrane–solvent interaction and was not used for calculating proton conductivity. Proton conductivity was independently determined through electrochemical impedance spectroscopy (EIS), using the resistance values obtained from Nyquist plots. The frequency range was considered to be 0.1 Hz to 1000 KHz, with a signal amplitude of 0.1 V.
The Raman spectra of the samples were obtained using an Alpha300RS Confocal Raman AFM Imaging System (WITec GmbH, Ulm, Germany), which analyzed the vibration modes of the Nafion N−115 membrane, offering insight into its molecular structure and confirming the presence of functional groups. Thermogravimetric analysis (Perkin Elmer 4000 Thermogravimetric Analyzer, Waltham, MA, USA) was utilized to examine the thermal stability and decomposition behavior of the Nafion N−115 membrane and demonstrated degradation patterns corresponding to water loss. Atomic force microscopy (JPK Nano Wizard II AFM, JPK Instruments, Berlin, Germany) provided detailed surface topography and roughness measurements, revealing the morphological features of the Nafion N−115 membrane at a nanoscale. Fourier transform infrared spectrum of the Nafion N−115 membrane was performed using an FTIR-Perkin Elmer Spectrum1 (Waltham, MA, USA) to identify functional groups and confirm successful incorporation of specific chemical species into the matrix. Electrochemical impedance spectroscopy (EIS) was performed using a Gamry 10101E/ZRA Reference 3000 (Gamry Instruments, Warminster, PA, USA) electrochemical workstation with a three-electrode setup consisting of a working electrode, a reference electrode, and a Pt counter electrode to study the interfacial charge transport of the Nafion N−115 membrane in different mixed solvents through EIS-Bode plot, EIS-Nyquist plot, linear scanning voltammetry (LSV), and cyclic voltammetry (CV) analyses.
Changes in the electrochemical environment of the Nafion N−115 membrane after partial dissolution were evaluated using cyclic voltammetry (CV) and electrochemical impedance spectroscopy (EIS). CV allowed assessment of redox peak behavior and stability over multiple cycles, indicating possible degradation or rearrangement of the membrane. EIS measurements, particularly Nyquist and Bode plots, provided insights into resistance changes and capacitive behavior, reflecting shifts in proton transport efficiency due to solvent-induced structural modifications.
3. Results and Discussion
3.1. Impact of Mixed Solvents via Partial Dissolution of the Nafion N−115 Membrane
The pH measurements before and after partial dissolution provide a clear indication of how Nafion interacts with each mixed solvent [27]. All solvent mixtures except DN show a dramatic decrease in pH, from near-neutral (around 6.2–6.6) to strongly acidic levels (around 2.5–2.8). This substantial drop in pH suggests the release of protons (H+) from the sulfonic acid groups of Nafion into the solvent. Nafion contains sulfonic acid (SO3H) groups, which, when dissolved or exposed to certain environments, can dissociate to release protons, acidifying the surrounding medium [28]. The initial pH of DN is 9.62, indicating a basic nature before dissolution. After partial dissolution, the pH drops significantly to 6.74, though it remains on the basic side. DMF and NMP are polar aprotic solvents, which do not support proton dissociation as effectively as aqueous or alcohol-based solvents [29]. This explains why the pH remains relatively higher compared to the other mixed solvents. The dramatic decrease in pH observed after dissolving Nafion in most solvents aligns with findings from Madhuranthakam et al. (2024), who reported a similar pH drop when Nafion interacted with aqueous and alcohol-based solvents, due to the release of protons from the sulfonic acid groups [23].
The temperature differences between the solvents before and after partial dissolution are minimal, indicating that the dissolution of Nafion at 60 °C does not result in a significant exothermic or endothermic reaction at the solvent’s final temperature point. Slight increases in temperature after partial dissolution are observed across all solvent mixtures, but the change is not large (typically about 1–2 °C). These minor temperature changes suggest that the dissolution of Nafion in these solvents is not heavily thermally influenced, meaning that it does not cause significant energy absorption or release during the 48 h process. Studies by Li et al. (2023) and Liu et al. (2023) also reported minor temperature changes (around 1–2 °C) during Nafion dissolution in various solvent mixtures, consistent with the findings from this study [30,31].
The observed variations in electric potential (measured in millivolts) upon the dissolution of Nafion N−115 in different solvent systems reflect the extent of proton release from the membrane’s sulfonic acid groups into the surrounding medium. In protic, alcohol-based solvents such as EI, IW, and especially EMI, strong hydrogen-bonding interactions facilitate sulfonic acid dissociation, leading to an increased free proton concentration and a higher electric potential after membrane dissolution. This trend is consistent with findings from Kumar et al. (2018), who reported enhanced proton activity in Nafion when treated with alcohol-containing solvents, due to increased hydrogen bonding and ionic exchange potential [32]. In contrast, the DN solvent system, being aprotic and less supportive of proton transfer, showed minimal change in potential, indicating weaker Nafion–solvent interaction and lower proton mobility. Based on the mV results, EMI-treated samples exhibited the highest post-dissolution potential, suggesting superior proton exchange capacity and making EMI the most favorable solvent system for fuel cell applications within the hydrogen economy. Conversely, DN-treated samples showed the weakest response, indicating limited suitability for proton exchange environments. Table 1 summarizes the important properties of the Nafion N−115 membrane before and after partial dissolution.

Table 1.
pH, temperature, and electric potential of the mixed solvents before and after partial dissolution of Nafion N−115.
Figure 1 indicates the FTIR spectrum of solvents before and after interactions with Nafion. It was observed that peaks become more defined and broader after partial dissolution, reflecting important changes in the molecular environment and interactions between the solvent and Nafion. Before dissolution, peaks for pure solvents tend to be narrower and more specific, as they correspond to well-defined vibrational modes of relatively simple molecules (e.g., ethanol, water, IPA, or DMF). These molecules, in their pure form, interact primarily with other solvent molecules, leading to sharp, well-defined peaks. After partial dissolution, the peaks become broader and more defined after the dissolution of Nafion. This broadening is typically associated with the formation of hydrogen bonds, ionic interactions, and the disorder introduced by the polymer molecules into the solvent.
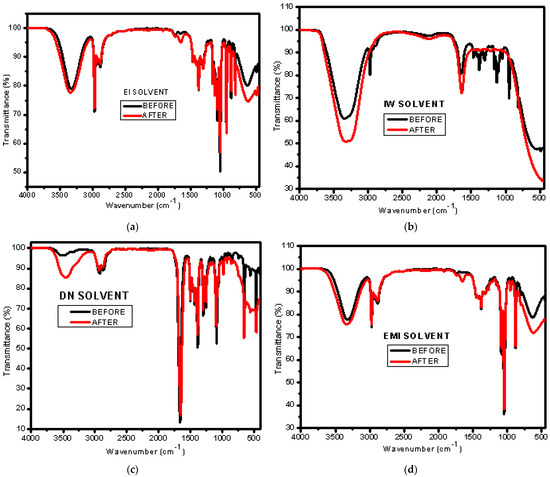
Figure 1.
FTIR of different mixed solvents before and after partial dissolution of Nafion N−115: (a) EI, (b) IW, (c) DN, and (d) EMI.
The lower pH values and higher conductivity observed in the solvent mixtures after partial dissolution of the Nafion membrane, particularly in the EMI system, correspond to the broader FTIR peaks seen in the O–H and S=O stretching regions, as shown in Figure 1. This suggests stronger hydrogen bonding and greater sulfonic acid dissociation due to interactions between the membrane and the polar protic solvents, which in turn support increased ionic interactions and proton conductivity [19,33].
The broadening and sharpening of peaks after Nafion dissolution seen in this study are consistent with recent studies on solvent–polymer interactions. Barik et al. (2021) [34] also reported peak broadening after Nafion was dissolved in alcohol-based and water-based solvents, attributing it to enhanced hydrogen bonding and ionic interactions between the sulfonic acid groups of Nafion and the solvent molecules. These interactions disrupt the solvent’s molecular arrangement, leading to more complex vibrational modes and broadened peaks. Wei et al. (2023) [35] observed that peaks corresponding to polar aprotic solvents like DMF and NMP also broadened after Nafion dissolution, though to a lesser extent compared to alcohol-based solvents. They suggested that this moderate broadening is due to the weaker proton-donor capabilities of DN, which results in fewer hydrogen bonds with Nafion’s sulfonic groups. This agrees with the findings from this study, which showed that, while broadening occurs in all solvents, alcohol-based mixtures experience more significant changes than polar aprotic solvents like DN. These findings underscore the role of solvent polarity and hydrogen bonding in driving the interactions between Nafion and various solvents.
Figure 2 reveals notable solvent-specific effects on the membrane. The EMI-treated membrane displays broad, intense bands in the 3200–3600 cm−1 and 1000–1200 cm−1 regions, indicative of extensive hydrogen bonding and greater sulfonic group dissociation. In contrast, the DN-treated sample shows comparatively sharper peaks with less intensity, reflecting weaker interaction with Nafion’s ionic domains. These differences are attributed to the higher polarity and proton-donating ability of alcohol-based mixtures (like EMI), which facilitate better proton solvation and network disruption compared to aprotic solvents like DMF/NMP in DN [36].
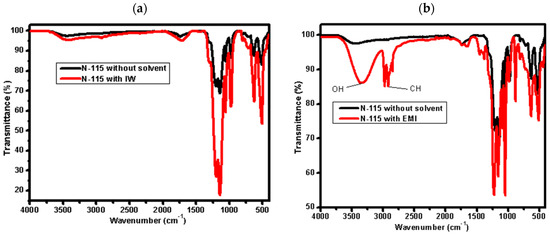
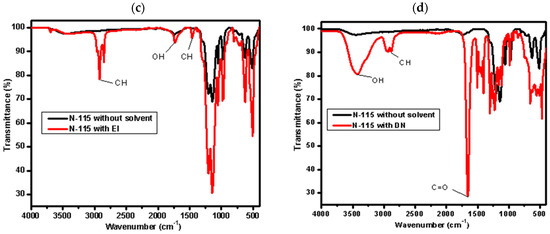
Figure 2.
FTIR of Nafion N−115 before and after partial dissolution in different mixed solvents: (a) IW, (b) EMI, (c) EI, and (d) DN.
The broadening of FTIR peaks observed after solvent treatment (Figure 2) is attributed to increased hydrogen bonding and molecular disorder introduced by the interaction between Nafion’s sulfonic acid groups and the solvent molecules. In particular, alcohol-based mixtures such as EMI and IW promote stronger hydrogen bonding and swelling, resulting in broader absorption bands, especially in the O–H and S=O stretching regions. In contrast, DN (a polar aprotic solvent system) shows more defined peaks, reflecting limited proton interaction and less disruption of the membrane structure. These spectral changes support the solvent-dependent reorganization of the Nafion matrix.
3.2. Evaluation of Mechanical Strength
The Raman peak intensities in Figure 3 reflect the polarizability and molecular interactions within the membrane, providing insight into its structural integrity and mechanical properties.
Figure 3.
Raman spectroscopy for N−115 immersed in water, N−115 at 60 degrees, and unmodified N−115.
The unmodified N−115 membrane shows higher Raman peak intensities for sulfonic acid, C–F, C–S, and CF2 vibrations, indicating a well-ordered, intact structure associated with strong mechanical properties. This high intensity is attributed to the crystalline-like ordering of polymer chains, indicating a tightly packed, mechanically stable structure that supports proton conduction [37]. These observations align with findings from other studies, which reported that sharp Raman peaks reflect crystalline-like structures with enhanced mechanical properties [38]. The structure is both conductive to protons and mechanically stable, and the pattern is consistent with the findings from this study [39].
After heating at 60 °C for 2 h, peak intensity decreases from 6000 to 5000, suggesting partial structural disruption due to thermal stress, though vibrational modes remain intact. The reduced peak intensity can be attributed to partial disruption of the polymer network, potentially due to thermal expansion or softening of the polymer chains. This aligns with Li et al. (2021) [40], who reported reduced Raman intensity after heat treatment due to microstructural relaxation and partial loss of rigidity, without degrading functional groups. This indicates that, while thermal exposure softens the membrane, it maintains a stable polymer network.
The membrane immersed in water shows the lowest Raman intensity, consistent with swelling and reduced cohesive forces, which likely weakens mechanical strength. This makes the membrane more prone to mechanical deformation, especially under load. However, the physical swelling likely affects the material’s elasticity and tensile strength, making it mechanically weaker than the dry or heat-treated samples. The lowest peak intensity observed after water immersion is consistent with studies by Zhang et al. (2024) [41] and Wu et al. (2023) [42], who reported similar decreases in Raman intensity due to membrane swelling in water. This swelling, particularly around the sulfonic acid groups, disrupts the polymer’s cohesive forces and reduces mechanical strength. As in this study, the mechanical weakening due to swelling leads to increased polymer chain mobility and decreased structural rigidity
The Raman spectra retain their characteristic peak positions across all treatments, indicating chemical integrity. This suggests that any changes that have taken place within the samples have not affected the ionic functionality of the membrane by altering the position of this peak from its wavenumber values for this compound. This implies that the chemical bonds within the ionomer network are thermally and chemically stable, so this accounts for the fact that the membrane has some degree of mechanical strength, even when it is stressed. As reported in previous studies, Nafion retains its sulfonic acid and backbone structure even after thermal or water exposure, preserving its characteristic Raman peak positions [43,44]. This supports the membrane’s preserved structural integrity and mechanical stability, as observed in this study.
3.3. AFM Investigation of the N−115 Membrane Under Hydration and Thermal Processing
In Figure 4b, AFM analysis reveals that water-treated N−115 membranes exhibit an increase in thickness from 0.4 µm to 2 µm, indicating significant water absorption. The smoother surface and reduced peak intensity suggest polymer chain expansion due to hydration. This observation is consistent with findings from Wang et al. (2023), who highlighted that higher water uptake increases swelling, reducing structural integrity in proton exchange membranes [45].
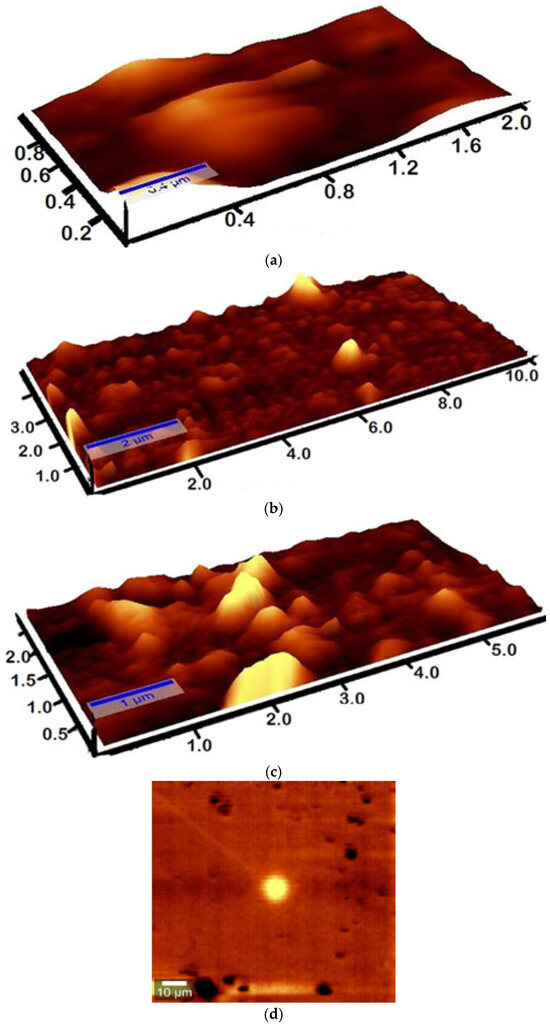
Figure 4.
3D AFM images of the N−115 membrane: (a) untreated, (b) water-treated, and (c) annealed at 60 °C. (d) 2D AFM image of the N−115 membrane.
In the untreated membrane (a), the rough, uneven morphology indicates the presence of polymer chain flexibility. However, the sample annealed at 60 °C (c) shows a more structured, crystalline surface with increased sharpness and rigidity. This implies that annealing improves mechanical strength by enhancing crystallinity and reducing molecular mobility, an observation supported by Zhao et al. (2022), who demonstrated that polymer reinforcement strategies enhance mechanical properties through controlled cross-linking [46]. Additionally, Stenina and Yaroslavtsev (2024) linked crystallinity improvements to better ion-exchange selectivity, which could enhance the membrane’s long-term stability [47].
Since water absorption expands the polymer, it increases the number of proton-conducting pathways. However, excessive swelling, as seen in sample (b), can reduce proton mobility due to disrupted ionic domains. Yan et al. (2022) emphasized that a balance between hydration and structural integrity is key to maintaining high proton conductivity [48]. The annealed membrane (c), with its enhanced crystallinity, likely experiences reduced swelling, leading to optimized proton transport channels. This is in agreement with the findings from Zakertbrizi et al. (2021), who showed that structural modifications enhancing proton transport efficiency can lead to higher membrane performance [49].
The rough morphology of the untreated membrane (a) suggests inherent flexibility but potential vulnerability to chemical degradation with prolonged use. In contrast, annealed samples (c) exhibit improved molecular ordering, which is often linked to better oxidative and chemical stability. This aligns with Okonkwo et al. (2022), who detailed how membrane structural modifications affect degradation resistance in proton exchange membrane fuel cells [50].
While this study did not establish a direct quantitative correlation between AFM-observed surface features and the membrane’s mechanical strength or proton conductivity, the morphological changes described in Figure 4 qualitatively support the trends observed in the Raman spectra shown in Figure 3. For example, the increased thickness and smoother surface of the water-treated membrane in Figure 4b correspond to reduced Raman peak intensity in Figure 3, indicating structural relaxation and possible mechanical weakening. Similarly, the more ordered and rigid surface of the heat-treated membrane shown in Figure 4c aligns with higher Raman peak intensity, reflecting enhanced structural integrity. These findings support the complementary nature of AFM and spectroscopic analyses in evaluating membrane structural behavior.
3.4. Assessment of Water Uptake
Using gravimetric measurements, water uptake was determined by the difference in weight between wet and dry membranes. Water uptake is important, because water is usually the medium of proton transfer and the proton carrier [51]. Usually, Nafion membranes rely on water molecules for proton conduction throughout the membrane.
The water uptake of the N−115 membrane was calculated to be 24%. Using the following Equation (1),
a water uptake of 24% in a Nafion membrane positions it in the optimal range for achieving high proton conductivity while maintaining structural integrity. At this level, the membrane is sufficiently hydrated to ensure proper proton conduction through the percolation of water channels [49]. This observation of 24% water uptake being optimal is well-aligned with several other studies of Nafion N−115 membranes. It fits within the range that balances proton conductivity with mechanical durability. Most studies suggest that maintaining water uptake within the 20–30% range is optimal for sustaining high proton conductivity while preventing structural degradation, aligning with the values observed in this study [52,53,54]. The sulfonic acid groups in Nafion N−115 are well-hydrated, which facilitates proton hopping and vehicular transport, both of which are critical for proton mobility [52,55]. At this level, the membrane avoids the issues associated with both insufficient hydration (where conductivity drops due to limited ion mobility) and excessive water uptake (which led to excessive swelling and mechanical failure) [55].
Using FTIR, as shown in Figure 5, the water uptake of the Nafion N−115 was characterized by relating molecular vibrations within the membrane to the presence of water and its interaction with the functional groups. Water in the Nafion membrane is identified by key water-related bands, which are O-H stretching vibrations occurring around 3200–3600 cm−2 and H-O-H bending vibrations occurring around 1600–1700 cm−1. The O-H stretching vibration is indicative of hydrogen-bonded water molecules, and the H-O-H bending vibration is associated with the bending modes of water molecules [56]. The increase in the intensity of these bands indicates great water uptake.

Figure 5.
FTIR of both soaked (wet) and dry Nafion N−115.
Recent studies from 2020–2024 on water uptake by Nafion membranes using FTIR consistently align with these findings. Singh et al. (2020) and Wu et al. (2024) reported O-H stretching vibrations in the 3200–3600 cm−1 range, indicative of hydrogen-bonded water molecules, and H-O-H bending vibrations between 1600–1700 cm−1, representing water molecule bending modes [57,58]. Both studies highlighted that the increased intensity of these bands corresponds to higher water uptake, reinforcing proton conductivity while maintaining membrane structure. Yan et al. (2022) further emphasized that the enhanced intensity in these regions confirms greater water interaction with sulfonic acid groups, a critical factor for efficient proton transport, consistent with the results reported in this study [49].
TGA is a powerful technique that can be used to quantify water uptake in materials, including Nafion membranes [59]. By measuring the weight loss of a sample as it is heated, TGA in Figure 6a provides direct information on the amount of absorbed water and its interaction with the membrane. As the temperature increases, the absorbed water will evaporate, leading to mass loss in the TGA curve. This mass loss is associated with the removal of water from the membrane. The first weight loss region, labeled A in the TGA curve, is typically due to physically absorbed water between 30 °C and 151.17 °C. This includes free and weakly bound water that evaporates easily. The second weight loss region, labeled B, is higher temperature weight loss between 151.17 °C and 339.37 °C. This is due to chemically bound water or water interacting more strongly with functional groups like the sulfonic acid (-SO3H) group in Nafion membranes [60].
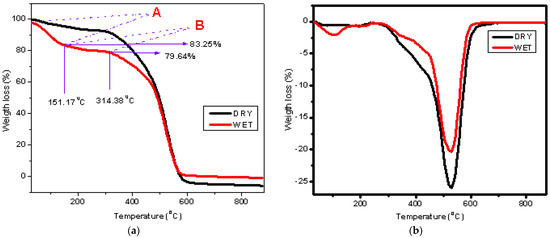
Figure 6.
Thermogravimetric analysis of both dry and water-immersed Nafion N−115 membranes: (a) weight loss curves showing initial water evarporation and subsequence membrane degradation, A (30−151 °C) correspond to the evaporation of free and weakly bound water, and B (151−339 °C) attribute to the loss of strongly bound water interaction with sulfonic acid groups and initial membrane degradation; (b) derivative weight loss curves highlighting the main decomposition of the membrane.
From the TGA curve in Figure 6a, water uptake was calculated using the followingformula:
Initial hydrated mass is the percentage weight of the membrane at the start of the TGA run. Final dry mass is the weight of the membrane after all water has evaporated. The initial hydrated mass is 100% at 30 °C, and the final dry mass is 79.64% at 314.28 °C. The calculated water uptake is 25.56%, using Equation (2).
Recent studies report comparable water uptake values for Nafion membranes using TGA, supporting this result of 25.56%. Pathak et al. (2021) [61] found water uptake in Nafion N−115 to be around 24–26%, consistent with the physically absorbed and chemically bound water loss regions seen in TGA analysis [62]. Similarly, Zhao et al. (2022) observed water uptake in the range of 23–28%, with mass loss in the 30–150 °C region corresponding to physically absorbed water and 150–350 °C linked to more strongly bound water [63]. These values closely align with the results calculated in this study, reinforcing that the typical water uptake for Nafion membranes remains within this range when analyzed via TGA.
3.5. Investigation of Chemical Stability
Chemical stability refers to a material’s ability to maintain its structural and functional integrity when exposed to various environmental conditions, including oxidative and reductive environments. Nafion N−115 is particularly sensitive to chemical degradation, especially under the high temperatures and aggressive chemical conditions often found in fuel cell operation.
Based on Figure 7, it is notable that, in CV (a) and CV (d) the membrane has retained electrochemical stability because there is no sign of peak shift between the cycles. This indicates that there is no degradation of the membrane. In CV (c), the membrane is electrochemically stable, but less so compared to CV (a) and CV (d) due to the notable peak shift between cycle 1 and the rest of the cycles. This indicates that degradation occurred at the first cycle, and then the membrane became stable on the following cycle, since they show no clear peak shift between them. For CV (b), notably, the first cycle displayed sharp and well-defined peaks, while the subsequent cycles revealed shifts in the peak potential. The shift between the peaks of this cycles is evidence of changes in the electrochemical environment of the membrane, possibly due to the onset of degradation mechanisms such as sulfonic group loss or polymer chain scission. Therefore, the membrane has low electrochemical stability.
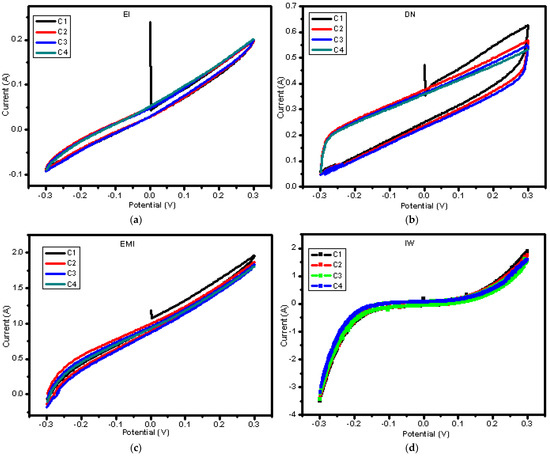
Figure 7.
Multi-cycle cyclic voltammetry test for N−115 after partial dissolution in different mixed solvents: (a) N−115 in EI, (b) N−115 in DN, (c) N−115 in EMI, and (d) N−115 in IW.
Qian et al. (2021) [64] reported similar results, where Nafion membranes displayed high electrochemical stability, with no significant peak shifts across multiple CV cycles, indicating minimal degradation and strong retention of electrochemical properties. In their study, this behavior was linked to the robust structural integrity of Nafion, particularly the stability of its sulfonic acid groups under electrochemical conditions. This matches this study’s observations for CV (a) and (d), where no peak shifts suggest high membrane durability and minimal degradation over the cycles.
On the other hand, Lu et al. (2020) [65] reported peak shifts in the first CV cycle of some Nafion-based membranes, similar to the CV (b) and CV (c) results from this study. This peak shift was attributed to initial degradation mechanisms, such as the loss of sulfonic acid groups or changes in the polymer backbone. Over time, however, these membranes became more stable in subsequent cycles, as the electrochemical environment settled.
3.6. Characterization of Proton Conductivity
Proton conductivity is therefore an inverse function of the total impedance, or of the real component of the impedance, Z’. Lower Zreal indicates enhanced proton conduction, because the membrane provides less hindrance to the conduction of protons. In the Nyquist plot of this system, the portion of the plot represented by Zimag highlights the capacitive behavior that defines this membrane’s capacity to store and transport charges through its ionic channels. Proton conductivity is a direct quantitative expression of proton transport efficiency within the membrane. Higher conductivity values reflect easier and more effective movement of protons across the hydrated ionic domains formed after solvent treatment.
Looking at Figure 8, It can be concluded that proton conductivity is lower in the case of Nafion N−115 under EI and IW conditions than the other three conditions used in the test. This may be because protons in the presence of IPA have reduced mobility and do not create the continuous water-mediated proton conduction pathways characteristic of Nafion membranes. This is likely to be contributing to lower contact angle values, leading to reduced water swelling of the Nafion membrane, and hence fewer effective proton pathways. Lower uptake decreases proton diffusion, thus increasing the real impedance (Zreal) and imaginary impedance (Zimag). The finding that Nafion N−115 exhibits the lowest proton conductivity in the EI and IW systems align with the results from Nandi et al. (2021) [66]. They reported that the presence of IPA hinders hydration and disrupts continuous water-mediated proton conduction pathways, leading to increased resistance and decreased proton mobility.
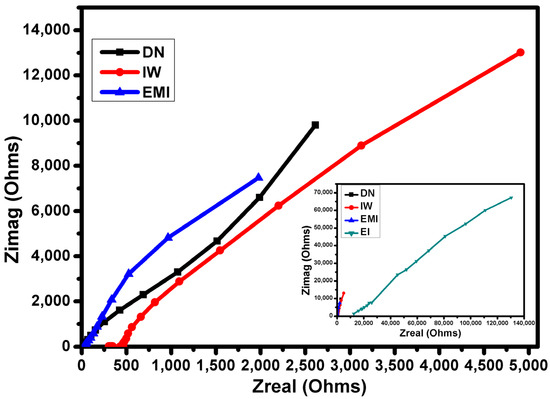
Figure 8.
Electrochemical impedance spectroscopy Nyquist plot for N−115 after partial dissolution in mixed solvents.
The membrane immersed in the DN solvent shows intermediate impedance values that are half that of the IW solvent system; thus, this membrane demonstrates higher proton conductivity than the one in IW. A lower Zreal means the membrane experiences less resistance to proton transport. The membrane in the EMI solvent exhibits the lowest impedance; this configuration has the highest proton conductivity among the three, as indicated by the lowest value of Zreal. The lower impedance suggests that proton transport occurs with much less resistance, meaning the membrane’s ionic channels are likely well-formed and fully functional in this solvent mixture.
The observation that Nafion in DN has intermediate impedance values is consistent with Zhang et al. (2022), who found that Nafion membranes in DMF exhibited better conductivity than those in alcohol–water mixtures [67]. They attributed this to the more favorable solvation environment provided by DMF, which facilitates proton transport through less resistance, like the findings from this study of lower Zreal in this solvent system. The results indicating that the EMI solvent mixture yields the highest proton conductivity are supported by Shi et al. (2021) [68], who observed that similar solvent blends enhance the formation of ionic channels in Nafion membranes. Their study demonstrated that such mixtures reduce impedance, leading to efficient proton transport, aligning with this study’s conclusion about the well-formed and functional ionic channels in the Nafion membrane under these conditions [69,70].
The proton conductivity of Nafion N−115 membranes can be also effectively analyzed by EIS Bode plot. In the given observations, we are analyzing phase angle behavior over different frequency ranges for Nafion N−115 membranes immersed in various mixed solvents (IW, EMI, DN) for 48 h at 60 °C. The phase angle provides insight into the capacitive versus resistive behavior of the membrane, which in turn gives us clues about the efficiency and durability of proton conductivity [71].
The proton conductivity of the treated Nafion N−115 membranes was calculated using the resistance values (in ohms) obtained from Nyquist plots and applying the standard equation
where σ is the proton conductivity (S·cm−1), t is the membrane thickness (cm), R is the resistance (Ω), and A is the electrode area (cm2). The calculated conductivity values are summarized in Table 2. Among the tested membranes, the EMI-treated sample exhibited the highest conductivity (6.42 × 10⁻⁶ S·cm−1), indicating enhanced proton mobility and strong interaction between the membrane and the solvent system. DN-treated samples also showed moderate conductivity (4.86 × 10⁻⁶ S·cm−1), despite the aprotic nature of the solvent. IW-treated membranes presented lower conductivity (2.59 × 10⁻⁶ S·cm−1), while EI-treated samples exhibited the lowest performance (9.74 × 10⁻⁸ S·cm−1), suggesting limited ion mobility or structural changes. These findings confirm the critical role of the solvent environment in influencing Nafion’s proton transport behavior.
Table 2.
Proton conductivity of Nafion N−115 membranes treated with different mixed solvent systems.
It is important to note that the conductivity values in Table 2 reflect membranes treated in mixed solvent systems and exposed to heat at 60 °C for 48 h. Only the water-soaked membrane was fully hydrated. The treatments used in this study cause partial structural changes to Nafion, which reduce proton mobility. Therefore, the values reported are lower than the standard ~0.1 S/cm seen in fully hydrated Nafion membranes and are used here to compare performance across different solvent treatments.
In the case of Figure 9, N−115 in IW has a phase angle of −70° at 1 Hz, indicating the presence of some capacitive behavior, which is typical of ionomer membranes, where protons are stored and transported through ionic domains. However, this value is slightly less negative than the ideal capacitive range (−90°), suggesting that the proton conductivity is moderate but not optimal. The quick transition to 0° at 10 Hz indicates that resistive behavior dominates, meaning that proton transport may be encountering some limitations, likely due to partial dehydration or reduced availability of water channels in the membrane. The constant phase angle of 0° beyond 1000 Hz reflects that the membrane’s proton conductivity may be stable at high frequencies, but it is mostly dominated by resistive processes. This observation is consistent with results from Nguyen et al. (2023) [72]. They reported similar phase angles for Nafion membranes in alcohol–water mixtures, emphasizing that a less negative phase angle reflects some limitations in proton transport, likely due to dehydration or suboptimal water channel availability.
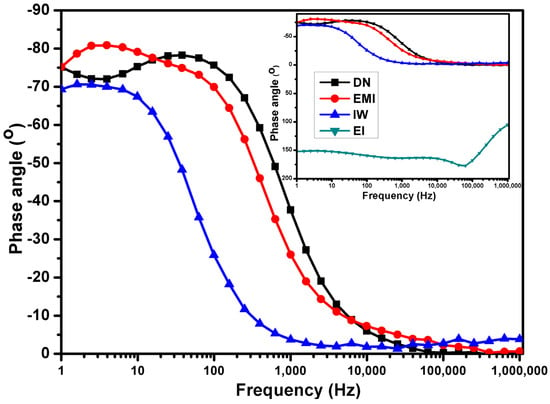
Figure 9.
Electrochemical impedance spectroscopy Bode plot for N−115 after partial dissolution in mixed solvents.
For N−115 in EMI, the lower phase angle (−75° to −82°) indicates better proton conductivity compared to the IW solvent. This is because a phase angle closer to −90° suggests more efficient capacitive behavior, where the membrane can effectively store and transport protons. However, the increase in phase angle to 0° at 100,000 Hz suggests that proton transport becomes more resistive at higher frequencies. The small increase beyond 0° at high frequencies could indicate capacitive leakage or instability, where the membrane’s ionic channels may not be fully stable under prolonged operation, leading to slightly reduced proton mobility. The observation of a lower phase angle (−75° to −82°) for Nafion in EMI, suggesting improved proton conductivity, is supported by Bender et al. (2021) [73]. Their study noted that a phase angle closer to −90° indicates more efficient capacitive behavior, enhancing proton transport. This study’s finding of a transition to 0° at high frequencies aligns with their observations regarding increased resistive behavior, indicating potential instability in ionic channels under prolonged operation.
In the case of N−115 in DN, similar to EMI, the phase angle of −75° at 1 Hz suggests relatively good proton conductivity, with capacitive behavior being moderately efficient. However, the dip to −78° at 40 Hz indicates some instability or inconsistency in proton transport at mid frequencies. The membrane’s behavior becomes more resistive (0° phase angle) at higher frequencies, suggesting that, while proton conductivity is decent at lower frequencies, there may be limitations in sustaining proton transport at higher operating frequencies. These results showing a phase angle of −75° at 1 Hz for Nafion in DN align with findings from Bakr et al. (2024), who indicated that such values reflect decent proton conductivity with moderate capacitive behavior [74]. The dip to −78° at mid frequencies in this study is similar to their observations of instability in proton transport, underscoring the challenges of sustaining efficient conductivity at higher frequencies [75].
For N−115 in EI, the very high phase angle suggests that the membrane is acting almost entirely as a capacitor at low frequencies, indicating that proton transport is heavily hindered. In capacitive behavior, protons are not easily moving through the membrane, leading to energy storage rather than transport [76]. In summary, the very high phase angle in EI reflects severe capacitive impedance, leading to significantly poorer proton conductivity compared to the other solvents. Some studies noted that such high phase angles reflect severe impedance to proton transport, leading to limited conductivity. The findings from this study reinforce their conclusions that this solvent combination significantly hinders proton mobility, confirming the detrimental effects of certain solvent interactions on membrane performance [77].
4. Conclusions
The Nafion N−115 membrane showed varied chemical stability depending on the solvent mixture. Membranes immersed in EI and IW demonstrated high electrochemical stability, with no peak shifts in cyclic voltammetry, indicating minimal degradation. Conversely, membranes exposed to DN exhibited lower chemical stability, as evidenced by peak shifts and potential degradation due to sulfonic group loss or polymer chain scission. This suggests that alcohol-based solvents better preserve the membrane’s chemical structure. Based on Raman spectroscopy, the mechanical integrity of the Nafion membrane was most robust in its untreated and annealed forms. Annealing improved crystallinity, enhancing structural integrity, although it also increased brittleness. Immersion of the membrane in water reduced its mechanical strength significantly due to swelling, which weakens polymer chains and makes the membrane more prone to deformation. This indicates that water-based environments can compromise long-term durability, especially under cyclic stresses.
Water uptake is a crucial factor for proton conductivity in Nafion membranes [78], and the N−115 membrane demonstrated a water uptake of 24–25%, a range optimal for ensuring high proton conductivity while avoiding excessive swelling that could compromise mechanical integrity. The balance between water retention and structural stability was well-maintained in this range, suggesting that Nafion can perform reliably in environments where moderate hydration is required for proton transfer. Proton conductivity varied significantly depending on the solvent used for membrane immersion. The lowest impedance (Zreal) and highest proton conductivity were observed for membranes immersed in EMI, indicating well-formed ionic channels. In contrast, membranes immersed in EI and IW exhibited poorer proton conductivity due to suboptimal hydration, which hindered the formation of continuous proton-conducting pathways. DN showed intermediate results, suggesting better conductivity than IW but less optimal conductivity than EMI.
The EMI-treated Nafion N−115 membrane emerged as the best performer, exhibiting the highest proton conductivity with relatively stable mechanical strength and adequate chemical stability. The balance of high conductivity and preserved structural integrity makes it the optimal choice for applications where both proton mobility and durability are critical. Finally, a comparative Table 3 has been added to exhibit the various impacts of different solvent systems on the membrane.
Table 3.
Summary of Nafion N−115 membrane behavior in different solvent systems.
Author Contributions
Conceptualization, L.M., N.R. and M.A.A.; methodology, L.M.; validation, L.M., N.R. and M.A.A.; formal analysis, L.M., N.R. and M.A.A.; investigation, L.M., N.R. and M.A.A.; resources, S.M., T.N. and E.L.M.; data curation, L.M., N.R. and M.A.A.; writing—original draft preparation, L.M.; writing—review and editing, E.L.M., N.R., S.M., T.N. and M.A.A.; visualization, E.L.M., N.R., S.M., T.N. and M.A.A.; supervision, E.L.M., N.R., S.M., T.N. and M.A.A.; project administration, E.L.M., N.R., S.M., T.N. and M.A.A.; funding acquisition, E.L.M.; All authors have read and agreed to the published version of the manuscript.
Funding
Isondo precious metal under TRIP and the APC was received from the Govan Mbeki Research and Development Centre (GMRDC) at the University of Fort Hare.
Data Availability Statement
Data will be made available on request.
Acknowledgments
The authors thank the Department of Science and Innovation, the National Research Foundation (GUN: 137944 and 118947), Isondo Precious Metals under TRHIP, and the Govan Mbeki Research and Development Centre (GMRDC) at the University of Fort Hare, South Africa for their financial support. L.M also thanks NRF-SASOL for funding his studies.
Conflicts of Interest
The authors declare no conflicts of interest.
References
- Cheekatamarla, P. Hydrogen and the global energy transition—Path to sustainability and adoption across all economic sectors. Energies 2024, 17, 807. [Google Scholar] [CrossRef]
- Hassan, Q.; Azzawi, I.D.; Sameen, A.Z.; Salman, H.M. Hydrogen fuel cell vehicles: Opportunities and challenges. Sustainability 2023, 15, 11501. [Google Scholar] [CrossRef]
- Seck, G.S.; Hache, E.; Sabathier, J.; Guedes, F.; Reigstad, G.A.; Straus, J.; Wolfgang, O.; Ouassou, J.A.; Askeland, M.; Hjorth, I.; et al. Hydrogen and the decarbonization of the energy system in europe in 2050: A detailed model-based analysis. Renew. Sustain. Energy Rev. 2022, 167, 112779. [Google Scholar] [CrossRef]
- de Sá, M.H. Electrochemical devices to power a sustainable energy transition—An overview of green hydrogen contribution. Appl. Sci. 2024, 14, 2168. [Google Scholar] [CrossRef]
- Meda, U.S.; Rajyaguru, Y.V.; Pandey, A. Generation of green hydrogen using self-sustained regenerative fuel cells: Opportunities and challenges. Int. J. Hydrogen Energy 2023, 48, 28289–28314. [Google Scholar] [CrossRef]
- Baroutaji, A.; Arjunan, A.; Robinson, J.; Abdelkareem, M.A.; Olabi, A.-G. Additive manufacturing for Proton Exchange Membrane (PEM) hydrogen technologies: Merits, challenges, and prospects. Int. J. Hydrogen Energy 2024, 52, 561–584. [Google Scholar] [CrossRef]
- Elegbeleye, I.; Oguntona, O.; Elegbeleye, F. Green Hydrogen: Pathway to Net Zero Green House Gas Emission and Global Climate Change Mitigation. Hydrogen 2025, 6, 29. [Google Scholar] [CrossRef]
- Tellez-Cruz, M.M.; Escorihuela, J.; Solorza-Feria, O.; Compañ, V. Proton exchange membrane fuel cells (PEMFCs): Advances and challenges. Polymers 2021, 13, 3064. [Google Scholar] [CrossRef]
- da Costa, G.P.; Garcia, D.M.; Van Nguyen, T.H.; Lacharmoise, P.; Simão, C.D. Advancements in printed components for proton exchange membrane fuel cells: A comprehensive review. Int. J. Hydrogen Energy 2024, 69, 710–728. [Google Scholar] [CrossRef]
- Chibac-Scutaru, A.L.; Coseri, S. Advances in the use of cellulose-based proton exchange membranes in fuel cell technology: A review. Int. J. Biol. Macromol. 2023, 247, 125810. [Google Scholar] [CrossRef]
- Jayakumar, A.; Madheswaran, D.K.; Kumar, N.M. A critical assessment on functional attributes and degradation mechanism of membrane electrode assembly components in direct methanol fuel cells. Sustainability 2021, 13, 13938. [Google Scholar] [CrossRef]
- Ng, W.W.; Thiam, H.S.; Pang, Y.L.; Chong, K.C.; Lai, S.O. A State-of-Art on the development of Nafion-based membrane for performance improvement in direct methanol fuel cells. Membranes 2022, 12, 506. [Google Scholar] [CrossRef]
- Sazali, N.; Wan Salleh, W.N.; Jamaludin, A.S.; Mhd Razali, M.N. New perspectives on fuel cell technology: A brief review. Membranes 2020, 10, 99. [Google Scholar] [CrossRef] [PubMed]
- Robert, M.; Dubelley, F.; Paul, A.; Svecova, L.; Bas, C. Investigation of Membrane–Electrode Separation Processes for the Recycling of Ionomer Membranes in End-of-Life PEM Fuel Cells. Energy Fuels 2025, 39, 2758–2771. [Google Scholar] [CrossRef]
- Safronova, E.Y.; Lysova, A.A.; Voropaeva, D.Y.; Yaroslavtsev, A.B. Approaches to the modification of perfluorosulfonic acid membranes. Membranes 2023, 13, 721. [Google Scholar] [CrossRef]
- Bhowmik, S.; Phukan, S.J.; Sah, N.K.; Roy, M.; Garai, S.; Iyer, P.K. Review of graphitic carbon nitride and its composite catalysts for selective reduction of CO2. ACS Appl. Nano Mater. 2021, 4, 12845–12890. [Google Scholar] [CrossRef]
- Palanisamy, G.; Oh, T.H.; Thangarasu, S. Modified cellulose proton-exchange membranes for direct methanol fuel cells. Polymers 2023, 15, 659. [Google Scholar] [CrossRef]
- Wang, K.Y.; Weber, M.; Chung, T.-S. Polybenzimidazoles (PBIs) and state-of-the-art PBI hollow fiber membranes for water, organic solvent and gas separations: A review. J. Mater. Chem. A 2022, 10, 8687–8718. [Google Scholar] [CrossRef]
- Gao, X.; Yamamoto, K.; Hirai, T.; Ohta, N.; Uchiyama, T.; Watanabe, T.; Imai, H.; Sugawara, S.; Shinohara, K.; Uchimoto, Y. Impact of the Composition of Alcohol/Water Dispersion on the Proton Transport and Morphology of Cast Perfluorinated Sulfonic Acid Ionomer Thin Films. ACS Omega 2021, 6, 14130–14137. [Google Scholar] [CrossRef]
- Li, S.; Gu, R.; Luo, R.; Cheng, X.; Li, X. Enhanced properties of Nafion nanofibrous proton exchange membranes by altering the electrospinning solvents. J. Polym. Eng. 2024, 44, 449–456. [Google Scholar] [CrossRef]
- Aburabie, J.; Lalia, B.; Hashaikeh, R. Proton conductive, low methanol crossover cellulose-based membranes. Membranes 2021, 11, 539. [Google Scholar] [CrossRef]
- Song, C.-H.; Park, J.-S. Effect of Dispersion Solvents in Catalyst Inks on the Performance and Durability of Catalyst Layers in Proton Exchange Membrane Fuel Cells. Energies 2019, 12, 549. [Google Scholar] [CrossRef]
- Madhuranthakam, C.M.R.; Abudaqqa, W.S.; Fowler, M. Advances in polyvinyl alcohol-based membranes for fuel cells: A comprehensive review on types, synthesis, modifications, and performance optimization. Polymers 2024, 16, 1775. [Google Scholar] [CrossRef]
- Solhi, L.; Guccini, V.; Heise, K.; Solala, I.; Niinivaara, E.; Xu, W.; Mihhels, K.; Kroger, M.; Meng, Z.; Wohlert, J. Understanding nanocellulose–water interactions: Turning a detriment into an asset. Chem. Rev. 2023, 123, 1925–2015. [Google Scholar] [CrossRef]
- Oxley, A.; Gaffney, P.R.; Kim, D.; Marchetti, P.; Livingston, A.G. Graft modification of polybenzimidazole membranes for organic solvent ultrafiltration with scale up to spiral wound modules. J. Membr. Sci. 2022, 647, 120199. [Google Scholar] [CrossRef]
- Wang, H.; Zhang, J.; Ning, X.; Tian, M.; Long, Y.; Ramakrishna, S. Recent advances in designing and tailoring nanofiber composite electrolyte membranes for high-performance proton exchange membrane fuel cells. Int. J. Hydrogen Energy 2021, 46, 25225–25251. [Google Scholar] [CrossRef]
- Prykhodko, Y.; Fatyeyeva, K.; Hespel, L.; Marais, S. Progress in hybrid composite Nafion®-based membranes for proton exchange fuel cell application. Chem. Eng. J. 2021, 409, 127329. [Google Scholar] [CrossRef]
- Ahmad, S.; Nawaz, T.; Ali, A.; Orhan, M.F.; Samreen, A.; Kannan, A.M. An overview of proton exchange membranes for fuel cells: Materials and manufacturing. Int. J. Hydrogen Energy 2022, 47, 19086–19131. [Google Scholar] [CrossRef]
- Rahim, A.; Shamsuri, N.; Adam, A.; Aziz, M.; Hamsan, M.; Rusdi, H.; Siong, S.O.J.; Noor, I.; Kadir, M.; Shukur, M. Characterization of nanocomposite polyvinyl alcohol/cellulose acetate blend gel polymer electrolytes for supercapacitor application. J. Energy Storage 2024, 97, 112964. [Google Scholar] [CrossRef]
- Li, Z.; Wang, Y.; Mu, Y.; Wu, B.; Jiang, Y.; Zeng, L.; Zhao, T. Recent advances in the anode catalyst layer for proton exchange membrane fuel cells. Renew. Sustain. Energy Rev. 2023, 176, 113182. [Google Scholar] [CrossRef]
- Liu, S.; Yuan, S.; Liang, Y.; Li, H.; Xu, Z.; Xu, Q.; Yin, J.; Shen, S.; Yan, X.; Zhang, J. Engineering the catalyst layers towards enhanced local oxygen transport of Low-Pt proton exchange membrane fuel cells: Materials, designs, and methods. Int. J. Hydrogen Energy 2023, 48, 4389–4417. [Google Scholar] [CrossRef]
- Kumar, A.G.; Singh, A.; Komber, H.; Voit, B.; Tiwari, B.R.; Noori, M.T.; Ghangrekar, M.M.; Banerjee, S. Novel sulfonated Co-poly (ether imide) s containing trifluoromethyl, fluorenyl and hydroxyl groups for enhanced proton exchange membrane properties: Application in microbial fuel cell. ACS Appl. Mater. Interfaces 2018, 10, 14803–14817. [Google Scholar] [CrossRef]
- Santhosh Kumar, K.; Vijayalakshmi, K.; Sivanath, S.; Jayalatha, T.; Mohanty, S.; Shaneeth, M. Interaction of Nafion ionomers toward various solvents. J. Appl. Polym. Sci. 2013, 128, 3710–3719. [Google Scholar] [CrossRef]
- Barik, B.; Yun, Y.; Kumar, A.; Bae, H.; Namgung, Y.; Park, J.-Y.; Song, S.-J. Highly enhanced proton conductivity of single-step-functionalized graphene oxide/nafion electrolyte membrane towards improved hydrogen fuel cell performance. Int. J. Hydrogen Energy 2023, 48, 11029–11044. [Google Scholar] [CrossRef]
- Wei, J.; Ma, Y.; Qin, Z.; Jin, Z.; Jin, Y.; Yang, L.; Yao, L.; Jiang, W.; Deng, Y.; Huang, Y. Membrane fabricated via a facile non-solvent induced microstructure rearrangement with superior CO2 separation performances. Sep. Purif. Technol. 2023, 320, 124182. [Google Scholar] [CrossRef]
- Zheng, Z.; Liu, T.; Liu, Q.; Lei, J.; Fang, J. A distributed energy system integrating SOFC-MGT with mid-and-low temperature solar thermochemical hydrogen fuel production. Int. J. Hydrogen Energy 2021, 46, 19846–19860. [Google Scholar] [CrossRef]
- LaVan, D.; Yi, F.; Adams, T.; Tao, R.; Pelczar, E.; Xia, H.; Hu, X.; Sauerbrunn, S.; Matisons, J. Abstracts of the 2023 49th Annual NATAS Conference. Polymers 2023, 15, 3250. [Google Scholar] [CrossRef]
- Chitra, S.; Balakumar, S. Insight into the impingement of different sodium precursors on structural, biocompatible, and hemostatic properties of bioactive materials. Mater. Sci. Eng. C 2021, 123, 111959. [Google Scholar] [CrossRef]
- Zhang, S.; Zheng, M.; Tang, Y.; Zang, R.; Zhang, X.; Huang, X.; Chen, Y.; Yamauchi, Y.; Kaskel, S.; Pang, H. Understanding synthesis–structure–performance correlations of nanoarchitectured activated carbons for electrochemical applications and carbon capture. Adv. Funct. Mater. 2022, 32, 2204714. [Google Scholar] [CrossRef]
- Li, D.; Yu, Y.; Ning, C.-Z. Super-stable high-quality few-layer black phosphorus for photonic applications. ACS Appl. Nano Mater. 2021, 4, 4746–4753. [Google Scholar] [CrossRef]
- Zhang, T.; Li, X.; Liu, D.; An, J.; Zhang, M.; Li, J.H.; Jiang, C. Plasmonic AgNPs reinforced flexible hydrogel Surface-Enhanced Raman scattering (SERS) sensor for in-situ detection of curved samples. Chem. Eng. J. 2024, 494, 153082. [Google Scholar] [CrossRef]
- Wu, Y.; Zhang, N.; Yuen, G.; de Lannoy, C.-F. Cross-linked iron nanoparticle-doped reduced graphene oxide membranes for micropollutant removal from water. Chem. Eng. J. 2023, 455, 140624. [Google Scholar] [CrossRef]
- Okonkwo, P.C.; Belgacem, I.B.; Emori, W.; Uzoma, P.C. Nafion degradation mechanisms in proton exchange membrane fuel cell (PEMFC) system: A review. Int. J. Hydrogen Energy 2021, 46, 27956–27973. [Google Scholar] [CrossRef]
- Vinothkannan, M.; Kim, A.R.; Ramakrishnan, S.; Yu, Y.-T.; Yoo, D.J. Advanced Nafion nanocomposite membrane embedded with unzipped and functionalized graphite nanofibers for high-temperature hydrogen-air fuel cell system: The impact of filler on power density, chemical durability and hydrogen permeability of membrane. Compos. Part B Eng. 2021, 215, 108828. [Google Scholar] [CrossRef]
- Wang, C.; Sun, Y.; Yang, Z.; Fan, J.; Li, H.; Xu, S. Low water swelling polyaromatic proton exchange membranes. J. Membr. Sci. 2023, 684, 121879. [Google Scholar] [CrossRef]
- Zhao, X.; Liu, J.; Li, J.; Liang, X.; Zhou, W.; Peng, S. Strategies and techniques for improving heat resistance and mechanical performances of poly (lactic acid) (PLA) biodegradable materials. Int. J. Biol. Macromol. 2022, 218, 115–134. [Google Scholar] [CrossRef]
- Stenina, I.; Yaroslavtsev, A. Prospects for the Development of Hydrogen Energy. Polymer Membranes for Fuel Cells and Electrolyzers. Membr. Membr. Technol. 2024, 6, 15–26. [Google Scholar] [CrossRef]
- Yan, X.; Xu, Z.; Yuan, S.; Han, A.; Shen, Y.; Cheng, X.; Liang, Y.; Shen, S.; Zhang, J. Structural and transport properties of ultrathin perfluorosulfonic acid ionomer film in proton exchange membrane fuel cell catalyst layer: A review. J. Power Sources 2022, 536, 231523. [Google Scholar] [CrossRef]
- Zakertabrizi, M.; Hosseini, E.; Korayem, A.H.; Razmjou, A.; Fane, A.G.; Chen, V. Insight from perfectly selective and ultrafast proton transport through anhydrous asymmetrical graphene oxide membranes under Grotthuss mechanism. J. Membr. Sci. 2021, 618, 118735. [Google Scholar] [CrossRef]
- Okonkwo, P.C.; Emori, W.; Uzoma, P.C.; Mansir, I.B.; Radwan, A.B.; Ige, O.O.; Abdullah, A.M. A review of bipolar plates materials and graphene coating degradation mechanism in proton exchange membrane fuel cell. Int. J. Energy Res. 2022, 46, 3766–3781. [Google Scholar] [CrossRef]
- Demchenko, A.P. Proton transfer reactions: From photochemistry to biochemistry and bioenergetics. BBA Adv. 2023, 3, 100085. [Google Scholar] [CrossRef]
- Wang, G.; Kang, J.; Yang, S.; Lu, M.; Wei, H. Influence of structure construction on water uptake, swelling, and oxidation stability of proton exchange membranes. Int. J. Hydrogen Energy 2024, 50, 279–311. [Google Scholar] [CrossRef]
- Lufrano, E.; Simari, C.; Di Vona, M.L.; Nicotera, I.; Narducci, R. How the morphology of nafion-based membranes affects proton transport. Polymers 2021, 13, 359. [Google Scholar] [CrossRef]
- Asghar, M.R.; Zhang, W.; Su, H.; Zhang, J.; Liu, H.; Xing, L.; Yan, X.; Xu, Q. A review of proton exchange membranes modified with inorganic nanomaterials for fuel cells. Energy Adv. 2025, 4, 185–223. [Google Scholar] [CrossRef]
- Freger, V.; Ramon, G.Z. Polyamide desalination membranes: Formation, structure, and properties. Prog. Polym. Sci. 2021, 122, 101451. [Google Scholar] [CrossRef]
- Zupančič, B.; Grdadolnik, J. Solute-induced changes in the water H-bond network of different alcohol-aqueous systems. J. Mol. Liq. 2021, 341, 117349. [Google Scholar] [CrossRef]
- Singh, J.; White, R.L. A variable temperature infrared spectroscopy study of NaY zeolite dehydration. Spectrochim. Acta Part A Mol. Biomol. Spectrosc. 2020, 231, 118142. [Google Scholar] [CrossRef] [PubMed]
- Wu, Y.; Wang, Y.; Liu, J.; Jiang, Z.; Wan, J.; Wang, J.; Chai, S.; Ai, C.; Dang, F.; Albilali, R. Promoting intermediates transformation by boosting H2O dissociation over core-shell Pd@ CoO Janus for acetone efficacious oxidation. Appl. Catal. B Environ. Energy 2024, 354, 124113. [Google Scholar] [CrossRef]
- Ibrahim, A.; Hossain, O.; Chaggar, J.; Steinberger-Wilckens, R.; El-Kharouf, A. GO-nafion composite membrane development for enabling intermediate temperature operation of polymer electrolyte fuel cell. Int. J. Hydrogen Energy 2020, 45, 5526–5534. [Google Scholar] [CrossRef]
- Peressut, A.B.; Latorrata, S.; Stampino, P.G.; Dotelli, G. Development of self-assembling sulfonated graphene oxide membranes as a potential proton conductor. Mater. Chem. Phys. 2021, 257, 123768. [Google Scholar] [CrossRef]
- Pathak, R.B.; Kumar, P.; Mishra, A.P.; Verma, V. Fabrication of nanocomposite membrane composed of sulfonated PVDF and thermo-mechanically modified fly ash for application in direct methanol fuel cells. J. Polym. Res. 2023, 30, 396. [Google Scholar] [CrossRef]
- Costa, L.A.T.; de Aguiar, L.C.V.; Gomes, A.d.S.; Brum, E.J.B.A. Characterization of PVA and phenol salt modified tin dioxide cationic membranes. Int. J. Hydrog. Energy 2022, 47, 7415–7431. [Google Scholar] [CrossRef]
- Zhao, C.; Zhu, J.; Zhang, C.; Wang, W.; Qu, W.; Wang, W.; Li, W.; Wu, H. Preparation of mechanically strong and active composite films based on fish myofibrillar proteins: The dual effects of oxidized polyphenol crosslinking and layered double hydroxide reinforcement. Food Hydrocoll. 2022, 129, 107616. [Google Scholar] [CrossRef]
- Qiao, Z.; Wang, C.; Zeng, Y.; Spendelow, J.S.; Wu, G. Advanced nanocarbons for enhanced performance and durability of platinum catalysts in proton exchange membrane fuel cells. Small 2021, 17, 2006805. [Google Scholar] [CrossRef]
- Lu, Y.; Liu, Y.; Li, N.; Hu, Z.; Chen, S. Sulfonated graphitic carbon nitride nanosheets as proton conductor for constructing long-range ionic channels proton exchange membrane. J. Membr. Sci. 2020, 601, 117908. [Google Scholar] [CrossRef]
- Nandi, S.; Wang, S.; Wahiduzzaman, M.; Yadav, V.; Taksande, K.; Maurin, G.; Serre, C.; Devautour-Vinot, S. Multivariate Sulfonic-Based Titanium Metal–Organic Frameworks as Super-protonic Conductors. ACS Appl. Mater. Interfaces 2021, 13, 20194–20200. [Google Scholar] [CrossRef]
- Zhang, T.; Ju, J.; Zhang, Z.; Su, D.; Wang, Y.; Kang, W. Wearable flexible zinc-ion batteries based on electrospinning technology. J. Energy Chem. 2024, 98, 562–587. [Google Scholar] [CrossRef]
- Shi, C.; Liu, T.; Chen, W.; Cui, F.; Liu, L.; Cai, Y.; Li, Y. Interaction, structure and tensile property of swollen Nafion® membranes. Polymer 2021, 213, 123224. [Google Scholar] [CrossRef]
- Li, J.; Liu, J.; Xu, W.; Long, J.; Huang, W.; He, Z.; Liu, S.; Zhang, Y. A sulfonated polyimide/nafion blend membrane with high proton selectivity and remarkable stability for vanadium redox flow battery. Membranes 2021, 11, 946. [Google Scholar] [CrossRef] [PubMed]
- Fang, F.; Liu, L.; Min, L.; Xu, L.; Zhang, W.; Wang, Y. Enhanced proton conductivity of Nafion membrane with electrically aligned sulfonated graphene nanoplates. Int. J. Hydrogen Energy 2021, 46, 17784–17792. [Google Scholar] [CrossRef]
- Mehrazi, S. Understanding the Microstructure and Interaction Between Nanoparticles and Polymers Through the Study of Precursor Complex Fluid in a PEMFC. Ph.D. Thesis, University of California, Merced, CA, USA, 2022. [Google Scholar]
- Nguyen, A.T.; Weigle, A.T.; Shukla, D. Functional regulation of aquaporin dynamics by lipid bilayer composition. Nat. Commun. 2024, 15, 1848. [Google Scholar] [CrossRef] [PubMed]
- Bender, J.; Mayerhöfer, B.; Trinke, P.; Bensmann, B.; Hanke-Rauschenbach, R.; Krajinovic, K.; Thiele, S.; Kerres, J. Conducting Aromatic Multiblock Copolymer and Blend Membranes and Their Application in PEM Electrolysis. Polymers 2021, 13, 3467. [Google Scholar] [CrossRef]
- Bakr, A.M.; Darwish, A.; Azab, A.; Makram, B.; Elzwawy, A. Influence of Ce and Ti oxides doping on the PMMA polymer: Structural, optical, THz, dielectric, and antimicrobial characteristics. Polym. Bull. 2024, 81, 13703–13727. [Google Scholar] [CrossRef]
- Azab, N.A.; Mohamed, M.M. Graphene foam-carbon nitride based composites as photoelectrocatalysts for overall water splitting in acidic and neutral media. J. Photochem. Photobiol. A Chem. 2023, 443, 114831. [Google Scholar] [CrossRef]
- Huang, C.; Zhang, W.; Zheng, W. Proton batteries shape the next energy storage. Energy Storage Mater. 2023, 61, 102913. [Google Scholar] [CrossRef]
- Hegde, S.; Ravindrachary, V.; Praveena, S.; Ismayil; Guruswamy, B.; Sagar, R.N. Microstructural, dielectric, and transport properties of proton-conducting solid polymer electrolyte for battery applications. Ionics 2020, 26, 2379–2394. [Google Scholar] [CrossRef]
- Rao, A.S.; Rashmi, K.; Manjunatha, D.; Jayarama, A.; Prabhu, S.; Pinto, R. Pore size tuning of Nafion membranes by UV irradiation for enhanced proton conductivity for fuel cell applications. Int. J. Hydrogen Energy 2019, 44, 23762–23774. [Google Scholar] [CrossRef]
Disclaimer/Publisher’s Note: The statements, opinions and data contained in all publications are solely those of the individual author(s) and contributor(s) and not of MDPI and/or the editor(s). MDPI and/or the editor(s) disclaim responsibility for any injury to people or property resulting from any ideas, methods, instructions or products referred to in the content. |
© 2025 by the authors. Licensee MDPI, Basel, Switzerland. This article is an open access article distributed under the terms and conditions of the Creative Commons Attribution (CC BY) license (https://creativecommons.org/licenses/by/4.0/).