Article

Assessing NO2-Hydrocarbon Interactions during Combustion of NO2/Alkane/Ar Mixtures in a Shock Tube Using CO Time Histories

J. Mike Walker Department of Mechanical Engineering, Texas A&M University, College Station, TX 77843, USA
*
Author to whom correspondence should be addressed.
Fuels 2022, 3(1), 1-14; https://doi.org/10.3390/fuels3010001
Submission received: 18 October 2021 / Revised: 23 November 2021 / Accepted: 24 November 2021 / Published: 4 January 2022
(This article belongs to the Special Issue Feature Papers in Fuels)

Abstract

:
Modern gas turbines use combustion chemistry during the design phase to optimize their efficiency and reduce emissions of regulated pollutants such as NOx. The detailed understanding of the interactions during NOx and natural gas during combustion is therefore necessary for this optimization step. To better assess such interactions, NO2 was used as a sole oxidant during the oxidation of CH4 and C2H6 (the main components of natural gas) in a shock tube. The evolution of the CO mole fraction was followed by laser-absorption spectroscopy from dilute mixtures at around 1.2 atm. The experimental CO profiles were compared to several modern detailed kinetics mechanisms from the literature: models tuned to characterize NOx-hydrocarbons interactions, base-chemistry models (C0–C4) that contain a NOx sub-mechanism, and a nitromethane model. The comparison between the models and the experimental profiles showed that most modern NOx-hydrocarbon detailed kinetics mechanisms are not very accurate, while the base chemistry models were lacking accuracy overall as well. The nitromethane model and one hydrocarbon/NOx model were in relatively good agreement with the data over the entire range of conditions investigated, although there is still room for improvement. The numerical analysis of the results showed that while the models considered predict the same reaction pathways from the fuels to CO, they can be very inconsistent in the selection of the reaction rate coefficients. This variation is especially true for ethane, for which a larger disagreement with the data was generally observed.

1. Introduction

The combustion of hydrocarbons in air in internal combustion engines and gas turbines can lead to the formation of NOx (NO, NO2, N2O), which are regulated pollutants. Thanks to a large number of fundamental studies conducted over the past few decades, the chemistry of several NOx formation mechanisms was identified (Zeldovich, Fenimore, N2O, etc.) [1,2], which allowed for the implementation of strategies to limit NOx emissions during combustion. For instance, one common method used in gas turbines and internal combustion engines consists of re-circulating the exhaust gases in the combustion chamber, to limit the combustion temperature and minimize NOx formation via the Zeldovich mechanism (so-called exhaust gas recirculation (or EGR) method). However, while NOx reduction is achieved, doing so also introduces some NOx into the fresh charge, which can dramatically change the combustion properties of the mixture, even at low NOx levels, as shown in a large number of fundamental experiments with H2- [3,4,5,6,7,8,9], CH4- [10,11,12,13,14,15,16], or larger hydrocarbon-based mixtures [17,18,19,20,21,22,23].
To design better combustion devices and reduce NOx emissions, it is therefore important to accurately know the chemistry for both NOx formation and NOx-fuel interaction mechanisms. This goal has been the purpose of the many detailed kinetics mechanisms that have been developed and refined continuously over the past 20+ years. To validate these detailed kinetics mechanisms, typically, a fuel/oxidizer (O2 and diluent or air) mixture is seeded with small amounts of NOx (a few hundred to a few thousand ppm). For example, Mathieu et al. [13], measured the ignition delay time of methane-based mixtures seeded with various amounts of NO2. As can be seen in Figure 1, most modern detailed kinetics models are able to predict the CH4-air mixture seeded by about 1500 ppm of NO2 during this study (models: Mathieu et al. [24] (Mathieu 2016), Ahmed et al. [25] (Ahmed 2016), Zhang et al. [26] (Zhang 2017), Deng et al. [20] (Deng 2018), Glarborg et al. [2] (Glarborg 2018), NUIGMech 1.1 [27], CRECK 2002 [28], and Fuller et al. [23] (Fuller 2021)). Note that all models but the Zhang 2017 one are within the experimental uncertainty (or close to) and present somewhat similar predictions.
However, recent studies where a large amount of NOx is used, to exaggerate the fuel/NOx interactions and assess them better, show that these interactions are actually not that well understood. For example, the study of Zhang et al. [26] investigated a dilute mixture of Methane/O2 (1.98% CH4) seeded with nearly 5000 ppm of NO2 (NO2 concentration corresponding to about 25% of the CH4 concentration, versus about 3% in the Mathieu et al. study). This time, as can be seen in Figure 2, the NOx models used in Figure 1 are all significantly over-reactive (by a factor of at least 2.5), except the model of Zhang and coworkers [26] (over-reactive by a factor of about 1.5, except for the lowest temperatures investigated where the model is accurate). The base-chemistry models (NUIGMech 1.1 and CRECK) were within an acceptable range for their predictions, and the nitromethane model from Mathieu et al. [24] was the most accurate overall. Similarly, it was recently shown that nitromethane pyrolysis is poorly predicted by modern detailed kinetics models [29]. During pyrolysis, at the conditions investigated, nitromethane rapidly decomposes into (mostly) CH3 and NO2 [29,30], after which subsequent reactions are basically pure interactions between NOx (NO2) and hydrocarbons (CH3).
These recent results indicate that NOx-hydrocarbon interactions in modern detailed kinetics models could be improved, and that exaggerating these interactions by using a large NO2 concentration would be a good way to assess and further validate models. Thus, the aim of this study was to provide new kinetics measurements for the oxidation of simple and well-studied hydrocarbons (CH4, C2H6) in the presence of a relatively large concentration of NOx. To do so, and to simplify the system and further exaggerate the NOx-hydrocarbon interactions, only NO2 was used to oxidize the hydrocarbons selected. Such an approach is new and was used recently by the authors by following H2O by laser absorption [22]. It was found that following H2O is more representative of the H2/NO2 sub-mechanism, which appears to be relatively well understood. As the present study shows below, contrary to H2O in [22], there are several reactions directly forming CO from reactions between a hydrocarbon molecule or radical and a NOx molecule. To focus on these hydrocarbon/NO2 interactions, CO was followed by laser absorption in the present study. After a brief overview of the experimental setup and optical diagnostic used, the experimental results are presented and then compared with modern detailed kinetics models from the literature. The best performing model was then selected to conduct a numerical analysis, explain the results, and point at deficiencies to address in future modeling efforts.

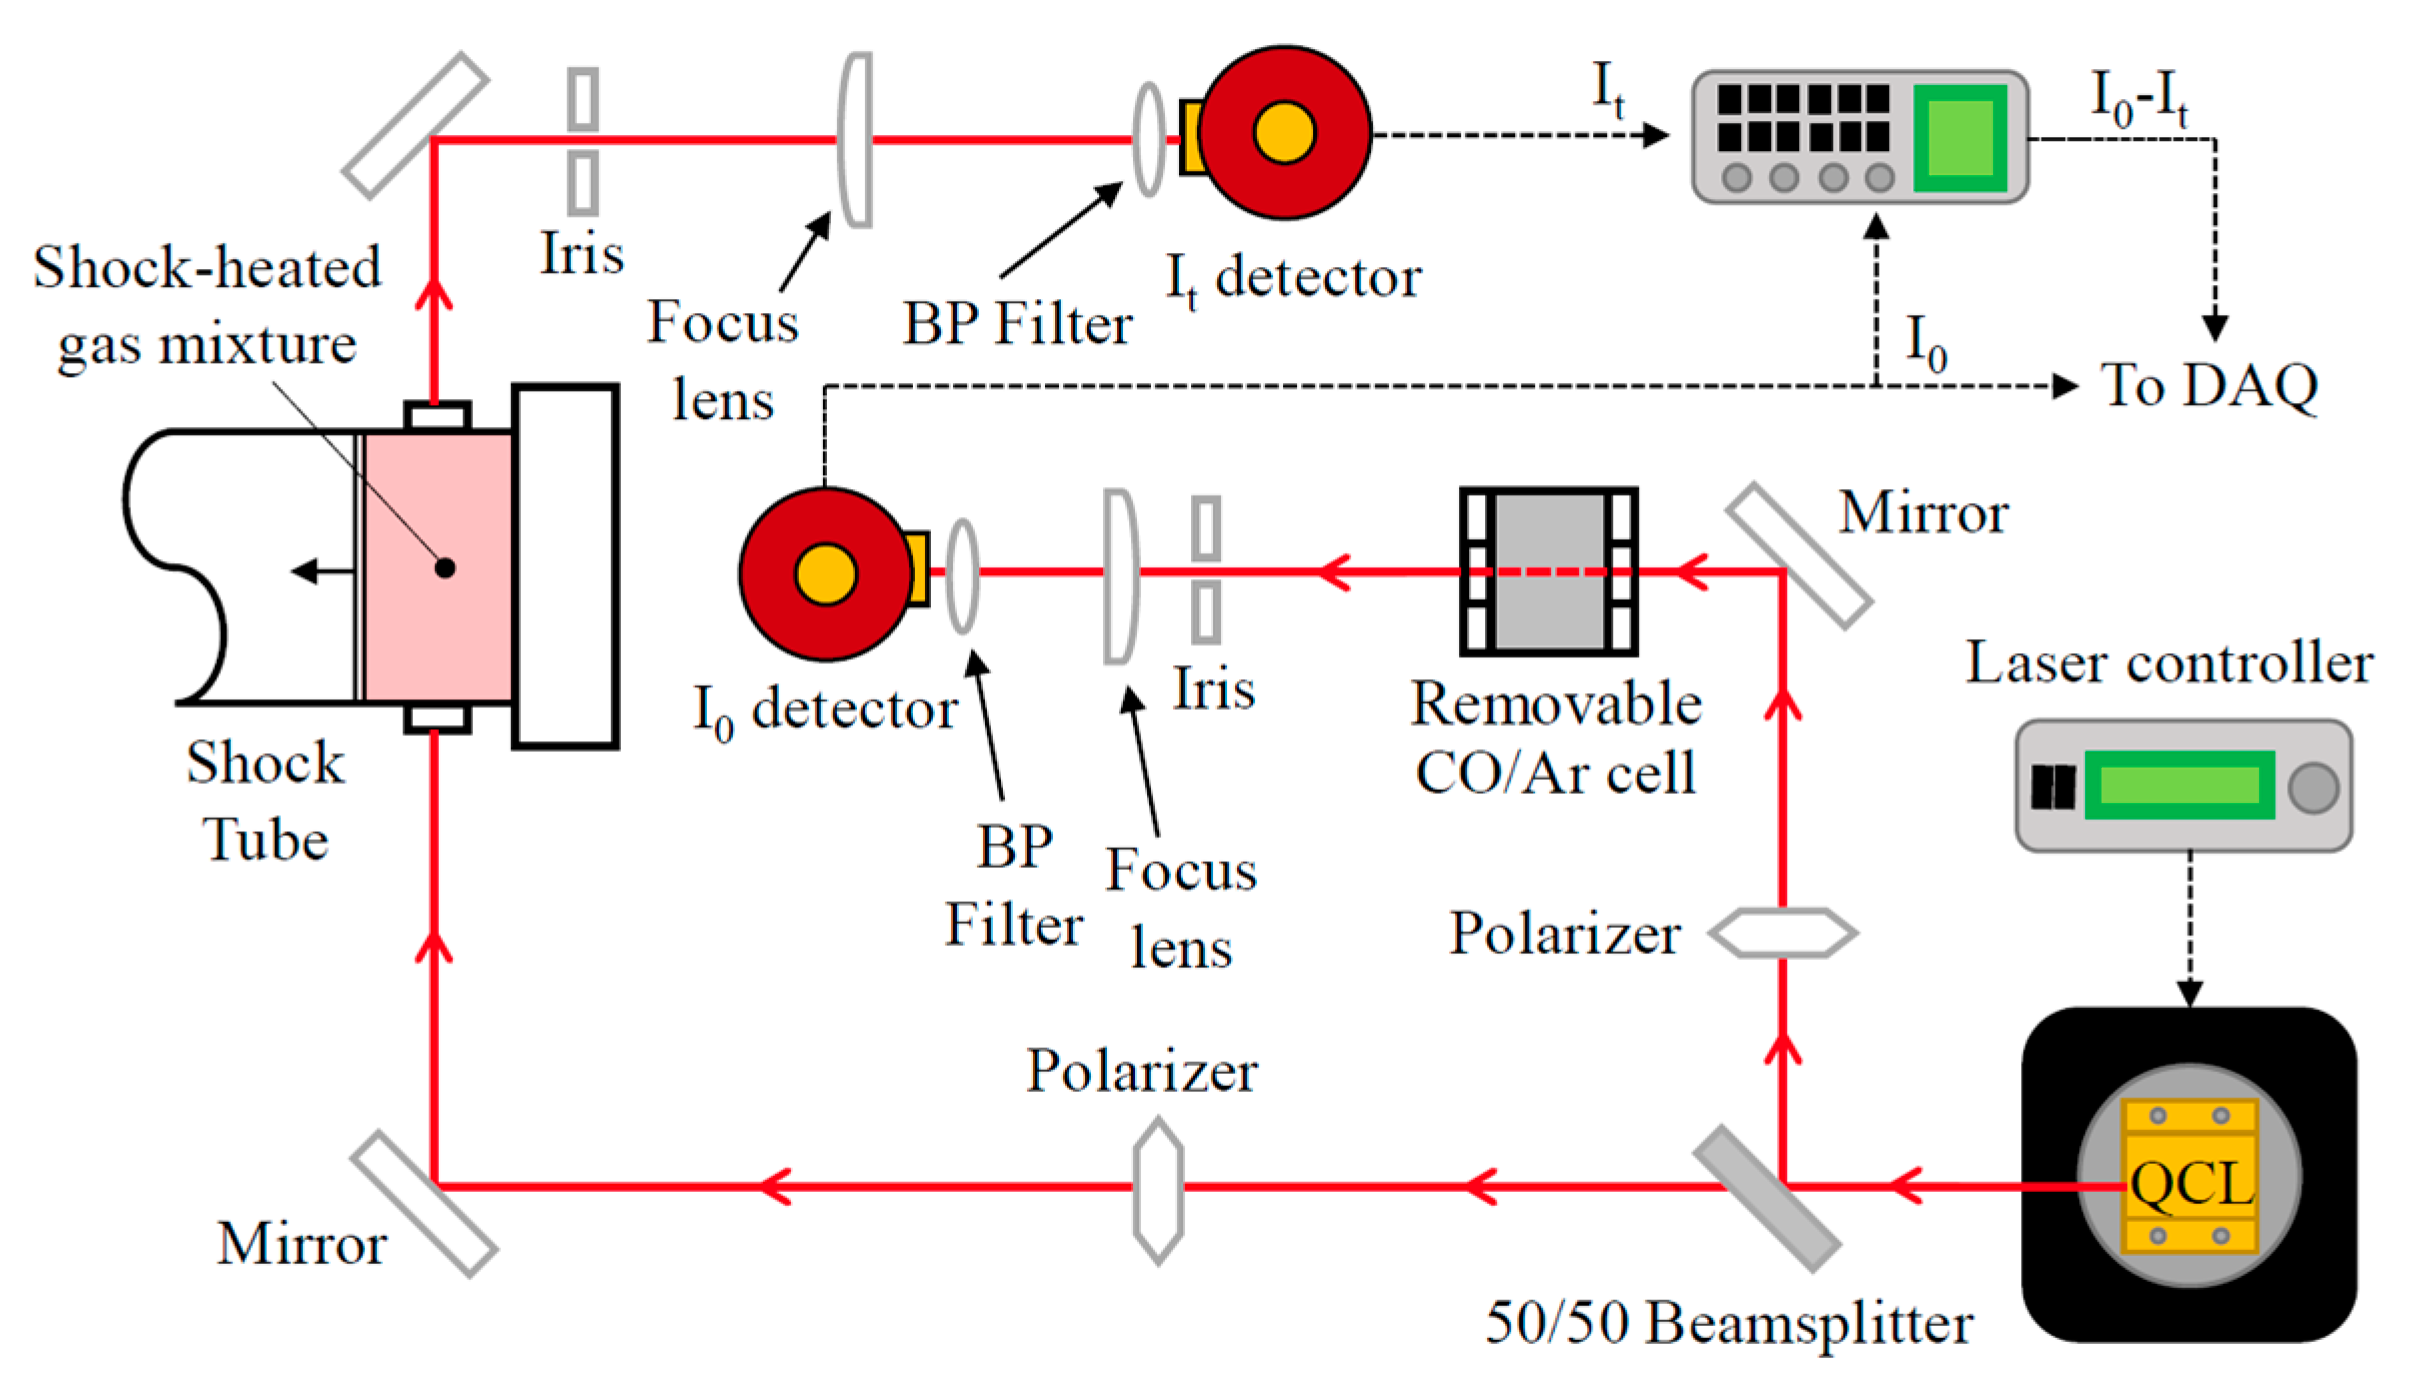
2. Experimental Setup

The shock tube used in this study to perform the laser-absorption experiments has been described in detail in the literature [31]. Thus, only a brief description is provided here. Due to the nature of the experiments conducted herein, with highly diluted mixtures, experiments were conducted behind reflected shock waves, and the stainless-steel shock tube is operated in a way that limits the impurities and their potential influence on the kinetics results. The large-volume driven section (7.88-m-long, 16.2-cm inner diameter) is vacuumed down to 1 mPa or lower between experiments using a system of mechanical and turbomolecular pumps. All gases were high purity (CH4 (Praxair, 99.97%), C2H6 (Acetylene Oxygen Company, Harlingen, TX, USA, 99.5%), NO2 (99.5% purity, supplied by Praxair as a mixture of 1.02% NO2 (±2%) in balance Ar, and He and Ar (Praxair 99.999%)). To ensure consistency in the mixtures and thus the experiments, enough mixture for several experiments was made for the CH4 and C2H6 cases. These mixtures were prepared manometrically into a separate stainless-steel mixing tank, connected to the shock tube’s manifold, and allowed to rest overnight for proper mixing. The leak rate in the shock tube was below 0.13 Pa/min, which, with experiments run within 5 min after the filling of the driven section with the mixture, considerably limits the possibility of O2 from air influencing the results. Note that Helium was added to the mixture to limit any potential influence of vibrational relaxation in the measured CO time-history profile, as reported in Mathieu et al. [32] for methane/O2 mixtures. The mixtures and conditions investigated are visible in Table 1. The uncertainty in the temperature is within ±10 K.
To overcome issues with the mixture preparation due to the conversion of NO2 and N2O4 at high pressure (the 1.02% NO2 in balance Ar mixture provided by Praxair was made on a weight basis, and the mixtures prepared in this study were prepared on a pressure basis), only fuel-lean mixtures, where the fuel is the limiting factor, were investigated. As reported in Mulvihill et al. [9], this approach allows for observing a concentration of the targeted species similar to the concentration at equilibrium. An equivalence ratio (φ) of 0.5 was targeted assuming CO2, H2O, and N2 as final combustion products. Note that, as seen with nitromethane (CH3NO2), a significant fraction of the NO2 will go to NO instead of N2 during the timeframe of a regular combustion experiment [33], explaining why some authors define the products as CO2, H2O, and NO (along with N2 from air) during nitromethane combustion. In the present study, NO2 is in large enough excess to stay below the stoichiometry regardless of the definition used.
The CO-absorption laser diagnostic has been described in detail in Mathieu et al. [32], and a schematic is visible in Figure 3. Briefly, the quantum cascade laser was used to access the R12 transition in the 1←0 band of CO at 4566.17 nm. The Beer-Lambert relation, 𝐼/𝐼0 = exp(−𝑘𝑣𝑃𝑋𝑎𝑏𝑠𝐿) was used (with 𝐼 and 𝐼0 the transmitted and incident laser intensities, respectively, 𝑘𝑣 the absorption coefficient (cm−1atm−1), 𝑃 the pressure (atm), 𝑋𝑎𝑏𝑠 the species mole fraction, and 𝐿 the path length (cm)). 𝑘𝑣 is the product of the lineshape (calculated using Ren et al. [34] Ar-broadening and Mulvihill et al. He-broadening [35] parameters for CO) and the linestrength (obtained from HITRAN 2004 [36]). To center the laser wavelength at the desired CO transition line, a CO/Ar absorption cell was placed in the laser pathway before each run. Laser intensities were recorded using InSb detectors equipped with bandpass filters (centered at 4500 nm, full width of 500 nm) allowing a decrease in the broadband emission levels entering the detectors to <0.3% of the absorbed signal. Note that a minor CO2 absorption also occurs at the wavelength used for the CO diagnostic, and the procedure described in Alturaifi et al. [37] was employed to correct the CO time histories. The laser absorption procedure is also very well detailed and explained in this reference. The estimated uncertainty in the CO time histories is 4% based on the detailed uncertainty analysis reported in Mulvihill et al. [38].

3. Modeling

The experimental results were modeled using the Chemkin Pro package, using the Closed 0-D Reactor module with the “Constant Volume and Solve Energy Equation” assumption. An assessment of several modern detailed kinetics mechanisms from the literature was conducted. Several Hydrocarbon/NOx models from the literature were used (Ahmed et al. [25] (Ahmed 2016), Zhang et al. [26] (Zhang 2017), Deng et al. [20] (Deng 2018), Glarborg et al. [2] (Glarborg 2018), and Fuller et al. [23] (Fuller 2021)), along with modern baseline generalist models that also contain a NOx sub-mechanism (NUIGMech 1.1 [26] and CRECK 2002 [27]). Finally, the nitromethane mechanisms used in the nitromethane pyrolysis study of Mathieu et al. [29] were used to model the data from the present study, and the model from Mathieu et al. [24] (Mathieu 2016) was found to be the most accurate one. Thus, the Mathieu et al. model was also used to predict the data from the present study.

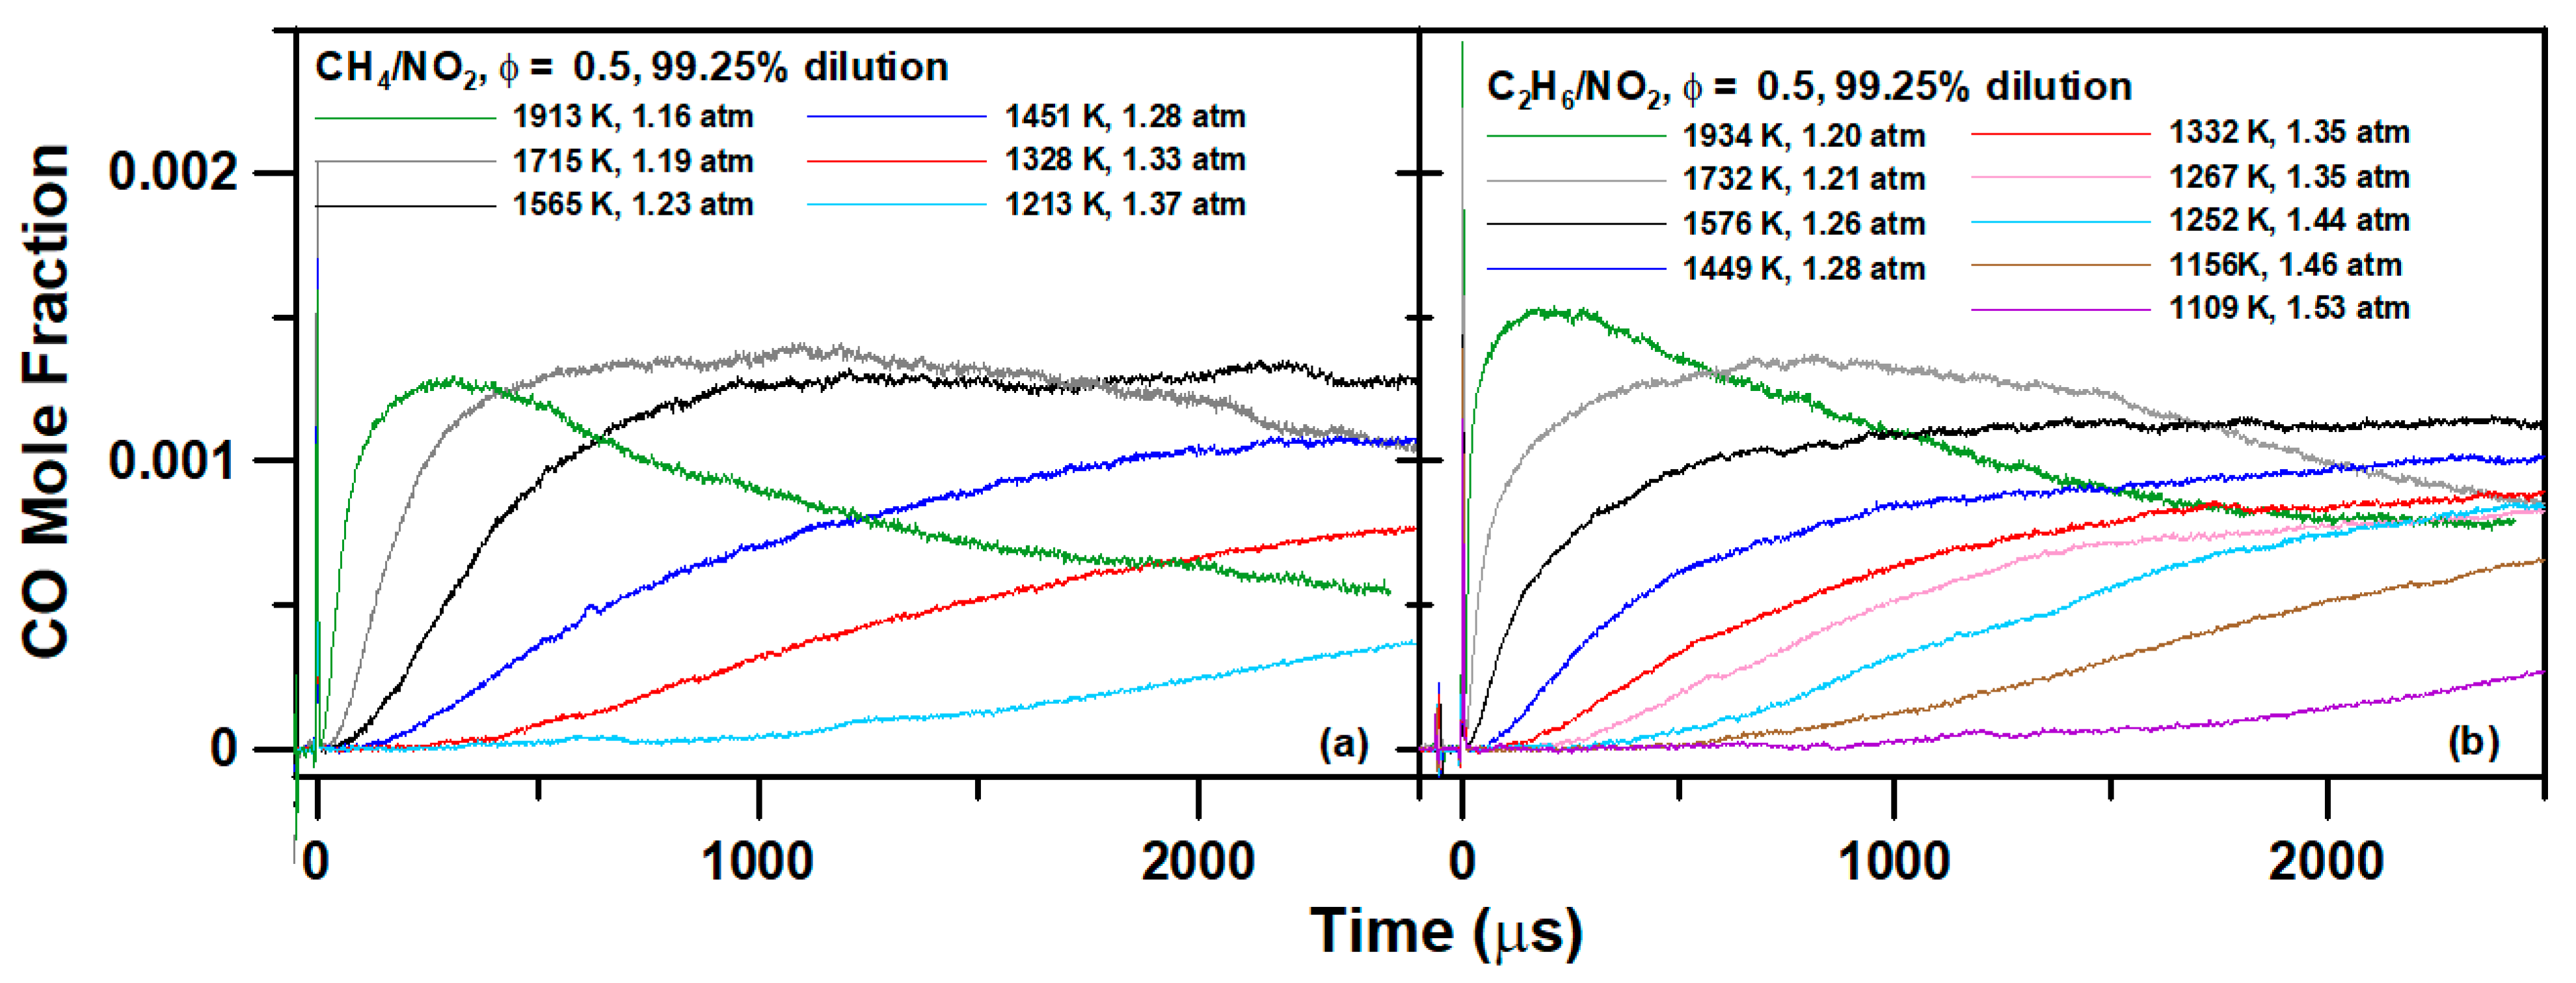
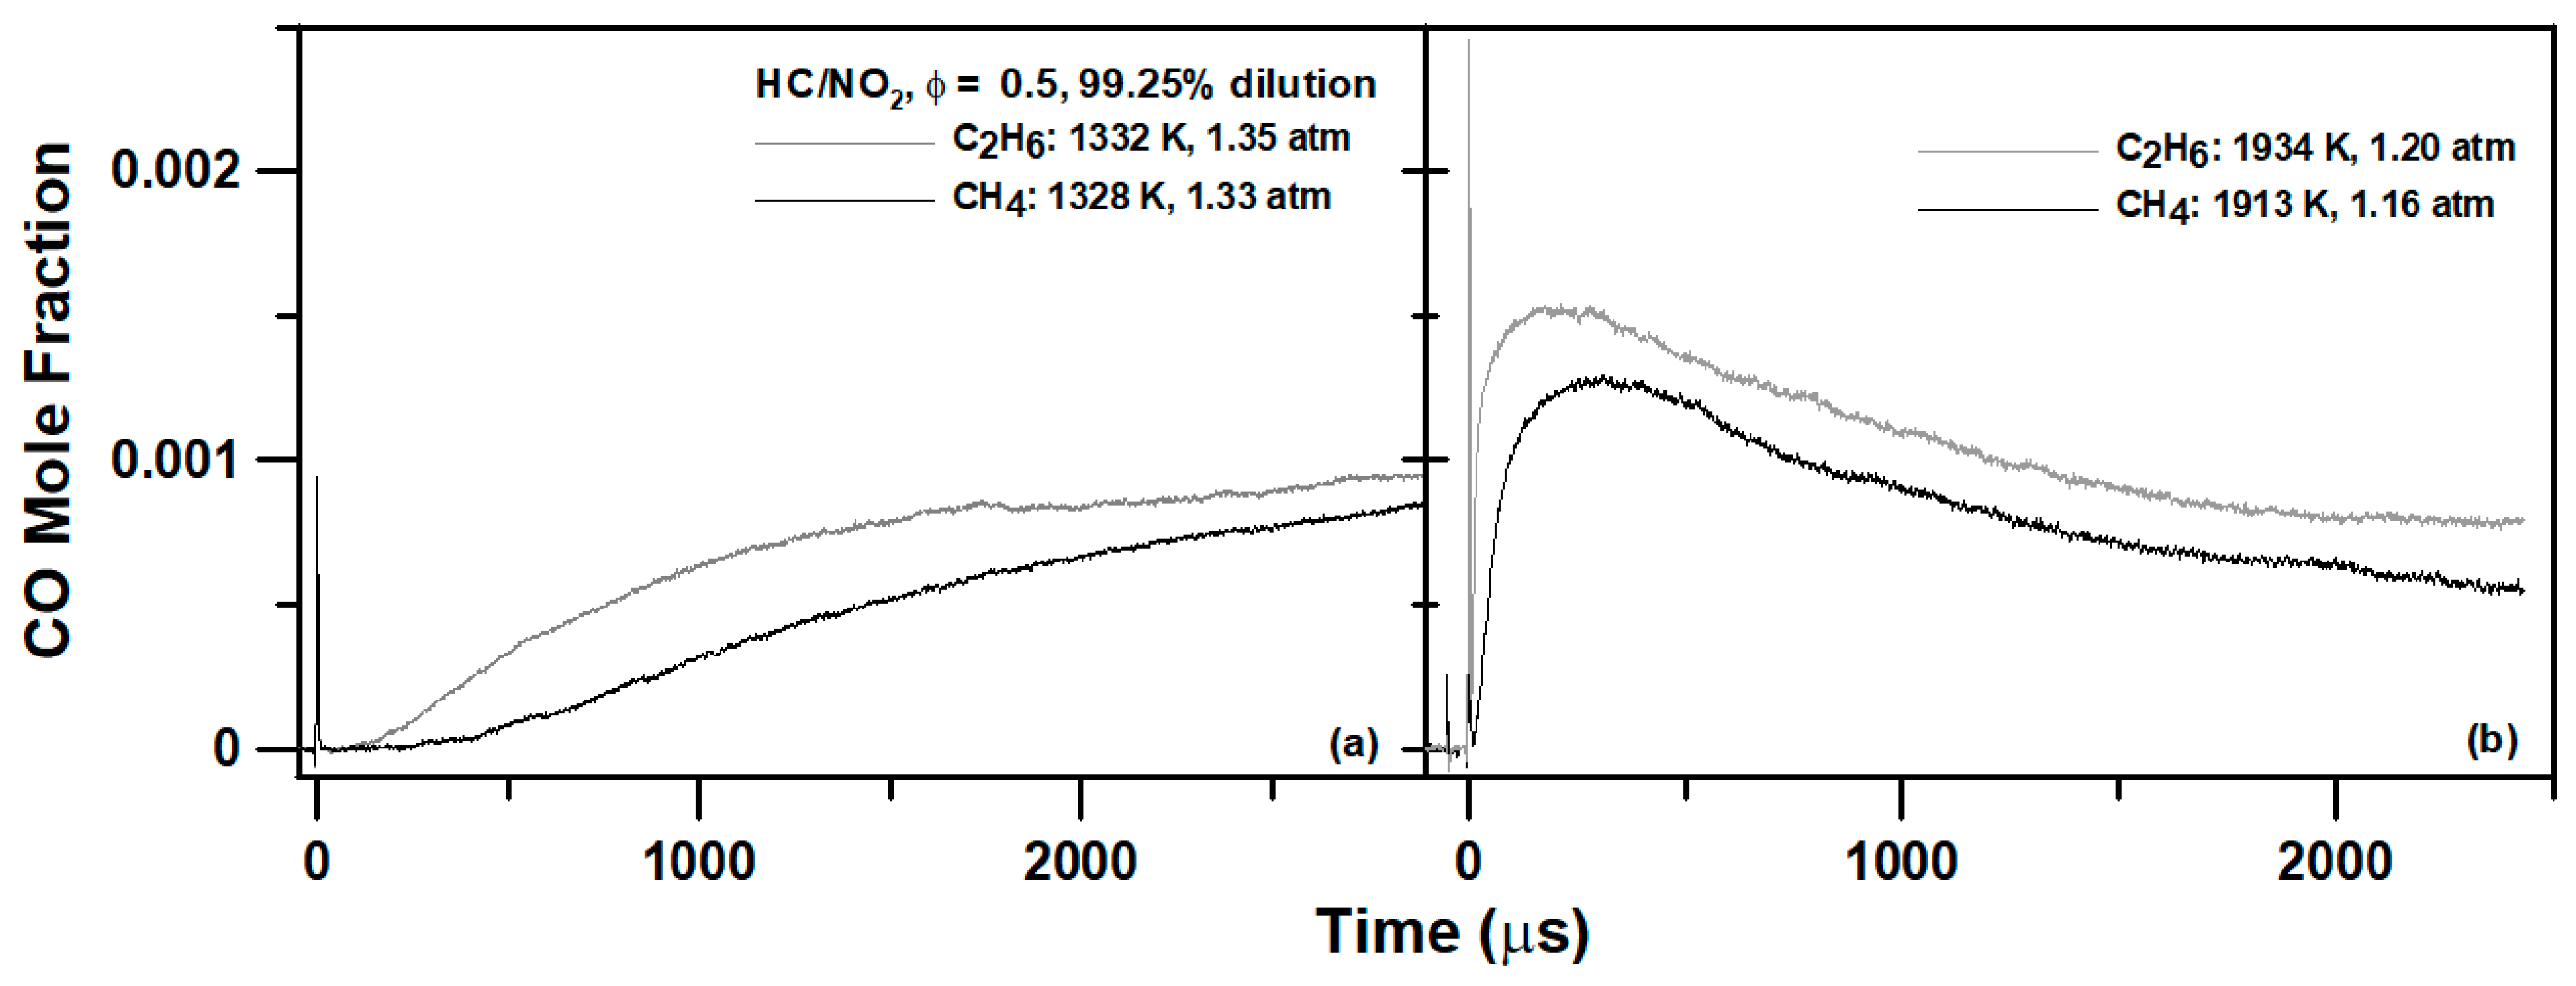
4. Experimental Results
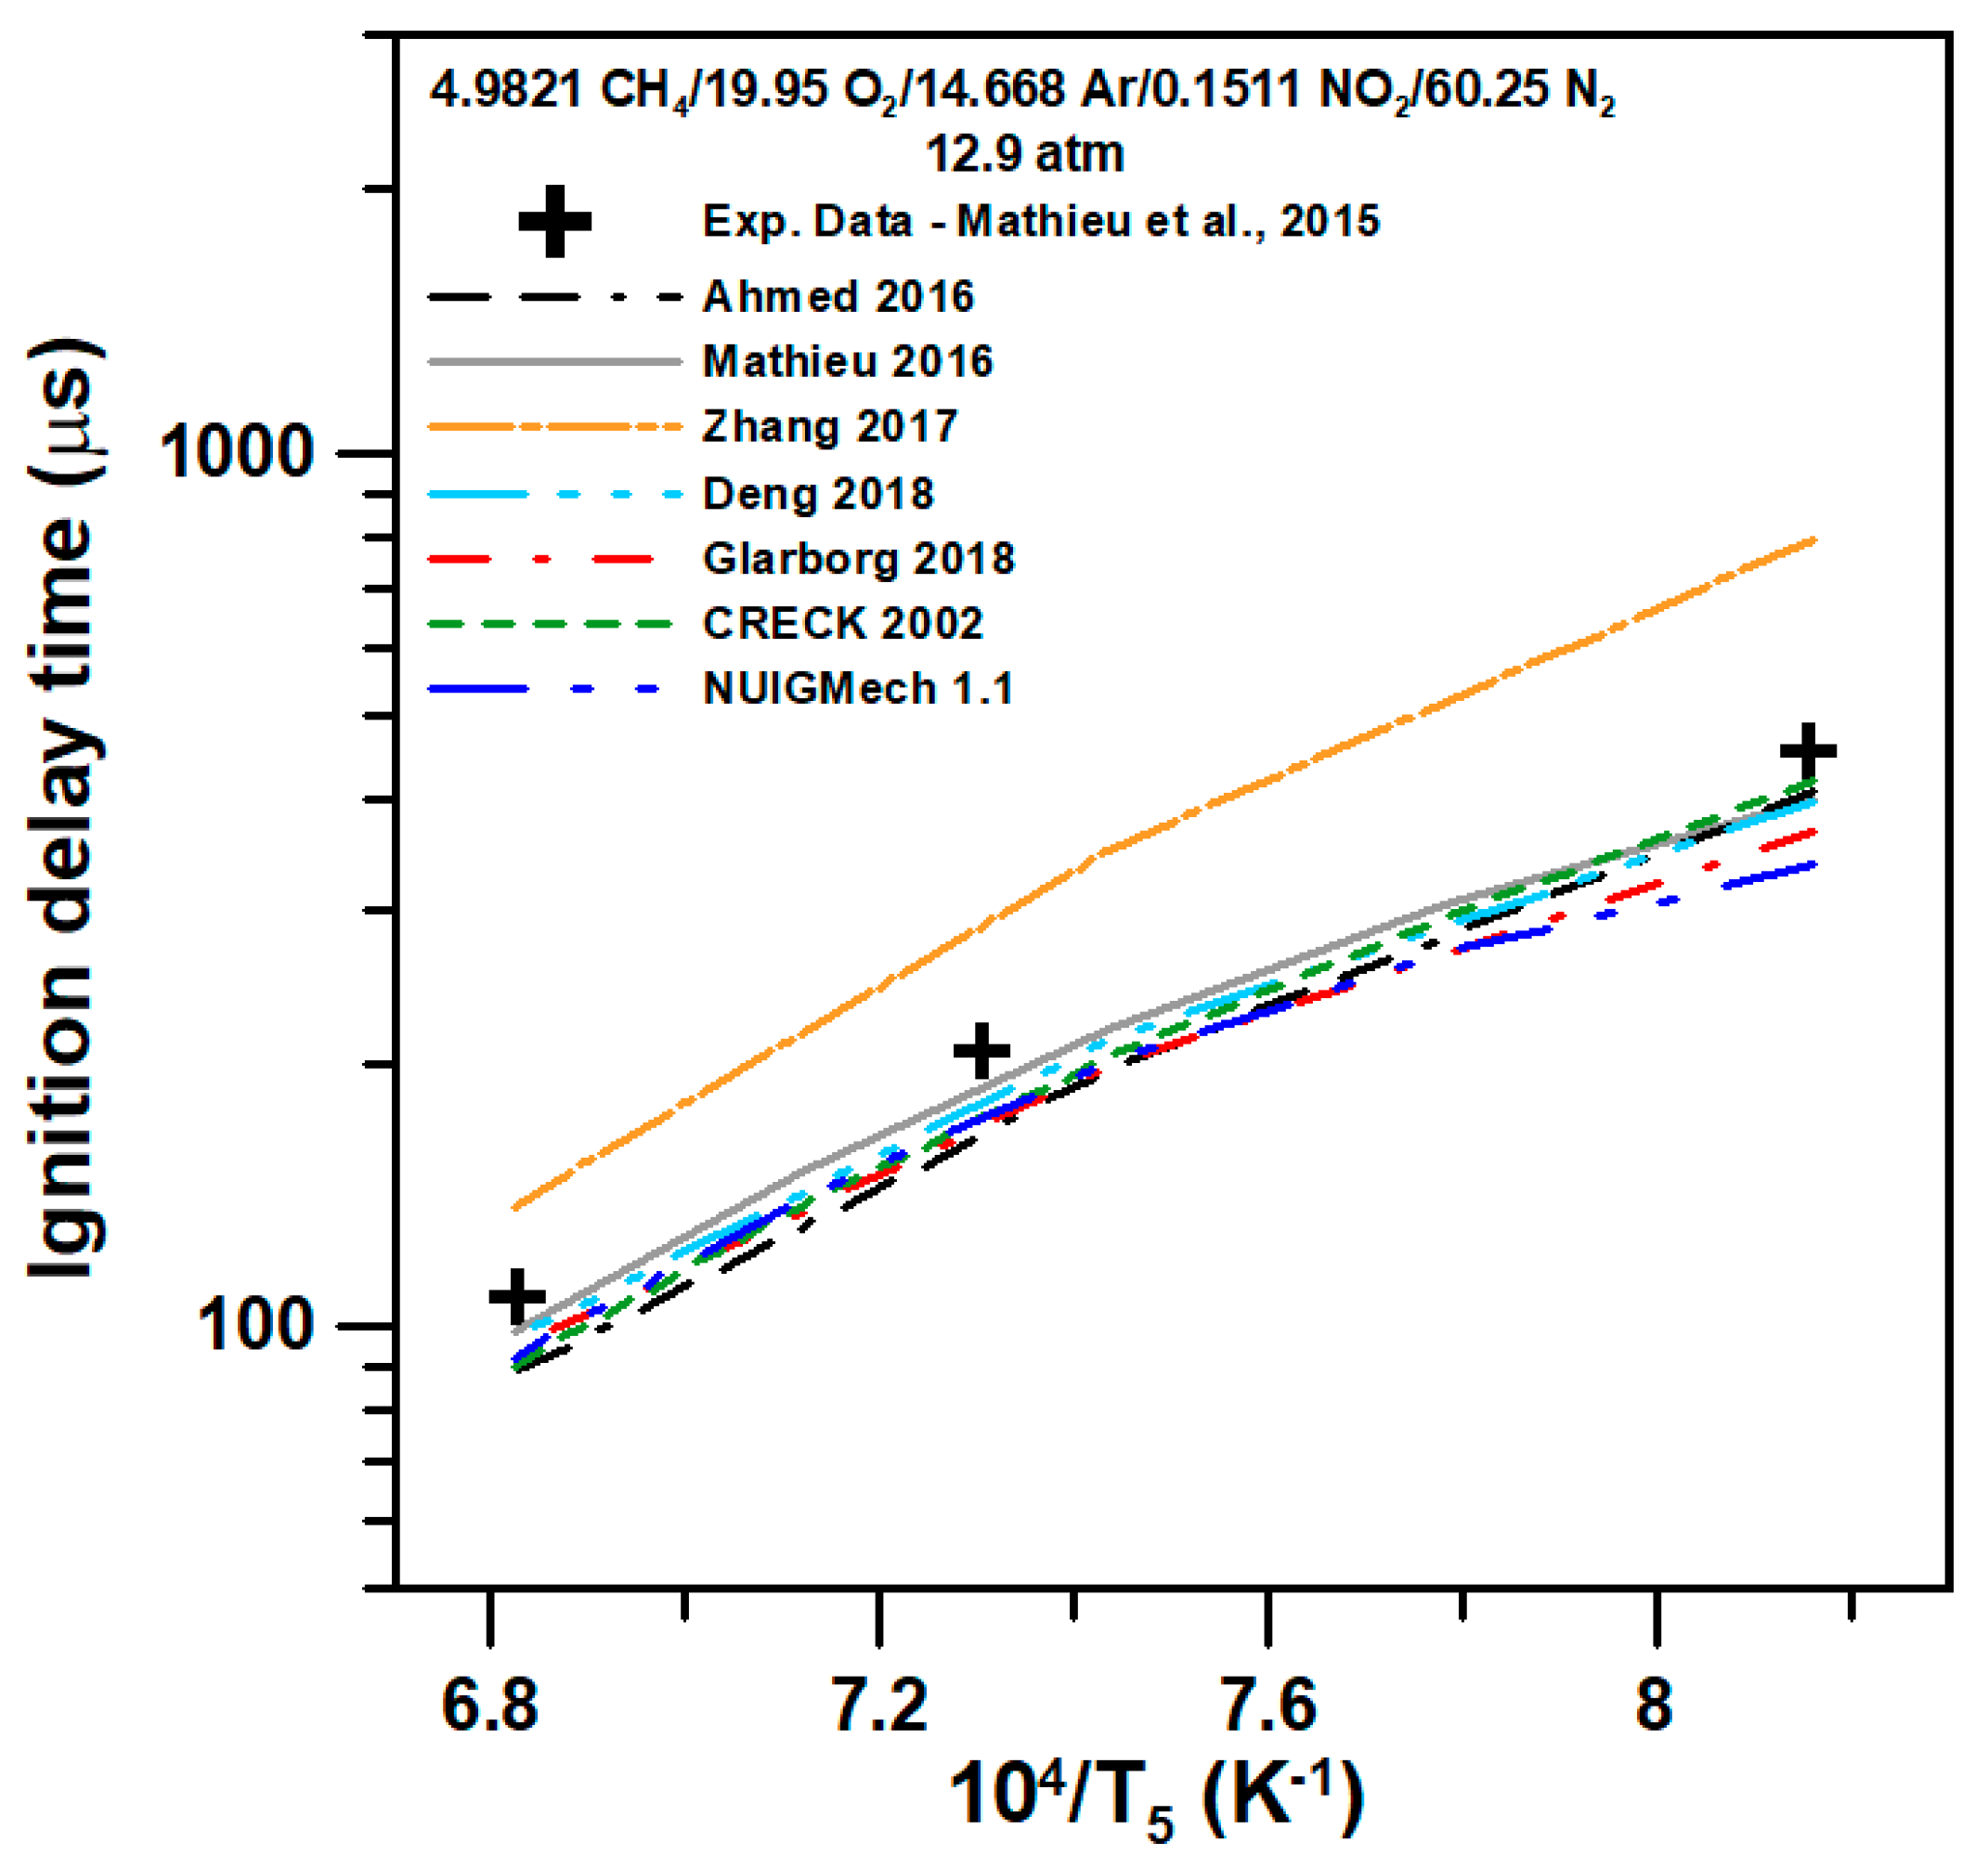
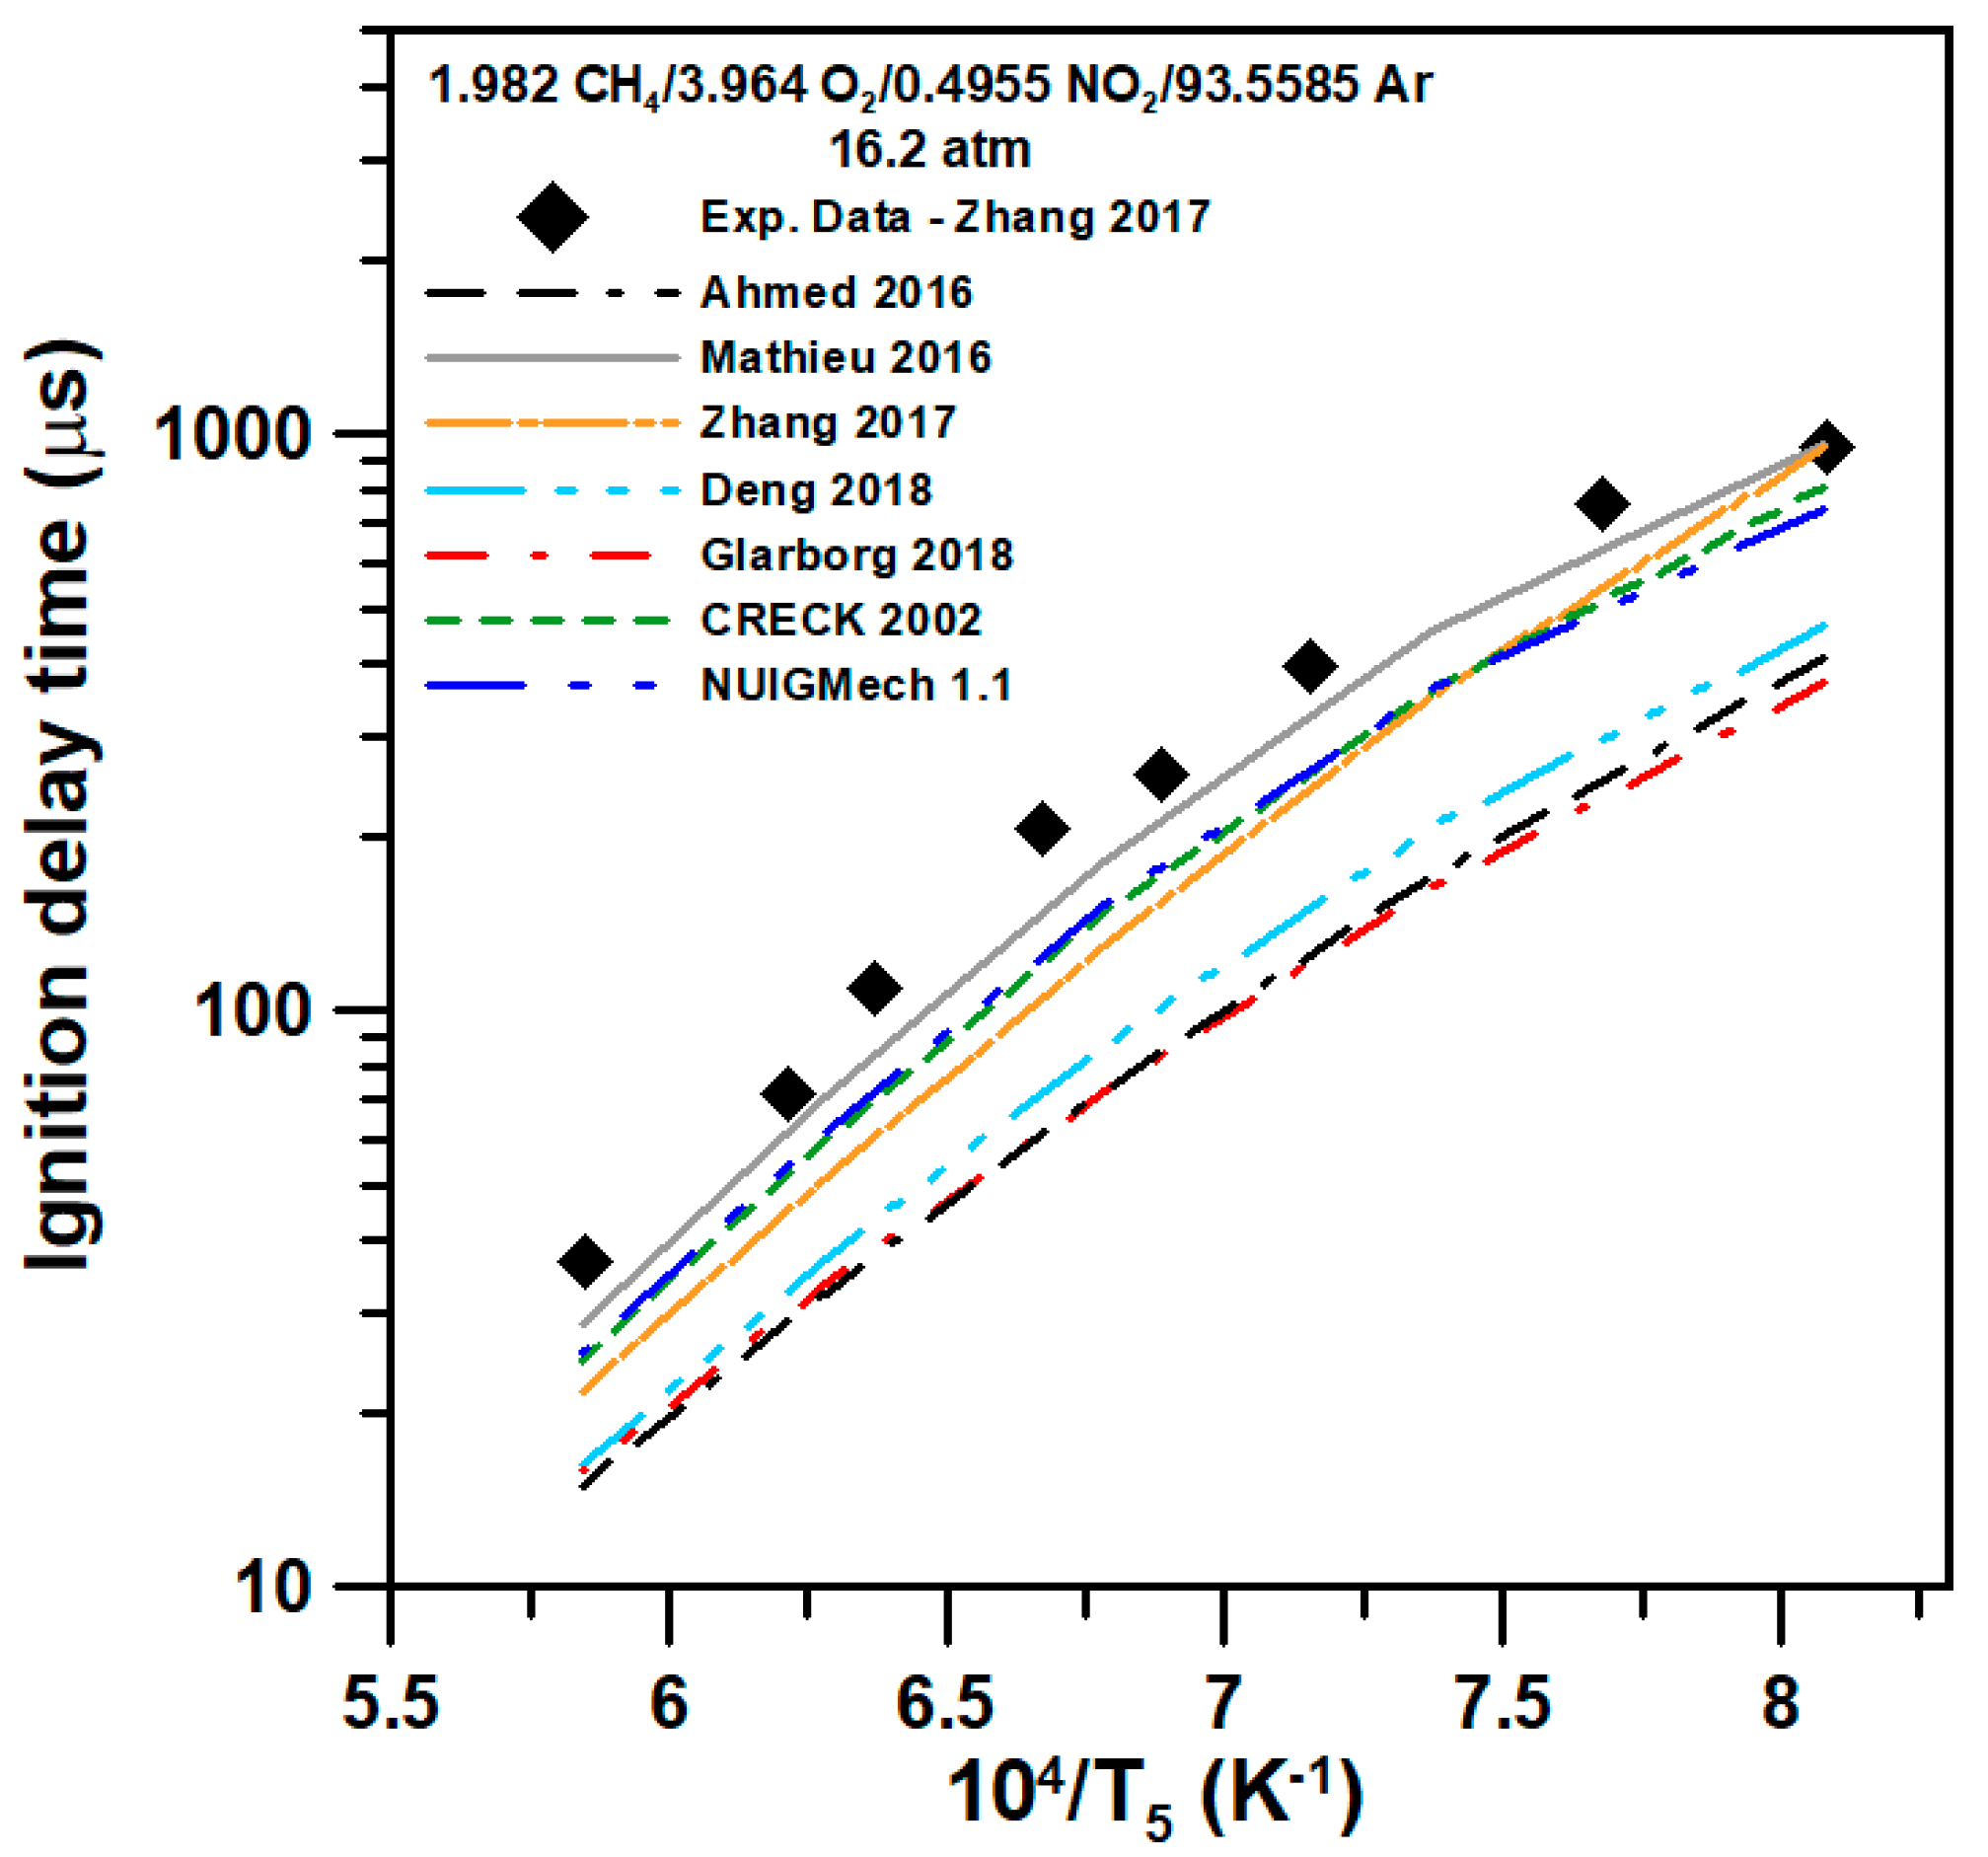
The CO time-history profiles obtained during the course of this study are visible in Figure 4 for (a) methane and (b) ethane. Both fuels show similar behavior: the increasing slope corresponding to the formation of CO, which becomes steeper as the temperature increases. In addition, the time at which the CO profile reaches an apparent plateau value, or a peak, is shortened as the temperature increases. Overall, within the test time of the shock tube and within the conditions investigated, the higher the temperature, the higher the maximum CO mole fraction. Note that for the highest temperatures investigated, above 1700 K, and especially above 1900 K, the CO profiles present a peak value before decreasing. For the coldest temperatures investigated, the peak value or plateau is not reached within the timeframe of the experiments.
The difference between the two hydrocarbons studied herein can be seen by comparing CO profiles obtained in very similar conditions as presented in Figure 5. At around 1330 K (Figure 5a) it can be seen that C2H6 is more reactive than CH4 as the CO formation starts about 300 µs earlier. The CO concentration also increases more rapidly, and C2H6 appears to produce more CO than CH4 under these conditions. For the highest temperature investigated, around 1924 K (Figure 5b), similar observations can be made. The two CO profiles are very similar in shape, but the one from C2H6 reaches its peak faster than the CO profile from CH4. Due to the fixed dilution between the two mixtures, the CO concentration remains higher for C2H6 over the entire timeframe of the experiment.

5. Model Comparison

A comparison of the models with selected data for methane is visible in Figure 6. As one can see, at a temperature of 1328 K (Figure 6a), the models are under-reactive and are too slow in predicting the CO formation. However, large variations can be observed amongst the models: the models from Ahmed et al. [25] and, to a lower extent, from Zhang et al. [26] are significantly under-reactive, causing the CO mole fraction to be much lower than the experimental one, by a factor of about 1.4, within the timeframe investigated. At the other extreme, the mechanisms of Fuller et al., Deng et al., and Mathieu et al. are slightly too slow at the beginning, but the predicted CO mole fraction is very close to the experimental one by the end of the experiment. The Glarborg model is the most reactive one at the beginning of the experiment, but the CO formation slows down past 1 ms, making the model diverge from the data past this time. The NUIGMech 1.1 and CRECK models have intermediate performance and fall in between the two extreme groups.
At 1451 K (Figure 6b), the Fuller, Mathieu, and Deng models are accurately predicting the final CO mole fraction reached at the end of the test time. At the beginning of the experiment, the Mathieu and Fuller models are the closest to the data, while the Deng one is slightly slower. After 500 µs, the Fuller model predicts a rate of CO formation that is faster than the Mathieu and Deng models, as well as the data. The Glarborg model is again the most reactive at the beginning of the experiment but it under-predicts the most the CO mole fraction toward the end of the experiment (by about 10%). The Ahmed model displays the opposite trend: least reactive model but predicts the largest amount of CO by the end of the experimental time, exceeding the experimental value by about 9%. Among the two base models, one can see that only CRECK predicts the CO mole fraction accurately. At 1565 K (Figure 6c), all models under-predict the CO mole fraction. The shape of the data is well captured by all models, but Fuller predicts a decrease in the CO mole fraction toward the end of the test time, which is not observed experimentally. Models are still under-reactive, with the Fuller and Mathieu mechanisms providing the most accurate reactivity. For the highest temperature investigated (Figure 6d), the peak in the CO profile is captured by all models with relatively accurate timing, although most models predict this peak to appear before the experimental one. The Mathieu and Fuller mechanisms predict the mole fraction at the peak with good accuracy, while other models under-predict the CO level by between 3% (Deng model) and 10% (Ahmed model). Past the peak, the Zhang model is the only one predicting the CO profile with high accuracy for the remainder of the experiment, although all models converge to a value similar to the experimental value at the end of the test time.
For the ethane results (Figure 7), it is visible for the 1332 K case (Figure 7a) that the Ahmed, Glarborg, and Zhang models are largely under-reactive and predict CO mole fractions that are significantly below the experimental values during the test time considered. The Mathieu and Deng models are very close to the data at the early stages of the experiment. After about 750 µs, the Deng model diverges and under-predicts the CO mole fraction, while the Mathieu model remains close to the experimental data. After 1 ms, the Fuller model converges with the Mathieu model and presents similar predictions.
At 1449 K (Figure 7b), the Fuller model is the closest to the data followed by the Mathieu model during the first millisecond. After this first millisecond, the base models (NUIGMech 1.1 and CRECK) present a CO mole fraction that is closer to the data than the Mathieu mechanism. The other hydrocarbon/NOx models considered herein are all under-reactive and under-predict the CO formation by a factor of up to about 1.6 for the Ahmed model. Similar observations can be made for the 1579 K case (Figure 7c), although the Zhang model is now closer to the best models, leaving the Ahmed and Glarborg models as the least accurate models in terms of both reactivity and CO mole fraction, the Ahmed model predicting a final CO mole fraction that is more than 5 times smaller than the experimental value.
For the highest temperature considered, 1934 K (Figure 7d), the predicted peak CO is too early for all models except the one from Glarborg. Only the Mathieu and Fuller models predict an accurate CO mole fraction at the peak, while the other models predict too small of a CO mole fraction. Note that past the peak, all models are similar and, while capturing well the shape of the CO profile, they all under-predict the CO mole fraction by about 15%.

6. Discussion

To explain the results obtained during this study, a numerical analysis was conducted. For this analysis, the Mathieu et al. model was selected as it consistently ranks the best or among the best models in Figure 1, Figure 2, Figure 6 and Figure 7. The model of Glarborg et al. was also used since, despite not being amongst the most accurate models, all NOx reactions used in this model were carefully reviewed and selected individually. It is also more recent that the Mathieu model.

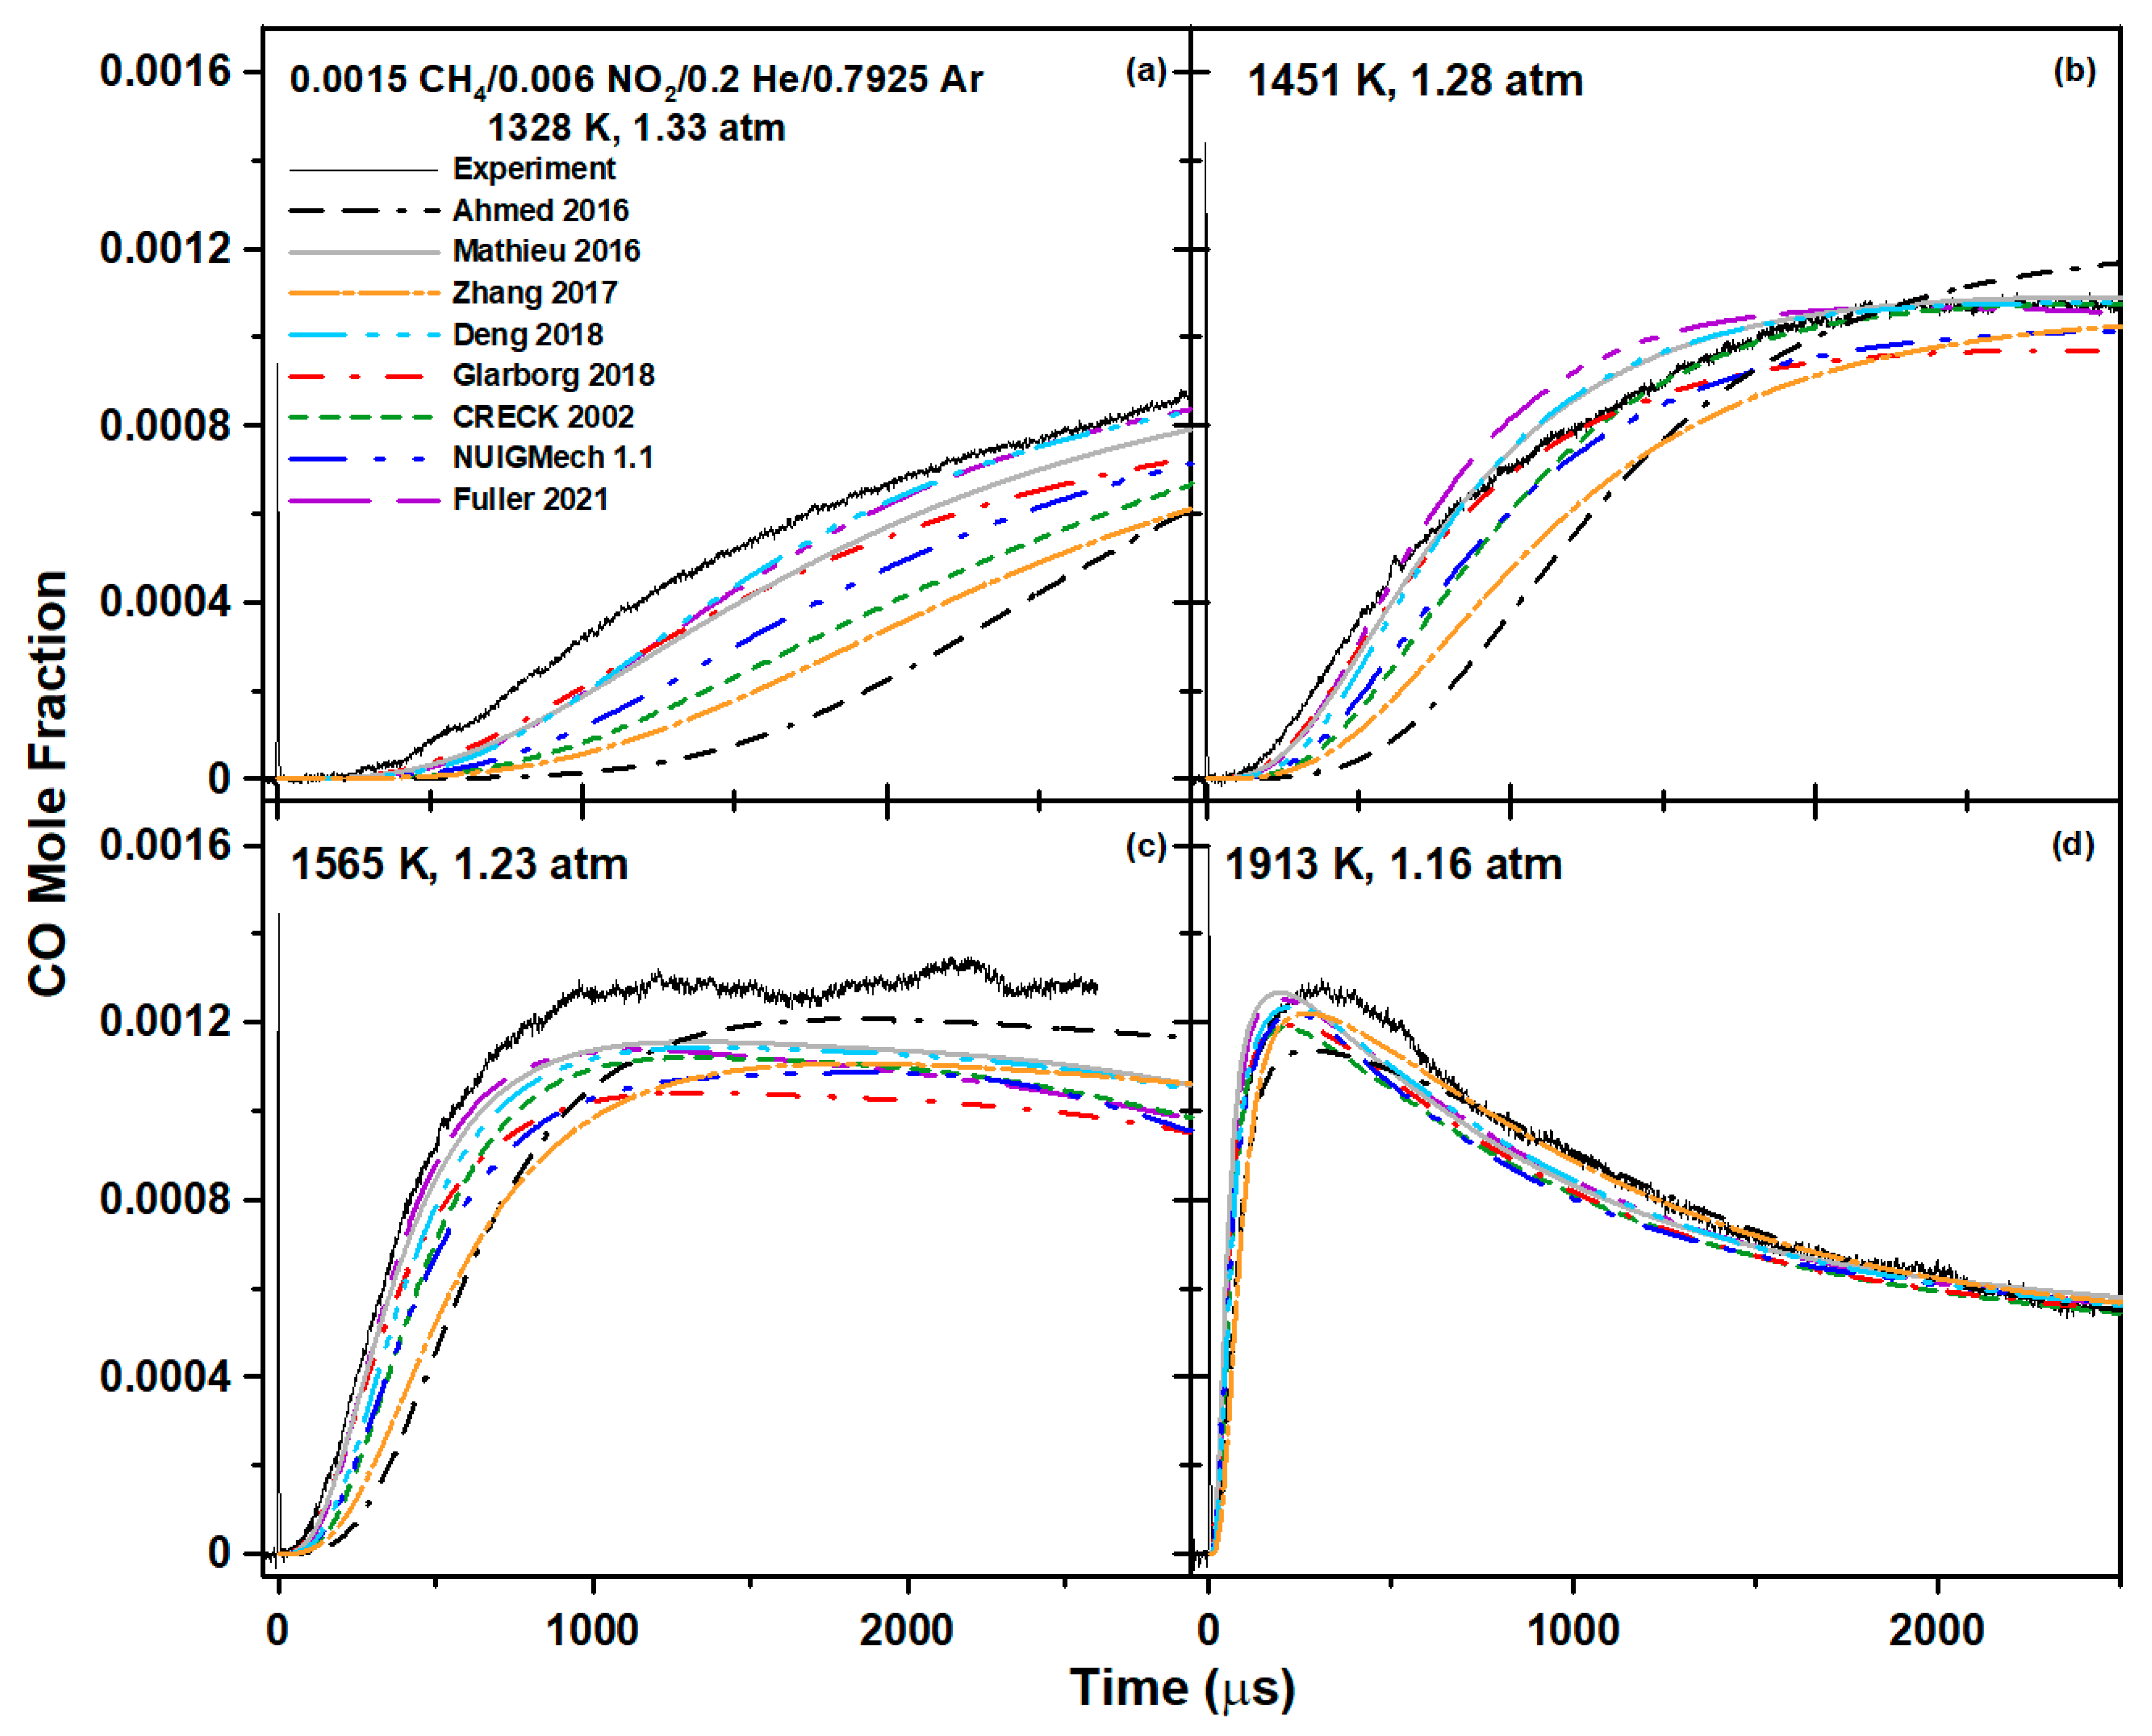
6.1. Methane Mixture
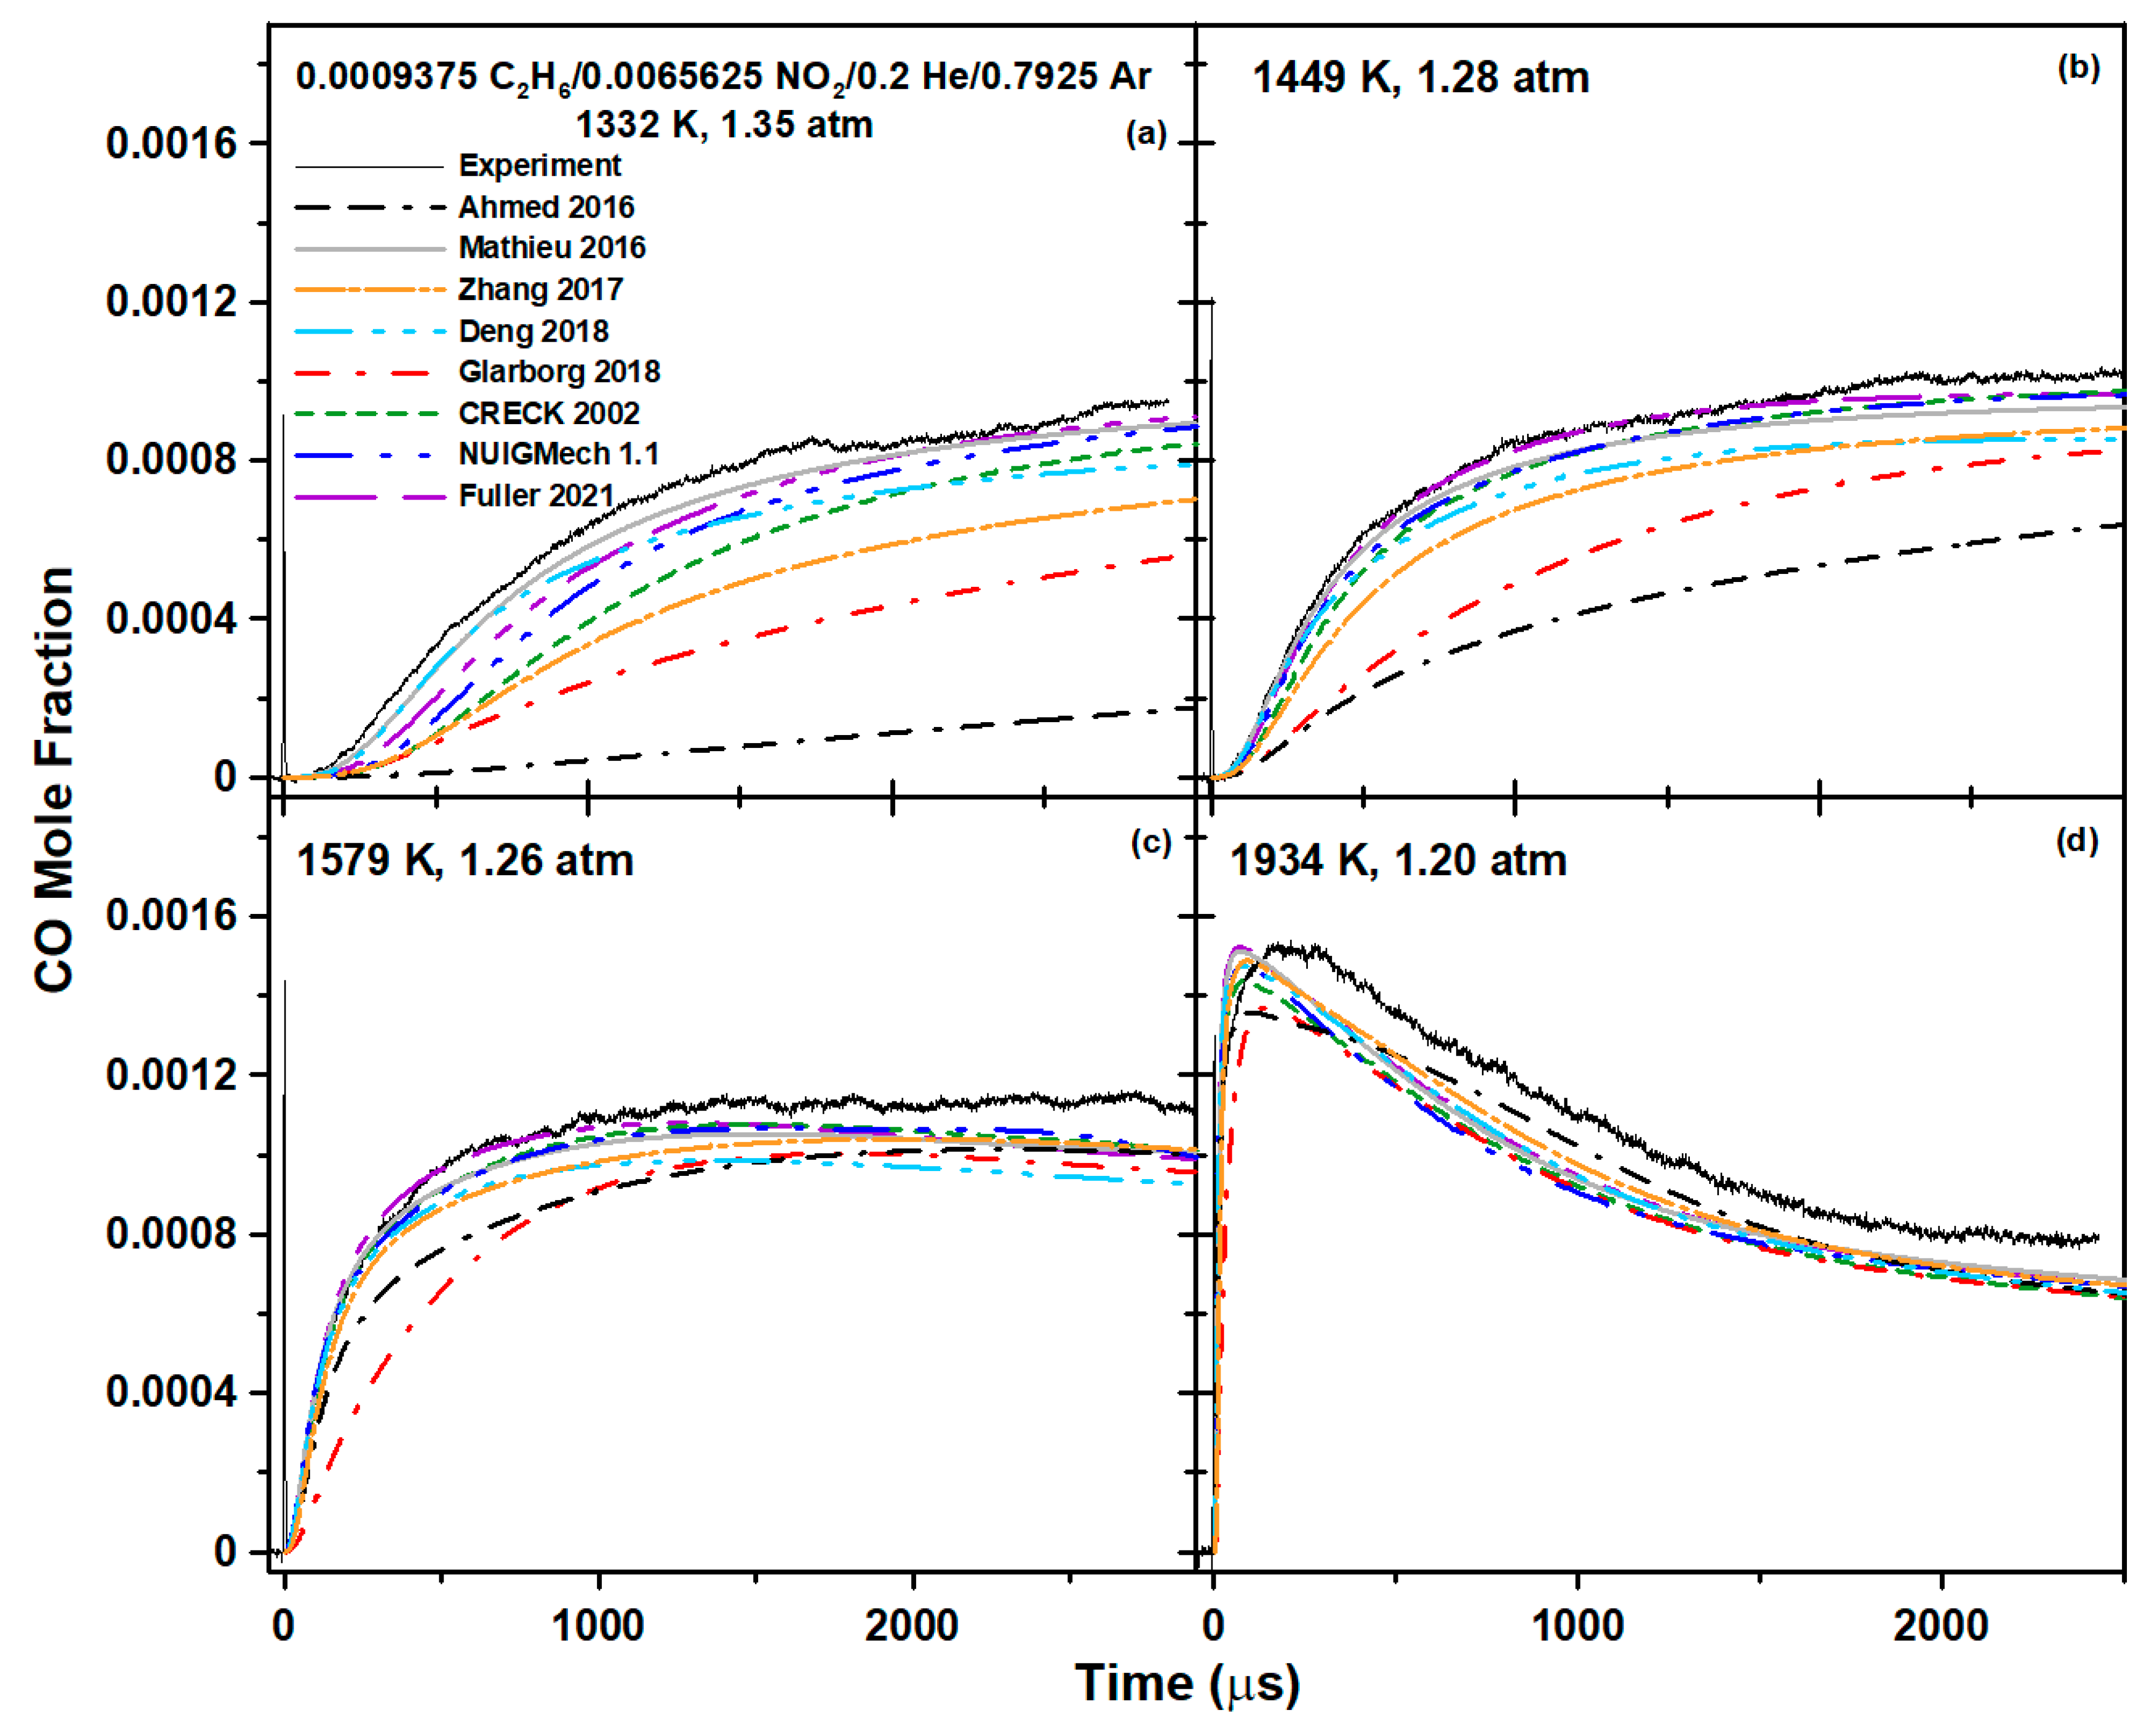
For the methane mixture, the Mathieu model shows that the reactivity is initiated by:
CH4 + NO2 ⇆ CH3 + HNO2
CH3+HONO ⇆ CH4 + NO2 (in reverse)
CH4 + O ⇆ CH3 + OH
with R1 largely dominating. Note that the HNO2 formed during R1 will rapidly isomerize into
HONO (HNO2 ⇆ HONO)
The O from R3 is essentially coming from
NO2 + NO2 ⇆ NO3 + NO
followed by
NO3 ⇆ NO2 + O
with a minor contribution from
NO + O (+M) ⇆ NO2 (+M) (in reverse)
After the reactivity is initiated, CO forms chiefly via the following sequence:
CH3 + NO2 ⇆ CH3O + NO
CH3O (+M) ⇆ CH2O + H (+M)
CH2O + OH ⇆ HCO + H2O
HCO + M ⇆ H + CO + M
note that a very small contribution comes from NOx interactions via (by order of importance):
HCO + NO2 ⇆ HONO + CO
HCO + NO ⇆ HNO + CO
HCO + NO2 ⇆ CO + NO + OH
For the highest temperatures, the reactivity is initiated by R7 followed by CH4 + O ⇆ CH3 + OH (R3) (followed by the sequence R8–R11 described above). Concerning the decrease in the CO profile observed at 1913 K (Figure 6d), the Mathieu model indicates that the reaction
CO + OH ⇆ CO2 + H
is chiefly responsible for this behavior, similar to regular hydrocarbon/O2 mixtures [37,38,39]. However, a small contribution from the following reactions is predicted (by order of importance):
NCO + H ⇆ CO + NH
NCO + NO ⇆ N2O + CO
HNCO + H ⇆ NH2 + CO
NCO + O ⇆ NO + CO
HCN + O ⇆ NH + CO
CN + O ⇆ CO + N
Concerning the Glarborg mechanism, the same reactions are involved (R1–R11), although
CH2O + OH ⇆ H + CO + H2O
is also contributing (this reaction is not present in the Mathieu mechanism). For the minor interactions with NOx for the CO formation, R12-R14 are similarly contributing moderately, but R23 is also predicted:
HCO + NO2 ⇆ HONO + CO
Likewise, for the highest temperature, predictions show that the R7 (NO + O (+M) ⇆ NO2 (+M) (in reverse))–R3 (CH4 + O ⇆ CH3 + OH) pathway is also initiating the oxidation process. In the area where the CO-to-CO2 conversion is observed, R15 also largely dominates, but reactions involving NOx seem even less important than for the Mathieu model. Here, only R16 (NCO + H ⇆ CO + NH) is predicted to have a very moderate effect.

6.2. Ethane Mixture

For ethane, the larger molecule induces a much more complex reaction scheme. According to the model from Mathieu et al., the oxidation is chiefly initiated by the thermal decomposition of C2H6:
2 CH3 (+M) ⇆ C2H6 (+M) (in reverse)
Additional initiation contribution comes from the H-abstraction by NO2:
C2H6 + NO2 ⇆ C2H5 + HNO2
which is then followed by R4 to form HONO. Subsequently, HONO rapidly decomposes to NO and OH via
HONO ⇆ OH + NO
and, to a lesser extent, by
C2H5 + HONO ⇆ C2H6 + NO2 (in reverse)
The CH3 produced from R24 then follows the R8–R11 pathway described for methane. Concerning NO2, the reactions R5–R7 are logically also present given that the conditions are essentially the same.
After this initiation phase, C2H6 is mostly consumed via C2H6 + OH ⇆ C2H5 + H2O, with OH mostly coming from R26. Once C2H5 is produced, it mostly produces CO via the following pathway (the reactions are listed by order of importance for a given molecule/radical):
C2H4 + H (+M) ⇆ C2H5 (+M) (in reverse)
C2H4 + OH ⇆ C2H3 + H2O
C2H4 + NO2 ⇆ C2H3 + HNO2
C2H3 + NO2 ⇆ NO + CH2CHO
C2H2 + H (+M) ⇆ C2H3 (+M) in reverse
C2H2 + OH ⇆ CH2CO + H
C2H2 + O ⇆ HCCO + H
CH2CHO (+M) ⇆ CH2CO + H (+M)
CH2CHO (+M) ⇆ CH3 + CO (+M)
CH2CHO + NO2 ⇆ CH2CO + HONO
CH2CHO + NO2 ⇆ CH2O + CO + NO
CH2CO + OH ⇆ HCCO + H2O
CH2CO + OH ⇆ CH2OH + CO
CH2OH (+M) ⇆ CH2O + H (+M)
CH2OH + NO2 ⇆ CH2O + HONO
HCCO + NO2 ⇆ HCNO + CO2
HCCO + NO ⇆ HCNO + CO
HCCO + NO ⇆ HCN + CO2
HCCO + OH ⇆ H2 + 2 CO
Note that R28 also competes with
C2H5 + NO2 ⇆ C2H5O + NO
followed by
C2H5O ⇆ CH3 + CH2O
with both fragments produced by R48 being part of the methane-to-CO pathway described above. For the highest temperature investigated (Figure 7d), the decomposition of ethane into methyl radicals (R24) largely dominates at the beginning of the computation. A very small contribution (accounting for about 5% of the C2H6 decomposition) is observed for C2H6 + O ⇆ C2H5 + OH, with O mostly coming from R7 (NO + O (+M) ⇆ NO2 (+M)). The subsequent reaction paths to CO follow the ones described above for CH4 (CH3 radical) and ethane (C2H5 radical). The CO decomposition area, past the peak, is subject to the same reactions as described before for methane (R15–21).
Concerning the Glarborg model, for the lowest temperatures, the NO2 still reacts via R5–R6 at the very beginning of the timescale considered (initiation phase). Note that R49: 2 NO2 ⇆ 2 NO + O2 is also relatively important. Ethane also mostly decomposes into CH3 fragments via R24 (which follows the pathway to CO described above for methane). However, the second most important reaction after R24 for C2H6 consumption is C2H6 + O ⇆ C2H5 + OH, which was not as important in the Mathieu et al. model at this stage. Past this initiation phase, C2H6 is mostly consumed via C2H6 + OH ⇆ C2H5 + H2O. Once C2H5 is formed, the pathway from C2 to CO is similar to the one described above for the Mathieu et al. model, but with some differences. First, the conversion from C2H4 to C2H3 via H abstraction by NO2 (R30) does not seem important for the Glarborg model. Similarly, the transition from C2H3 to C2H2 shows that the H abstraction by NO2 (R31) has a larger importance than R32 (C2H2 + H (+M) ⇆ C2H3 (+M) in reverse) in the Mathieu model, whereas the opposite is observed for the Glarborg model. The other reactions leading to CO appear to be the same between the two mechanisms. Similarly, for the highest temperature investigated (Figure 7d) the same main reactions are seen for the two models considered.
These results seem to indicate that the differences in predictions observed between these two models are due to the variations in the reaction rate coefficients used, at possibly both the base hydrocarbon/O2 and the hydrocarbon/NOx interactions level. For instance, a comparison of the CO profiles from the two models considered herein using a CH4/O2 mixture was made in Mathieu et al. [29]. It is visible in [29] that the CO profiles are similar in their shapes and CO levels, although a noticeable difference in terms of reactivity can be observed (the Glarborg model being less reactive). The difference in the CO level observed between the two models in Figure 6 is therefore likely due to the hydrocarbon/NOx interactions. A comparison of the rate coefficients for the reactions involved in the CO formation process for the two mechanisms was made. It was found that the rate coefficients for only 12 reactions (R5, R7, R12, R16–R21, R23, and R31–R32) over the 49 mentioned in this paper are identical. The other reactions present different rate coefficients or are present in one model only (R22, R41, and R46).
While different rate coefficients for some reactions might only lead to minor differences in the predictions, it is worth mentioning that, on the other hand, some reactions are very important for the results presented herein. The reactions pertaining to the base hydrocarbon/O2 chemistry will not be discussed here as they are beyond the scope of this work. However, it can be pointed out that the two modern generalist base models, NUIGMech 1.1 and CRECK 2002, for which the baseline chemistry was extensively validated, both present good predictions overall, stressing the importance of having a robust base chemistry for hydrocarbon/O2 interactions as a foundation.
Concerning the two models discussed, differences in the rate coefficients for reactions such as R1 (CH4 + NO2 ⇆ CH3 + HNO2), which appears to be the leading reaction for initiating the oxidation process in most of the temperature range investigated for the methane mixture, can only lead to differences between the models’ predictions. Concerning the ethane mixture, one can see in Figure 7 that the differences are larger between the two models than for the methane mixture (Figure 6). A careful analysis shows that all important reactions between C2 hydrocarbons (and their subsequent fragments) and NOx use different reaction rate coefficients between the two models (R25, R27, R30–R31, R37–R38, R42–R45, R47). This difference illustrates the need for the experimental results presented herein, so hydrocarbon/NOx models can be further validated, and reaction rate coefficients can be selected with higher confidence. The CO species profiles presented herein are excellent targets to further validate models as they present more stringent constraints to assess specific reaction rate coefficients. Such constraints are not typically offered by global combustion parameters such as ignition delay time or laminar flame speed data.

7. Conclusions

During this study, the oxidation of well-studied hydrocarbons, methane and ethane, was performed in mixtures in excess of NO2 and observed by measuring CO profiles. These data allowed for probing the complex interactions between these hydrocarbons and NOx and are the first of their kind. Several modern detailed kinetics mechanisms from the literature were compared to these new data, and most of them are not accurate enough to predict the results, especially for ethane.
While the two models used for the numerical analysis predicted essentially the same reaction pathways from the initial hydrocarbons to CO, the numerical analysis showed the importance for accurate predictions from the base chemistry as well as the right selection of rate coefficients for the reactions involving NOx. This observation is especially true for ethane, for which larger discrepancies between the models and the data, as well as between the models, were observed.
Further work using the same method with unsaturated (C2H4, C2H2), larger (C3H8, butane isomers, etc.), or different classes (aromatics, alcohols, etc.) of hydrocarbons would be necessary to better comprehend the interactions between NOx and fuels for a large number of applications and fuels (natural gas, gasoline, kerosene, diesel, etc.). The present results show that the discrepancies between the models and between the models and the data are larger for the experiments conducted below 1500 K, which indicates that future experiments should as much as possible be conducted below this temperature.

Author Contributions

Conceptualization, O.M.; Experimental investigation, S.P.C. and O.M.; data curation, S.A.A.; writing—original draft preparation, O.M.; writing—review and editing, E.L.P.; supervision, E.L.P.; project administration, E.L.P.; funding acquisition, O.M. and E.L.P. All authors have read and agreed to the published version of the manuscript.

Funding

This research was funded by the National Science Foundation (Award # 2037795). Additional support was provided by the TEES (Texas A&M Engineering Experiment Station) Turbomachinery Laboratory and by King Fahd University of Petroleum & Minerals through the Saudi Arabian Cultural Mission in the form of fellowship funding for S. Alturaifi (Fellowship No. 1440/10079/9).

Institutional Review Board Statement

Not applicable.

Informed Consent Statement

Not applicable.

Data Availability Statement

Data are available from the corresponding author upon request.

Acknowledgments

The authors also want to thank Mark Fuller for performing the Cantera calculations with his mechanism for this study.

Conflicts of Interest

The authors declare no conflict of interest.

References

  1. Santner, J.; Ahmed, S.F.; Farouk, T.; Dryer, F.L. Computational Study of NOx Formation at Conditions Relevant to Gas Turbine Operation: Part 1. Energy Fuels 2016, 30, 6745–6755. [Google Scholar] [CrossRef]
  2. Glarborg, P.; Miller, J.A.; Ruscic, B.; Klippenstein, S.J. Modeling nitrogen chemistry in combustion. Prog. Energy Combust. Sci. 2018, 67, 31–68. [Google Scholar] [CrossRef] [Green Version]
  3. Dayma, G.; Dagaut, P. Effects of air contamination on the combustion of hydrogen—effect of NO and NO2 addition on hydrogen ignition and oxidation kinetics. Combust. Sci. Technol. 2006, 178, 1999–2024. [Google Scholar] [CrossRef]
  4. Mével, R.; Javoy, S.; Lafosse, F.; Chaumeix, N.; Dupré, G.; Paillard, C.-E. Hydrogen–nitrous oxide delay times: Shock tube experimental study and kinetic modelling. Proc. Combust. Inst. 2009, 32, 359–366. [Google Scholar] [CrossRef]
  5. Mével, R.; Lafosse, F.; Chaumeix, N.; Dupré, G.; Paillard, C.-E. Spherical expanding flames in H2–N2O–Ar mixtures: Flame speed measurements and kinetic modeling. Int. J. Hydrogen Energy 2009, 34, 9007–9018. [Google Scholar] [CrossRef]
  6. Mathieu, O.; Levacque, A.; Petersen, E.L. Effects of N2O additions on the ignition of H2-O2 mixtures: Experimental and detailed kinetic modeling study. Int. J. Hydrogen Energy 2012, 37, 15393–15405. [Google Scholar] [CrossRef]
  7. Mathieu, O.; Levacque, A.; Petersen, E.L. Effects of NO2 addition on hydrogen ignition behind reflected shock waves. Proc. Combust. Inst. 2013, 34, 633–640. [Google Scholar] [CrossRef]
  8. Mulvihill, C.R.; Mathieu, O.; Petersen, E.L. The Unimportance of the Reaction H2 + N2O = H2O + N2: A Shock-tube Study Using H2O Time Histories and Ignition Delay Times. Combust. Flame 2018, 196, 478–486. [Google Scholar] [CrossRef]
  9. Mulvihill, C.R.; Mathieu, O.; Petersen, E.L. H2O time histories in the H2-NO2 system for validation of NOx hydrocarbon kinetics mechanisms. Int. J. Chem. Kin. 2019, 51, 669–678. [Google Scholar] [CrossRef]
  10. Dagaut, P.; Nicole, A. Experimental study and detailed kinetic modeling of the effect of exhaust gas on fuel combustion: Mutual sensitization of the oxidation of nitric oxide and methane over extended temperature and pressure ranges. Combust. Flame 2005, 140, 161–171. [Google Scholar] [CrossRef]
  11. Rasmussen, C.L.; Rasmussen, A.E.; Glarborg, P. Sensitizing effects of NOx on CH4 oxidation at high pressure. Combust. Flame 2008, 154, 529–545. [Google Scholar] [CrossRef]
  12. Gersen, S.; Mokhov, A.V.; Darmeveil, J.H.; Levinsky, H.B.; Glarborg, P. Ignition-promoting effect of NO2 on methane, ethane and methane/ethane mixtures in a rapid compression machine. Proc. Combust. Inst. 2011, 33, 433–440. [Google Scholar] [CrossRef]
  13. Mathieu, O.; Pemelton, J.M.; Bourque, G.; Petersen, E.L. Shock-Induced Ignition of Methane Sensitized by NO2 and N2O. Combust. Flame 2015, 162, 3053–3070. [Google Scholar] [CrossRef] [Green Version]
  14. Marrodán, S.Y.L.; Vina, N.; Herbinet, O.; Assaf, E.; Fittschen, C.; Stagni, A.; Faravelli, T.; Alzueta, M.U.; Battin-Leclerc, F. The sensitizing effects of NO2 and NO on methane low temperature oxidation in a jet stirred reactor. Proc. Combust. Inst. 2019, 37, 667–675. [Google Scholar]
  15. Amrit BSahu, A.B.; El-Sabor Mohamed, A.A.; Panigrahy, S.; Saggese, C.; Patel, V.; Bourque, G.; Pitz, W.J.; Curran, H.J. An experimental and kinetic modeling study of NOx sensitization on methane autoignition and oxidation. Combust. Flame 2021, 111746, in press. [Google Scholar] [CrossRef]
  16. Dagaut, P.; Mathieu, O.; Nicolle, A.; Dayma, G. Experimental study and detailed kinetic modeling of the mutual sensitization of the oxidation of nitric oxide, ethylene and ethane. Combust. Sci. Technol. 2005, 177, 1767–1791. [Google Scholar] [CrossRef]
  17. Giménez-López, J.; Alzueta, M.U.; Rasmussen, C.T.; Marshall, P.; Glarborg, P. High pressure oxidation of C2H4/NO mixtures. Proc. Combust. Inst. 2011, 33, 449–457. [Google Scholar] [CrossRef]
  18. Herzler, J.; Naumann, C. Shock Tube Study of the Influence of NOx on the Ignition Delay Times of Natural Gas at High Pressure. Combust. Sci. Technol. 2012, 184, 1635–1650. [Google Scholar] [CrossRef] [Green Version]
  19. Mével, R.; Shepherd, J.E. gnition delay-time behind reflected shock waves of small hydrocarbons–nitrous oxide(–oxygen) mixtures. Shock Waves 2015, 25, 217–229. [Google Scholar] [CrossRef]
  20. Deng, F.; Zhang, Y.; Sun, W.; Huang, W.; Zhao, Q.; Qin, X.; Yang, F.; Huang, Z. Towards a Kinetic Understanding of the NOx Sensitization Effect on Unsaturation Hydrocarbons: A Case Study of Ethylene/Nitrogen Dioxide Mixtures. Proc. Combust. Inst. 2018, 37, 719–726. [Google Scholar] [CrossRef]
  21. Marshall, P.; Leung, C.; Gimenez-Lopez, J.; Rasmussen, C.T.; Hashemi, H.; Glarborg, P.; Abian, M.; Alzueta, M.U. The C2H2 + NO2 reaction: Implications for high pressure oxidation of C2H2/NOx mixtures. Proc. Combust. Inst. 2019, 37, 469–476. [Google Scholar] [CrossRef] [Green Version]
  22. Mathieu, O.; Mulvihill, C.R.; Petersen, E.L.; Curran, H.J. NOx-hydrocarbon kinetics model validation using measurements of H2O in shock-heated CH4/C2H6 mixtures with NO2 as oxidant. J. Eng. Gas Turb. Pow. 2019, 141, 41007. [Google Scholar] [CrossRef]
  23. Fuller, M.E.; Morsch, P.; Goldsmith, F.; Heufer, K.A. The Impact of NOx Addition on the Ignition Behavior of N-Pentane. Chem. Eng. Ind. Chem. 2021, in press. [Google Scholar] [CrossRef]
  24. Mathieu, O.; Giri, B.; Agard, A.R.; Adams, T.N.; Mertens, J.D.; Petersen, E.L. Nitromethane ignition behind reflected shock waves: Experimental and numerical study. Fuel 2016, 182, 597–612. [Google Scholar] [CrossRef] [Green Version]
  25. Ahmed, S.F.; Santner, J.; Dryer, F.L.; Padak, B.; Farouk, T.I. Computational Study of NOx Formation at Conditions Relevant to Gas Turbine Operation, Part 2: NOx in High Hydrogen Content Fuel Combustion at Elevated Pressure. Energy Fuels 2016, 30, 7691–7703. [Google Scholar] [CrossRef]
  26. Zhang, X.; Ye, W.; Shi, J.C.; Wu, X.J.; Zhang, R.T.; Luo, S.N. Shock-Induced Ignition of Methane, Ethane, and Methane/Ethane Mixtures Sensitized by NO2. Energy Fuels 2017, 31, 12780–12790. [Google Scholar] [CrossRef]
  27. Baigmohammadi, M.; Patel, V.; Nagaraja, S.; Ramalingam, A.; Martinez, S.; Panigrahy, S.; Mohamed, A.; Somers, K.P.; Burke, U.; Heufer, K.A.; et al. Comprehensive experimental and simulation study of the ignition delay time characteristics of binary blended methane, ethane, and ethylene over a wide range of temperature, pressure, equivalence ratio, and dilution. Energy Fuels 2020, 34, 8808–8823. [Google Scholar] [CrossRef]
  28. Ranzi, E.; Cavallotti, C.; Cuoci, A.; Frassoldati, A.; Pelucchi, M.; Faravelli, T. New reaction classes in the kinetic modeling of low temperature oxidation of n-alkanes. Combust. Flame 2015, 162, 1679–1691. [Google Scholar] [CrossRef]
  29. Mathieu, O.; Chaumeix, N.; Yamamoto, Y.; Abid, S.; Paillard, C.-E.; Tezuka, T.; Nakamura, H.; Mulvihill, C.R.; Petersen, E.L. Nitromethane Pyrolysis in Shock Tubes and a Micro Flow Reactor with a Controlled Temperature Profile. Proc. Combust. Inst. 2021, 38, 1007–1015. [Google Scholar] [CrossRef]
  30. Annesley, C.J.; Randazzo, J.B.; Klippenstein, S.J.; Harding, L.B.; Jasper, A.W.; Georgievskii, Y.; Ruscic, B.; Tranter, R.S. Thermal Dissociation and Roaming Isomerization of Nitromethane: Experiment and Theory. J. Phys. Chem. A 2015, 119, 7872–7893. [Google Scholar] [CrossRef]
  31. Mathieu, O.; Mulvihill, C.R.; Petersen, E.L. Shock tube water time-histories and ignition delay time measurements for H2S near atmospheric pressure. Proc. Combust. Inst. 2017, 36, 4019–4027. [Google Scholar] [CrossRef] [Green Version]
  32. Mathieu, O.; Mulvihill, C.R.; Petersen, E.L. Assessment of modern detailed kinetics mechanisms to predict CO formation from methane combustion using shock-tube laser-absorption measurements. Fuel 2019, 236, 1164–1180. [Google Scholar] [CrossRef]
  33. Nauclér, J.D.; Nilsson, E.J.K.; Konnov, A.A. Laminar burning velocity of nitromethane + air flames: A comparison of flat and spherical flames. Combust. Flame 2015, 162, 3803–3809. [Google Scholar] [CrossRef]
  34. Ren, W.; Farooq, A.; Davidson, D.F.; Hanson, R.K. CO concentration and temperature sensor for combustion gases using quantum-cascade laser absorption near 4.7 μm. App. Phys. B 2012, 107, 849–860. [Google Scholar] [CrossRef]
  35. Mulvihill, C.R.; Alturaifi, S.A.; Petersen, E.L. High-temperature He- and O2-broadening of the R(12) line in the 10 band of carbon monoxide. J. Quant. Spectrosc. Radiat. Transf. 2018, 217, 432–439. [Google Scholar] [CrossRef]
  36. Rothman, L.S.; Jacquemart, D.; Barbe, A.; Benner, D.C.; Birk, M.; Brown, L.R.; Carleer, M.R.; Chackerian, C.; Chance, K.; Coudert, L.H.; et al. The HITRAN 2004 molecular spectroscopic database. J. Quant. Spectrosc. Radiat. Transf. 2005, 96, 139–204. [Google Scholar] [CrossRef] [Green Version]
  37. Alturaifi, S.A.; Mulvihill, C.R.; Mathieu, O.; Petersen, E.L. Speciation measurements in shock tubes for validation of complex kinetics mechanisms: Application to 2-Methyl-2-Butene oxidation. Combust. Flame 2021, 225, 196–213. [Google Scholar] [CrossRef]
  38. Mulvihill, C.R.; Keesee, C.L.; Sikes, T.; Teixeira, R.S.; Mathieu, O.; Petersen, E.L. Ignition delay times, laminar flame speeds, and species time-histories in the H2S/CH4 system at atmospheric pressure. Proc. Combust. Inst. 2019, 37, 735–742. [Google Scholar] [CrossRef]
  39. Mathieu, O.; Cooper, S.P.; Alturaifi, S.A.; Mulvihill, C.R.; Atherley, T.M.; Petersen, E.L. Shock-Tube Laser Absorption Measurements of CO and H2O during Iso-Octane Combustion. Energy Fuels 2020, 34, 7533–7544. [Google Scholar] [CrossRef]
Figure 1. Comparison of ignition delay time measurements from Mathieu et al. [13] with predictions from literature models.
Fuels 03 00001 g001
Figure 2. Comparison of ignition delay time measurements from Zhang et al. [26] with predictions from literature models.
Fuels 03 00001 g002
Figure 3. Schematic of the laser diagnostic used during this study to measure the CO concentration behind reflected shock waves.
Fuels 03 00001 g003
Figure 4. CO profiles for (a) methane and (b) ethane obtained during the course of this study.
Fuels 03 00001 g004
Figure 5. Comparison between the CO profiles from methane and ethane for similar conditions at around (a) 1330 K and (b) 1924 K.
Fuels 03 00001 g005
Figure 6. Comparison between experimental CO profiles and predictions of detailed kinetics models from the literature for a 0.0015 CH4/0.006 NO2/0.2 He/0.7925 Ar mixture at around 1.2 atm and for various temperatures: (a) 1328 K, (b) 1451 K, (c) 1565 K, and (d) 1913 K.
Fuels 03 00001 g006
Figure 7. Comparison between experimental CO profiles and predictions of detailed kinetics models from the literature for a 0.0009375 C2H6/0.006 NO2/0.2 He/0.7925 Ar mixture at around 1.2 atm and for various temperatures: (a) 1332 K, (b) 1449 K, (c) 1579 K, and (d) 1934 K.
Fuels 03 00001 g007
Table 1. Mixtures and conditions investigated during this study.
Mixture Composition (Mol. Fraction)T5 (K)P5 (atm)
0.0015 CH4/0.006 NO2/0.2 He/0.7925 Ar1213–19131.16–1.37
0.0009375 C2H6/0.0065625 NO2/0.2 He/0.7925 Ar1109–19341.20–1.53
Publisher’s Note: MDPI stays neutral with regard to jurisdictional claims in published maps and institutional affiliations.

