4.1. Analysis of the Electromotive Force Characteristics of Oxygen Sensors
Stepwise cooling tests were conducted separately on the Bi/Bi
2O
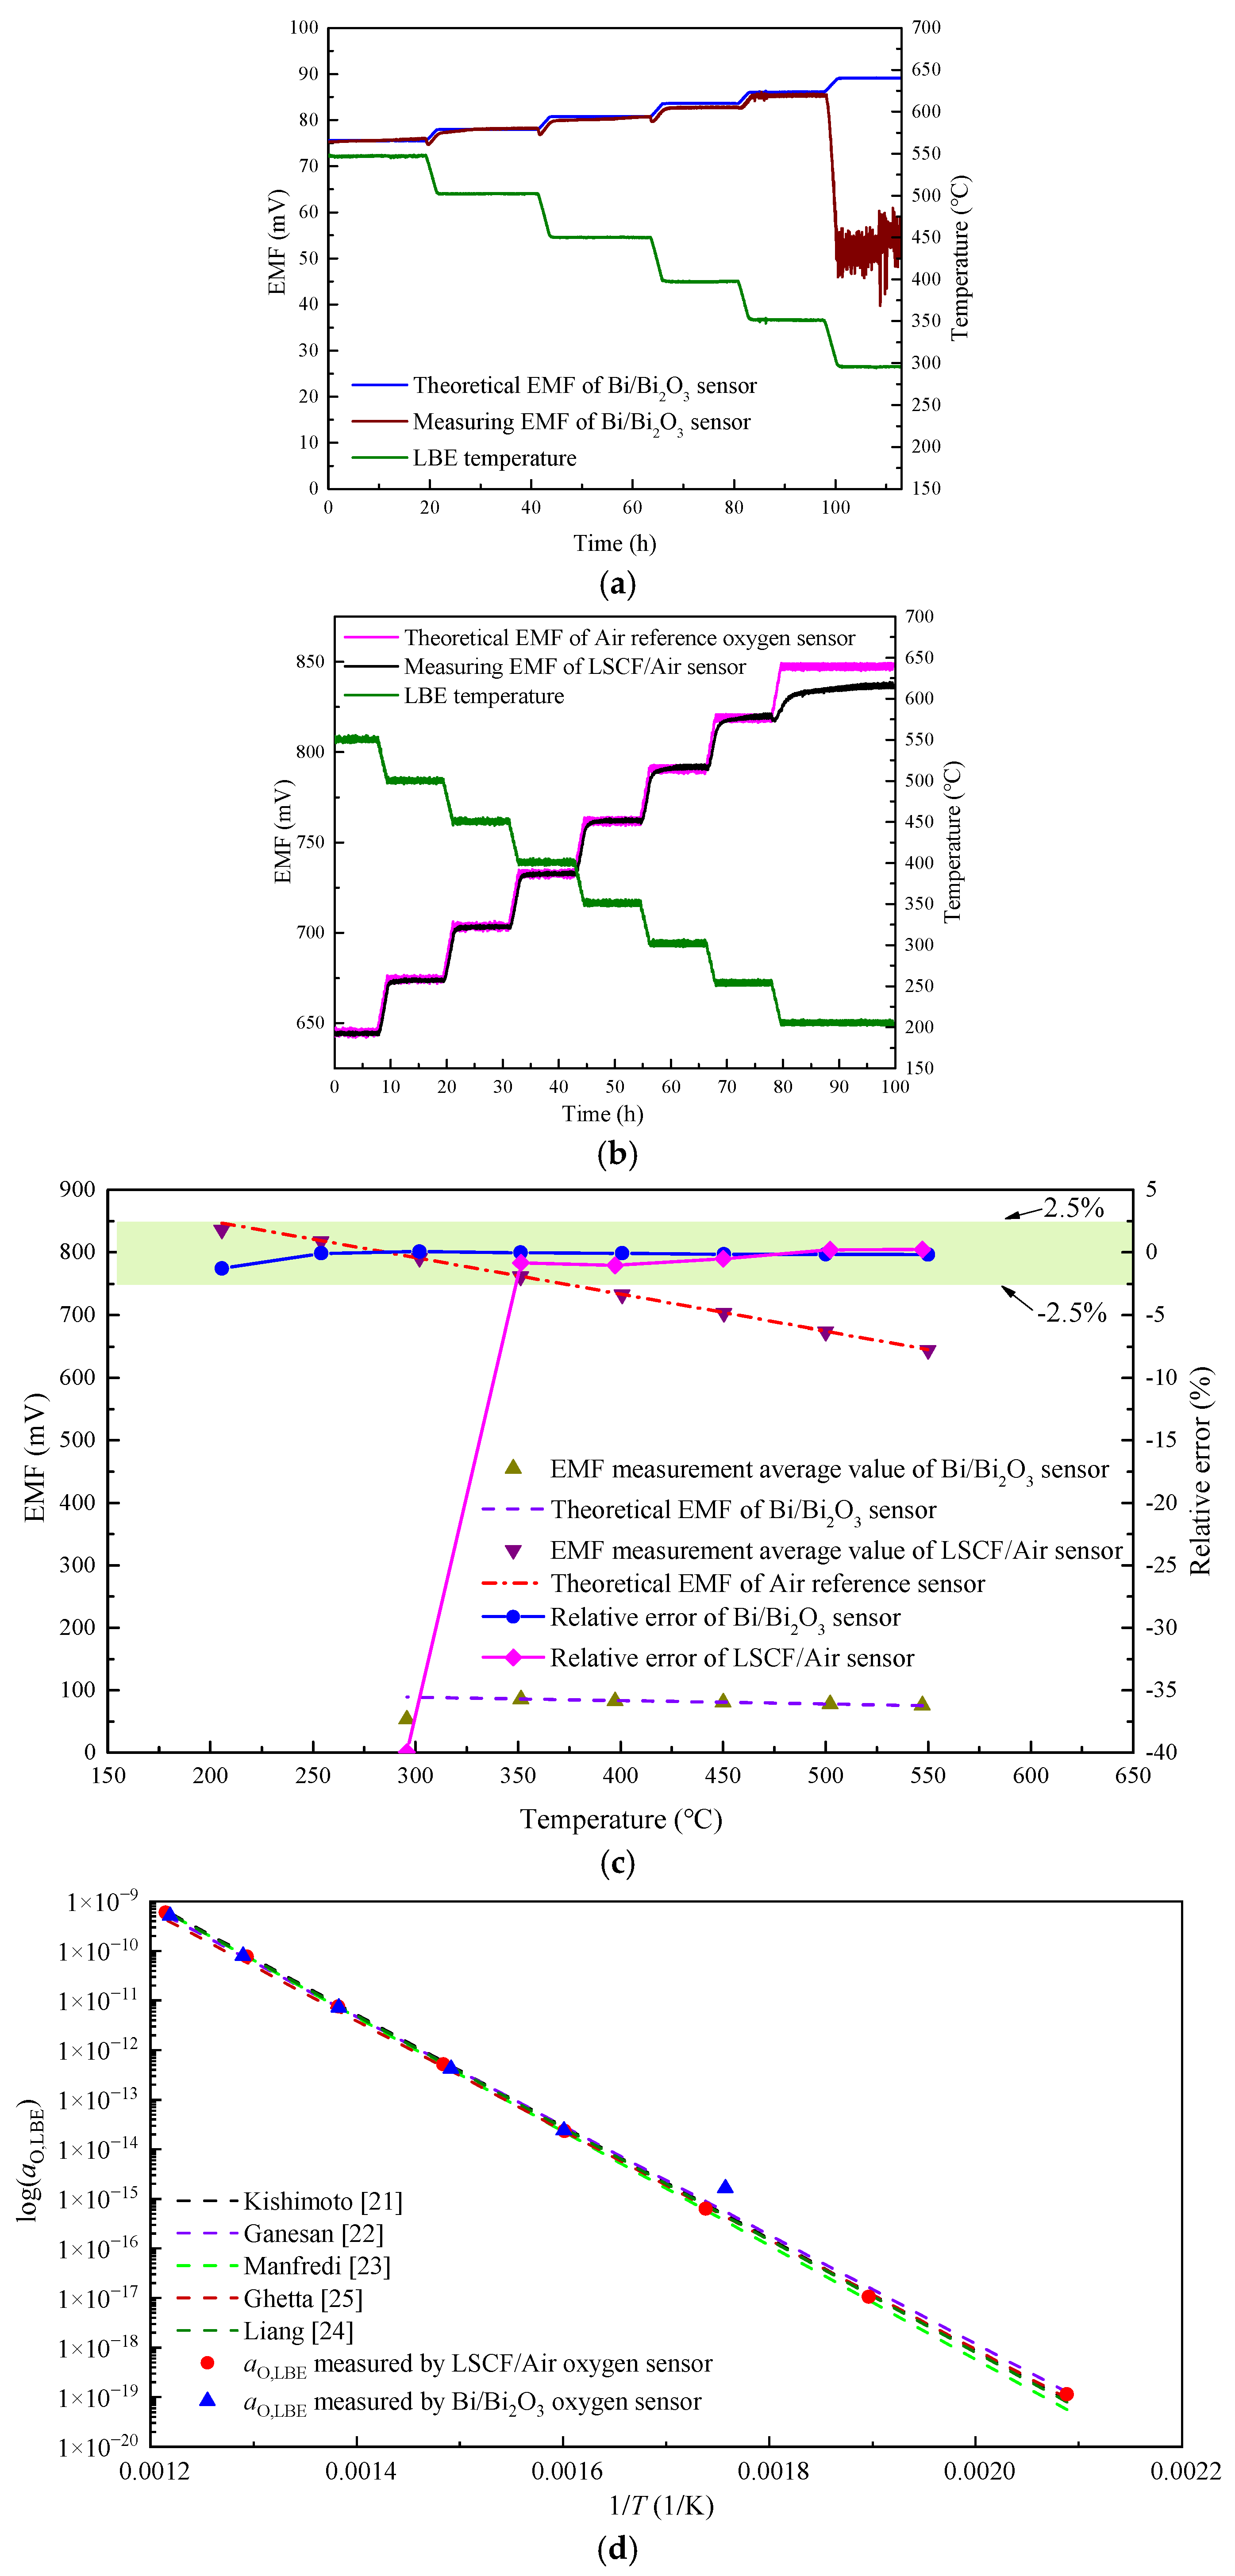
3 and LSCF oxygen sensors in saturated oxygen LBE, with results shown in
Figure 4. For the Bi/Bi
2O
3 sensor test conditions, the temperature change rate of the LBE was set at 0.3 °C/min, and a target dwell time of 18 h was maintained to ensure full thermal equilibrium at each temperature point, as illustrated in
Figure 4a. Overall, the output electromotive force (EMF) of the bismuth-based oxygen sensor closely matched theoretical values, and its temperature-dependent behavior conformed well to the Nernst theory. However, during the initial phase of cooling from the constant-temperature stage, the EMF of the bismuth sensor first decreased and then increased. A distinct signal relaxation phenomenon occurred at the beginning of cooling at each target temperature. This is typically attributed to the combined effects of non-steady-state temperature changes and delayed dynamic responses at the electrode interface. In the early cooling phase, the EMF rapidly declined with decreasing temperature, primarily due to the direct reduction effect of the
RT/
nF term in the Nernst equation. However, the subsequent EMF recovery cannot be fully explained by thermodynamics alone; instead, it reflects the interface dynamic response lag under non-steady-state temperature conditions. Specifically, when the temperature decreases, a gradient in oxygen activity develops between the bulk LBE and the electrode interface due to diffusion limitations. Meanwhile, the equilibrium reconstruction of the Bi/Bi
2O
3 reaction at the reference electrode side involves a relaxation process. These two factors together cause the effective interfacial oxygen partial pressure to initially remain low before gradually recovering toward the equilibrium state corresponding to the given temperature, resulting in an observed EMF rebound. This phenomenon indicates that during dynamic cooling, the output of the bismuth oxygen sensor does not uniquely correspond to the thermodynamic equilibrium potential at any given temperature, and reliable readings can only be obtained after the interface relaxation has completed. Once the LBE temperature reaches and stabilizes at the target value, the oxygen sensor’s output EMF also gradually stabilizes. Within the temperature range of 550~350 °C, the Bi/Bi
2O
3 oxygen sensor achieved stable signal readings after a 10-h stabilization period. When the temperature decreased from 350 °C toward the target value, the output EMF of the bismuth sensor continued to decrease without recovery, and the signal did not rise—its reading clearly deviated from Nernstian behavior. At the final constant temperature of 295 °C, the output EMF of the bismuth sensor was 35 mV lower than the theoretical value, with significant fluctuations in readings, leading to signal failure.
Unlike the Bi/Bi
2O
3 oxygen sensor, the relaxation phenomenon in the LSCF/Air oxygen sensor is not significant. During stepwise cooling from 550 °C to 250 °C, no noticeable relaxation behavior was observed, indicating that the LSCF/Air material exhibits good response stability and rapid equilibration capability within the medium-to-high temperature range. However, during the initial stage of cooling the LBE temperature from 250 °C toward the target value of 205 °C, a distinct relaxation behavior was observed in the sensor’s output electromotive force, as shown in
Figure 4b. This suggests that although the LSCF/Air oxygen sensor demonstrates excellent dynamic response characteristics at higher temperatures, its electrochemical equilibrium process is significantly affected at low temperatures—particularly near 205 °C. Possible reasons include a substantial decrease in oxygen ion migration rate within the solid electrolyte at low temperatures, slower kinetics of interfacial charge transfer reactions, and delayed establishment of oxygen partial pressure at the electrode/electrolyte interface, all of which collectively cause the sensor’s output electromotive force to require a longer time to reach steady state. This relaxation behavior is especially pronounced during the initial cooling phase, further indicating enhanced sensitivity of the LSCF/Air oxygen sensor to temperature changes under low-temperature conditions. When held at the lowest temperature for up to 20 h, the output voltage of the LSCF/Air oxygen sensor was 10 mV lower than the theoretical value.
Overall, the LSCF/Air oxygen sensor exhibits good accuracy and stability within the temperature range of 205~550 °C, with a maximum relative error of −1.28% between its output electromotive force and the theoretical value, occurring at the lowest temperature. In contrast, the Bi/Bi
2O
3 oxygen sensor shows better accuracy and stability in the range of 350~550 °C; however, when the temperature drops below 350 °C, its output signal deviates from the Nernst behavior, reaching a relative deviation of −39.95% at 295 °C, as shown specifically in
Figure 4c.
The oxygen activity data measured by the Bi/Bi
2O
3 and LSCF/Air oxygen sensors are shown in
Figure 4d. For the Bi/Bi
2O
3 oxygen sensor, the measured oxygen activity values at temperatures above 295 °C generally fall within the range reported in the literature. Within the operating temperature range of 350~550 °C, the measured oxygen activity in this study showed relative errors ranging from −14.2% to −11.2% compared to the data of Kishimoto et al. [
21]. In comparison with Ganesan et al.’s data [
22], the maximum relative error was −17.6%, while the minimum was as low as 4.1%. Compared to the data from Manfredi et al. [
23], the relative error range is only from −0.83% to +7.2%. Compared to our previous research results [
24], the relative errors remained stable within −9.2% to −7.5%. Notably, except for the data of Ghetta et al., the maximum relative errors in all other comparisons occurred at 350 °C; whereas the deviations from Ghetta et al.’s [
25] data were most scattered—the largest relative error (+32.5%) occurred at 550 °C, while the smallest (+2.8%) was observed at 350 °C. The oxygen activity data measured by the LSCF/Air oxygen sensor showed relative errors of −7.2% to +31.2% compared to Kishimoto et al.’s results [
21], −35.2% to +15.8% compared to Ganesan et al.’s results [
22], and the largest deviation—ranging from −0.8% to +106%—compared to Manfredi et al.’s data [
23], with the maximum positive deviation occurring at the lowest test temperature (205 °C). Compared to Ghetta et al.’s data [
25], the relative error ranged from −16.5% to +38.8%. Except for the data point at 205 °C, the relative error remained stable between −13.7% and −3.4% when compared to our team’s previous research results [
24].
These differences may arise from variations in experimental conditions, such as differences in the composition of LBE, oxygen-activity definitions, thermodynamic data, temperature measurement, YSZ properties, electrode configurations, and experimental procedures used by different research groups. Therefore, the differences between the present results and the literature data should not be directly treated as the absolute measurement errors of the sensors. Calibration under the actual operating conditions is still required before quantitative oxygen-concentration measurements are performed.
4.2. Electrochemical Performance Analysis of Bi/Bi2O3 and LSCF/Air Oxygen Sensors
In this experiment, electrochemical impedance spectroscopy (EIS) measurements were performed using a CHI660E electrochemical workstation for both Bi/Bi
2O
3and LSCF/Air oxygen sensors. The purpose was to investigate the interfacial polarization characteristics of solid-state oxygen sensors in a liquid LBE environment. The EIS measurements were conducted under open-circuit potential (OCP) conditions with an AC perturbation amplitude of 10 mV over a frequency range from 10
5 Hz down to 10
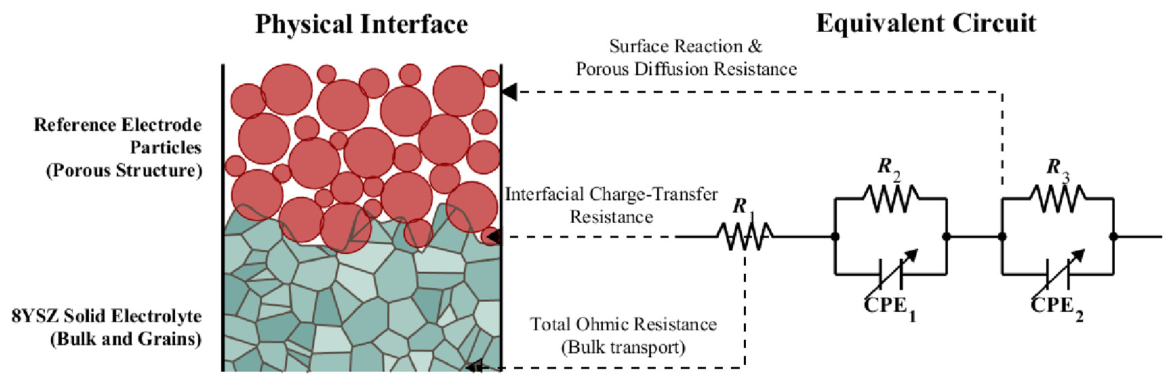
−2 Hz. Prior to each EIS acquisition, the system was stabilized at the target temperature to ensure a steady electrochemical state. The impedance spectra were quantitatively evaluated using ZView2.9c software (or the built-in CHI software) via a complex nonlinear least squares (CNLS) fitting method. Both sensors used an 8YSZ ceramic tube as the solid electrolyte, and the reference electrode material was filled into the inner cavity of the ceramic tube. Because the two oxygen sensors have similar physical mechanisms in charge transfer and mass transport, the equivalent circuit model shown in
Figure 5 was used for fitting and analysis. In this model,
R1 represents the ohmic resistance of the system, which is mainly determined by the bulk ionic transport resistance of the 8YSZ solid electrolyte.
R2 is the high-frequency polarization resistance, which characterizes the charge-transfer impedance at the triple-phase boundary (TPB).
R3 is the low-frequency polarization resistance, which reflects the impedance related to oxygen adsorption, dissociation, and diffusion/mass transport inside the porous electrode. The total polarization resistance,
Rp, is defined as the sum of
R2 and
R3.
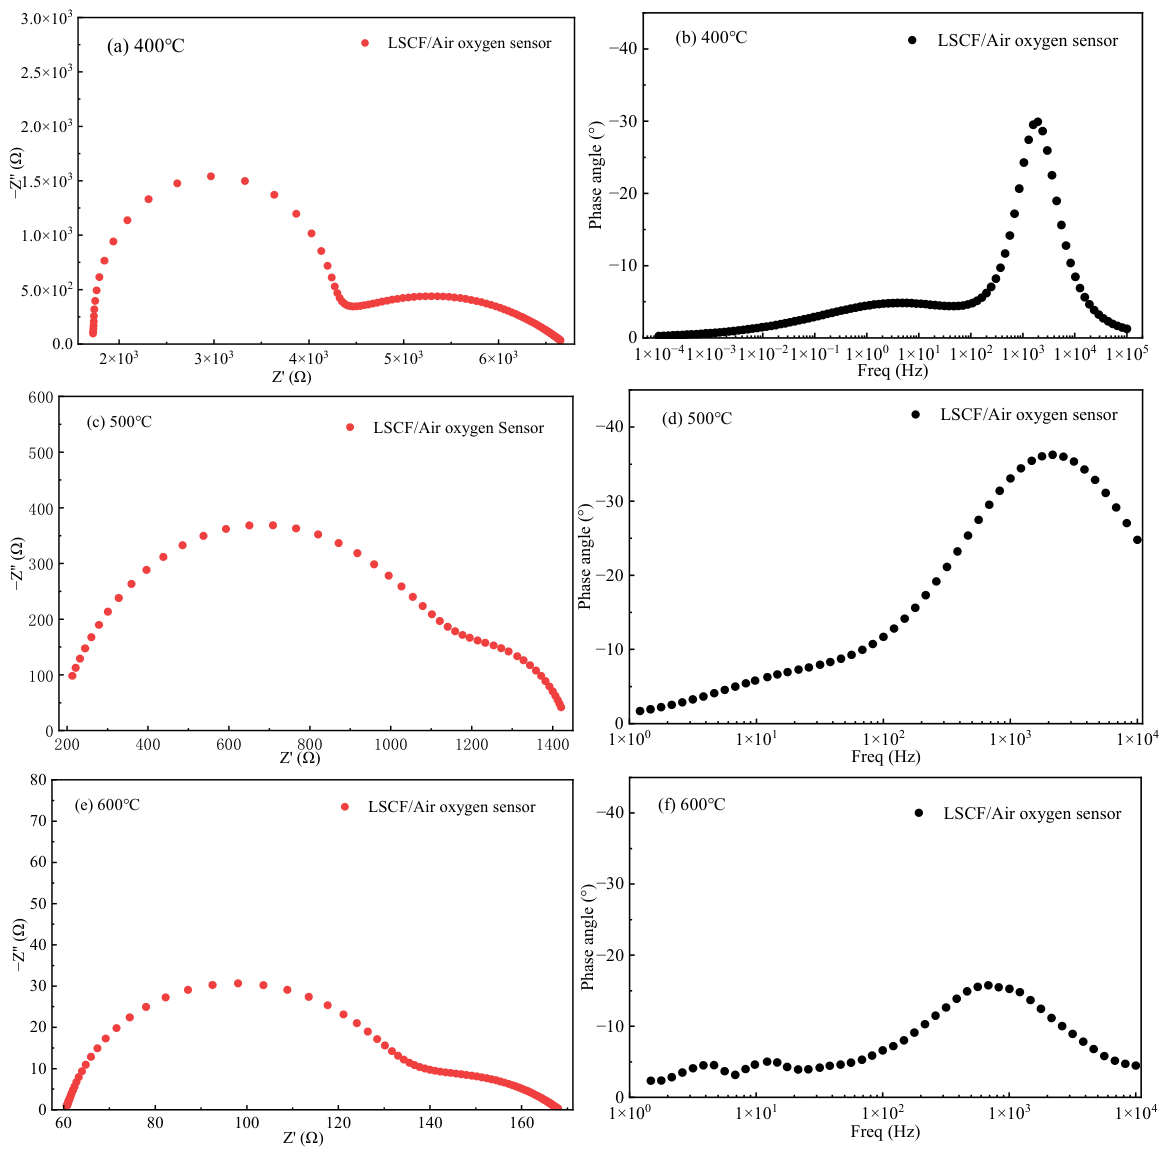
The fitted Nyquist plots of the LSCF/Air oxygen sensor are shown in
Figure 6. At 400 °C, as shown in
Figure 6a, the impedance spectrum shows a clear two-capacitive-arc feature, indicating that the oxygen reduction reaction is controlled by multiple elementary steps. The interfacial ion-transfer resistance corresponding to the high-frequency arc is approximately 3717–4774 Ω, while the surface reaction/adsorption-dissociation resistance corresponding to the low-frequency arc is approximately 1152–1185 Ω. The peak imaginary impedance reaches about 1500 Ω.
As the temperature increases, the polarization resistance in each frequency region and the peak imaginary impedance decrease significantly. At 500 °C, as shown in
Figure 6c, the total polarization resistance decreases from about 6700 Ω to about 1200 Ω, and the peak imaginary impedance decreases to about 400 Ω. At 600 °C, as shown in
Figure 6e, the impedance arcs further shrink. This trend indicates that increasing temperature effectively accelerates the oxygen exchange kinetics on the LSCF electrode surface and the interfacial oxygen ion injection process. As a result, the polarization impedance at the electrode/electrolyte interface is significantly reduced. This is consistent with the enhanced mixed conductivity and surface catalytic activity of LSCF at high temperature.
The Bode phase-angle plots of the LSCF/Air oxygen sensor, shown in
Figure 6b,d,f, exhibit broad frequency-distribution characteristics in the temperature range of 400–600 °C. The response covers a wide frequency range from low to high frequencies. This indicates that the oxygen reduction reaction involves multiple elementary steps with different relaxation times. These steps can be distinguished in the frequency spectrum. The low-frequency region corresponds to the diffusion of gaseous oxygen in the porous LSCF electrode and its mass transport to the active reaction sites. The medium-frequency region reflects the adsorption and dissociation of oxygen molecules on the LSCF electrode surface. The high-frequency region represents the interfacial transfer of oxygen ions from the LSCF electrode to the 8YSZ electrolyte.
As the temperature increases, the phase-angle peak generally shifts toward lower frequencies. This phenomenon can be attributed to the mixed ionic–electronic conducting nature of LSCF. At high temperature, the electrochemically active region of LSCF expands from the traditional triple-phase boundary to the whole exposed electrode surface, which significantly increases the electrochemically active area and interfacial capacitance. According to the relaxation–time relationship, the increase in capacitance leads to an increase in the system time constant, which appears as a shift in the phase-angle peak toward lower frequencies. This evolution also indirectly confirms that increasing temperature enhances the mixed oxygen ion/electron transport ability in the LSCF bulk.
The Nyquist impedance spectra of the Bi/Bi
2O
3 oxygen sensor are shown in
Figure 7. Overall, as the temperature increases from 400 °C to 600 °C, the total polarization impedance at the electrode/YSZ interface decreases significantly, from the order of ~10
4 Ω to ~10
2 Ω.
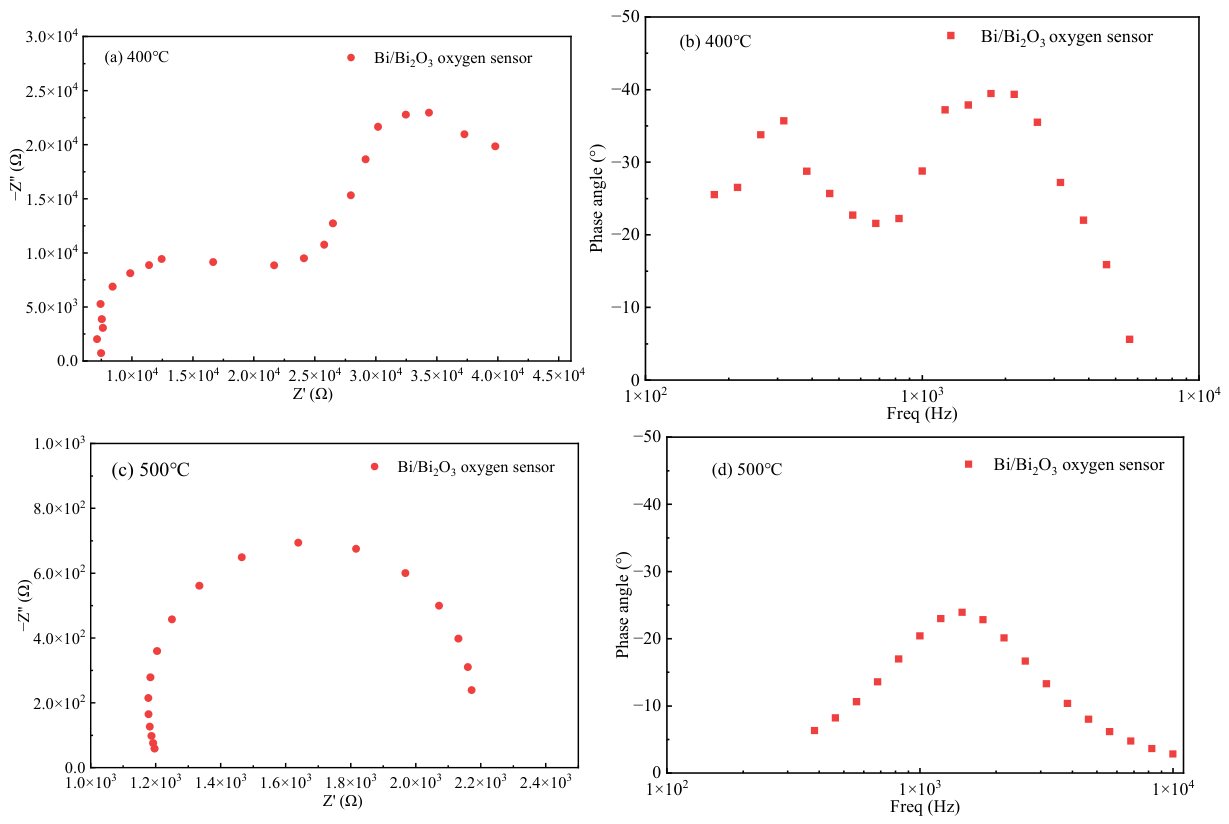
At 400 °C, as shown in
Figure 7a, the impedance spectrum shows a clear two-capacitive-arc feature. The high-frequency arc corresponds to the bulk ionic conduction response of the YSZ electrolyte, while the low-frequency arc reflects the oxygen ion transfer process at the Bi/Bi
2O
3–YSZ interface. At this temperature, the real-axis intercept of the low-frequency arc is approximately 2.6 × 10
4~3.1 × 10
4 Ω, and the peak value of the imaginary component reaches 2.5 × 10
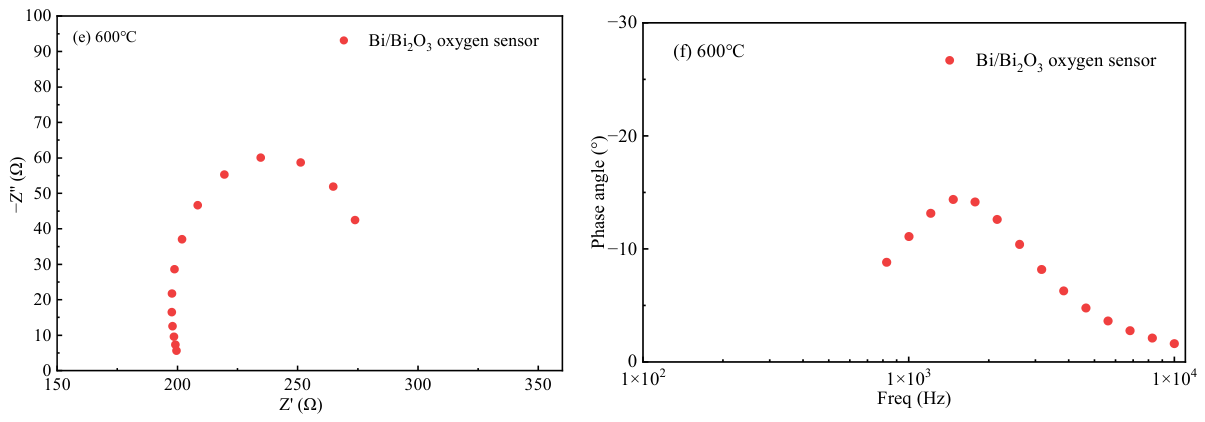
4 Ω. This indicates that the interfacial oxygen ion exchange rate is extremely low at low temperature, and the ion injection barrier is high. When the temperature increases to 500 °C and 600 °C, as shown in
Figure 7c,e, the impedance spectra evolve from two arcs into a single capacitive arc. This suggests that the relaxation times of the bulk and interfacial processes become closer, and the interfacial polarization impedance decreases greatly. It is worth noting that the significant shrinkage of the low-frequency arc means that interfacial ion exchange is no longer the rate-controlling step, and the interface tends to become electrochemically uniform.
The Bode phase-angle plots of the Bi/Bi
2O
3 system, shown in
Figure 7b,d,f, indicate that its effective electrochemical response is mainly concentrated in the high-frequency region of 10
3~10
5 Hz. At 400 °C, the phase-angle curve shows a clear double-peak feature, suggesting that ideal and uniform electrochemical contact between liquid Bi and the 8YSZ solid electrolyte has not yet been formed. This is mainly because liquid Bi has relatively poor wettability at low temperature and is difficult to sufficiently penetrate into the microstructure of the YSZ surface. Therefore, significant interfacial contact impedance is generated. The local non-uniformity of the interface also gives rise to two distinguishable relaxation time constants in the high-frequency response. As the temperature increases to 500 °C, the two peaks gradually merge and transform toward a single peak. At 600 °C, the high-frequency response evolves into a relatively complete capacitive arc. This evolution indicates that increasing temperature significantly reduces the viscosity of liquid Bi and improves its wettability on the YSZ surface. As a result, the solid–liquid contact becomes tighter and more uniform, the interfacial contact impedance is greatly reduced, and the interfacial state tends to become electrochemically consistent.
To quantitatively analyze the interfacial polarization characteristics, the derived resistive parameters (
R1,
R2,
R3) are summarized in
Table 1. It should be noted that while the equivalent circuit incorporates constant phase elements, we specifically focus on reporting these resistive components, as they are the primary kinetically relevant variables utilized for the subsequent calculations of apparent ionic conductivity and activation energies.
To ensure the statistical significance and reliability of the reported results, two independent sensors (
N = 2) were fabricated and tested for each electrode configuration (LSCF/Air and Bi/Bi
2O
3). Representative single-measurement EIS spectra are presented, but the parameter calculations were performed on both independent datasets. The fitting results and calculated conductivities are expressed as mean ± standard deviation (SD), as detailed in
Table 1 and
Table 2. During the uncertainty propagation for apparent ionic conductivity, the variance in geometric dimensions (machined 8YSZ tubes) was verified to be negligible (tolerance < 0.02 mm); therefore, the uncertainty is primarily derived from the standard deviation of the measured impedance. As shown in the tables, the relative uncertainties at high temperatures (600 °C) are extremely small (<3%), demonstrating the excellent reproducibility of the sensor fabrication and measurement. Notably, the larger standard deviations observed for the Bi/Bi
2O
3 sensor at 400 °C (~19.4% for
R1) quantitatively reflect the physical randomness of the liquid–solid “point contact” interface caused by poor wettability at low temperatures. This further corroborates the kinetic limitations and instability of the Bi-based sensor in low-temperature LBE environments.
Combined with the equivalent-circuit fitting data in
Table 1, the interfacial polarization characteristics of the two reference electrode systems can be quantitatively compared. It should be noted that the physical origins of the low-frequency arcs are different in the two systems. For the LSCF/Air system, the low-frequency response mainly reflects the surface adsorption, dissociation, and diffusion processes of oxygen molecules. For the Bi/Bi
2O
3 system, it corresponds to oxygen ion injection across the liquid–solid interface. At 400 °C, the low-frequency polarization resistance of the LSCF system is 1.15 × 10
3 Ω, which is much lower than that of the Bi/Bi
2O
3 system, 3.13 × 10
4 Ω. This advantage is due to the mixed ionic–electronic conducting characteristics of LSCF. These characteristics extend the electrochemically active region from the traditional triple-phase boundary to the whole electrode surface, giving good interfacial oxygen exchange kinetics even at low temperature. Therefore, the LSCF-based oxygen sensor is more suitable for low-temperature environments.
The bulk ionic conductivity (
σ) of the solid electrolyte and the interfacial polarization area conductivity (
Gp) were further analyzed for oxygen sensors with the two different electrode systems.
σ is the ionic conductivity, with a unit of S/cm;
R1 is the ohmic resistance, with a unit of Ω. The bulk ionic conductivity of the 8YSZ solid electrolyte can be calculated accordingly.
Gt is the bulk conduction geometric factor of the corresponding oxygen sensor, which is determined from the specific sensor geometry.
Gp is the interfacial polarization area conductivity, with a unit of S/cm2; Rp is the total polarization resistance, with a unit of Ω. Sin is the effective active area of the corresponding oxygen sensor, with a unit of cm2.
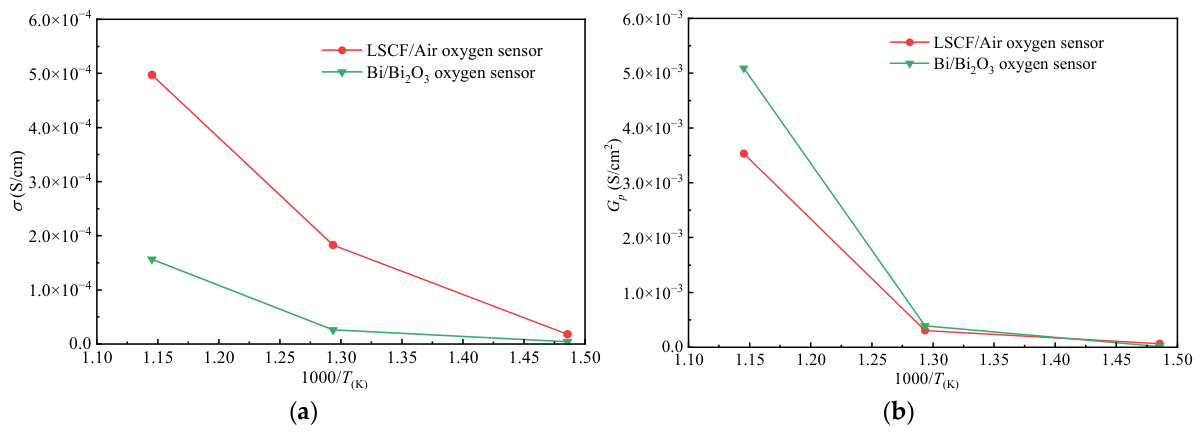
Figure 8a shows that, at the same temperature, the apparent effective ionic conductivity calculated from the LSCF/Air system is significantly higher than that of the Bi/Bi
2O
3 system. It should be noted that this difference does not represent a real difference in the intrinsic bulk ionic conductivity of the 8YSZ electrolyte. Instead, it originates from the different physical contributions to the high-frequency intercept
R1 in the impedance spectra. In actual measurements,
R1 includes not only the intrinsic bulk resistance of the YSZ electrolyte, but also the ohmic contact resistance at the electrode/electrolyte interface connected in series. For the LSCF/Air system, this advantage is intrinsically linked to the mixed ionic–electronic conducting (MIEC) characteristics of LSCF. According to established solid-state electrochemistry literature [
26], MIEC materials effectively extend the electrochemically active region from the traditional triple-phase boundary to the entire electrode surface. Although direct in-situ microstructural observation (e.g., cross-sectional SEM) was not performed here, our EIS results strongly align with the widely accepted phenomenological model (as schematically inferred in
Figure 5) that LSCF establishes a highly effective solid–solid contact pathway with the YSZ inner wall upon high-temperature sintering. Therefore, the relatively low contact resistance allows the
value to more closely reflect the bulk properties compared to the Bi-based system, although it remains an apparent measurement. Conversely, for the Bi/Bi
2O
3 system, it is fundamentally limited by the interfacial ion injection barrier. Based on well-documented liquid metal-ceramic wetting behaviors [
27], the physical contact state between liquid Bi and the YSZ wall is largely governed by wettability mechanics. Therefore, it can be reasonably inferred that the remarkably large apparent impedance at 400 °C originates from the limited effective contact area and poor wettability of liquid Bi at low temperatures. In addition, the possible interfacial lattice mismatch between solid Bi/Bi
2O
3 and YSZ may further increase the interfacial barrier, resulting in a significant increase in contact resistance. In this case,
R1 is the sum of the bulk resistance and contact resistance. If
R1 is directly used to calculate the intrinsic conductivity, the obtained value will be seriously underestimated. Therefore, the difference in apparent effective ionic conductivity observed in
Figure 8a essentially reflects the significant difference in ohmic contact quality between the two electrode systems and the YSZ electrolyte. This further demonstrates the applicability of the LSCF-based oxygen sensor at low temperature.
Figure 8b compares the temperature dependence of the polarization area conductivity of the two oxygen sensor systems. In the low-temperature region at 400 °C, the polarization area conductivities of the LSCF/Air and Bi/Bi
2O
3 systems are similar, and both remain at relatively low levels. However, the origins of their impedance are completely different. For the LSCF/Air system, the polarization impedance is limited by the slow adsorption/dissociation kinetics of oxygen molecules on the electrode surface at low temperature. For the Bi/Bi
2O
3 system, it is limited by the interfacial ion injection barrier caused by the limited solid–liquid contact area between liquid Bi and the YSZ wall. Therefore, the similar polarization resistance values of the two systems at low temperature are only a numerical coincidence observed in the experiment, rather than being caused by the same physical mechanism. As the temperature increases to 600 °C, the polarization area conductivities of both systems increase. However, the increase in the Bi/Bi
2O
3 system is more significant, and its polarization area conductivity becomes obviously higher than that of the LSCF/Air system at the same temperature. This change is attributed to the significant improvement in the wettability of liquid Bi on the YSZ surface in the temperature range of 500~600 °C. The liquid–solid contact state changes from sparse “point contact” at low temperature to continuous “area contact” at high temperature. The large increase in effective interfacial area directly leads to a rapid enhancement of the interfacial ion exchange rate. This further demonstrates the important influence of electrode/electrolyte interfacial polarization characteristics on the overall performance of the sensor.
The Arrhenius fitting lines of the ionic conduction behavior in the LSCF/Air and Bi/Bi
2O
3 oxygen sensors were further investigated.
where
A is the pre-exponential factor representing the effective reaction/collision sites, and the unit is related to the region.
kB is the Boltzmann constant 8.617 × 10
−5 eV/K, and
Ea is the activation energy, expressed in eV. The slope of the fitted straight line directly reflects the activation energy
Ea required to overcome the conduction barrier, while the intercept corresponds to the magnitude of the pre-exponential factor ln(
A).
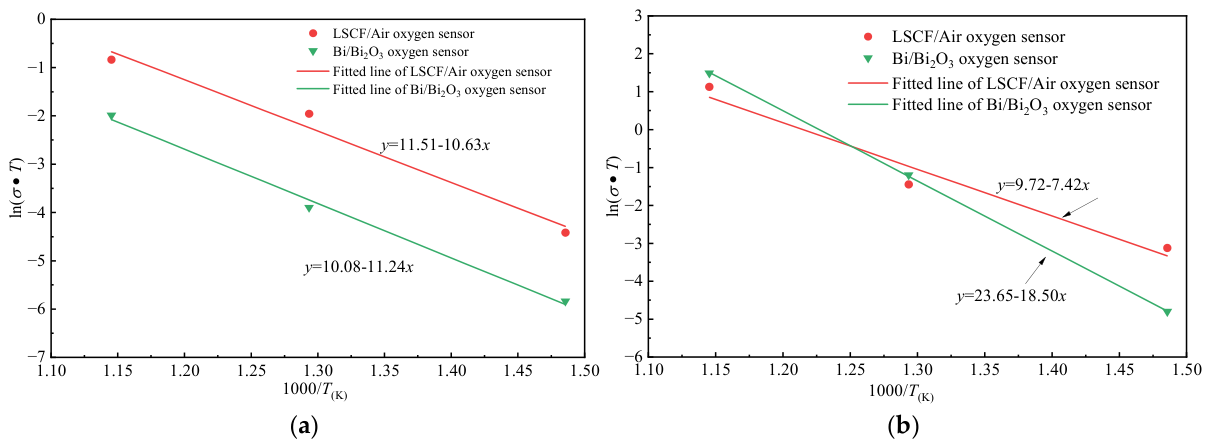
According to the Arrhenius plot of solid-electrolyte ionic conduction in
Figure 9a, the bulk oxygen ion conduction activation energy
Ea of the LSCF/Air oxygen sensor is approximately 0.92 eV, while that of the Bi/Bi
2O
3 system is approximately 0.97 eV. Both values fall within the typical range of 0.9–1.0 eV for oxygen vacancy hopping in bulk 8YSZ. This indicates that the evolution of high-frequency impedance in both sensors is mainly controlled by oxygen ion migration inside the YSZ lattice.
It is worth noting that, at the same temperature, the values of the LSCF/Air system are systematically higher than those of the Bi/Bi2O3 system. This difference is not caused by a change in the intrinsic ionic conductivity of YSZ. Instead, it is caused by the non-negligible interfacial ohmic contact resistance connected in series with the high-frequency intercept R1 in the Bi/Bi2O3 system. Therefore, the apparent conductivity calculated from the total resistance is underestimated. This inference is consistent with the equivalent-circuit analysis described above.
It must be explicitly emphasized that the remarkably higher apparent effective ionic conductivity derived from the LSCF/Air system does not represent a true enhancement in the intrinsic bulk transport properties of the 8YSZ electrolyte itself. As acknowledged above, the measured resistance (R1) encompasses distinct interfacial contact contributions. Therefore, these apparent conductivity values primarily reflect the superior interfacial contact quality and significantly lower contact resistance of the LSCF electrode in low-temperature regimes, rather than an inherent superiority in electrolyte bulk transport.
Furthermore, according to the Arrhenius plot of interfacial polarization in
Figure 9b, the interfacial polarization activation energy of the LSCF/Air system is approximately 0.64 eV, while the apparent polarization activation energy of the Bi/Bi
2O
3 system reaches 1.59 eV. The large difference between the two values reflects completely different interface-controlled mechanisms. In the LSCF system, the lower activation energy is attributed to the efficient interfacial oxygen exchange kinetics provided by its mixed ionic–electronic conducting characteristics. Therefore, its interfacial impedance has relatively low temperature sensitivity, which is beneficial for maintaining a stable sensor response over a wide medium- and low-temperature range.
In contrast, the high apparent activation energy of 1.59 eV for the Bi/Bi2O3 system does not represent the energy barrier of a single elementary reaction. Instead, it includes the combined contribution of a non-Arrhenius-type physical process associated with the threshold-like transition of liquid Bi wettability with temperature. This indicates that the interfacial polarization impedance of the Bi/Bi2O3 system is highly sensitive to temperature changes.
In addition, the intercepts ln(A) obtained from the Arrhenius fitting of the two systems are also significantly different. The value is 23.65 for the Bi/Bi2O3 system and 9.72 for the LSCF system. The intercept term reflects the combined effects of effective carrier concentration and hopping frequency. The larger intercept of the Bi/Bi2O3 system means that it has a higher upper limit of conductivity at high temperature. Combined with its high activation energy of 1.59 eV, this indicates that Bi/Bi2O3-based oxygen sensors are more suitable for high-temperature operating environments. In contrast, the lower activation energy and smaller intercept of the LSCF/Air sensor enable it to show better ionic-conduction stability and stronger resistance to temperature disturbance in the low- to medium-temperature range.