Article

Hydrodynamic and Energy Transport Model-Based Hot-Carrier Effect in GaAs pin Solar Cell

1
i-Powered Energy Research Center (i-PERC), The University of Electro-Communications, Tokyo 182-8585, Japan
2
Department of Engineering Science, The University of Electro-Communications, Tokyo 182-8585, Japan
*
Author to whom correspondence should be addressed.
Electron. Mater. 2022, 3(2), 185-200; https://doi.org/10.3390/electronicmat3020016
Submission received: 10 March 2022 / Revised: 25 April 2022 / Accepted: 5 May 2022 / Published: 11 May 2022
(This article belongs to the Special Issue Feature Papers of Electronic Materials II)

Abstract

:
The hot-carrier effect and hot-carrier dynamics in GaAs solar cell device performance were investigated. Hot-carrier solar cells based on the conventional operation principle were simulated based on the detailed balance thermodynamic model and the hydrodynamic energy transportation model. A quasi-equivalence between these two models was demonstrated for the first time. In the simulation, a specially designed GaAs solar cell was used, and an increase in the open-circuit voltage was observed by increasing the hot-carrier energy relaxation time. A detailed analysis was presented regarding the spatial distribution of hot-carrier temperature and its interplay with the electric field and three hot-carrier recombination processes: Auger, Shockley–Read–Hall, and radiative recombinations.

1. Introduction

Hot-carrier solar cells have drawn much attention due to their high theoretical efficiency limit of more than 80% [1,2]. Conventionally, hot-carrier solar cells require (1) a photoactive material where the transport to contacts must be much faster than the cooling; (2) the selective extraction of electrons or holes through a narrow energy band [1]. However, this model lacks the interlink to the semiconductor device because it is based on thermodynamics. The realization of selective contact is especially extremely challenging due to the poor understanding of the energy conservation principles from the device’s point of view. However, some trial experiments regarding the selective contact implementation have been reported [3,4]. One of the main targets of the current work is to address the hot-carrier operation principle from the closed-form of a Boltzmann device transportation model, especially a hydrodynamic energy transport model (HETM) model where the carrier temperature and lattice temperature are treated separately. The aim is to gain deeper insight into the proposed thermal dynamic hot-carrier solar cell by studying the hot-carrier effect on the conventional solar cell [5,6].
This paper is arranged as follows: first, the hot-carrier solar cell operation principle was simulated based on the thermodynamic detail balance model containing a ‘cooling’ and ‘hot’ competing process. A detailed analysis regarding the constraint of particle conservation and chemical potential was given in detail. Then, a hydrodynamic model, including the carrier energy, ω ( ω = 3 / 2 k T H , where T H   denotes the hot-carrier temperature, and k denotes the Boltzmann constant), was used to simulate a specially designed GaAsn-emitter/AlGaAsbarrier/GaAsintrinsic/GaAsp-base solar cell. The results were compared with the simulation results using the drift-diffusion model (DDM) by varying the internal electric filed, hot-carrier relaxation time, τ w , and the AlGaAs barrier thickness. At last, the spatial distribution of the hot-carrier temperature and the effect of the electric field and recombination rate was presented.

2. Thermal Dynamical Model of Hot-Carrier Dynamics

This section will first present the simulation results of an ideal hot-carrier solar cell based on the so-called Ross–Nozik model [2,7]. Then, we will provide further information regarding the comparison with other models. 
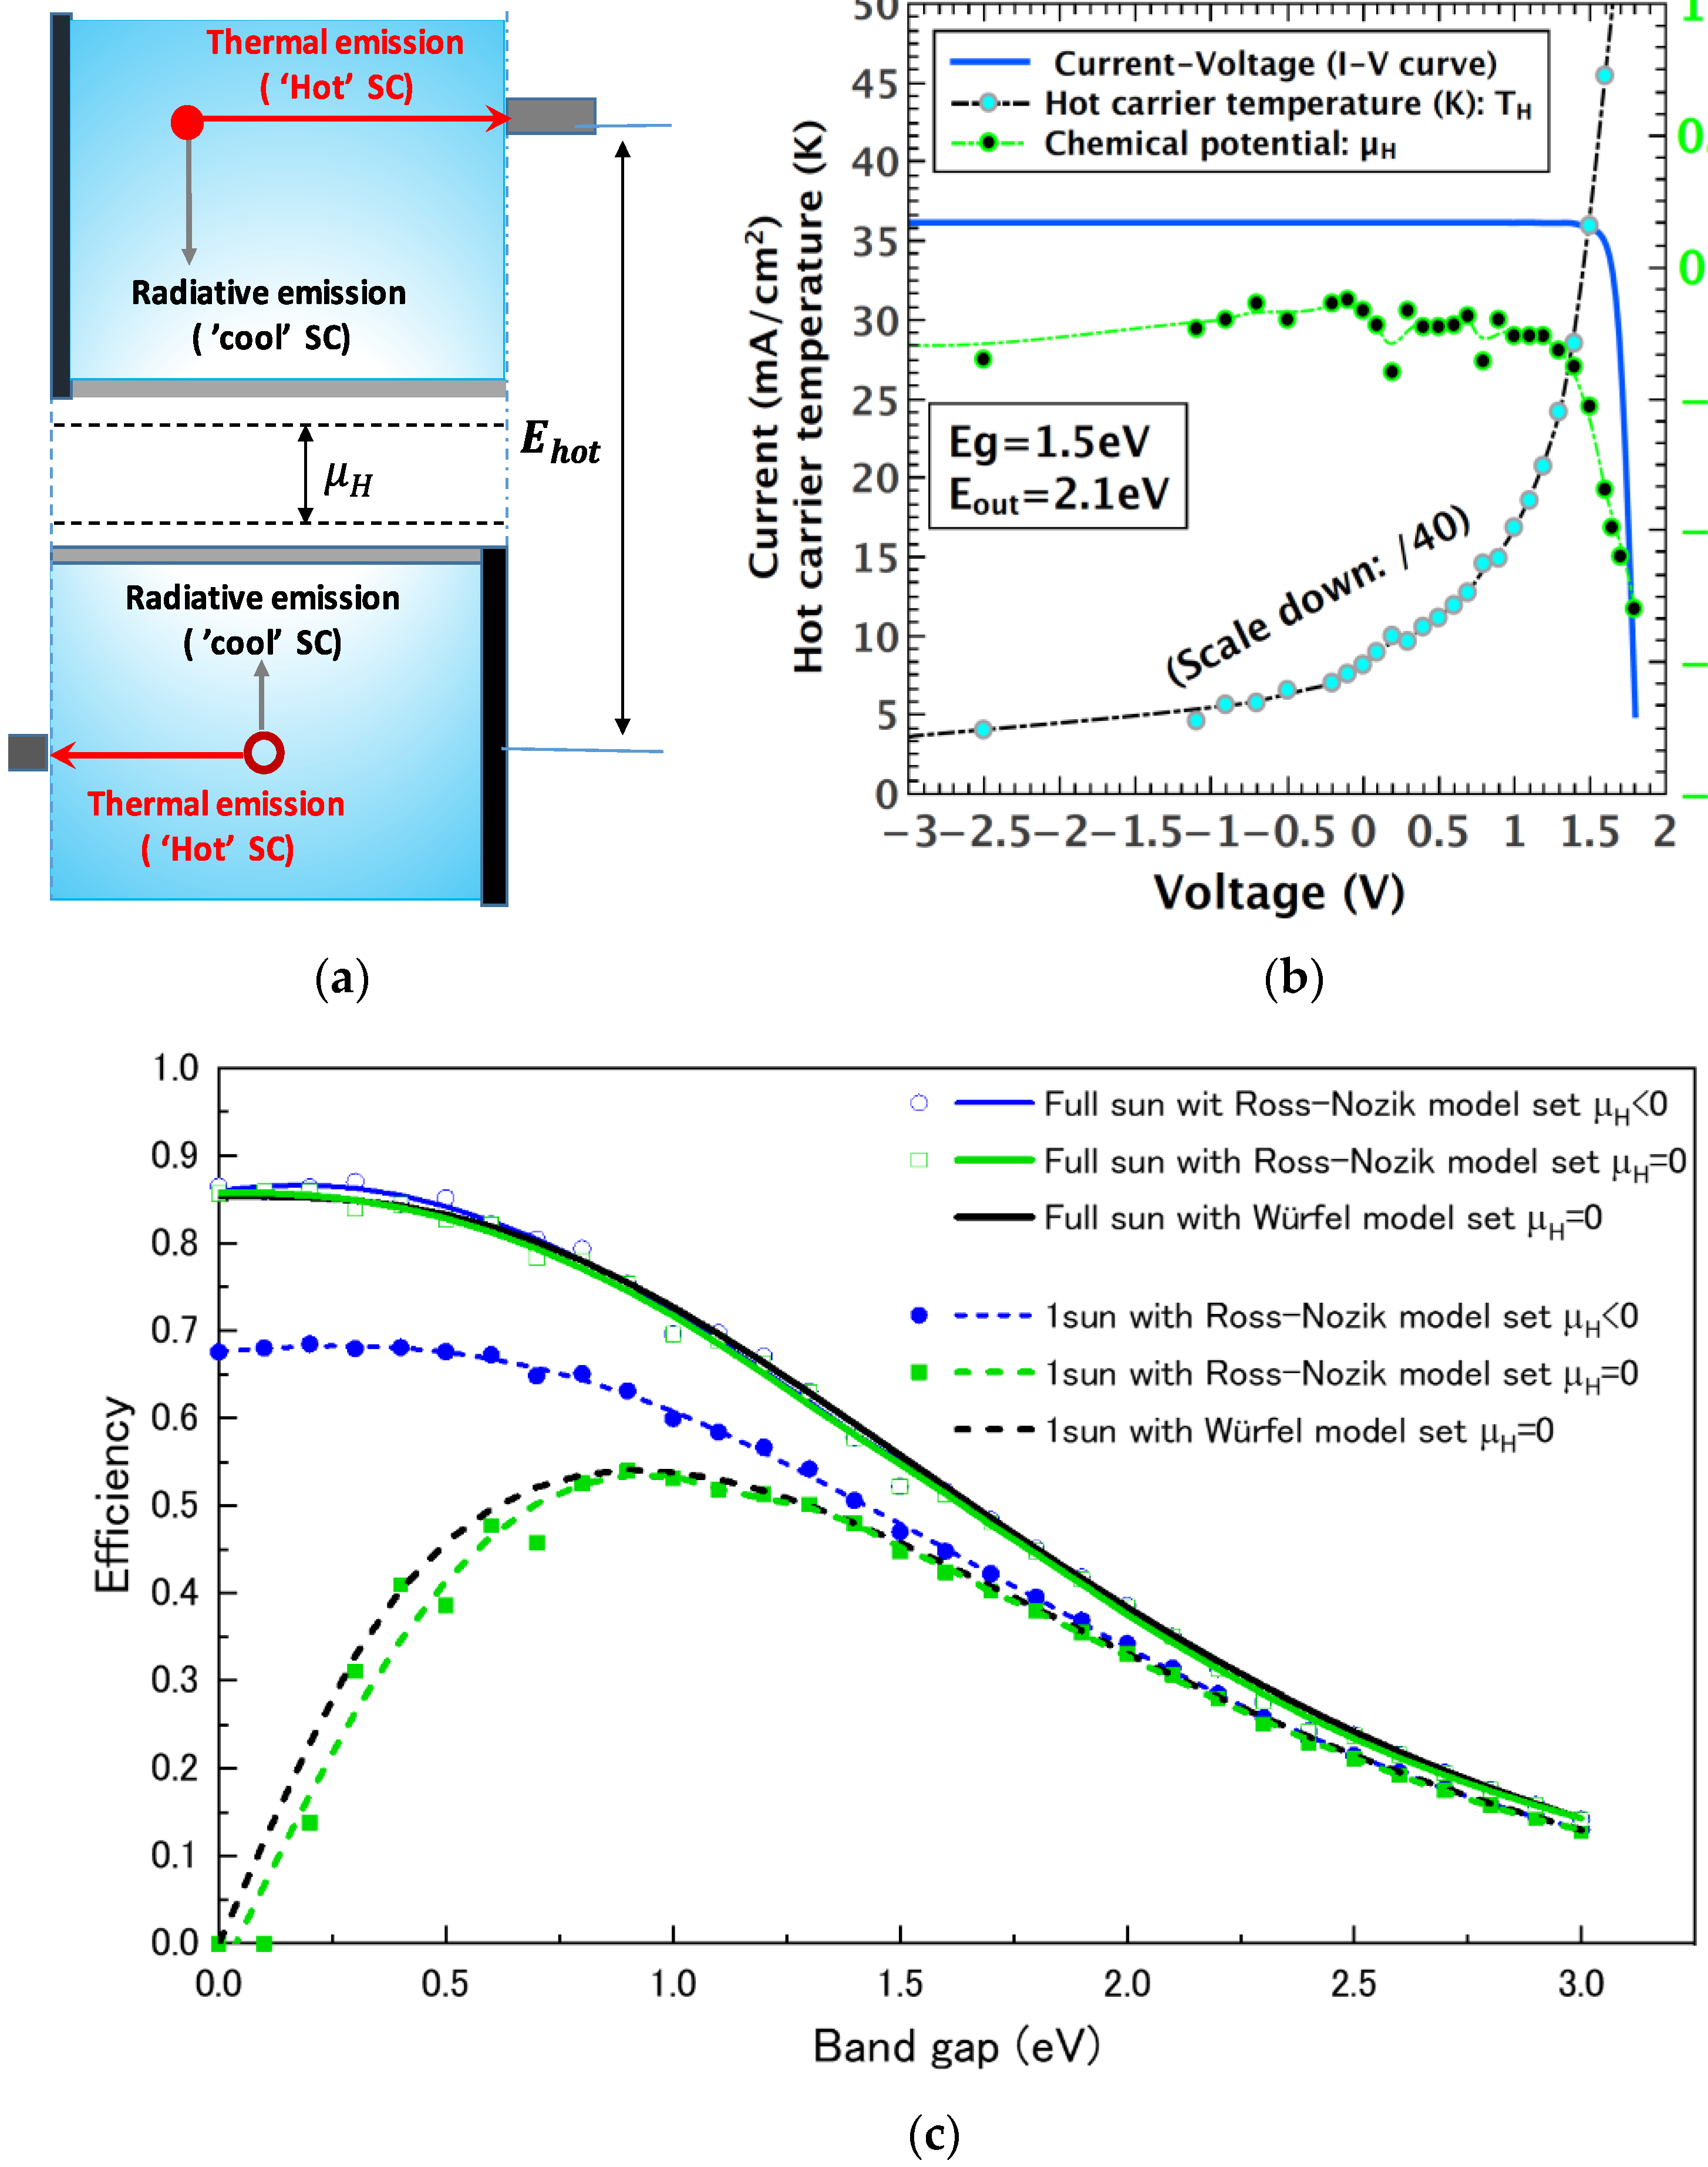
Figure 1a shows the thermodynamic mechanism involving an interplay between the ‘cool’ and the ‘hot’ carriers. Here, we have assumed a self-equilibrium between the hot-carrier temperature   T H and chemical potential   μ H . It is known that a competing behavior exists between T H and   μ H , and the mechanism is represented by the following equations:
μ o u t = μ H T a T H + E h o t 1 T a T H  
J = q X f S N E g , ,   T s u n , 0 N E g , ,   T H ,   μ H + 1 X f S N E g , ,   T a , 0
J E h o t = q X f S L E g , ,   T s u n , 0 L E g , ,   T H ,   μ H
where   J is the current density, T a is the ambient temperature ( 300   K ) , E h o t is the energy separation between the extracted electron and hole, and, in physics, it equals the kinetic energy, ω , N(·) is the photon flux density, and L(·) is the energy flux density; X and f S are the parameters related to light concentration. If the hot-carrier reaches the thermal equilibrium with the surrounding temperature, e T a , the hot-carrier solar cell performs as the conventional solar cell, and the output potential equals   μ o u t = μ H (the quasi-Fermi level splitting). The current-voltage (J-V) relation can be derived by considering both the particle conservation (the number of absorbed photons equals the number of emitted photons) described in Equation (2) and the energy conservation in Equation (3). Figure 1b shows the results of a hot-carrier solar cell with a bandgap of E g = 1.5   eV , and the extraction energy separation, E h o t , was set at 2.1   eV . It is seen here that the temperature of the carriers, T H , and the chemical potential, μ H , showed opposite trend versus the output voltage, indicating their competing behavior. The output current decreased with the increase of the output voltage, V. This reduction is mainly due to the increase of the photon emission following Planck’s radiation law:
n E E 2 exp E μ H k   T H
In order to separate the photon emission contribution due to the μ H and   T H , Planck’s law of Equation (4) was rewritten as:
n E E 2 exp μ H k T a + exp E k T H + C
where C equals   exp k T a 300 k and can be treated as a constant. Here, we can view the photon emission controlled by the term in Equation (5) containing only μ H as a ‘cool’ process, and the ones induced by temperature,   T H , i.e., the second term in Equation (5), as a ‘hot’ process. We named this process ‘cool’ so as to emphasize its similar operation to the conventional solar cell, in which the chemical potential, μ , governs the photoemission because   T H , here, is usually treated as a constant temperature and as the environment temperature,   T a . The word ‘cool’ here also reflects the fact that the value of μ is much less than the chemical potential in the conventional solar cell. In extreme cases, the value of μ could become zero or negative, especially when the applied voltage reaches the   V o c . The competition between the ‘cool’ and ‘hot’ processes is mainly due to the following fact: In a hot-carrier solar cell, as shown in Equation (5),   T H and μ H are allowed to vary the number of emitted photons, n E , in order to reach the detailed balance with the absorbed photons. When the output voltages, V, are within the regime of near   V o c , the carrier temperature,   T H , increases dramatically, which will inevitably drive μ H to zero, or even negative, due to the stringent constraints rooted in the conservation of particles and energy. In other words, conventional solar cells at   V o c can be viewed approximately as an ‘emitting diode’ at the ambient temperature,   T a , while the hot-carrier solar cell is exemplified as a ‘hot’ (high temperature   T H ) thermal engine, with μ H   being negative, as shown in Figure 1b. It is noteworthy to mention here that the competing process involving the variation of   T H and μ H are, in principle, due to the strong particle conservation constraints shown in Equation (2).
In contrast, in a model based on relaxed particle conservation, i.e., the so-called impact ionization and the Auger recombination model proposed by References [1,8], the μ H is set to zero. We undertook a comparison study by simulating the limiting efficiency based on three different models: (1) the Reference [2] model (Ross–Nozik model) where μ H < 0 , (2) the Reference [2] model (Ross–Nozik model) where μ H = 0 , and (3) the Reference [1] model (Würfel model) where μ H = 0 , and the results are summarized in Figure 1c. Model (2) was implemented by forcing the μ H = 0 while still applying the strong particle conservation constraints to the Ross–Nozik model. It can be seen from Figure 1c that there exists a dramatic difference between the models, allowing the value of μ H to be negative and for μ H = 0 under the 1sun or diffuse light condition. However, the difference was almost negligible when performing the simulation under full sun or direct light conditions. Meanwhile, it can also be found that the results obtained from models (2) and (3) showed a negligible difference for both the 1sun condition and full sun condition (note that models (1) and (2) were performed using numerical simulation, while model (3) was derived based on the analytical form). The fact is that model (2), with the constraint of particle conservation and the constraint of μ H = 0 , rendered the same results as the impact ionization model, i.e., model (1); we, thus, we argue that model (2), i.e., the Ross–Nozik model with particle conservation constraints, may present a more general picture of the hot-carrier solar cell. However, we must note that there exists a different perspective regarding this consistence, as reported in Reference [9].

3. Hot-Carrier Dynamics Simulation Based on HETM Model

In the previous section, we focused on the investigation of the competing dynamics between the ‘cool’ and ‘hot’ carriers using the thermodynamic model. In this section, we performed an extended exploration of the hot-carrier relaxation and extraction effect from the point of view of the solar cell device’s performance. For this purpose, the conventional drift-diffusion model was converted into the HETM model, where the hot-carrier energy, ω = 3/2 k T H , was included. The HETM model was based on the hydrodynamic model, including hot-carrier energy transportation using the software Crosslight APSYS®; the drift-diffusion (DDM) model served as a reference and was implemented based on the methods described by References [10,11,12,13]. The main equations used in the HETM model are given as follows [14]:
· ϵ s ψ = q p n + N D + N A
1 q · J n = G + R  
1 q · J p = G R
J n q = μ n n ε c + D n n + S n T n , H  
J p q = μ p p ε c D p p S p T p , H  
t n ω + · Q J n q · ε c = t n ω c ω R G  
Equations (6)–(10) are the familiar Poisson’s equation, current continuity equation, and current density. Here, ϵ s is the semiconductor permittivity;   ψ is the electrostatic potential; p , n , N D + , N A are the hole, electron, donor, and acceptor concentrations, respectively; G and R denote the generation rate and recombination rate; μ n and μ p are the electron and hole mobilities under the electric field; S n and S p are the electron and hole mobilities under the temperature gradient; ε c is the conduction band edge; Q is the energy flux. Note that in (9) and (10), there is an additional contribution to the current density due to the hot-carrier temperature gradient when compared to the standard drift-diffusion simulation (DDM). Equations (6)–(10) physically correspond to the particle conservation of Equation (2) in the thermodynamic detailed balance model [15,16], and the concrete proof is given in Appendix A.
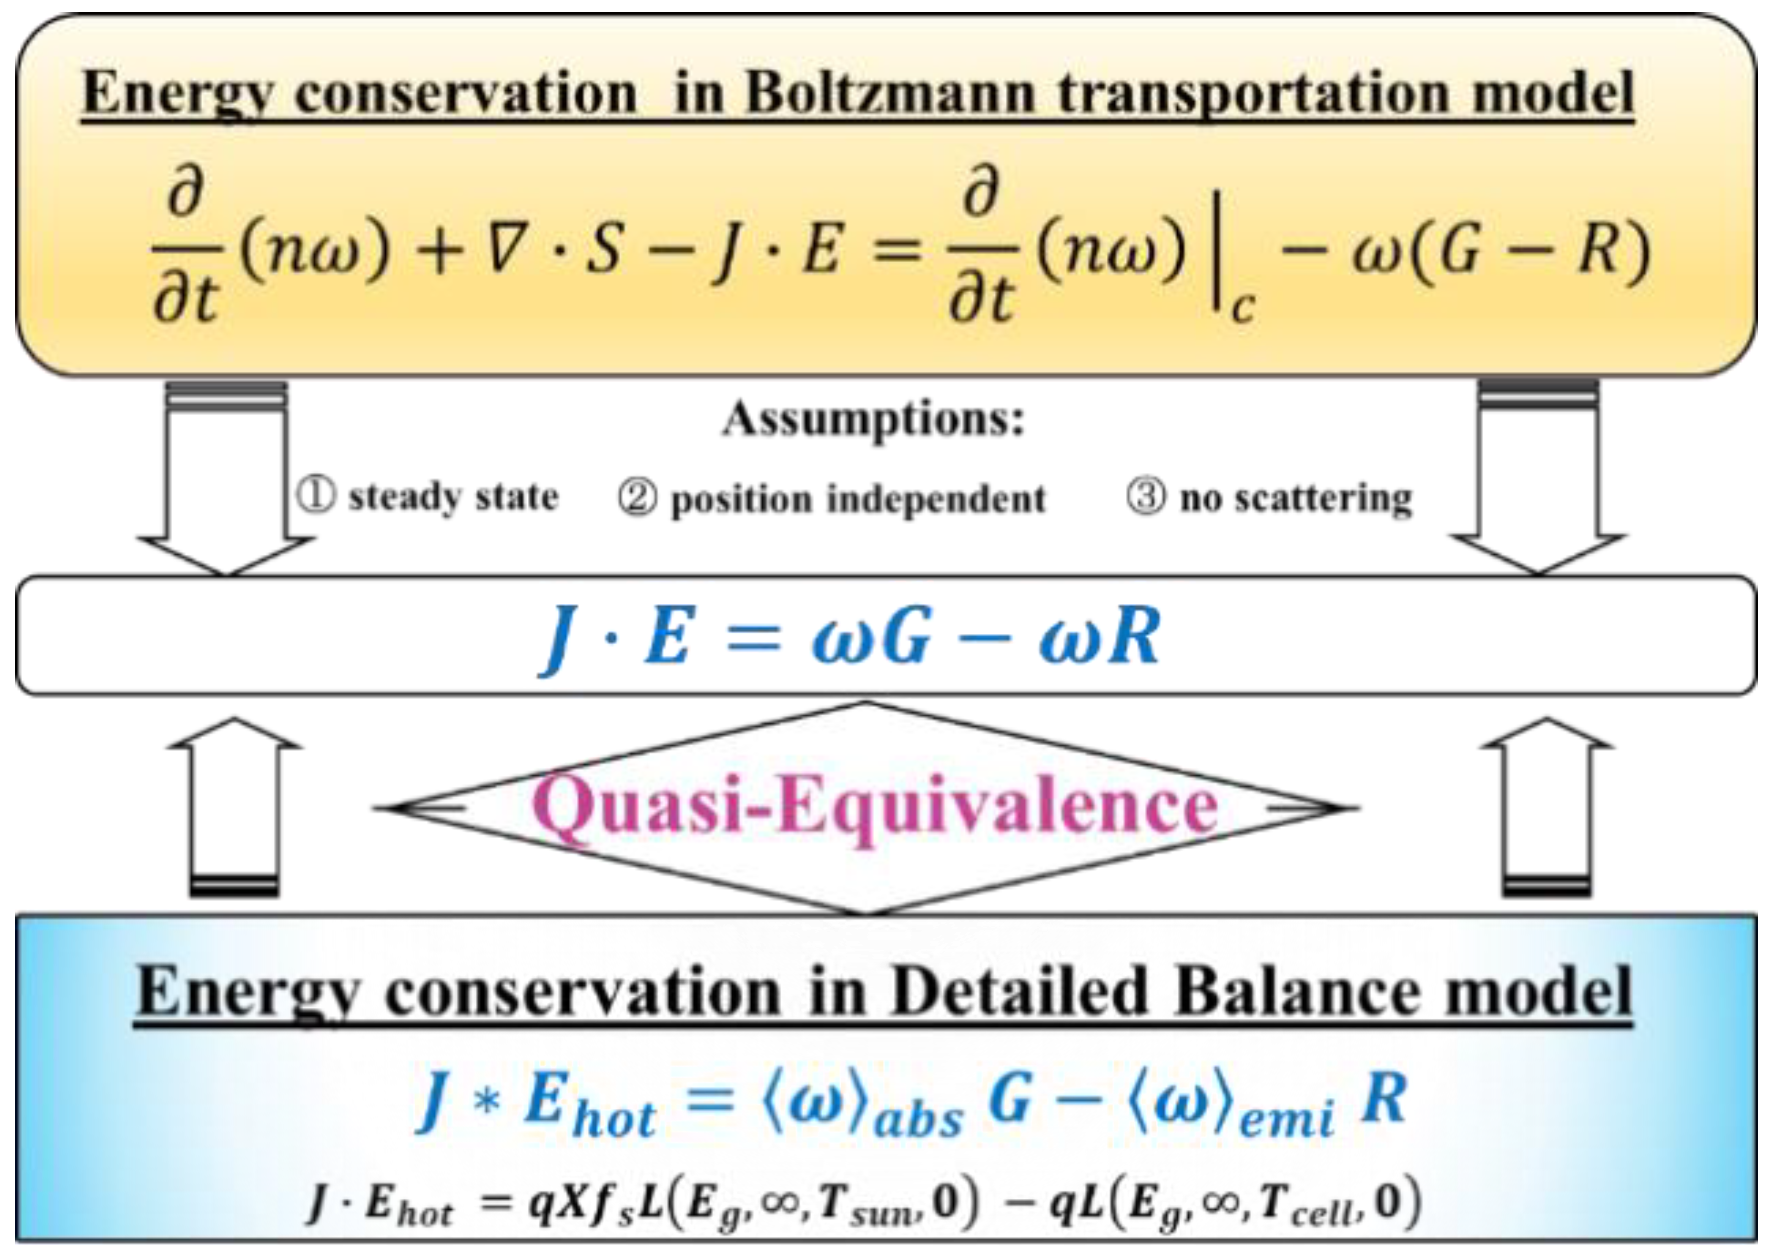
A key feature of the HETM model is the energy balance in Equation (11). Based on the following assumptions, this equation can be simplified to a form that is similar to the energy conservation in Equation (3) shown in Figure 2. ε c here represents the electric field, E . Meanwhile, if we assume an ideal thermodynamic device, there is no position dependence, which leads to · Q = 0 . Meanwhile, if we assume there is no scattering ( τ ω ); thus, t n ω c = 0 . Based on these assumptions and simplifications, Equation (9) can be simplified as:
J · E = ω G ω R
On the other hand, we can reformulate Equation (3) so as to relate the photon currents to energy currents via the introduction of the average energies of the absorbed w a b s and emitted w e m i photons [9]. These average photon energies are given by the absorbed or emitted energy currents, divided by the appropriate photon currents G and R. Equation (3) finally took the following form:
J · E h o t = ω a b s G ω e m i R
As it can be seen from Figure 2, a quasi-equivalence is built between Equations (12) and (13). As is known, E h o t is the most important and governing parameter in the thermodynamic model of hot-carrier solar cells. By comparing Equations (12) and (13), it can be seen that E h o t plays a similar role as the electric field, E , does in Equation (12). This quasi-equivalence relation is conceptually illustrated in Figure 2.
Based on the thermodynamic theoretical framework, we moved to further implement the proposed device simulation concept. 
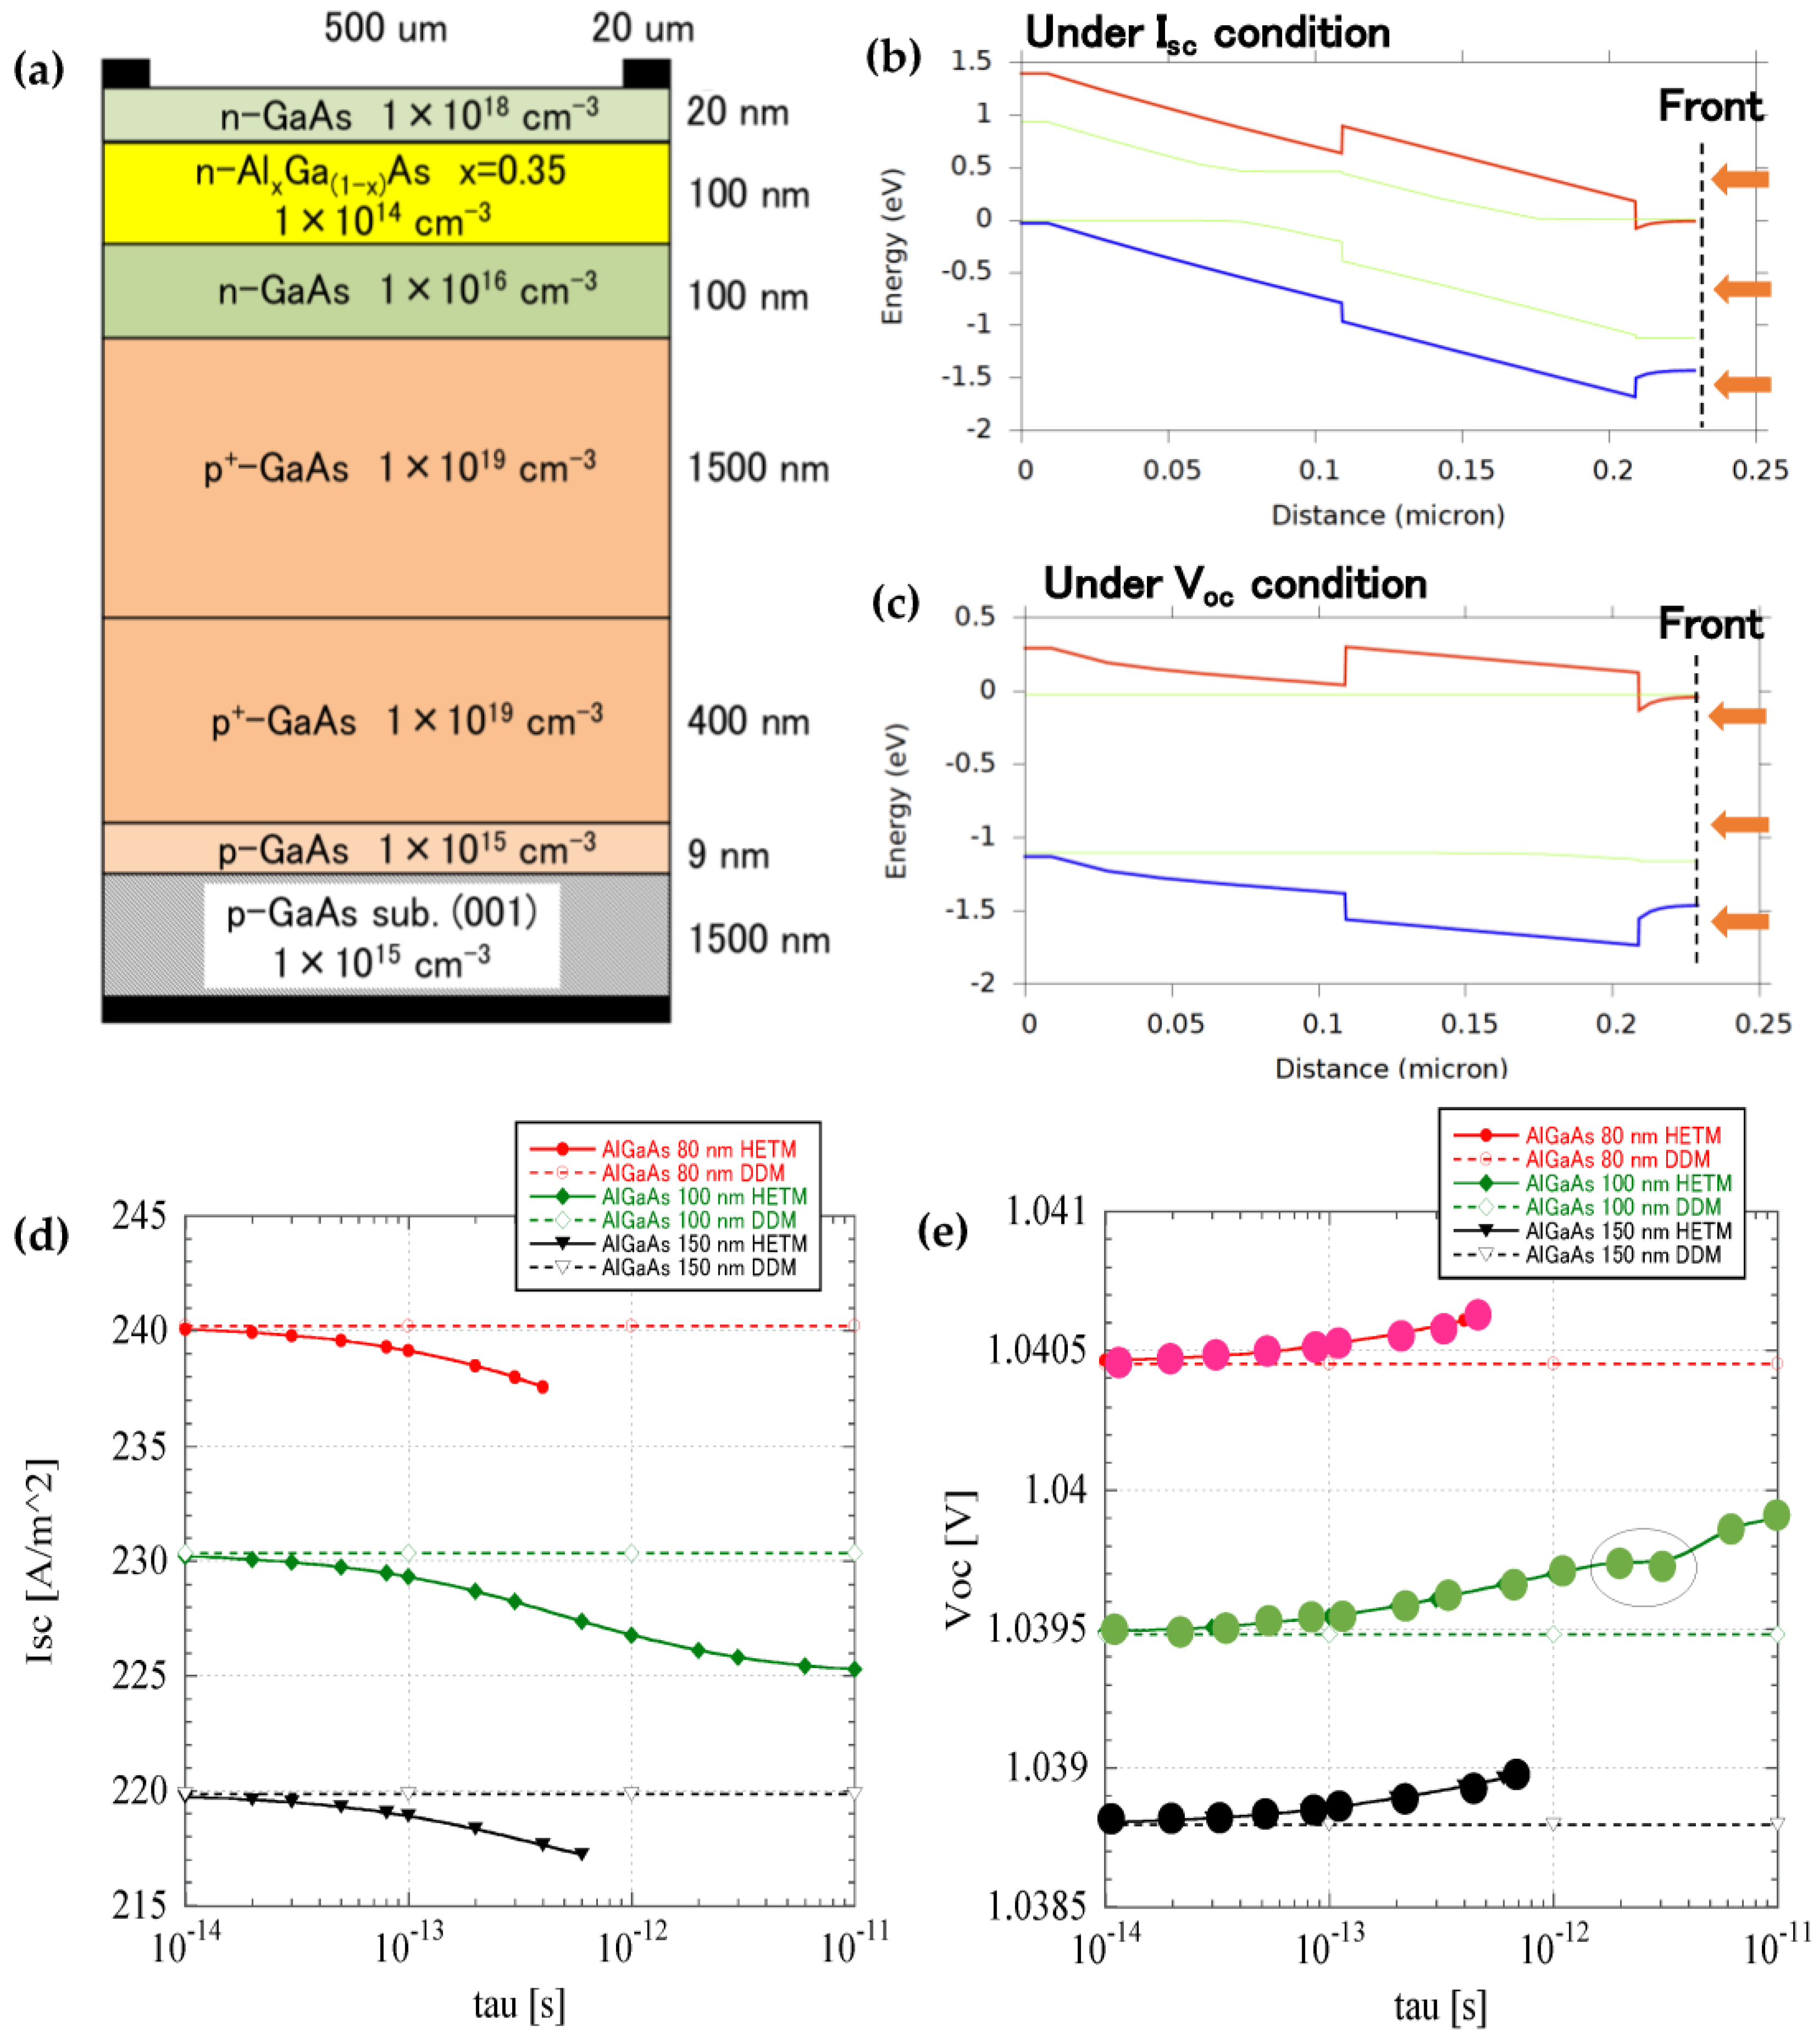
Figure 3a shows the device structure of a specially designed GaAs solar cell. In order to enhance the electric field effect, the intrinsic layer (i-GaAs) was set to 100 nm with a narrow n-type emitter. The hot-carrier dynamics were tuned by varying the thickness of the AlGaAs barrier inserted between the i-GaAs and n-GaAs. Since the focus of the current work was to study the hot-carrier dynamics effect on a conventional solar cell rather than building a hot-carrier solar cell, the selective contact for extracting energy, E h o t , was not considered. Figure 3b,c show the band diagrams at the short-circuit condition and open-circuit voltage condition. The energy-dependent relaxation time, τ ω , was varied from 1 × 10 14   s to 1 × 10 11   s to examine the hot-carrier transportation dynamics. All of these results were compared with those calculated by the conventional DDM model, where the hot-carrier effect was not considered.
From Figure 3d, it can be found that the J s c decreased with the increase of the relaxation time, τ w . The reduction of J s c was attributed to a leak current of the hot electrons at the back electrode, and we expect that an electron, back surface field-block layer could have suppressed the current reduction. As shown in Figure 3e, contrary to the reduction of J s c ,     V o c , simulated under the HETM model, showed a much higher value than the   V o c   simulated by DDM. We will give a more detailed analysis regarding the   V o c variation with τ w in in the next section. Not shown in the figure, the fill factor (FF) was found to be improved in the HETM model, from 83.5% at 1 × 10 14   s to 84.8 at 1 × 10 11   s . The FF increased with the extended carrier relaxation time, indicating the enhanced carrier extraction under ‘hot’ states, which will be discussed in more detail in the next section.

4. Results and Discussion

4.1. Hot-Carrier Temperature Distribution

Figure 4 shows the hot-carrier temperature distribution simulated using the HETM model by varying τ ω under a forward bias of 0.2 V. The plot contains an x-y plot of the temperature distribution together with the 1-D band diagram. We integrated the two plots into one plot to directly compare the electric field and hot-carrier temperature.
It can be seen from Figure 4a that the extension of the carrier relaxation time, τ w , caused a much higher carrier temperature and reached the highest value of more than 1200 K when the τ ω was set as 1 × 10 11   s . We also found that the higher the hot-carrier temperatures were, they mainly distributed around the junction area, and the gradient gradually faded away from the neutral region. Meanwhile, as shown in Figure 4b, the hot-carrier temperature strongly depended on the applied bias voltage, and the forward bias voltage tended to diminish the temperature gradient. When the forward bias was greater than 0.9 V, the temperature of the carrier at the neutral region was found to be even below the lattice temperature (300 K), indicating a ‘cooling’ effect in the device.
A quantitative analysis was presented to gain deeper insight into the spatial distribution of the hot-carrier temperature. If we define ε c as the electric field, E , as we have so far, the scattering term is t n w c n τ ω 3 2 k T H 3 2 k T a , where   T a ,   T H are the lattice and electron temperature, respectively. Then, Equation (11) can be simplified as:
n τ ω 1 T a T H = 2 3 k q T H J n · E G R
Here, we have also ignored the term · Q . It can be seen that under this assumption, there exists a direct link between the hot-carrier temperature and the product of the electron current and electric field ( J n · E ), as well as the net generation   G R .   Phenomenologically, this can be understood as follows: While increasing the forward bias voltage, J n and E both decrease, so their contribution to T e decreases as well. On the other hand, with the increase of the forward bias voltage, the recombination rate, R , increases, and the net generation rate G R decreases accordingly. Therefore, its contribution to the hot-carrier temperature increases, especially when the device is under the V o c condition; thus, J n = 0 and the Equation (14) becomes:
n τ ω 1 T a T H = G R
We plotted both the spatial distribution of J n · E and E together with the hot-carrier temperature under the applied external bias, V b i a s = 0.2   V , as shown in Figure 4c. It was found that the hot-carrier temperature distribution was consistent with the electric field, E , distribution while showing significant deviation from J n · E . On the other hand, it was found that the hot-carrier temperature distribution was strongly correlated with the net generation rate G R when the external bias was at V o c ; these results are presented in Figure 4d. We also found an increase in the hot-carrier temperature with an increase in the relaxation time, i.e., a longer τ ω . All these results are consistent with Equation (15). It is also important to mention that from Figure 4d, we speculate that it is the difference in G R between the HETM and DDM simulation at V o c that induced the increase of V o c in the HETM simulation, as shown in Figure 3e.

4.2. Hot-Carrier Recombination Behavior

In the HETM simulation, we included the Auger, Shockley–Read–Hall (SRH), and radiative recombinations into the simulation. We found that for the device structure studied, an SRH recombination ( ~ 10 8 / c m 3 s ) prevailed over the other two (Auger: ~ 10 9 / c m 3 s ; Radiative: ~ 10 10 / c m 3 s ) for both the HETM and DDM simulations. Including the SRH recombination was for practical purposes since realistic solar cells usually suffer energy dissipation, and its effect is comparable to that of the radiative recombination or even stronger [17]. Note that the recombination rate strongly depended on the applied bias voltage. This means that the SRH was the dominating recombination and directly affected the device’s performance, especially the fill factor. Detailed analysis results are given in Figure 5a–d, where the calculated three recombination dependencies of the relaxation time are given under the forward bias of 0.9 V. Meanwhile, in order to better understand the hot-carrier effect, we plotted the difference between the HETM and DDM models. As shown in Figure 5, the Auger, radiative, and SRH recombinations showed different tendencies for the two models: the HETM showed a much higher value for the Auger and radiative recombinations than the DDM but a lower value for the SRH recombination. It is also interesting to note that extending the relaxation time enhanced the tendency, i.e., longer lifetime, rendering a further higher value for the Auger and radiative recombinations and a further lower value for the SRH recombination. The lower value of the SRH at 0.9 V contributed to the higher fill factor obtained from the HETM simulation, as mentioned in the previous section. It is worth noting that, unlike the electric field, the spatial distribution profile for the three recombinations showed no consistency with the spatial distribution profile of the hot-carrier temperature. This is indicated by the dotted line shown in Figure 5, which shows that the SRH minimal position keeps constant for all four types of relaxation time.

4.3. Increase of V o c in HETM Simulation

At last, we proceed further to disclose the reason for the increase of the V o c obtained from the HETM model from three different points of view:

4.3.1. Simplification of Two-Temperature J-V Relation:

A straightforward strategy to simplify the J-V relation of the two-temperature HETM is to take the analog of the conventional one-temperature J-V model with the temperature dependence for the related parameters. The final form is described in Equation (16), and a more detailed proof for this simplification is given in Appendix A.2.
V o c , H E T M m T H k T a ln J s c J 0 T H + 1  
Here, the m T H   represents the temperature dependent ideality factor; J 0 T H   is the temperature-dependent recombination currents, such as SRH, Auger, and radiative recombinations. As mentioned before, the J 0 , calculated by the HETM, was found much higher than the ones calculated by the DDM. Meanwhile, the device temperature, T H , at the condition of V o c was almost equal to T a = 300   K ; so, the only parameters which contributed to the increase of V o c was the ideality factor m T H .   A simple relation between the fill factor and ideality factor has been derived by Green [18], which states that the increase of the fill factor would cause a decrease in the ideality factor. As mentioned in Section 3, an increase of the FF is found by using the HETM model, thus, leading to a decrease of m T H and, therefore, a decrease of V o c , which is contradictory to the simulation results. From the analysis above, we found that Equation (16) failed to interpret the increase of V o c , calculated by using the HETM. In other words, a simplified J-V diode model is not applicable for analysing the HETM results. This is reasonable because the energy conservation part is not included in the approximation, as shown in Appendix A.2.

4.3.2. Energy Conservation Analysis

In principle, the difference between the DDM and HETM is the applied energy conservation law in the HETM model. The increase of V o c should be fully understood through the closed-form of Equation (11). At V o c , the current J n = 0 in Equation (11), which was then reduced to Equation (15). This is an incredibly significant result for understanding the HETM model. We found that ( G R ) depended on the carrier temperature, T H , and relaxation time, τ w . Although further investigation is needed to gain deeper insight into this issue, ( G R ) remaining nonzero at V o c is considered to be the most decisive factor which altered the V o c value in the HETM simulation.

4.3.3. Thermodynamic Analysis

We can also address the increase of V o c from an alternative thermodynamic point of view. As described in Equation (1) and Figure 1b, when a hot-carrier solar cell approaches its   V o c , the carrier temperature,   T H , will increase, which will inevitably cause the reduction of μ H . However, in our current simulation model, since we have not yet included the carrier separation term, E h o t , as designed in Figure 1, the   V o c represented here will only be controlled by the first half of Equation (1): μ H T a T H . If the T H is higher than the T a , μ H must increase to compensate for the drop due to the increase of the carrier temperature. This is the reason for the increased   V o c observed here, which will decrease in a normally operated hot-carrier solar cell, assuming the E h o t can be correctly incorporated into the current hydrodynamic and energy transportation model. In addition, it is worthwhile to mention that the increases in   V o c   can be converted to evaluate the hot-carrier temperature.
Our future investigation will be focused on the competing principle in Equation (15) between the net generation rate ( G R ) and the product of J n · E . We will compare this competing principle with the competing behavior between the ‘hot’ and ‘cool’ processes explained in the thermodynamic detailed balance model section. Meanwhile, in the current work, we have ignored the analysis regarding the energy flux · Q and will be given full investigation regarding its effect on V o c .

5. Conclusions

Hot-carrier dynamics in GaAs-based solar cells were studied by using the HETM by varying the hot-carrier relaxation time, and the results were compared to those simulated by using the DDM. It was found that the J s c tends to decrease with the increase of the hot-carrier relaxation time and showed a lower value in the energy transport model than in the DDM model. The   V o c , on the contrary, showed a much higher value and was analyzed based on the thermodynamic model and energy conservation in the HETM simulation. A detailed analysis regarding the carrier temperature distribution and its relation to the electric field and net generation rate ( G R ) was presented. Lastly, the increase of   V o c was interpreted in different models and found that the net generation rate ( G R ) is possibly the key factor.

Author Contributions

Conceptualization, T.S. and K.S. (Katsuyoshi Sakamoto); Data curation, K.S. (Kodai Shiba) and K.S. (Katsuyoshi Sakamoto); Methodology, T.S. and K.S. (Kodai Shiba); Supervision, T.S.; Writing—original draft, T.S. All authors have read and agreed to the published version of the manuscript.

Funding

This research was funded by the New Energy and Industrial Technology Development Organization (NEDO) under grant number NEDO P20015.

Institutional Review Board Statement

Not applicable.

Informed Consent Statement

Not applicable.

Data Availability Statement

The data that support the findings of this study are available from the corresponding authors upon reasonable request.

Acknowledgments

We wish to acknowledge the financial support from the New Energy and Industrial Technology Development Organization (NEDO) and from the Ministry of Economy, Trade, and Industry (METI), Japan.

Conflicts of Interest

The authors declare no conflict of interest.

Appendix A

Here, we gave a detailed derivation of the famous Shockley’s diode equation from merely the thermal dynamic model with the particle conservation constraints model described in Equation (2). The explicit form of Equation (2) is given as below:
J = 0 q A E b e a r t h E + q A E b s u n E q B E   b e μ dE  
b e a r t h E = g X   E 2 exp E k T e a r t h 1 g X   E 2 e x p E k T e a r t h
b s u n E = g X E 2 exp ( E k T s u n )  
  b e μ = g X E 2 exp ( E μ k T H )  
Here, the T e a r t h is the same as the environmental temperature, T a , and A E is the absorbance; B E   is the emissivity; b e a r t h E and b s u n E are the photon flux density from the earth and the sun, respectively. b e μ is the photon flux emitted from the solar cell device.

Appendix A.1. Derivation with the Assumption of T H = T e a r t h

In order to show the equivalence to Shockley’s diode equation, we have assumed here that the solar cell device is in thermal equilibrium with the environmental temperature, T e a r t h ; thus, T H = T e a r t h . In other words, the hot-carrier effect is not considered for this proof of concept. The g X   is the coefficient depending only on the concentration ratio X . By assuming the detailed balance principle, i.e., A E = B E , Equation (A1) can be further simplified as:
J = 0 q A E b e a r t h E + q A E b s u n E q A E   b e a r t h μ dE  
J = 0 q A E b s u n E dE   0 q A E b e a r t h μ dE   0 q A E   b e a r t h E dE  
J = 0 q A E b s u n E dE   q 0 A E   b e a r t h μ b e a r t h E dE  
Using the Equations (A2) and (A4), Equation (A7) can be further simplified as:
J = 0 q A E b s u n E dE   q g X E g A E E 2 e x p E k T e a r t h d E   exp μ k T e a r t h 1
J = J s c q g X E g A E E 2 e x p E k T e a r t h d E   exp μ k T e a r t h 1
Here, we have defined the photon flux density from the sun as the short-circuit current density, J s c .
So far, we have expanded and reformed Equation (2) under merely the thermal dynamic framework. From now on, we will demonstrate how Equation (A9) is equivalent to the current–voltage relation of the Shockley diode equation based on the normal DDM (drift-diffusion model). At first, we assume a simple PN diode model, as shown in Figure A1.
Figure A1. A simplified PN diode model for both drift-diffusion simulation and thermal dynamic simulation.
Electronicmat 03 00016 g0a1
Recall that the absorbance of A E is calculated as follows:
A E = 1 e x p α E d
Here, the α E is the absorption coefficient and d is the device thickness. A key assumption is used here to approximate the device thickness. We adopted the diffusion length for the electron and hole as l e   a n d   l h   and define the effective device thickness as d l e + l h . Using the effective device thickness, along with a first-order Taylor expansion, Equation (A10) can be described as:
A E = 1 e x p α E d α E d = α E l e + l h  
Inserting Equation (A11) into Equation (9), the following formula is obtained:
J = J s c l e + l h   q g X   E g α E   E 2 e x p E k T e a r t h d E   exp μ k T e a r t h 1
During most of the simulation, the absorption coefficient, α E , can be treated as a constant; thus, α E α ; thus, Equation (A12) can also be written as:
J = J s c l e + l h   q g X   α E g   E 2 e x p E k T e a r t h d E   exp μ k T e a r t h 1  
Here, we introduce the generation rate at the thermal equilibrium, G e h 0 , defined based on the reference (p75, P. Würfel and U. Würfel, Physics of Solar Cells: From Basic Principles to Advanced Concepts, 3rd edition):
G e h 0 = g X   α   E g   E 2 e x p E k T e a r t h d E  
Then, Equation (A12) is reformulated as:
J = J s c l e + l h   q G e h 0   exp μ k T e a r t h 1  
The G e h 0 can be further approximated by using the recombination rate, R e h 0 , at the thermal equilibrium under the detailed balance principle:
G e h 0 = R e h 0  
Recall that the recombination rate, R e h 0 , is usually governed by the inverse of the minority carrier lifetime and has the explicit form of:
  R e h 0 = n e P τ e = n h N τ h   ,
where
n e P = n i 2 N A ,   n h N = n i 2 N D ,   τ e = l e 2 D e ,   τ h = l h 2 D h  
In Equations (A17) and (A18), we have assumed the intrinsic carrier concentrate as n i , the doner concentration as N D , and the acceptor concentration as N A ; the minority electron and hole lifetimes are τ e and τ h ; the electron and hole diffusion coefficients are D e and D h . n e P , which stands for the electron concentration at the P-side of the PN diode, and n h N stands for the hole concentration at the N-side of the PN diode. We have also used the Einstein relation to link the minority carrier lifetime with the diffusion length. Using Equations (A17) and (A18), Equation (A15) can be rewritten as:
J = J s c q l e + l h   n e P τ e   exp μ k T e a r t h 1  
J = J s c q l e n e P τ e + l h n e P τ e   exp μ k T e a r t h 1  
Using the relation described in Equation (A17), Equation (A20) is further described as follows:
J = J s c q n i 2 D e l e N A + D h l h N D   exp q V   k T e a r t h 1   w i t h   μ = q V  
J = J s c J 0   exp q V   k T e a r t h 1   w i t h     J 0 = n i 2 D e l e N A + D h l h N D  
Since the photon absorption from the earth is usually negligible, Equation (A22) can be further simplified as:
J J s c J 0   exp q V   k T e a r t h
The second part of Equation (A21) is precisely Shockley’s diode equation. Schokley’s diode equation can be derived based on the well-known DDM (drift-diffusion model), and the detailed derivation can be easily found in most semiconductor physics textbooks. Note that none of the drift-diffusion models have been used during the derivation of (A21). Thus, we show that Equation (2), in the main text, does show an equivalence to the Equations (7)–(10) under the assumption of T H = T e a r t h .

Appendix A.2. Derivation with the Assumption of T H   T e a r t h

Now, let us consider the solar cell temperature under the condition in which the solar cell temperature is different from the environment. For the sake of simplicity, we omitted the photon absorption from the earth; therefore, Equation (A1) can be simplified as:
J = 0 q A E b s u n E dE   0 q B E b e μ dE    
Again, we apply the detailed balance principle and write the explicit form of Equation (A24) as:
J = 0 q A E b s u n E dE   q g X E g A E E 2   e x p E μ k T H   d E
In order to make an easy comparison with the model in the previous section under the condition of Appendix A.1, i.e., T H = T e a r t h ,
J = 0 q A E b s u n E dE   q g X E g A E E 2   e x p E μ k T e a r t h   · k T e a r t h k T H   d E
Here, we introduce a temperature ratio, β H , between T H   a n d   T e a r t h
β H = T e a r t h T H
Thus, Equation (A26) can be written as:
J = 0 q A E b s u n E dE   q g X E g A E E 2 exp E   β H k T e a r t h   e x p μ β H k T e a r t h     d E
If we assume the same effective device thickness as l e + l h , Equation (A27) can be further expanded as:
J = 0 q A E b s u n E dE   l e + l h   q g X   E g α E   E 2 exp E   β H k T e a r t h   d E   e x p μ β H k T e a r t h    
Since β H is not dependent energy, E , we introduce the following conversion variable to simplify Equation (A28). We also assumed a constant absorption coefficient to simplify the integration part of Equation (A28):
E   β H = E β μ β H = μ β E = 1 β E β α E = α
Under these conditions, Equation (A28) can be rewritten as:
J = J s c 1 β 3 l e + l h   q g X   α   E g , β   E β 2 exp E β k T e a r t h   d E β   e x p μ β   k T e a r t h  
If we compare Equation (A13) with Equation (A29), we find that, except for some additional constant terms related to the temperature scaling factor, β , these two formulas are precisely the same if we treat the hot-carrier solar cell as operating under the energy range scaled by the factor of 1 β . At last, we can approximately write Equation (A29) as the form of the drift-diffusion model under the temperature scaling factor of β :
J = J s c q 1 β 3 n i 2 D e l e N A + D h l h N D   exp q V β   k T e a r t h  
J = J s c J 0 β   exp q V β   k T e a r t h  
We also present its logarithmic form at the open-circuit voltage when J = 0 , which is used in Equation (16).
V o c , β = k T e a r t h ln J s c J 0 β    
Note, again, that we derived Equation (A31) without using the HETM model containing Equations (7)–(10) listed in the main text. Even when we treat the hot-carrier cell with the device temperature, other than the environment temperature, we can still derive the results with a similar form to those based on the drift-diffusion model. Of course, caution must be paid here because the results should be, in principle, compared to the analytical form based on the HETM model, which is not available. We will tackle it in our further investigation.

References

  1. Würfel, P.; Würfel, U. Physics of Solar Cells: From Basic Principles to Advanced Concepts, 3rd ed.; Wiley-VCH Verlag GmbH & Co. KGaA: Weinheim, Germany, 2016. [Google Scholar]
  2. Nelson, J. The Physics of Solar Cells; Imperial College Press: London, UK, 2003. [Google Scholar]
  3. Dimmock, J.A.R.; Kauer, M.; Wu, J.; Liu, H.; Stavrinou, P.N.; Ekins-Daukes, N.J. A metallic hot-carrier photovoltaic device. Semicond. Sci. Technol. 2019, 34, 064001. [Google Scholar] [CrossRef]
  4. Takeda, Y.; Ichiki, A.; Kusano, Y.; Sugimoto, N.; Motohiro, T. Resonant tunneling diodes as energy-selective contacts used in hot-carrier solar cells. J. Appl. Phys. 2015, 118, 124510. [Google Scholar] [CrossRef]
  5. Catone, D.; Ammirati, G.; O’Keeffe, P.; Martelli, F.; Di Mario, L.; Turchini, S.; Paladini, A.; Toschi, F.; Agresti, A.; Pescetelli, S.; et al. Effects of crystal morphology on the hot-carrier dynamics in mixed-cation hybrid lead halide perovskites. Energies 2021, 14, 708. [Google Scholar] [CrossRef]
  6. Gradauskas, J.; Ašmontas, S.; Sužiedėlis, A.; Šilėnas, A.; Vaičikauskas, V.; Čerškus, A.; Širmulis, E.; Žalys, O.; Masalskyi, O. Influence of hot carrier and thermal components on photovoltage formation across the p–n junction. Appl. Sci. 2020, 10, 7483. [Google Scholar] [CrossRef]
  7. Ross, R.T.; Nozik, A.J. Efficiency of hot-carrier solar energy converters. J. Appl. Phys. 1982, 53, 3813–3818. [Google Scholar] [CrossRef]
  8. Würfel, P. Solar energy conversion with hot electrons from impact ionisation. Sol. Energy Mater. Sol. Cells 1997, 46, 43–52. [Google Scholar] [CrossRef]
  9. Würfel, P.; Brown, A.S.; Humphrey, T.E.; Green, M.A. Particle conservation in the hot-carrier solar cell. Prog. Photovolt. Res. Appl. 2005, 13, 277–285. [Google Scholar] [CrossRef]
  10. Sogabe, T.; Kaizu, T.; Okada, Y.; Tomić, S. Theoretical analysis of GaAs/AlGaAs quantum dots in quantum wire array for intermediate band solar cell. J. Renew. Sustain. Energy 2014, 6, 011206. [Google Scholar] [CrossRef] [Green Version]
  11. Sogabe, T.; Shoji, Y.; Ohba, M.; Yoshida, K.; Tamaki, R.; Hong, H.-F.; Wu, C.-H.; Kuo, C.-T.; Tomić, S.; Okada, Y. Intermediate-band dynamics of quantum dots solar cell in concentrator photovoltaic modules. Sci. Rep. 2015, 4, 4792. [Google Scholar] [CrossRef] [PubMed]
  12. Tomić, S.; Sogabe, T.; Okada, Y. In-plane coupling effect on absorption coefficients of InAs/GaAs quantum dots arrays for intermediate band solar cell. Prog. Photovolt. Res. Appl. 2015, 23, 546–558. [Google Scholar] [CrossRef]
  13. Sogabe, T.; Hung, C.-Y.; Tamaki, R.; Tomić, S.; Yamaguchi, K.; Ekins-Daukes, N.; Okada, Y. Experimental demonstration of energy-transfer ratchet intermediate-band solar cell. Commun. Phys. 2021, 4, 38. [Google Scholar] [CrossRef]
  14. Azoff, E.M. Energy transport numerical simulation of graded AlGaAs/GaAs heterojunction bipolar transistors. IEEE Trans. Electron. Devices 1989, 36, 609–616. [Google Scholar] [CrossRef]
  15. Lee, J.; Honsberg, C.B. Numerical analysis of the detailed balance of multiple exciton generation solar cells with nonradiative recombination. Appl. Sci. 2020, 10, 5558. [Google Scholar] [CrossRef]
  16. Lee, J. Limiting efficiencies of intermediate band solar cells in tandem configuration. Energies 2020, 13, 6021. [Google Scholar] [CrossRef]
  17. Takeda, Y. Hot-carrier solar cells and improved types using wide-bandgap energy-selective contacts. Prog. Photovolt. Res. Appl. 2022, 30, 65–84. [Google Scholar] [CrossRef]
  18. Green, M.A. Solar cell fill factors: General graph and empirical expressions. Solid State Electron. 1981, 24, 788. [Google Scholar] [CrossRef]
Figure 1. (a) The schematic model of the cooling and ‘hot’ competing processes. (b) Simulation results using the detailed balance principle and energy conservation constraints. Here, E g = 1.5   eV and E h o t = 2.1   eV , V= μ o u t / q . T H was scaled down by 40 to fit on the same figure. (c) The limiting efficiency of a hot-carrier cell under 1sun and full sun for various models: (i) hollow circle with a solid line (full sun) and a solid circle with dotted line (1sun) show the particle conservation constrained case where the μ H < 0 ; (ii) hollow square with a solid line (full sun) and a solid square with dotted line (1sun) show the particle conservation constrained case where the μ H = 0 ; (iii) solid line (full sun) and dotted line (1sun) show the relaxed particle conservation where μ H = 0 , which corresponds to the impact ionization, indicating high levels of interaction between hot electrons and holes.
Electronicmat 03 00016 g001
Figure 2. Sketch of the derivation of quasi-equivalence between the energy conservation in a detailed balance model and energy conservation in a Boltzmann transportation model.
Electronicmat 03 00016 g002
Figure 3. (a) Device structure and its corresponding band diagrams under the short−circuit condition (b) and open−circuit condition (c); simulated results for (d) J s c and (e)   V o c ; the solid curve represents the simulation using the HETM model, while the dotted curve represents the simulation using the DDM. In (d,e), the results under different barrier heights are also presented.
Electronicmat 03 00016 g003
Figure 4. (a) Carrier temperature distribution under different relaxation times; (b) carrier temperature dependence on the applied forward voltage; notice that the y-axis for V o c is shown on the right side; (c) carrier temperature distribution together with the spatial distribution of the electric field, E , and the product of J n · E   ; the applied external voltage is 0.2 V; (d) relation between the hot-carrier temperature distribution and spatial distribution difference of the net generation ( G R ) and electric field, E , between the HETM and DDM; the applied external voltage is V o c ; notice that the y-axis for the electric field, E , is shown on the right side.
Electronicmat 03 00016 g004
Figure 5. Carrier temperature distribution under 0.9V and the Auger, SRH, and radiative recombinations for the carrier energy relaxation time: (a)   1 × 10 14   s , (b) 1 × 10 13   s , (c) 1 × 10 12   s , (d) 1 × 10 11   s .
Electronicmat 03 00016 g005
Publisher’s Note: MDPI stays neutral with regard to jurisdictional claims in published maps and institutional affiliations.

