Abstract
The development of lithium-ion batteries (LIBs) based on current practice allows an energy density increase estimated at 10% per year. However, the required power for portable electronic devices is predicted to increase at a much faster rate, namely 20% per year. Similarly, the global electric vehicle battery capacity is expected to increase from around 170 GWh per year today to 1.5 TWh per year in 2030—this is an increase of 125% per year. Without a breakthrough in battery design technology, it will be difficult to keep up with their increasing energy demand. The objective of this investigation is to develop a design methodology to accelerate the LIB development through the integration of electro-chemical numerical simulations and machine learning algorithms. In this work, the Gaussian process (GP) regression model is used as a fast approximation of numerical simulation (conducted using Simcenter Battery Design Studio®). The GP regression models are systematically updated through a multi-objective Bayesian optimization algorithm, which enables the exploration of innovative designs as well as the determination of optimal configurations. The results reported in this work include optimal thickness and porosities of LIB electrodes for several practical charge–discharge scenarios which maximize energy density and minimize capacity fade.
1. Introduction
Lithium-ion batteries (LIBs) with a high energy density, low-capacity fade, long life, and high safety are crucial to increasing the acceptance rate of electric vehicles in the market. Following an incredible amount of research and development on rechargeable LIBs, they are in high demand for energy storage applications such as consumer electronics (cellphones, laptops, medical devices, etc.), hybrid and electric vehicles (EV), and industrial tools. LIBs are in high demand due to their high specific energy density, large specific capacity, high efficiency, and longer cycle life. Furthermore, extensive research has been carried out to meet and satisfy the target of travelling 300 miles with an EV on a single charge. Current research is turning to a series of Ni-rich lithium metal oxides to provide high energy density and capacity for such applications [1,2].
Nickel-rich cathodes provide a high theoretical capacity of up to 279 mAh/g [1]. However, there is a limit to the fraction of nickel that can be used. Some of the main disadvantages of such cathodes are their capacity retention and thermal stability; the capacity fade of Ni-rich electrodes is amplified in thicker configurations [1]. Some popular lithium Ni-cathode materials include , , and as they provide a high operating potential of 3.6 V vs. Li/Li+ [2].
The capacity fade of a battery can be described as the loss in discharge capacity demonstrated by the cell over time. Commonly, the end of service life of a battery is considered at a loss of 80% of its initial capacity [2]. Spotnitz provides a review of technical literature on the characteristics of capacity fade [2], and demonstrates that various commercial cell types experience a capacity fade in the range of 12% to 25% after 500 cycles. Two important parameters that rule the performance of a cell are the thickness and porosity of the active material in the electrodes, e.g., it has been observed that cells with low porosity and thick electrodes present high capacity fades [3]. Other factors that affect the performance of LIBs include the ratio of the active materials to inactive components (conductive materials, binders, separators, current collectors, and electrolytes) and the charge–discharge rates [3].
In the last decade, numerical simulation for degradation analysis of LIBs has gained acceptance in the cell design community. Among the different cell models, the porous electrode technique developed by Newman and Tiedemann [4] has been widely adopted to simulate thermal effects in LIBs [4,5]. For example, Kumaresan, Sikha, and White used the Newman electrochemical–thermal model to determine the solid-phase diffusion coefficient, kinetic constants, and thermal conductivity of LIBs [6]. They found a satisfactory agreement between the predictions of the model and their experiments. In addition to thermal effects, the porous electrode model has been extended to capture the capacity fade of LIBs [2]. Current extensions can predict the capacity fade of large-format stacked prismatic batteries and three-dimensional configurations [7].
With respect to the Newman electrochemical–thermal model, it is worth noting that the estimated effective transport coefficients and interfacial reaction current density are based on homogeneous approximations that do not consider all aspects of the electrode microstructure, which can misrepresent the impact of the porosity and tortuosity on the macro variables of the cell [8,9]. This challenge can be solved by running comprehensive 3D simulations of the complete cell, but at a large computational cost. However, high fidelity 3D models possess limitations on design and optimization tasks where a large number of simulations is needed.
This study employs the Simcenter Battery Design Studio® (BDS), which uses the Newman model to perform numerical simulations of the cycling performance test of 18650 spirally wound cells. Here, charge–discharge rates used for the cycling performance tests are derived from operational scenarios that an EV battery goes through. The simulations are performed using as the cathode material. cathodes have a ordered rock salt-type structures that display layered configurations and present high specific capacities [10]. The 3D model used in BDS is based on the non-linear discretized partial differential equations developed by Fuller et al. [11], modelled for galvanostatic performance of li-ion insertion cells. Sakti et al. [12] conclude from their validation study that the 3D model used in BDS represents ionic diffusion and performance during discharge simulations with sufficient accuracy.
Recently, Bayesian optimization has emerged as an efficient methodology to solve optimization problems that require the evaluation of expensive black-box functions [13]. In a black-box function problem, a closed-form expression of is not available; however, can be evaluated at any location of the design space employing numerical simulations or physical experiments. One example of a black-box function is the simulations of the cycling performance test in BDS. Here, a numerical method solves the partial differential equations that govern the electro-chemical process in order to predict the performance of a LIB cell for a given configuration . The efficiency of Bayesian optimization lies on two components: a probabilistic surrogate model of the black-box function and an acquisition function that guides the optimization.
The surrogate model employs a probabilistic framework to encode prior knowledge about the functional form of . Once new data is observed, this probabilistic formulation is updated following a Bayesian scheme [13,14]. Gaussian process-based models are the most popular surrogate models in Bayesian optimization due to their flexibility and mathematical tractability [15]. This study employs the Gaussian process (GP) regression model [14] to predict the performance of LIB cells under different operational scenarios. The GP regression model employs a mean and a covariance function to generate probabilistic predictions of black-box functions that might involve continuous, discrete, or even categorical variables [14,16].
The acquisition function employs the probabilistic predictions of the surrogate model to determine a sequence of design points that can solve the optimization problem [13,15]. This study employs the Euclidean-based expected improvement (EEI) function [17,18] as the acquisition function that guides the solution of the multi-objective optimization problem. The EEI function combines the probability that a new sample has to improve the current Pareto front, i.e., the probability of improvement (PI), and the Euclidean distance between the centroid of the PI and the nearest Pareto design. The PI promotes the selection of designs that solve the multi-objective problem while the Euclidean distance promotes the generation of a diverse and well-spread Pareto front.
Recently, Bayesian optimization has been utilized in the design of LIB technologies. Some examples include the design of active materials [19,20,21], the design of solid-state [22,23,24,25] and liquid-state electrolytes [26], the design of charging protocols [27,28], and the optimization of battery pack performance [29]. In comparison to the mentioned research works, the two main contributions of this study are (1) the solution of a multi-objective problem that includes the electrode thickness and porosity as the design variables and specific energy and capacity fade as the objective functions, and (2) optimization of the LIB cell for six different operational scenarios, which shades light on the effect of the charge–discharge rate on the performance of LIB cells.
As such, this work presents a design methodology that integrates the simulation software Simcenter Battery Design Studio (BDS) and Bayesian optimization in the design optimization of LIB cells. In this study, 18650 spiral cells with active material that operate under different charge–discharge practical scenarios are optimized. The proposed methodology searches for the thickness and the porosity of the coating of the cell electrodes to optimize two objectives: maximization of the specific energy and minimization of the capacity fade. The results show that for the stated optimization problem, Bayesian optimization performs similarly or better than design approaches that uniformly distribute their samples through the design space. It is observed that Bayesian optimization concentrates its samples in areas that potentially contain high-performance designs. The data generated during the optimization can be also utilized to analyze the effect of the electrode coating thickness, porosity, and charge–discharge protocol in the performance of LIB cells. The methodology identifies a well-defined Pareto front for every charge rate. This study shows how battery manufacturers can leverage battery simulation software and optimization techniques to study the degradation of LIBs and identify high-performance designs.
2. Methodology
The methodology presented in this study utilizes the following components: Gaussian process regression, the EEI acquisition function, and simulations of the cycling performance test in BDS.
2.1. Gaussian Process Regression
A stochastic process extends the application of probability distributions from finite-dimensional random variables to functions [14]. A Gaussian process (GP) is a stochastic process in which every finite collection of its random variables has a multivariate Gaussian distribution, which facilitates the development of powerful models for regression and classification tasks [13,14,30]. Two common names for the use of GPs as surrogate models of black-box functions are GP regression and kriging metamodeling. A GP is defined as
where and are the mean and the covariance functions of the GP. In GP regression, the black-box function is assumed to be generated by the GP defined by and . An intelligent selection of the mean and the covariance functions can lead to powerful regression models that capture prior knowledge about such as global trends and smoothness. A common practice is to build GP regression models with a zero-mean function due to the descriptive power of [31,32].
Valid covariance functions produce positive semi-definite matrices regardless of the chosen pair of points [15,31]. A popular example is the squared exponential (SE) covariance function
where is the variance of the GP and is the characteristic length along the -th input dimension [14]. The variance and the characteristic lengths are known as the hyperparameters of the GP model. Three popular techniques to find appropriate values of the hyperparameters are maximum likelihood estimation (MLE), maximum a posteriori (MAP), and the fully Bayesian approach [15]. This study employs the MLE approach.
Given a set of samples where is a -dimensional vector, with observations , the predictive equations of the GP regression model at the predicting points is
where,
and
Here, is the predictive mean of the GP regression model. It predicts the response of the black-box function at the predictive points . The diagonal of is the predictive variance of the GP regression model. It provides estimates of the uncertainty in the predictions of the surrogate model. In these expressions, is the covariance matrix of the observed data, is the covariance matrix between the observed data and the predicted data, and is the covariance matrix of the predictions. The components of the covariance matrices are generated by the evaluation of the covariance function . Equations (4) and (5) correspond to a GP regression model with a zero-mean function prior. These expressions can be extended to model non-zero mean function priors and noisy data following the procedures in [14]. Figure 1 shows a GP regression model for the capacity fade of a LIB cell type 18650. The regression model uses a constant mean function and a SE covariance function.
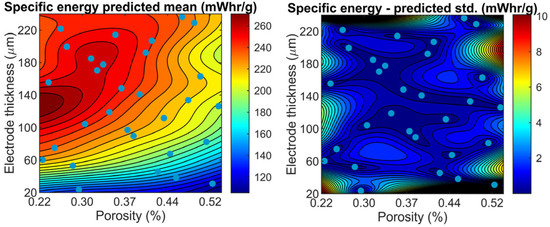
Figure 1.
Gaussian process regression model—Specific energy of the 18650 LIB cell. The left figure shows the predictive mean and the right figure shows the predictive standard deviation, i.e., , of the GP regression model. The blue dots are the samples used to train the surrogate model.
2.2. The Euclidean-Based Expected Improvement
Bayesian optimization has emerged as an efficient gradient-free alternative to solve optimization problems that require the evaluation of expensive black-box functions. This optimization methodology has two main components: a probabilistic surrogate model of the black-box function and an acquisition function (AF) that guides the optimization. The AF utilizes the probabilistic predictions of the surrogate model to quantify the gain that can be attained by a specific design. Through the optimization, the AF is maximized to determine a design that can improve the current sampling plan. Then, this design is sampled. The process of maximization of the AF and sampling, i.e., black-box function evaluation, is repeated until convergence.
This study employs the Euclidean-based expected improvement (EEI) [17,18] as the AF that solves the multi-objective optimization problem. Considering an optimization problem with two objective functions and to be minimized, the evaluation of the two functions using a sampling plan generates an initial Pareto front with designs,
where and is a member of the current Pareto set.
The EEI function is defined as
where is the probability of improving both functions and if the design is sampled, and is the minimum Euclidean distance between the centroid of the probability of improvement and the current Pareto front (Figure 2).
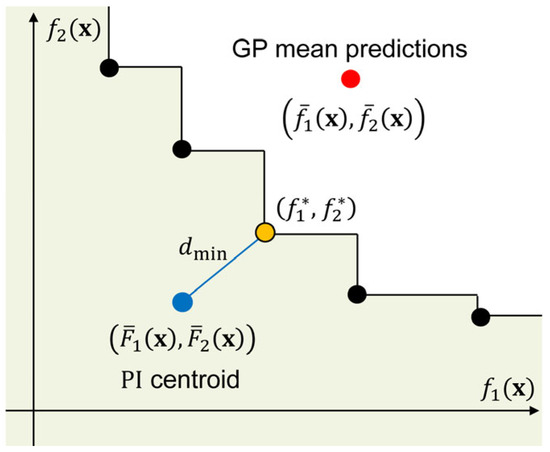
Figure 2.
Euclidean-based expected improvement. The black dots denote the current Pareto front. The design has GP mean predictions and (red dot). The centroid of the probability of improvement (, ) is denoted by the blue dot, and the closest Pareto design () is denoted by the orange dot.
The probability of improvement is
where . Here, is the mean prediction of the -th objective and is the corresponding standard deviation predicted by the GP model at the location .
The centroid of the probability of improvement is given by
where . Here, and are the probability density function and the cumulative density function of a standard normal distribution. is defined similarly.
2.3. Numerical Model
BDS is used to simulate the cycling performance of 18650 spirally wound cells with cathode material (Figure 3). For these cells, the thickness of the separator and current collectors remain constant. Table 1 contains the parameters used to perform the cycling simulations.
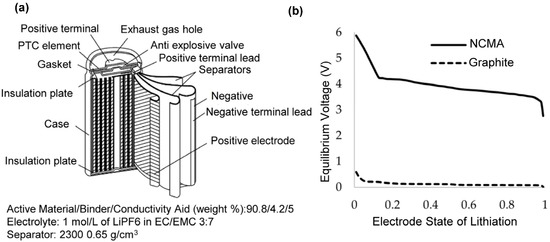
Figure 3.
(a) 18650 cell assembly; (b) Equilibrium voltage curves of the positive electrode and the Graphite negative electrode materials.

Table 1.
Parameters used to perform the BDS cycling simulations.
The motivation behind choosing the cycling rates of this study comes from utilizing BDS and Bayesian optimization for practical EV battery scenarios. As such, this study uses six charge–discharge scenarios: one baseline scenario and five practical EV scenarios.
The baseline charge–discharge scenario is 0.1 C charge–0.1 C discharge as it is commonly used when investigating new materials for LIBs. This low rate scenario is useful to explore the maximum specific energy and minimum capacity fade that can be obtained from the LIB cells.
The current EV market offers a few charging options. A wall connector, which is provided on purchasing an EV, charges from 0% to 100% SOC within 8 to 8.5 h giving an approximate C rate of 0.12 C. Furthermore, today’s superchargers charge the battery using variable C rates to protect the cells from damage. As per data available online, Tesla superchargers, for example, charge batteries initially for a range of 200 miles within 15–20 min, giving us a 3 C-rate. However, if the user decides to charge the battery for 100% SOC, the supercharge rates drop from 3 C to 1.2 C to avoid damaging the battery. EVs present discharge rates that depend on the vehicle speed. The speed limits on highways in the United States of America on average are 70 mph. Popular EVs available in the market have an average range of 300–320 miles. As such, discharge rates that an EV cell undergoes during highway usage at 70 mph is approximately 0.23 C. As such, this study uses five practical charge–discharge scenarios: 0.12 C charge–0.23 C discharge, 0.23 C charge–0.23 C discharge, 0.7 C charge–0.23 C discharge, 1.2 C charge–0.23 C discharge, and 3 C charge–0.23 C discharge.
Furthermore, the weight for the calculation of the specific energy corresponds to the summation of the weights of the cathode, anode, current collectors, separator, and electrolyte.
2.4. Optimization Methodology
The Bayesian optimization methodology presented in this study has four main components: design of experiments (DOE), GP regression models, BDS simulations of the cycling performance of LIB cells, and the EEI acquisition function (Figure 4). The proposed methodology is utilized in the design of LIB cells and the results are compared with a DOE methodology that employs the same number of BDS simulations.
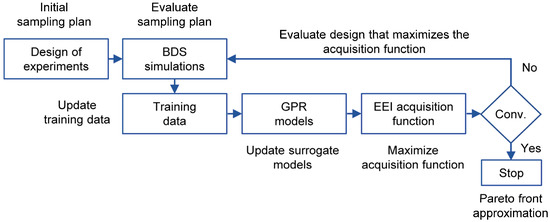
Figure 4.
Bayesian optimization framework for the design of lithium-ion battery cells.
At the beginning of the optimization process, DOE generates a 30-sample sampling plan that represents cells with different electrode thickness and porosities. The DOE technique employed in this study is Latin hypercube sampling. The capacity fade curves of the cells are predicted using BDS. From the BDS simulations, the specific energy and the capacity fade are extracted. Then, two GP regression models for the objective functions and are trained. The GP models employ a constant mean regression function and a squared exponential covariance function. In order to prevent biasing the optimization towards the objective function with the highest magnitude, the data is normalized to the range from 0 to 1. This normalization is also helpful to estimate the accuracy of the GP regression models. After normalization, the EEI function is utilized to identify designs that can improve the current Pareto front: cells with high energy density and low-capacity fade. The design that produces the highest improvement is sampled, i.e., execution of the BDS simulation, in order to update the GP regression models. The maximization of the EEI function and execution of the BDS simulation is repeated until a convergence criterion is satisfied. For comparison purposes, 50 iterations of the Bayesian methodology are executed. The Bayesian optimization results are compared with a Pareto front generated by an 80-sample Latin hypercube sampling plan. The GP regression models are trained independently using the ooDACE toolbox [33]. The genetic algorithm implementation of MATLAB maximizes the EEI function.
3. Results and Discussion
This section employs Bayesian optimization to identify the electrode thickness and porosities of spiral cells type 18650 that can produce high specific energy and low-capacity fade.
The formulation of the optimization problem is
where are the thickness and porosity of the coating of the electrodes of the LIB cell. The upper and lower bounds of the design variables are included in Table 2.

Table 2.
Lower and upper bounds of the porosity and single side electrode coating thickness of the LIB electrodes.
The cyclic performance profiles of the 30-DOE samples for every charge–discharge scenario are shown in Figure 5. Low charge rates do not produce substantial capacity fade (Figure 5a–c),whereas high charge rates lead to a substantial detriment of the cell capacity (Figure 5d,e). This phenomenon illustrates the importance of accounting for an appropriate charge–discharge scenario when designing LIB cells.
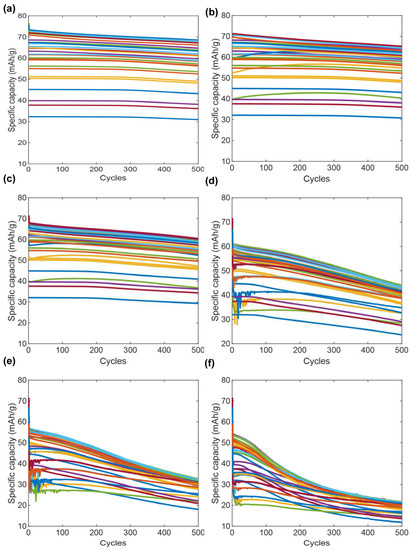
Figure 5.
Capacity fade curves for the DOE cells under different charge rates: (a) 0.1 C charge–0.1 C discharge; (b) 0.12 C charge–0.23 C discharge; (c) 0.23 C charge–0.23 C discharge; (d) 0.7 C charge–0.23 C discharge; (e) 1.2 C charge–0.23 C discharge; (f) 3 C charge–0.23 C discharge.
Figure 6 shows the results of the responses of the initial 30-sample DOE (blue dots), the initial Pareto front (orange dots), the designs that are sampled by Bayesian optimization (gray dots), the Pareto front generated by Bayesian optimization (black dots), the responses of an 80-sample sampling plan (yellow dots), and its corresponding Pareto front (red dots). In the 0.1 C charge–0.1 C discharge case, the proposed methodology clearly outperforms the 80-sample DOE approach as it finds several designs with high specific energy and low capacity fade (Figure 6a). In the remaining scenarios, the initial sampling plan (30 samples) produces a suitable approximation of the Pareto front. Therefore, Bayesian optimization focuses its search towards designs that improve the diversity of the Pareto front. At the end of the optimization, Bayesian optimization and the 80-sample DOE produce Pareto fronts of similar characteristics.
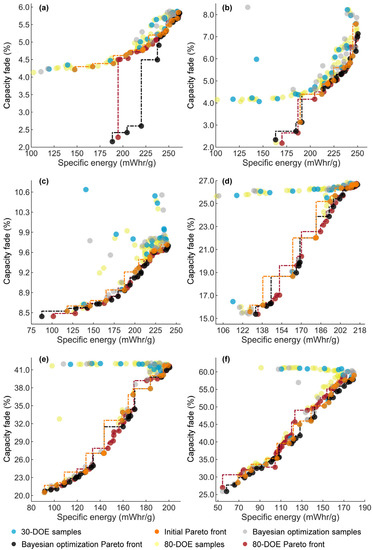
Figure 6.
Optimization results for different charge rates: (a) 0.1 C charge–0.1 C discharge; (b) 0.12 C charge–0.23 C discharge; (c) 0.23 C charge–0.23 C discharge; (d) 0.7 C charge–0.23 C discharge; (e) 1.2 C charge–0.23 C discharge; (f) 3 C charge–0.23 C discharge. The figure shows the responses of the 30-sample DOE, the 50 Bayesian optimization samples, and the 80-sample DOE. The dotted lines represent the Pareto fronts of the initial sampling plan, Bayesian optimization, and the 80-sample DOE.
Table 3 summarizes the outcomes of the optimization methodology. The table contains the number of designs in the initial and final Pareto front, and the specific energy and capacity fade of the designs located at the edges of the Pareto front. Bayesian optimization greatly improves the initial Pareto front for the 0.1 C charge and 0.1 C discharge scenario. The other scenarios do not present extreme variations of the edges of the Pareto front; however, Bayesian optimization finds several designs that improve the diversity of the Pareto front. For high charging scenarios, the difference in lowest and highest capacity fade is drastic, which also affects the discharged specific energy. For such scenarios, the decision can be based of on trade-off, i.e., whether capacity fade should be given more priority over specific energy. In Figure 6a, the difference between minimum and maximum capacity fade is just 3.7% but the difference between specific energies is high, i.e., 73.3 mWhr/g. As such, cell designs that lie in the top right corner of the plot can be considered as optimal designs. This holds true for scenarios (b) and (c). For scenarios (d), (e), and (f) the decision is not straight-forward as there are substantial differences between the maximum and minimum values of specific energy and capacity fade. The designer needs additional information to guide the selection of a design from the Pareto front. Since an EV battery undergoes varied charge–discharge rates during its lifespan, it becomes important to have such data on the performance of cells to devise proper battery management protocols.

Table 3.
Comparison between initial and final Pareto designs.
Figure 7a shows the effect of the charge rate in the degradation of the cell and its ability to store energy. The capacity fade presents large variations with respect to the charge rate. Figure 7b shows the distribution of the optimal designs in the design space. Here, the size of the markers is linked to the specific energy of the cell, i.e., large circles correspond to high specific energies. Figure 7b suggests that optimal configurations are characterized by (1) high electrode thicknesses and low porosities, (2) intermediate electrode thicknesses and intermediate porosities, and (3) low electrode thicknesses and high porosities. Non-optimal configurations correspond to cells with low porosities and low electrode thicknesses, and with high porosities and high electrode thicknesses.
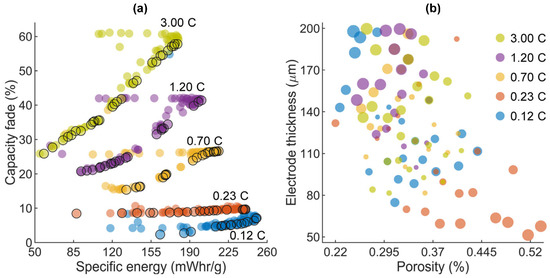
Figure 7.
Summary of optimization results. (a) Distribution of the initial sampling plan and Bayesian optimization samples in the objective space for the charge–discharge scenarios 0.12 C charge–0.23 C discharge, 0.23 C charge–0.23 C discharge, 0.7 C charge–0.23 C discharge, 1.2 C charge–0.23 C discharge, and 3 C charge–0.23 C discharge. (b) Distribution of the optimal designs in the design space. The size of the markers vary according to the specific energy of the design, e.g., large circles correspond to cells with high specific energy and vice versa.
The contour plots in Figure 8 and Figure 9 are the GP mean predictions of the specific energy and capacity fade. The specific energy and capacity fade present different sensitivity with respect to the charge–discharge protocol. The shape of the specific energy does not present a substantial shift as the charge rate grows. On the other hand, the capacity fade is greatly affected. Slow charge–discharge scenarios present a reduced capacity fade. As charging speed increases, the capacity fade decays substantially. For scenario (a), optimal designs are characterized by thick and porous electrodes. For scenarios (b) and (c), results favor the intermediate option where a range of thickness for 100 microns to 200 microns with porosities in the range of 0.24 to 0.33 is preferable. For the fast-charging scenarios, the distribution of the optimal designs is more complicated.
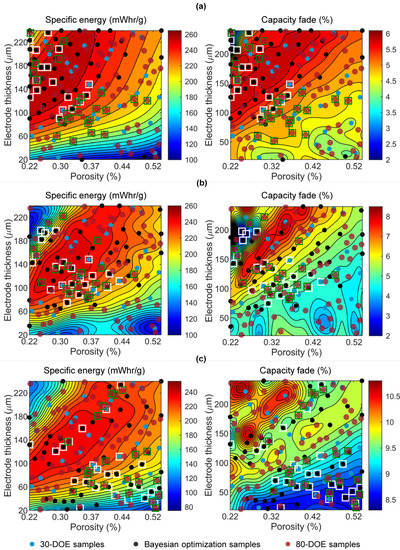
Figure 8.
Gaussian process predictions of the specific energy and capacity fade for charge–discharge scenarios: (a) 0.1 C charge–0.1 C discharge; (b) 0.12 C charge–0.23 C discharge; (c) 0.23 C charge–0.23 C discharge. The blue dots are the initial 30 DOE samples, the black dots are the 50 Bayesian optimization samples, the red dots are the 80 DOE samples. The designs enclosed in white and green squares are the optimal designs from Bayesian optimization and the 80-sample DOE, respectively.
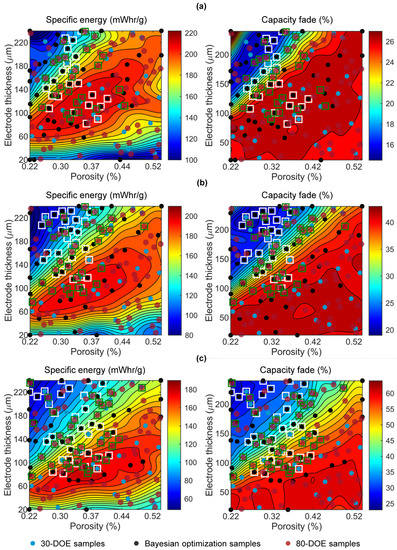
Figure 9.
Gaussian process predictions of the specific energy and capacity fade for charge–discharge scenarios: (a) 0.7 C charge–0.23 C discharge; (b) 1.2 C charge–0.23 C discharge; (c) 3 C charge–0.23 C discharge. The blue dots are the initial 30 DOE samples, the black dots are the 50 Bayesian optimization samples, the red dots are the 80 DOE samples. The designs enclosed in white and green squares are the optimal designs from Bayesian optimization and the 80-sample DOE, respectively.
Figure 8 and Figure 9 are also useful to compare the performance of Bayesian optimization and exhaustive DOE. Bayesian optimization concentrates its samples along zones that potentially contain Pareto designs, while DOE generates a sampling plan with space-filling properties in order to capture the shape of the functions under analysis. For these reasons, Bayesian optimization outperforms the 80-sample DOE approach in the 0.1 C charge–0.1 C discharge scenario since most of the optimal designs are located along the top-left zone of the design space. In the other scenarios, the optimal designs have a more complex distribution, i.e., they are located in different zones of the design space, which favors the performance of the 80-sample DOE approach. In these cases, a satisfactory initial design of experiments will find a suitable approximation of the Pareto front, and Bayesian optimization can be used to refine such an approximation.
In order to assess the performance of the GP regression models, two indices are evaluated: (1) the residuals of the GP regression models when performing leave-one-out cross-validation on the initial training data [17] and (2) the residuals of the GP regression models when using the 80-sample DOE as test data. As stated before, the specific energy and capacity fade are normalized in the range from 0 to 1 to prevent biasing the optimization towards the objective with the highest magnitude. This transformation facilitates the evaluation of the performance of the surrogate models.
Figure 10a shows the box plots of the residuals generated by the two GP regression models when performing leave-one-out cross validation using the initial training data (30-sample DOE). The figure shows a mean deviation of the models close to zero. The GP model of the specific energy present satisfactory predictions; 68% of the residuals present errors lower than 10%. In the case of the capacity fade, two of the charging scenarios present errors larger than 10% but lower than 25%. Figure 10a also displays the presence of a few outliers where the model does not provide a suitable prediction of the function. Figure 10b shows the residuals of the GP regression model when using the 30-sample DOE as the training data and the 80-sample DOE as the test data. In here, the residuals concentrate around zero and present deviations lower than 15%. As there is a large number of testing points, the presence of outliers also increases. These values suggest an overall satisfactory performance of the GP regression models.
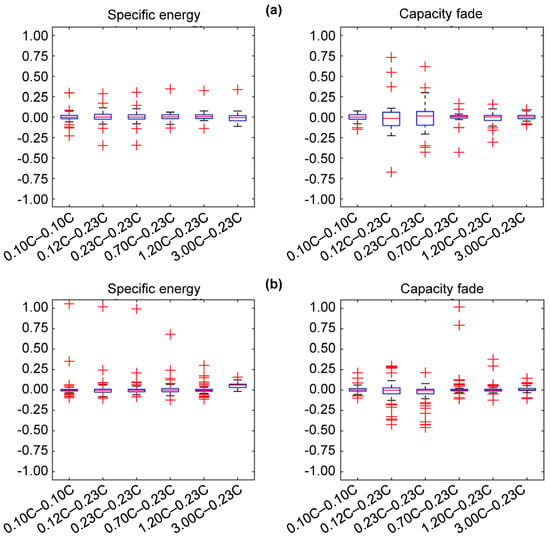
Figure 10.
Performance of the GP regression models of the specific energy and capacity fade. (a) Box-plots of the residuals of the GP models from leave-one-out cross-validation. (b) Box-plots of the residuals of the GP models using the 80-sample DOE as test data.
4. Conclusions
This study employs Battery Design Studio and Bayesian optimization to design spiral LIB cells type 18650 with cathode active material . The cells are designed for maximum specific energy and minimum capacity fade under six charge–discharge scenarios. The design variables of the optimization problem are the thickness and porosity of the LIB electrodes. The cells are optimized holding the porosity and thickness of the anode and cathode to a 1:1 ratio and keeping constant the thickness and porosity of the separator, and the electrolyte concentration.
The optimization methodology finds several designs for every scenario that have high energy density and low-capacity fade. The results show that a design that performs well in one charge–discharge scenario may not be optimal in another scenario. In the case of low charge rates, it is observed that optimal configurations are characterized by high electrode thicknesses and low porosities, or intermediate electrode thicknesses and intermediate porosities. In the case of fast charge scenarios, the distribution of the optimal designs is more complicated. The results also suggest that cell configurations with low porosities and low electrode thicknesses, and high porosities and high electrode thicknesses, can present poor performance.
The results of the proposed methodology are obtained with an initial sampling plan of 30 samples and 50 iterations of the Bayesian optimization algorithm. These results are compared with an 80-sample Latin hypercube sampling plan. This process was repeated for every charge and discharge scenario, giving us a total of 960 simulations. It is observed that Bayesian optimization performs similarly or better than the 80-sample DOE approach. Bayesian optimization concentrates its samples in areas that potentially contain high-performance designs whereas the DOE approach samples the design space uniformly.
Further extension of this study involves the inclusion of microstructural properties in the optimization process by using 3D microstructural models. These microstructural models will enable the definition of three additional design variables: particle size, particle distribution, and tortuosity. This strategy can be useful to understand the factors that limit the performance of LIB cells and the effect of charge and discharge scenarios.
Author Contributions
Conceptualization, A.G., H.V., A.T., L.Z. and H.E.-M.; methodology, A.G. and H.V.; software, A.G. and H.V.; formal analysis, A.G. and H.V.; investigation, A.G. and H.V.; resources, A.T., L.Z. and H.E.-M.; data curation, A.G. and H.V.; writing—original draft preparation, A.G. and H.V.; writing—review and editing, A.G., H.V., A.T., L.Z. and H.E.-M.; visualization, A.G. and H.V.; supervision, A.T., L.Z. and H.E.-M.; project administration, L.Z.; funding acquisition, A.T., L.Z. and H.E.-M. All authors have read and agreed to the published version of the manuscript.
Funding
This article is derived from the Subject Data funded in whole or part by the United States Agency for International Development (USAID) and the National Academy of Sciences (NAS) through Subaward 2000010562. Any opinions, findings, conclusions, or recommendations expressed in this article are those of the authors alone, and do not necessarily reflect the views of USAID or NAS. Additionally, this manuscript is based upon work supported by the National Science Foundation under Grant No. 2028630 and a research grant from the Institute of Integrative Artificial Intelligence at Indiana University-Purdue University Indianapolis (IUPUI). The authors gratefully acknowledge this support. Any opinions, findings, conclusions, or recommendations expressed in this manuscript are those of the authors and do not necessarily reflect the views of the National Science Foundation or the Institute of Integrative AI at IUPUI.
Data Availability Statement
The data that support the findings of this study are available on request from the corresponding authors.
Acknowledgments
We also would like to acknowledge Siemens PLM for providing the software tool used to run the battery performance simulation, namely BDS (Battery Design Studio).
Conflicts of Interest
The authors declare no conflict of interest.
References
- Nam, G.W.; Park, N.-Y.; Park, K.-J.; Yang, J.; Liu, J.; Yoon, C.S.; Sun, Y.-K. Capacity Fading of Ni-Rich NCA Cathodes: Effect of Microcracking Extent. ACS Energy Lett. 2019, 4, 2995–3001. [Google Scholar] [CrossRef]
- Spotnitz, R. Simulation of capacity fade in lithium-ion batteries. J. Power Source 2003, 113, 72–80. [Google Scholar] [CrossRef]
- Du, Z.; Wood, D.L.; Daniel, C.; Kalnaus, S.; Li, J. Understanding limiting factors in thick electrode performance as applied to high energy density Li-ion batteries. J. Appl. Electrochem. 2017, 47, 405–415. [Google Scholar] [CrossRef]
- Newman, J.; Tiedemann, W. Porous-electrode theory with battery applications. AIChE J. 1975, 21, 25–41. [Google Scholar] [CrossRef] [Green Version]
- Gomadam, P.M.; Weidner, J.W.; Dougal, R.A.; White, R.E. Mathematical modeling of lithium-ion and nickel battery systems. J. Power Source 2002, 110, 267–284. [Google Scholar] [CrossRef]
- Kumaresan, K.; Sikha, G.; White, R.E. Thermal model for a Li-ion cell. J. Electrochem. Soc. 2007, 155, A164. [Google Scholar] [CrossRef]
- Kim, G.-H.; Smith, K.; Lee, K.-J.; Santhanagopalan, S.; Pesaran, A. Multi-Domain Modeling of Lithium-Ion Batteries Encompassing Multi-Physics in Varied Length Scales. J. Electrochem. Soc. 2011, 158, A955. [Google Scholar] [CrossRef]
- Xue, N.; Du, W.; Gupta, A.; Shyy, W.; Sastry, A.M.; Martins, J. Optimization of a Single Lithium-Ion Battery Cell with a Gradient-Based Algorithm. J. Electrochem. Soc. 2013, 160, A1071. [Google Scholar] [CrossRef] [Green Version]
- Gupta, A.; Seo, J.H.; Zhang, X.; Du, W.; Sastry, A.M.; Shyy, W. Effective Transport Properties of LiMn2O4 Electrode via Particle-Scale Modeling. J. Electrochem. Soc. 2011, 158, A487. [Google Scholar] [CrossRef] [Green Version]
- Beard, K.W. Linden’s Handbook of Batteries; McGraw-Hill Education: Berkshire, UK, 2019. [Google Scholar]
- Fuller, T.F.; Doyle, M.; Newman, J. Simulation and Optimization of the Dual Lithium Ion Insertion Cell. J. Electrochem. Soc. 1994, 141, 1. [Google Scholar] [CrossRef] [Green Version]
- Sakti, A.; Michalek, J.J.; Chun, S.-E.; Whitacre, J.F. A validation study of lithium-ion cell constant c-rate discharge simulation with Battery Design Studio®. Int. J. Energy Res. 2012, 37, 1562–1568. [Google Scholar] [CrossRef]
- Shahriari, B.; Swersky, K.; Wang, Z.; Adams, R.P.; De Freitas, N. Taking the Human Out of the Loop: A Review of Bayesian Optimization. Proc. IEEE 2015, 104, 148–175. [Google Scholar] [CrossRef] [Green Version]
- Rasmussen, C.E.; Williams, C.K. Gaussian Process for Machine Learning. Adaptive Computation and Machine Learning; MIT Press Cambridge: Cambridge, MA, USA, 2006. [Google Scholar]
- Frazier, P.I. A tutorial on Bayesian optimization. arXiv 2018, arXiv:1807.02811. [Google Scholar]
- Cressie, N. Statistics for spatial data. Terra Nova 1992, 4, 613–617. [Google Scholar] [CrossRef]
- Forrester, A.; Sobester, A.; Keane, A. Engineering Design via Surrogate Modelling: A Practical Guide; John Wiley & Sons: Weinheim, Germany, 2008. [Google Scholar]
- Keane, A. Statistical Improvement Criteria for Use in Multiobjective Design Optimization. AIAA J. 2006, 44, 879–891. [Google Scholar] [CrossRef]
- Karasuyama, M.; Kasugai, H.; Tamura, T.; Shitara, K. Computational design of stable and highly ion-conductive materials using multi-objective bayesian optimization: Case studies on diffusion of oxygen and lithium. Comput. Mater. Sci. 2020, 184, 109927. [Google Scholar] [CrossRef]
- Valladares, H.; Li, T.; Zhu, L.; El-Mounayri, H.; Hashem, A.M.; Abdel-Ghany, A.E.; Tovar, A. Gaussian process-based prognostics of lithium-ion batteries and design optimization of cathode active materials. J. Power Source 2022, 528, 231026. [Google Scholar] [CrossRef]
- Valladares, H.; Li, T.; Zhu, L.; El-Mounayri, H.; Hashem, A.; Abdel-Ghany, A.E.; Tovar, A. Bayesian Optimization of Active Materials for Lithium-ion Batteries. In SAE WCX Digital Summit; SAE International: Warrendale, PA, USA, 2021. [Google Scholar]
- Harada, M.; Takeda, H.; Suzuki, S.; Nakano, K.; Tanibata, N.; Nakayama, M.; Karasuyama, M.; Takeuchi, I. Bayesian-optimization-guided experimental search of NASICON-type solid electrolytes for all-solid-state Li-ion batteries. J. Mater. Chem. A 2020, 8, 15103–15109. [Google Scholar] [CrossRef]
- Nakano, K.; Noda, Y.; Tanibata, N.; Takeda, H.; Nakayama, M.; Kobayashi, R.; Takeuchi, I. Exhaustive and informatics-aided search for fast Li-ion conductor with NASICON-type structure using material simulation and Bayesian optimization. APL Mater. 2020, 8, 041112. [Google Scholar] [CrossRef] [Green Version]
- Yang, Z.; Suzuki, S.; Tanibata, N.; Takeda, H.; Nakayama, M.; Karasuyama, M.; Takeuchi, I. Efficient Experimental Search for Discovering a Fast Li-Ion Conductor from a Perovskite-Type Li x La (1–x)/3NbO3 (LLNO) Solid-State Electrolyte Using Bayesian Optimization. J. Phys. Chem. C 2020, 125, 152–160. [Google Scholar] [CrossRef]
- Nakayama, M.; Kanamori, K.; Nakano, K.; Jalem, R.; Takeuchi, I.; Yamasaki, H. Data-Driven Materials Exploration for Li-Ion Conductive Ceramics by Exhaustive and Informatics-Aided Computations. Chem. Rec. 2019, 19, 771–778. [Google Scholar] [CrossRef] [Green Version]
- Dave, A.; Mitchell, J.; Kandasamy, K.; Wang, H.; Burke, S.; Paria, B.; Póczos, B.; Whitacre, J.; Viswanathan, V. Autonomous Discovery of Battery Electrolytes with Robotic Experimentation and Machine Learning. Cell Rep. Phys. Sci. 2020, 1, 100264. [Google Scholar] [CrossRef]
- Jiang, B.; Berliner, M.D.; Lai, K.; Asinger, P.A.; Zhao, H.; Herring, P.K.; Bazant, M.Z.; Braatz, R.D. Fast charging design for Lithium-ion batteries via Bayesian optimization. Appl. Energy 2021, 307, 118244. [Google Scholar] [CrossRef]
- Houchins, G.; Viswanathan, V. An accurate machine-learning calculator for optimization of Li-ion battery cathodes. J. Chem. Phys. 2020, 153, 054124. [Google Scholar] [CrossRef] [PubMed]
- Liu, C.; Liu, L. Optimal Design of Li-Ion Batteries through Multi-Physics Modeling and Multi-Objective Optimization. J. Electrochem. Soc. 2017, 164, E3254. [Google Scholar] [CrossRef]
- Bishop, C.M. Pattern Recognition and Machine Learning (Information Science and Statistics); Springer: Berlin/Heidelberg, Germany, 2006. [Google Scholar]
- Jones, D.R.; Schonlau, M.; Welch, W.J. Efficient Global Optimization of Expensive Black-Box Functions. J. Glob. Optim. 1998, 13, 455–492. [Google Scholar] [CrossRef]
- Rivera, P.A.; Woollam, M.; Siegel, A.P.; Agarwal, M. Gaussian Process Regression and Monte Carlo Simulation to Determine VOC Biomarker Concentrations via Chemiresistive Gas Nanosensors. In Proceedings of the 2021 IEEE International Conference on Design & Test of Integrated Micro & Nano-Systems (DTS), Sfax, Tunisia, 2 August 2021; IEEE: Danvers, MA, USA. [Google Scholar]
- Couckuyt, I.; Dhaene, T.; Demeester, P. ooDACE toolbox: A flexible object-oriented Kriging implementation. J. Mach. Learn. Res. 2014, 15, 3183–3186. [Google Scholar]
Publisher’s Note: MDPI stays neutral with regard to jurisdictional claims in published maps and institutional affiliations. |
© 2022 by the authors. Licensee MDPI, Basel, Switzerland. This article is an open access article distributed under the terms and conditions of the Creative Commons Attribution (CC BY) license (https://creativecommons.org/licenses/by/4.0/).