Article

Identifying Risk Factors for Premature Birth in the UK Millennium Cohort Using a Random Forest Decision-Tree Approach

School of Medicine, Faculty of Health Sciences & Medicine, Bond University, Robina, QLD 4223, Australia
Reprod. Med. 2022, 3(4), 320-333; https://doi.org/10.3390/reprodmed3040025
Submission received: 10 November 2022 / Revised: 6 December 2022 / Accepted: 7 December 2022 / Published: 9 December 2022
(This article belongs to the Special Issue Recent Advances in Fetal Medicine 2022)

Abstract

:
Prior research on causes of preterm birth has tended to focus on pathophysiological processes while acknowledging the role of socioeconomic indicators. The present research explored a wide range of factors plausibly associated with preterm birth informed by pathophysiological and evolutionary life history perspectives on gestation length. To achieve this, a machine learning ensemble classification data analysis approach, random forest (RF), was applied to the UK Millennium Cohort (18,201 births). The results highlighted the importance of socioeconomic variables and parental age in predicting preterm (before 37 completed weeks) and very preterm (before 32 weeks) birth. Infants born in households with low income and with young fathers had an increased risk of both very preterm and preterm birth. Maternal health and health problems during pregnancy were not found to be useful predictors. The best-performing algorithm was for very preterm birth and had 93% sensitivity and 100% specificity using six variables. Algorithms predicting preterm birth before 37 weeks showed increased error, with out-of-bag error rates of about 7% versus only 1% for those predicting very preterm birth. The poorer performance of algorithms predicting preterm births to 37 weeks of gestation suggests that some preterm birth may not result from pathology related to poor maternal health or social or economic disadvantage, but instead represents normal life-history variation.

1. Introduction

Normal gestation length in humans is 37 to 42 weeks from the last menstrual period. Premature birth, which is defined as less than 37 weeks, is associated with increased neonatal morbidity and mortality [1,2,3]. The risk of infant death is over 60% for infants born very prematurely who do not receive specialist medical interventions [1]. While mortality is dramatically lowered with neonatal intensive care, there are health-related sequelae to premature birth which may persist into adulthood [4].
The predominant view in medicine is that premature birth before 37 weeks is most likely to result from pathophysiological processes which affect the uterine environment. Examples of pathologies include intrauterine infection, preeclampsia, vaginal bleeding and anaemia in pregnancy [5,6,7,8], but also include longstanding maternal health problems and effects of maternal behaviours, such as smoking [9,10,11]. One study which included a large number of pathologies, maternal behaviours and sociodemographic variables found that both pathophysiological factors and lack of physical exercise, maternal anxiety and antibiotic use predicted high preterm birth risk [12]. Similar pathologies appear to underlie both mildly preterm (32–36 weeks) and very preterm (before 32 weeks) birth [13], but with some exceptions. Delivery due to hypertension and placental pathologies is more likely to occur in mildly preterm birth [14].
In contrast to the predominant view that premature birth is necessarily indicative of pathophysiology, understandings from theoretical and evolutionary biology developed in the last several decades suggest that not all premature birth is an outcome of pathological processes in a straightforward way. Gestation length is a biological trait with a range of normal variability between individuals and between pregnancies. Natural selection will act on and constrain this variability. In addition, following the theory of parent–offspring conflict [15], maternal and foetal interests in when birth should ideally occur will differ, with the foetus typically maximising its survival at a longer gestation length than is optimal from the mother’s perspective [16]. This is because the mother will maximise her genetic representation in future generations by investing not only in her current pregnancy but by allocating her energy optimally across her entire reproductive career. This situation for a foetus can be reversed if foetal nutrition is limited enough for early birth to be in the infant’s survival interests [17]. This perspective is less specific about what exactly causes a mother to attempt to have a shortened gestation length: on top of pathophysiological processes stemming from maternal illness, anything that limits maternal energy resources may predict shorter gestation, including low socioeconomic status and social stressors in her environment. In unpredictable, poor-quality environments, traits which accompany premature birth may, counterintuitively, be beneficial for survival: small size at birth, altered hypo-pituitary axis functioning, increased insulin resistance and altered growth trajectories may be part of a suite of traits which represent evolutionary adaptations to environmental adversity [17,18,19]. It is also possible given this evolutionary perspective that preterm birth in some cases could occur in genetic lineages in which there has been consistent exposure to stressors: preterm birth could occur not due to maternal factors but to stress and poor nutrition in her lineage.
Both pathophysiological and parent–offspring conflict-derived perspectives suggest that similar factors underlie premature birth. If maternal health is compromised and this has led to her having to allocate more of her energy to keep herself alive with less to allocate to her foetus, then a foetal decision to be born prematurely might be in the infant’s own survival interests. However, very preterm birth means low survival chances for an infant, and it is difficult to understand how this could ever be evolutionarily adaptive. For this reason, it is expected that pathophysiology may better explain very premature birth than other factors in the maternal environment, such as being in a low socioeconomic status group.
The majority of past research has aimed to understand preterm birth by hypothesizing that it is associated with a particular predictor of interest, statistically adjusting for other potentially important variables. The aims of the present research were to take a machine learning classification approach rather than using null hypothesis significance testing. It aimed to create an algorithm with high sensitivity and specificity predicting preterm birth, and to determine which factors are the most important out of a large number of predictors, including measures of maternal health, health problems during pregnancy, social, demographic, economic and behavioural variables. Machine learning classification algorithms are well-suited for use in screening with a large number of predictors rather than to determine whether a specific risk factor is associated with premature birth [20,21].
As it remains an unusual choice in public health research, it is worth outlining in more detail why a machine learning algorithm for classification purposes was selected over regression modelling. Machine learning, which was carried out in this research with an ensemble decision-tree algorithm (random forest), has some advantages and disadvantages compared with regression. A key advantage over regression-based statistical approaches is that using a very large number of predictors (named features in machine learning) is not problematic. Features which are highly correlated with each other can be included without risking multicollinearity, and linear relationships between predictors and outcomes are not necessary. This avoids the need to transform variables to achieve linearity, and categorical data such as ethnic background do not need to be recoded as separate dummy variables in a random forest algorithm. The main disadvantage is that the resulting predictive algorithm is less easily interpretable. Neither multiple regression nor random forests have very satisfactory means of model reduction to include only the most important predictors: forwards and backwards selection in variable reduction are not advisable in regression modelling as they tend to result in different reduced models depending on the order in which variables were entered or eliminated [22]. There is an analogous problem in random forests where the number of features selected at each decision point in a classification tree can affect which features are most important in the algorithm. Steps were undertaken to minimise this problem.
In summary, the aim of this study was to apply machine learning to predict and accurately classify cases of preterm and very preterm birth using a wide range of variables that are likely risk factors. The risk factors were drawn from two perspectives: 1. That preterm birth results from maternal or foetal pathophysiological processes or disease states, instigated in some cases by environmental and socioeconomic factors. 2. That the timing of birth reflects evolutionary processes such that mildly preterm birth is more likely to result from stressful conditions in the maternal environment rather than from disease. Very preterm birth on the other hand is unlikely to have any advantage associated with it for the mother or infant and hence should have pathophysiological causes: low socioeconomic status and social stressors should predict mildly preterm birth and pathophysiological causes should predict very preterm birth.

2. Materials and Methods

2.1. Population and Sample

The UK Millennium cohort (henceforth MCS) is an ongoing longitudinal cohort of 18,818 live-born infants in the United Kingdom from September 2000 to August 2001. Mothers were identified using Universal Child Benefit records and NHS Health Visitors [23]. Here, data were analysed using the first survey of the cohort, which took place 9 months after the birth. Analyses linking the MCS data to hospital records for the births have found the MCS birth data to be highly reliable, and not subject to significant recall bias [24,25]. A cohort profile is available providing detail about the sample and sampling methods [26]. Data can be accessed without charge via the UK Data Service.

2.2. Dependent Variable

The dependent variable, premature birth, was measured in the MCS in days since last menstrual period. The analysis was carried out twice, first for gestation length of less than 37 full weeks, and for gestation length of less than 32 weeks. This was completed to assess whether very preterm birth has different underlying aetiology, as outlined in the introduction.

2.3. Independent Variables (Features)

The first MCS survey dataset was visually scanned for variables relevant to preterm birth given prior literature on potential and known causes which are not genetic. It should be noted that the MCS study data does not include information allowing direct analysis of potential genetic causes of premature delivery. Most of the relevant MCS survey questions fell into the following categories: maternal health, health problems during pregnancy, paternal health, social, demographic, economic and behavioural variables such as parents’ alcohol and tobacco use. Seventy-two features were identified and included. Table 1 in the results section displays these variables. Supplementary Materials S1 display the original MCS variable names. One change that was made was to extract the ICD-10 codes for maternal longstanding illness and for problems in the pregnancy. Categorical features were created representing, for example, whether the mother had diabetes mellitus. Some maternal illnesses were rare, and a decision was made to create categorical variables only for illnesses which had at least 40 cases (0.2% of the sample) regardless of whether the illness would be likely to directly affect the pregnancy. Variables indicating whether there was any longstanding illness or maternal illness during pregnancy were retained so that rare conditions were included in the aggregated feature identifying whether any maternal illness was present.

2.4. Data Analysis

The MCS data were analysed using random forests (RF), a supervised machine learning decision tree algorithm. For a brief non-technical introduction see [27], and for more detail see [28,29]. Other machine learning classification algorithms are available, such as XGBOOST. RF was chosen over XGBOOST due to its availability in commonly used statistical software, including Stata, SPSS Statistics (using Python plug-ins) and open-source software such as R and the R graphical interface BlueSky Statistics. In addition, algorithm optimisation (hyper-tuning) is easily implemented in RF. The RF algorithm uses two-thirds of the data for creating the algorithm (the training set), and with bootstrapping creates sets of decision trees with the bootstrapped subsets of the data which comprise a decision rule at each branch node. Overfitting is avoided in RF using bootstrapping and averaging (bagging). The remaining third of the data (the test set) is used for cross-validation: out-of-bag error is the estimate of the proportion of observations in the test set that were misclassified by the algorithm. Missing data occurred due to unanswered interview items on a small number of variables. The RF algorithm contained a proximity algorithm to handle missing observations for features. Observations with a missing value for the outcome variable were dropped from the analysis.
All analyses were carried out in Stata 16. For the RF model, the Python plug-in Rforest was used [30]. Algorithm performance was enhanced by hyper-tuning: finding optimal settings for how many variables should be randomly selected for inclusion in creating each decision tree, and the number of iterations or number of decision trees created. This was carried out using Stata code developed by Schonlau and Zou [30]. Stata code, hyper-tuning cross-validation and out-of-bag error scores are shown in the Supplementary Materials file. Because the number of variables available for selection at each split in the decision trees affects feature importance scores, the best ten hyper-tuning results for determining the number of variables at each split were averaged to create a list of features with the highest overall importance scores. Feature reduction was carried out to attempt to create an efficient algorithm both in terms of avoiding creating an algorithm requiring data for a large number of variables, and minimising computer processor time if the algorithm was applied. Feature reduction was carried out using forward selection to produce the algorithm with the fewest features while maintaining a low out-of-bag error statistic. Hyper-tuning was repeated to optimise algorithm performance on the reduced-feature algorithms.

3. Results

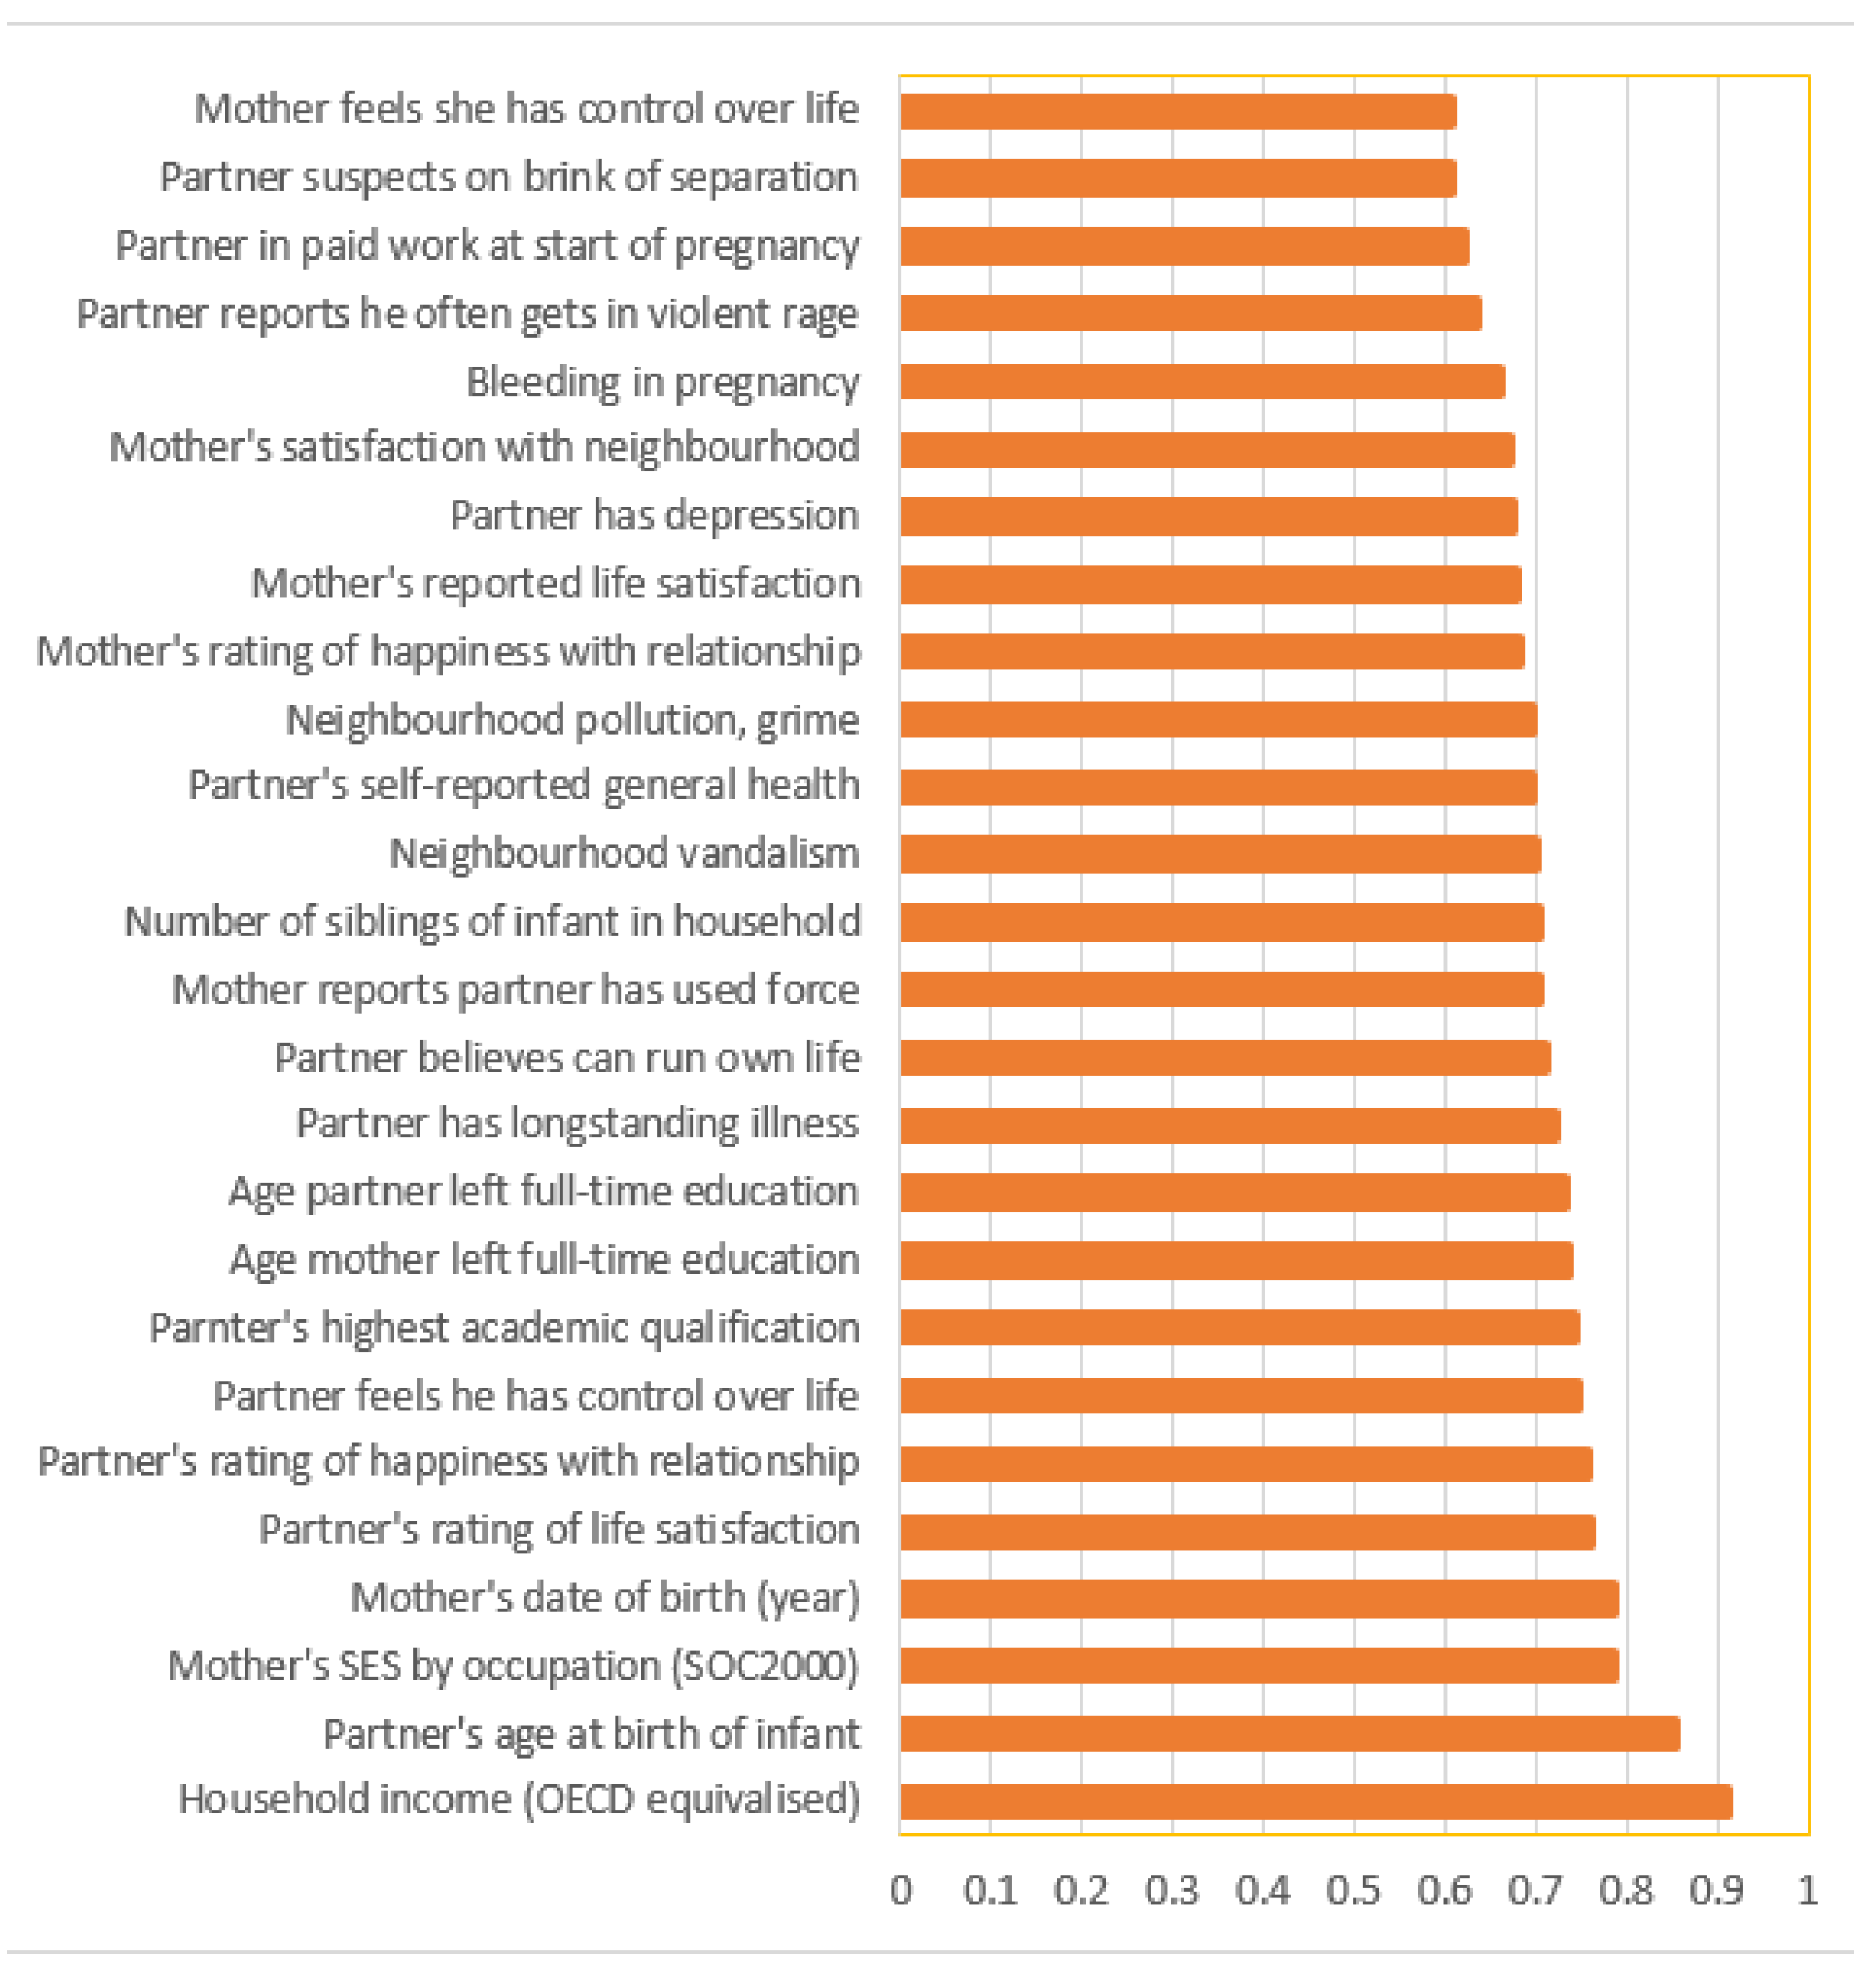
Table 1 and Table 2 show descriptive statistics for all 72 features and the outcome variables. Table 3 contains a summary of the full 72 feature algorithm results for delivery before 32 and 37 weeks of gestation, as well as reduced algorithms. Sensitivity and specificity values reported in Table 3 were produced by applying the algorithm back to the entire dataset, not the third of the data which was the test set (and from which the out-of-bag error estimate was calculated). The best-performing algorithm predicted very premature delivery (before 32 weeks) with 93% sensitivity using only six features, which were the top six listed in Figure 1. Delivery before 37 weeks proved more difficult to predict: while the 72-feature model had 70% sensitivity, it was not possible to maintain low out-of-bag error and high sensitivity in the feature reduction process. The nine-feature algorithm displayed in Table 3 was selected as providing feature reduction while maintaining low out-of-bag error and reasonably high sensitivity.
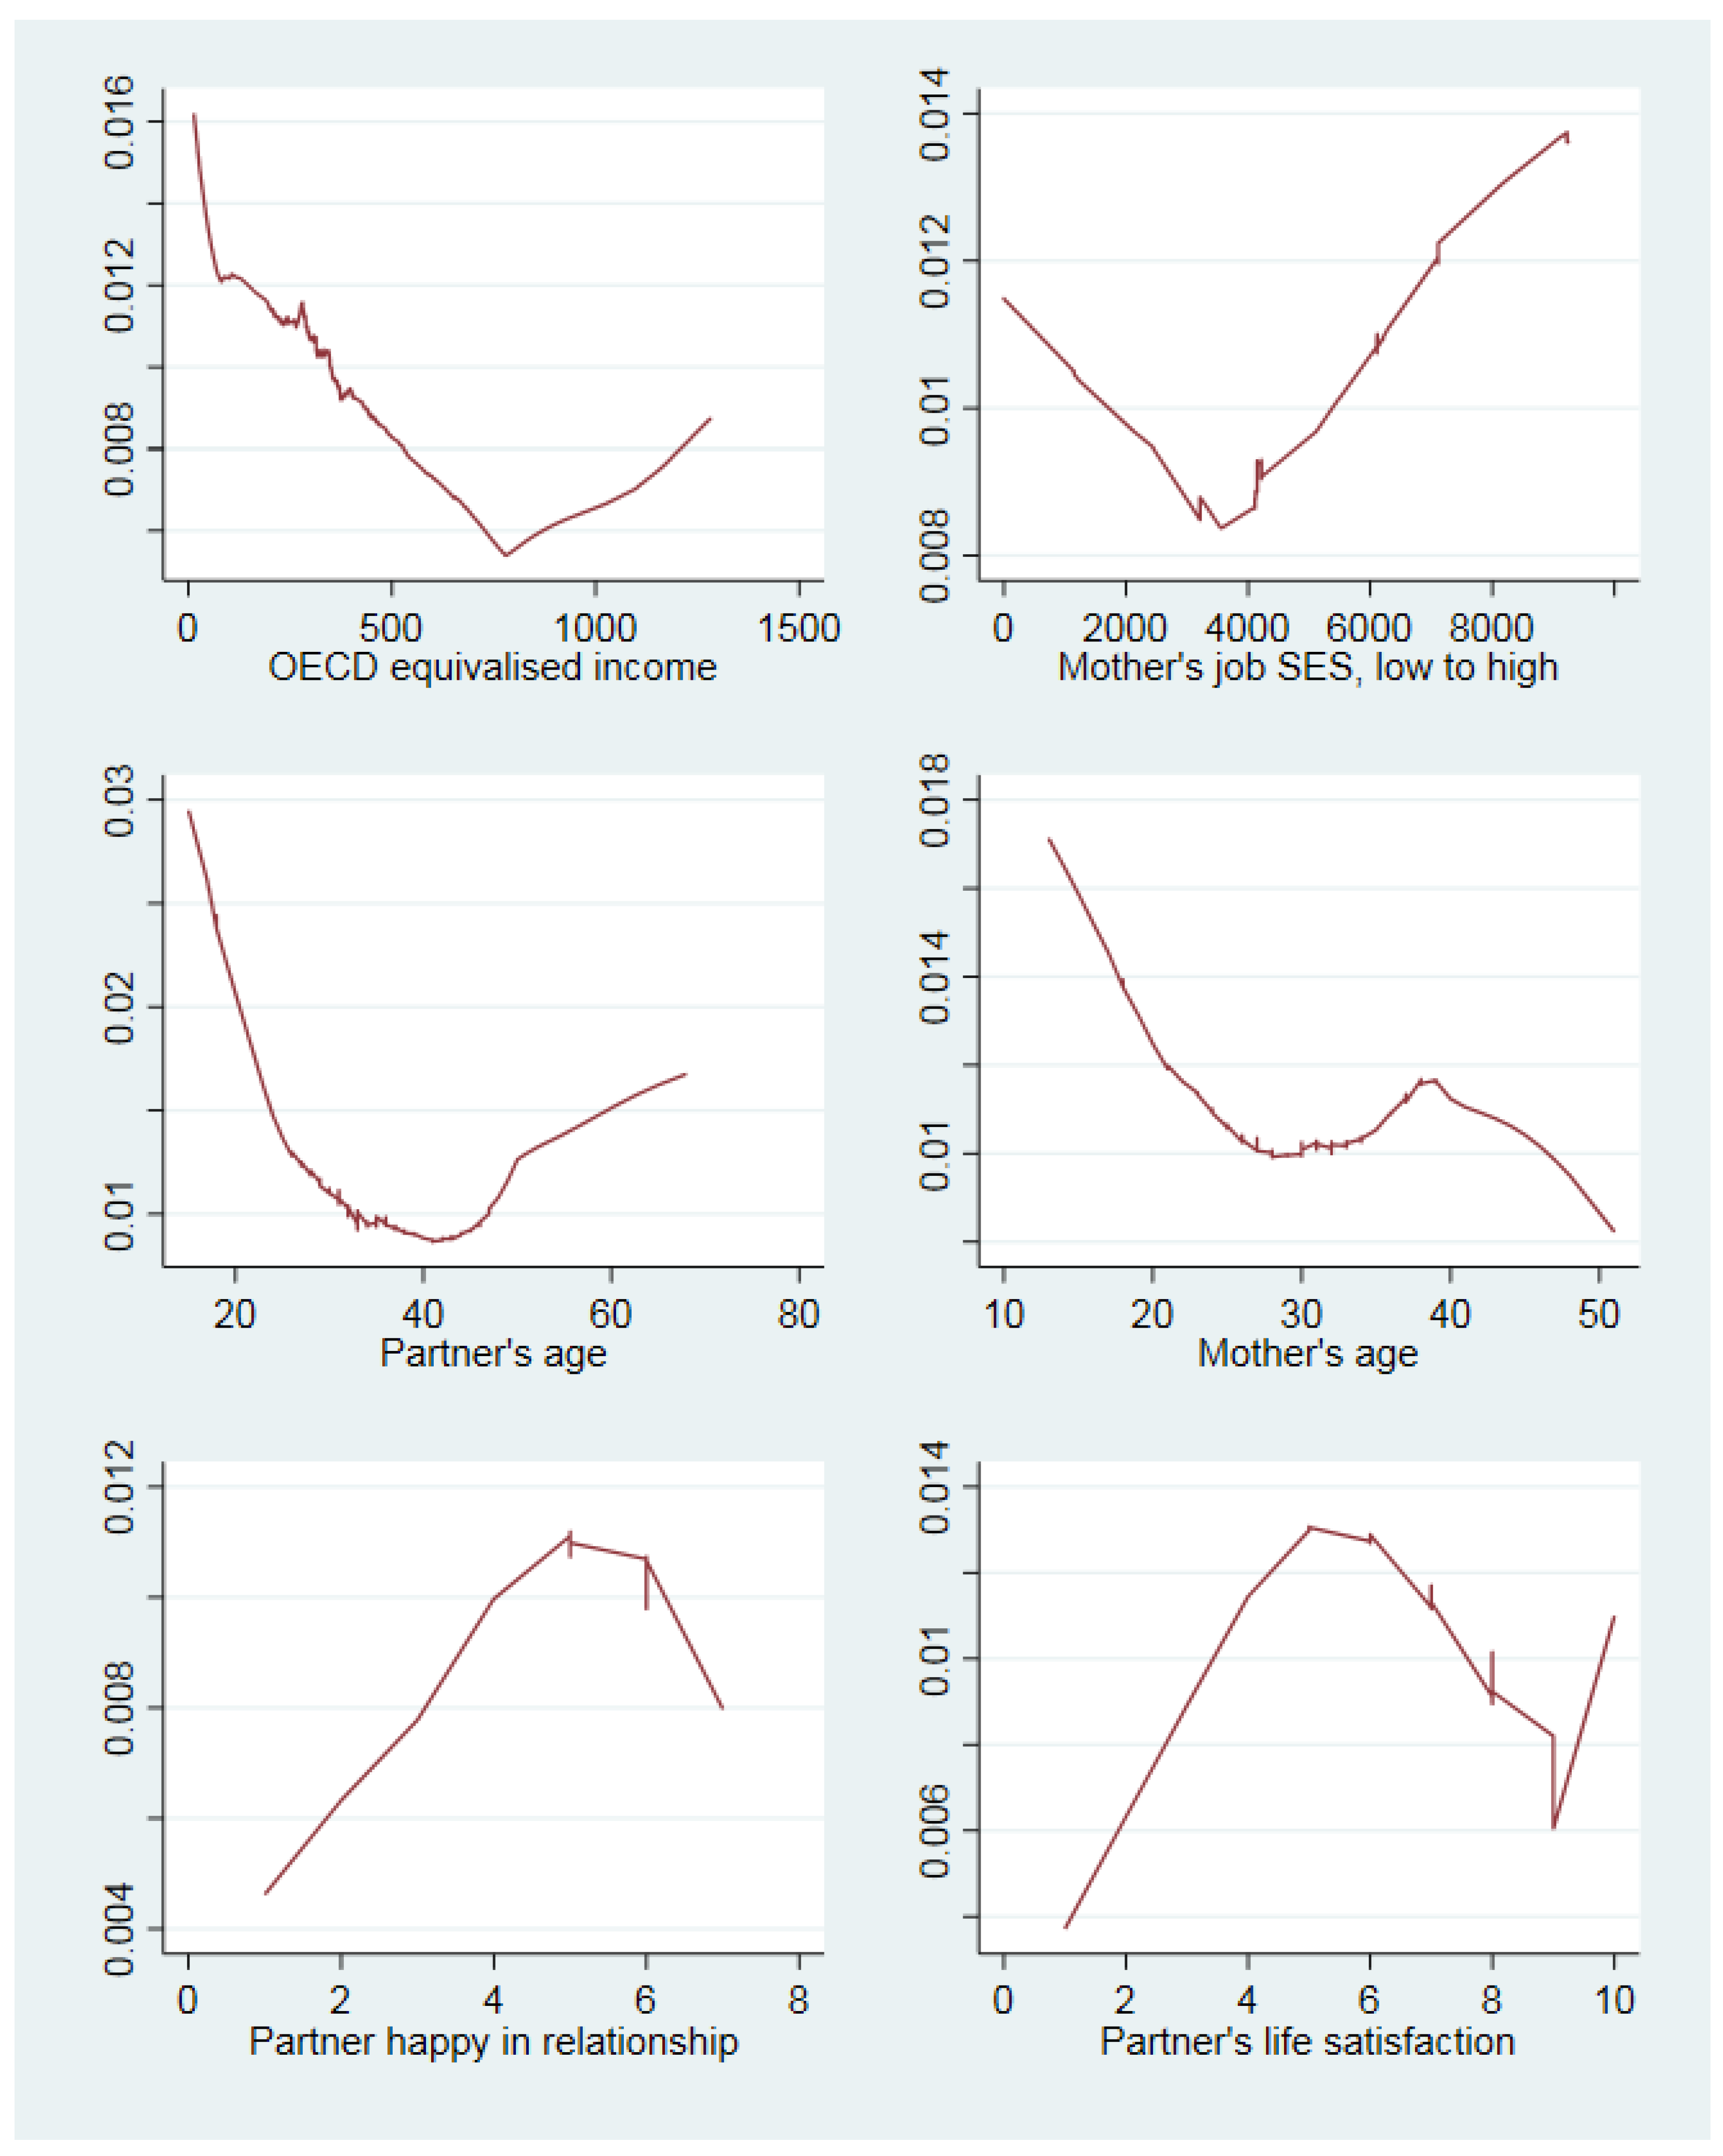
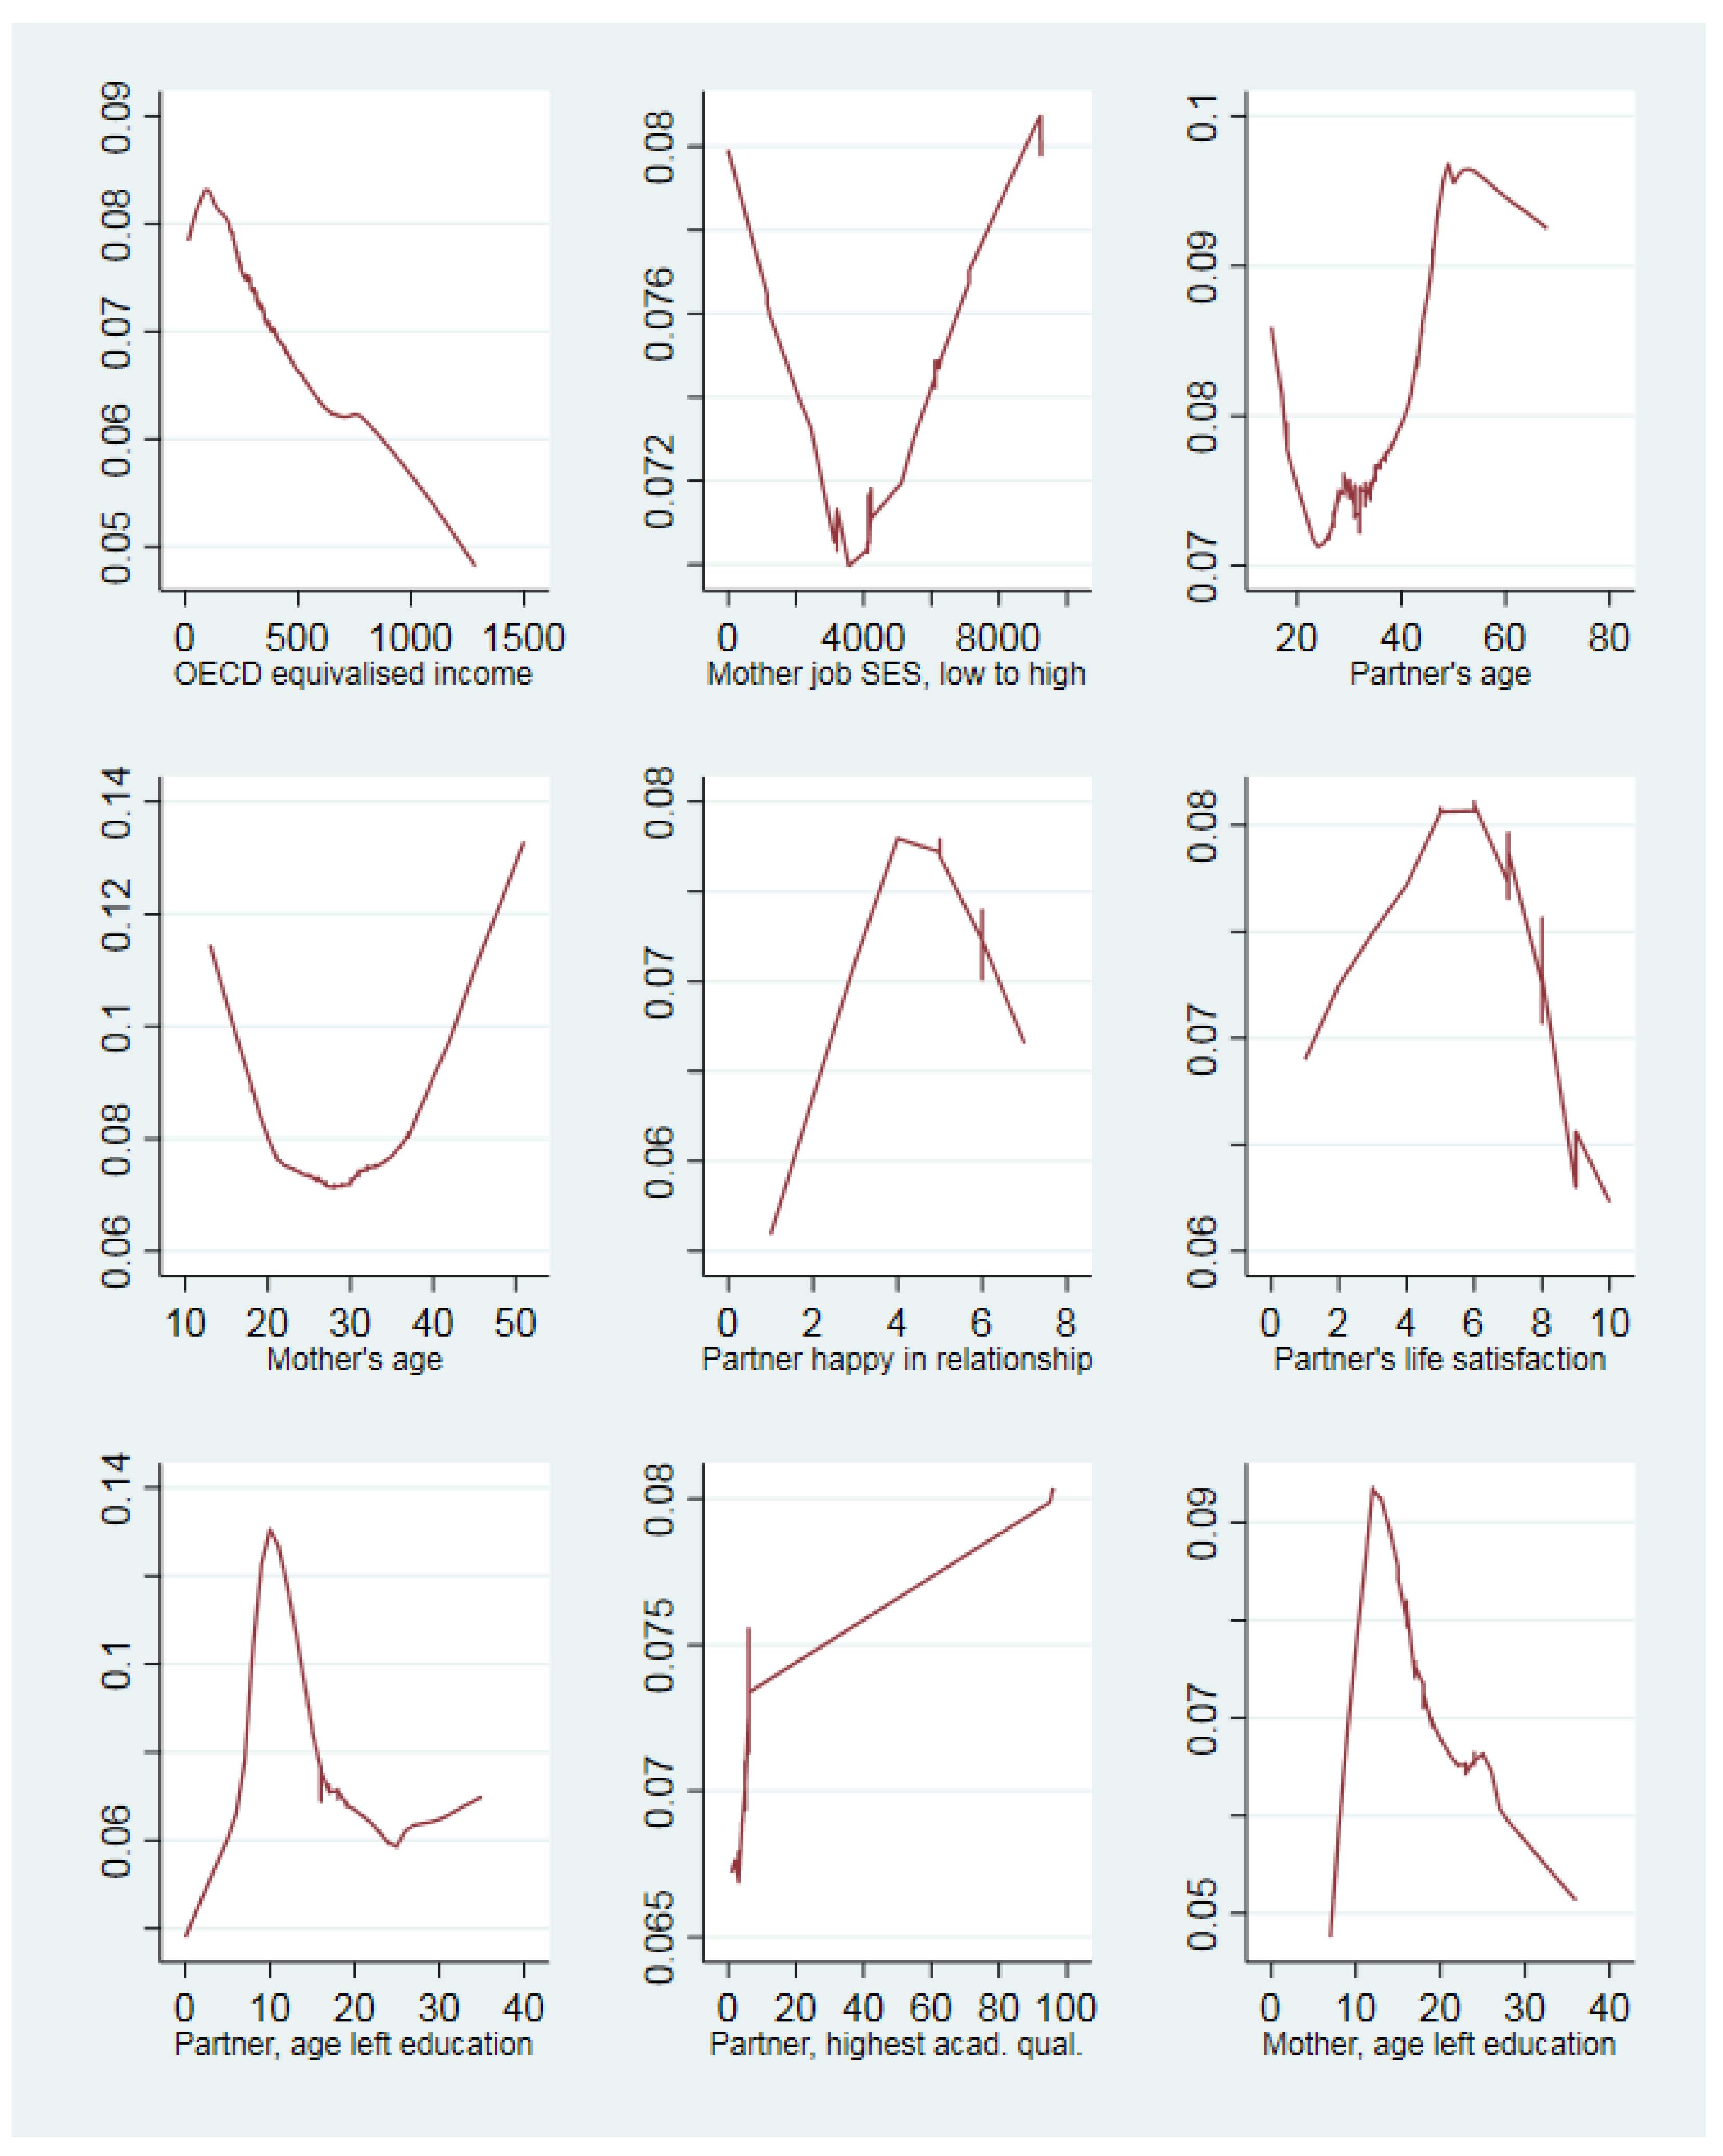
Figure 1 shows all features with average importance scores above 0.6 for predicting very premature birth. Feature importance measures the contribution of each variable to the overall algorithm prediction process. The scores are normalised: the highest value is always one, and a score of zero would reflect a variable which made no positive predictive contribution. In this analysis, they were averaged over the ten best-scoring 72 feature algorithms in hyper-tuning validation for the number of variables selected at each split. Figure 2 displays the same information for predicting birth before 37 weeks of completed gestation. Both figures show that income, occupation and parental age were the best predictors of premature birth. Relationship and life satisfaction additionally had high importance scores. Maternal health and pregnancy problems were not necessary for successfully predicting prematurity. RF results do not include a parameter estimate which indicates the direction of an effect, as they are not linear models. Figure 3 and Figure 4 display two-way scatter plots with lowess fit lines so that the shapes of the relationships between predictor and preterm birth for the most important features can be viewed. The Supplementary Materials includes importance scores for all 72 features. Importance scores can be near zero for features with little or no predictive utility in the algorithm, and this was the case for alcohol use and some common maternal illnesses unlikely to be associated with premature birth (e.g., psoriasis, sciatica, dermatitis and endometriosis). The number of features with low predictive utility may in part explain why the 72-feature algorithm in the algorithm predicting delivery before 32 weeks had higher out-of-bag error than algorithms with fewer features included.

4. Discussion

4.1. Summary of Main Findings

This research had two aims. The first was to explore whether a useful screening tool could be produced using an RF approach with medical records and interview data which could be obtained relatively easily from pregnant women. The second was to determine what is most important for predicting premature birth, excluding measures of genetic risk, which were not available for the dataset used in this research. To address the first goal, 93% sensitivity was achieved in predicting very preterm birth (before 32 completed weeks) with only six features. This algorithm would require little data collection time and little computing time to produce a screening result.
The features with the highest importance scores, indicating that they had the most utility for classifying preterm birth, were almost identical for preterm and very preterm birth. These were parental age, socioeconomic and life satisfaction measures. For the purposes of developing a screening tool for premature delivery, the results suggest that socioeconomic factors have more utility for predicting delay than maternal health variables representing individual illnesses. This is not surprising given the statistical methodology, as features measuring illnesses which only apply to a small proportion of individuals will not be as important in an algorithm as features which predict premature birth and apply to a larger proportion of the population.

4.2. Algorithm Performance

Predicting delivery before 37 weeks using RF was less successful than for very preterm birth. The 72-feature algorithm had similar sensitivity to the 72-feature algorithm for delivery before 32 weeks, but reducing the feature number to create a more efficient algorithm proved difficult. The out-of-bag error was generally above 7% for algorithms predicting delivery before 37 weeks and was around 1% for algorithms predicting delivery before 32 weeks (see Table 3). This occurred despite the fact that RF should be poorer at predicting minority class membership in a more unbalanced dataset (one with only a small proportion of cases with preterm birth). This suggests that preterm birth from 32 to 36 weeks includes births which have not resulted from the risk factors captured in this study using the MCS data. As most of the MCS variables reflect disadvantage or pathophysiology, this is suggestive of mildly preterm birth not resulting from these factors.

4.3. Support for the Study Hypotheses

Researchers using evolutionary perspectives have suggested that preterm and very preterm delivery may have different underlying biological causes, with birth closer to 37 weeks less likely to represent pathophysiology and more likely to be early birth due to foetal adaptation to poor conditions or nutrition in the uterus [17,18,19]. The expectation given this was that pathophysiological processes would be more important in predicting very preterm birth. This was not supported by the results. While the same features had high importance scores for both outcomes, there were differences in the shapes of the associations which suggest differences in causal factors between preterm and very preterm birth (see Figure 3 and Figure 4). Of note, mothers over 35 years old had an increased risk of premature birth but not of very premature birth. Given that all of the predictors included in the algorithms represent illness or disadvantage in some way, the poorer performance of algorithms predicting preterm birth to 37 weeks supports the observation made in the previous paragraph, which is that illness and socioeconomic disadvantage are not the primary drivers of preterm birth from 32-36 weeks.

4.4. Similarity and Differences to Past Research

A large number of past studies have taken a biomedical approach to the causes of preterm birth, focussing on intrauterine infection, decidual haemorrhage and other pathophysiological causes [31]. Past research has also highlighted the importance of socioeconomic factors in preterm birth, and biopsychosocial approaches have identified roles of and pathways connecting maternal stress, anxiety and living conditions to preterm birth [12,32,33,34,35]. The most similar past study in terms of the statistical approach taken found a different group of variables predicted preterm birth, including maternal anxiety, and low physical exercise but not age, socioeconomic or paternal factors [12]. The difference between studies may in part be due to differences in variable selection procedures: maternal and paternal ages showed a u-shaped association with preterm birth that would be favoured in the RF approach applied here more than in the variable reduction procedures by Della Rosa et al. [12].
One group of features was more important in the RF algorithms than expected given past research. Partner-related or paternal variables were included because they may signal stress and disadvantage in the maternal environment. However, variables drawn from the MCS interview with partners often had higher importance scores than similar variables reported by mothers, such as for reported life satisfaction and happiness with their relationship. In addition, the risk of premature birth was lowest at moderate levels of reported satisfaction and higher for those who were either very unhappy or extremely happy with life and their marriage/relationship. While fathers will no doubt affect the quality of life and stress experienced by their female partner and this in turn will affect the foetal experience of stress, the importance of paternal data, including paternal age in predicting premature birth warrants further investigation.

4.5. Study limitations

While past research on potential biases in the MCS birth data suggests that the birth data are unbiased [24,25], a retrospective cohort study of preterm birth is not ideal: for example, there may be a failure to capture data on infants who were live-born but who died as neonates. On the other hand, the MCS allows the use of a wide range of potentially important variables which could inform future prospectively designed studies of preterm birth. A further advantage of the MCS is that the data were not sourced from medical records, which typically offer little socioeconomic or social information and will therefore tend to restrict the discussion of preterm birth to medically related variables only.
From a statistical perspective, it is highly likely that further improvements to the algorithms could be made using approaches to better handle unbalanced data: very preterm birth will necessarily be unbalanced in that only around one percent of births are likely to occur before 32 weeks of gestation. Second, RF could be compared with similar algorithms such as XGBOOST to ascertain which machine learning tool results in the least classification error.

5. Conclusions

While maternal and pregnancy-related illnesses have been demonstrated to predict preterm birth [5,6,7,8,9,10,11], from a screening perspective, socioeconomic variables, quality of life and the relationship between parents appear to have more predictive utility than maternal health problems. These findings support the view presented in the introduction that not all preterm birth represents pathophysiology in a straightforward way. However, the results did not support this view in an expected way: instead of environment and stress-related causes predominating in algorithms of preterm birth up to 37 weeks but not for very preterm birth, all of the algorithms predicting preterm birth to 37 weeks of gestation showed poorer performance (higher error) than those predicting very preterm birth. Given the large number and wide range of variables included to measure pathophysiology, stress and poverty, these results suggest that some preterm birth may not result from pathology related to poor maternal health or social or economic disadvantage, but instead represents normal life history variation.

Supplementary Materials

The following supporting information can be downloaded at: https://www.mdpi.com/article/10.3390/reprodmed3040025/s1, Supplementary file S1: Spreadsheet showing importance scores for all 72 features averaged across the ten beat-performing algorithms for premature and very premature birth. Supplementary file S2: Hyper-tuning results graphs for selecting the number of variables at each split, Stata code including implementation of algorithms with original MCS variable names.

Funding

This research received no external funding.

Institutional Review Board Statement

Detailed information on ethical approval can be accessed here: https://cls.ucl.ac.uk/wp-content/uploads/2017/07/MCS-Ethical-review-and-consent-Shepherd-P-November-2012.pdf (accessed on 1 November 2022).

Informed Consent Statement

Informed consent was given by the MCS cohort members. For details see: https://cls.ucl.ac.uk/wp-content/uploads/2017/07/MCS-Ethical-review-and-consent-Shepherd-P-November-2012.pdf (accessed on 1 November 2022).

Data Availability Statement

The data used in this study are available free of charge via the UK Data Service. https://beta.ukdataservice.ac.uk/datacatalogue/studies/#!?Search=&Rows=10&Sort=0&DataTypeFacet=Cohort%20and%20longitudinal%20studies&Page=1&DateFrom=440&DateTo=2022 (accessed on 15 January 2021).

Conflicts of Interest

The author declares no conflict of interest.

References

  1. Carlo, W.A.; Goudar, S.S.; Jehan, I.; Chomba, E.; Tshefu, A.; Garces, A.; Parida, S.; Althabe, F.; McClure, E.M.; Derman, R.J.; et al. High Mortality Rates for Very Low Birth Weight Infants in Developing Countries Despite Training. Pediatrics 2010, 126, e1072–e1080. [Google Scholar] [CrossRef] [Green Version]
  2. Blencowe, H.; Cousens, S.; Chou, D.; Oestergaard, M.; Say, L.; Moller, A.-B.; Kinney, M.; Lawn, J.; the Born Too Soon Preterm Birth Action Group. Born Too Soon: The global epidemiology of 15 million preterm births. Reprod. Health 2013, 10 (Suppl. S1), S2. [Google Scholar] [CrossRef] [Green Version]
  3. Blencowe, H.; Lee, A.C.; Cousens, S.; Bahalim, A.; Narwal, R.; Zhong, N.; Chou, D.; Say, L.; Modi, N.; Katz, J.; et al. Preterm birth–associated neurodevelopmental impairment estimates at regional and global levels for 2010. Pediatr. Res. 2013, 74, 17–34. [Google Scholar] [CrossRef] [Green Version]
  4. Murray, C.J.L.; Vos, T.; Lozano, R.; Naghavi, M.; Flaxman, A.D.; Michaud, C.; Ezzati, M.; Shibuya, K.; Salomon, J.A.; Abdalla, S.; et al. Disability-adjusted life years (DALYs) for 291 diseases and injuries in 21 regions, 1990–2010: A systematic analysis for the Global Burden of Disease Study 2010. Lancet 2012, 380, 2197–2223. [Google Scholar] [CrossRef]
  5. Goldenberg, R.L.; Hauth, J.C.; Andrews, W.W. Intrauterine Infection and Preterm Delivery. N. Engl. J. Med. 2000, 342, 1500–1507. [Google Scholar] [CrossRef]
  6. Sibai, B.M. Preeclampsia as a Cause of Preterm and Late Preterm (Near-Term) Births. Semin. Perinatol. 2006, 30, 16–19. [Google Scholar] [CrossRef]
  7. Hossain, R.; Harris, T.; Lohsoonthorn, V.; Williams, M.A. Risk of preterm delivery in relation to vaginal bleeding in early pregnancy. Eur. J. Obstet. Gynecol. Reprod. Biol. 2007, 135, 158–163. [Google Scholar] [CrossRef] [Green Version]
  8. Levy, A.; Fraser, D.; Katz, M.; Mazor, M.; Sheiner, E. Maternal anemia during pregnancy is an independent risk factor for low birthweight and preterm delivery. Eur. J. Obstet. Gynecol. Reprod. Biol. 2005, 122, 182–186. [Google Scholar] [CrossRef]
  9. Melikova, S.; Bagirova, H.; Magalov, S. The impact of maternal epilepsy on delivery and neonatal outcomes. Child’s Nerv. Syst. 2019, 36, 775–782. [Google Scholar] [CrossRef]
  10. Sorensen, T.K.; Dempsey, J.C.; Xiao, R.; Frederick, I.O.; Luthy, D.A.; Williams, M.A. Maternal Asthma and Risk of Preterm Delivery. Obstet. Gynecol. Surv. 2003, 58, 702–703. [Google Scholar] [CrossRef]
  11. Liu, B.; Xu, G.; Sun, Y.; Qiu, X.; Ryckman, K.K.; Yu, Y.; Snetselaar, L.G.; Bao, W. Maternal cigarette smoking before and during pregnancy and the risk of preterm birth: A dose–response analysis of 25 million mother–infant pairs. PLOS Med. 2020, 17, e1003158. [Google Scholar] [CrossRef]
  12. Della Rosa, P.A.; Miglioli, C.; Caglioni, M.; Tiberio, F.; Mosser, K.H.; Vignotto, E.; Canini, M.; Baldoli, C.; Falini, A.; Candiani, M.; et al. A hierarchical procedure to select intrauterine and extrauterine factors for methodological validation of preterm birth risk estimation. BMC Pregnancy Childbirth 2021, 21, 306. [Google Scholar] [CrossRef]
  13. Delnord, M.; Zeitlin, J. Epidemiology of late preterm and early term births—An international perspective. Semin. Fetal Neonatal Med. 2019, 24, 3–10. [Google Scholar] [CrossRef] [Green Version]
  14. Shapiro-Mendoza, C.K.; Lackritz, E.M. Epidemiology of late and moderate preterm birth. Semin. Fetal Neonatal Med. 2012, 17, 120–125. [Google Scholar] [CrossRef] [Green Version]
  15. Trivers, R.L. Parent-offspring conflict. Integr. Comp. Biol. 1974, 141, 249–264. [Google Scholar] [CrossRef] [Green Version]
  16. Haig, D. Genetic Conflicts in Human Pregnancy. Q. Rev. Biol. 1993, 68, 495–532. [Google Scholar] [CrossRef] [Green Version]
  17. Williams, T.C.; Drake, A.J. Preterm birth in evolutionary context: A predictive adaptive response? Philos. Trans. R. Soc. B Biol. Sci. 2019, 374, 20180121. [Google Scholar] [CrossRef] [Green Version]
  18. Gluckman, P.D.; Hanson, M.A.; Beedle, A.S. Early life events and their consequences for later disease: A life history and evolutionary perspective. Am. J. Hum. Biol. 2007, 19, 1–19. [Google Scholar] [CrossRef]
  19. Hanson, M.A.; Gluckman, P.D. Early Developmental Conditioning of Later Health and Disease: Physiology or Pathophysiology? Physiol. Rev. 2014, 94, 1027–1076. [Google Scholar] [CrossRef]
  20. Leidy, N.K.; Malley, K.G.; Steenrod, M.A.W.; Mannino, D.M.; Make, B.J.; Bowler, R.P.; Thomashow, B.M.; Barr, R.G.; Rennard, S.I.; Houfek, J.F.; et al. Insight into Best Variables for COPD Case Identification: A Random Forests Analysis. Chronic Obstr. Pulm. Dis. J. COPD Found. 2016, 3, 406–418. [Google Scholar] [CrossRef]
  21. De Lobel, L.; Geurts, P.; Baele, G.; Castro-Giner, F.; Kogevinas, M.; Van Steen, K. A screening methodology based on Random Forests to improve the detection of gene–gene interactions. Eur. J. Hum. Genet. 2010, 18, 1127–1132. [Google Scholar] [CrossRef]
  22. Heinze, G.; Wallisch, C.; Dunkler, D. Variable selection—A review and recommendations for the practicing statistician. Biom. J. 2018, 60, 431–449. [Google Scholar] [CrossRef] [Green Version]
  23. Ketende, S.; Jones, E. User Guide to Analysing MCS Data Using Stata; Centre for Longitudinal Studies: London, UK, 2011. [Google Scholar]
  24. Quigley, M.; Hockley, C.; Davidson, L. Agreement between hospital records and maternal recall of mode of delivery: Evidence from 12 391 deliveries in the UK Millennium Cohort Study. BJOG Int. J. Obstet. Gynaecol. 2007, 114, 195–200. [Google Scholar] [CrossRef]
  25. Hockley, C.; Quigley, M.; Hughes, G.; Calderwood, L.; Joshi, H.; Davidson, L.L. Linking Millennium Cohort data to birth registration and hospital episode records. Paediatr. Perinat. Epidemiol. 2007, 22, 99–109. [Google Scholar] [CrossRef]
  26. Connelly, R.; Platt, L. Cohort Profile: UK Millennium Cohort Study (MCS). Leuk. Res. 2014, 43, 1719–1725. [Google Scholar] [CrossRef] [Green Version]
  27. IBM Cloud Education. Random Forest. Available online: https://www.ibm.com/cloud/learn/random-forest (accessed on 8 November 2022).
  28. Breiman, L. Random Forests. Mach. Learn. 2001, 45, 5–32. [Google Scholar] [CrossRef] [Green Version]
  29. Grömping, U. Variable Importance Assessment in Regression: Linear Regression versus Random Forest. Am. Stat. 2009, 63, 308–319. [Google Scholar] [CrossRef]
  30. Schonlau, M.; Zou, R.Y. The random forest algorithm for statistical learning. Stata J. Promot. Commun. Stat. Stata 2020, 20, 3–29. [Google Scholar] [CrossRef]
  31. Romero, R.; Dey, S.K.; Fisher, S.J. Preterm labor: One syndrome, many causes. Science 2014, 345, 760–765. [Google Scholar] [CrossRef] [Green Version]
  32. McHale, P.; Maudsley, G.; Pennington, A.; Schlüter, D.K.; Ben Barr, B.; Paranjothy, S.; Taylor-Robinson, D. Mediators of socioeconomic inequalities in preterm birth: A systematic review. BMC Public Health 2022, 22, 1134. [Google Scholar] [CrossRef]
  33. Dunkel Schetter, C. Psychological science on pregnancy: Stress processes, biopsychosocial models, and emerging research issues. Annu. Rev. Psychol. 2011, 62, 531–558. [Google Scholar] [CrossRef]
  34. Lu, M.J.; Huang, K.; Yan, S.Q.; Zhu, B.B.; Shao, S.S.; Zhu, P.; Tao, F.B. Association of antenatal anxiety with preterm birth and low birth weight: Evidence from a birth cohort study. Zhonghua Liu Xing Bing Xue Za Zhi Zhonghua Liuxingbingxue Zazhi 2020, 41, 1072–1075. [Google Scholar]
  35. Asta, F.; Michelozzi, P.; Cesaroni, G.; De Sario, M.; Badaloni, C.; Davoli, M.; Schifano, P. The Modifying Role of Socioeconomic Position and Greenness on the Short-Term Effect of Heat and Air Pollution on Preterm Births in Rome, 2001–2013. Int. J. Environ. Res. Public Health 2019, 16, 2497. [Google Scholar] [CrossRef]
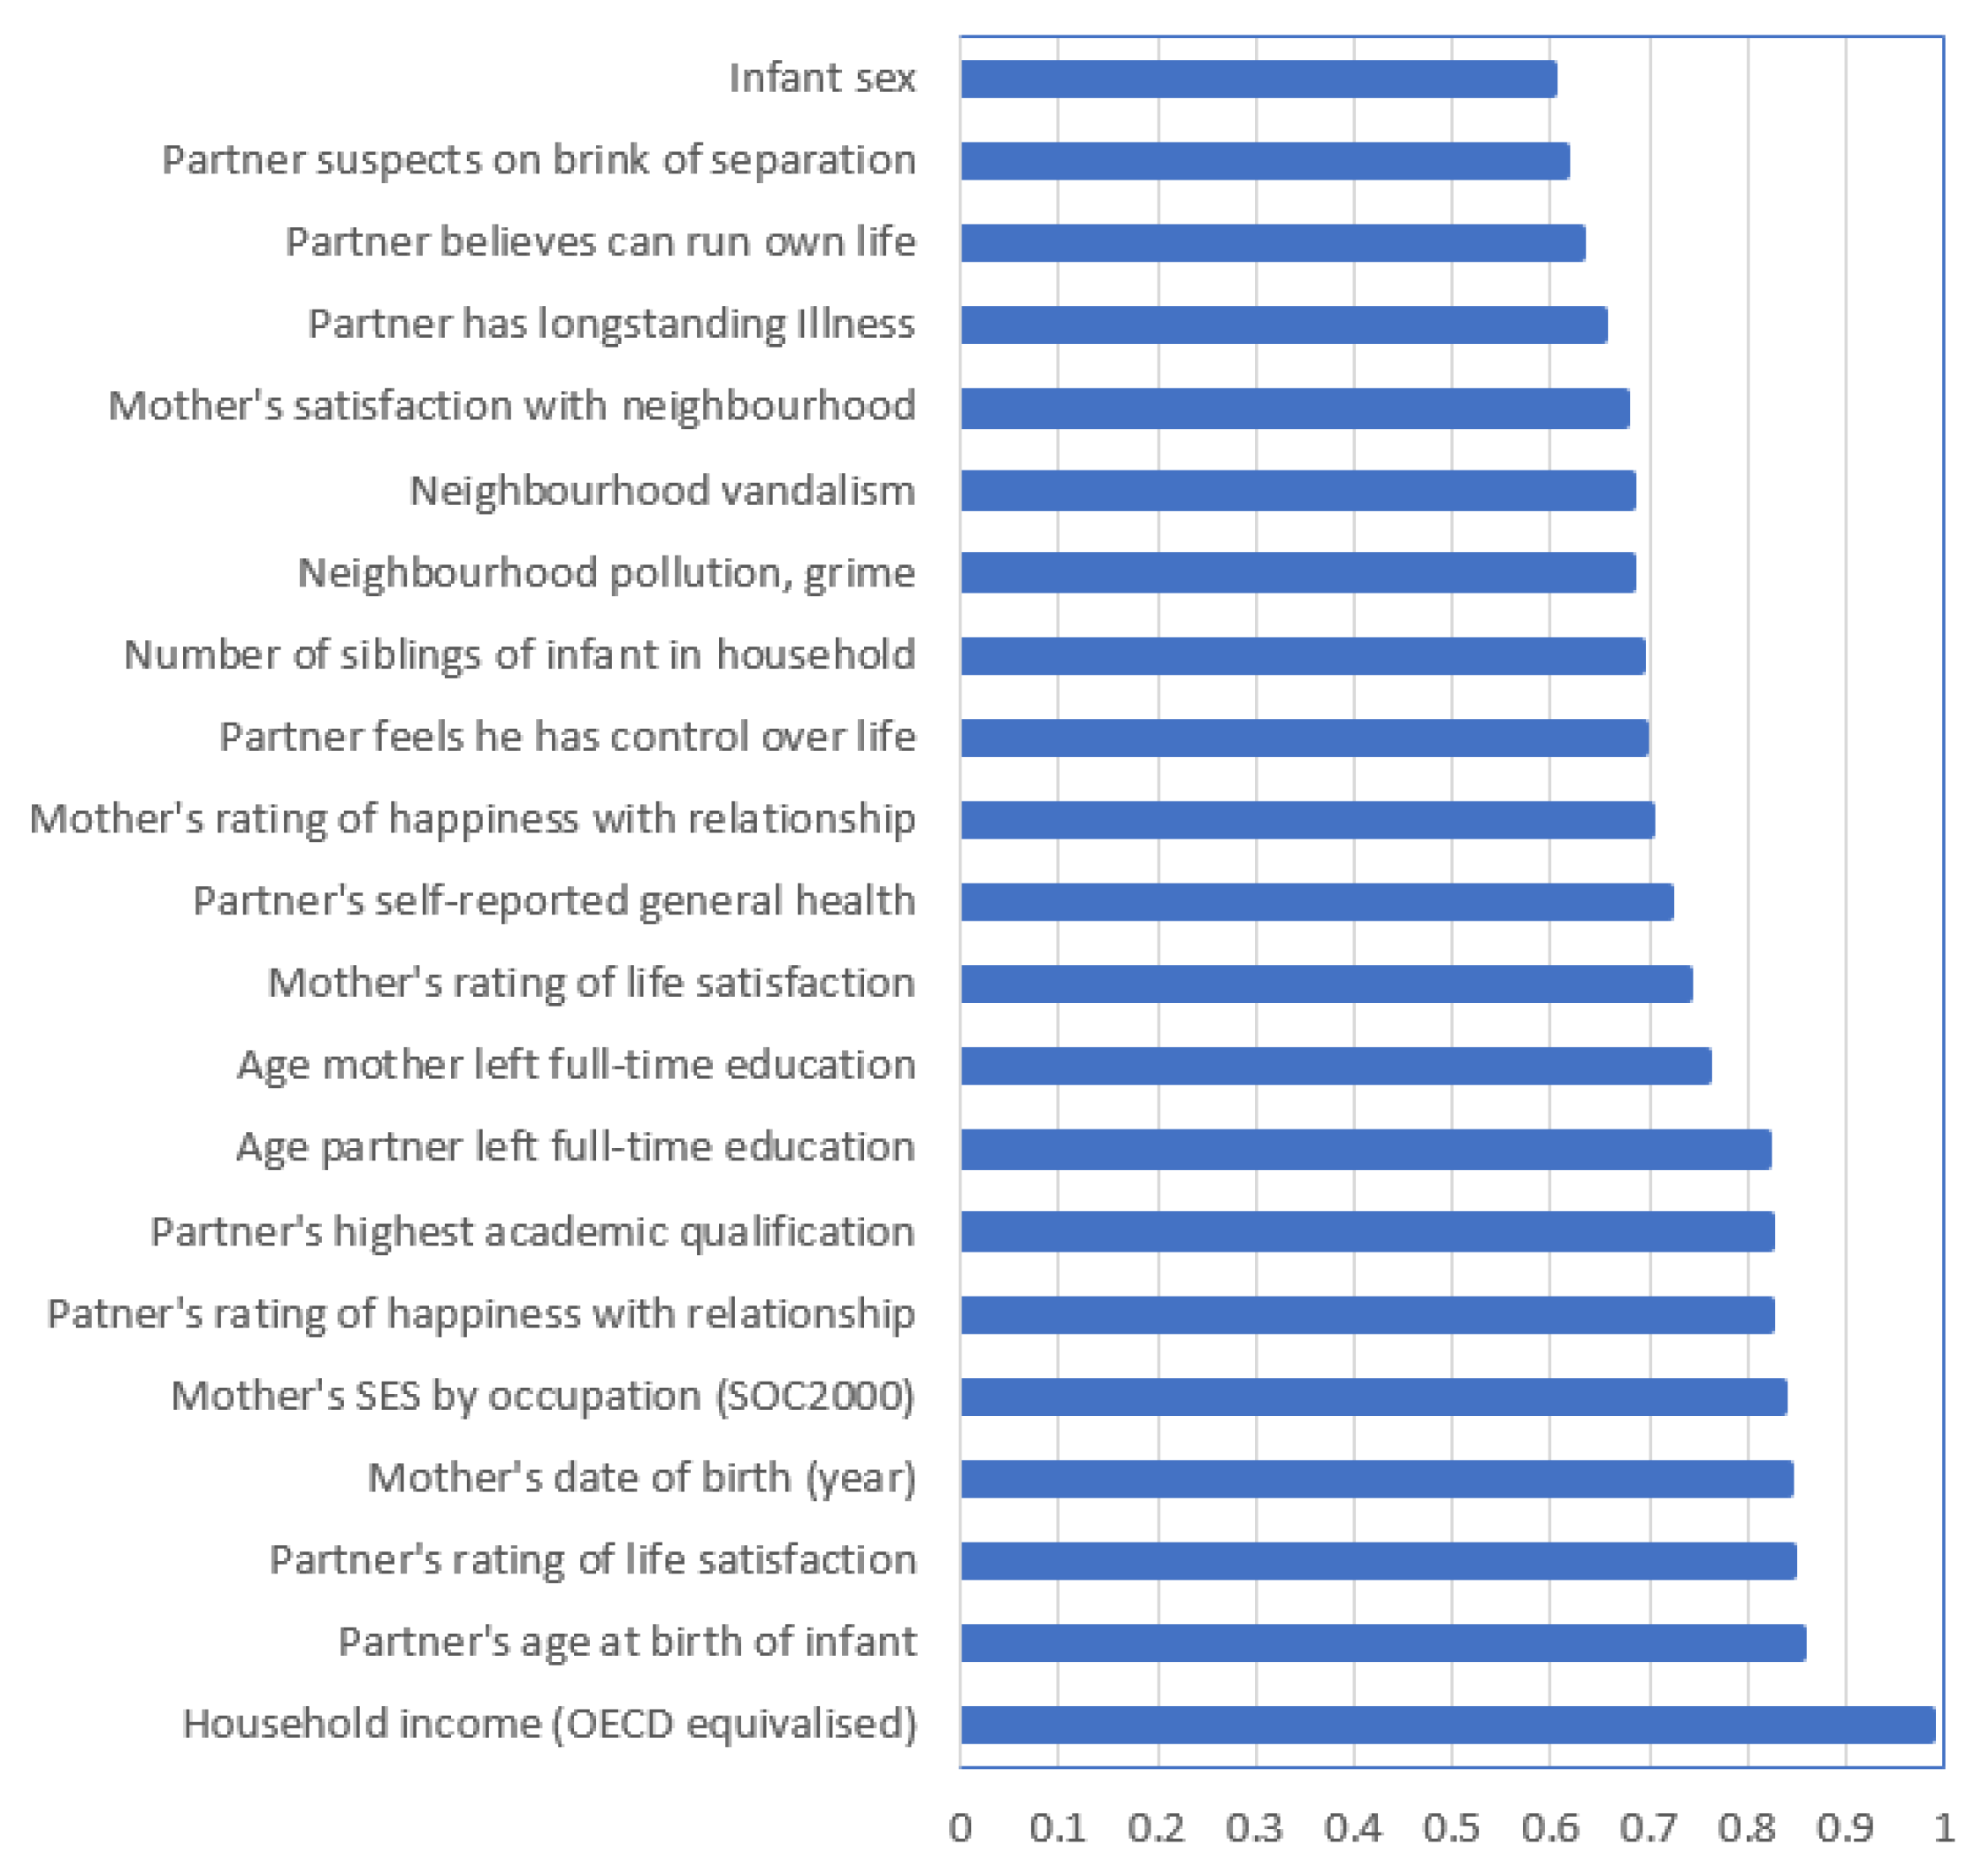
Figure 1. Importance scores for features with average importance scores above 0.6 in 72-feature RF algorithms predicting very premature birth before 32 weeks.
Reprodmed 03 00025 g001
Figure 2. Importance scores for features with average importance scores above 0.6 in 72-feature RF algorithms predicting premature birth before 37 weeks.
Reprodmed 03 00025 g002
Figure 3. Scatter plots with lowess-smoothed trend lines showing relationships between the proportion of infants born before 32 weeks (y-axis), and the six predictors in the RF algorithms with the highest feature importance scores. SES by job (SOC2000) is coded from high to low, and relationship and life satisfaction are coded from low to high satisfaction. Data points are hidden to avoid visual confusion and show the trends clearly.
Reprodmed 03 00025 g003
Figure 4. Scatter plots with lowess-smoothed trend lines showing relationships between the proportion of infants prematurely born before 37 weeks (y-axis), and the nine predictors in the RF algorithms with the highest feature importance scores. SES by job (SOC2000) and academic qualifications are coded from high to low, and relationship and life satisfaction are coded from low to high satisfaction. Data points are hidden to avoid visual confusion and show the trends clearly.
Reprodmed 03 00025 g004
Table 1. Descriptive statistics for the outcome and binary predictors.
VariableObsYesNo
Premature birth, before 37 weeks 18,201136116,840
Very premature birth, before 32 weeks 18,20119418,007
Pregnancy illness YesNo
Dorsopathies 18,20138217,819
Sciatica 18,20122517,796
Non-trivial infections 18,20130317,898
Anaemia 18,20136217,839
UTI 18,20150917,692
Eclampsia 18,20199417,207
Hyperemesis 18,20179717,404
Bleeding 18,201111517,086
Any illness reported in pregnancy 18,196687111,325
Reported longstanding illnesses occurring in more than 0.2% of the sample YesNo
Endometriosis 18,2015918,142
Arthritis 18,2017218,129
Psoriasis 18,2014118,160
Dermatitis 18,2017118,130
Irritable bowel syndrome 18,2016418,137
Asthma 18,20180517,396
Hypertension 18,2018218,119
Hearing loss 18,2015118,150
Migraine 18,2015618,145
Epilepsy 18,2019118,110
Clinical depression 18,20128217,919
Karotype 47 (xxx) 18,2014318,158
Diabetes mellitus 18,2019318,108
Thyroid problems 18,20117118,030
Anaemia 18,2014418,157
Mother in paid work while pregnant 18,18311,3646819
Partner in paid work at start of pregnancy 12,96311,8471116
Pregnancy result of fertility treatment 18,19447617,718
Mother reports getting depressed 18,196446813,728
Mother reports partner get in violent rage 12,58440512,179
Mother ever was a smoker 11,29817679531
Partner has depression 13,022120811,814
Partner has diabetes 13,02016012,860
Partner has longstanding illness 13,030264710,383
Home is damp 18,163248415,679
Grandparents live in household 18,201141416,787
Father not in household 18,175310215,073
Infant sex 18,2019337M8864F
Table 2. Descriptive statistics (non-binary variables).
Variable NameObsMeanSDMinMax
OECD equivalised income18,024289.7196.313.21282.8
Father’s age18,16531.95.71568
Number of children in household18,2010.931.0809
Age mother left full-time education (yrs)18,12117.62.8736
Mother’s ethnic group (8 categories) white, mixed, Indian, Pakistani, Bangladeshi, Caribbean, African, others.18,1721.61.618
Birth interval from last child (months)887042.827.99318
Mother’s age18,19920.15.91351
Age father left full-time education13,00117.62.9035
Father’s qualification MCS code (1 = highest)13,01224.838.5196
Father’s life satisfaction (10 = highest)12,5787.81.7110
Father feels he can run own life (1 = agree)12,5791.30.613
Father feels has control over life (1 = agree)12,5791.30.713
Father reports mother has used force (1 = Yes, 2 = no, 3 = refusal)12,2901.90.313
Partner happy with relationship (1 = lowest)12,2785.71.417
Partner suspects on brink of separation (1 = Yes)12,2894.60.716
Partner cigarettes per day before pregnancy (descriptive for smokers)5330139.4070
Partner’s self-rated general health (1 = healthy)13,0321.90.714
Neighbourhood vandalism (1 = least)18,1373.10.914
Neighbourhood pollution, grime (1 = least)17,9973.10.914
Mother’s satisfaction with area (1 = satisfied)18,1651.91.115
Housing (house = 1, to sharing = 4. Not codable = 5)18,1791.44.115
Mother suspects on brink of separation (1 = Yes)14,2414.70.716
Mother happy with relationship (1 = lowest)14,2345.71.417
Mother reports father has used force (1 = Yes, 2 = no, 3 = refusal)14,2402.00.213
Mother’s unit alcohol per day before pregnant (descriptive shown for drinkers only)36751.71.4022
Mother’s cigarettes per day before pregnancy (descriptive shown for smokers only)687711.88.1080
Singleton birth = 1, twins = 2, triplets = 318,2011.00.113
Mother’s maths ability: change in shops (1 = able)18,1721.10.313
Mother’s literacy: filling in forms (1 = able)18,1721.10.413
Mother’s SES by occupation (SOC2000)18,2014856.82884.609259
Mother’s life satisfaction (10 = highest)17,5967.71.8110
Mother feels she can run own life (1 = agree)17,6071.20.613
Mother feels has control over life (1 = agree)17,6071.40.713
Mother feels she gets what she wants (1 = agree)17,6092.00.513
Table 3. Summary of the RF results for algorithms with 72 features, and after feature reduction. Lower out-of-bag error indicates less error.
AlgorithmOut-of-Bag ErrorHyper-Tuning: n. Iterations/n. Variables at Each SplitSensitivity (n. Correctly Classified Premature/n. Premature)Specificity (Number Correctly Classified Not Premature/n. Not Premature)
Delivery before 32 weeks, 72 features0.010720/768% (131/194)100% (18,007/18,007)
Delivery before 32 weeks, algorithm reduced to 6 features0.010925/693% (180/194)100% (18,007/18,007)
Delivery before 37 weeks, 72 features0.075225/1270% (957/1361)100% (16,840/16,840)
Delivery before 37 weeks, algorithm reduced to 9 features0.074530/360% (821/1361)100% (16,840/16,840)
Publisher’s Note: MDPI stays neutral with regard to jurisdictional claims in published maps and institutional affiliations.