

Obesity Is Associated with Higher Odds of In-Hospital Mortality but Lower Risk of 5-Year Mortality in ST-Segment Elevation Myocardial Infarction Patients


 , ,
, ,
Abstract
1. Introduction
2. Methods
2.1. Study Population
2.2. Statistical Analysis
3. Results
3.1. Characteristics of STEMI Patients Stratified by BMI Groups
3.2. Outcomes of STEMI Patients Stratified by BMI Groups
3.3. Characteristics of STEMI Patients Stratified by BMI Groups and Sex
3.4. Outcomes of STEMI Patients Stratified by BMI Groups and Sex
4. Discussion
5. Limitations
6. Conclusions
Author Contributions
Funding
Institutional Review Board Statement
Informed Consent Statement
Data Availability Statement
Conflicts of Interest
Abbreviations
| BMI | Body mass index |
| CAD | Coronary artery disease |
| MACE | Major adverse cardiovascular events |
| MI | Myocardial infarction |
| OHCA | Out-of-hospital cardiac arrest |
| PCI | Percutaneous coronary intervention |
| RASS-I | Renin–angiotensin–aldosterone inhibitors |
| STEMI | ST-segment elevation myocardial infarction |
References
- Martin, S.S.; Aday, A.W.; Almarzooq, Z.I.; Anderson, C.A.M.; Arora, P.; Avery, C.L.; Baker-Smith, C.M.; Barone Gibbs, B.; Beaton, A.Z.; Boehme, A.K.; et al. 2024 Heart Disease and Stroke Statistics: A Report of US and Global Data from the American Heart Association. Circulation 2024, 149, E347–E913. [Google Scholar] [CrossRef] [PubMed]
- Timmis, A.; Aboyans, V.; Vardas, P.; Townsend, N.; Torbica, A.; Kavousi, M.; Boriani, G.; Huculeci, R.; Kazakiewicz, D.; Scherr, D.; et al. European Society of Cardiology: The 2023 Atlas of Cardiovascular Disease Statistics. Eur. Heart J. 2024, 45, 4019–4062. [Google Scholar] [CrossRef] [PubMed]
- Khan, S.S.; Ning, H.; Wilkins, J.T.; Allen, N.; Carnethon, M.; Berry, J.D.; Sweis, R.N.; Lloyd-Jones, D.M. Association of Body Mass Index with Lifetime Risk of Cardiovascular Disease and Compression of Morbidity. JAMA Cardiol. 2018, 3, 280–287. [Google Scholar] [CrossRef] [PubMed]
- Powell-Wiley, T.M.; Poirier, P.; Burke, L.E.; Després, J.P.; Gordon-Larsen, P.; Lavie, C.J.; Lear, S.A.; Ndumele, C.E.; Neeland, I.J.; Sanders, P.; et al. Obesity and Cardiovascular Disease: A Scientific Statement from the American Heart Association. Circulation 2021, 143, E984–E1010. [Google Scholar] [CrossRef] [PubMed]
- Romero-Corral, A.; Montori, V.M.; Somers, V.K.; Korinek, J.; Thomas, R.J.; Allison, T.G.; Mookadam, F.; Lopez-Jimenez, F. Association of Bodyweight with Total Mortality and with Cardiovascular Events in Coronary Artery Disease: A Systematic Review of Cohort Studies. Lancet 2006, 368, 666–678. [Google Scholar] [CrossRef] [PubMed]
- Niedziela, J.; Hudzik, B.; Niedziela, N.; Gąsior, M.; Gierlotka, M.; Wasilewski, J.; Myrda, K.; Lekston, A.; Poloński, L.; Rozentryt, P. The Obesity Paradox in Acute Coronary Syndrome: A Meta-Analysis. Eur. J. Epidemiol. 2014, 29, 801–812. [Google Scholar] [CrossRef] [PubMed]
- Liu, S.H.; Lin, Y.Z.; Han, S.; Jin, Y.Z. The Obesity Paradox in ST-Segment Elevation Myocardial Infarction Patients: A Meta-Analysis. Ann. Noninvasive Electrocardiol. 2023, 28, e13022. [Google Scholar] [CrossRef] [PubMed]
- Saygi, M.; Uzman, O.; Birdal, O.; Karagoz, A.; Yumurtas, A.C.; Tezen, O.; Tanboga, I.H.; Karabay, C.Y. The Relation of Body Mass Index with In-Hospital Mortality in Patients with ST-Segment Elevation Myocardial Infarction. Metab. Syndr. Relat. Disord. 2023, 21, 94–100. [Google Scholar] [CrossRef] [PubMed]
- Chaudhry, H.; Bodair, R.; Mahfoud, Z.; Dargham, S.; Al Suwaidi, J.; Jneid, H.; Abi Khalil, C. Overweight and Obesity Are Associated with Better Survival in STEMI Patients with Diabetes. Obesity 2023, 31, 2834–2844. [Google Scholar] [CrossRef] [PubMed]
- Keller, K.; Münzel, T.; Ostad, M.A. Sex-Specific Differences in Mortality and the Obesity Paradox of Patients with Myocardial Infarction Ages >70 y. Nutrition 2018, 46, 124–130. [Google Scholar] [CrossRef] [PubMed]
- Elbaz-Greener, G.; Rozen, G.; Carasso, S.; Kusniec, F.; Marai, I.; Sud, M.; Strauss, B.; Smart, F.W.; Planer, D.; Amir, O. The Relationship Between Body Mass Index and In-Hospital Mortality in the Contemporary Era of an Acute Myocardial Infarction Management. Vasc. Health Risk Manag. 2021, 17, 551–559. [Google Scholar] [CrossRef] [PubMed]
- Das, S.R.; Alexander, K.P.; Chen, A.Y.; Powell-Wiley, T.M.; Diercks, D.B.; Peterson, E.D.; Roe, M.T.; De Lemos, J.A. Impact of Body Weight and Extreme Obesity on the Presentation, Treatment, and in-Hospital Outcomes of 50,149 Patients with ST-Segment Elevation Myocardial Infarction: Results from the NCDR (National Cardiovascular Data Registry). J. Am. Coll. Cardiol. 2011, 58, 2642–2650. [Google Scholar] [CrossRef] [PubMed]
- Payvar, S.; Kim, S.; Rao, S.V.; Krone, R.; Neely, M.; Paladugu, N.; Daggubati, R. In-Hospital Outcomes of Percutaneous Coronary Interventions in Extremely Obese and Normal-Weight Patients: Findings from the NCDR (National Cardiovascular Data Registry). J. Am. Coll. Cardiol. 2013, 62, 692–696. [Google Scholar] [CrossRef] [PubMed]
- Herrmann, J.; Gersh, B.J.; Goldfinger, J.Z.; Witzenbichler, B.; Guagliumi, G.; Dudek, D.; Kornowski, R.; Brener, S.J.; Parise, H.; Fahy, M.; et al. Body Mass Index and Acute and Long-Term Outcomes after Acute Myocardial Infarction (from the Harmonizing Outcomes with Revascularization and Stents in Acute Myocardial Infarction Trial). Am. J. Cardiol. 2014, 114, 9–16. [Google Scholar] [CrossRef] [PubMed]
- Sharbati, M.; Heidarimoghadam, R.; Rouzbahani, M.; Salehi, N.; Montazeri, N.; Azimivaghar, J.; Mahmoudi, S.; Rai, A. The Effects of the Obesity Paradox and In-Hospital and One-Year Outcomes in Patients with ST Elevation Myocardial Infarction (STEMI): Results From a STEMI Registry. ARYA Atheroscler. 2023, 19, 89–97. [Google Scholar] [CrossRef] [PubMed]
- Karastergiou, K.; Smith, S.R.; Greenberg, A.S.; Fried, S.K. Sex Differences in Human Adipose Tissues—The Biology of Pear Shape. Biol. Sex Differ. 2012, 3, 13. [Google Scholar] [CrossRef] [PubMed]
- Lumish, H.S.; O’Reilly, M.; Reilly, M.P. Sex Differences in Genomic Drivers of Adipose Distribution and Related Cardiometabolic Disorders: Opportunities for Precision Medicine. Arterioscler. Thromb. Vasc. Biol. 2020, 40, 45–60. [Google Scholar] [CrossRef] [PubMed]
- Yildiz, M.; Sharkey, S.; Aguirre, F.V.; Tannenbaum, M.; Garberich, R.; Smith, T.D.; Shivapour, D.; Schmidt, C.W.; Pacheco-Coronado, R.; Rohm, H.S.; et al. The Midwest ST-Elevation Myocardial Infarction Consortium: Design and Rationale. Cardiovasc. Revasc. Med. 2021, 23, 86–90. [Google Scholar] [CrossRef] [PubMed]
- Samanta, R.; Narayan, A.; Kovoor, P.; Thiagalingam, A. Influence of BMI on Short and Long-Term Outcomes in Patients with STEMI and LV Dysfunction. Heart Lung Circ. 2020, 29, 361–367. [Google Scholar] [CrossRef] [PubMed]
- Neeland, I.J.; Das, S.R.; Simon, D.N.; Diercks, D.B.; Alexander, K.P.; Wang, T.Y.; De Lemos, J.A. The Obesity Paradox, Extreme Obesity, and Long-Term Outcomes in Older Adults with ST-Segment Elevation Myocardial Infarction: Results from the NCDR. Eur. Heart J. Qual. Care Clin. Outcomes 2017, 3, 183–191. [Google Scholar] [CrossRef] [PubMed]
- Baumann, S.; Koepp, J.; Becher, T.; Huseynov, A.; Bosch, K.; Behnes, M.; Fastner, C.; EL-Battrawy, I.; Renker, M.; Lang, S.; et al. Biomarker Evaluation as a Potential Cause of Gender Differences in Obesity Paradox among Patients with STEMI. Cardiovasc. Revasc. Med. 2016, 17, 88–94. [Google Scholar] [CrossRef] [PubMed]
- Zhang, L.; Liu, Z.; Zhu, Y.; Zeng, J.; Huang, H.; Yang, W.; Peng, K.; Wu, M. Sex-Specific Impact of Mild Obesity on the Prognosis of ST-Segment Elevation Myocardial Infarction. Sci. Rep. 2024, 14, 2228. [Google Scholar] [CrossRef] [PubMed]
- Chang, E.; Varghese, M.; Singer, K. Gender and Sex Differences in Adipose Tissue. Curr. Diab. Rep. 2018, 18, 69. [Google Scholar] [CrossRef] [PubMed]
- Fuente-Martín, E.; Argente-Arizón, P.; Ros, P.; Argente, J.; Chowen, J.A. Sex Differences in Adipose Tissue: It Is Not Only a Question of Quantity and Distribution. Adipocyte 2013, 2, 128–134. [Google Scholar] [CrossRef] [PubMed]
- Frias, J.P.; Macaraeg, G.B.; Ofrecio, J.; Yu, J.G.; Olefsky, J.M.; Kruszynska, Y.T. Decreased Susceptibility to Fatty Acid-Induced Peripheral Tissue Insulin Resistance in Women. Diabetes 2001, 50, 1344–1350. [Google Scholar] [CrossRef] [PubMed]
- Ibrahim, M.M. Subcutaneous and Visceral Adipose Tissue: Structural and Functional Differences. Obes. Rev. 2010, 11, 11–18. [Google Scholar] [CrossRef] [PubMed]
- Porter, S.A.; Massaro, J.M.; Hoffmann, U.; Vasan, R.S.; O’Donnel, C.J.; Fox, C.S. Abdominal Subcutaneous Adipose Tissue: A Protective Fat Depot? Diabetes Care 2009, 32, 1068–1075. [Google Scholar] [CrossRef] [PubMed]
- Lovejoy, J.C.; Champagne, C.M.; De Jonge, L.; Xie, H.; Smith, S.R. Increased Visceral Fat and Decreased Energy Expenditure during the Menopausal Transition. Int. J. Obes. 2008, 32, 949–958. [Google Scholar] [CrossRef] [PubMed]


| Demographics and Characteristic | Normal BMI, n = 1038 | Overweight, n = 1697 | Obese, n = 1947 | p-Value |
|---|---|---|---|---|
| Sex, n (%) | <0.001 | |||
| Female | 399 (38%) | 418 (25%) | 591 (30%) | |
| Male | 639 (62%) | 1279 (75%) | 1356 (70%) | |
| Age, y, median (IQR) | 67 (58, 79) | 63 (55, 73) | 61 (53, 70) | <0.001 |
| Race/Ethnicity, n (%) | <0.001 | |||
| Non-Hispanic White | 927 (91%) | 1523 (91%) | 1794 (93%) | |
| Black | 47 (4.6%) | 89 (5.3%) | 90 (4.7%) | |
| Asian | 26 (2.5%) | 15 (0.9%) | 6 (0.3%) | |
| Hispanic | 8 (0.8%) | 25 (1.5%) | 17 (0.9%) | |
| Other | 15 (1.5%) | 24 (1.4%) | 16 (0.8%) | |
| Comorbidities, n (%) | ||||
| Hypertension | 564 (55%) | 929 (55%) | 1366 (70%) | <0.001 |
| Diabetes | 151 (15%) | 323 (19%) | 606 (31%) | <0.001 |
| Dyslipidemia | 479 (46%) | 922 (55%) | 1163 (60%) | <0.001 |
| Smoking History | 632 (61%) | 1040 (62%) | 1163 (60%) | 0.6 |
| History of CAD | 315 (30%) | 540 (32%) | 619 (32%) | 0.7 |
| History of Stroke | 76 (7.4%) | 79 (4.7%) | 94 (4.8%) | 0.005 |
| History of MI | 213 (21%) | 376 (22%) | 442 (23%) | 0.4 |
| Medications on Admission, n (%) | ||||
| ASA | 404 (39%) | 668 (40%) | 854 (44%) | 0.009 |
| Anti-platelet | 92 (9.0%) | 145 (8.7%) | 204 (11%) | 0.12 |
| Statins | 329 (32%) | 587 (35%) | 733 (38%) | 0.006 |
| Beta Blockers | 292 (28%) | 482 (29%) | 663 (34%) | <0.001 |
| RAAS-I | 261 (25%) | 445 (27%) | 703 (36%) | <0.001 |
| Clinical Characteristics | ||||
| BMI, kg/m2, median (IQR) | 23.1 (21.5, 24.2) | 27.5 (26.3, 28.7) | 33.8 (31.6, 37.1) | <0.001 |
| SBP, mmHg, mean (SD) | 136 (31) | 140 (33) | 143 (34) | <0.001 |
| DBP, mmHg, mean (SD) | 81 (20) | 85 (21) | 86 (22) | <0.001 |
| HR, bpm, median (IQR) | 77 (64, 92) | 76 (64, 91) | 81 (68, 96) | <0.001 |
| LVEF, % median (IQR) | 50 (37, 58) | 52 (40, 60) | 51 (40, 60) | <0.001 |
| OHCA, n (%) | 96 (9.2%) | 163 (9.6%) | 234 (12%) | 0.02 |
| CS Pre-PCI, n (%) | 100 (9.6%) | 165 (9.7%) | 202 (10%) | 0.7 |
| Killip Class, n (%) | 0.3 | |||
| 1 or 2 | 951 (92%) | 1533 (90%) | 1755 (90%) | |
| 3 or 4 | 85 (8.2%) | 162 (9.6%) | 191 (9.8%) | |
| Laboratory Markers | ||||
| Peak Trop, ng/mL, median (IQR) | 8 (1, 41) | 9 (1, 40) | 9 (1, 42) | 0.7 |
| Peak Cr, mg/dL, median (IQR) | 0.98 (0.82, 1.23) | 1.04 (0.87, 1.26) | 1.05 (0.89, 1.32) | <0.001 |
| Angiographic Characteristics | ||||
| Door-to-Balloon Time, median (IQR) | 92 (65, 122) | 88 (60, 117) | 95 (67, 126) | <0.001 |
| Culprit Artery, n (%) | <0.001 | |||
| Left Main | 12 (1.2%) | 24 (1.5%) | 17 (0.9%) | |
| LAD | 340 (33%) | 541 (33%) | 608 (32%) | |
| LCx | 107 (11%) | 208 (13%) | 271 (14%) | |
| RCA | 349 (34%) | 606 (37%) | 727 (38%) | |
| Multiple | 14 (1.4%) | 21 (1.3%) | 37 (1.9%) | |
| Graft | 21 (2.1%) | 43 (2.6%) | 37 (1.9%) | |
| None | 172 (17%) | 211 (13%) | 210 (11%) | |
| TIMI Flow Pre-PCI, n (%) | 0.002 | |||
| 0 or 1 | 511 (58%) | 894 (60%) | 1123 (65%) | |
| 2 or 3 | 371 (42%) | 595 (40%) | 618 (35%) | |
| TIMI Flow Post-PCI, n (%) | 0.5 | |||
| 0 or 1 | 15 (1.7%) | 30 (2.0%) | 41 (2.4%) | |
| 2 or 3 | 867 (98%) | 1455 (98%) | 1699 (98%) |
| Outcomes | Normal BMI, n = 1038 | Overweight, n = 1697 | Obese, n = 1947 | p-Value |
|---|---|---|---|---|
| Discharge Medications, n (%) | ||||
| ASA | 879 (91%) | 1512 (94%) | 1701 (94%) | 0.003 |
| Anti-platelet | 801 (84%) | 1362 (86%) | 1593 (89%) | 0.002 |
| Statins | 845 (88%) | 1466 (92%) | 1667 (93%) | <0.001 |
| Beta Blockers | 829 (86%) | 1422 (89%) | 1652 (92%) | <0.001 |
| RAAS-I | 655 (69%) | 1162 (73%) | 1358 (76%) | <0.001 |
| Treatment, n (%) | ||||
| PCI | 812 (78%) | 1388 (82%) | 1632 (84%) | <0.001 |
| Medical Management | 133 (13%) | 175 (10%) | 172 (9.0%) | 0.003 |
| Outcomes, n (%) | ||||
| In-Hospital Death | 59 (5.7%) | 77 (4.5%) | 123 (6.3%) | 0.062 |
| In-Hospital MACE | 68 (6.6%) | 90 (5.3%) | 139 (7.1%) | 0.073 |
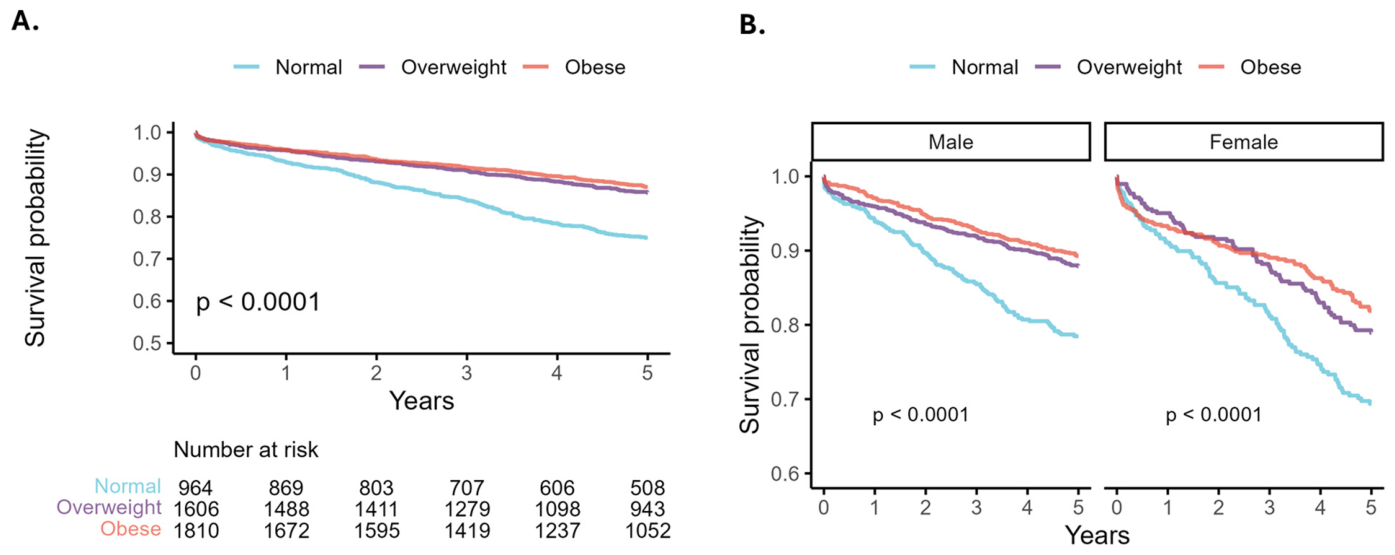
| 5-year Mortality | 274 (27%) | 274 (16%) | 324 (17%) | <0.001 |
| Unadjusted Model | Adjusted Model | |
|---|---|---|
| Overall STEMI Cohort | ||
| In-Hospital Mortality [(OR), 95% CI] | ||
| Normal BMI | 1.0 (Reference) | 1.0 (Reference) |
| Overweight | 0.79 (0.56–1.12) | 1.1 (0.67–1.8) |
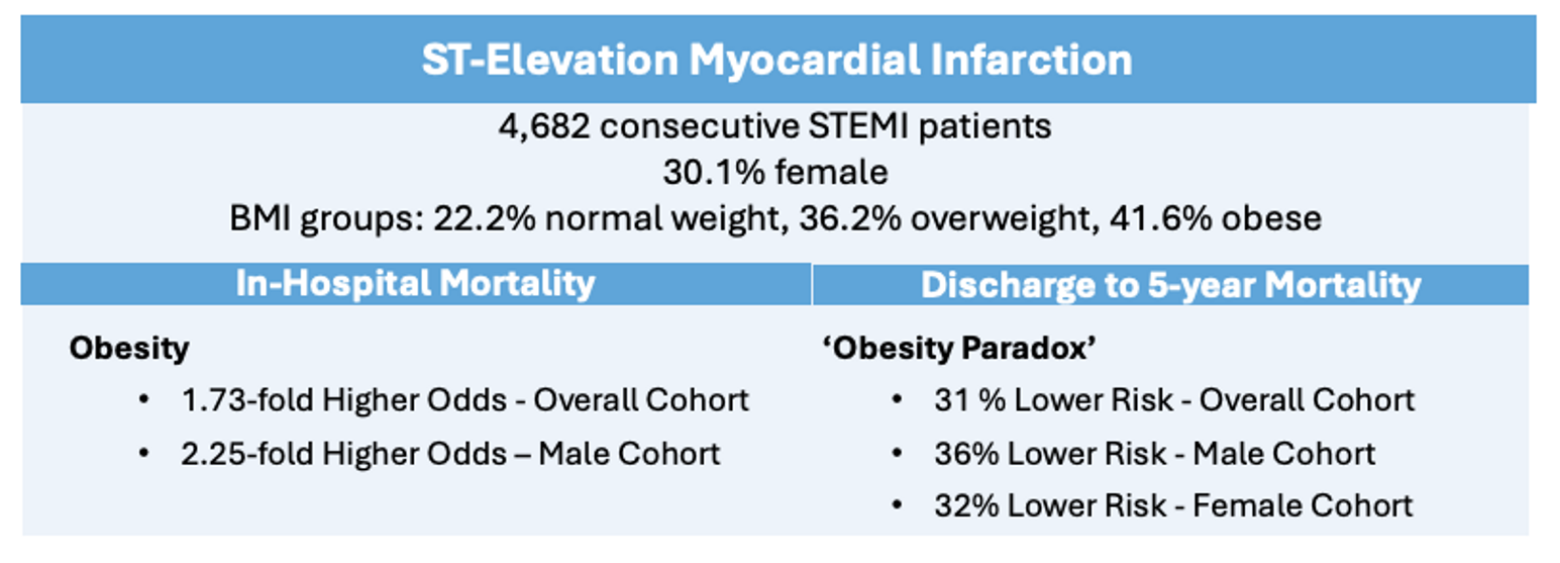
| Obese | 1.12 (0.82–1.55) | 1.73 (1.08–2.8) |
| Discharge-to-5-Year Mortality [(HR), 95% CI] | ||
| Normal BMI | 1.0 (Reference) | 1.0 (Reference) |
| Overweight | 0.54 (0.44–0.65) | 0.69 (0.57–0.85) |
| Obese | 0.48 (0.4–0.58) | 0.66 (0.53–0.82) |
| 5-Year Mortality [(HR), 95% CI] | ||
| Normal BMI | 1.0 (Reference) | 1.0 (Reference) |
| Overweight | 0.59 (0.5–0.7) | 0.73 (0.61–0.88) |
| Obese | 0.61 (0.52–0.72) | 0.8 (0.66–0.97) |
| Female STEMI Cohort | ||
| In-Hospital Mortality [(OR), 95% CI] | ||
| Normal BMI | 1.0 (Reference) | 1.0 (Reference) |
| Overweight | 0.74 (0.42–1.3) | 0.8 (0.35–1.78) |
| Obese | 0.8 (0.48–1.34) | 1.31 (0.64–2.73) |
| Discharge-to-5-Year Mortality [(HR), 95% CI] | ||
| Normal BMI | 1.0 (Reference) | 1.0 (Reference) |
| Overweight | 0.64 (0.47–0.87) | 0.79 (0.57–1.08) |
| Obese | 0.55 (0.41–0.73) | 0.68 (0.49–0.94) |
| 5-Year Mortality [(HR), 95% CI] | ||
| Normal BMI | 1.0 (Reference) | 1.0 (Reference) |
| Overweight | 0.66 (0.51–0.86) | 0.77 (0.57–1.03) |
| Obese | 0.61 (0.47–0.78) | 0.77 (0.58–1.03) |
| Male STEMI Cohort | ||
| In-Hospital Mortality [(OR), 95% CI] | ||
| Normal BMI | 1.0 (Reference) | 1.0 (Reference) |
| Overweight | 0.89 (0.57–1.43) | 1.42 (0.74–2.81) |
| Obese | 1.41 (0.93–2.19) | 2.25 (1.18–4.51) |
| Discharge-to-5-Year Mortality [(HR), 95% CI] | ||
| Normal BMI | 1.0 (Reference) | 1.0 (Reference) |
| Overweight | 0.53 (0.42–0.69) | 0.63 (0.49–0.82) |
| Obese | 0.47 (0.36–0.6) | 0.64 (0.48–0.85) |
| 5-Year Mortality [(HR), 95% CI] | ||
| Normal BMI | 1.0 (Reference) | 1.0 (Reference) |
| Overweight | 0.61 (0.49–0.76) | 0.71 (0.56–0.91) |
| Obese | 0.65 (0.53–0.8) | 0.83 (0.64–1.06) |
| Demographics and Characteristics | Female | Male | ||||||
|---|---|---|---|---|---|---|---|---|
| Normal BMI | Overweight | Obese | p-Value | Normal BMI | Overweight | Obese | p-Value | |
| n = 399 | n = 418 | n = 591 | n = 639 | n = 1279 | n = 1356 | |||
| Age, y, median (IQR) | 72 (61, 83) | 68 (59, 78) | 65 (55, 74) | <0.001 | 65 (54, 76) | 62 (54, 71) | 60 (52, 68) | <0.001 |
| Race/Ethnicity, n (%) | <0.001 | <0.001 | ||||||
| Non-Hispanic White | 367 (93%) | 369 (90%) | 528 (91%) | 560 (89%) | 1154 (91%) | 1266 (94%) | ||
| Black | 8 (2.0%) | 29 (7.0%) | 47 (8.1%) | 39 (6.2%) | 60 (4.7%) | 43 (3.2%) | ||
| Asian | 6 (1.5%) | 3 (0.7%) | 2 (0.3%) | 20 (3.2%) | 12 (0.9%) | 4 (0.3%) | ||
| Hispanic | 1 (0.3%) | 5 (1.2%) | 5 (0.9%) | 7 (1.1%) | 20 (1.6%) | 12 (0.9%) | ||
| Other | 11 (2.8%) | 6 (1.5%) | 1 (0.2%) | 4 (0.6%) | 18 (1.4%) | 15 (1.1%) | ||
| Comorbidities, n (%) | ||||||||
| Hypertension | 248 (63%) | 258 (62%) | 448 (76%) | <0.001 | 316 (50%) | 671 (53%) | 918 (68%) | <0.001 |
| Diabetes | 57 (14%) | 104 (25%) | 236 (40%) | <0.001 | 94 (15%) | 219 (17%) | 370 (27%) | <0.001 |
| Dyslipidemia | 191 (48%) | 240 (58%) | 365 (62%) | <0.001 | 288 (45%) | 682 (54%) | 798 (59%) | <0.001 |
| Smoking history | 207 (52%) | 218 (52%) | 344 (59%) | 0.065 | 425 (67%) | 822 (65%) | 819 (61%) | 0.019 |
| History of CAD | 109 (28%) | 128 (31%) | 170 (29%) | 0.6 | 206 (32%) | 412 (32%) | 449 (33%) | 0.9 |
| History of Stroke | 26 (6.6%) | 23 (5.5%) | 49 (8.3%) | 0.2 | 50 (7.8%) | 56 (4.4%) | 45 (3.3%) | <0.001 |
| History of MI | 71 (18%) | 95 (23%) | 122 (21%) | 0.2 | 142 (22%) | 281 (22%) | 320 (24%) | 0.5 |
| Medications on Admission, n (%) | ||||||||
| ASA | 156 (39%) | 182 (44%) | 266 (45%) | 0.2 | 248 (39%) | 486 (39%) | 588 (44%) | 0.024 |
| Anti-platelet | 37 (9.3%) | 30 (7.2%) | 64 (11%) | 0.13 | 55 (8.7%) | 115 (9.1%) | 140 (10%) | 0.4 |
| Statins | 132 (33%) | 147 (35%) | 231 (39%) | 0.13 | 197 (31%) | 440 (35%) | 502 (37%) | 0.032 |
| Beta Blockers | 127 (32%) | 133 (32%) | 223 (38%) | 0.064 | 165 (26%) | 349 (28%) | 440 (33%) | 0.003 |
| RASS-I | 101 (26%) | 127 (31%) | 230 (39%) | <0.001 | 160 (25%) | 318 (25%) | 473 (35%) | <0.001 |
| Clinical Characteristics | ||||||||
| BMI, kg/m2, median (IQR) | 23 (21, 24) | 28 (26, 29) | 34 (32, 39) | <0.001 | 23 (22, 24) | 28 (26, 29) | 34 (31, 37) | <0.001 |
| SBP, mmHg, mean (SD) | 137 (32) | 137 (33) | 142 (35) | 0.007 | 135 (31) | 141 (32) | 144 (33) | <0.001 |
| DBP, mmHg, mean (SD) | 80 (20) | 81 (21) | 83 (22) | 0.015 | 82 (20) | 86 (21) | 88 (22) | <0.001 |
| Heart rate, bpm, median (IQR) | 78 (66, 94) | 80 (65, 95) | 83 (69, 100) | 0.015 | 76 (63, 90) | 75 (64, 90) | 80 (67, 95) | <0.001 |
| LVEF, %, median (IQR) | 50 (35, 60) | 52 (40, 60) | 50 (40, 60) | 0.2 | 50 (38, 58) | 51 (40, 60) | 52 (40, 60) | 0.003 |
| OHCA, n (%) | 33 (8.3%) | 37 (8.9%) | 52 (8.8%) | >0.9 | 63 (9.9%) | 126 (9.9%) | 182 (13%) | 0.007 |
| CS pre-PCI, n (%) | 42 (11%) | 53 (13%) | 66 (11%) | 0.6 | 58 (9.1%) | 112 (8.8%) | 136 (10%) | 0.5 |
| Killip class, n (%) | 0.3 | 0.6 | ||||||
| 1 or 2 | 361 (91%) | 367 (88%) | 520 (88%) | 590 (92%) | 1166 (91%) | 1235 (91%) | ||
| 3 or 4 | 37 (9.3%) | 51 (12%) | 71 (12%) | 48 (7.5%) | 111 (8.7%) | 120 (8.9%) | ||
| Laboratory Markers | ||||||||
| Peak Trop, ng/mL, median (IQR) | 5 (1, 28) | 7 (1, 30) | 9 (1, 35) | 0.14 | 10 (1, 54) | 10 (1, 43) | 9 (1, 44) | 0.9 |
| Peak Cr, mg/dL, median (IQR) | 0.9 (0.8, 1.1) | 0.9 (0.8, 1.1) | 0.9 (0.8, 1.3) | <0.001 | 1.0 (0.9, 1.3) | 1.1 (0.9, 1.3) | 1.1 (0.9, 1.3) | 0.001 |
| Angiographic Characteristics | ||||||||
| Door-to-Balloon Time, median (IQR) | 94 (71, 127) | 90 (65, 123) | 96 (64, 132) | 0.2 | 90 (62, 119) | 87 (59, 116) | 94 (69, 123) | <0.001 |
| Culprit Artery, n (%) | 0.046 | 0.020 | ||||||
| LAD | 124 (32%) | 118 (29%) | 185 (32%) | 216 (35%) | 423 (34%) | 423 (32%) | ||
| LCx | 34 (8.7%) | 50 (12%) | 80 (14%) | 73 (12%) | 158 (13%) | 191 (14%) | ||
| Left Main | 5 (1.3%) | 3 (0.7%) | 8 (1.4%) | 7 (1.1%) | 21 (1.7%) | 9 (0.7%) | ||
| Multiple | 8 (2.1%) | 5 (1.2%) | 10 (1.7%) | 6 (1.0%) | 16 (1.3%) | 27 (2.0%) | ||
| None | 83 (21%) | 70 (17%) | 77 (13%) | 89 (14%) | 141 (11%) | 133 (10%) | ||
| Graft | 5 (1.3%) | 12 (2.9%) | 9 (1.5%) | 16 (2.6%) | 31 (2.5%) | 28 (2.1%) | ||
| TIMI Flow Pre-PCI, n (%) | 0.11 | 0.017 | ||||||
| 0 or 1 | 183 (56%) | 201 (56%) | 321 (62%) | 328 (59%) | 693 (61%) | 802 (66%) | ||
| 2 or 3 | 146 (44%) | 156 (44%) | 197 (38%) | 225 (41%) | 439 (39%) | 421 (34%) | ||
| TIMI Flow Post-PCI, n (%) | 0.031 | 0.5 | ||||||
| 0 or 1 | 6 (1.8%) | 2 (0.6%) | 16 (3.1%) | 9 (1.6%) | 28 (2.5%) | 25 (2.0%) | ||
| 2 or 3 | 323 (98%) | 353 (99%) | 501 (97%) | 544 (98%) | 1102 (98%) | 1198 (98%) | ||
| Outcomes | Female | Male | ||||||
|---|---|---|---|---|---|---|---|---|
| Normal BMI | Overweight | Obese | p-Value | Normal BMI | Overweight | Obese | p-Value | |
| n = 399 | n = 418 | n = 591 | n = 639 | n = 1279 | n = 1356 | |||
| Discharge Medications, n (%) | ||||||||
| ASA | 327 (89%) | 375 (96%) | 507 (93%) | 0.002 | 552 (92%) | 1137 (94%) | 1194 (95%) | 0.13 |
| Anti-platelet | 292 (80%) | 318 (83%) | 465 (86%) | 0.1 | 509 (86%) | 1044 (87%) | 1128 (90%) | 0.031 |
| Statins | 309 (84%) | 347 (89%) | 492 (90%) | 0.017 | 536 (90%) | 1119 (93%) | 1175 (94%) | 0.02 |
| Beta Blockers | 320 (88%) | 344 (88%) | 499 (92%) | 0.1 | 509 (85%) | 1078 (89%) | 1153 (92%) | <0.001 |
| RASS-I | 230 (64%) | 263 (68%) | 388 (72%) | 0.025 | 425 (72%) | 899 (75%) | 970 (77%) | 0.029 |
| Treatment | ||||||||
| PCI, n (%) | 288 (72%) | 324 (78%) | 483 (82%) | 0.002 | 524 (82%) | 1064 (83%) | 1149 (85%) | 0.2 |
| Medical Management, n (%) | 65 (16%) | 56 (14%) | 62 (11%) | 0.033 | 68 (11%) | 119 (9.4%) | 110 (8.2%) | 0.2 |
| Outcomes, n (%) | ||||||||
| In-Hospital Death | 29 (7.3%) | 23 (5.5%) | 35 (5.9%) | 0.5 | 30 (4.7%) | 54 (4.2%) | 88 (6.5%) | 0.026 |
| In-Hospital MACE | 31 (7.8%) | 28 (6.7%) | 39 (6.6%) | 0.8 | 37 (5.8%) | 62 (4.8%) | 100 (7.4%) | 0.024 |
| 5-year Mortality | 128 (33%) | 93 (22%) | 120 (21%) | <0.001 | 146 (23%) | 181 (14%) | 204 (15%) | <0.001 |
Disclaimer/Publisher’s Note: The statements, opinions and data contained in all publications are solely those of the individual author(s) and contributor(s) and not of MDPI and/or the editor(s). MDPI and/or the editor(s) disclaim responsibility for any injury to people or property resulting from any ideas, methods, instructions or products referred to in the content. |
© 2026 by the authors. Licensee MDPI, Basel, Switzerland. This article is an open access article distributed under the terms and conditions of the Creative Commons Attribution (CC BY) license.
Share and Cite
Aziz, D.; Yildiz, M.; Henry, T.D.; Tapp, D.; Bergstedt, S.; Chambers, J.; Stanberry, L.; Rohm, H.S.; Aguirre, F.V.; Garcia, S.; et al. Obesity Is Associated with Higher Odds of In-Hospital Mortality but Lower Risk of 5-Year Mortality in ST-Segment Elevation Myocardial Infarction Patients. Hearts 2026, 7, 21. https://doi.org/10.3390/hearts7030021
Aziz D, Yildiz M, Henry TD, Tapp D, Bergstedt S, Chambers J, Stanberry L, Rohm HS, Aguirre FV, Garcia S, et al. Obesity Is Associated with Higher Odds of In-Hospital Mortality but Lower Risk of 5-Year Mortality in ST-Segment Elevation Myocardial Infarction Patients. Hearts. 2026; 7(3):21. https://doi.org/10.3390/hearts7030021
Chicago/Turabian StyleAziz, Dalia, Mehmet Yildiz, Timothy D. Henry, Danielle Tapp, Seth Bergstedt, Jenny Chambers, Larissa Stanberry, Heather S. Rohm, Frank V. Aguirre, Santiago Garcia, and et al. 2026. "Obesity Is Associated with Higher Odds of In-Hospital Mortality but Lower Risk of 5-Year Mortality in ST-Segment Elevation Myocardial Infarction Patients" Hearts 7, no. 3: 21. https://doi.org/10.3390/hearts7030021
APA StyleAziz, D., Yildiz, M., Henry, T. D., Tapp, D., Bergstedt, S., Chambers, J., Stanberry, L., Rohm, H. S., Aguirre, F. V., Garcia, S., Sharkey, S. W., & Quesada, O. (2026). Obesity Is Associated with Higher Odds of In-Hospital Mortality but Lower Risk of 5-Year Mortality in ST-Segment Elevation Myocardial Infarction Patients. Hearts, 7(3), 21. https://doi.org/10.3390/hearts7030021