Article

Comparison of Two Risk Calculators Based on Clinical Variables (MAGGIC and BCN Bio-HF) in Prediction of All-Cause Mortality After Acute Heart Failure Episode


by
Alejandro Gallego-Cuenca
1,
Esperanza Bueno-Juana
1,2,
Amelia Campos-Sáenz de Santamaría
1,2,
Vanesa Garcés-Horna
2,
Marta Sánchez-Marteles
2,
Juan I. Pérez-Calvo
1,2,
Ignacio Giménez-López
1,2,3,* and
Jorge Rubio-Gracia
1,2
1
School of Medicine, University of Zaragoza, 50009 Zaragoza, Spain
2
Aragon Health Research Institute (IIS Aragon), 50009 Zaragoza, Spain
3
Renal and Cardiovascular Pathophysiology (FISIOPREN), Institute for Health Sciences of Aragon (IACS), 50009 Zaragoza, Spain
*
Author to whom correspondence should be addressed.
Hearts 2025, 6(4), 26; https://doi.org/10.3390/hearts6040026
Submission received: 24 August 2025 / Revised: 28 September 2025 / Accepted: 23 October 2025 / Published: 30 October 2025

Abstract

Background: Heart failure (HF) is common and deadly, affecting over 60 million people worldwide, and it remains a leading cause of hospitalization and post-discharge death. One-year mortality after an acute decompensated HF (ADHF) admission often approaches 40%. Prognostic models are critical for stratifying mortality risk in heart failure (HF) patients. This study compared the performance of the MAGGIC and BCN Bio-HF models in predicting 1-year and 3-year all-cause mortality (ACM) in patients discharged after acute decompensated HF (ADHF). Methods: A retrospective analysis was conducted on 229 patients hospitalized for ADHF at the Clinical University Hospital of Zaragoza. The required variables were extracted from medical records, and ACM risks were calculated using web-based tools. Calibration, discrimination (AUC), and Kaplan–Meier survival analysis and calibration curves assessed risk stratification and alignment with observed outcomes. Reclassification metrics (Net Reclassification Index [NRI], Integrated Discrimination Improvement [IDI]) were used to compare the models’ predictive performances. Results: Both of the models demonstrated robust discrimination for 1-year ACM (AUC: MAGGIC = 0.738, BCN Bio-HF = 0.769) but showed lower performance for 3-year predictions. Calibration was poor, with both models exhibiting significant risk underestimation at the individual level. MAGGIC achieved higher sensitivity (1-year: 0.911; 3-year: 0.685), favoring high-risk patient identification, whereas BCN Bio-HF offered superior specificity (1-year: 0.679; 3-year: 0.746) and a positive prediction value, reducing false positives. BCN Bio-HF showed a significant 12.7% reclassification improvement for 1-year mortality prediction. Conclusions: BCN Bio-HF did not outperform MAGGIC in our cohort. MAGGIC is preferable for the initial high-risk patient identification, requiring more intense short-term follow-up, while BCN Bio-HF’s higher specificity is best-suited to avoid overtreatment. Altogether, the clinical utility of both models was limited in our cohort by severe miscalibration, which may render adequate risk stratification difficult.

1. Introduction

Heart failure (HF) remains a major global health challenge, characterized by elevated hospitalization rates, reduced quality of life, and substantial economic burden, particularly among the elderly [1]. Despite advances in pharmacotherapy and device-based interventions—including Implantable Cardioverter Defibrillators (ICDs), Cardiac Resynchronization Therapy (CRT), and Ventricular Assist Devices (VADs)—the overall prognosis is still suboptimal, with approximately 40% of patients dying within the first year after diagnosis. Clinical practice guidelines for HF emphasize the value of established prediction models to assess prognosis, guide treatment decisions, and ultimately improve patient outcomes. In particular, accurate short-term mortality risk prediction is essential in HF management, as access to certain therapies is restricted to patients meeting 1-year mortality risk thresholds [2]. Prognostic classification is essential to developing personalized follow-up plans, enabling self-monitoring practices, and assisting physicians in making well-informed decisions for HF patients [3].
Over the past decade, numerous HF risk calculators have been derived from large cohort and clinical trial studies (recently reviewed in [4]). Most report acceptable discriminative ability, frequently with C-statistics > 0.70 [5,6], and rely on commonly available predictors such as NT-proBNP, creatinine, blood urea nitrogen, systolic blood pressure, sodium, NYHA class, left ventricular ejection fraction, heart rate, sex, and age [7]. However, important limitations persist. Many models lack rigorous external validation and exhibit calibration drift, raising concerns about transportability and reliability across settings [6,7]. Methodological shortcomings such as the suboptimal handling of missing data and low events-per-variable ratios are also frequent. Consequently, while these models show promise for risk stratification, further validation and impact studies are needed to determine their clinical utility and cost-effectiveness [5,7].
Among the available tools online, the Meta-Analysis Global Group in Chronic Heart Failure (MAGGIC) score is probably the most widely published and best-validated model. Developed in 2013 from thirty cohort studies, including six clinical trials and encompassing different HF phenotypes [8], MAGGIC uses 13 demographic and clinical variables to calculate 1- and 3-year all-cause mortality (ACM) risk in HF patients. Medication inputs are limited to beta-blockers and ACEI/ARB. The MAGGIC score has shown consistently good performance across varied clinical contexts [9]. In a study including 10,930 ambulatory patients, the MAGGIC score was evaluated alongside the Seattle Heart Failure Model (SHFM), another widely used HF risk score [10]. The study did not find any significant benefit in using one risk model over the other [11], but MAGGIC is easier to apply, requiring roughly half of the variables included in the SHFM, and it is less dependent on pharmacological therapies. While MAGGIC and SHFM address short- and long-term mortality in chronic HF, other scores have been developed to predict in-hospital mortality, such as the Get With The Guidelines-Heart Failure (GWTG-HF) and the Acute Decompensated Heart Failure National Registry (ADHERE) risk scores. A recent single-center meta-analysis and external validation comparing SHFM, MAGGIC, GWTF-HF, ADHERE, and other established scores found similar discrimination for 1-year mortality (AUCs ~0.76–0.82) but showed systematic miscalibration, with most models overestimating risk [12]. In terms of balance, MAGGIC is frequently preferred among established models due to its broad validation, the small number of required variables, and its online availability.
The Barcelona Bio-Heart Failure (BCNBio-HF v3.0) risk calculator represents a more contemporary alternative [13]. It is accessible online and has undergone successive updates to reflect evolving standards of care, including ARNIs, CRT, ICDs, and, most recently, iSGLT2s [14]. The full BCN Bio-HF model incorporates biomarkers that capture HF’s underlying pathophysiology (NT-proBNP, troponins, and sST-2), while a reduced model enables risk estimation when biomarkers are unavailable. BCN bio-HF has demonstrated good predictive performance (AUCs in the 0.5–0.80 range) across different HF settings, though validations have typically involved relatively small cohorts [15].
This study evaluates the utility of the BCN Bio-HF risk calculator in predicting short- and long-term mortality risk for patients discharged after an ADHF episode in a setting where biomarkers are unavailable, which has been insufficiently demonstrated. Using MAGGIC as a benchmark, we conduct a rigorous head-to-head comparison to determine which models offer superior discrimination, calibration, and clinical utility for predicting 1- and 3-year ACM in a real-world post-discharge cohort. By assessing the non-biomarker BCN Bio-HF model, we test whether a simpler clinical-based approach can deliver reliable risk stratification when resources are limited. Should BCN Bio-HF outperform MAGGIC, its contemporary design, flexibility to incorporate high-value biomarkers, and iterative updates aligned with current therapeutic strategies would support its adoption as a preferred tool in this clinical setting.

2. Materials and Methods

2.1. Study Design and Participants

This retrospective observational study was conducted on a cohort of patients treated for acutely decompensated heart failure (ADHF) at the Internal Medicine Department of the Clinical University Hospital of Zaragoza. The cohort included patients treated between 2013 and 2018. Therapeutic strategies were consistent throughout and reflect that period’s practices. Patients were enrolled consecutively if they consented to participate and signed an informed consent form.
The study’s primary outcome was all-cause mortality (ACM) within three years of discharge. The secondary outcome was ACM within one year. Outcomes were obtained for this study from medical records. The study adheres to the Declaration of Helsinki (Fortaleza, Brazil, 2013) and good clinical practice guidelines. Ethical approval was obtained from the Comité de Ética en la Investigación Clínica de Aragón (CEICA; PI12/117; 3 October 2012).

2.2. Data Collection and Processing

The variables required for each risk model (Table 1) were extracted from the participant database. Missing data was supplemented from medical records. Patients with unavailable left ventricular ejection fraction (LVEF) measurements were excluded from this study. Body mass index (BMI) was calculated from height and weight. For patients missing height or weight values, the cohort’s median BMI was imputed. Smoking habits had not been recorded in the participant database, and all patients were classified as non-smokers. Smoking status was unavailable and imputed as ‘non-smoker’ for all patients. Because current smoking is included in MAGGIC, this approach may bias MAGGIC prediction downward in true smokers. Sensitivity analysis was not feasible given the lack of source smoking data. We did not perform resampling-based internal validation (e.g., bootstrapping) or model refitting; our objective was an external use-case evaluation of published tools.
Individual 1- and 3-year mortality risks were calculated using the MAGGIC (https://www.mdcalc.com/calc/3803/maggic-risk-calculator-heart-failure; accessed March 2023) and BCN Bio-HF 3.0 (http://ww2.bcnbiohfcalculator.org/web/; accessed March 2023) online calculators. Observed mortality rates were determined for risk groups or categories as the number of events divided by the number of patients in each group. Participant categories (terciles, sextiles, or deciles) were assigned based on the distribution of the MAGGIC scores or predicted risk distributions.

2.3. Statistical Analysis

2.3.1. Descriptive Statistics

Continuous variables were summarized as mean ± standard deviation (SD) or median with interquartile range (IQR), depending on normality. Categorical variables were reported as absolute frequencies and percentages. Comparisons of parametric variables were performed using Student’s t-test or ANOVA, while non-parametric comparisons employed the Mann–Whitney U, Kruskal–Wallis, or chi-squared tests. Correlations were assessed using Pearson and Spearman tests, depending on the distribution.

2.3.2. Assessment of Discrimination

The model’s ability to distinguish patients with different mortality risk was evaluated using Receiver Operating Characteristic (ROC) analysis. The Area Under the Curve (AUC) values were compared using a paired-sample design, employing the DeLong method in SPSS v26, IBM. Model discrimination ability was further assessed by comparing Kaplan–Meier survival curves across predicted risk categories, and statistical significance was determined using the log-rank test.

2.3.3. Assessment of Calibration

Whether the models over- or underestimate mortality risk was assessed by comparing the observed and predicted mortalities across risk categories. The Hosmer–Lemeshow statistic was calculated using binary logistic regression, where 1- or 3-year observed mortality served as the dependent variable and the predicted mortality risk as the covariate. Calibration plots were generated, and R2 values were used to evaluate model fit.

2.3.4. Reclassification

MAGGIC and BCN Bio-HF performance in predicting mortality risk was compared using sensitivity, 1-specificity, positive predicted value (PPV) and negative predictive value (NPV), and the Brier score. Reclassification metrics included the Brier Skill Score, the absolute Net Reclassification Index (NRI), and the Integrated Discrimination Improvement Index (IDI), taking MAGGIC as the reference model when applicable.
Statistical analyses and graphical outputs were obtained using IBM SPSS Statistics version 26 (IBM Corp., Armonk, NY, USA) and Microsoft Excel (Microsoft Corp., Redmond, WA, USA).

3. Results

3.1. Study Population and Baseline Characteristics

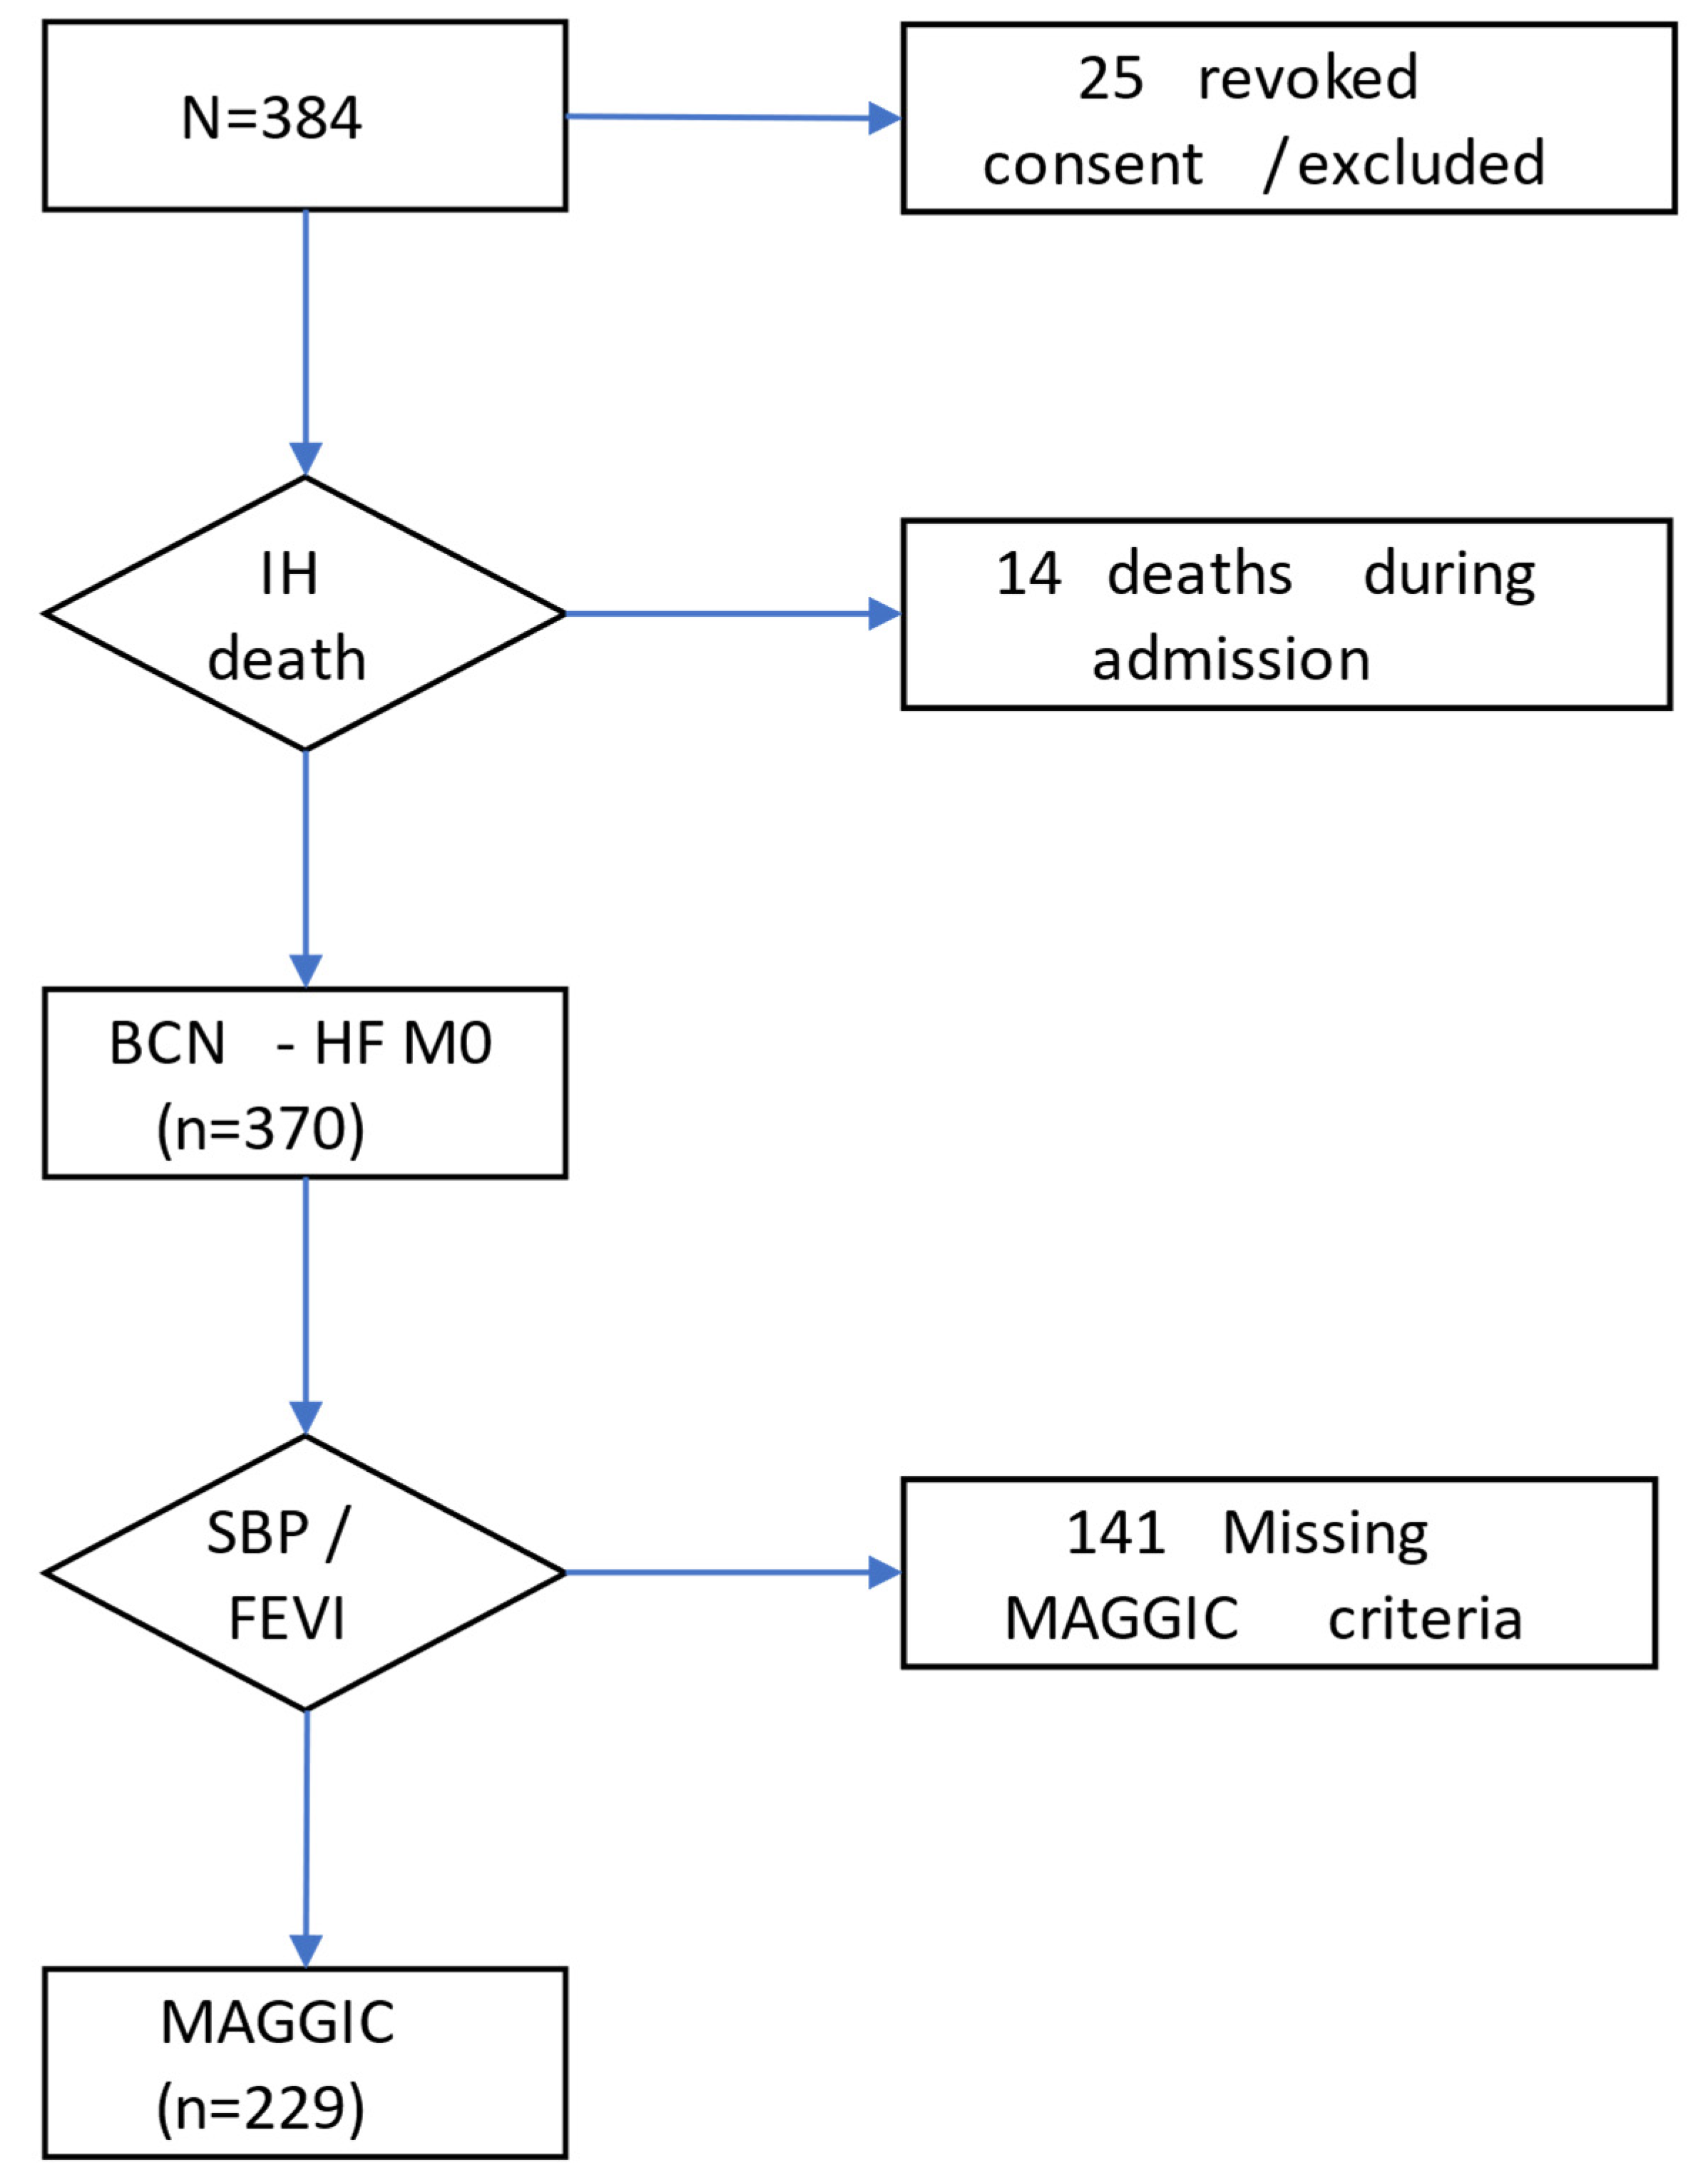
The analyzed cohort consisted of 229 patients admitted with acute decompensated heart failure for which we had on record their LVEF value (Figure 1). Table 1 summarizes their baseline clinical characteristics. Global features are typical of an HF population, with a preponderance of elderly female patients in the functional class NYHA II-III, impaired renal function, and common comorbidities such as hypertension and diabetes mellitus.
Age, greater NYHA class, larger doses of furosemide equivalents administered during hospitalization, and lower blood hemoglobin were the factors associated with increased mortality rates at one-year follow-up. Impaired kidney function was a prominent risk factor, whether assessed using the previous history of chronic kidney disease (CKD) or the baseline serum creatinine, serum cystatin C, or estimated GFR. Although not statistically significant, increased systolic blood pressure (SBP) and sodium serum levels seemed to have a protective effect on 1-year mortality. There was a strong correlation between a greater BMI and a decreased risk of death during a 3-year period. Patients who had died 1 year after discharge had a non-significantly lower LVEF, a trend that was no longer observed at the 3-year follow-up.

3.2. Observed Mortality and Predicted Risk Probability Distributions

The average individual follow-up time was 786.8 ± 387.9 days (2.15 ± 1.06 years). A total of 111 patients died during the study period (48.5%; 19.7% in the first year).
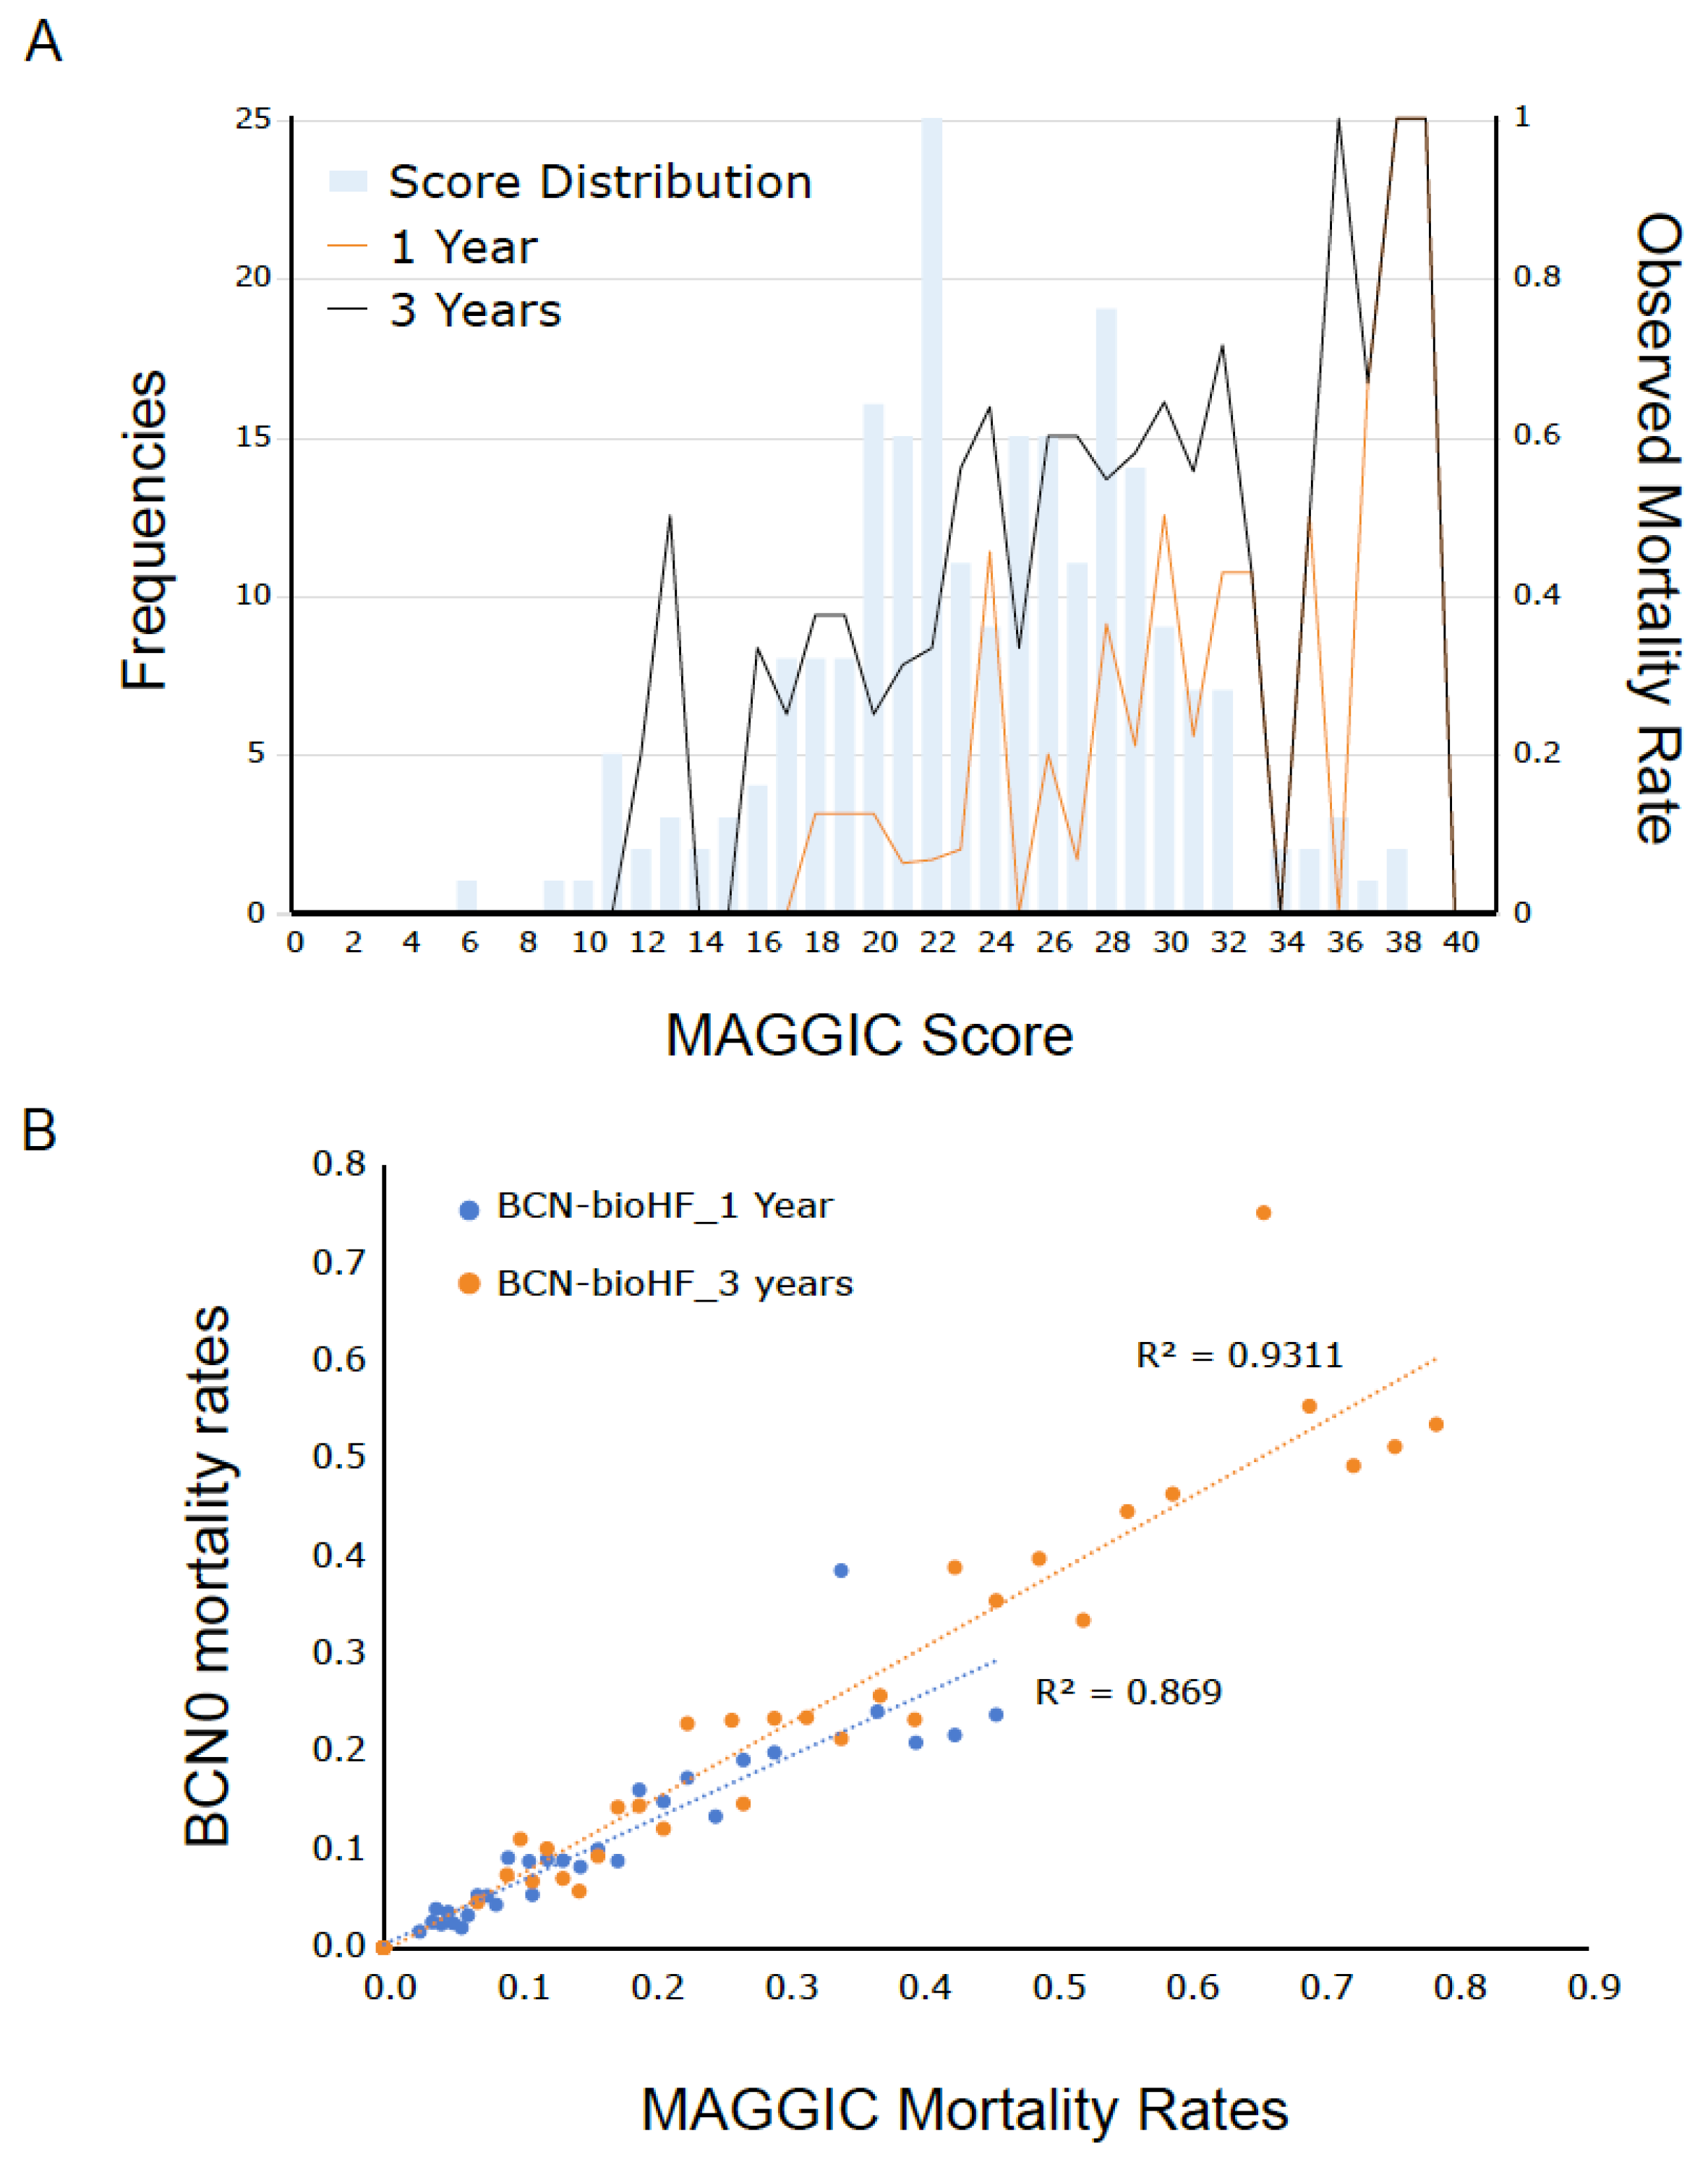
The MAGGIC score (0–40 range) was calculated for each patient. A plot of observed mortality rates for each value of MAGGIC score demonstrates a clear positive association between the risk score and observed mortality rate, indicating that MAGGIC is able to predict mortality in our cohort (Figure 2A). Moreover, MAGGIC predictions showed a strong correlation with those calculated by the BCN Bio-HF model (Figure 2B), both during the 1-year (R2 = 0.869, Spearman’s rho 0.664, p = 0.000) and 3-year (R2 = 0.9311, Spearman’s rho 0.665, p = 0.000) follow-up periods.

3.3. ROC Analysis and Risk Discrimination by MAGGIC and BCN Bio-HF

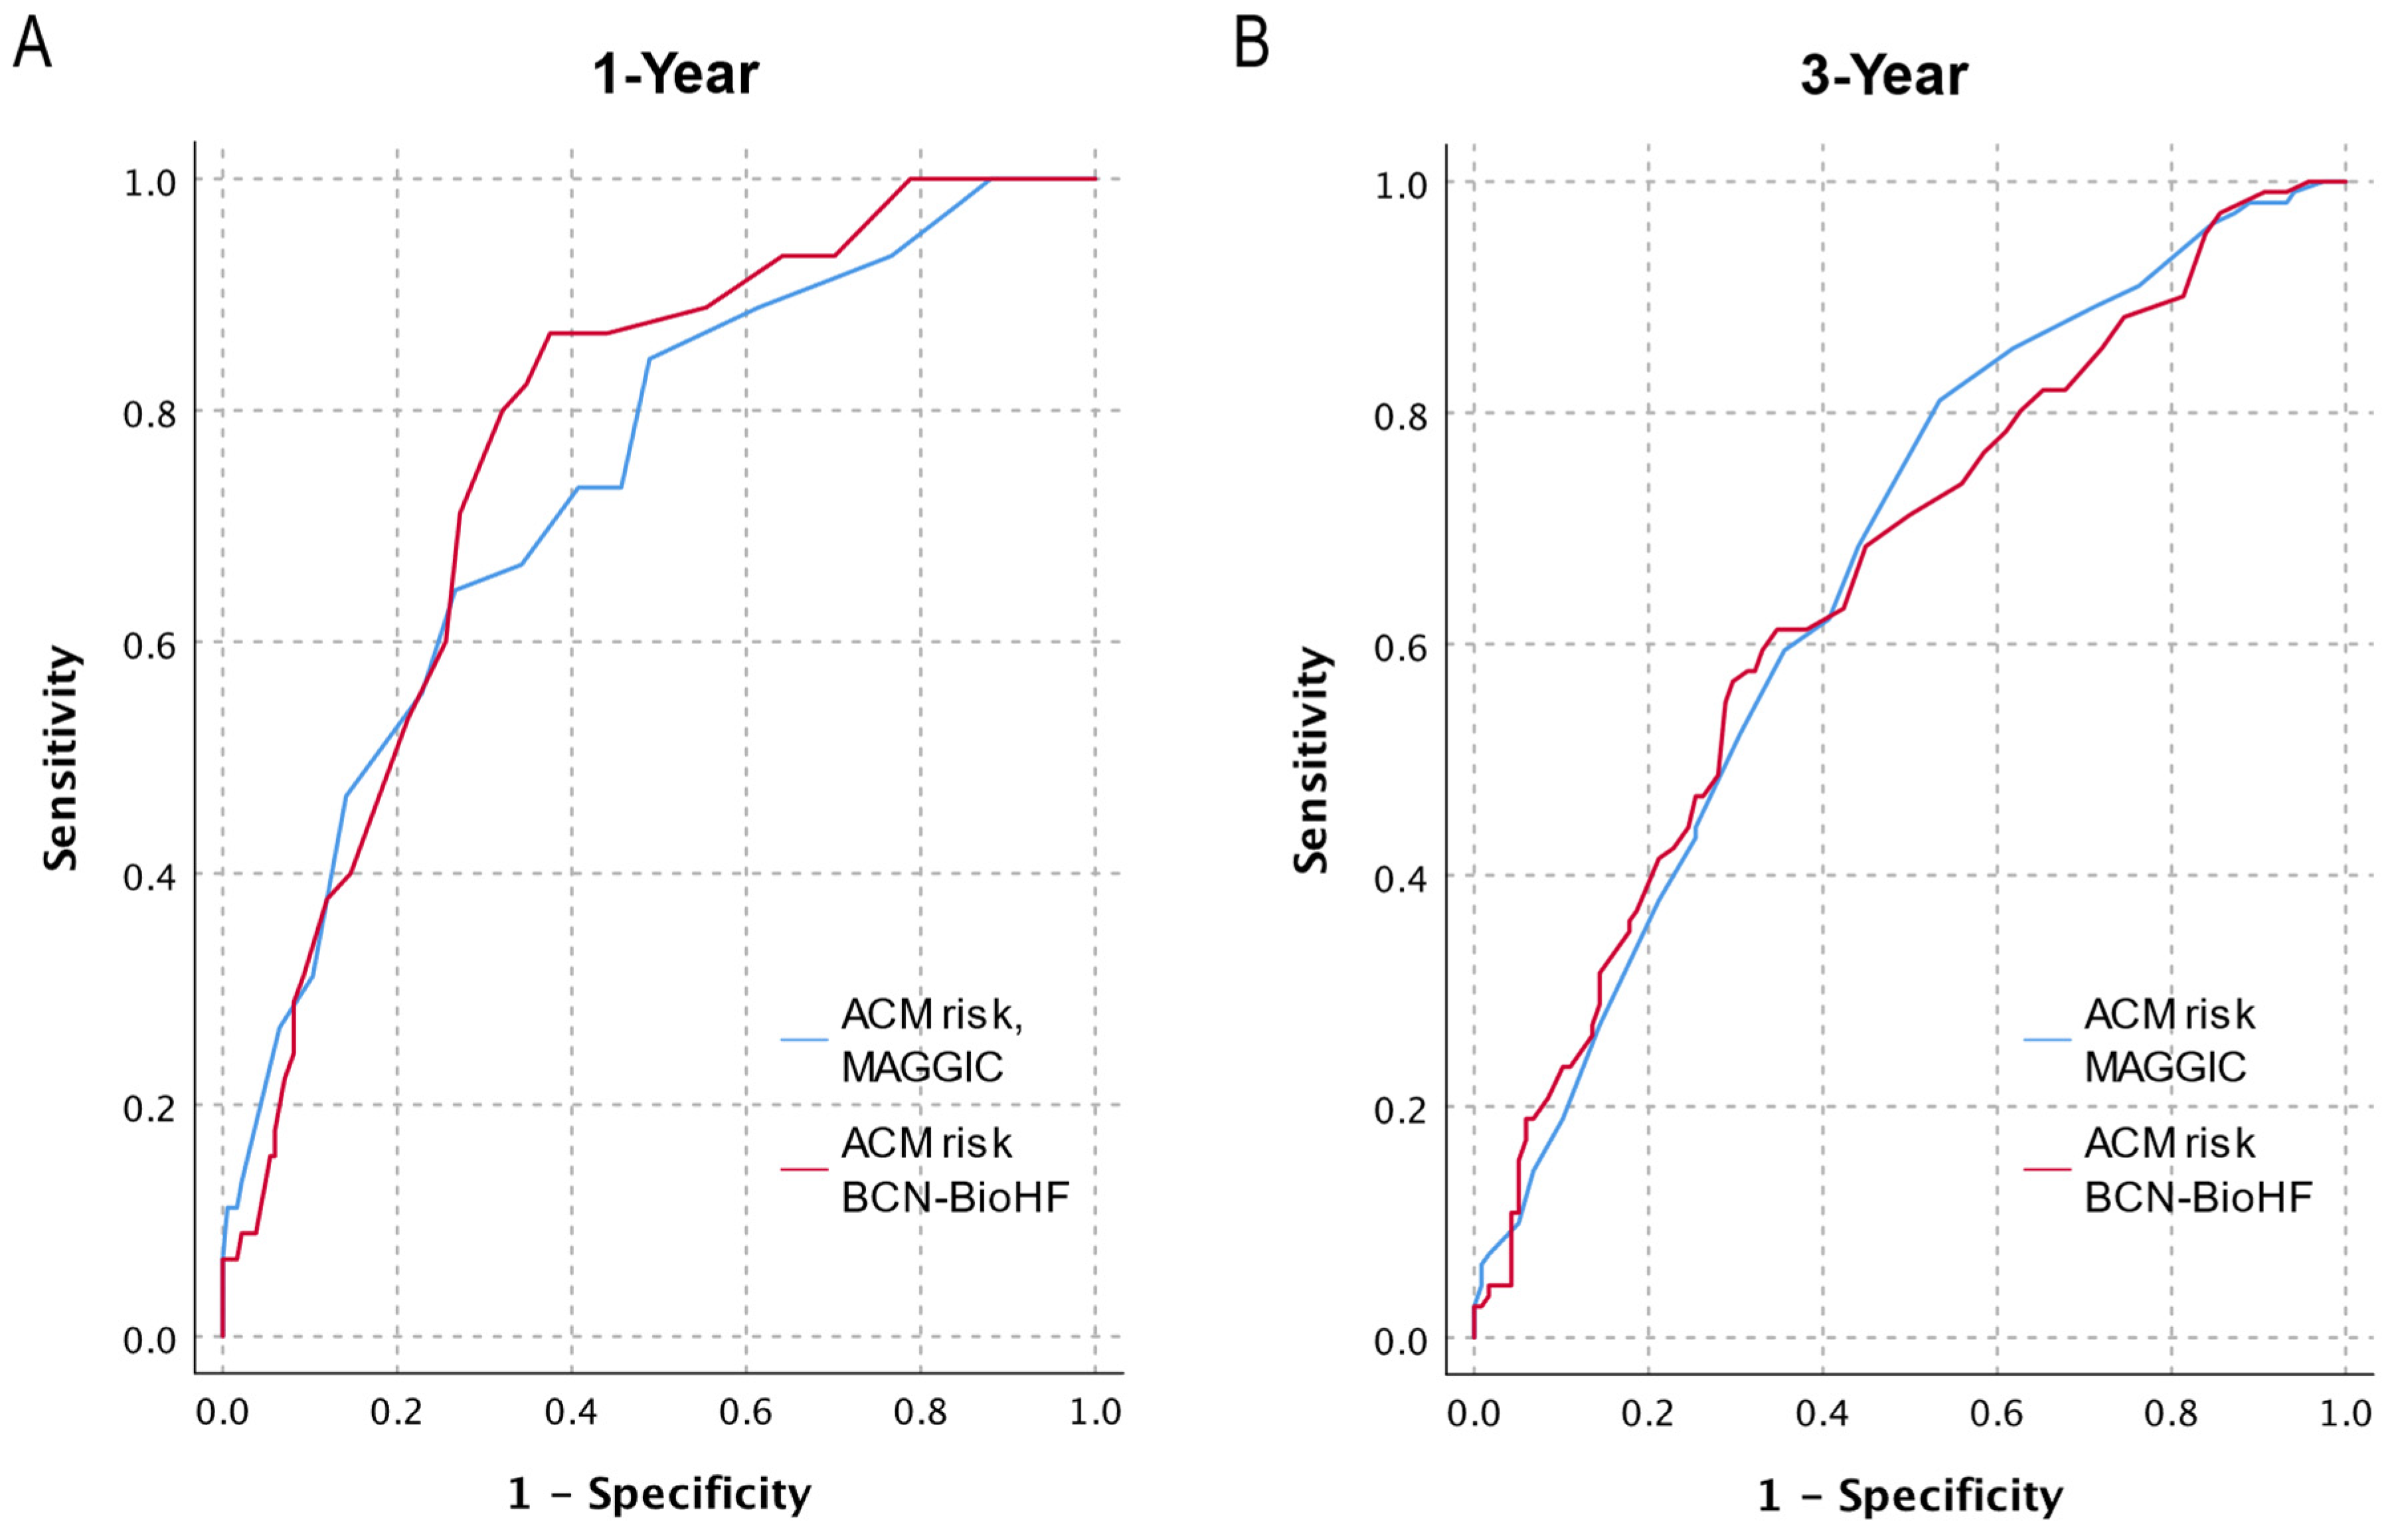
A Receiver Operating Characteristic (ROC) analysis demonstrated that both models have similar capabilities to discriminate patients at risk (Figure 3). Predictions for 1-year mortality (MAGGIC AUC = 0.738 [0.658–0.818], BCN Bio-HF AUC = 0.769 [0.699–0.839]) were more accurate than those for 3-year mortality (MAGGIC AUC = 0.664 [0.594–0.734], BCN Bio-HF AUC = 0.654 [0.583–0.724]). The differences between the models were not statistically significant (1-year p = 0.373, 3-year p = 0.754).

3.4. Calibration of MAGGIC and BCN Bio-HF Risk Models

Both models underestimated the observed mortality rates at 1 and 3 years. MAGGIC predicted that the global mortalities were 16.1% at 1 year and 35.7% at 3 years, compared to the observed rates of 19.7% and 48.5%, respectively. BCN Bio-HF predicted even lower mortality rates of 10.8% for 1 year and 26.7% for 3 years. Both prediction models were, however, found to accurately fit the data, based on the Hosmer–Lemeshow test. The X2 values for the 1-year period for MAGGIC and BCN Bio-HF were 8.162 (p = 0.418) and 3.816 (p = 0.873), respectively. For the 3-year follow-up, the X2 values for MAGGIC and BCN Bio-HF were 5.954 (p = 0.652) and 5.965 (p = 0.651), respectively.
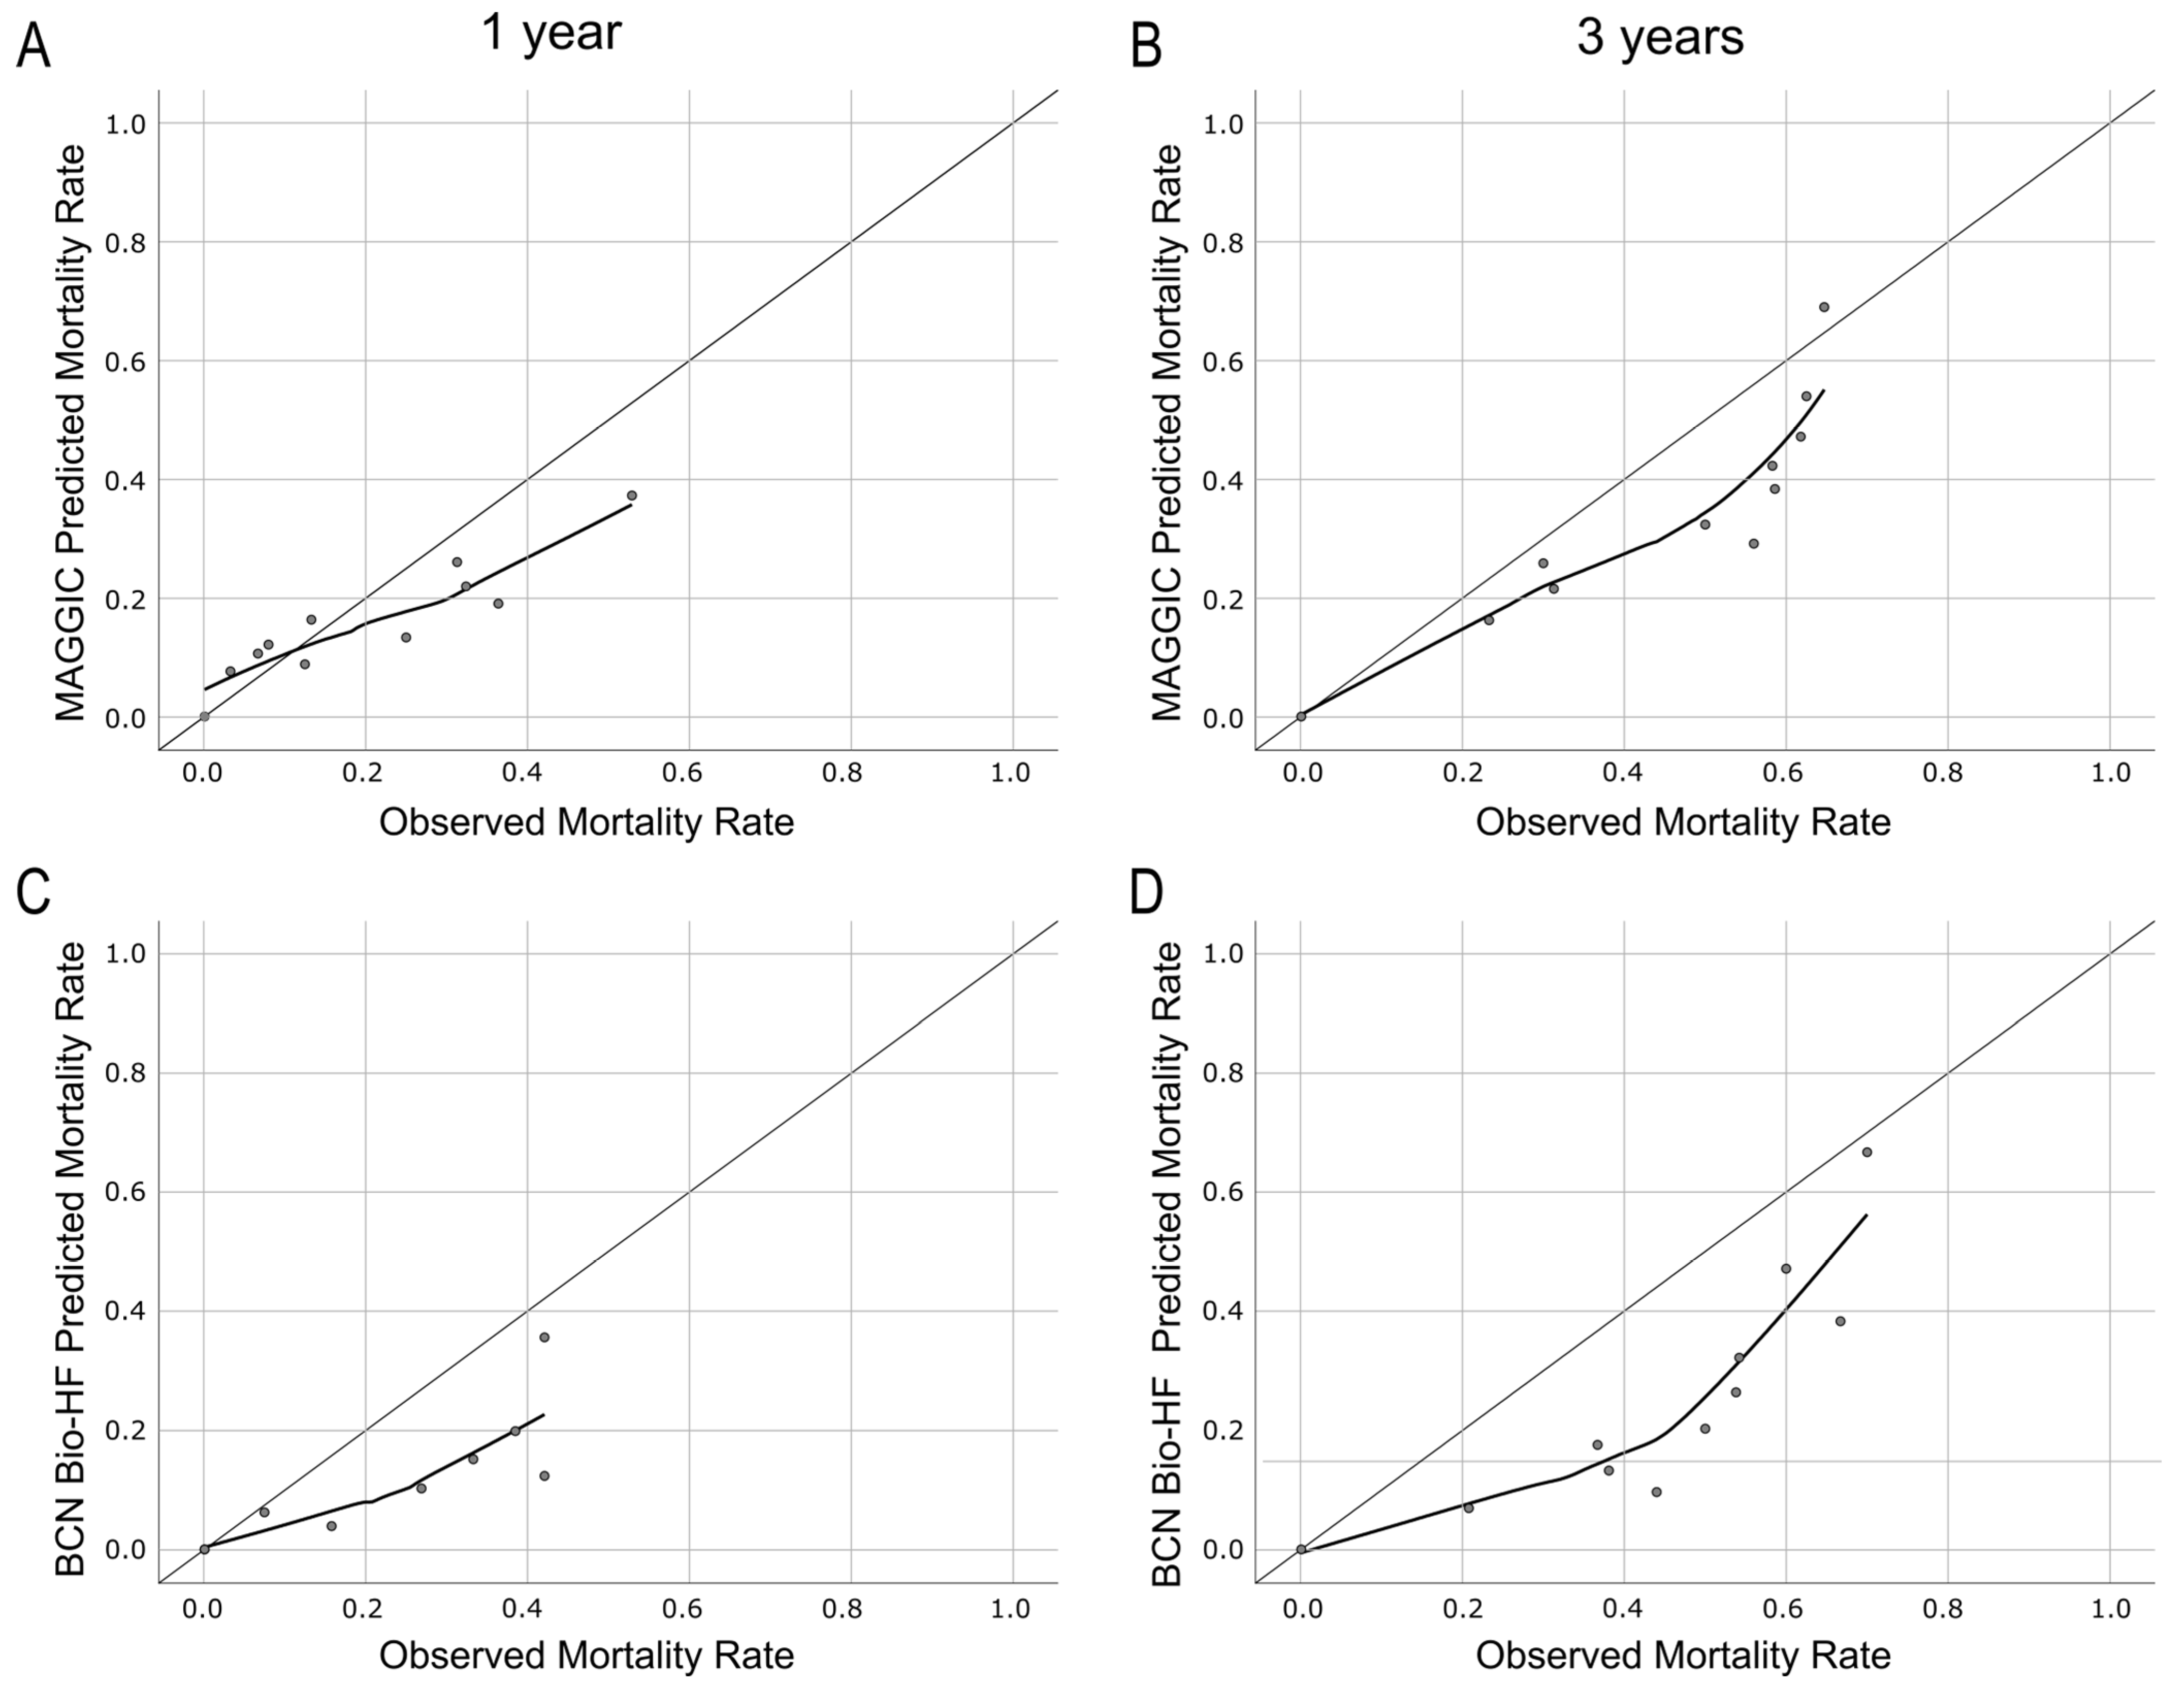
The performance of the MAGGIC and BCN Bio-HF risk models was analyzed in more detail using calibration plots comparing the observed and predicted mortality rates across 10 risk categories (deciles for each prediction risk distribution). Figure 4 shows that MAGGIC mortality rate predictions were adequate for low–middle-risk groups at 1 year and for the highest risk group at 3 years (Figure 4A,B). However, BCN Bio-HF demonstrated rather poor calibration, except for the 3-year prediction in the highest-risk group (Figure 4C,D).

3.5. Stratification of Patient Risk

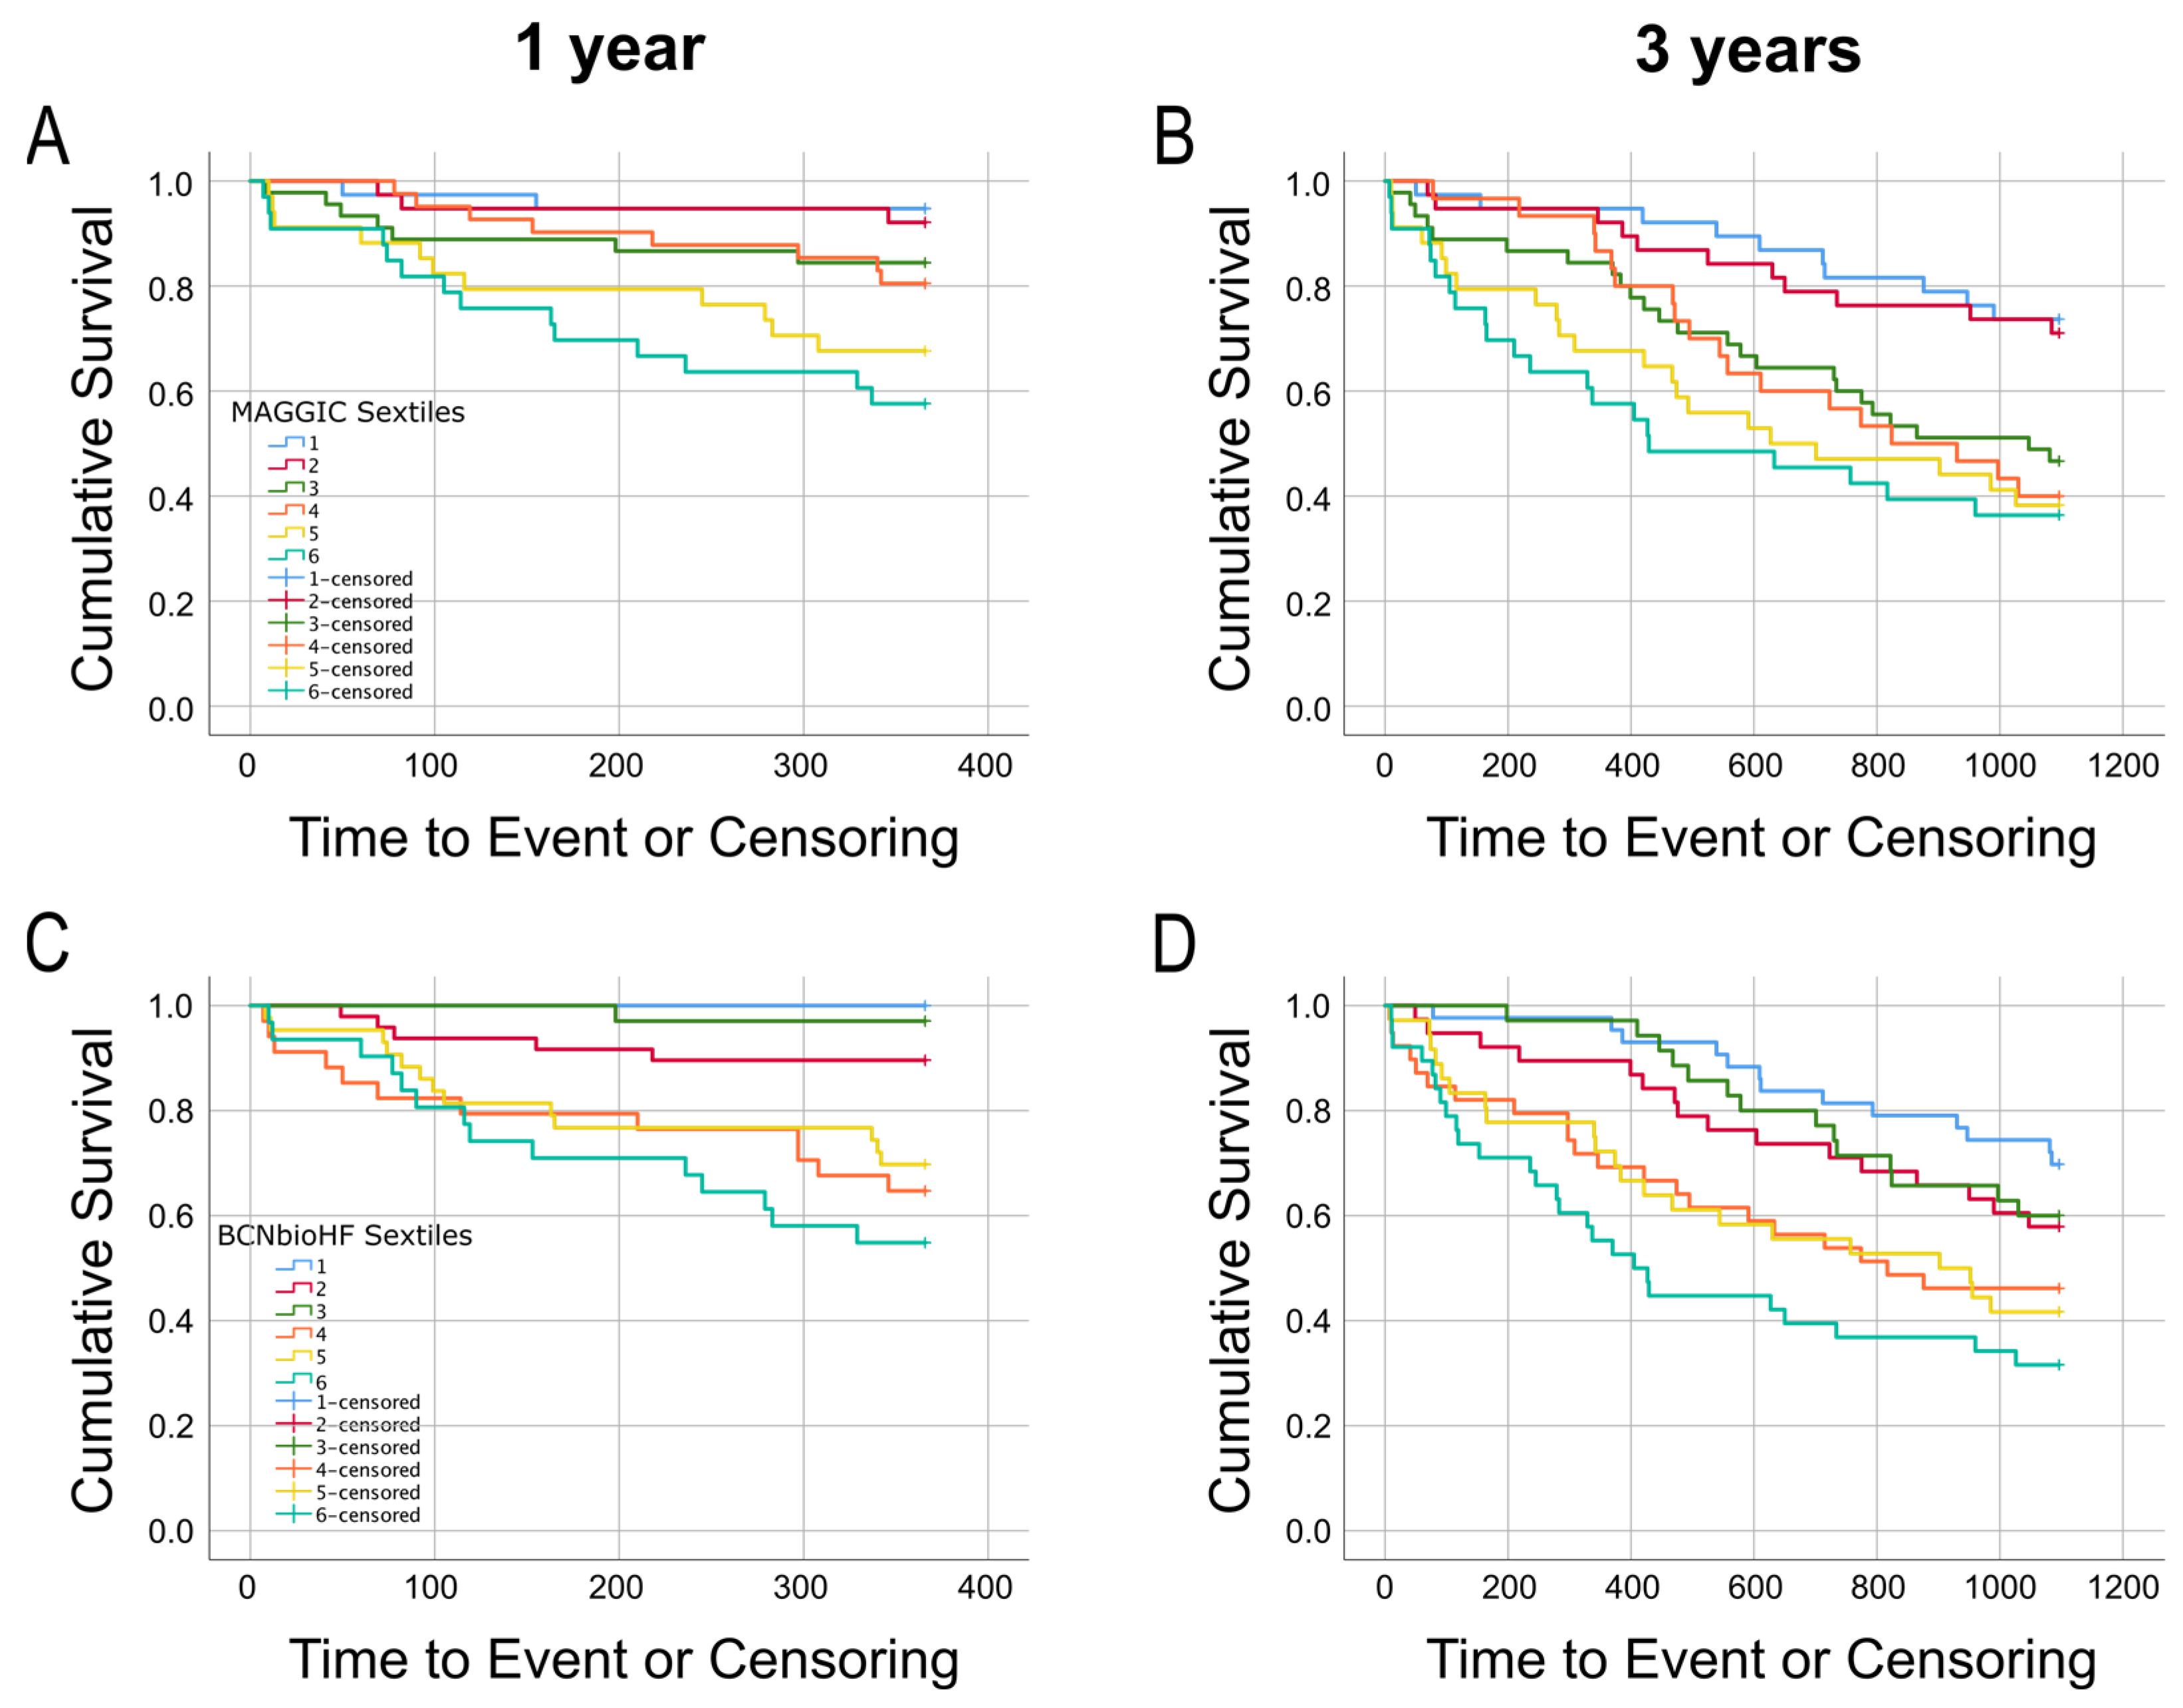
The results of the Kaplan–Meier survival curves (Figure 5) for patients grouped according to their predicted risk mortality (sextiles) demonstrate that both models effectively identify patients with greater risk throughout the 1-year and 3-year follow-up periods (log-rank tests p < 0.000).
Model predictions allow for assigning patients to Low-risk (0.0–0.1 predicted rate, S1–S2), Medium-risk (0.1–0.2, sextiles S3 and S4), or High-risk categories (0.2–1; sextiles S5 and S6) for the 1-year mortality predictions and Low-risk (0.0–0.2 predicted rate), Medium-risk (0.2–0.4), or High-risk (0.4–1.0) for the 3-year predictions. MAGGIC discriminated better the three risk levels at the 1-year prediction, whereas BCN Bio-HF performed better at the 3-year prediction (Figure 5).

3.6. Comparative Reclassification Analysis

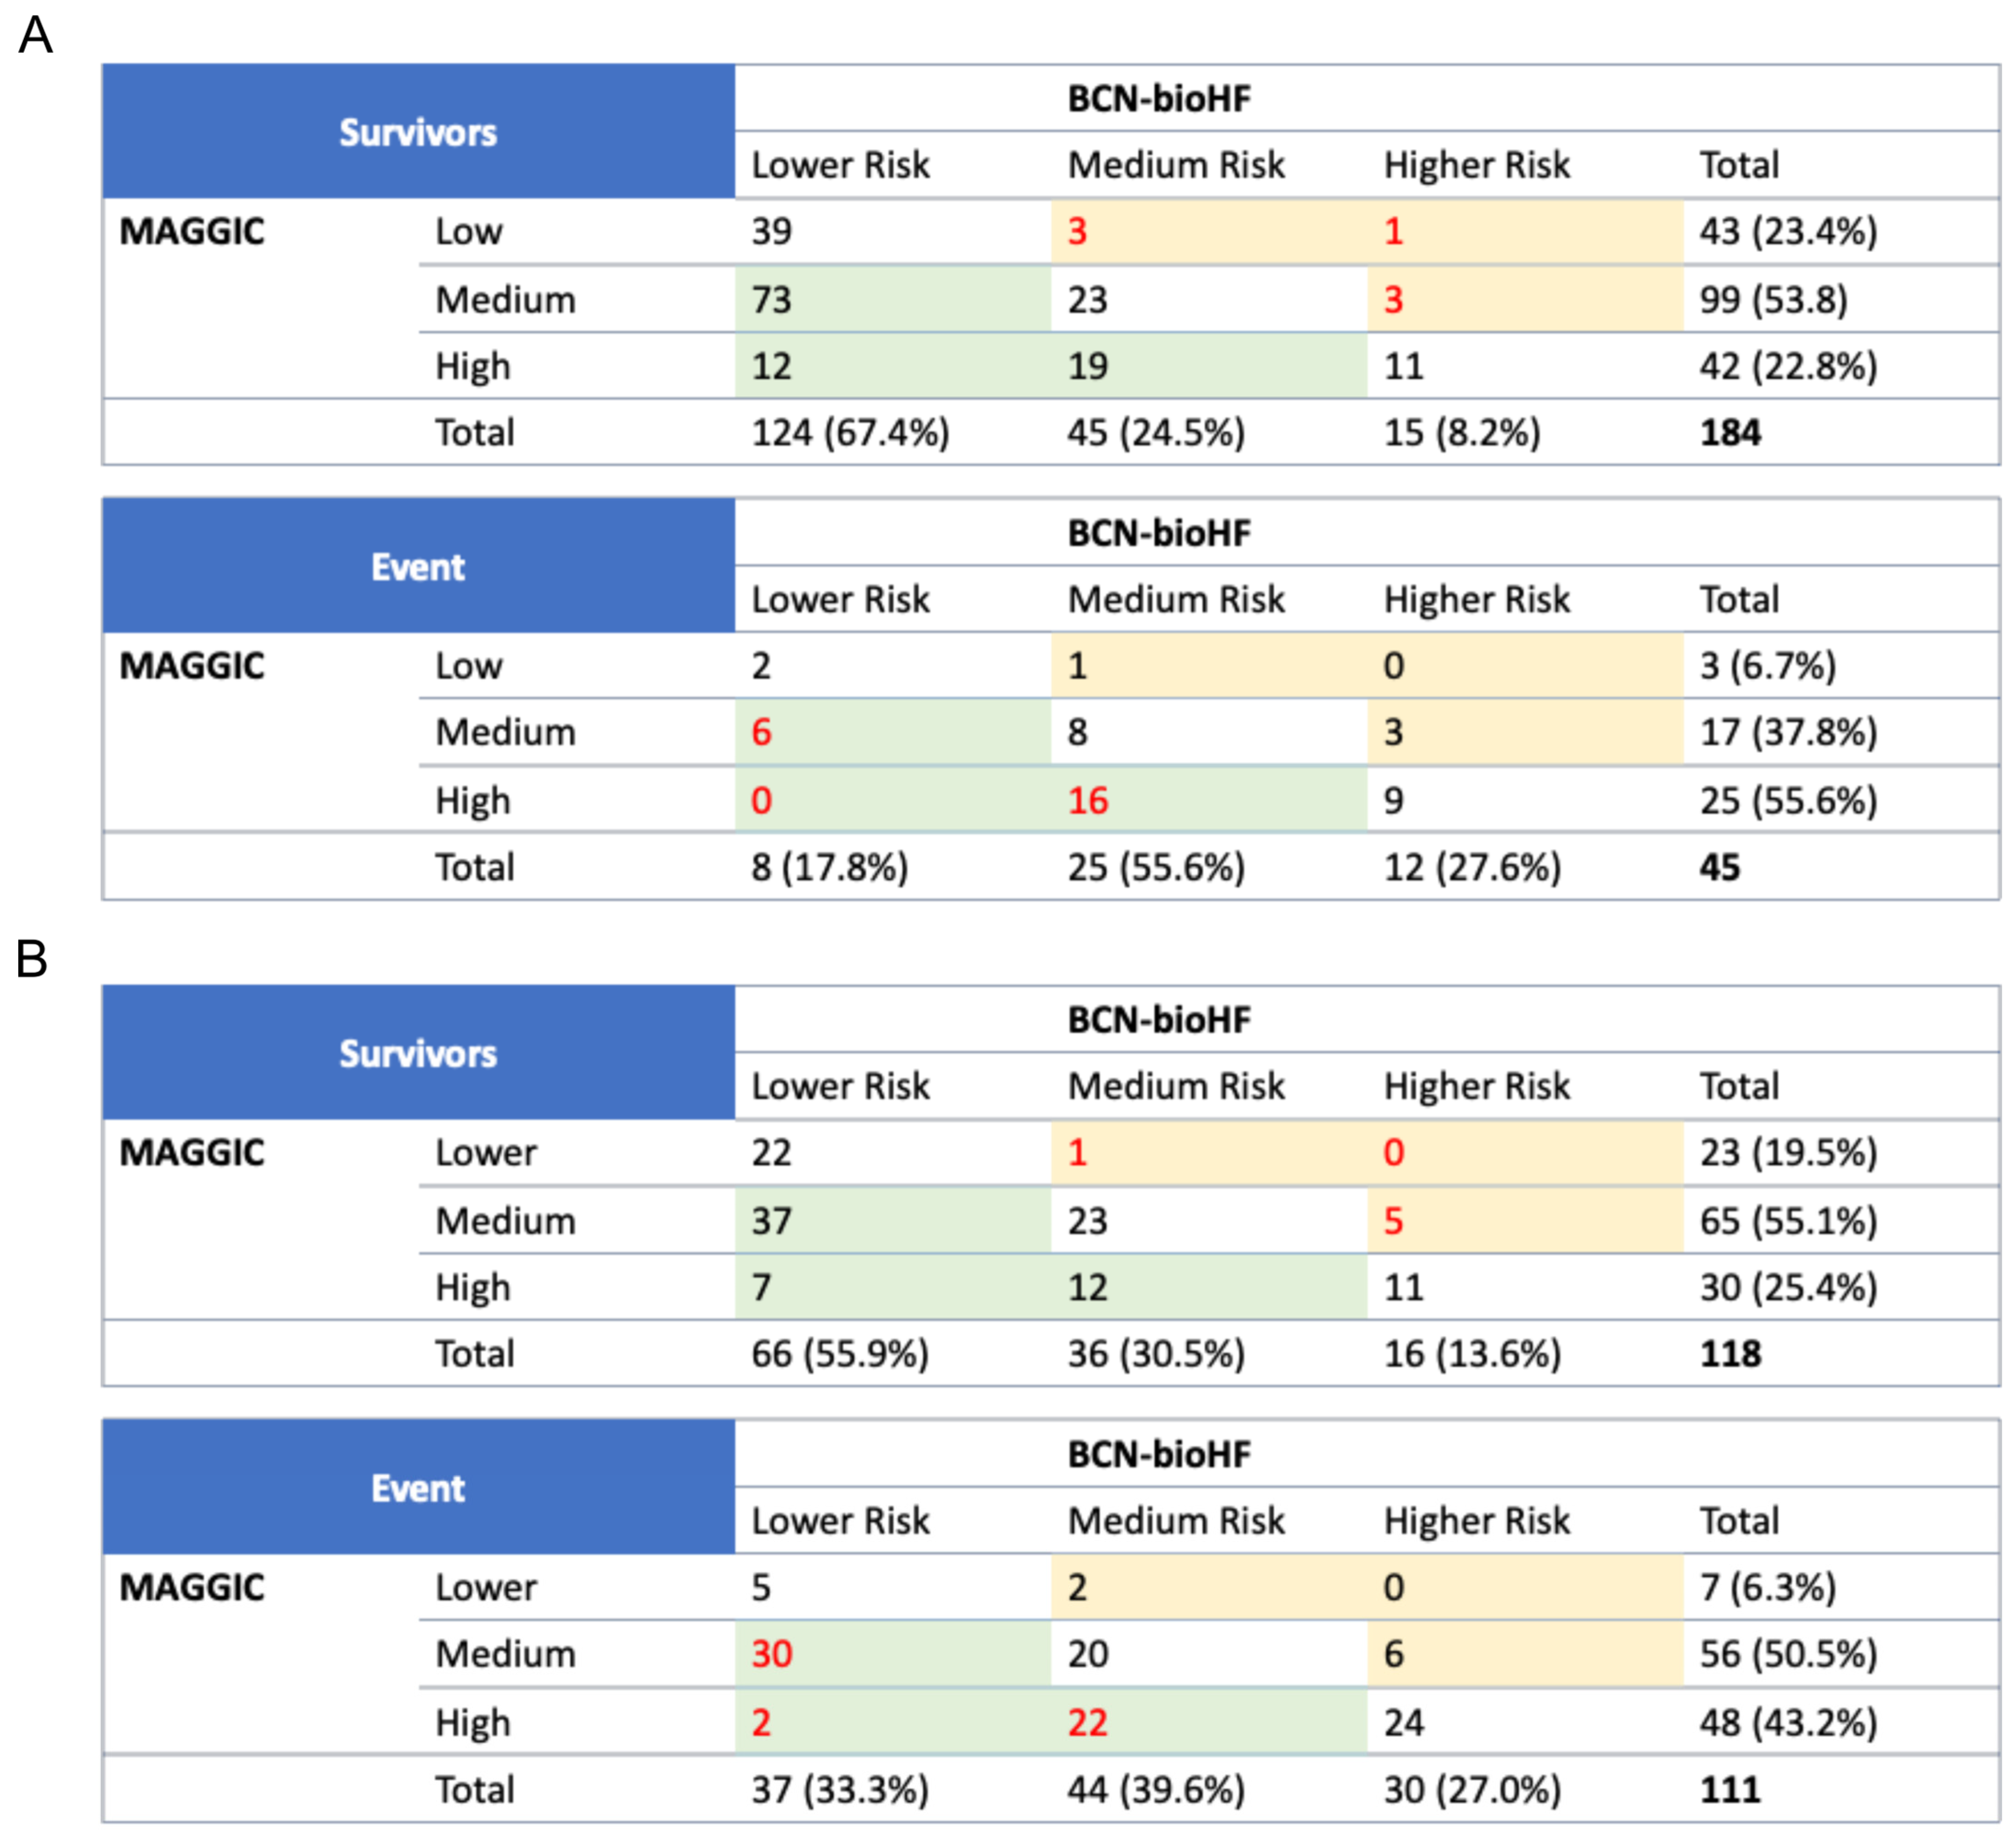
Reclassification metrics were used to assess the relative performance of MAGGIC and BCN Bio-HF in categorizing patients into clinically meaningful risk strata. Figure 6 compares the frequencies within predicted mortality risk categories (Low, Medium, and High) to evaluate how differently MAGGIC and BCN Bio-HF classify survivors and event patients. For 1-year mortality (Figure 6A), the percentage of survivors correctly identified as Low-risk was markedly higher for BCN Bio-HF compared to the MAGGIC model (67.4% vs. 23.4%). On the other hand, the MAGGIC model accurately predicted almost twice as many events (55.5% vs. 26.7%) when considering the High-risk group. However, only 17.8% of events were classified by BCN Bio-HF as Low-risk. Similar observations were made for the 3-year prediction (Figure 6B).
The Net Reclassification Index (NRI) and the Integrated Discrimination Improvement (IDI) reclassification metrics were used to quantify the enhancement in risk classification by BCN Bio-HF compared to MAGGIC. The NRI evaluates the net proportion of patients correctly reclassified. The categorical NRI at 1 year comprised an event NRI of 0.400 and a non-event NRI of 0.527, yielding a net 12.7% improvement for BCN Bio-HF; at 3 years, an event NRI of 0.414 and a non-event NRI of 0.424 summed to 0.93%. The IDI, reflecting the mean improvement in predicted risk across the cohort, showed no significant advantage for BCN Bio-HF compared to MAGGIC (Table 2).
The reclassification matrix in Figure 6 suggests differences in sensitivity and specificity between the models that were confirmed by calculating these parameters using a 0.3 risk threshold for events (Table 2). Sensitivity, which measures the ability to identify high-risk patients, was higher for MAGGIC (0.911 vs. 0.800 for 1-year mortality; 0.685 vs. 0.468 for 3-year mortality). Specificity, on the other hand, was superior for BCN Bio-HF (0.679 vs. 0.310 for 1-year mortality; 0.746 vs. 0.559 for 3-year mortality), indicating its strength in minimizing false positives.
The differences in specificity were reflected in a greater positive predictive value (PPV) for BCN Bio-HF, especially at the 1-year prediction, indicating improved accuracy in identifying actual events. PPVs increased in both cases for the 3-year predictions. In contrast, the negative predictive value (NPV) was higher for 1-year mortality and similar in both models, correctly classifying 90% of negative events.
Brier scores, a measure of overall prediction accuracy, yielded similar values in both models, with both models performing better in 1-year predictions (Table 2). MAGGIC slightly outperformed BCN Bio-HF, as shown by the negative values in the Brier Skill Score test.

4. Discussion

This study provides a detailed comparative analysis of the MAGGIC and BCN Bio-HF (v3.0) risk models for predicting mortality in patients discharged after acute decompensated heart failure (ADHF) episodes. Both models were developed in chronic HF populations, lacked direct comparison in the setting of acute heart failure [16,17,18,19], or comparisons did not include reclassification analysis [12,20,21]. MAGGIC was chosen as the benchmark for its broad use and validation, accessibility, ease of use, and reliance on relatively few clinical variables [22,23,24,25,26,27]. We took advantage of BCN Bio-HF’s flexibility to calculate risk in the absence of biomarkers to reflect settings where laboratory access is limited. In this context, our results show broadly similar discrimination but varied in calibration, sensitivity, specificity, and clinical utility across the 1- and 3-year follow-ups.

4.1. Discrimination

At 1 year, both scores achieved acceptable discrimination, consistent with reports across mixed clinical settings [6,11,13,14,17,18,19]. The ROC-based comparisons did not identify a statistically meaningful advantage of one model over the other, aligning with prior work showing comparable C-indices among contemporary HF scores [11,18].
At 3 years, discriminatory ability was reduced for both scores, a pattern repeatedly observed when prediction horizons lengthen and clinical heterogeneity becomes complex.

4.2. Calibration

Many studies comparing risk model performance stop at reporting AUC values. ROC analysis to determine AUCs as a measure of predictive power is a simple approach which only provides an overall indicator of the models’ discriminatory ability. Hence, a more thorough analysis was carried out to establish BCN Bio-HF’s advantages and disadvantages with respect to MAGGIC’s. We found both models underestimated the observed mortality at 1 year. The miscalibration issue is consistent with prior validation studies, showing a decline in performance when applied to real-world populations [16,17,18,19,20,28,29,30,31,32]. Likely contributors include our cohort’s older age, differences in therapy strategies, post-ADHF management, and higher event rates relative to the large ambulatory populations used to derive MAGGIC and BCN Bio-HF scores. The low use of newer therapies (ARNIs and SGLT2is) in our cohort may partially explain the miscalibration in BCN Bio-HF 3.0 but not for MAGGIC, the development of which predates our cohort. Moreover, the contribution of these therapies to BCN Bio-HF’s risk algorithm is not as significant as that of other more traditional variables included in MAGGIC. The handling of missing data may have also introduced some bias, particularly for MAGGIC, as explained below. Recalibration, calibration slope adjustment, or selective refitting of the influential coefficients in the models may be necessary to improve transportability to specific real-world settings.

4.3. Stratification, Reclassification, and Clinical Utility

Miscalibrated models can still be useful if there is a good correlation between the predicted and real mortality, allowing for the classification of patients to different risk groups of clinical value. Risk stratification analyses (Kaplan–Meier curves) demonstrated that both models effectively identified high-risk and low-risk patient groups at the 1-year follow-up, although they faced challenges in discriminating between intermediate-risk patients. At the 3-year follow-up, both models performed better in discriminating the medium-risk patients, especially BCN Bio-HF.
Next, we quantified, using several parameters, the improvement in risk stratification that the use of BCN Bio-HF would bring about over MAGGIC. While MAGGIC exhibited higher sensitivity in predicting 1-year mortality, its specificity and PPVs were worse than those of BCN Bio-HF. These differences were reflected in a significant performance enhancement for 1-year mortality prediction by BCN Bio-HF (NIR 12%), which is largely due to its better ability to correctly classify survivors.
The performance of both models in long-term (3-year) prognosis was dramatically decreased for both models, and there was no gain from the use of BCN Bio-HF over MAGGIC.

4.4. Clinical Utility

Our results indicate that both models perform similarly in our cohort, with small differences in sensitivity and specificity. MAGGIC’s higher sensitivity makes it better-suited for identifying patients at risk who might benefit from closer monitoring, while BCN Bio-HF would be a preferable option over MAGGIC when the goal is to avoid the overtreatment of patients at low risk. Since both scores are easy to calculate, one model’s strengths may complement the other’s. MAGGIC screening would produce a high number of false positives requiring independent interrogation, which could be carried out by calculating BCN Bio-HF scores. The systematic calculation of MAGGIC and BCN Bio-HF at discharge might represent a cost-efficient measure to stratify patients according to their predicted short-term prognoses. Patients who are truly at high risk would benefit from targeted intensive interventions such as advanced imaging, device implantation, or close follow-up [2,3]. Taking advantage of BCN Bio-HF’s greater specificity would help avoid the overtreatment of false positives which could lead to unnecessary procedures, adverse effects, or resource strain. This is an intriguing hypothesis that deserves further investigation in larger cohorts.

4.5. Limitations

This study reflects real-world clinical practice, but it has several limitations that must be considered. Key limitations include the following: a small, single-center sample size; the retrospective design; an absence of external validation; the missing smoking data (coded as non-smoker); a lack of internal resampling; and that patient enrollment was prior to widespread ARNI/SGLT2i use. The relatively small-sized, single-center sample limits the generalizability of our findings. We did not perform bootstrapping or other internal validation procedures; future work should incorporate resampling and, if warranted, recalibration. The cohort’s older age and moderate use of interventional therapies differ from the studies in which the risk scores were developed. Enrollment occurred in 2013–2018, largely preceding the routine use of SGLT2 inhibitors and ARNIs. Consequently, our cohort’s treatment intensity and event rates differed from contemporary practice, plausibly limiting generalizability to populations treated under modern clinical guidelines. BCN Bio-HF v3.0 includes SGLT2is/ARNIs in its algorithm, and exposure to these therapies in our cohort was very low (ARNIs 0.9% and no meaningful SGLT2i use). This might have contributed to the calibration issues, especially affecting the more contemporary BCN Bio-HF 3.0.
The exclusion of biomarkers could have reduced the prediction performance. The addition of biomarkers (e.g., NT-proBNP) to BCN Bio-HF usually improves its performance [16,20]. However, the integration of biomarkers can offer modest improvements in risk prediction [25,31,32,33,34], no gain at all [31,34], or conflicting results [21], and it requires the careful consideration of cost and availability [35]. On the other hand, exclusive reliance on clinical variables simplifies the application of risk models. Our findings confirm that risk can be assessed properly when resources are limited and there are no biomarkers available.
Smoking status was unavailable and imputed as ‘non-smoker’ for all patients. Because current smoking is included in MAGGIC, this approach may bias MAGGIC’s prediction downward in true smokers. Sensitivity analysis was not feasible given the lack of source smoking data. Risk prediction models face challenges with missing data and variable availability across healthcare settings [12,17,20]. MAGGIC does not address missing data, risking underestimation, while BCN Bio-HF imputes pathological values, potentially leading to overestimation. We mitigated these issues by excluding cases with missing key variables. Simplified models requiring fewer inputs may be more suitable for real-world conditions [36].
Taken together, these findings should be considered hypothesis-generating and warrant confirmation in larger, multi-center cohorts with contemporary therapeutic options and ideally in prospective designs enabling model updates or recalibration before influencing definitive clinical pathways.

5. Conclusions

This single-center, retrospective study provides a comprehensive comparison of two online calculators for predicting mortality in patients discharged after acute decompensated heart failure (ADHF). Despite calibration issues, MAGGIC and BCN Bio-HF models showed good discrimination ability, allowing for clinically meaningful patient risk stratification in the short-term follow-up. Differences in the classification metrics suggest BCN Bio-HF might outperform MAGGIC, with good sensitivity and superior specificity in identifying patients at 1-year mortality risk. The clinical utility of both models in our cohort was limited by severe miscalibration which may render adequate risk stratification difficult. Proper validation in real-world contexts, assessing risk stratification performance, is recommended before including a risk prediction model in clinical practice.

Author Contributions

Conceptualization, A.G.-C., E.B.-J., J.I.P.-C., I.G.-L. and J.R.-G.; methodology, A.G.-C., E.B.-J., I.G.-L. and J.R.-G.; formal analysis, A.G.-C., E.B.-J., V.G.-H. and I.G.-L.; investigation, A.G.-C., E.B.-J., A.C.-S.d.S., V.G.-H., M.S.-M. and J.R.-G.; resources, E.B.-J., A.C.-S.d.S., V.G.-H., M.S.-M. and J.R.-G.; data curation, A.G.-C., E.B.-J. and I.G.-L.; writing—original draft preparation, A.G.-C., J.I.P.-C., I.G.-L. and J.R.-G.; writing—review and editing, A.G.-C., E.B.-J., A.C.-S.d.S., V.G.-H., M.S.-M., J.I.P.-C., I.G.-L. and J.R.-G.; visualization, A.G.-C., E.B.-J. and I.G.-L.; supervision, J.I.P.-C., I.G.-L. and J.R.-G.; project administration, I.G.-L.; funding acquisition, J.I.P.-C., I.G.-L. and J.R.-G. The authors take full responsibility for the content of the published article. All authors have read and agreed to the published version of the manuscript.

Funding

This research was funded by Gobierno de Aragón, B07-23R.

Institutional Review Board Statement

The study adheres to the Declaration of Helsinki (Fortaleza, Brazil, 2013) and good clinical practice guidelines. Ethical approval was obtained from the Comité de Ética en la Investigación Clínica de Aragón (CEICA; data collection: PI12/117; 3 October 2012; secondary use: PI22/522; 30 November 2022).

Informed Consent Statement

Informed consent was obtained from all subjects involved in the study.

Data Availability Statement

The raw data supporting the conclusions of this article will be made available by the authors upon reasonable request.

Acknowledgments

We are indebted to Josep Lupón, Pau Codina, and Antoni Bayés (Hospital Universitari Germans Trias i Pujol, Badalona Spain) for sharing the BCN Bio-HF v3 calculator algorithms, which saved us a tremendous amount of work. We are thankful for the technical assistance by the Servicio de Apoyo Metodológico y Estadístico (SAME) from IACS. Declaration of generative AI and AI-assisted technologies in the writing process: During the preparation of this work, the authors used ChatGPT 4.0, OpenAI to improve the readability and language of the manuscript. After using this tool/service, the authors reviewed and edited the content as needed.

Conflicts of Interest

The authors declare no conflicts of interest. The funders had no role in the design of the study; in the collection, analyses, or interpretation of data; in the writing of the manuscript; or in the decision to publish the results.

Abbreviations

The following abbreviations are used in this manuscript:
NYHANew York Heart Association
SBPsystolic blood pressure
LVEFleft ventricular ejection fraction
CKDchronic kidney disease
COPDchronic obstructive pulmonary disease
ACE-Iangiotensin-converting enzyme inhibitor
ARBangiotensin receptor blocker
MRAmineralocorticoid receptor antagonist
Hbhemoglobin
eGFR-MDRDestimated glomerular filtration rate by modification of diet in renal disease study formula
PPVpositive predictive value
NPVnegative predictive value
NRINet Reclassification Index
IDIIntegrated Discrimination Improvement Index
ARNIAngiotensin Receptor-Neprilysin Inhibitor
CRTCardiac Resynchronization Therapy
ICDImplantable Cardioverter Defibrillator
ADHFacute decompensated heart failure

References

  1. Martin, S.S.; Aday, A.W.; Almarzooq, Z.I.; Anderson, C.A.; Arora, P.; Avery, C.L.; Baker-Smith, C.M.; Gibbs, B.B.; Beaton, A.Z.; Boehme, A.K.; et al. 2024 Heart Disease and Stroke Statistics: A Report of US and Global Data from the American Heart Association. Circulation 2024, 149, e347–e913. [Google Scholar] [CrossRef] [Scilit]
  2. Heidenreich, P.A.; Bozkurt, B.; Aguilar, D.; Allen, L.A.; Byun, J.J.; Colvin, M.M.; Deswal, A.; Drazner, H.A.; Dunlay, S.M.; Evers, L.R.; et al. 2022 AHA/ACC/HFSA Guideline for the Management of Heart Failure: A Report of the American College of Cardiology/American Heart Association Joint Committee on Clinical Practice Guidelines. J. Am. Coll. Cardiol. 2022, 79, e263–e421. [Google Scholar] [CrossRef] [Scilit]
  3. Alba, A.C.; Agoritsas, T.; Jankowski, M.; Courvoisier, D.; Walter, S.D.; Guyatt, G.H.; Ross, H.J. Risk prediction models for mortality in ambulatory patients with heart failure: A systematic review. Circ. Heart Fail. 2013, 6, 881–889. [Google Scholar] [CrossRef] [Scilit] [PubMed]
  4. Skoularigkis, S.; Kourek, C.; Xanthopoulos, A.; Briasoulis, A.; Androutsopoulou, V.; Magouliotis, D.; Athanasiou, T.; Skoularigis, J. Prognostic Models in Heart Failure: Hope or Hype. J. Pers. Med. 2025, 15, 345. [Google Scholar] [CrossRef] [Scilit]
  5. Echouffo-Tcheugui, J.B.; Greene, S.J.; Papadimitriou, L.; Zannad, F.; Yancy, C.W.; Gheorghiade, M.; Butler, J. Population Risk Prediction Models for Incident Heart Failure: A Systematic Review. Circ. Heart Fail. 2015, 8, 438–447. [Google Scholar] [CrossRef] [Scilit] [PubMed]
  6. Sahle, B.W.; Owen, A.J.; Chin, K.L.; Reid, C.M. Risk Prediction Models for Incident Heart Failure: A Systematic Review of Methodology and Model Performance. J. Card. Fail. 2017, 23, 680–687. [Google Scholar] [CrossRef] [Scilit] [PubMed]
  7. Di Tanna, G.L.; Wirtz, H.; Burrows, K.L.; Globe, G. Evaluating risk prediction models for adults with heart failure: A systematic literature review. PLoS ONE 2020, 15, e0224135. [Google Scholar] [CrossRef] [Scilit]
  8. Pocock, S.J.; Ariti, C.A.; McMurray, J.J.; Maggioni, A.; Køber, L.; Squire, I.B.; Swedberg, K.; Dobson, J.; Poppe, K.K.; Whalley, G.A.; et al. Predicting survival in heart failure: A risk score based on 39 372 patients from 30 studies. Eur. Heart J. 2013, 34, 1404–1413. [Google Scholar] [CrossRef] [Scilit]
  9. Sartipy, U.; Dahlström, U.; Edner, M.; Lund, L.H. Predicting survival in heart failure: Validation of the MAGGIC heart failure risk score in 51 043 patients from the Swedish Heart Failure Registry. Eur. J. Heart Fail. 2014, 16, 173–179. [Google Scholar] [CrossRef] [Scilit]
  10. Levy, W.C.; Mozaffarian, D.; Linker, D.T.; Sutradhar, S.C.; Anker, S.D.; Cropp, A.B.; Anand, I.; Maggioni, A.; Burton, P.; Sullivan, M.D.; et al. The Seattle Heart Failure Model: Prediction of Survival in Heart Failure. Circulation 2006, 113, 1424–1433. [Google Scholar] [CrossRef] [Scilit]
  11. Allen, L.A.; Matlock, D.D.; Shetterly, S.M.; Xu, S.; Levy, W.C.; Portalupi, L.B.; McIlvennan, C.K.; Gurwitz, J.H.; Johnson, E.S.; Smith, D.H.; et al. Use of Risk Models to Predict Death in the Next Year Among Individual Ambulatory Patients with Heart Failure. JAMA Cardiol. 2017, 2, 435–441. [Google Scholar] [CrossRef] [Scilit]
  12. Bo, X.; Zhang, Y.; Liu, Y.; Kharbuja, N.; Chen, L. Performance of the heart failure risk scores in predicting 1 year mortality and short-term readmission of patients. ESC Heart Fail. 2023, 10, 502–517. [Google Scholar] [CrossRef] [Scilit] [PubMed]
  13. Lupón, J.; de Antonio, M.; Vila, J.; Peñafiel, J.; Galán, A.; Zamora, E.; Urrutia, A.; Bayes-Genis, A. Development of a novel heart failure risk tool: The Barcelona Bio-Heart Failure risk calculator (BCN bio-HF calculator). PLoS ONE 2014, 9, e85466. [Google Scholar] [CrossRef] [Scilit] [PubMed]
  14. Codina, P.; Lupón, J.; Subirana, I.; Zamora, E.; Domingo, M.; Santiago-Vacas, E.; Cediel, G.; Borrellas, A.; Barallat, J.; Bayes-Genis, A. Barcelona Bio-HF calculator version 3.0: Recalibration and incorporation of sodium-glucose cotransporter 2 inhibitor treatment. Eur. J. Heart Fail. 2023, 25, 131–132. [Google Scholar] [CrossRef] [Scilit]
  15. Szczurek-Wasilewicz, W.; Skrzypek, M.; Karmański, A.; Jurkiewicz, M.; Gąsior, M.; Szyguła-Jurkiewicz, B. The Barcelona Bio-Heart Failure Risk Calculator may predict one-year mortality in patients with advanced heart failure. Pol. Arch. Intern. Med. 2024, 134, 16757. [Google Scholar] [CrossRef] [Scilit]
  16. Codina, P.; Lupón, J.; Borrellas, A.; Spitaleri, G.; Cediel, G.; Domingo, M.; Simpson, J.; Levy, W.C.; Santiago-Vacas, E.; Zamora, E.; et al. Head-to-head comparison of contemporary heart failure risk scores. Eur. J. Heart Fail. 2021, 23, 2035–2044. [Google Scholar] [CrossRef] [Scilit]
  17. Codina, P.; Dobarro, D.; de Juan-Bagudá, J.; De Frutos, F.; Lupón, J.; Bayes-Genis, A.; Gonzalez-Costello, J.; Collaborators, S.L.R. Heart failure risk scores in advanced heart failure patients: Insights from the LEVO-D registry. ESC Heart Fail. 2023, 10, 2875–2881. [Google Scholar] [CrossRef] [Scilit] [PubMed]
  18. Iwakura, K.; Onishi, T.; Okamura, A.; Koyama, Y.; Tanaka, N.; Okada, M.; Fujii, K.; Seo, M.; Yamada, T.; Yano, M.; et al. The WATCH-DM risk score estimates clinical outcomes in type 2 diabetic patients with heart failure with preserved ejection fraction. Sci. Rep. 2024, 14, 1746. [Google Scholar] [CrossRef] [Scilit]
  19. Codina, P.; Zamora, E.; Levy, W.C.; Revuelta-López, E.; Borrellas, A.; Spitaleri, G.; Cediel, G.; Ruiz-Cueto, M.; Cañedo, E.; Santiago-Vacas, E.; et al. Mortality Risk Prediction Dynamics After Heart Failure Treatment Optimization: Repeat Risk Assessment Using Online Risk Calculators. Front. Cardiovasc. Med. 2022, 9, 836451. [Google Scholar] [CrossRef] [Scilit]
  20. Álvarez-García, J.; García-Osuna, Á.; Vives-Borrás, M.; Ferrero-Gregori, A.; Martínez-Sellés, M.; Vázquez, R.; Gonzalez-Juanatey, J.R.; Rivera, M.; Segovia, J.; Pascual-Figal, D.; et al. A 3-Biomarker 2-Point-Based Risk Stratification Strategy in Acute Heart Failure. Front. Physiol. 2021, 12, 708890. [Google Scholar] [CrossRef] [Scilit]
  21. Pérez-Sanz, T.M.; Gómez-Salvador, I.; Codina, P.; Calvo Antón, B.; de la Torre Carpente, M.M.d.l.T.; Redondo Bermejo, B.; Tapia Ballesteros, C. Soluble ST2, BCN-Bio-HF calculator and MAGGIC-HF score in long-term risk prediction after an urgent visit for heart failure. Heart Vessels. 2023, 39, 216–225. [Google Scholar] [CrossRef] [Scilit] [PubMed]
  22. Freitas, P.; Aguiar, C.; Ferreira, A.; Tralhão, A.; Ventosa, A.; Mendes, M. Comparative Analysis of Four Scores to Stratify Patients with Heart Failure and Reduced Ejection Fraction. Am. J. Cardiol. 2017, 120, 443–449. [Google Scholar] [CrossRef] [Scilit]
  23. Heyl, S.; Luu, B.; Wieszner, M.; Nikkhoo, A.; Seeger, F.; Hemmann, K.; Assmus, B.; Kaess, B.; Zeiher, A.; Walther, C.; et al. Differential prognostic accuracy of right ventricular dysfunction, the Seattle heart failure model and the MAGGIC score in patients with severe mitral regurgitation undergoing the MitraClip® procedure. Int. J. Cardiol. Heart Vasc. 2020, 31, 100641. [Google Scholar] [CrossRef] [Scilit]
  24. Szlacheta, P.; Malinowska-Borowska, J.; Nowak, J.U.; Buczkowska, M.; Kulik, A.; Mroczek, A.; Duda, S.; Ostręga, W.; Niedziela, J.T.; Skrzypek, M.; et al. Long-term prognostic scores may underestimate the risk of death in patients with heart failure with reduced ejection fraction in whom red cell distribution width is elevated. Pol. Arch. Intern. Med. 2023, 133, 16494. [Google Scholar] [CrossRef] [Scilit]
  25. Muser, D.; Liang, J.J.; Castro, S.A.; Lanera, C.; Enriquez, A.; Kuo, L.; Magnani, S.; Birati, E.Y.; Lin, D.; Schaller, R.; et al. Performance of Prognostic Heart Failure Models in Patients with Nonischemic Cardiomyopathy Undergoing Ventricular Tachycardia Ablation. JACC Clin. Electrophysiol. 2019, 5, 801–813. [Google Scholar] [CrossRef] [Scilit]
  26. Kwon, J.-M.; Kim, K.-H.; Jeon, K.-H.; Lee, S.E.; Lee, H.-Y.; Cho, H.-J.; Choi, J.O.; Jeon, E.-S.; Kim, M.-S.; Kim, J.-J.; et al. Artificial intelligence algorithm for predicting mortality of patients with acute heart failure. PLoS ONE 2019, 14, e0219302. [Google Scholar] [CrossRef] [Scilit] [PubMed]
  27. Tohyama, T.; Ide, T.; Ikeda, M.; Kaku, H.; Enzan, N.; Matsushima, S.; Funakoshi, K.; Kishimoto, J.; Todaka, K.; Tsutsui, H. Machine learning-based model for predicting 1 year mortality of hospitalized patients with heart failure. ESC Heart Fail. 2021, 8, 4077–4085. [Google Scholar] [CrossRef] [Scilit] [PubMed]
  28. McGranaghan, P.; Saxena, A.; Düngen, H.-D.; Rubens, M.; Appunni, S.; Salami, J.; Veledar, E.; Lacour, P.; Blaschke, F.; Obradovic, D.; et al. Performance of a cardiac lipid panel compared to four prognostic scores in chronic heart failure. Sci. Rep. 2021, 11, 8164. [Google Scholar] [CrossRef] [Scilit]
  29. Lupón, J.; Simpson, J.; McMurray, J.J.; de Antonio, M.; Vila, J.; Subirana, I.; Barallat, J.; Moliner, P.; Domingo, M.; Zamora, E.; et al. Barcelona Bio-HF Calculator Version 2.0: Incorporation of angiotensin II receptor blocker neprilysin inhibitor (ARNI) and risk for heart failure hospitalization. Eur. J. Heart Fail. 2018, 20, 938–940. [Google Scholar] [CrossRef] [Scilit]
  30. Kouwert, I.J.; Bakker, E.A.; Cramer, M.J.; Snoek, J.A.; Eijsvogels, T.M. Comparison of MAGGIC and MECKI risk scores to predict mortality after cardiac rehabilitation among Dutch heart failure patients. Eur. J. Prev. Cardiol. 2020, 27, 2126–2130. [Google Scholar] [CrossRef] [Scilit]
  31. Michaels, A.; Aurora, L.; Peterson, E.; Liu, B.; Pinto, Y.M.; Sabbah, H.N.; Williams, K.; Lanfear, D.E. Risk Prediction in Transition: MAGGIC Score Performance at Discharge and Incremental Utility of Natriuretic Peptides. J. Card. Fail. 2020, 26, 52–60. [Google Scholar] [CrossRef] [Scilit]
  32. Sawano, M.; Shiraishi, Y.; Kohsaka, S.; Nagai, T.; Goda, A.; Mizuno, A.; Sujino, Y.; Nagatomo, Y.; Kohno, T.; Anzai, T.; et al. Performance of the MAGGIC heart failure risk score and its modification with the addition of discharge natriuretic peptides. ESC Heart Fail. 2018, 5, 610–619. [Google Scholar] [CrossRef] [Scilit] [PubMed]
  33. Rich, J.D.; Burns, J.; Freed, B.H.; Maurer, M.S.; Burkhoff, D.; Shah, S.J. Meta-Analysis Global Group in Chronic (MAGGIC) Heart Failure Risk Score: Validation of a Simple Tool for the Prediction of Morbidity and Mortality in Heart Failure with Preserved Ejection Fraction. J. Am. Heart Assoc. 2018, 7, e009594. [Google Scholar] [CrossRef] [Scilit]
  34. Khanam, S.S.; Choi, E.; Son, J.-W.; Lee, J.-W.; Youn, Y.J.; Yoon, J.; Lee, S.-H.; Kim, J.-Y.; Ahn, S.G.; Ahn, M.-S.; et al. Validation of the MAGGIC (Meta-Analysis Global Group in Chronic Heart Failure) heart failure risk score and the effect of adding natriuretic peptide for predicting mortality after discharge in hospitalized patients with heart failure. PLoS ONE 2018, 13, e0206380. [Google Scholar] [CrossRef] [Scilit] [PubMed]
  35. Masè, M.; Rossi, M.; Setti, M.; Barbati, G.; Teso, M.; Ribichini, F.; Koni, M.; Stolfo, D.; Merlo, M.; Sinagra, G.; et al. Applicability and performance of heart failure prognostic scores in dilated cardiomyopathy: The real-world experience of an Italian referral center for cardiomyopathies. Int. J. Cardiol. 2024, 396, 131562. [Google Scholar] [CrossRef] [Scilit] [PubMed]
  36. Sommer, K.K.; Amr, A.; Bavendiek, U.; Beierle, F.; Brunecker, P.; Dathe, H.; Eils, J.; Ertl, M.; Fette, G.; Gietzelt, M.; et al. Structured, Harmonized, and Interoperable Integration of Clinical Routine Data to Compute Heart Failure Risk Scores. Life 2022, 12, 749. [Google Scholar] [CrossRef] [Scilit]
Figure 1. The patient selection algorithm. The initial cohort included 384 patients. After excluding 14 patients who died during admission (IH death), 370 patients remained with all variables required for calculating the BCN Bio-HF risk model. An additional 141 patients were excluded due to missing data for SBP and FEVI, which are needed for MAGGIC calculations. The final cohort comprised 229 patients with complete data for both MAGGIC and BCN Bio-HF calculators.
Hearts 06 00026 g001
Figure 2. (A) MAGGIC scores were normally distributed (light blue bars). Mortality rates at 1-year (orange line) and 3-year (black line) follow-ups correlated with MAGGIC scores. (B) MAGGIC-predicted mortality risks were correlated with those calculated by BCN Bio-HF at both 1-year (blue) and 3-year (orange) follow-ups.
Hearts 06 00026 g002
Figure 3. Receiver Operating Curves (ROC) for predicting 1-year (A) and 3-year (B) mortality using the MAGGIC (blue line) and BCN Bio-HF (red line) risk calculators.
Hearts 06 00026 g003
Figure 4. Calibration curves for predicting 1-year (A,C) and 3-year (B,D) mortality using MAGGIC (top) and BCN Bio-HF (bottom) risk calculators. The graphs show smoothed correlation plots for observed versus predicted mortality rates, calculated for each risk decile.
Hearts 06 00026 g004
Figure 5. Kaplan–Meier curves showing cumulative survival over 1-year (A,C) and 3-year (B,D) follow-up periods for MAGGIC (top) and BCN Bio-HF (bottom) calculated risks. Each plot displays curves for six patient risk groups (sextiles). At the 1-year follow-up, BCN Bio-HF sextiles effectively separated patients into two distinct groups, namely low- (S1 = 00%, S2 = 10.4%, S3 = 2.9%) and high-risk (S4 = 35.3%, S5 = 30.2%, S6 = 45.2%). However, MAGGIC sextiles successfully identified three distinct groups, namely low- (S1 = 5.3%, S2 = 7.9%), middle- (S3 = 15.6%, S4 = 19.5%), and high-risk patients (S5 = 32.4%, S6 = 42.4%). BCN Bio-HF sextiles (S1 = 30.2%, S2 = 42.1%, S3 = 40%, S4 = 53.8%, S5 = 58.3%, S6 = 68.4%) showed superior ability to distinguish 3-year mortality risk compared to MAGGIC sextiles (S1 = 26.3%, S2 = 28.9%, S3 = 53.3%, S4 = 60%, S5 = 61.8%, S6 = 63.6%).
Hearts 06 00026 g005
Figure 6. (A) Reclassification of 1-year mortality risk. Survivors and deceased (event) patients were divided into three risk groups (Low = 0.0–0.1, Medium = 0.1–0.2, and High ≥ 0.2) for each model. Within colored cells, black and red numbers indicate patients whose risk classification would improve or worsen, respectively, using BCN Bio-HF for assessment instead of MAGGIC. (B) Reclassification of 3-year mortality risk (Low = 0.0–0.2, Medium = 0.2–0.4, and High ≥ 0.4).
Hearts 06 00026 g006
Table 1. Clinical characteristics of patients on admission and grouped by 1-year and 3-year mortality.
1-Year Follow-Up3-Year Follow-Up
MBTotalSurvivorDeceasedpSurvivorDeceasedp
n, % 229184 (80.3)45 (19.7) 118 (51.5)111 (48.5)
Demographics
Age, yearsXX81 (10)80 (11)83 (6)0.00280 (11)81 (8)0.045
Gender, femalesXX118 (51.5)97 (52.7)21 (46.7)0.46763 (53.4)55 (49.5)0.561
BMIX 29.3 (6.5)29.3 (6.8)27.7 (7)0.15730.04 (7.5)27.55 (7.6)0.039
HF ≥ 18 monthsX 109 (47.6)83 (45.1)26 (57.8)0.12750 (42.4)59 (53.2)0.103
Months of HF X14 (49)11.50 (43)21 (59)0.0788.5 (43)20 (53)0.116
Previous admissions X0 (1)0 (1)1 (1)0.1510 (1)1 (1)0.005
NYHAXX
NYHA Class I 21 (9.2)19 (10.3)2 (4.4)0.00416 (13.6)5 (4.5)0.002
NYHA Class II 153 (66.8)130 (70.7)23 (51.1) 84 (71.2)69 (62.2)
NYHA Class III 53 (23.1)34 (18.5)19 (42.2) 18 (15.3)35 (31.5)
NYHA Class IV 2 (0.9)1 (0.5)1 (2.2) 0 (0)2 (1.8)
Clinical profile
Vital signs upon admission
SBP, mmHgX 136 (38)140 (42.8)129 (26)0.057143 (44.3)133.5 (27)0.096
LVEF, %XX54 (24)54 (22)49 (29)0.09554 (24)54.5 (25)0.600
Comorbidities
Ischemic cardiopathy 83 (36.2)66 (35.9)17 (37.8)0.81139 (33.1)44 (39.6)0.300
Hypertension 192 (83.8)155 (84.2)37 (82.2)0.74298 (83.1)94 (84.7)0.737
Diabetes mellitusXX94 (41.0)75 (40.8)19 (42.2)0.85849 (41.5)45 (40.5)0.880
Atrial fibrillation 138 (60.3)109 (59.2)29 (64.4)0.52267 (56.8)71 (64)0.267
CKD 65 (28.4)47 (25.5)18 (40.9)0.04321 (17.8)44 (40)0.000
COPDX 37 (16.2)32 (17.4)5 (11.1)0.30521 (17.8)16 (14.4)0.487
Medication at discharge
Furosemide equivalents X30 (20)20 (20)40 (30)0.00020 (10)30 (20)0.000
Statins X97 (42.4)79 (42.9)18 (40)0.72150 (42.4)47 (42.3)0.996
Beta-blockersXX135 (59)111 (60.3)24 (53.5)0.39369 (58.5)66 (59.5)0.880
ACE-I/ARBsXX166 (72.5)137 (74.5)29 (64.4)0.17886 (72.9)80 (72.1)0.891
MRAs X75 (32.8)55 (29.9)20 (44.4)0.06232 (27.1)43 (38.7)0.061
ARNI X2 (0.9)1 (0.5)1 (2.2)0.2780 (0)2 (1.8)0.143
Interventions
CRT X3 (1.3)3 (1.6)0 (0)0.3890 (0)3 (2.7)0.072
ICD X2 (0.9)1 (0.5)1 (2.2)0.2780 (0)2 (1.8)0.143
Laboratory
Hb, g/dL X12.2 ± 1.912.3 ± 211.7 ± 1.50.02612.5 ± 1.911.8 ± 1.80.017
Serum creatinine, mg/dLX 1.10 (0.6)1.07 (0.57)1.24 (0.65)0.0021.02 (0.56)1.165 (0.63)0.004
eGFR-MDRD, mL/min/1.73 m2 X61 (31)63 (30.8)52 (24)0.00265 (32.5)58 (27.8)0.003
Serum cystatin C 1.450 (0.6)1.415 (0.6)1.730 (0.7)0.0031.32 (0.6)1.485 (0.8)0.002
eGFR EpiCys, mL/min/1.73 m2 43 (24.5)44.5 (28.5)34 (20.5)0.00247 (24.5)40 (27.3)0.002
Sodium, mEq/L X142 (4)142 (4)140 (5)0.052141 (5)141 (5.3)0.808
Potassium, mEq/L 4.1 ± 0.534.1 ± 0.524.1 ± 0.520.9934.0 ± 0.534.1 ± 0.540.282
Values are shown as mean (SD) for parametric quantitative variables and median (IQR) for non-parametric variables and as net number and percentage, n (%), for qualitative variables. Conversion factors (molecular weights g/mol): hemoglobin 64000, creatinine 113.12, uric acid 168.1, sodium 23, potassium 39. M = variables computed in MAGGIC (https://www.mdcalc.com/calc/3803/maggic-risk-calculator-heart-failure, accessed 8 August 2025); B = variables computed in BCN Bio-HF clinical model without biomarkers (http://ww2.bcnbiohfcalculator.org/web/, accessed 8 August 2025). Abbreviations: NYHA, New York Heart Association; SBP, systolic blood pressure; LVEF, left ventricular ejection fraction; CKD, chronic kidney disease; COPD, chronic obstructive pulmonary disease; ACE-I, angiotensin converting enzyme inhibitors; ARB, angiotensin receptor blocker; MRA, mineralocorticoid receptor antagonist; ARNI, Angiotensin Receptor-Neprilysin Inhibitor; CRT, Cardiac Resynchronization Therapy; ICD, Implantable Cardioverter Defibrillator; Hb, hemoglobin; eGFR-MDRD, estimated glomerular filtration rate by modification of diet in renal disease study formula.
Table 2. Comparison of MAGGIC and BCN Bio-HF models.
MAGGICBCN Bio-HFDirect Comparison
1-Year3-Years1-Year3-Years1-Year3-Year
ROC analysis******
AUROC0.738 ± 0.041 (0.658–0.818)0.664 ± 0.036 (0.594–0.734)0.769 ± 0.036 (0.699–0.839)0.654 ± 0.036 (0.583–0.724)
Sensitivity0.9110.6850.8000.468
FPR (1-specificity)0.6900.4410.3210.254
Specificity (1-FPR)0.3100.5590.6790.746
Precision
PPV0.2440.5940.3790.634
NPV0.9340.6540.9330.599
Accuracy
Brier score0.143 ± 0.2450.247 ± 0.1880.148 ± 0.2810.282 ± 0.278
Brier Skill Score −0.035−0.142
Reclassification indexes
NRI 12.7%0.93%
IDI 0.006030.01054
* p < 0.05, ** p < 0.01. AUROC: Area Under the Receiver Operating Curve. Data shown as AUC ± SD (95% confidence interval). PPV: positive predictive value; NPV: negative predictive value; NRI: Net Reclassification Index; IDI: Integrated Discrimination Improvement index. Sensitivity, 1-Specificity, PPV, and NPV provided for 0.3 risk cut-off (MAGGIC-predicted risk).
Disclaimer/Publisher’s Note: The statements, opinions and data contained in all publications are solely those of the individual author(s) and contributor(s) and not of MDPI and/or the editor(s). MDPI and/or the editor(s) disclaim responsibility for any injury to people or property resulting from any ideas, methods, instructions or products referred to in the content.