Article

Pyrolyzed Sucrose as a Green Binder for Coconut Shell-Based Activated Carbon Electrodes in Supercapacitors


by
Prabhasha Manodya Kumarage
1,
Dileep Sandakelum Gamage
1,2,
Asiri Thimal Medagedara
1,2,
Muthugalage Ishara Umayangani Weerasinghe
1,2,
Sadith Punsara Jayathilaka
1,
Athulya Methsisi Rathnayake
1,
Senuka Bandara Deegala
1,
Rajapakse Mudiyanselage Gamini Rajapakse
2,3,
Kirthi Tennakone
1,
Uthpala Dahanayake
4,
Wijendra Jayalath Bandara
2,5,
Masamichi Yoshimura
6 and
Gamaralalage Rajanya Ashoka Kumara
1,*
1
National Institute of Fundamental Studies, Hantana Road, Kandy 20000, Sri Lanka
2
Postgraduate Institute of Science, University of Peradeniya, Peradeniya 20400, Sri Lanka
3
Department of Chemistry, Faculty of Science, University of Peradeniya, Peradeniya 20400, Sri Lanka
4
Department of Physical Sciences, Faculty of Applied Sciences, Rajarata University of Sri Lanka, Mihintale 50300, Sri Lanka
5
Department of Physics, Faculty of Science, University of Peradeniya, Peradeniya 20400, Sri Lanka
6
Graduate School of Engineering, Toyota Technological Institute, 2-12-1 Hisakata, Tempaku, Nagoya 468-8511, Japan
*
Author to whom correspondence should be addressed.
Appl. Nano 2026, 7(3), 19; https://doi.org/10.3390/applnano7030019
Submission received: 26 May 2026 / Revised: 25 June 2026 / Accepted: 9 July 2026 / Published: 13 July 2026

Abstract

Supercapacitors are widely used in high-power-density applications due to their ability to deliver rapid energy bursts and fast recharging. The incorporation of naturally derived materials into supercapacitor electrodes offers notable advantages in terms of sustainability, environmental impact, and biodegradability relative to their synthetic counterparts. In this study, activated carbon with high electronic conductivity is combined with pyrolyzed sucrose as a binder to fabricate thin-film electrodes, with 2.50 mol dm−3 H2SO4 serving as the electrolyte. Both constituent materials are characterized with respect to their structural and electrical properties. The optimized electrodes exhibit a sheet resistance of 171.24 Ω sq−1 and a resistivity of 1.92 × 10⁻⁴ Ω cm. The assembled electric double-layer capacitor achieves a specific capacitance of 74.35 F g−1 at an activated carbon-to-sucrose ratio of 1:2, following sintering at 350 °C for 20 min. Cyclic voltammetry reveals capacitive-to-diffusive current contributions of 93:7% at 200 mV s−1 and 67:33% at 5 mV s−1, with a specific capacitance retention of 77% after 1000 cycles. Collectively, these results indicate that the fabricated electrodes possess satisfactory energy storage capability and adequate electrochemical stability. The findings suggest that biomass-derived activated carbon–pyrolyzed sucrose composites warrant consideration as cost-effective and environmentally benign electrode materials for sustainable energy storage applications.

1. Introduction

New technologies have enabled the development of high-performance energy storage devices that can deliver the required energy output. Among the energy storage options, batteries and environmentally sustainable supercapacitors stand out as particularly promising, despite their differing charge-storage mechanisms. Batteries harness chemical energy, which is stored via redox reactions and subsequently converted into electrical energy upon demand. Conversely, supercapacitors employ an electrostatic storage mechanism, depositing energy directly onto the surface of their electrodes. The rate at which batteries convert chemical energy (expressed as—ΔGcell reaction) into electrical energy (denoted as—nFEcell) hinges on the kinetics of cell reactions and associated mass transport phenomena. In contrast, supercapacitors boast the ability to swiftly extract electrostatically stored charges, thereby facilitating rapid charge–discharge cycles. Consequently, supercapacitors embody an energy storage solution characterized by rapid response times, high power densities, and prolonged cyclic stability [1,2,3]. Notably, supercapacitors excel as energy storage solutions in applications such as elevators, cranes, brake energy recovery systems, and electric vehicles.
Supercapacitors comprise two electrodes separated by a separator and an electrolyte, where energy storage occurs via EDLC (electrostatic ion adsorption), pseudocapacitance (surface Faradaic reactions), or a combination of both, depending on the electrode material and electrolyte employed. Presently, Electric Double-Layer Capacitors (EDLCs) represent the foremost energy storage devices [4,5], distinguished by their exceptional cycle longevity and high-power output. Extensive research efforts have focused on enhancing EDLC performances, predominantly through advancements in electrode material properties [6], novel electrolyte formulations [7,8,9,10], and binder types [11,12] utilized in supercapacitor fabrication. To date, diverse carbon-based electrode materials have been investigated, including activated carbon, carbon nanofibers [13,14,15], carbon nanotubes [16], carbon-derived carbons [17,18], and graphene sheets [19,20,21] and graphite composites [22,23]. Table 1 provides a comprehensive summary of specific capacitance (Cs) values for representative carbon-based electrodes reported in the literature, along with the values achieved in the current study. Among these, activated carbons are widely preferred due to their superior cycling durability and cost-effectiveness [24]. Nonetheless, the incorporation of organic or polymeric binders is typically necessary to bind activated carbon particles/powders into cohesive, free-standing electrodes, thereby underscoring the crucial role of binders in supercapacitor design and performance.
Historically, synthetic binders such as poly(vinylidene difluoride) (PVDF) and poly(tetra-fluoroethylene) (PTFE) have been widely used in the fabrication of activated carbon-based electrodes [25,26,27]. These binders offer the advantage of compatibility with a wide range of electrolytes commonly employed in EDLCs. However, both PVDF and PTFE binders entail high costs. Additionally, PTFE necessitates suspension in water, while PVDF demands expensive organic solvents like N-methyl pyrrolidone (NMP) for dissolution. As an alternative, sodium-carboxymethyl cellulose (CMC) has been proposed as a binder for EDLCs. CMC presents cost efficiency and environmental friendliness compared to its synthetic counterparts [28,29]. Furthermore, CMC exhibits water solubility. Nonetheless, the water solubility of CMC restricts its compatibility with aqueous electrolytes, as binder dissolution compromises electrode integrity [30]. Consequently, there has emerged a burgeoning interest in investigating more sustainable and eco-friendly alternatives, such as natural binders.
Researchers are increasingly drawn to natural binders, such as natural cellulose and sucrose, among others, as viable alternatives to costly synthetic binders in energy storage device manufacturing [31,32,33]. These natural binders offer affordability and, when subjected to heat treatment, yield highly conductive carbon-based binders, presenting a straightforward preparation method that reduces production expenses for large-scale device manufacturing.
Utilizing sugar as a natural binder in supercapacitors offers several notable advantages. Firstly, sugar boasts abundant availability, renewability, and cost-effectiveness in comparison to synthetic counterparts. Secondly, sugar-based binders exhibit environmental friendliness and mitigate health and safety concerns associated with certain synthetic alternatives. Moreover, the adoption of natural binders resonates with the escalating demand for sustainable and eco-friendly energy storage solutions [34,35]. Also, heat-treated sugar is employed as a binder; it serves to consolidate electrode materials, enhancing their adhesion to the current collector and mitigating detachment during charge–discharge cycles. Additionally, sugar acts as a carbon source during the heat treatment process, facilitating the conversion of the binder into a conductive carbon matrix. This carbon matrix augments the electrical conductivity of the electrodes, thereby enhancing supercapacitor performance [35].
However, it is imperative to recognize that the development of sugar-based binders for supercapacitors is still nascent, necessitating further research to optimize their performance and stability. Ongoing efforts focus on refining synthesis methodologies and exploring diverse sugar derivatives to enhance binder properties. The present work is distinguished from prior studies by three key contributions: (i) the use of commercially available brown sugar (sucrose) as a fully renewable, water-soluble, solvent-free binder precursor that carbonizes in situ upon heat treatment; (ii) a systematic optimization of both the AC–sucrose mass ratio and the sintering temperature to maximize electrochemical performance; and (iii) the demonstration of a wholly biomass-derived electrode system coconut shell AC bound by pyrolyzed sucrose that avoids toxic solvents such as N-methyl pyrrolidone (required for PVDF) and offers a low-cost fabrication pathway suitable for scalable production.
In this study, electrodes were fabricated utilizing activated carbon derived from burned coconut shells, employing sucrose (sugar) as a natural binder, and subjected to heat treatment to convert sugar into an electronically conductive carbon matrix. This process binds activated carbon particles, yielding a porous structure characterized by the high conductivity and prolonged cyclic stability essential for achieving enhanced energy storage capacity [36,37]. Importantly, this approach emphasizes cost-effectiveness, aligning with the economic viability requisite for supercapacitor applications.
Table 1. A comparative evaluation of the Cs values of fabricated EDLCs employing different electrode materials, binders, and electrolytes, as assessed using a two-electrode technique.
Electrode MaterialBinderElectrolyteCs (F g−1)Reference
AC:CNT:CBBinder-Free1 M Li2SO4125.6[38]
ACGuar gum1 M NaCl82.2[33]
Chitosan63
Casein, CMC, Gelatin30–36
ACNa-CMC
Natural cellulose
1 M Na2SO4
1 M Et2NBF4
PYR14TFSI
70–80[32]
ACPVP and PVDF1.5 M H2SO4132.3[39]
GraphitePVDF1 M H2SO416.2[25]
PPy/GO/ZnOBinder free1 M Na2SO494.6[40]
ACPotato starch: Guar gum1 M TEABF426.0[31]
ACMFC6 M KOH85–90[41]
ACSugar Binder2.5 M H2SO474.35This work
Activated carbon (AC), carbon nanotubes (CNTs), carbon black (CB), carboxymethyl cellulose (CMC), sodium carboxymethyl cellulose (Na-CMC), microfibrillated cellulose (MFC), polyvinylidene fluoride (PVDF), polyvinylpyrrolidone (PVP), zinc oxide (ZnO), polypyrrole (PPy), graphene oxide (GO).

2. Materials and Methods

2.1. Experimental Materials

Coconut shells for producing activated carbon (AC) were found in coconut plantations located in the Kurunegala district of Sri Lanka. As the current collector, titanium plates were used with dimensions of 2 cm × 1 cm × 0.45 mm (length × width × thickness). Additionally, commercially available brown sugar was purchased from Lanka Sugar Company Limited, Pelawatte, Sri lanka. Medium retention filter papers with a retention range of 10–13 μm (model-F1001) were obtained from Chmlab, Barcelona, Spain. Additionally, the utilized chemicals, sulfuric acid (H2SO4, 97%), and isopropyl alcohol (C3H8O, 99.5%), were acquired from Sigma-Aldrich, St. Louis, MO, USA, and Merck, Mumbai, India, respectively.

2.2. Preparation of AC Powder

Coconut shells were initially cleaned and cut into small segments (2–4 cm), then washed with distilled water to remove impurities. The cleaned segments were then dried under direct sunlight (12 h) to eliminate residual moisture. Then the dried segments were subjected to pyrolysis in a low-oxygen environment at 350 °C for 30 min to facilitate the carbonization. Following this, the carbonized shells were further thermally treated at a temperature of 900 °C for 20 min in a box furnace under a hot air atmosphere in a tight sealed container. The heated material was rapidly quenched in distilled water to induce activation, following the procedure reported in a previous study [39]. This activation process was repeated multiple times, with each step followed by drying at 110 °C overnight to remove residual moisture. After that, the activated coconut shells were broken into a fine powder using disk milling, yielding activated coconut charcoal powder.

2.3. Device Fabrication and Characterization

Titanium plates, serving as current collectors, were cleaned with ethanol to remove surface contaminants, followed by cleaning with distilled water to remove residual ethanol. The plates were then dried using a hot air stream to ensure a moisture-free surface. The mass of each titanium plate was measured and recorded before further processing.
The study initially sought to optimize the mass ratio of AC to sugar for electrode fabrication. A baseline mixture was prepared by dissolving 0.50 g of sugar in 4.0 mL of distilled water and dispersing 0.50 g of AC in 6.0 mL of isopropyl alcohol. These slurries were combined and mixed with a mortar and pestle. To ensure homogeneity, the suspension was sonicated for 15 min using an ultrasonic cleaner (Rocker: soner 220H, New Taipei City, Taiwan). The mixture was then spray-coated onto a titanium substrate preheated at 150 °C. The average mass loading per electrode during preparation was 0.005 g. Experimental trials continued by varying the AC to sugar mass ratio to 1:1.5, 1:2, 1:2.5, and 1:3 to determine the optimum formulation.
The subsequent phase of the study investigated the influence of sintering temperature on electrode performance. Electrodes fabricated with the optimal binder ratio underwent thermal treatment within a controlled furnace (KDF 007, Denken-Highdental Co., Ltd., Kyoto, Japan). The sintering temperature varied from 200 °C to 400 °C in 50 °C increments. Each annealing cycle lasted 20 min. Following this treatment, the electrodes were characterized to determine the specific conditions that yielded the highest electrochemical efficiency.
Cells were fabricated using medium-retention filter paper as the separator, with the inter-electrode space filled with a 2.5 M H2SO4(aq) electrolyte used based on prior optimizations [39]. Electrochemical performance was characterized through cyclic voltammetry (CV), electrochemical impedance spectroscopy (EIS), and galvanostatic charge–discharge (GCD) techniques using a Metrohm Autolab analyzer(Metrohm Autolab B.V., Utrecht, the Netherlands) and NOVA 2.1 software following the two-electrode system. The Cs for each CV and GCD measurement were calculated using Equations (1) and (2) [39]. In these equations, Cs (F g−1), V (V), m (g), v (mV s−1), t (s), and Iv represent specific capacitance, applied potential window, active material mass, scan rate, discharge time, and current at potential V, respectively. The integral, which means the area of the cyclic voltammogram curve, was calculated using Origin software.
C s = V a V c I v d V m v V c   V a
C s = I × t m × V
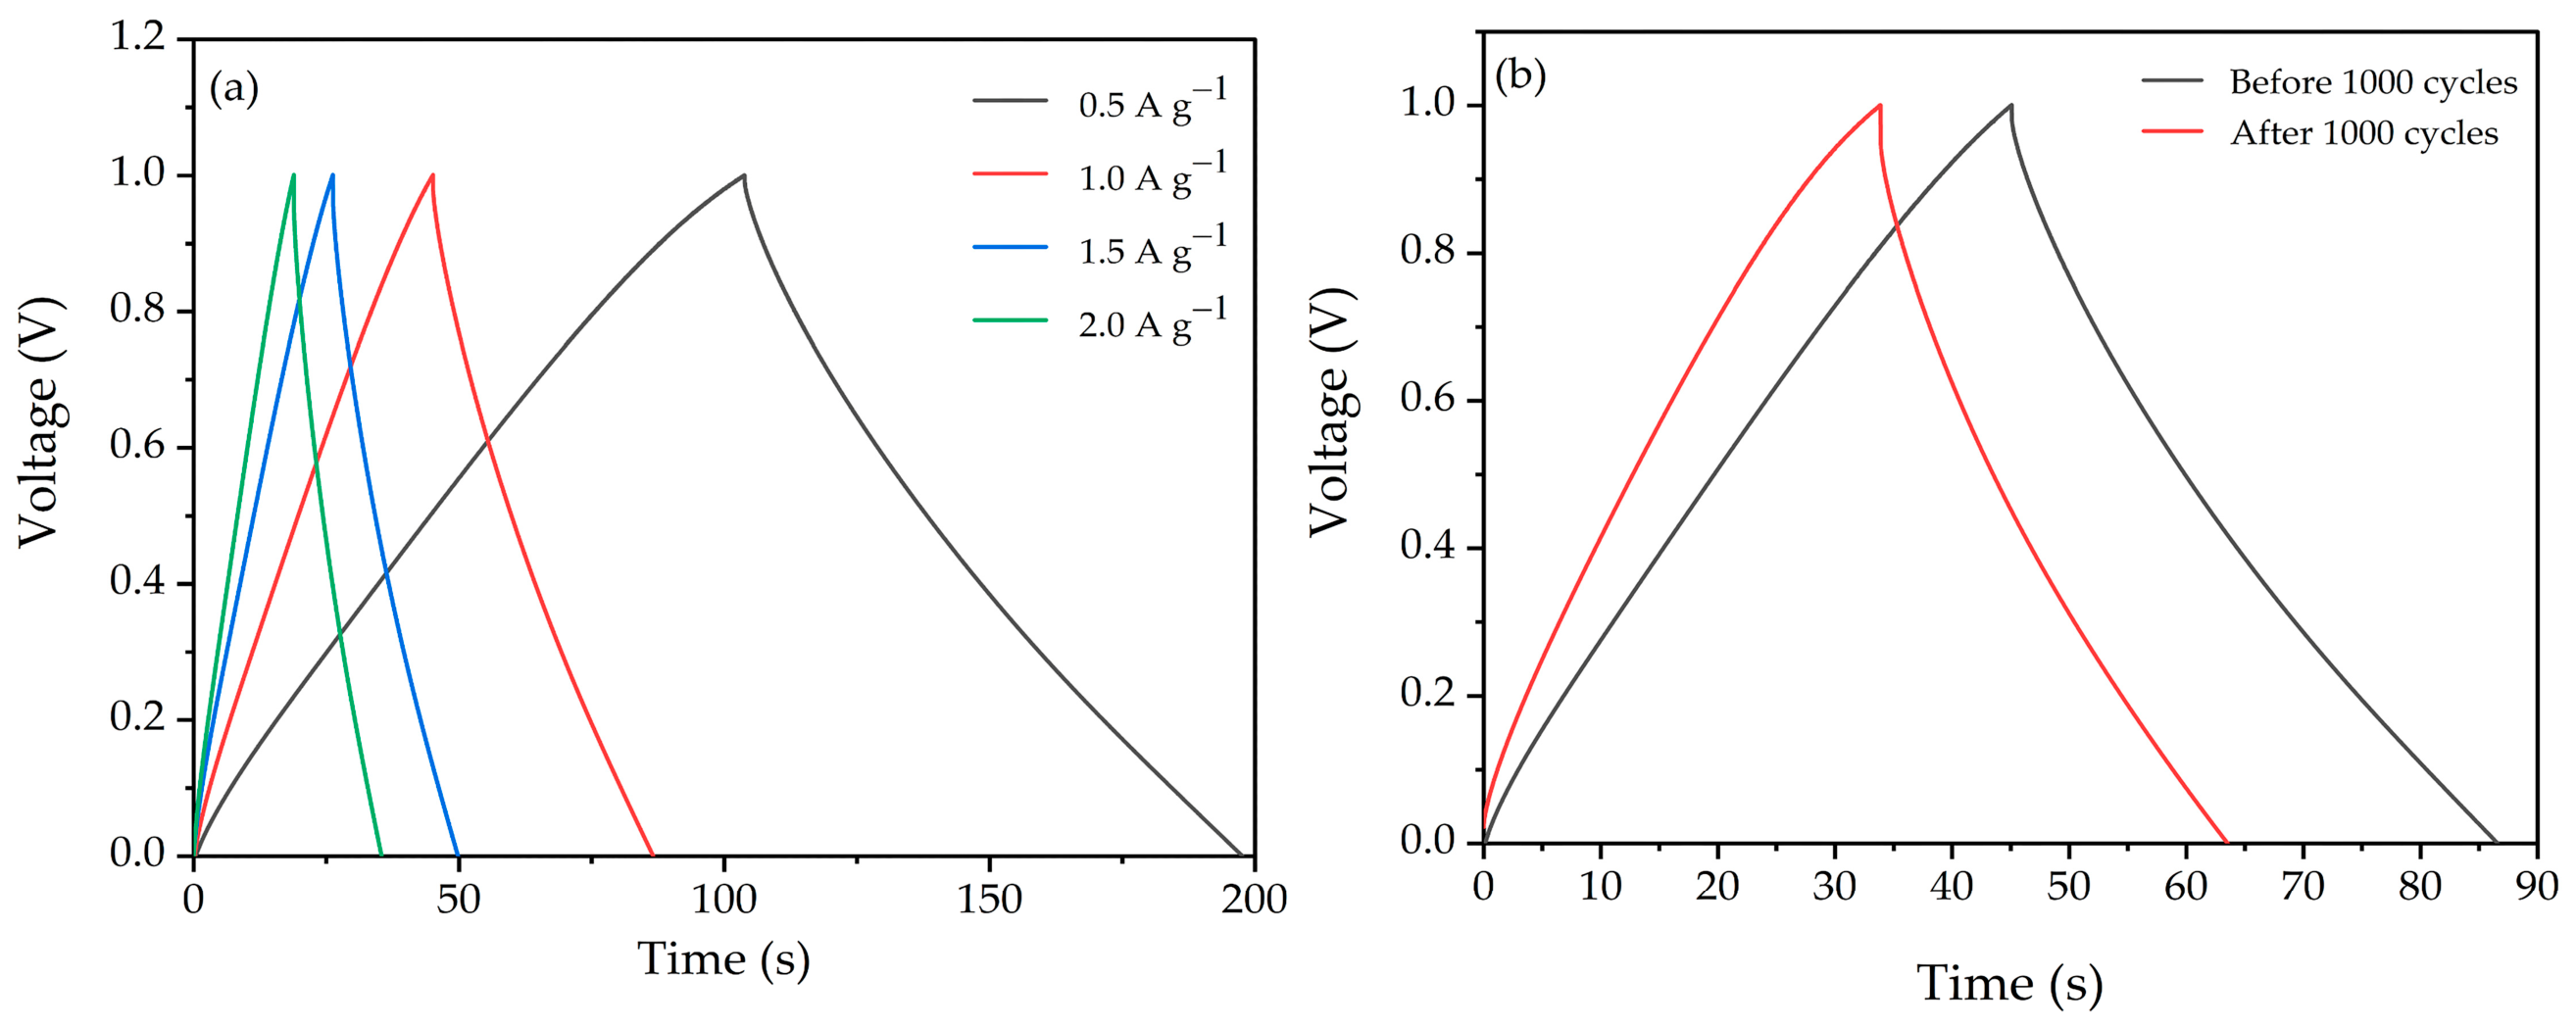
CVs were recorded at a scan rate of 10 mV s−1 over a potential window of 0 V to +1.0 V. EIS measurements were conducted in the 0.1–100 kHz range to assess the impedance characteristics of the supercapacitor cells. GCD cycles were performed to evaluate charge–discharge behavior in a cut-off voltage of 1 V at different current densities, 0.5, 1.0, 1.5, and 2.0 A g−1. To investigate the cycle stability of the cells, 1000 CV cycles were conducted at a scan rate of 200 mV s−1. Then, EIS and GCD measurements were taken before and after the 1000 CV cycles to quantify any performance degradation.

2.4. Characterization of the Samples

The prepared samples were characterized using powder X-ray diffraction (p-XRD) conducted on a Rigaku Ultima IV X-ray powder diffractometer (Rigaku Corporation, Tokyo, Japan) equipped with a Cu anode and dual detectors (λ = 1.54 nm) operating at a tube voltage, current, and power of 40 kV, 30 mA, and 1.2 kW, respectively. And Scans were performed over a 2θ range of 3° to 80° at a scan rate of 2° min−1. Fourier transform infrared spectroscopy in its attenuated total reflection mode (FT-IR, ATR) was performed using a Bruker Alpha FT-IR spectrometer (Bruker Optics GmbH & Co. KG, Ettlingen, Germany) within the range of 500–4000 cm−1, with thin films prepared by spraying the respective mixture onto titanium plates. Raman spectra were recorded on powdered samples using a Renishaw Invia Reflex Raman microscopy (Renishaw plc, Gloucestershire, UK) system with 514 nm excitation, covering the wavenumber range of 300–3500 cm−1. The microstructural morphology of the electrode surface was analyzed using a scanning electron microscope (SEM) (ZEISS EVO LS15, Carl Zeiss Microscopy GmbH, Jena, Germany) at different magnifications with a fixed tube voltage of 20 kV, capturing high-resolution micrographs. DC conductivity measurements were conducted on thin films prepared on non-conducting glass plates (2.5 cm × 2.5 cm) using the four-probe meter of the VK-PA-25 PV (SPD laboratory, Shizuoka, Japan) Power Analyzer. Several measurements were taken at different points on the electrode, and the average values were obtained.

3. Results and Discussion

3.1. Characterization of AC, Sugar, and Its Pyrolyzed Products

The X-ray diffraction (XRD) pattern of the prepared AC is shown in Figure 1a, showing broad diffraction bands characteristic of an amorphous carbon structure. The prominent peaks at 2θ = 23.5° and 43.7° correspond to the (002) and (100) planes, respectively, by the standard AC pattern (JCPDS 75-1621), yielding d-spacing values of 3.80 Å and 2.10 Å. Under optimized conditions involving sugar incorporation with AC, the d-spacing values decreased to 3.59 Å and 2.08 Å for the (002) and (100) planes, respectively. This reduction in interplanar spacing indicates an increase in graphitic ordering, which is expected to enhance electrical conductivity by facilitating more efficient electron transport within the electrode [42].
According to the Raman spectrum in Figure 1b, two primary bands spanning the range of 500 cm−1 to 3000 cm−1 are prominent in the AC powder. The band centered at 1367 cm−1 is attributed to the disordered defect (D) band, while the band centered at 1617 cm−1 corresponds to the graphitic (G) band arising from the E2g vibrational mode of the C-C bond stretching, respectively. The ID/IG ratio of 0.98 for the AC sample indicates a significant degree of disorder. In comparison, the reported ID/IG ratios of reduced graphene oxide (r-GO), N-doped graphene (N-Gr), and Fe and N-doped graphene (FeN-Gr) are 1.08, 1.02, and 1.16, respectively [43]. The lower ID/IG ratio of the AC sample, corresponding to 96% of the defect density of N-doped graphene, suggests a slightly lower defect density compared to these graphene derivatives. This difference can be attributed to the distinct structural characteristics and synthesis conditions of AC versus graphene-based materials. AC typically possesses a more amorphous, porous structure with a higher proportion of sp2-hybridized carbon domains, resulting in a relatively ordered graphitic framework despite the presence of defects [44]. The FT-IR spectrum of AC illustrated in Figure 1c reveals the presence of typical vibrations related to C=C and C-H bonds, along with additional oxygenated functional groups such as -OH, C=O, and C-O-C, including adsorbed CO2 as indicated within the spectrum. These additional functional groups are attributed to oxidized sites present on the surface of AC during heat treatment, which result in increased defect density.
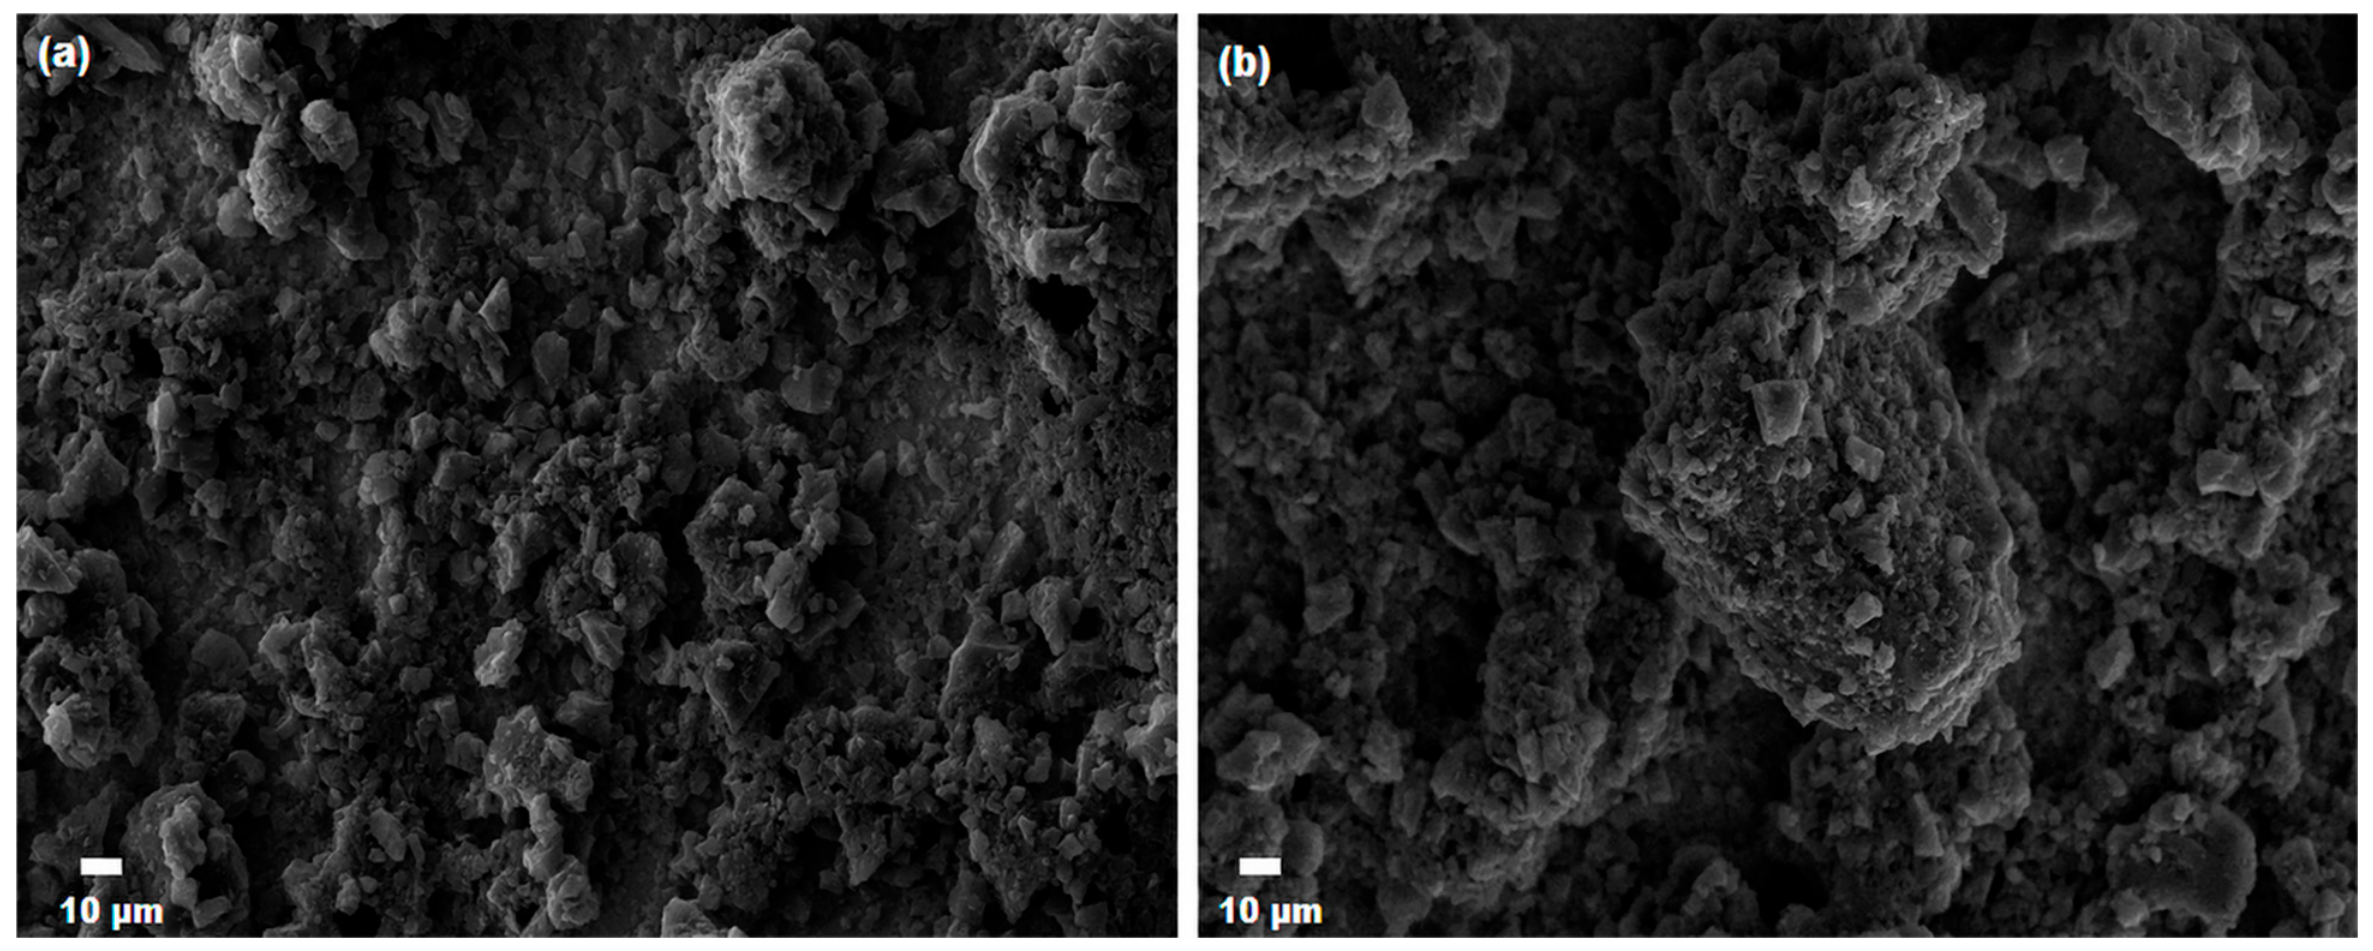
As shown in Figure 2a, the rough, irregular surface with a more clustered and uneven distribution of AC particles. The lack of sugar treatment results in a less defined porous structure, with smaller, densely packed aggregates. But Figure 2b shows a slightly smoother and more open texture, suggesting that sugar treatment may have influenced the particle arrangement. The morphological differences are limited to the observable surface texture: Figure 2a shows a rough, irregular surface with densely packed AC aggregates, while Figure 2b exhibits a slightly smoother and more open surface texture, consistent with improved particle coalescence mediated by the pyrolyzed sucrose matrix.
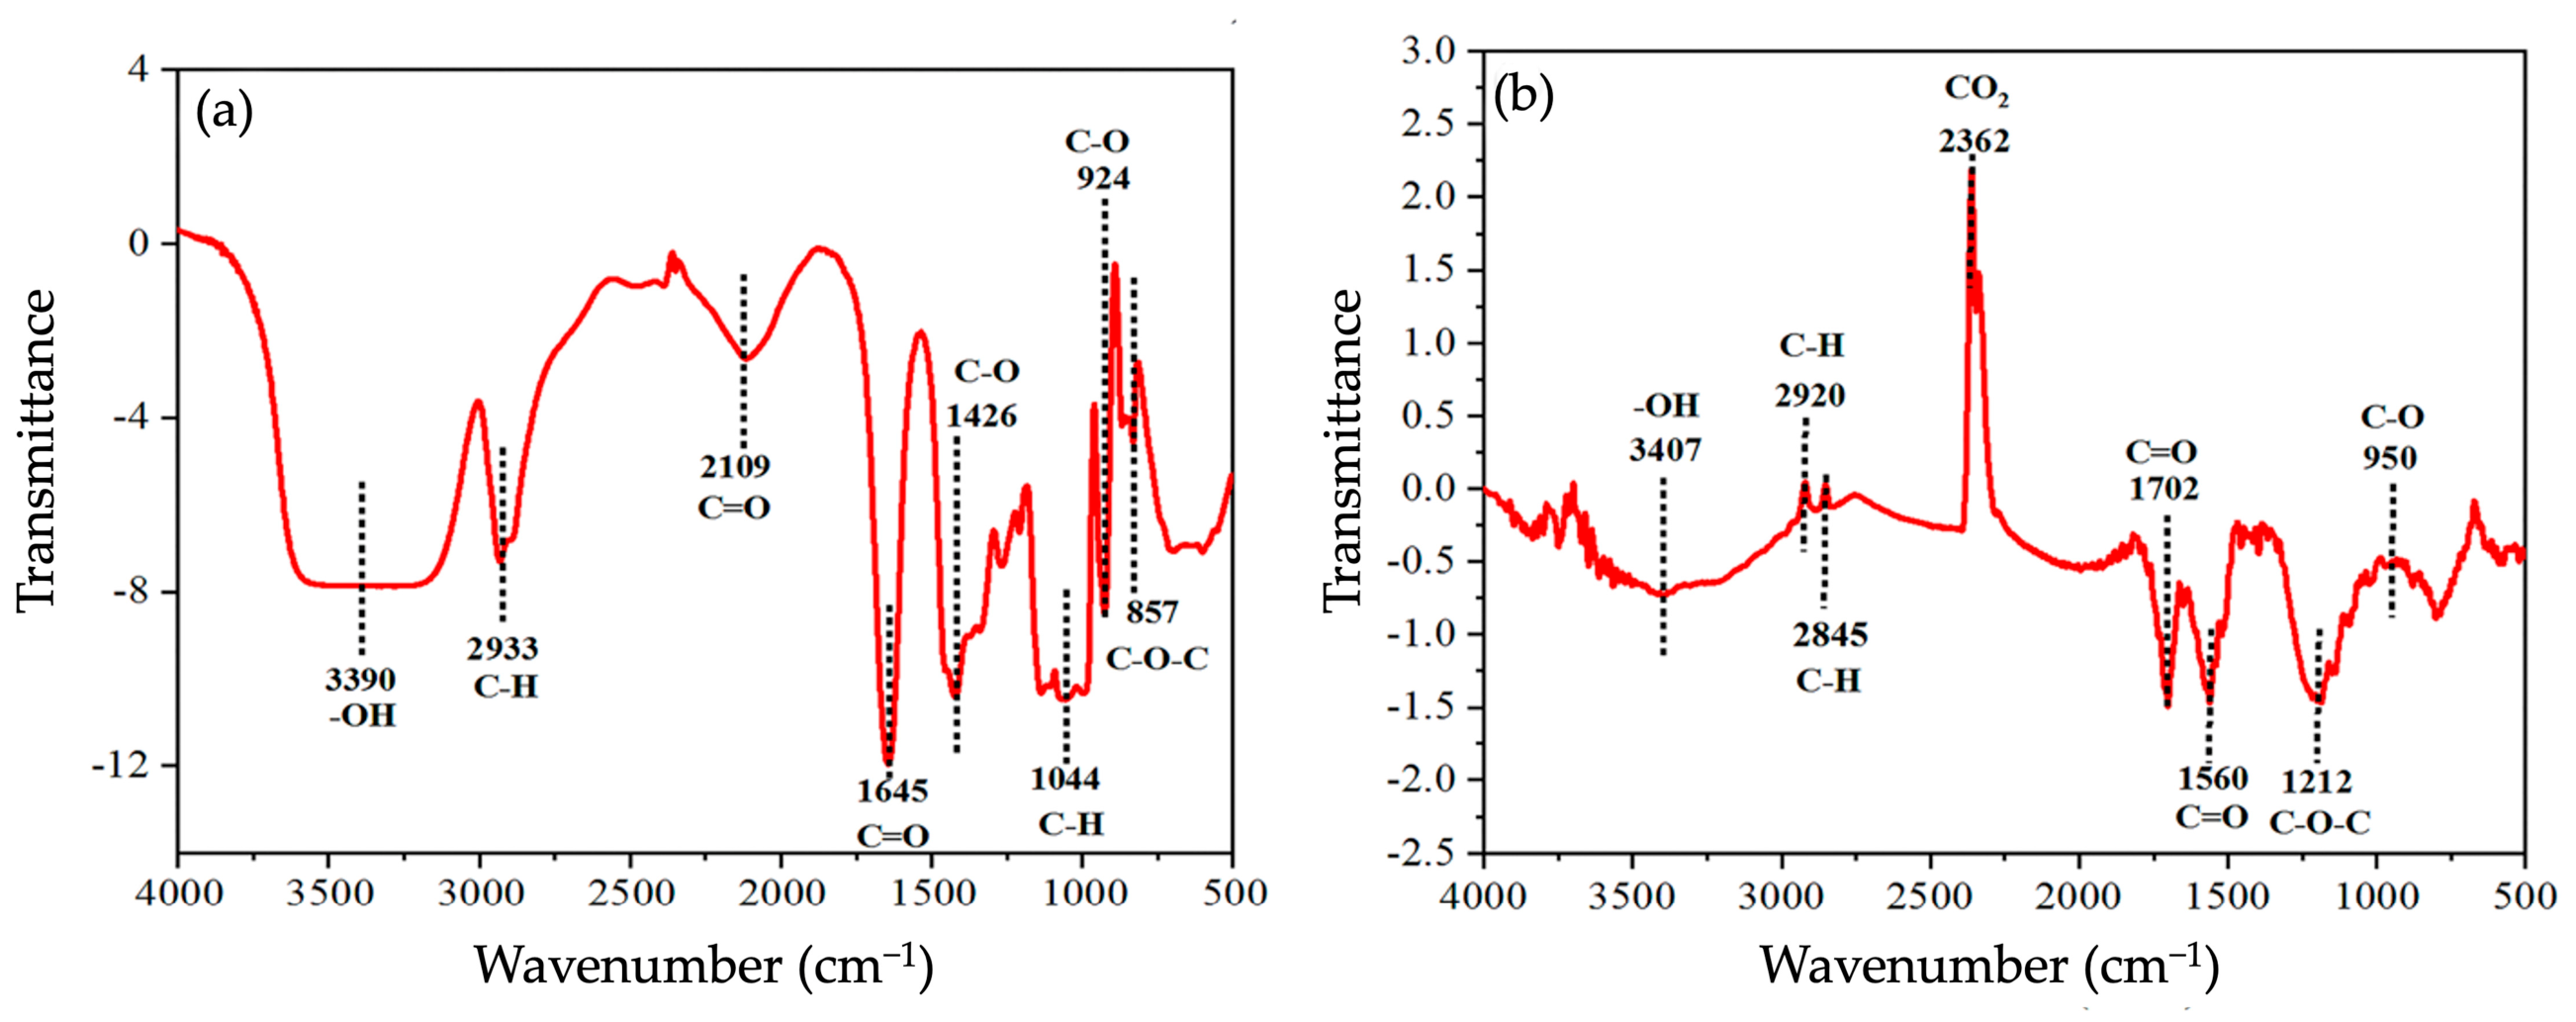
As illustrated in Figure 3a, the FT-IR spectrum of sugar powder exhibits characteristic bands centered at 3390 cm−1, indicative of the presence of hydroxyl (-OH) groups. Additional functional groups, including aliphatic C-H stretching (str.), carbonyl (C=O) stretching, carbonyl (C=O) bending, ether (C-O), aliphatic C-H bending, and ether (C-O-C) bending, manifest at 2933, 2109, 1645, 1426, 924, and 857 cm−1, respectively. The band positions of the thin film show distinct shifts compared to those of the sugar powder, attributed to the heat treatment during thin film fabrication, which promotes the formation of sp2 hybridized C=C bonds. Similarly, the thin film prepared under optimized conditions using sugar and AC exhibits comparable vibrational modes, with minor shifts in band positions, as shown in Figure 3b.
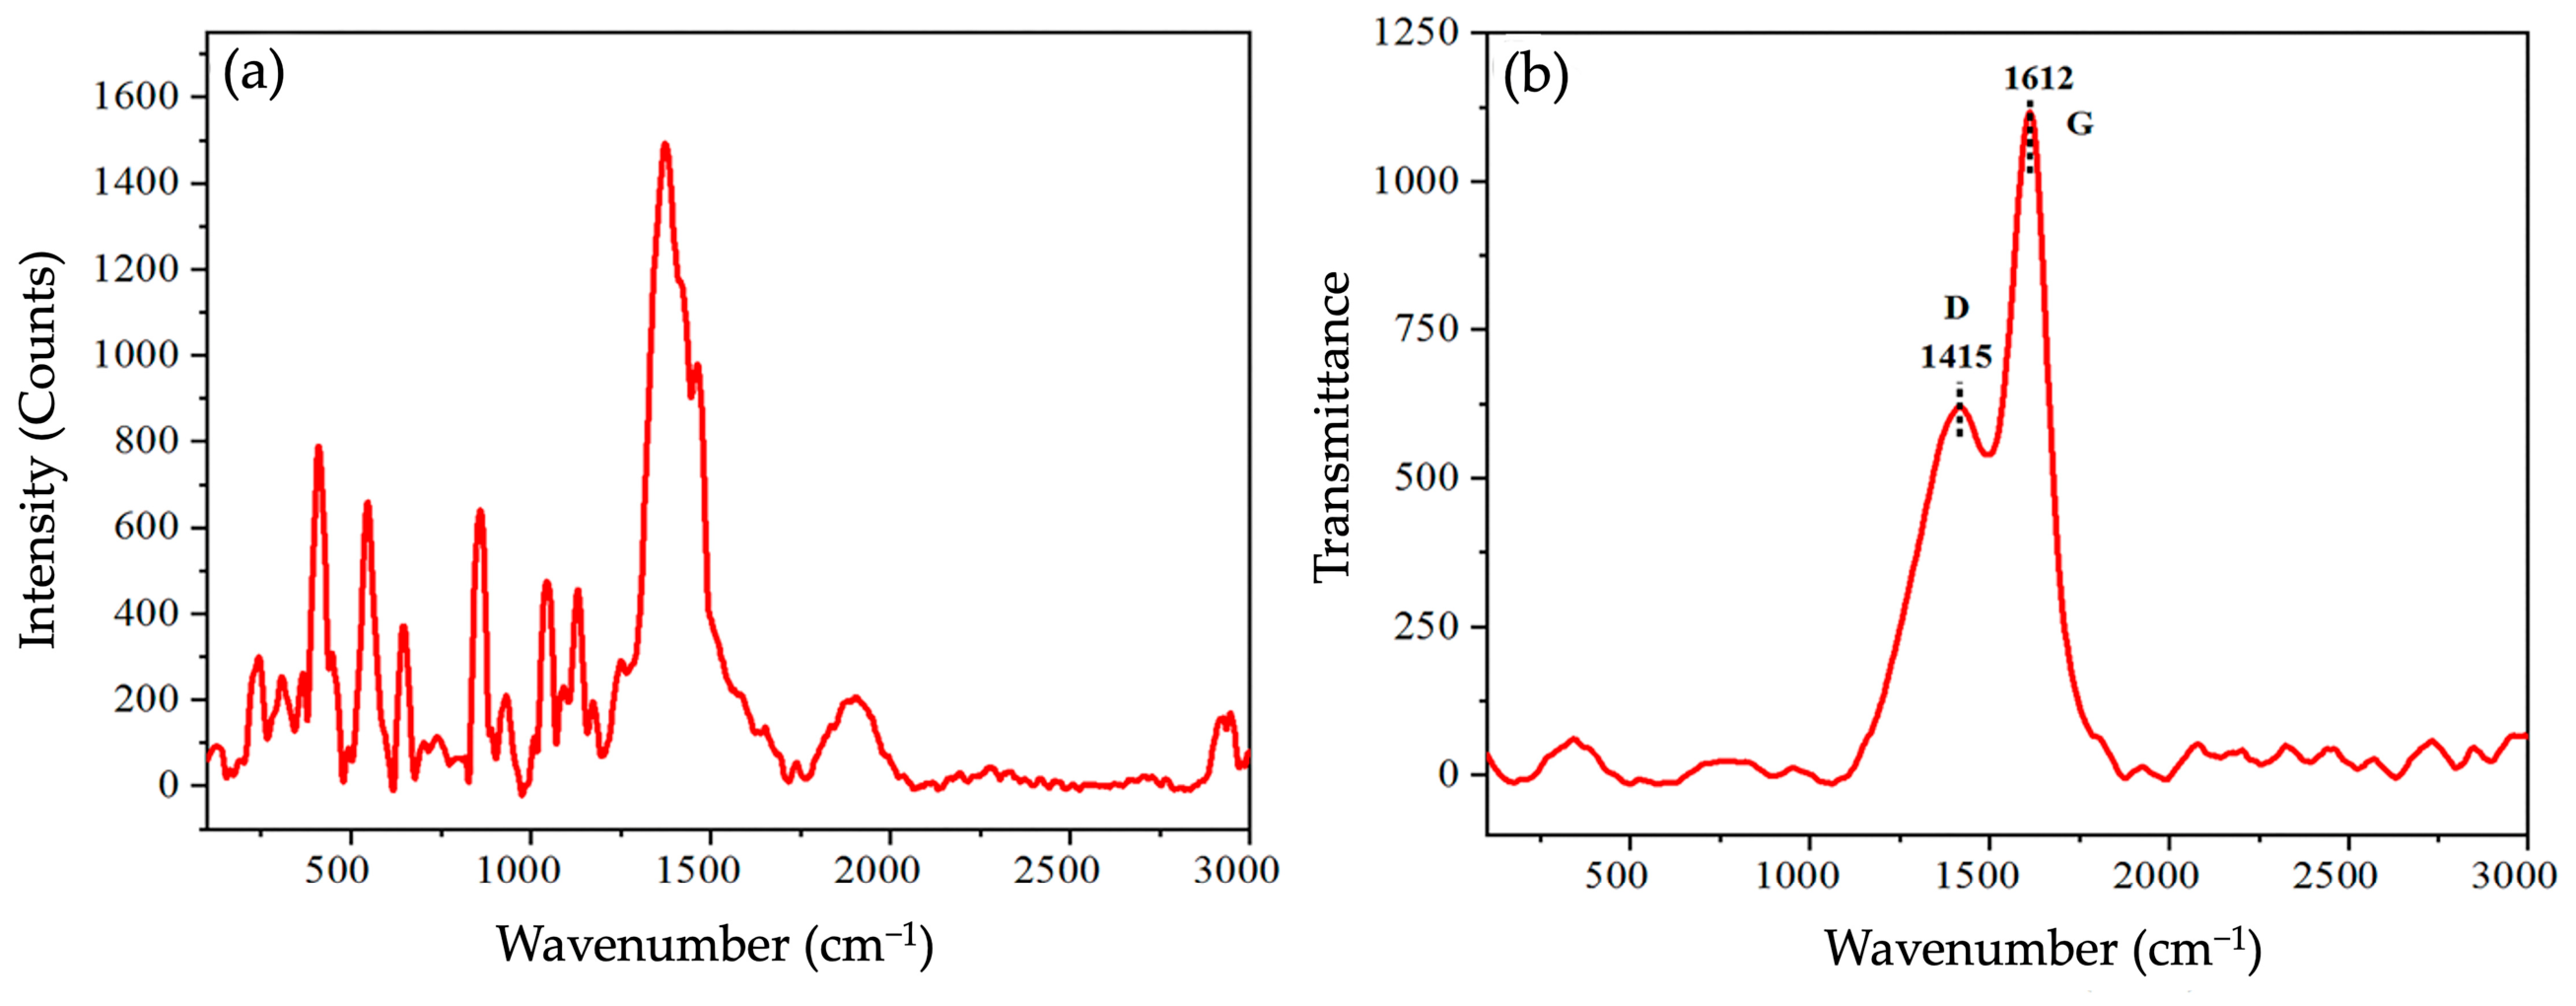
The Raman spectrum of sugar powder in Figure 4a corresponds with the FT-IR analysis and reflects characteristic bond vibrations. Thermal treatment during thin film fabrication transforms the sugar into a graphitic carbon structure. This phase transition is confirmed by the appearance of typical D and G bands in Figure 4b. The D band and G bands emerge at 1415 cm−1 and 1612 cm−1, respectively. The calculated ID/IG ratio of 0.55 suggests a graphitic structure with a low defect density. This result implies that combining sugar with AC creates an extended sp2 network. This network facilitates efficient electron transport and increases electrical conductivity. Within supercapacitor systems, higher conductivity decreases internal resistance and contributes to superior electrochemical stability [39].

3.2. Sheet Resistance of AC Samples Bonded by Sugar

Sheet resistance values for AC thin films vary based on synthesis technique, film thickness, and post-treatment methods. Typical values span a broad range from a few ohms per square to several hundred. In this study, the prepared AC thin film showed a sheet resistance of 345.87 Ω sq−1 and a resistivity of 3.61 × 10⁻⁴ Ω cm. These figures place the material within the semiconducting conductivity range [45].
Optimized composite exhibits reasonably good electrical conductivity in the semi-conducting regime, potentially attributed to the strong binding of graphitic carbon particles by the conductive carbon formed during the pyrolysis of the sugar binder. The optimized composition exhibited a sheet resistance of 171.24 Ω sq−1 and a resistivity of 1.92 × 10⁻⁴ Ω cm.

3.3. EDLC Characterization

3.3.1. Determination of Optimum Binder Percentage

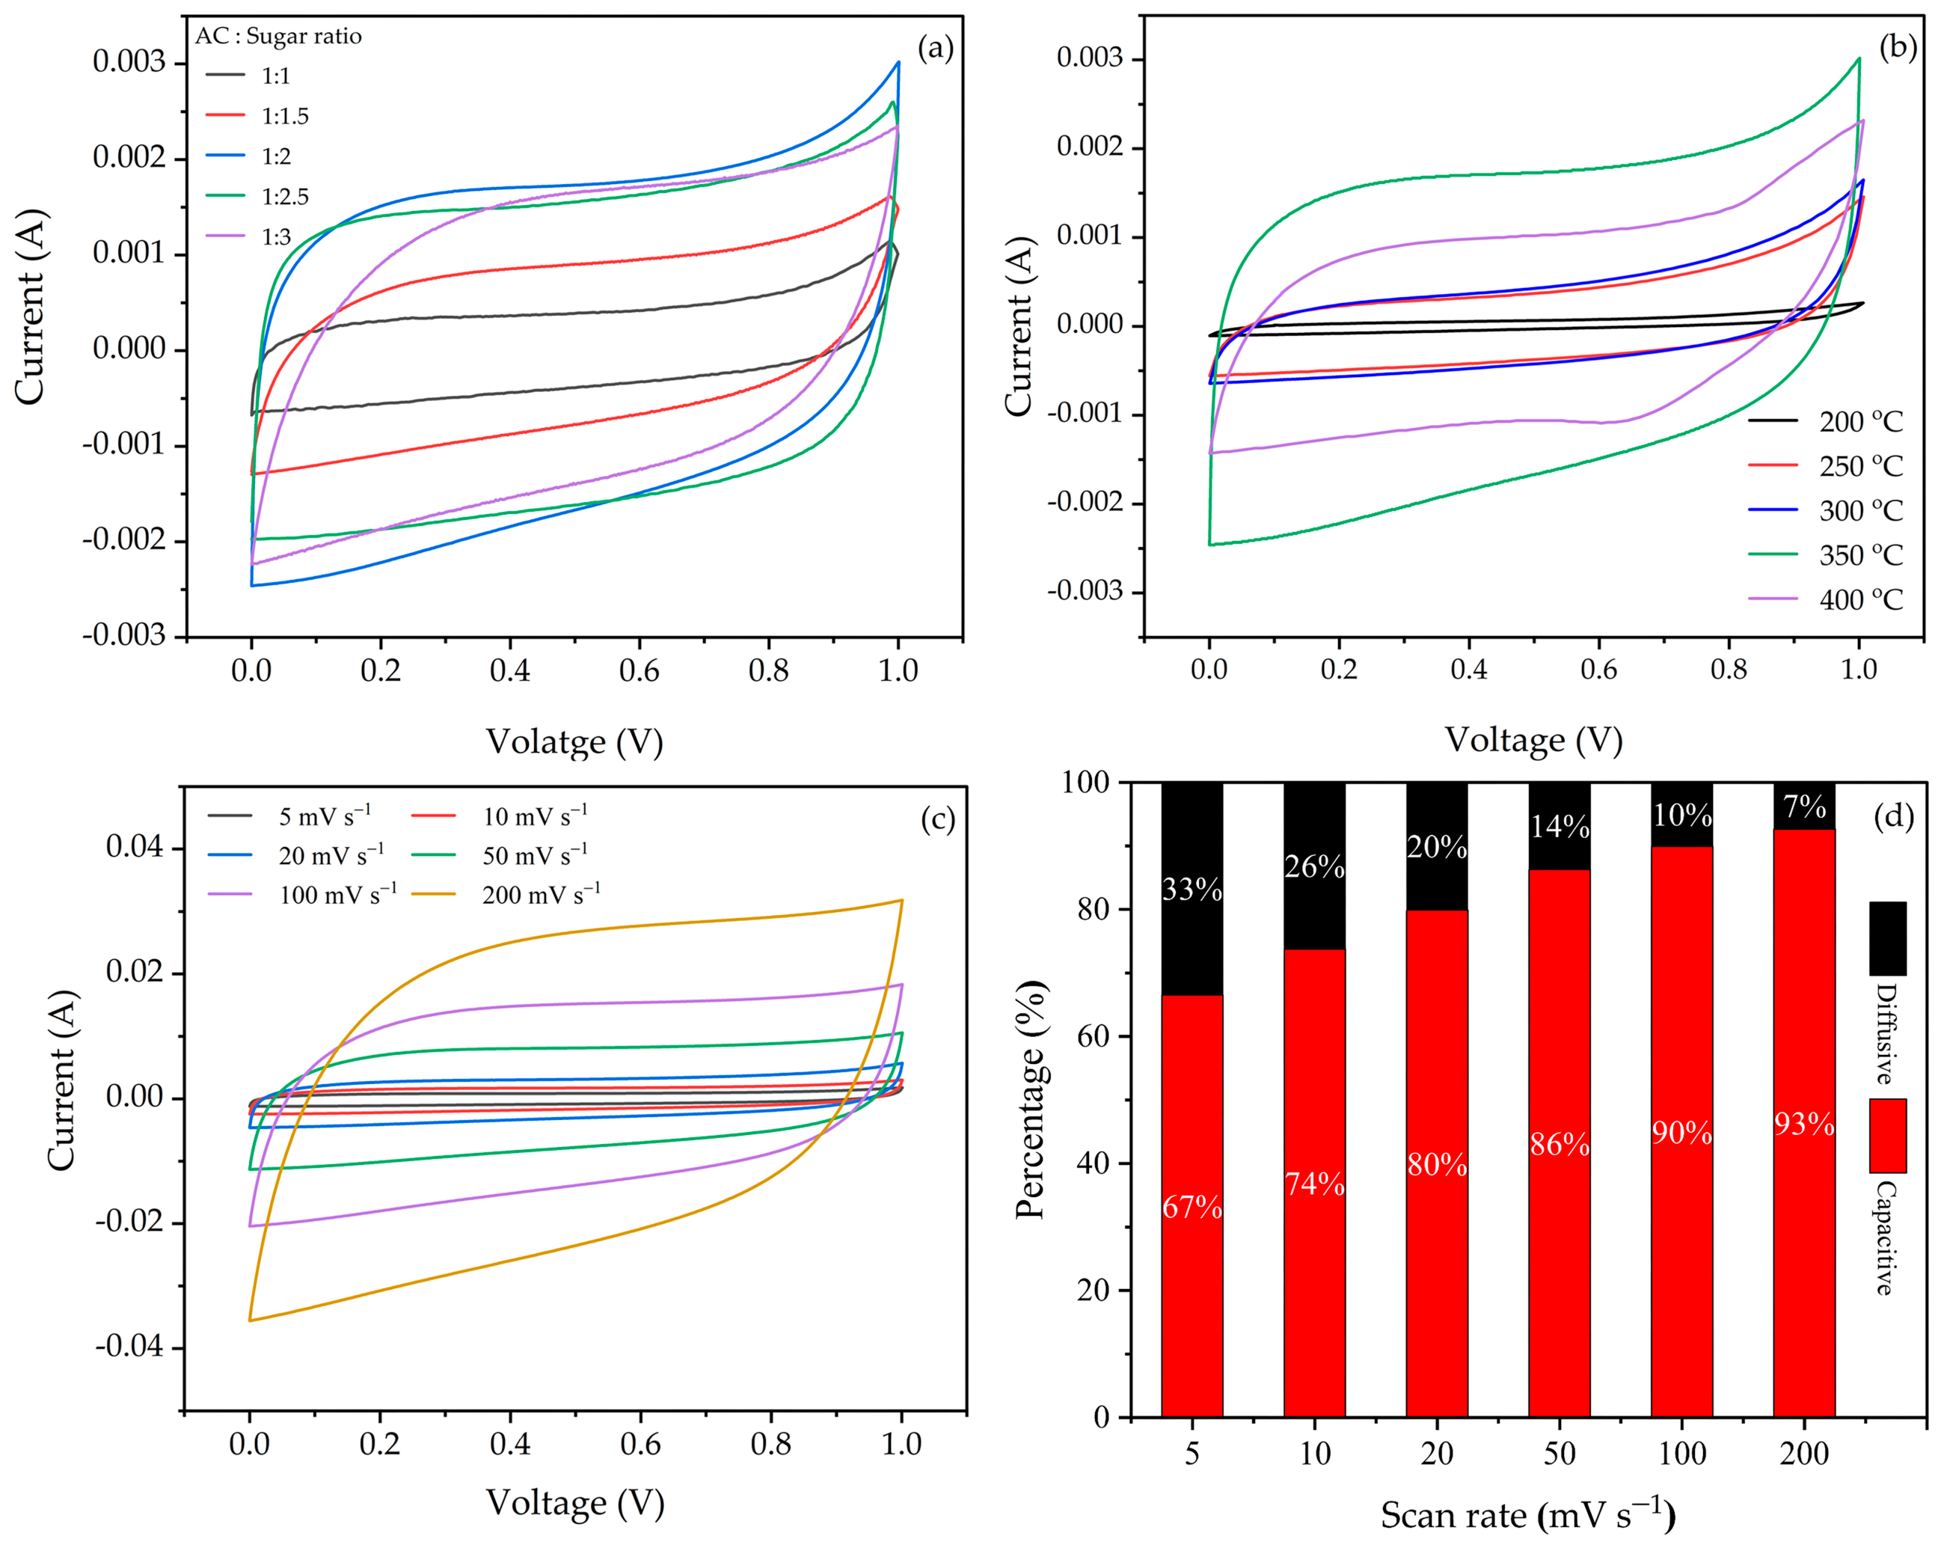
Figure 5a shows the CVs of the fabricated cell by varying the sugar binder percentage at the scan rate of 10 mV s−1. The respective values are given in Table 2. Interestingly, the Cs value increases from 1:1 to 1:2, beyond which it decreases. This is possibly due to two opposing effects on the capacitance caused by the impact of the binder on the conductivity and the active sites of the AC thin films used as supercapacitor electrodes. When the binder used is low, then the conductivity of the thin film suffers, and when it is high, the active site density of AC is reduced. The maximum Cs value of 74.35 F g−1 was obtained for the AC: sugar ratio of 1:2.

3.3.2. Finding the Optimum Sintering Temperature and Time

Figure 5b shows the CV for temperature variation for the optimized binder ratio fixed at 1:2, to assess the optimized sintering temperature. The CV curve at 350 °C is the widest and closest to a symmetric, quasi-rectangular shape, which indicates low internal resistance and efficient charge storage. Cs value from CV is proportional to the enclosed loop area; therefore, the 350 °C electrode, having the largest area at a given scan rate it delivers the highest Cs value of 74.35 F g−1. This sintering temperature optimizes the balance between conductivity, porosity, and surface chemistry, giving the largest effective electroactive surface area and fast charge–discharge process. At low sintering temperatures (200–250 °C), incomplete crystallization, residual organics, and poor particle connectivity limit electronic conductivity and reduce the accessible surface area, giving smaller CV diagrams and lower Cs values. At 400 °C and above, pore collapse and loss of surface functional groups reduce the number of active sites and ion-accessible pores, resulting in a decrease in the performance.

3.3.3. Electrochemical Characterization of Optimized EDLC

As a result of the optimized AC: Sucrose mass ratio of 1:2 and the optimum sintering temperature of 350 °C, the fabricated electrodes were evaluated by CV at scan rates of 5, 10, 20, 50, 100, and 200 mV s−1. As shown in Figure 5c, the CV exhibits characteristic quasi-rectangular shapes across all scan rates from 5 mV s−1 to 200 mV s−1, demonstrating excellent electrochemical performance and EDLC behavior. The data analysis summarized in Table 3 reveals that the behavior of the EDLC remains consistent even at higher scan rates. This indicates that the EDLC exhibits good stability under high scan rate conditions. The maximum Cs of 75.73 F g−1 was achieved at a scan rate of 5 mV s−1.
According to Figure 5d, the capacitive component rises from 67% at 5 mV s−1 to 93% at 200 mV s−1, while the diffusive component drops from 33% at 5 mV s−1 to 7% at 200 mV s−1. The decrease in the diffusive component with increasing scan rate can be attributed to the limited time available for ion diffusion into the electrode material’s porous structure. But with the lower scan rates, ions have enough time to penetrate completely into the micropores and mesopores of the AC, contributing to the diffusion-controlled Faradaic process [46]. However, as the scan rate increases, the rapid voltage sweep limits the time for ion transport, restricting diffusion to the outer surface where capacitive charge storage dominates. This shift highlights the electrode’s ability to favor surface-controlled capacitive behavior at higher scan rates, a characteristic of efficient EDLC performance.
Figure 6 shows the GCD curves of the optimized EDLC at different current densities. The device shows a stable isosceles triangle shape even at high current densities, which again confirms an excellent capacitive behavior and absence of Faradaic processes. From the calculation of GCD curves, the Cs of the EDLC is 41.06 F g−1, which drops to 29.45 F g−1 at 1000 cycles. The ESR values extracted from the GCD profiles increased from 3 Ω to 6 Ω after 1000 cycles, a moderate rise characteristic of laboratory scale AC based EDLCs that remains within the acceptable range, confirming adequate ionic transport and interfacial integrity. These values align with those derived from EIS, validating the consistency of both characterization techniques. It is interesting to note that the supercapacitive behavior remains even after 1000 cycles of scan cycles, indicating the high stability of the device.
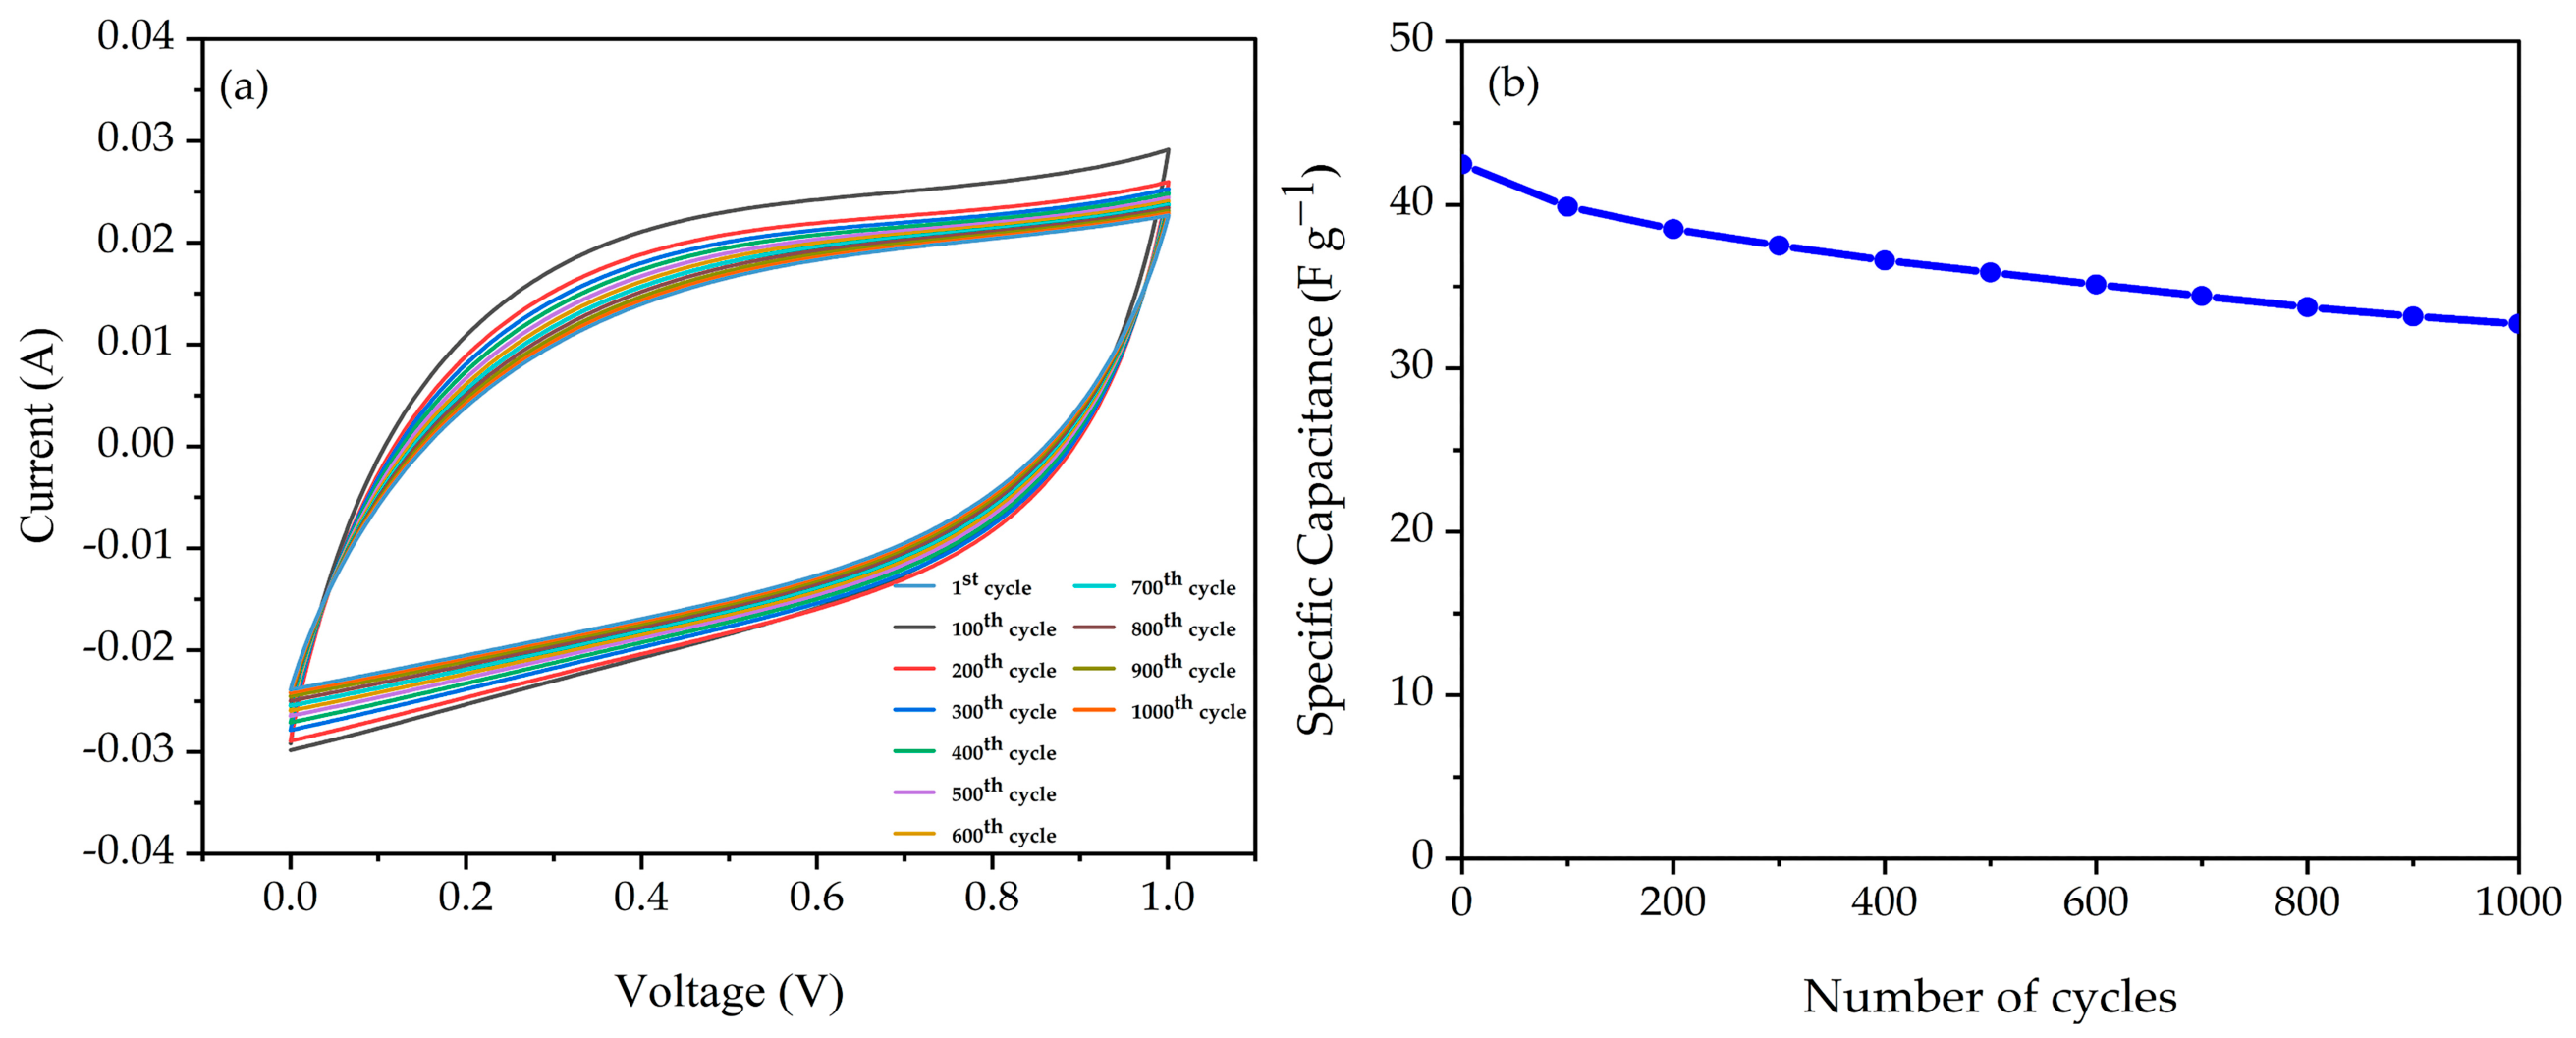
The long-term electrochemical stability of the fabricated EDLC was evaluated through CV measurements recorded at selected cycle intervals, as presented in Figure 7a. The CV profiles retain their near-rectangular geometry throughout the extended cycling process, with only marginal distortions observed even at higher cycle numbers. This persistent rectangular shape is characteristic of ideal electric double-layer capacitive behavior and reflects a high degree of electrochemical reversibility within the system. Nevertheless, a subtle yet progressive contraction in the enclosed area of the CV curves is discernible with increasing cycle number, indicative of a gradual decay in Cs.
The corresponding evolution of Cs as a function of cycle number is shows in Figure 7b. A steady, monotonic decline in Cs is observed over the course of 1000 cycles. This gradual degradation may originate from several contributing mechanisms, including partial blockage of electrolyte-accessible pores, incremental deterioration of the electrode electrolyte interface, or subtle structural rearrangements within the active material induced by prolonged electrochemical stress. Quantitatively, the Cs decreased from an initial value of 42.47 F g−1 to 32.72 F g−1 after 1000 CV cycles, corresponding to a capacitance retention of approximately 77%. This level of retention demonstrates reasonably robust cycling stability and affirms the structural resilience of the electrode material under repetitive charge discharge conditions.
Collectively, these findings establish that the fabricated EDLC maintains stable electrochemical performance over extended operation, with well-preserved charge storage characteristics. The demonstrated cycling durability, combined with consistent capacitive behavior, underscores the practical viability of the electrode material for integration into sustainable and long-lasting energy storage devices.
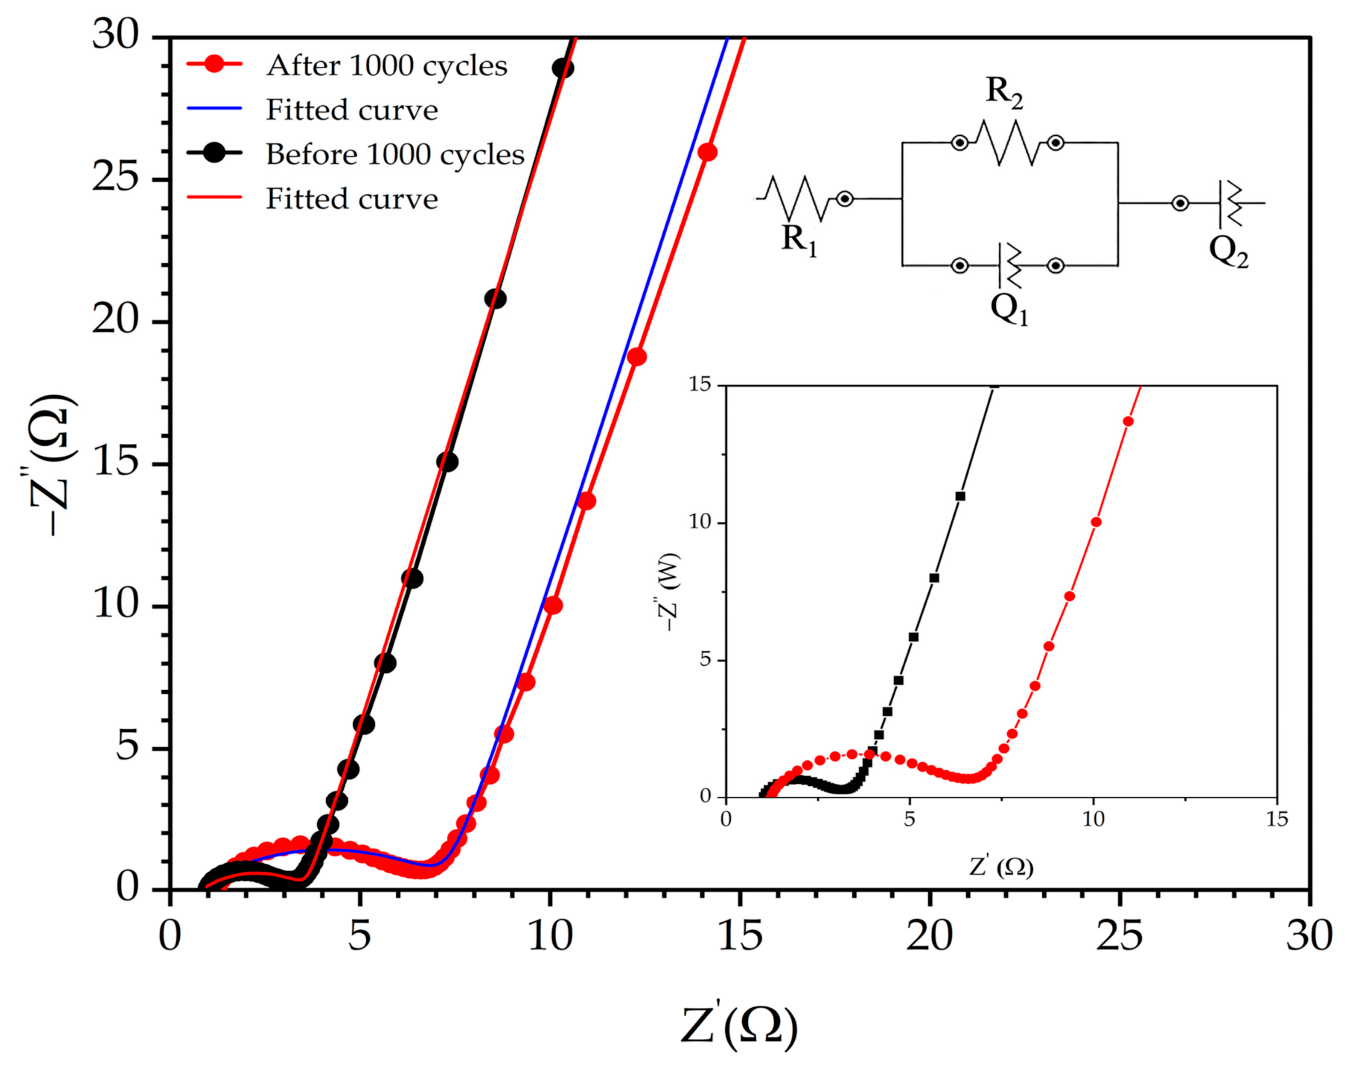
EIS was conducted over 0.1 Hz to 100 kHz to evaluate internal resistance and ion-transport behavior of the optimized EDLC before and after 1000 cyclic voltammetry cycles. Figure 8, the Nyquist plots, together with the fitted curves from the equivalent circuit model, showed excellent agreement across the measured frequency range, confirming that the selected circuit adequately describes the device response.
Before cycling, the spectrum exhibited a small semicircle at high frequency and a near-vertical low-frequency line, indicating low interfacial resistance and predominantly electric double-layer capacitance. After 1000 cycles of scanning, the overall shape remained unchanged, suggesting that the device retained its capacitive behavior. However, the fitted parameters (Table 4) revealed measurable degradation: the series resistance R1 increased slightly from 1.04 Ω to 1.22 Ω, indicating that the ohmic contribution of the electrolyte, current collector, and contact interfaces remained largely stable. In contrast, the charge-transfer-related resistance R2 increased from 2.15 Ω to 5.33 Ω, reflecting slower ion adsorption/desorption kinetics, likely due to partial micropore blockage and interfacial aging [47].
The constant phase element Q1 increased modestly from 1.45 × 10⁻⁴ to 1.87 × 10⁻⁴ F sn−1, suggesting minor redistribution of interfacial capacitance. Meanwhile, Q2 decreased from 0.13 to 0.10 F sn−1, corresponding to a reduction in low-frequency capacitive response. This trend is consistent with the observed decline in total cell capacitance from 0.219 F to 0.186 F and agrees well with the cycling-retention results from the CV study. Overall, the use of sucrose as a binder contributes to a mechanically robust and well-adhered activated carbon network on the current collector, which helps preserve electrode integrity and maintain stable ionic pathways during repeated cycling.

4. Conclusions

The fabrication of natural material-based electrodes for EDLCs, as demonstrated in this study, highlights the potential of sustainable resources for producing cost-effective and environmentally friendly energy storage devices. The fabricated EDLC with an AC sucrose ratio of 1:2 annealed at 350 °C for 20 min showed a maximum Cs value of 74.35 F g−1 at a scan rate of 10 mV s−1, which is a promising result comparable to those achieved with AC bound by synthetic polymers such as poly(vinyl pyrrolidone). Cyclic voltammetry analysis indicated predominant capacitive behavior with minimal diffusive contribution, and 77% capacitance retention after 1000 cycles confirmed good electrochemical stability. The findings of this study highlight the effectiveness of sucrose as a natural binder and emphasize the potential of biomass-derived AC–sucrose composites as high-performance electrode materials while minimizing the environmental impact, thereby supporting the broader shift toward green technologies in energy storage applications.

Author Contributions

Conceptualization, G.R.A.K.; Methodology, P.M.K., D.S.G., A.T.M., M.I.U.W., S.P.J., A.M.R. and S.B.D.; Validation, P.M.K., D.S.G., A.T.M., R.M.G.R., K.T., U.D., W.J.B., M.Y. and G.R.A.K.; Formal analysis, P.M.K., D.S.G., A.T.M., M.I.U.W., S.P.J., A.M.R. and S.B.D.; Investigation, P.M.K., D.S.G. and A.T.M.; Data curation, P.M.K., D.S.G. and A.T.M.; Writing—original draft, P.M.K., D.S.G. and A.T.M.; Writing—review and editing, R.M.G.R., K.T., U.D., W.J.B., M.Y. and G.R.A.K.; Visualization, R.M.G.R., K.T., U.D., M.Y. and G.R.A.K.; Supervision, G.R.A.K.; Project administration, G.R.A.K. All authors have read and agreed to the published version of the manuscript.

Funding

The APC was funded by the Research Center for the Smart Energy Technologies, Toyota Technological Institute, Japan.

Data Availability Statement

The original contributions presented in this study are included in the article. Further inquiries can be directed to the corresponding author.

Acknowledgments

This study was partially supported by the Research Center for the Smart Energy Technologies, Toyota Technological Institute, Japan.

Conflicts of Interest

The authors declare that they have no known competing financial interests or personal relationships that could have appeared to influence the work reported in this paper.

References

  1. Gu, Y.; Du, W.; Liu, X.; Gao, R.; Liu, Y.; Ma, H.; Xu, J.; Wei, S. Matching design of high-performance electrode materials with different energy-storage mechanism suitable for flexible hybrid supercapacitors. J. Alloys Compd. 2020, 844, 156196. [Google Scholar] [CrossRef] [Scilit]
  2. Yu, K.; Pan, X.; Zhang, G.; Liao, X.; Zhou, X.; Yan, M.; Xu, L.; Mai, L. Nanowires in Energy Storage Devices: Structures, Synthesis, and Applications. Adv. Energy Mater. 2018, 8, 1802369. [Google Scholar] [CrossRef] [Scilit]
  3. Li, Y.; Yang, W.; Han, L.; Li, H.; Wen, Z.; Li, Y.; Wang, X.; Sun, H.; Lu, T.; Xu, M.; et al. Recent progress and perspective of multifunctional integrated zinc-ion supercapacitors. Energy Mater. 2022, 2, 200018. [Google Scholar] [CrossRef] [Scilit]
  4. Bhattacharjya, D.; Yu, J.S. Activated carbon made from cow dung as electrode material for electrochemical double layer capacitor. J. Power Sources 2014, 262, 224–231. [Google Scholar] [CrossRef] [Scilit]
  5. Saini, P. A Historical Review of Electrode Materials and Electrolytes for Electrochemical Double Layer Supercapacitors and Pseudocapacitors. Indian J. Pure Appl. Phys. 2023, 61, 268–290. [Google Scholar] [CrossRef] [Scilit]
  6. Patel, K.K.; Singhal, T.; Pandey, V.; Sumangala, T.P.; Sreekanth, M.S. Evolution and recent developments of high performance electrode material for supercapacitors: A review. J. Energy Storage 2021, 44, 103366. [Google Scholar] [CrossRef] [Scilit]
  7. Zhong, C.; Deng, Y.; Hu, W.; Qiao, J.; Zhang, L.; Zhang, J. A review of electrolyte materials and compositions for electrochemical supercapacitors. Chem. Soc. Rev. 2015, 44, 7484–7539. [Google Scholar] [CrossRef] [Scilit] [PubMed]
  8. Simon, P.; Gogotsi, Y. Capacitive Energy Storage in Nanostructured Carbon–Electrolyte Systems. Acc. Chem. Res. 2013, 46, 1094–1103. [Google Scholar] [CrossRef] [Scilit] [PubMed]
  9. Pal, B.; Yang, S.; Ramesh, S.; Thangadurai, V.; Jose, R. Electrolyte selection for supercapacitive devices: A critical review. Nanoscale Adv. 2019, 1, 3807–3835. [Google Scholar] [CrossRef] [Scilit] [PubMed]
  10. Béguin, F.; Presser, V.; Balducci, A.; Frackowiak, E. Carbons and Electrolytes for Advanced Supercapacitors. Adv. Mater. 2014, 26, 2219–2251. [Google Scholar] [CrossRef] [Scilit] [PubMed]
  11. Schütter, C.; Pohlmann, S.; Balducci, A. Industrial Requirements of Materials for Electrical Double Layer Capacitors: Impact on Current and Future Applications. Adv. Energy Mater. 2019, 9, 1900334. [Google Scholar] [CrossRef] [Scilit]
  12. Joseph, A.; Mathew, A.; Perikkathra, S.; Thomas, T. Recent advances in and perspectives on binder materials for supercapacitors—A review. Eur. Polym. J. 2024, 210, 112941. [Google Scholar] [CrossRef] [Scilit]
  13. Li, X.; Chen, Y.; Huang, H.; Mai, Y.W.; Zhou, L. Electrospun carbon-based nanostructured electrodes for advanced energy storage—A review. Energy Storage Mater. 2016, 5, 58–92. [Google Scholar] [CrossRef] [Scilit]
  14. Dubey, R.; Guruviah, V. Review of carbon-based electrode materials for supercapacitor energy storage. Ionics 2019, 25, 1419–1445. [Google Scholar] [CrossRef] [Scilit]
  15. Jian, X.; Liu, S.; Gao, Y.; Tian, W.; Jiang, Z.; Xiao, X.; Tang, H.; Yin, L. Carbon-Based Electrode Materials for Supercapacitor: Progress, Challenges and Prospective Solutions. J. Electr. Eng. 2016, 4, 75–87. [Google Scholar] [CrossRef] [Scilit]
  16. Zhu, S.; Ni, J.; Li, Y. Carbon nanotube-based electrodes for flexible supercapacitors. Nano Res. 2020, 13, 1825–1841. [Google Scholar] [CrossRef] [Scilit]
  17. Lyu, L.; Seong, K.-D.; Ko, D.; Choi, J.; Lee, C.; Hwang, T.; Cho, Y.; Jin, X.; Zhang, W.; Pang, H.; et al. Recent development of biomass-derived carbons and composites as electrode materials for supercapacitors. Mater. Chem. Front. 2019, 3, 2543–2570. [Google Scholar] [CrossRef] [Scilit]
  18. Murugadoss, G.; Rajaboopathi, M.; Rajesh Kumar, M.; Kamalan Kirubaharan, A.M. Biomass-Derived Carbon-Based Materials for Supercapacitor Applications. In Biomass-Derived Carbon Materials: Production and Applications; Wiley: Hoboken, NJ, USA, 2022; pp. 253–274. [Google Scholar] [CrossRef] [Scilit]
  19. Ke, Q.; Wang, J. Graphene-based materials for supercapacitor electrodes—A review. J. Mater. 2016, 2, 37–54. [Google Scholar] [CrossRef] [Scilit]
  20. Yan, J.; Liu, J.; Fan, Z.; Wei, T.; Zhang, L. High-performance supercapacitor electrodes based on highly corrugated graphene sheets. Carbon 2012, 50, 2179–2188. [Google Scholar] [CrossRef] [Scilit]
  21. Lemine, A.S.; Zagho, M.M.; Altahtamouni, T.M.; Bensalah, N. Graphene a promising electrode material for supercapacitors—A review. Int. J. Energy Res. 2018, 42, 4284–4300. [Google Scholar] [CrossRef] [Scilit]
  22. Madhushanka, P.M.H.; Karunadasa, K.S.P.; Gamage, D.J.D.S. Advancement of Graphite-Clay Composite Electrodes via Different Compositions to Improve the Synergetic Matrix Effect Towards General Electroanalytical and Energy Storage Applications. Adv. Energy Convers. Mater. 2024, 5, 281–307. [Google Scholar] [CrossRef] [Scilit]
  23. Gamage, D.J.D.S.; Karunadasa, K.S.P.; Madhushanka, P.M.H. A synergetic graphite-(Ce-montmorillonite) binary composite electrode contains cerium (IV) ions as a supportive electroactive mediator for improved electroanalytical and energy storage applications. Chem. Pap. 2025, 79, 8653–8678. [Google Scholar] [CrossRef] [Scilit]
  24. Dubey, P.; Shrivastav, V.; Maheshwari, P.H.; Sundriyal, S. Recent advances in biomass derived activated carbon electrodes for hybrid electrochemical capacitor applications: Challenges and opportunities. Carbon 2020, 170, 1–29. [Google Scholar] [CrossRef] [Scilit]
  25. Choi, J.Y.; Choi, J.H. A carbon electrode fabricated using a poly(vinylidene fluoride) binder controlled the Faradaic reaction of carbon powder. J. Ind. Eng. Chem. 2010, 16, 401–405. [Google Scholar] [CrossRef] [Scilit]
  26. Rajeevan, S.; John, S.; George, S.C. The effect of poly(vinylidene fluoride) binder on the electrochemical performance of graphitic electrodes. J. Energy Storage 2021, 39, 102654. [Google Scholar] [CrossRef] [Scilit]
  27. Salleh, N.A.; Kheawhom, S.; Ashrina AHamid, N.; Rahiman, W.; Mohamad, A.A. Electrode polymer binders for supercapacitor applications: A review. J. Mater. Res. Technol. 2023, 23, 3470–3491. [Google Scholar] [CrossRef] [Scilit]
  28. Varzi, A.; Passerini, S. Enabling high areal capacitance in electrochemical double layer capacitors by means of the environmentally friendly starch binder. J. Power Sources 2015, 300, 216–222. [Google Scholar] [CrossRef] [Scilit]
  29. Fang, B.; Binder, L. A novel carbon electrode material for highly improved EDLC performance. J. Phys. Chem. B 2006, 110, 7877–7882. [Google Scholar] [CrossRef] [Scilit] [PubMed]
  30. Bresser, D.; Buchholz, D.; Moretti, A.; Varzi, A.; Passerini, S. Alternative binders for sustainable electrochemical energy storage—The transition to aqueous electrode processing and bio-derived polymers. Energy Environ. Sci. 2018, 11, 3096–3127. [Google Scholar] [CrossRef] [Scilit]
  31. Ruschhaupt, P.; Varzi, A.; Passerini, S. Natural Polymers as Green Binders for High-Loading Supercapacitor Electrodes. ChemSusChem 2020, 13, 763–770. [Google Scholar] [CrossRef] [Scilit] [PubMed]
  32. Böckenfeld, N.; Jeong, S.S.; Winter, M.; Passerini, S.; Balducci, A. Natural, cheap and environmentally friendly binder for supercapacitors. J. Power Sources 2013, 221, 14–20. [Google Scholar] [CrossRef] [Scilit]
  33. Landi, G.; La Notte, L.; Palma, A.L.; Sorrentino, A.; Maglione, M.G.; Puglisi, G. A comparative evaluation of sustainable binders for environmentally friendly carbon-based supercapacitors. Nanomaterials 2022, 12, 46. [Google Scholar] [CrossRef] [Scilit] [PubMed]
  34. Nandy, S.; Goswami, S.; Marques, A.; Gaspar, D.; Grey, P.; Cunha, I.; Nunes, D.; Pimentel, A.; Igreja, R.; Barquinha, P.; et al. Cellulose: A Contribution for the Zero e-Waste Challenge. Adv. Mater. Technol. 2021, 6, 2000994. [Google Scholar] [CrossRef] [Scilit]
  35. Skorupska, M.; Kamedulski, P.; Lukaszewicz, J.P.; Ilnicka, A. The Improvement of Energy Storage Performance by Sucrose-Derived Carbon Foams via Incorporating Nitrogen Atoms. Nanomaterials 2021, 11, 760. [Google Scholar] [CrossRef] [Scilit] [PubMed]
  36. Appiagyei, A.B.; Asiedua-Ahenkorah, L.; Bathula, C.; Kim, H.S.; Han, S.S.; Rao, K.M.; Anang, D.A. Rational design of sucrose-derived graphitic carbon coated MnMoO4 for high performance asymmetric supercapacitor. J. Energy Storage 2023, 58, 106383. [Google Scholar] [CrossRef] [Scilit]
  37. Díez, N.; Botas, C.; Goikolea, E.; Carriazo, D. Macroporous carbon monoliths derived from phloroglucinol–sucrose resins as binder-free thick electrodes for supercapacitors. J. Mater. Sci. 2017, 52, 11191–11200. [Google Scholar] [CrossRef] [Scilit]
  38. Taurbekov, A.; Abdisattar, A.; Atamanov, M.; Kaidar, B.; Yeleuov, M.; Joia, R.; Amrousse, R.; Atamanova, T. Investigations of Activated Carbon from Different Natural Sources for Preparation of Binder-Free Few-Walled CNTs/Activated Carbon Electrodes. J. Compos. Sci. 2023, 7, 452. [Google Scholar] [CrossRef] [Scilit]
  39. Keppetipola, N.M.; Dissanayake, M.; Dissanayake, P.; Karunarathne, B.; Dourges, M.A.; Talaga, D.; Servant, L.; Olivier, C.; Toupance, T.; Uchida, S.; et al. Graphite-type activated carbon from coconut shell: A natural source for eco-friendly non-volatile storage devices. RSC Adv. 2021, 11, 2854–2865. [Google Scholar] [CrossRef] [Scilit] [PubMed]
  40. Chee, W.K.; Lim, H.N.; Harrison, I.; Chong, K.F.; Zainal, Z.; Ng, C.H.; Huang, N. Performance of Flexible and Binderless Polypyrrole/Graphene Oxide/Zinc Oxide Supercapacitor Electrode in a Symmetrical Two-Electrode Configuration. Electrochim. Acta 2015, 157, 88–94. [Google Scholar] [CrossRef] [Scilit]
  41. Azega, R.K.; Haque, M.M.; Vyas, A.; Tam, P.L.; Smith, A.D.; Lundgren, P.; Enoksson, P. Durable Activated Carbon Electrodes with a Green Binder. Phys. Status Solidi B Basic Res. 2022, 259, 2100311. [Google Scholar] [CrossRef] [Scilit]
  42. Gautam, S.; Sidhu, J.S.; Verma, M. Influence of reduction duration on reduced graphene oxide for supercapacitor energy storage enhancement. Carbon Trends 2025, 19, 100499. [Google Scholar] [CrossRef] [Scilit]
  43. Palaniselvam, T.; Aiyappa, H.B.; Kurungot, S. An efficient oxygen reduction electrocatalyst from graphene by simultaneously generating pores and nitrogen doped active sites. J. Mater. Chem. 2012, 22, 23799. [Google Scholar] [CrossRef] [Scilit]
  44. Kosateva, A.; Stoycheva, I.; Petrova, B.; Tsyntsarski, B. Characterization of some carbon materials by Raman spectroscopy. Bulg. Chem. Commun. 2021, 53, 85–88. [Google Scholar] [CrossRef]
  45. Sharme, R.K.; Quijada, M.; Terrones, M.; Rana, M.M. Thin Conducting Films: Preparation Methods, Optical and Electrical Properties, and Emerging Trends, Challenges, and Opportunities. Materials 2024, 17, 4559. [Google Scholar] [CrossRef] [Scilit] [PubMed]
  46. Wang, G.; Zhang, L.; Zhang, J. A review of electrode materials for electrochemical supercapacitors. Chem. Soc. Rev. 2012, 41, 797–828. [Google Scholar] [CrossRef] [Scilit] [PubMed]
  47. Eleri, O.E.; Huld, F.; Pires, J.; Tucho, W.M.; Schweigart, P.; Svensson, A.M.; Lou, F.; Yu, Z. Revealing mechanisms of activated carbon capacity fade in lithium-ion capacitors. Electrochim. Acta 2023, 453, 142359. [Google Scholar] [CrossRef] [Scilit]
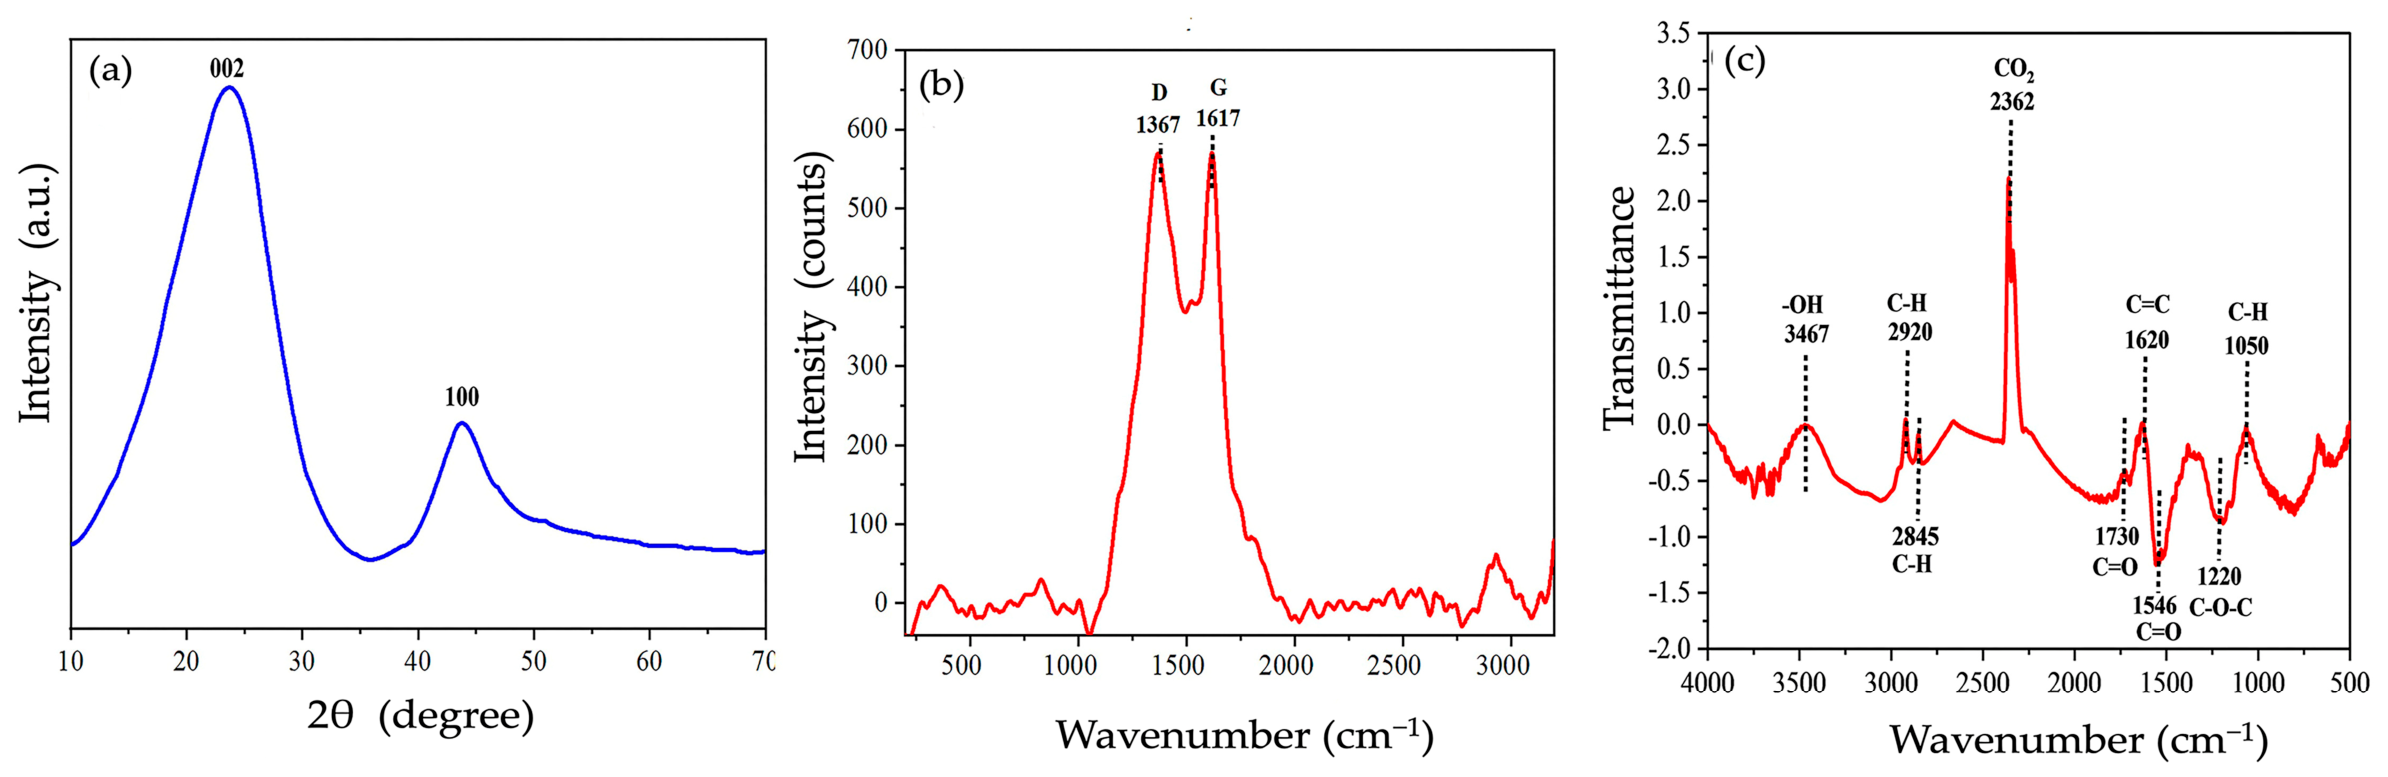
Figure 1. (a) The X-ray diffractogram, (b) Raman spectrum, and (c) FT-IR spectrum of the synthesized AC powder.
Applnano 07 00019 g001
Figure 2. The SEM images of the electrode surfaces, made of AC (a) without sugar treatment and (b) with sugar treatment (magnification ×10,000).
Applnano 07 00019 g002
Figure 3. FTIR spectra of (a) sugar powder, (b) thin film prepared using optimum conditions with AC and sugar.
Applnano 07 00019 g003
Figure 4. The Raman spectra of (a) sugar powder, and (b) thin film prepared using optimum conditions with sugar and AC.
Applnano 07 00019 g004
Figure 5. (a) The CVs for the fabricated cell by varying the AC and sugar binder percentage at the scan rate of 10 mV s−1, (b) optimization of the sintering temperature of the electrodes at the scan rate of 10 mV s−1 from 200 to 400 °C; (c) the CVs of the optimized EDLC at 5, 10, 20, 50, 100, and 200 mV s−1 scan rates; and (d) the capacitive and diffusive contributions to the total current at different scan rates.
Applnano 07 00019 g005
Figure 6. The GCD curves of the optimized cell (a) at different current densities, 0.5, 1.0, 1.5, and 2.0 A g−1 (b) GCD curves at 1.0 A g−1 before and after 1000 scan cycles.
Applnano 07 00019 g006
Figure 7. (a) The selected CV of the 1st, 100th, 200th, 300th, 400th, 500th, 600th, 700th, 800th, 900th, and 1000th for the optimized EDLC at a scan rate of 200 mV s−1 (b) Variation in Cs with the number of scan cycles.
Applnano 07 00019 g007
Figure 8. The electrochemical impedance Nyquist plots for the optimized EDLC before and after 1000 scan cycles.
Applnano 07 00019 g008
Table 2. Calculated Cs values with different binder percentages at the scan rate of 10 mV s−1.
AC: Sugar 1:11:1.51:21:2.51:3
Cs (F g−1)17.8435.1574.3566.160.54
Table 3. Cs values at different scan rates for the optimized EDLC.
Scan rate (mV s−1)5102050100200
Cs (F g−1)75.7374.3568.5767.6360.1842.47
Table 4. Circuit parameters based on the equivalent circuit.
Impedance ParametersBefore Charge/Discharge CyclingAfter 1000 CyclesUnits
R11.041.22
R22.155.33
Q11.45 × 10−41.87 × 10⁻⁴F s n−1
Q20.130.10F s n−1
Disclaimer/Publisher’s Note: The statements, opinions and data contained in all publications are solely those of the individual author(s) and contributor(s) and not of MDPI and/or the editor(s). MDPI and/or the editor(s) disclaim responsibility for any injury to people or property resulting from any ideas, methods, instructions or products referred to in the content.