2. Experimental Methodology
Materials: For the PbS QDs synthesis, the following reactants were used: Lead oxide (PbO) 99.99%, oleic acid (OA) 90%, 1-octadecene (ODE) 90%, hexamethyldisilathiane (TMS) reactive grade, diphenylphosphine (DPP) 98%, hexane and chloroform (CHCl3) were acquired from Sigma-Aldrich, while solvents such as acetone and isopropyl alcohol, ethanol and methanol were acquired from CTR Scientific.
The molecules used for the capping ligand exchange, L-Cysteine (L-Cys) 97%, 1,2-ethanedithiol (EDT) and tetrabutylammonium iodide (TBAI) were acquired from Sigma-Aldrich.
For the GO synthesis, natural graphite, concentrated sulfuric acid (H2SO4), phosphoric acid (H3PO4), potassium permanganate (KMnO4), hydrogen peroxide (H2O2), hydrochloric acid (HCl) at 30% and ether were used, which were acquired from Sigma-Aldrich.
PbS QDs Synthesis: For the synthesis of the PbS QDs, the rapid hot-injection method was used, following procedures previously reported [
10,
19]. PbO (0.45 gr) was dissolved in the mixture of ODE (20 mL) and OA (1.6 mL), followed by magnetic stirring. This solution was degassed at 115 °C under N
2 atmosphere until it became completely clear and without bubbles, for approximately 1 h. Simultaneously, the sulfur precursor solution is prepared in a glove box under Ar atmosphere; for this solution, 210 μL of TMS, 2 mL of ODE and 100 μL of DPP were stirred for 30 min at room temperature. The sulfur precursor was injected rapidly into the lead precursor solution under N
2, and after 4 s of reaction time, the reaction was cooled down with cold acetone. PbS QDs were washed five times in acetone using centrifugation (9000 rpm, 30 min) and redispersed in chloroform. The precipitated QDs were finally dissolved in chloroform.
PbS QDs Ligand Exchange: PbS QD solution with a concentration of 5 mg mL−1 was prepared. 0.125 gr of PbS QDs were added to 25 mL of hexane, or chloroform, in order to obtain the desired concentration. Solutions were prepared with EDT and TBAI in methanol with concentrations of 0.175 M and 0.027 M, respectively. L-Cys was dissolved in deionized (DI) water in order to form a solution with a concentration of 0.075 M. It is worth mentioning that this solution needed to be prepared right before it was intended to be used; otherwise, after 24 h, large L-Cys crystals would start to form in the solution, and then it would not be useful for the intended purpose. For the ligand exchange with EDT and TBAI, 1 mL of their solution was mixed with 1 mL of the PbS QD solution in hexane; then, this mixture was vigorously agitated for 1 min, and it was left to rest for 1 min; after this rest time, the PbS QDs could be seen to change from the organic phase to the aqueous phase, indicating the proper ligand exchange. Then, the PbS QDs were extracted and stored in 2 mL centrifugation tubes, where the vials were filled with methanol. In the case of the L-Cys ligand exchange, 1 mL of the L-Cys solution in DI was mixed with 1 mL of PbS QD solution in chloroform; then, this mixture was vigorously agitated for 1 min and left to rest for 1 min; again, it was possible to see the PbS QDs change from the organic phase to the aqueous phase. Afterward, the PbS QDs were extracted and stored in 2 mL centrifugation tubes, where the vials were filled with acetone. Then, all the samples were centrifuged at 13,000 rpm for 10 min in a Fisher Scientific Accum Spin micro17 centrifuge; after centrifugation, the supernatant was extracted, and the particles were redispersed in methanol. This process was repeated two additional times. Finally, the PbS QDs were redispersed in ethanol and centrifuged at 13,000 rpm for 10 min, the supernatant was again discarded and the particles were redispersed in ethanol. This process was repeated one additional time, and the particles were finally left in ethanol for further processing.
GO synthesis: GO was synthesized using the method reported by Marcano et al. [
9]. After the synthesis, GO was dispersed in ethanol.
Nanostructured hybrid materials (NHMs) preparation: 4 mL of PbS QDs in ethanol with the new capping ligand molecule was deposited in 8 mL vials; this QD solution and the GO solution were ultrasonicated, separately, for one minute; afterward, 300 μL of GO was added to the 4 mL PbS QD solution in the 8 mL vials, and they were vigorously agitated and left for 2 min in the ultrasonic bath. Later, the solutions were centrifuged at 13,000 rpm for 10 min, the supernatant was discarded and the NHMs were redispersed in ethanol.
NHMs’ thin films deposition: Thin films of the prepared NHMs were deposited via spin coating on thoroughly cleaned glass substrates. A spin coater WS−400BZ−6NPP/LITE was used for this purpose. The deposition speed used was 2500 rpm; 1100 mL of the hybrid material was deposited on the glass substrate dropwise; while the substrate was spinning, we waited for 5 s in between drops to let the ethanol evaporate. Once the deposition process was finished, the thin films were left to dry, and afterward, they were stored in a glove box under an Ar atmosphere and in dark conditions.
Physical characterization: UV-Vis-NIR optical absorption spectroscopy studies of the PbS QDs before and after the ligand exchange were performed in an Agilent Cary 5000 spectrometer in the range between 200 nm and 1100 nm. Photoluminescence (PL) spectroscopy studies were performed in a StellarNet Silver-Nova Fluor system in the range between 700 nm and 1100 nm, with an excitation wavelength of 655 nm. For both studies, the samples were in solution: chloroform for the sample before the ligand exchange and ethanol for the samples after the ligand exchange. Fourier Transform Infrared (FTIR) spectroscopy studies were performed with an FTIR Interspec 200-X spectrometer in the range between 400 cm−1 and 4000 cm−1, and the samples were prepared with KBr in order to perform the measurements. Raman spectroscopy measurements were performed on a LabRAM HR Horiba Scientific spectrometer with an excitation laser of 633 nm, an acquisition time of 5 s and an objective lens of 50X. X-ray Photoelectron Spectroscopy (XPS) measurements were performed on a Thermo Fisher Scientific K-Alpha spectrometer (Waltham, MA, USA) featuring an Al Kα radiation source (1486.68 eV); for these studies, deposited thin films were used from the different samples. Scanning Electron Microscopy (SEM) studies were performed using a Hitachi SU8020 with an acceleration voltage of 1 kV and a beam current of 10 μA. For this study, only the thin films of the NHMs were analyzed. TEM studies were performed using a FEI TEM Titan G2 80–300 operated at 300 kV with scanning transmission electron microscopy (STEM) capabilities and equipped with a high-angle annular dark-field (HAADF) detector from Fishione, bright-field (BF) and dark-field (DF) STEM detectors from Gatan and an EDAX energy-dispersive X-ray spectroscopy (EDXS) detector. TEM samples from the PbS QDs in solution were prepared by depositing one drop of the solution on carbon-coated Cu grids, while the samples from the NHMs’ thin films were prepared as follows: the thin films were detached from the substrates; then, the thin films were grinded in an agata mortar; finally, the fine powder was deposited on lacey carbon Cu grids.
Electrical properties characterization: For the electrical properties studies, a Keithley 6487 picoammeter was used. I–V and photoresponse curves were acquired for the NHMs’ thin films. Silver paint was used for the electrodes to perform the measurements. For the I–V curves, the voltage was varied between 0 V and 20 V, whereas for the photoresponse measurements, 20 V was used, the sample was left in a dark box for 20 s and then exposed to 50 W tungsten halogen lamp for 20 s and, finally, the light source was turned off while the current was measured for another 20 s.
3. Results and Discussion
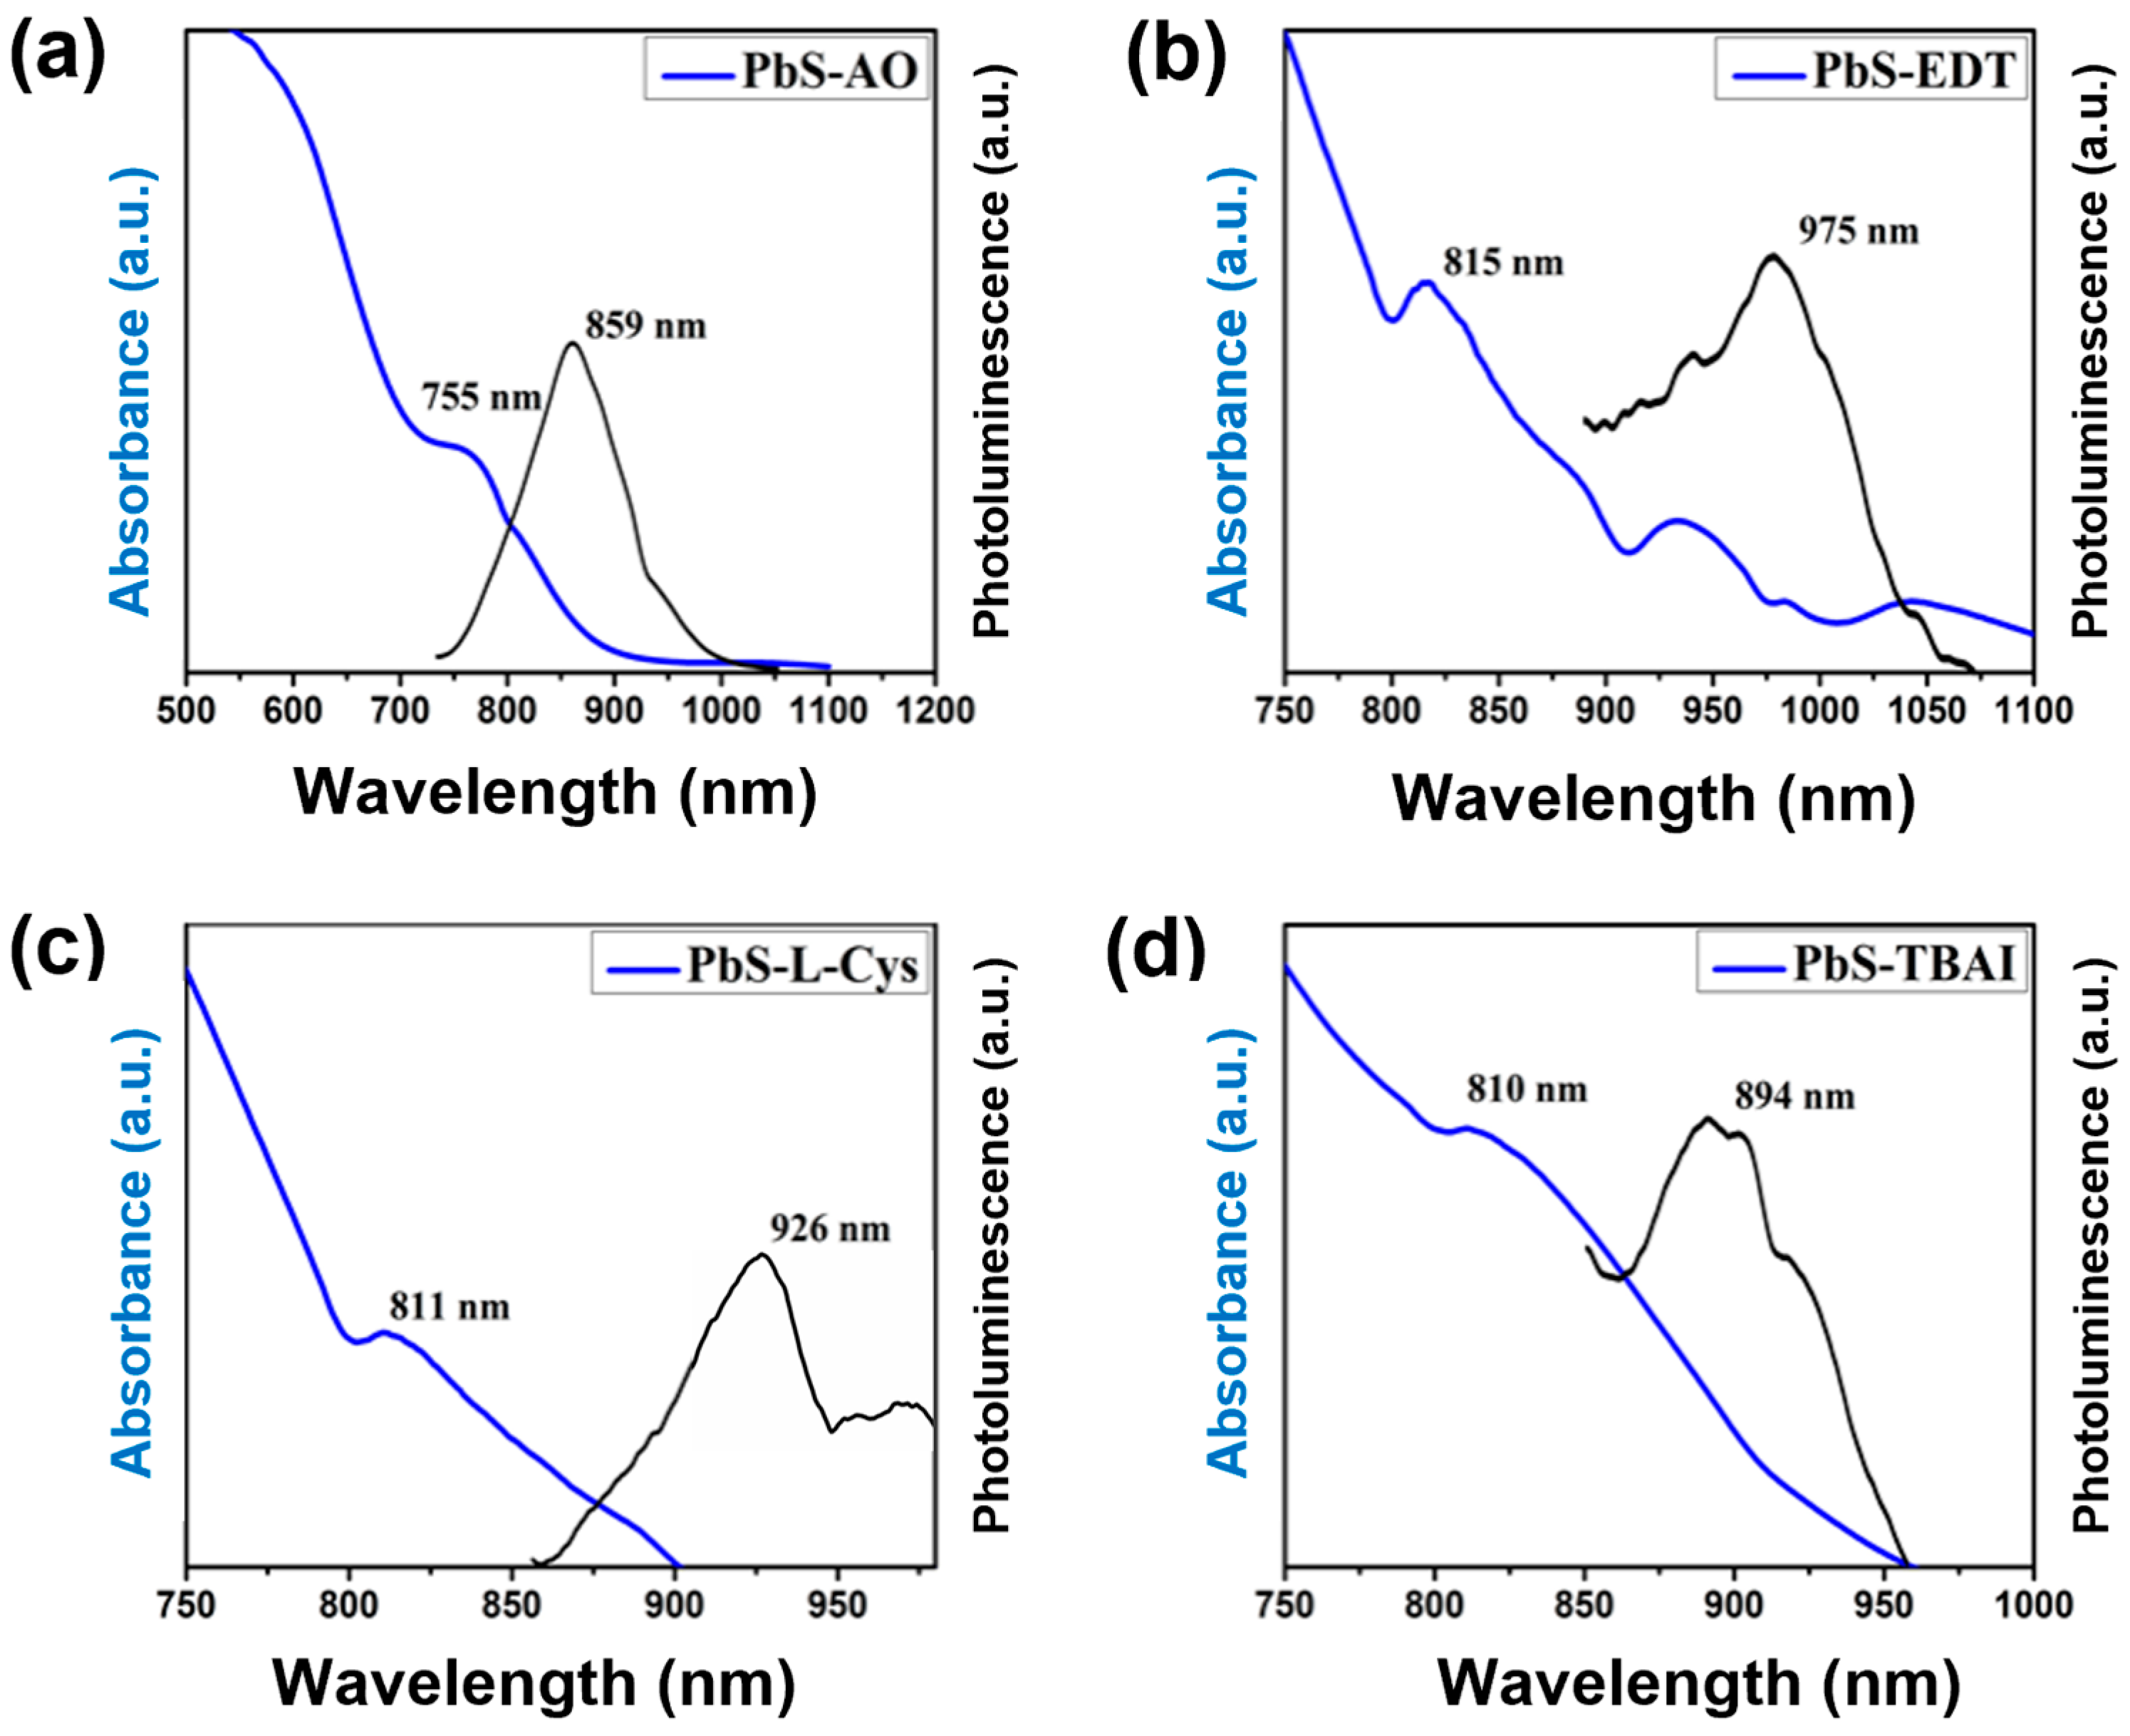
The synthesized and ligand-exchanged PbS QDs were analyzed via UV-Vis-NIR and PL spectroscopy.
Figure 1 shows the results obtained for these studies. The optical absorption spectra for the OA-capped sample showed an absorption peak maximum at ~755 nm. After the ligand exchange, this absorption peak maximum shifted to approximately 811, 810 and 815 nm for the capping ligands L-Cys, TBAI and EDT, respectively. This variation in the absorption peak maximum can be associated with an increase in the average particle size in the different samples, as has been reported previously [
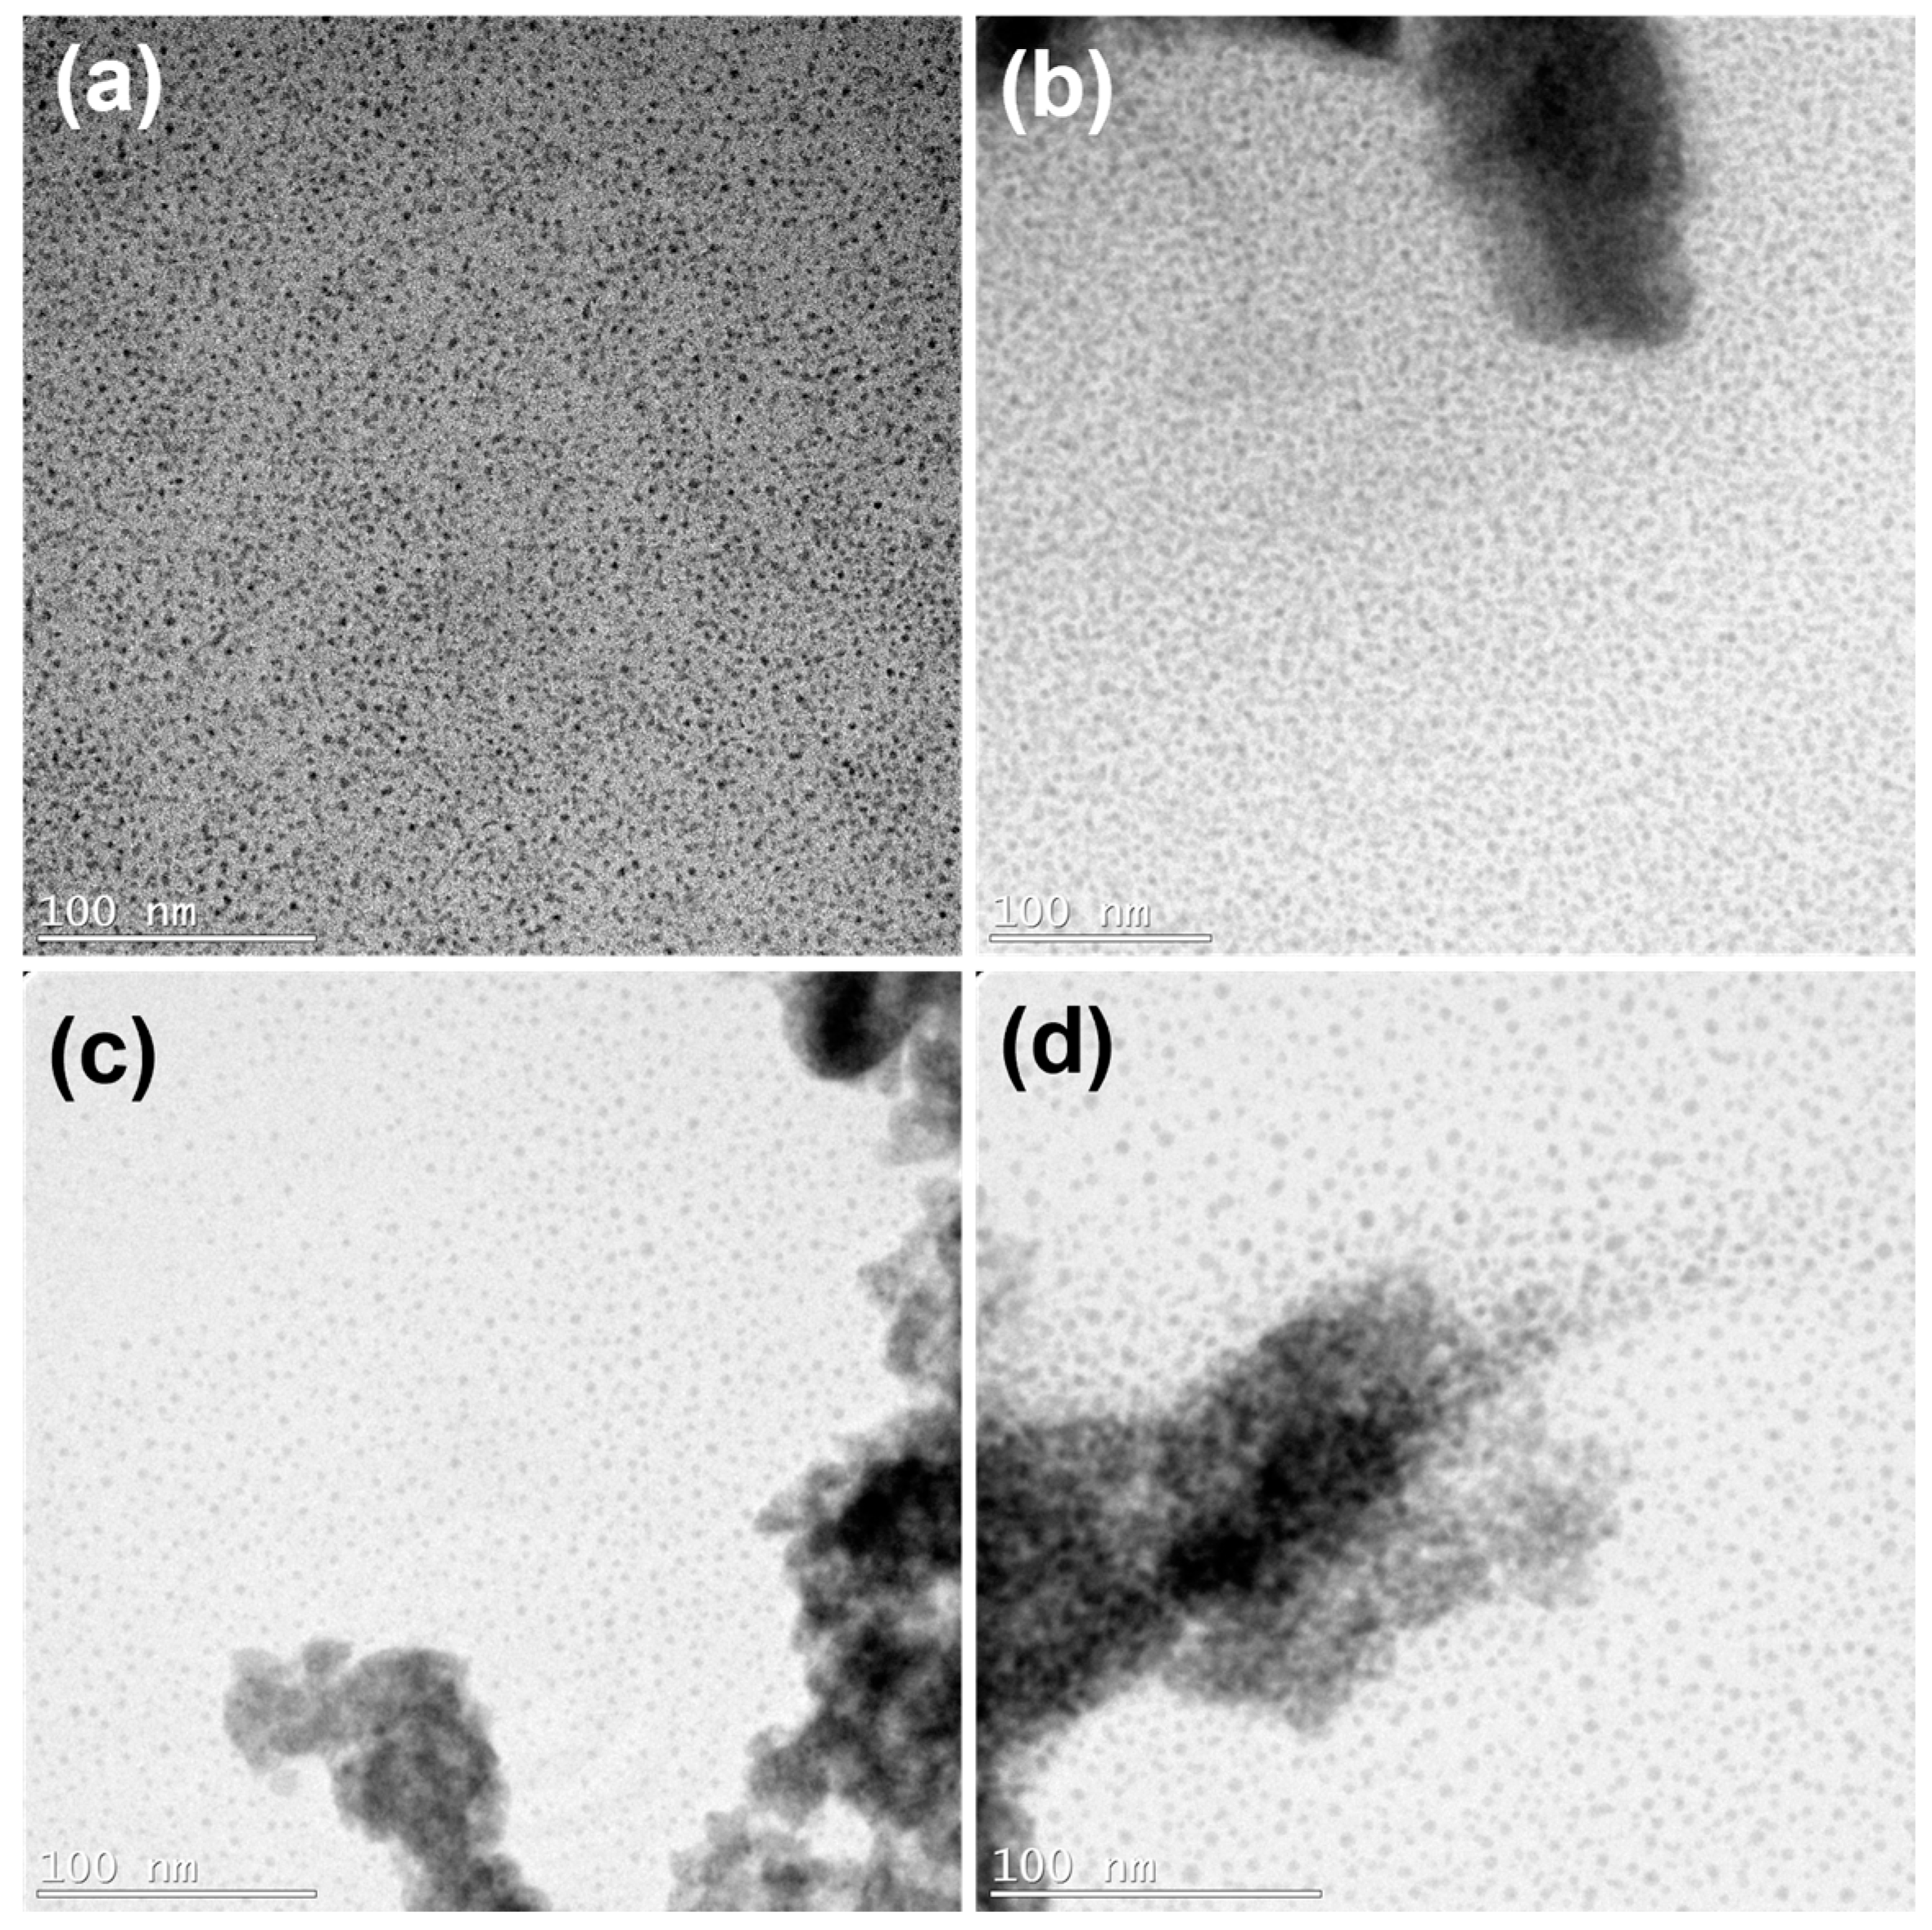
20]. Additionally, the full width at half maximum (FWHM) in all ligand-exchanged samples showed an increase compared to the OA sample, with less intense and broader absorption peaks. These observations can be associated with an increment in particle-size dispersion. Additionally, the PbS QDs were observed to form agglomerates (
Figure 2) after the capping ligand exchange procedure; these agglomerates can also produce variations in the UV-Vis absorption and PL spectra.
The PL spectra, shown as the dark lines in
Figure 1, showed an emission signal with a Stokes shift of 100 nm, 115 nm, 84 nm and 160 nm for the samples with the capping ligand of OA, L-Cys, TBAI and EDT, respectively. This emission is produced due to the radiative recombination of the photogenerated excitons (electron–hole pairs) within the QDs [
21]. These Stokes shift variations can be attributed to the surface trap states generated by the defects found on the QDs’ surface. Defects that have been observed in the case of PbS QDs mainly originate through the surface passivation of OA, which displays a preferential interaction with Pb atoms, leaving un-passivated S atoms on the surface of the QDs and, hence, forming the mentioned surface trap [
21]. The measured Stokes shift is different in all the samples analyzed; these variations will be discussed in more detail later in the manuscript.
Figure 2 shows TEM images of the synthesized PbS QDs and the samples after the capping ligand-exchange procedure with the different ligands. It was observed that after the capping ligand-exchange process took place, aggregates of the PbS QDs could be observed, which were not seen in the originally synthesized PbS QD sample.
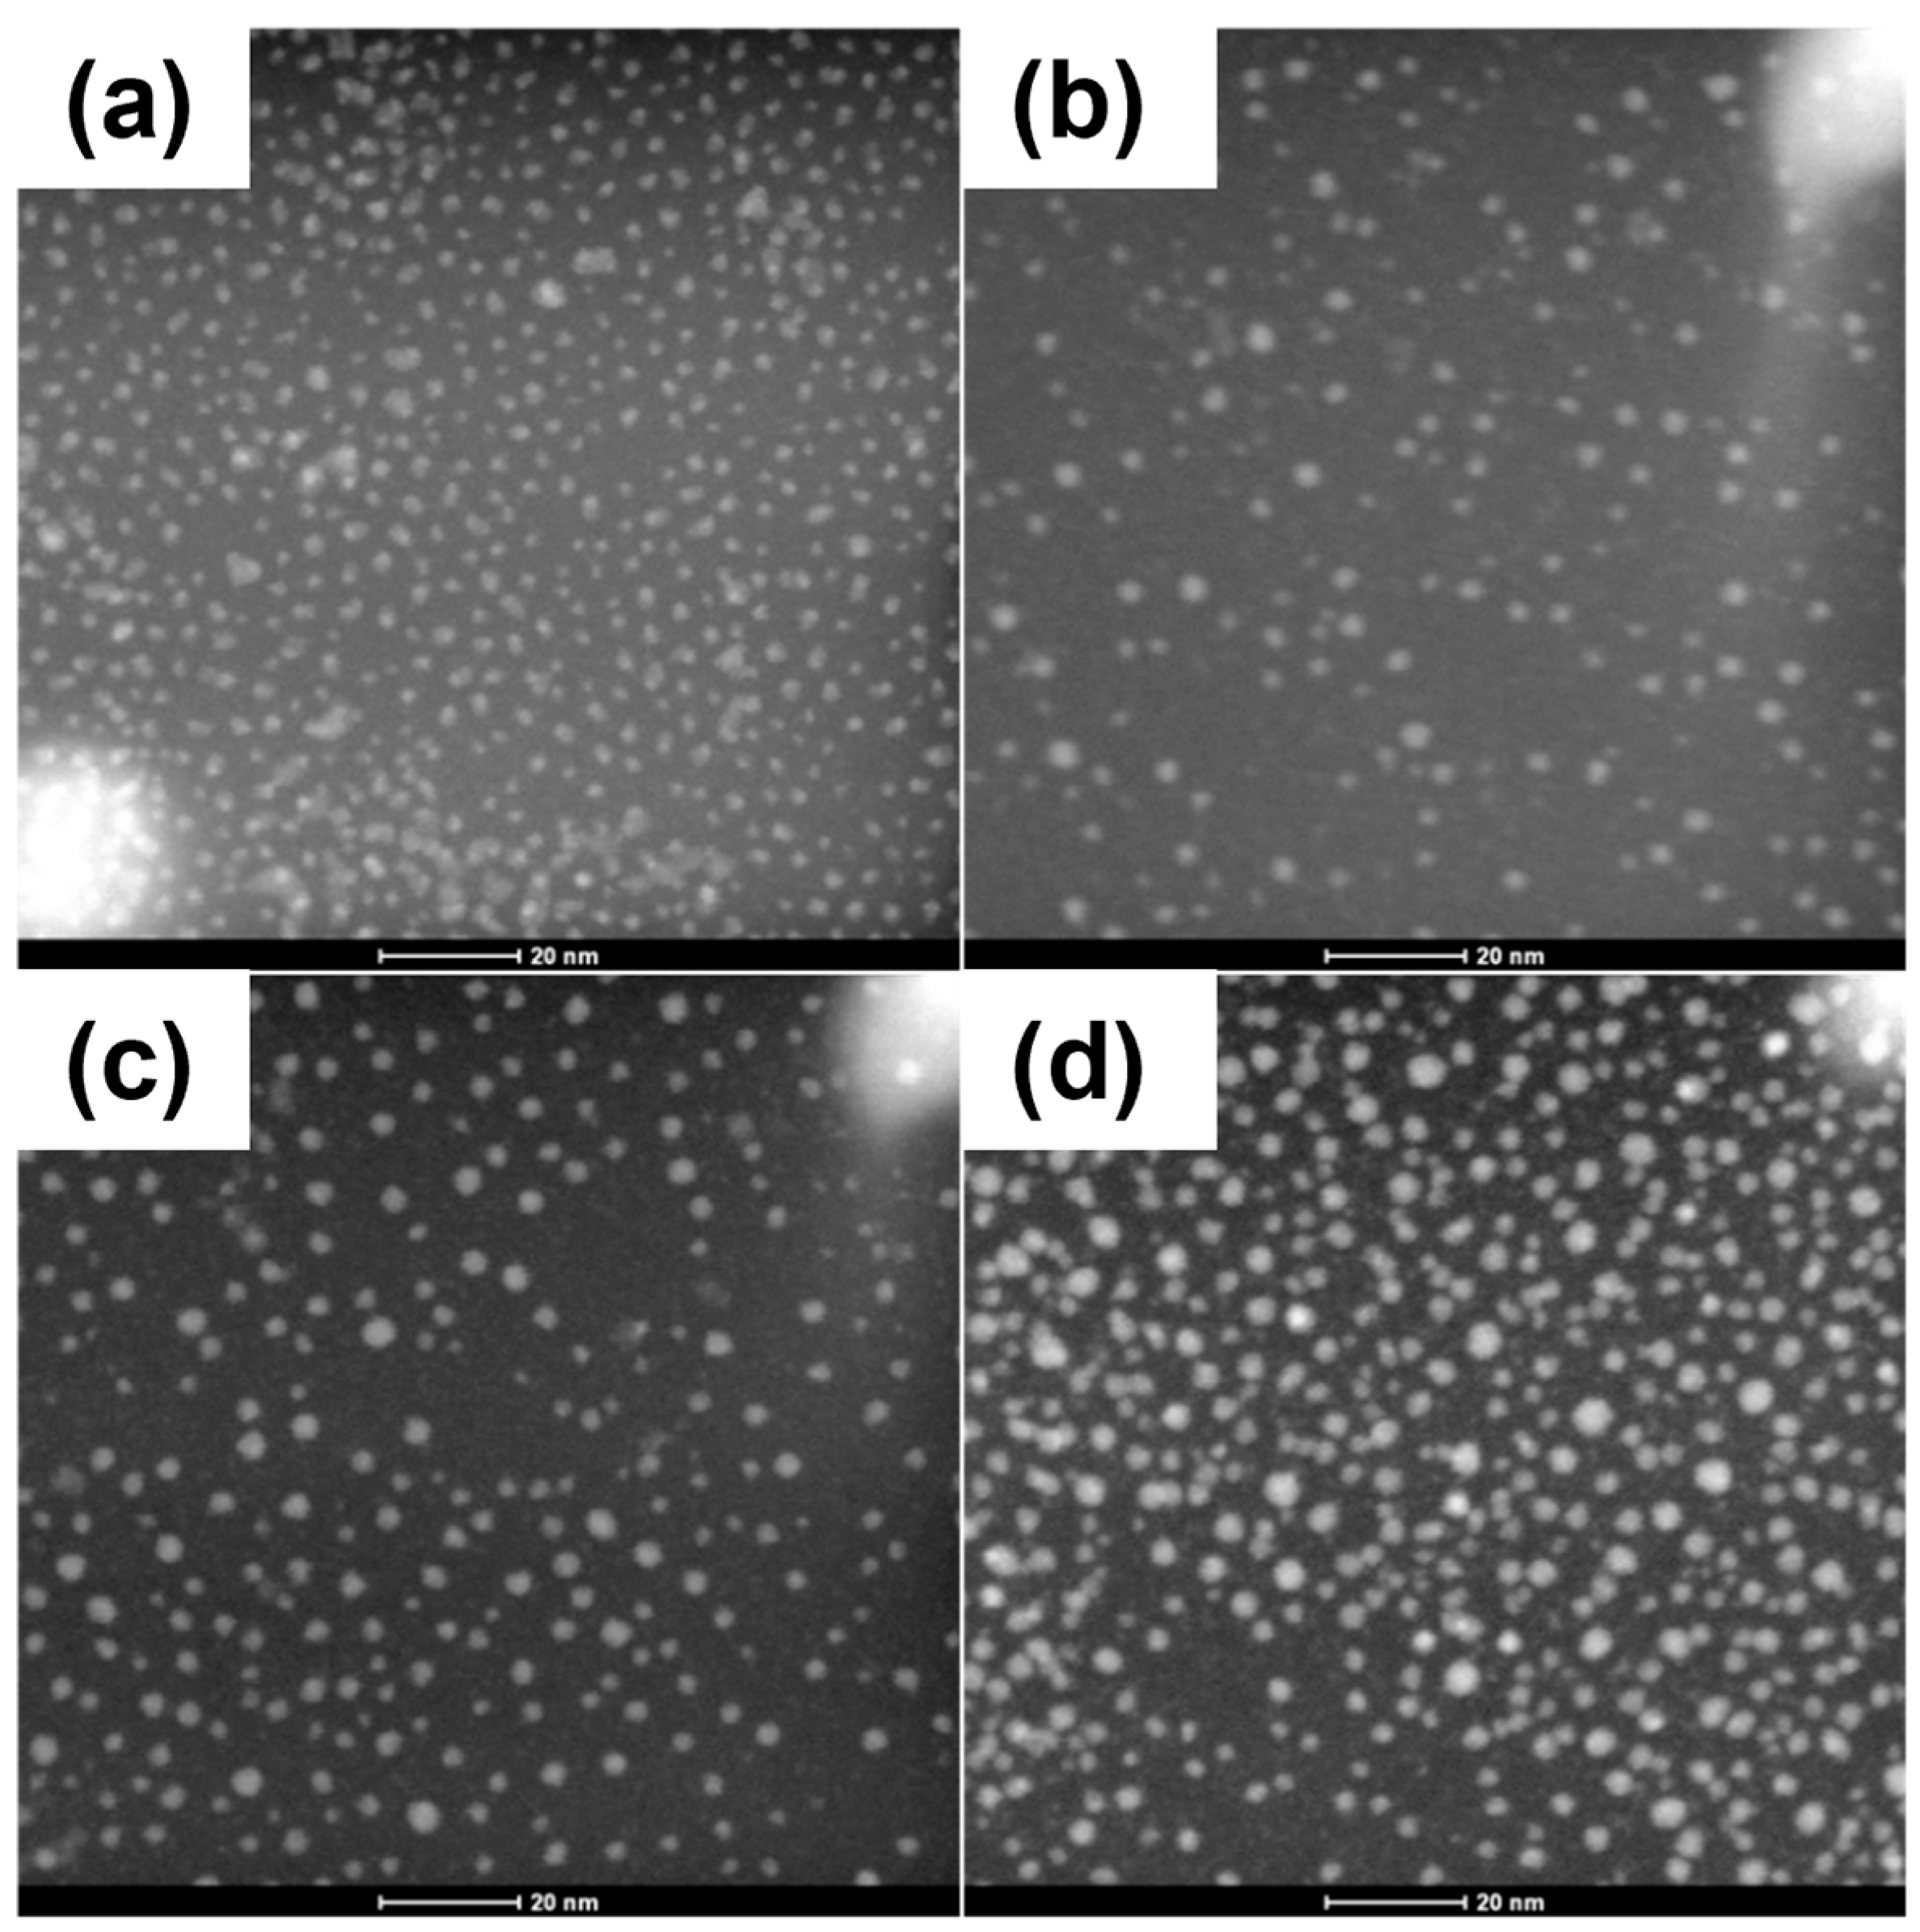
Figure 3 shows STEM–HAADF images of the samples, where slight variations in the QDs’ size, shape and size distribution can be observed. The measured average particle size for the QDs capped with OA, EDT, L-Cys and TBAI was 3.48 nm, 3.68 nm, 3.5 nm and 3.79 nm, respectively (
Table 1). These numbers were calculated by measuring PbS QDs away from the previously mentioned PbS QD agglomerates. As was suggested by the optical absorption results, a slight increment in the average particle size was observed in the STEM results for the QDs with the ligand exchanged.
Figure 4 shows the FTIR and the Raman spectroscopy results for the analyzed samples. For the PbS QDs originally synthesized with the OA as the capping ligand (
Figure 4a), three bands related to the symmetric vibrations of the methylene (-CH
2) group can be observed at ~722, ~2853 and ~2924 cm
−1, while the bands seen at ~1405 and ~1540 cm
−1 correspond to the stretching of the C=O group; finally, a low-intensity band can be seen at ~3006 cm
−1 related to the stretching of the C-H group. These bands can be attributed to the presence of the OA molecule on the surface of the PbS QDs [
22]. In the case of the capping ligand-exchanged PbS QDs, the intensity of the bands observed at ~2853 and ~2924 cm
−1 decreased considerably, while the band at ~722 cm
−1 cannot be detected (
Figure 4a); for the case of the bands observed in the region between 500 and 1700 cm
−1, new signals appeared, others disappeared and others changed in intensity; all these observations support the idea of the capping ligand exchange occurring in the studied samples. Analyzing each specific case separately, we can see that for the EDT ligand-exchanged sample, a new band appeared at ~825 cm
−1 related to the C-S group present in the EDT molecule [
22]. For the case of the TBAI ligand-exchanged sample, it can be seen that all the signals related to vibrations of the C-H groups disappeared (
Figure 4a), a fact that has been previously reported in the literature as evidence of the OA ligand exchange for TBAI [
23]. Lastly, for the L-Cys ligand exchange, it has been reported that the L-Cysteine molecule displays bands at ~1588 cm
−1 and at ~1650 cm
−1 related to the asymmetric stretching vibration of the carboxylate (COO-) group and the bending mode of the -NH
2 group, respectively [
24]; both signals can be observed in the PbS-L-Cys sample (
Figure 4a), which confirms the presence of the L-Cysteine molecule on the surface of these ligand-exchanged PbS QDs. It can also be noted that a clear signal related to the functional group -OH can be observed in the samples after the ligand exchange procedure (
Figure 4a); this is a consequence of the ligand exchange process, and it is attributed to the solvent used during this process (ethanol) and the fact that the samples were dispersed in ethanol right before the FTIR analysis was performed. It is worth noting that for the case of the EDT ligand exchange, the bands related to the C=O and -CH
2 functional groups, possibly from the OA molecule, are still present, with a lower intensity than in the PbS-OA sample but a higher intensity than in the other ligand-exchange samples. This could be related to the presence of OA molecules on the surface of the PbS QDs exchanged with EDT, which could be associated with a less effective ligand exchange process.
Figure 4b shows the Raman spectra acquired for the different PbS QDs with the different capping ligands in the region between 0 and 1000 cm
−1. For the PbS QDs with OA as the capping ligand, two clear peaks can be observed at 81 cm
−1 and 135 cm
−1. Sample PbS-EDT showed peaks at 40 cm
−1, 68 cm
−1, 125 cm
−1 and 962 cm
−1. The PbS QDs with L-Cysteine as the capping ligand showed five different peaks at 34 cm
−1, 62 cm
−1, 89 cm
−1, 137 cm
−1 and 962 cm
−1, and some of them are similar to the peaks observed in the previous sample. Finally, sample PbS-TBAI showed four peaks at 42 cm
−1, 80 cm
−1, 136 cm
−1 and 963 cm
−1. For bulk PbS and microcrystalline PbS, transverse acoustic (TA) phonon modes have been reported at 48 cm
−1, whereas longitudinal acoustic (LA) modes have been reported at 84 cm
−1 [
25]. The TA phonon mode could be related to the signals observed in the PbS QDs around 40 cm
−1, like the peak at 40 cm
−1 in the PbS-EDT sample and the peak at 42 cm
−1 in the PbS-TBAI sample, while the LA phonon mode signal could be related to the peak seen at 81 cm
−1 in the PbS-OA sample, the peak at 89 cm
−1 in the PbS-L-Cys sample and the peak at 80 cm
−1 in the PbS-TBAI sample. The variations in the final value of the phonon vibrations might be a consequence of the interactions between the capping ligand molecule and the QDs’ surface atoms, which might produce variations in the interplanar/interatomic distances on the surface of the QDs as part of the surface reconstruction effects previously reported in nanoparticles [
26,
27]. These variations in the distances between neighboring atoms will have a direct effect on the vibrational behavior displayed by the QDs. Additionally, several peaks between 34 cm
−1 and 68 cm
−1 appear in these samples, without clear connections to the vibrational modes observed in bulk PbS. These additional peaks might be related to the mechanical softness displayed by QDs’ surface [
28], which affects surface phonons by making them exhibit reduced symmetry and low energies [
28]. It has been proposed that another consequence of this mechanical softness is the generation of a large number of low-energy surface phonons on QDs, with up to 200 possible additional vibrational modes [
28]. The appearance of byproducts due to the degradation/photo-oxidation of PbS QDs due to the interaction with the laser from the equipment during Raman analyses has also been previously reported [
29]; these signals are found between 100 cm
−1 and 1000 cm
−1. The peaks seen at 136 cm
−1, 137 cm
−1, 125 cm
−1 and 135 cm
−1 in the PbS-TBAI, PbS-L-Cys, PbS-EDT and PbS-OA samples, respectively, can be attributed to the Pb-O-Pb stretching in lead oxide, as has been previously reported [
29]. The oxidation of the anion in PbS QDs gives rise to peaks within the 600 cm
−1 to 1000 cm
−1 range, which are associated with the formation of SO
4 species, specifically, lead sulfate, PbSO
4 [
29]. The peaks at 967 cm
−1, 963 cm
−1 and 962 cm
−1 seen in the PbS-L-Cys, PbS-TBAI and PbS-EDT samples, respectively, can be attributed to the presence of PbSO
4 in these samples [
13,
29].
XPS analyses were performed for all the synthesized samples. These results showed the variations produced by the capping ligand-exchange process in the chemical state of the QDs’ surface atoms.
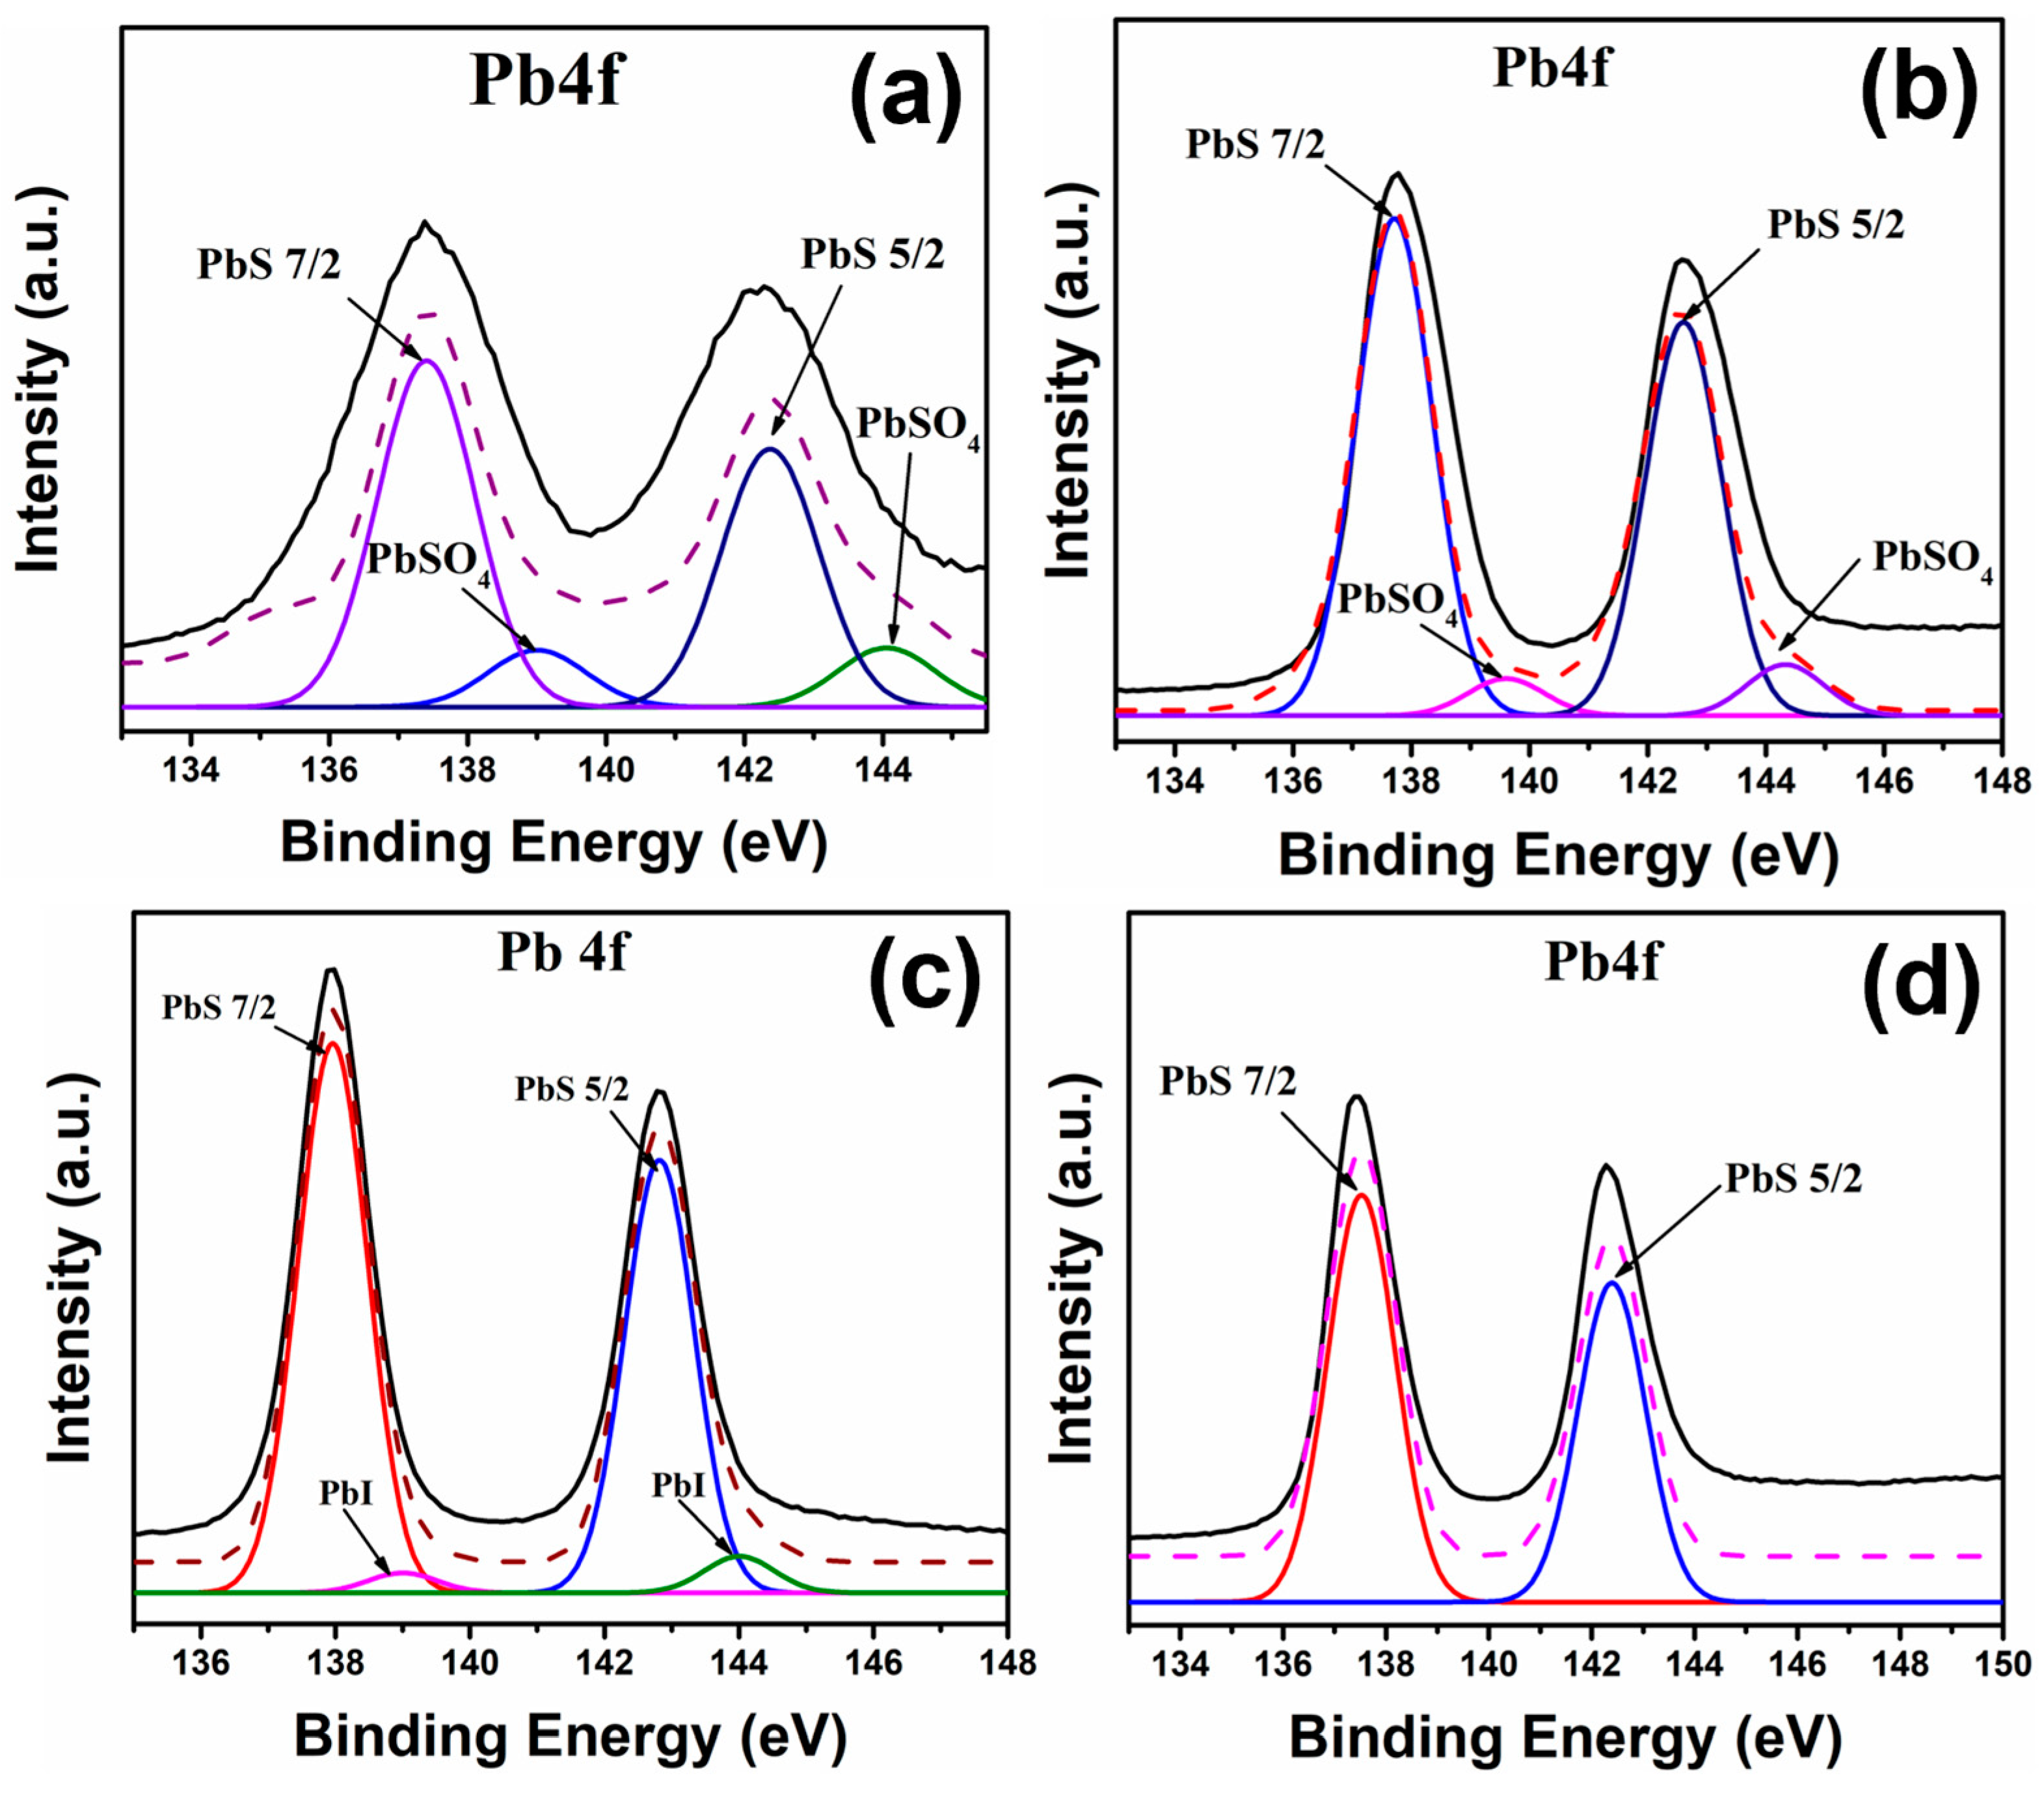
Figure 5 shows the high-resolution XPS spectra corresponding to the Pb4f peak of the four samples studied. In the PbS-OA sample, the deconvolution analysis resulted in two signals (
Figure 5a), two peaks observed at ~137 eV and ~142 eV, which can be attributed to the PbS 7/2 and PbS 5/2 peaks from the Pb-S bond, respectively, while the second signal, located at ~139 eV and ~144 eV, can be attributed to the presence of PbSO
4 or PbO in the sample [
30]. The PbS-EDT sample (
Figure 5b) showed the same signals, with a clear difference in the ratio between the intensities of the peaks related to the PbS signal and the peaks related to the PbSO
4/PbO signal. A larger ratio is observed in the PbS-EDT sample, which can be interpreted as a lower presence of PbSO
4 or PbO in this sample, which can be attributed to a more stable sample under atmospheric conditions due to an improved surface protection of the capping ligand on the QDs’ surface.
Figure 5c shows the XPS spectra for the Pb4f peak from the PbS-TBAI sample. In this case, two peaks can be observed at ~137 eV and ~142 eV, which can be attributed to the PbS 7/2 and PbS 5/2 peaks from the Pb-S bond, respectively [
31]; two additional peaks of lower intensity can be observed at ~139 eV and ~144 eV, which are signals related to the Pb-I bond, as has been previously reported [
31]. This evidence, along with the FTIR and Raman results, contributes to supporting the idea that the OA is replaced by the TBAI during the capping ligand exchange process. Moreover, the absence of signals related to the degradation of PbS to PbSO
4 and/or PbO suggests that this capping ligand exchange produces PbS QDs with higher stability in ambient conditions. Finally,
Figure 5d shows the XPS spectra for the Pb4f peak from the PbS-L-Cys sample, where only the two peaks related to the PbS 7/2 and PbS 5/2 signals of the Pb-S bond can be observed [
30]; just like in the previous case, the absence of other signals related to the degradation of PbS suggests the production of QDs with improved stability in ambient conditions due to the capping ligand exchange with L-Cysteine producing better-capped QD surfaces.
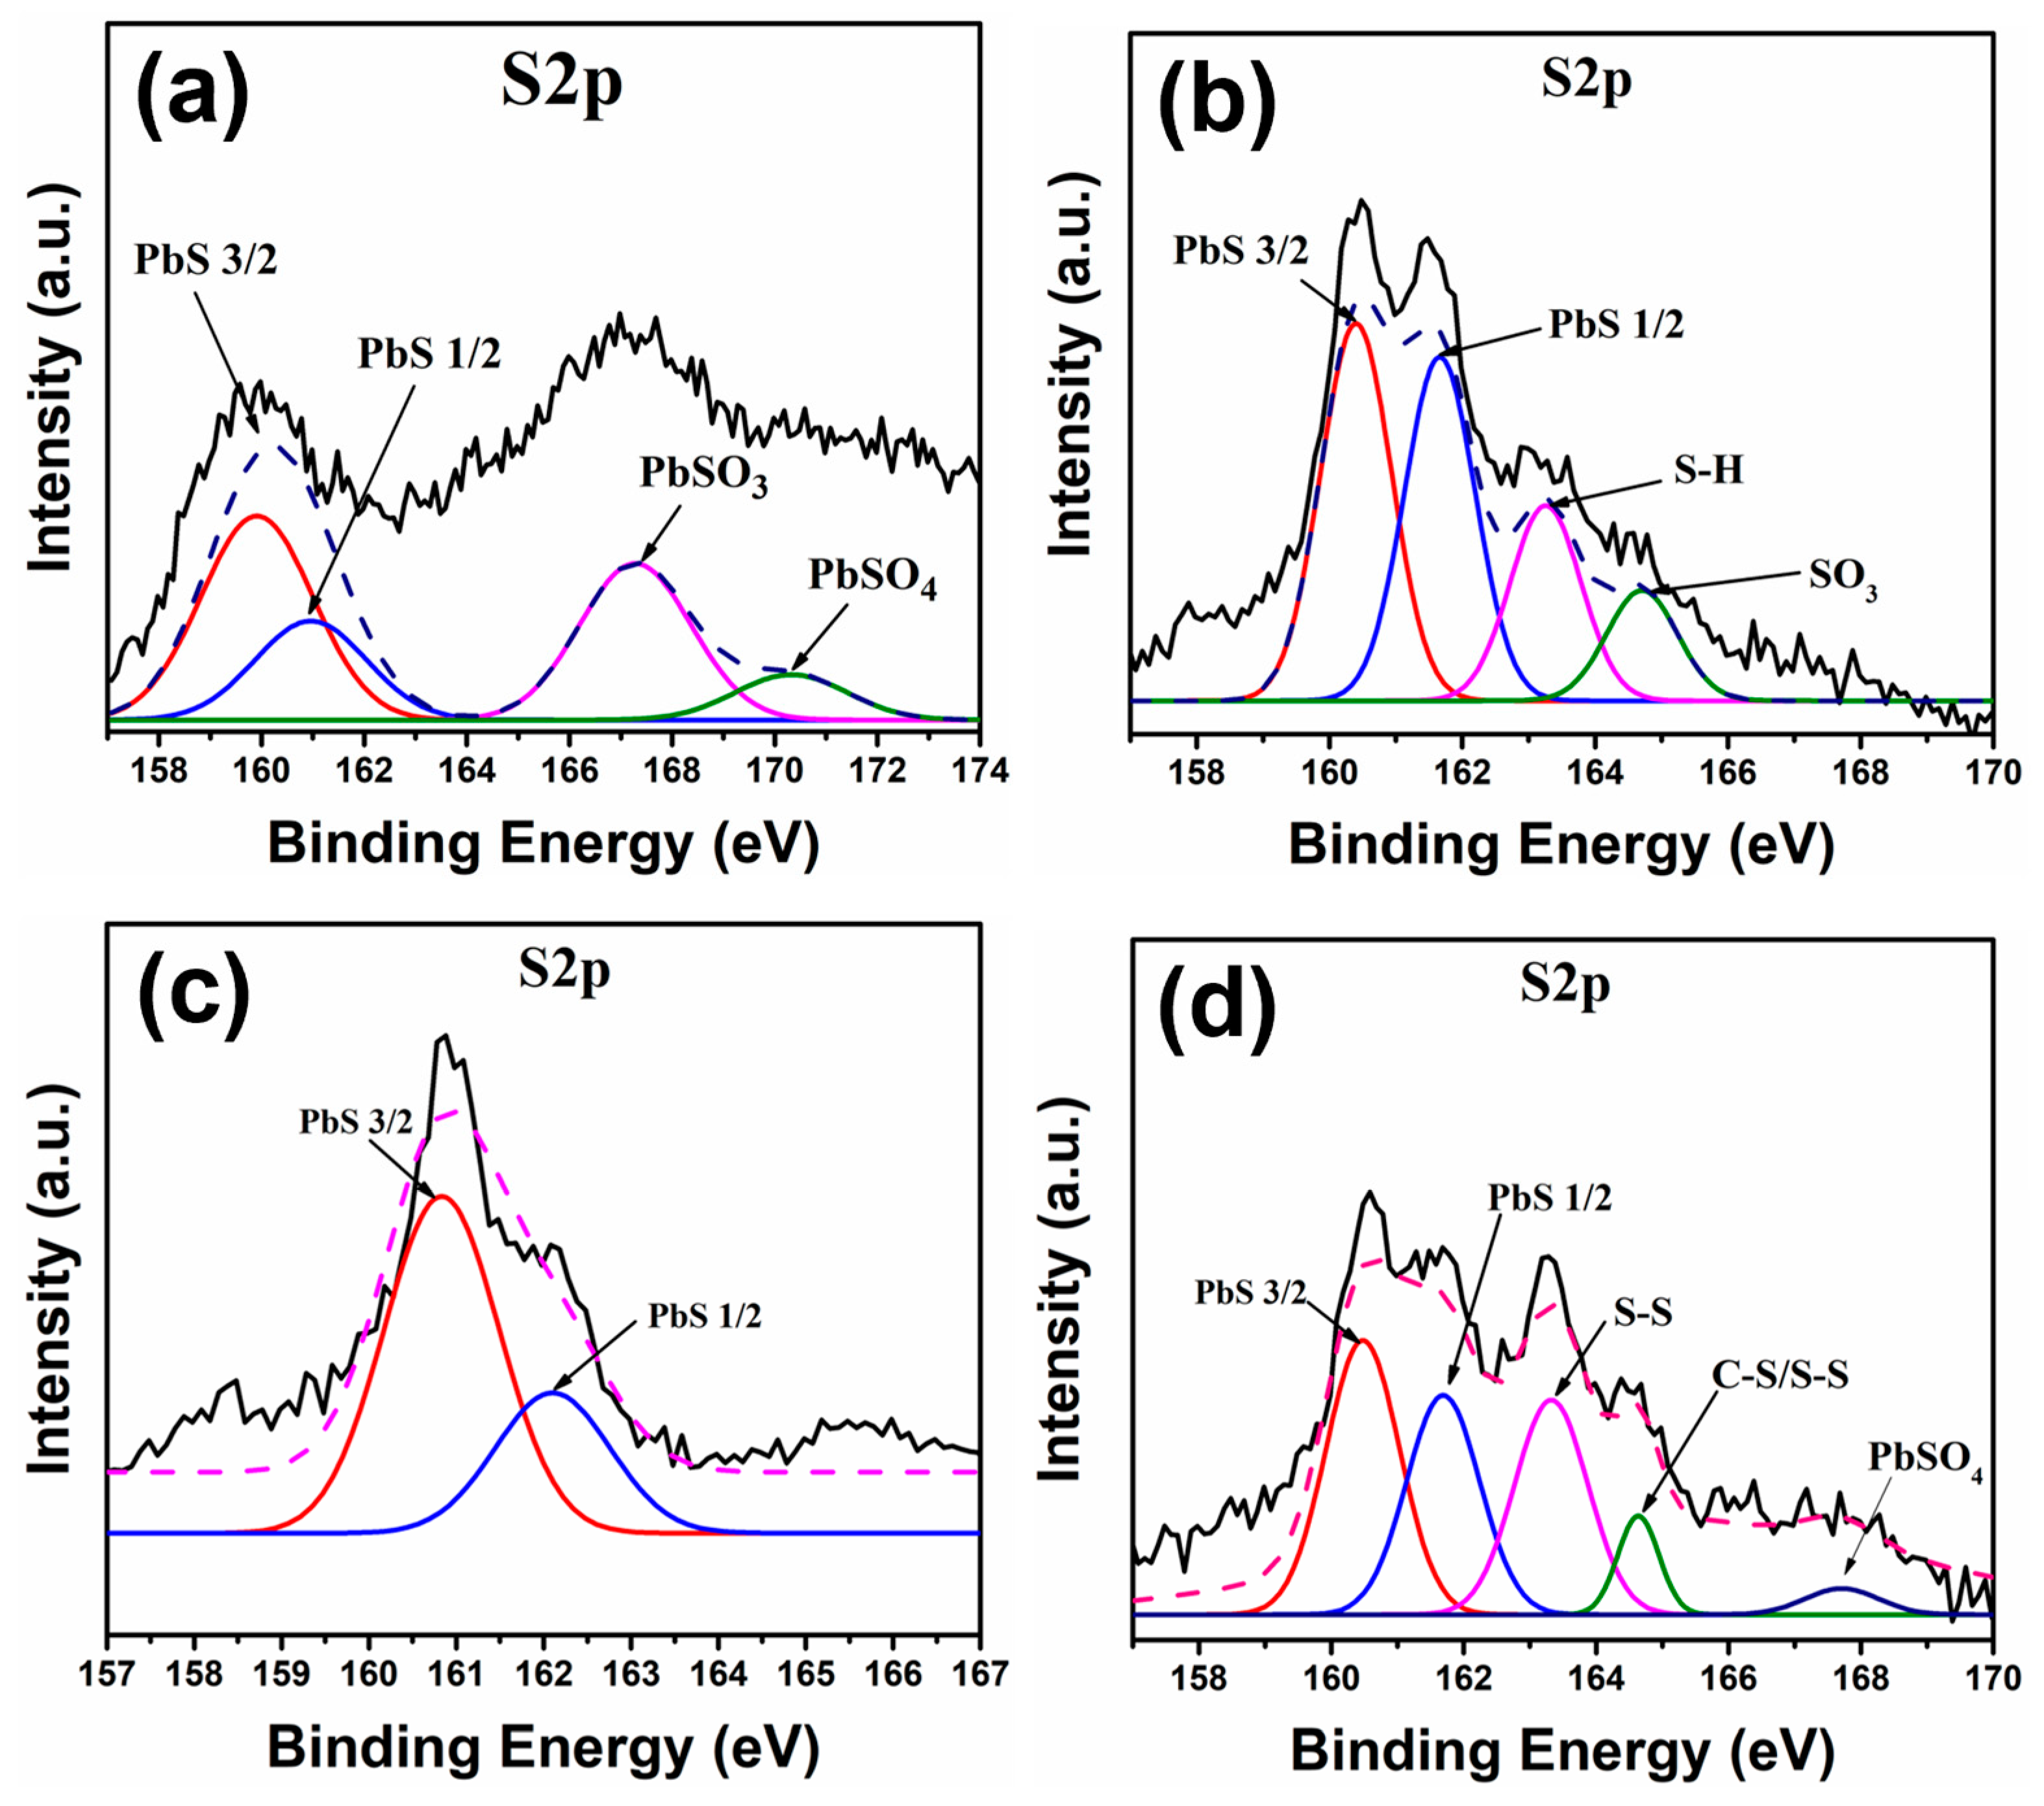
Figure 6 shows the XPS S2p peak for the different samples studied.
Figure 6a shows the S2p peak for the PbS-OA sample, where four different signals can be observed. At ~160 eV and ~161 eV, the peaks correspond to the S2p3/2 and S2p1/2 signals, respectively [
32], and the peaks at ~167 eV and ~170 eV indicate the presence of oxysulphides, such as SO
32− and SO
42, which are products of S oxidation [
33]. For the case of the PbS-EDT sample (
Figure 6b), again, the signals related to the Pb-S bond can be observed at ~160 eV and ~161 eV (S2p3/2 and S2p1/2, respectively) [
32], while the peak at ~163 eV corresponds to the presence of poly-sulfurs (S
n2−), found on EDT molecules in the capping ligand [
34]. There is also a signal observed at ~165 eV, which is related to the C-S/S-S bonds, also found on EDT molecules [
35]; finally, the signal observed at ~168 eV is related to the oxidation of S, as previously mentioned [
33].
The XPS spectra corresponding to the PbS-TBAI sample (
Figure 6c) show only two signals at ~160 eV and ~162 eV, with both signals attributed to the S2p3/2 and S2p1/2 peaks, respectively, observed in the Pb-S bond [
32]; again, the absence of signals related to the degradation of PbS suggests a successful and effective ligand exchange procedure nd improved surface passivation. Finally, for the case of the PbS-L-Cys sample (
Figure 6d), the S2p peak shows several signals. The peaks at ~160 eV and ~161 eV correspond to the S2p3/2 and S2p1/2 signals, respectively, found in the Pb-S bond [
32]; additionally, a peak at ~163 eV can be seen, related to the S-H interaction found in L-Cysteine molecules [
36], while the peak observed at ~165 eV corresponds to the presence of oxidized S atoms (SO
32−) [
33]; in this case, the oxidized S atoms could be from the L-Cysteine molecule, because the Pb4f peak from this sample (
Figure 5d) did not show a signal related to the presence of PbSO
3.
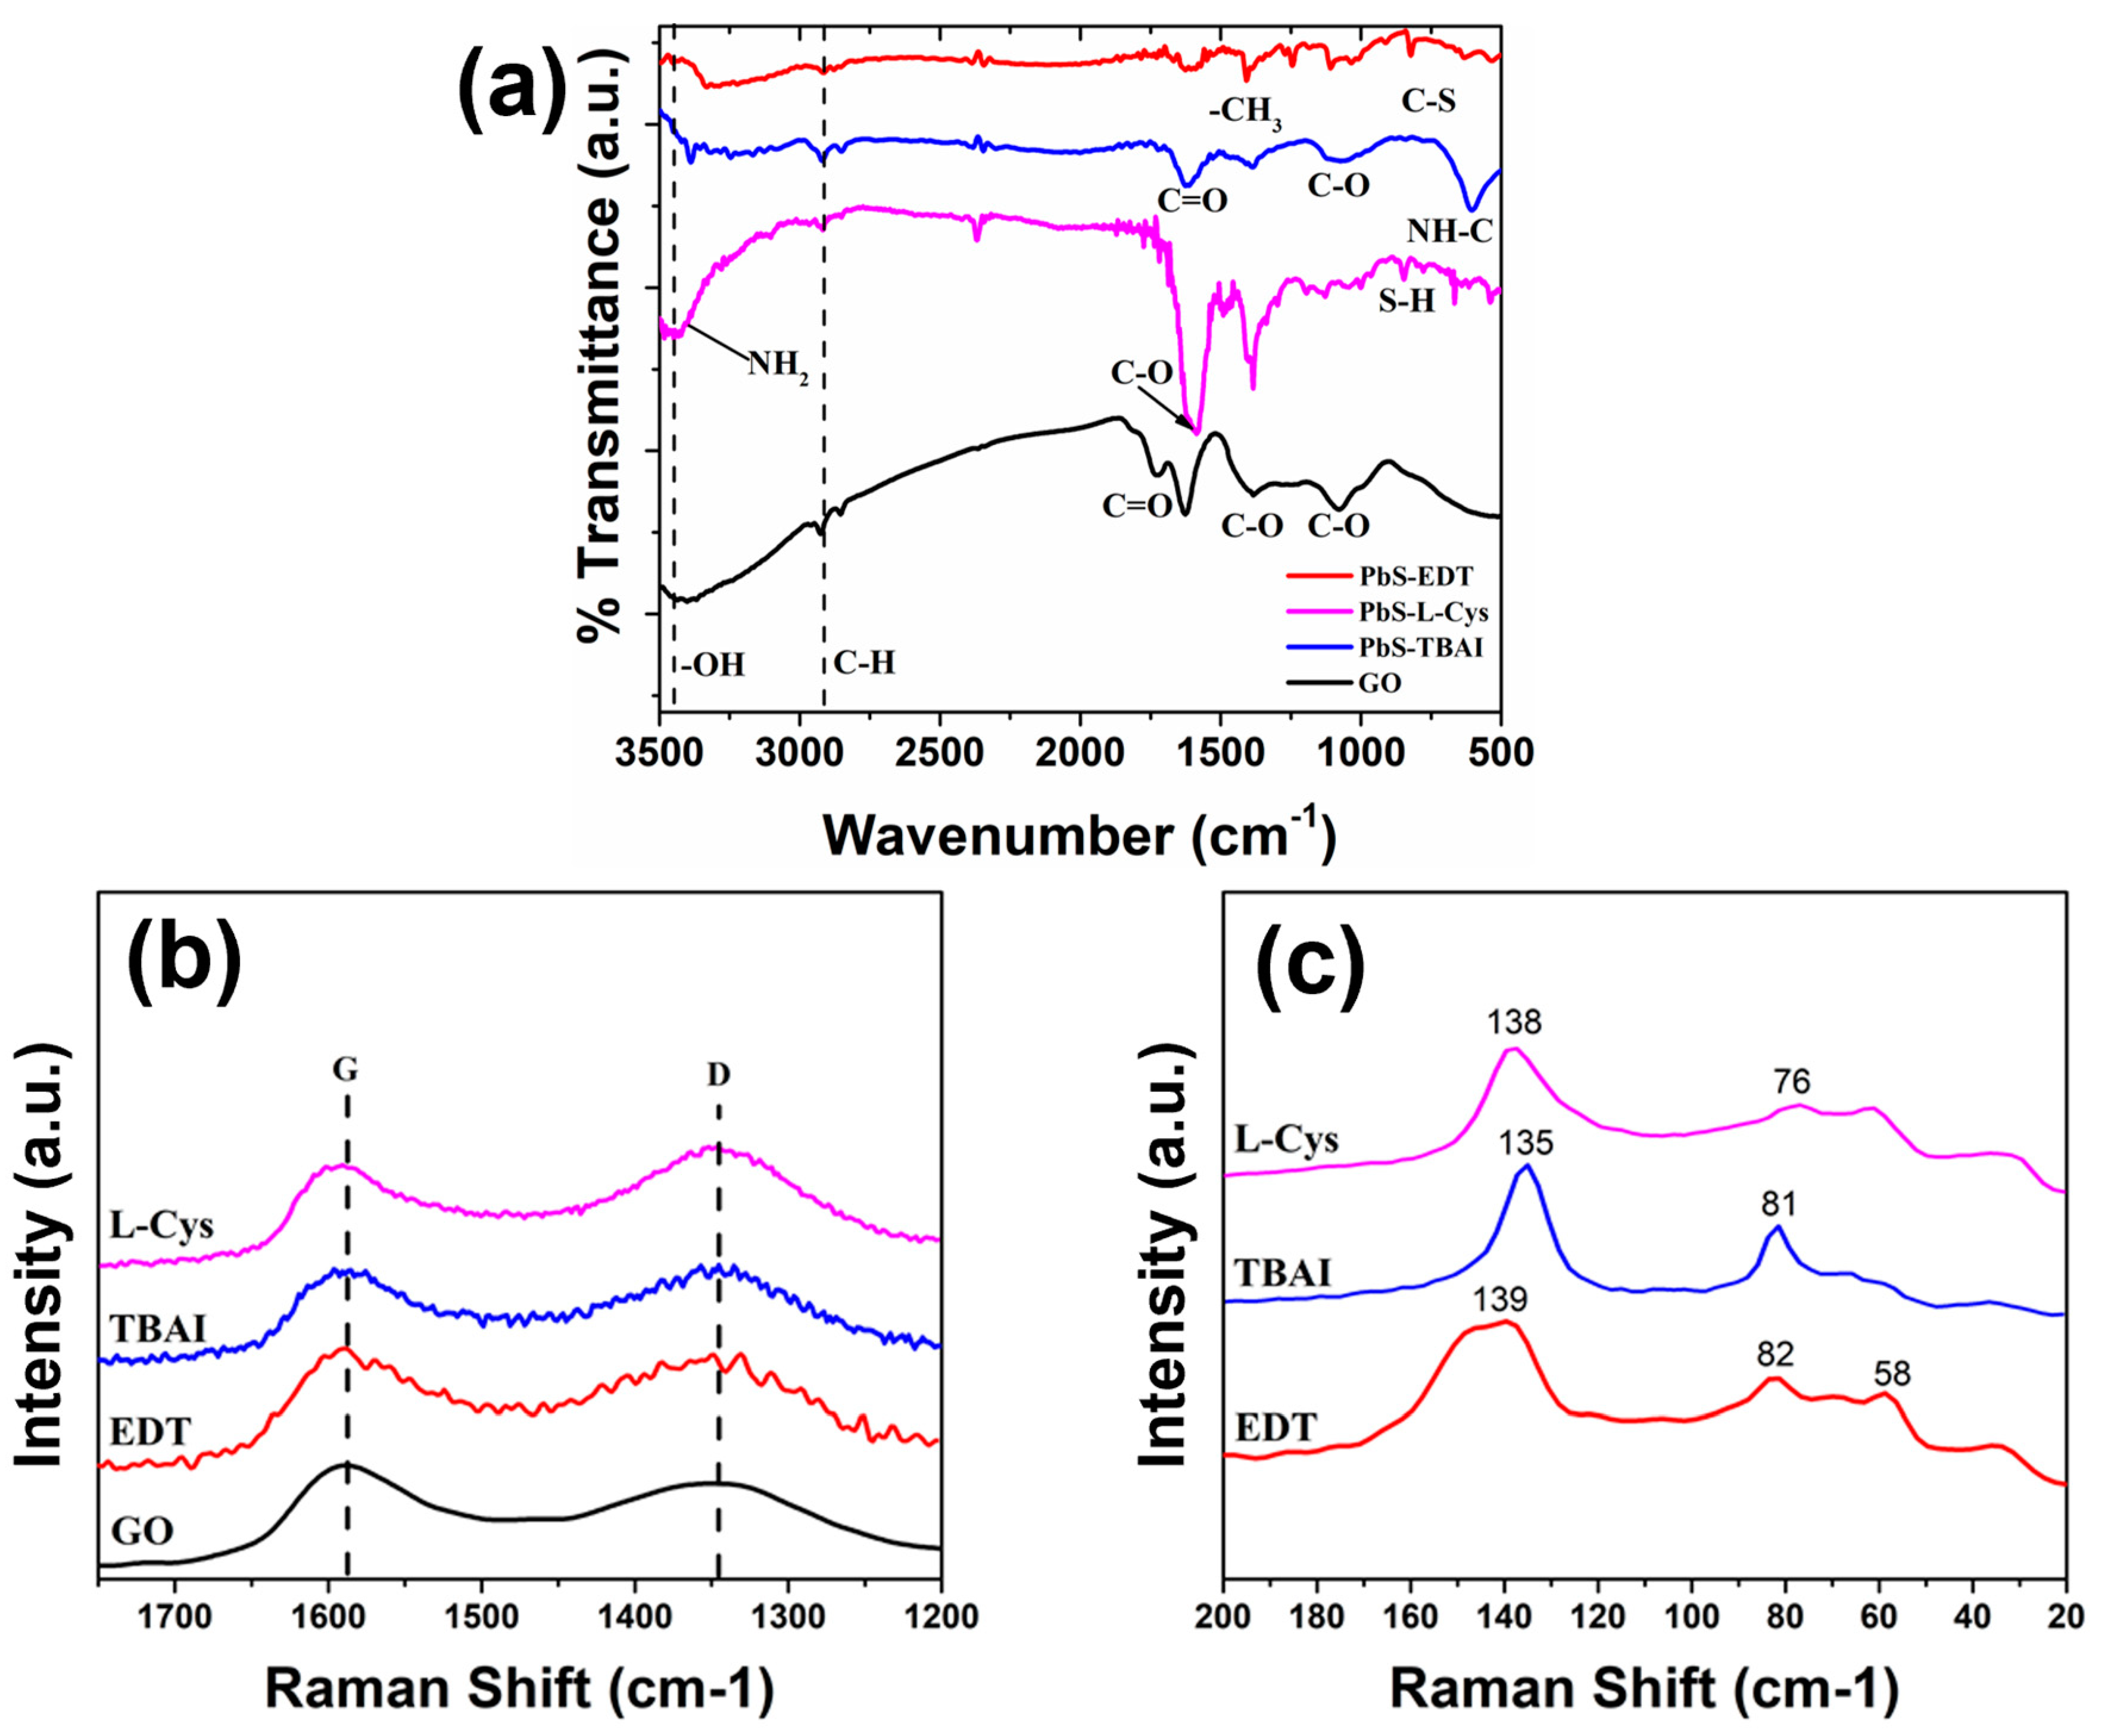
For the case of the NHMs, several bands were observed in their FTIR spectra (
Figure 7a). In the PbS-EDT/GO sample, a band at ~825 cm
−1 can be seen and is attributed to the C-S group vibration [
22]; at ~1416 cm
−1, another signal can be observed, which corresponds to the vibration of the -CH
3 group found on GO [
37]; at ~1629 cm
−1, a band can be observed related to the vibration of the -CH
2 group, while the bands observed at ~2917 cm
−1 and ~3429 cm
−1 correspond to the vibrations of the C-H and O-H groups, respectively [
37]. Similarly, for the nanostructured hybrid material (NHM) PbS-L-Cys/GO, a band can be observed at ~845 cm
−1, which corresponds to the S-H group vibration; at ~1582 cm
−1, the signal related to the C-O stretching can be seen; at ~1618 cm
−1, a signal corresponding to the C=O group can be observed, while the bands detected at 3100 cm
−1 and ~3413 cm
−1 correspond to the stretching of the OH and NH
2 groups, respectively [
37]. For the case of the PbS-TBAI/GO hybrid material, different bands were observed at ~610 cm
−1, corresponding to the vibration of secondary amide NH-C [
38]; two bands characteristic of the C-O group stretching were observed at ~1070 cm
−1 and ~1385 cm
−1; at ~1625 cm
−1, a signal appears that is related to the vibration of the C=O group; finally, the bands observed at ~2919 cm
−1 and ~3388 cm
−1 correspond to the characteristic vibrations of C-H and O-H stretching [
37], respectively. The FTIR spectra of the GO are also presented in
Figure 7a, where the characteristic bands of GO can be observed. At ~1075 cm
−1 and ~1385 cm
−1, bands attributed to the vibrational modes of the epoxy (C-O-C) and carboxyl (COOH) groups can be seen [
37], respectively; at ~1260 cm
−1, another band related to the stretching of the C-O-C group can be observed, while the bands appearing at ~1625 cm
−1 and ~1725 cm
−1 correspond to the stretching and vibration of the carbonyl group (C=O) [
37,
39]; finally, the bands observed at ~2910 cm
−1 and ~3401 cm
−1 correspond to the vibrations of the C-H and O-H groups, respectively [
37].
The Raman spectra for the NHMs can be observed in
Figure 7b,c. Particularly,
Figure 7c shows the region corresponding to the phonon vibrations observed in PbS QDs, where clear signals can be detected between ~30 cm
−1 and ~144 cm
−1. The peaks observed at ~82 cm
−1, ~81 cm
−1 and ~76 cm
−1 in the PbS-EDT/GO, PbS-TBAI/GO and PbS-L-Cys/GO samples, respectively, might be related to the LA phonon vibrations in PbS QDs previously discussed in this manuscript, which differ from the values measured in only the PbS QD samples. For the case of the PbS-EDT sample, no clear peak was observed close to this value, while for the case of the PbS-TBAI and PbS-L-Cys samples, the peaks were observed at 80 cm
−1 and 89 cm
−1, respectively. The peaks detected at ~33 cm
−1, ~37 cm
−1 and ~30 cm
−1 in the PbS-EDT/GO, PbS-TBAI/GO and PbS-L-Cys/GO samples, respectively, might be related to the TA phonon vibrations in PbS QDs previously discussed in this work. The different PbS QD samples displayed peaks related to these TA phonon vibrations at ~40 cm
−1, ~42 cm
−1 and ~34 cm
−1 in the PbS-EDT, PbS-TBAI and PbS-L-Cys samples, respectively. The peaks observed at ~139 cm
−1, ~135 cm
−1 and ~138 cm
−1 in the PbS-EDT, PbS-TBAI and PbS-L-Cys samples, respectively, are still related to the Pb-O-Pb stretching in lead oxide, as has been previously discussed in this work. The variations in the values measured can be attributed to the interaction between the PbS QDs’ surface and the GO flakes, which has a clear effect on the surface vibrational modes observed on the PbS QDs. All the NHMs displayed a Raman peak at ~60 cm
−1, which could be related to the formation of additional low-energy/low-symmetry phonon vibrations as a consequence of the QD surface’s mechanical softness, as previously discussed in this paper. Finally, when comparing the Raman spectra of the PbS QD samples after the capping ligand process and the spectra for the NHMs, it can be observed that the Raman spectra for the PbS QD samples showed very different surface phonon vibrations in the range between 25 cm
−1 and 100 cm
−1, not only in the values of the peaks observed but also in their intensities (
Figure 4b), whereas in the NHM samples, the peaks observed, and their relative intensities, are similar in all three cases. These observations suggest that the surface phonon vibrations observed in the PbS QDs after the hybrid material is formed are strongly determined by the interactions between the GO flake (functional groups) and the PbS QDs’ surface, promoting the formation of the surface phonon modes observed in
Figure 7c.
Figure 7b shows the region where the D and G band for GO can be observed (~1250–~1700 cm
−1). The D band is located at ~1347 cm
−1 and relates to the defects and structural disorder found on the GO flakes [
40]; this band is also related to the vibrational modes indicating the presence of sp
3 hybridization between C atoms. The G band is located at ~1594 cm
−1 and can be attributed to the in-plane stretching vibration of the C bonds with sp
2 hybridization in the GO flakes [
40]. All NHM samples displayed the D and G bands at the same values, which is a confirmation of the presence of GO in the NHMs with the PbS QDs with different capping ligands. Slight variations in the ratio between the intensities of the D and G bands were seen between the different samples. While in the PbS-TBAI/GO and PbS-L-Cys/GO samples, the D band shows a higher intensity than the G band, indicating more disorder/higher presence of sp
3 hybridization in the structure of the GO flake, the PbS-EDT/GO sample displays a G band that is slightly higher than the D band—more similar to the GO spectra—which can be attributed to fewer defects on the GO flake structure or less disorder/higher presence of sp
2 hybridization between C atoms or less interactions with surface functional groups.
Table 2 shows the Tuinstra–Koenig ratio (I
D/I
G), which shows the ratio between the D band and G band intensity in the different samples. It has been reported that lower values for this ratio indicate a decreased level of defects and more sp
2 hybridization in the GO structure [
40].
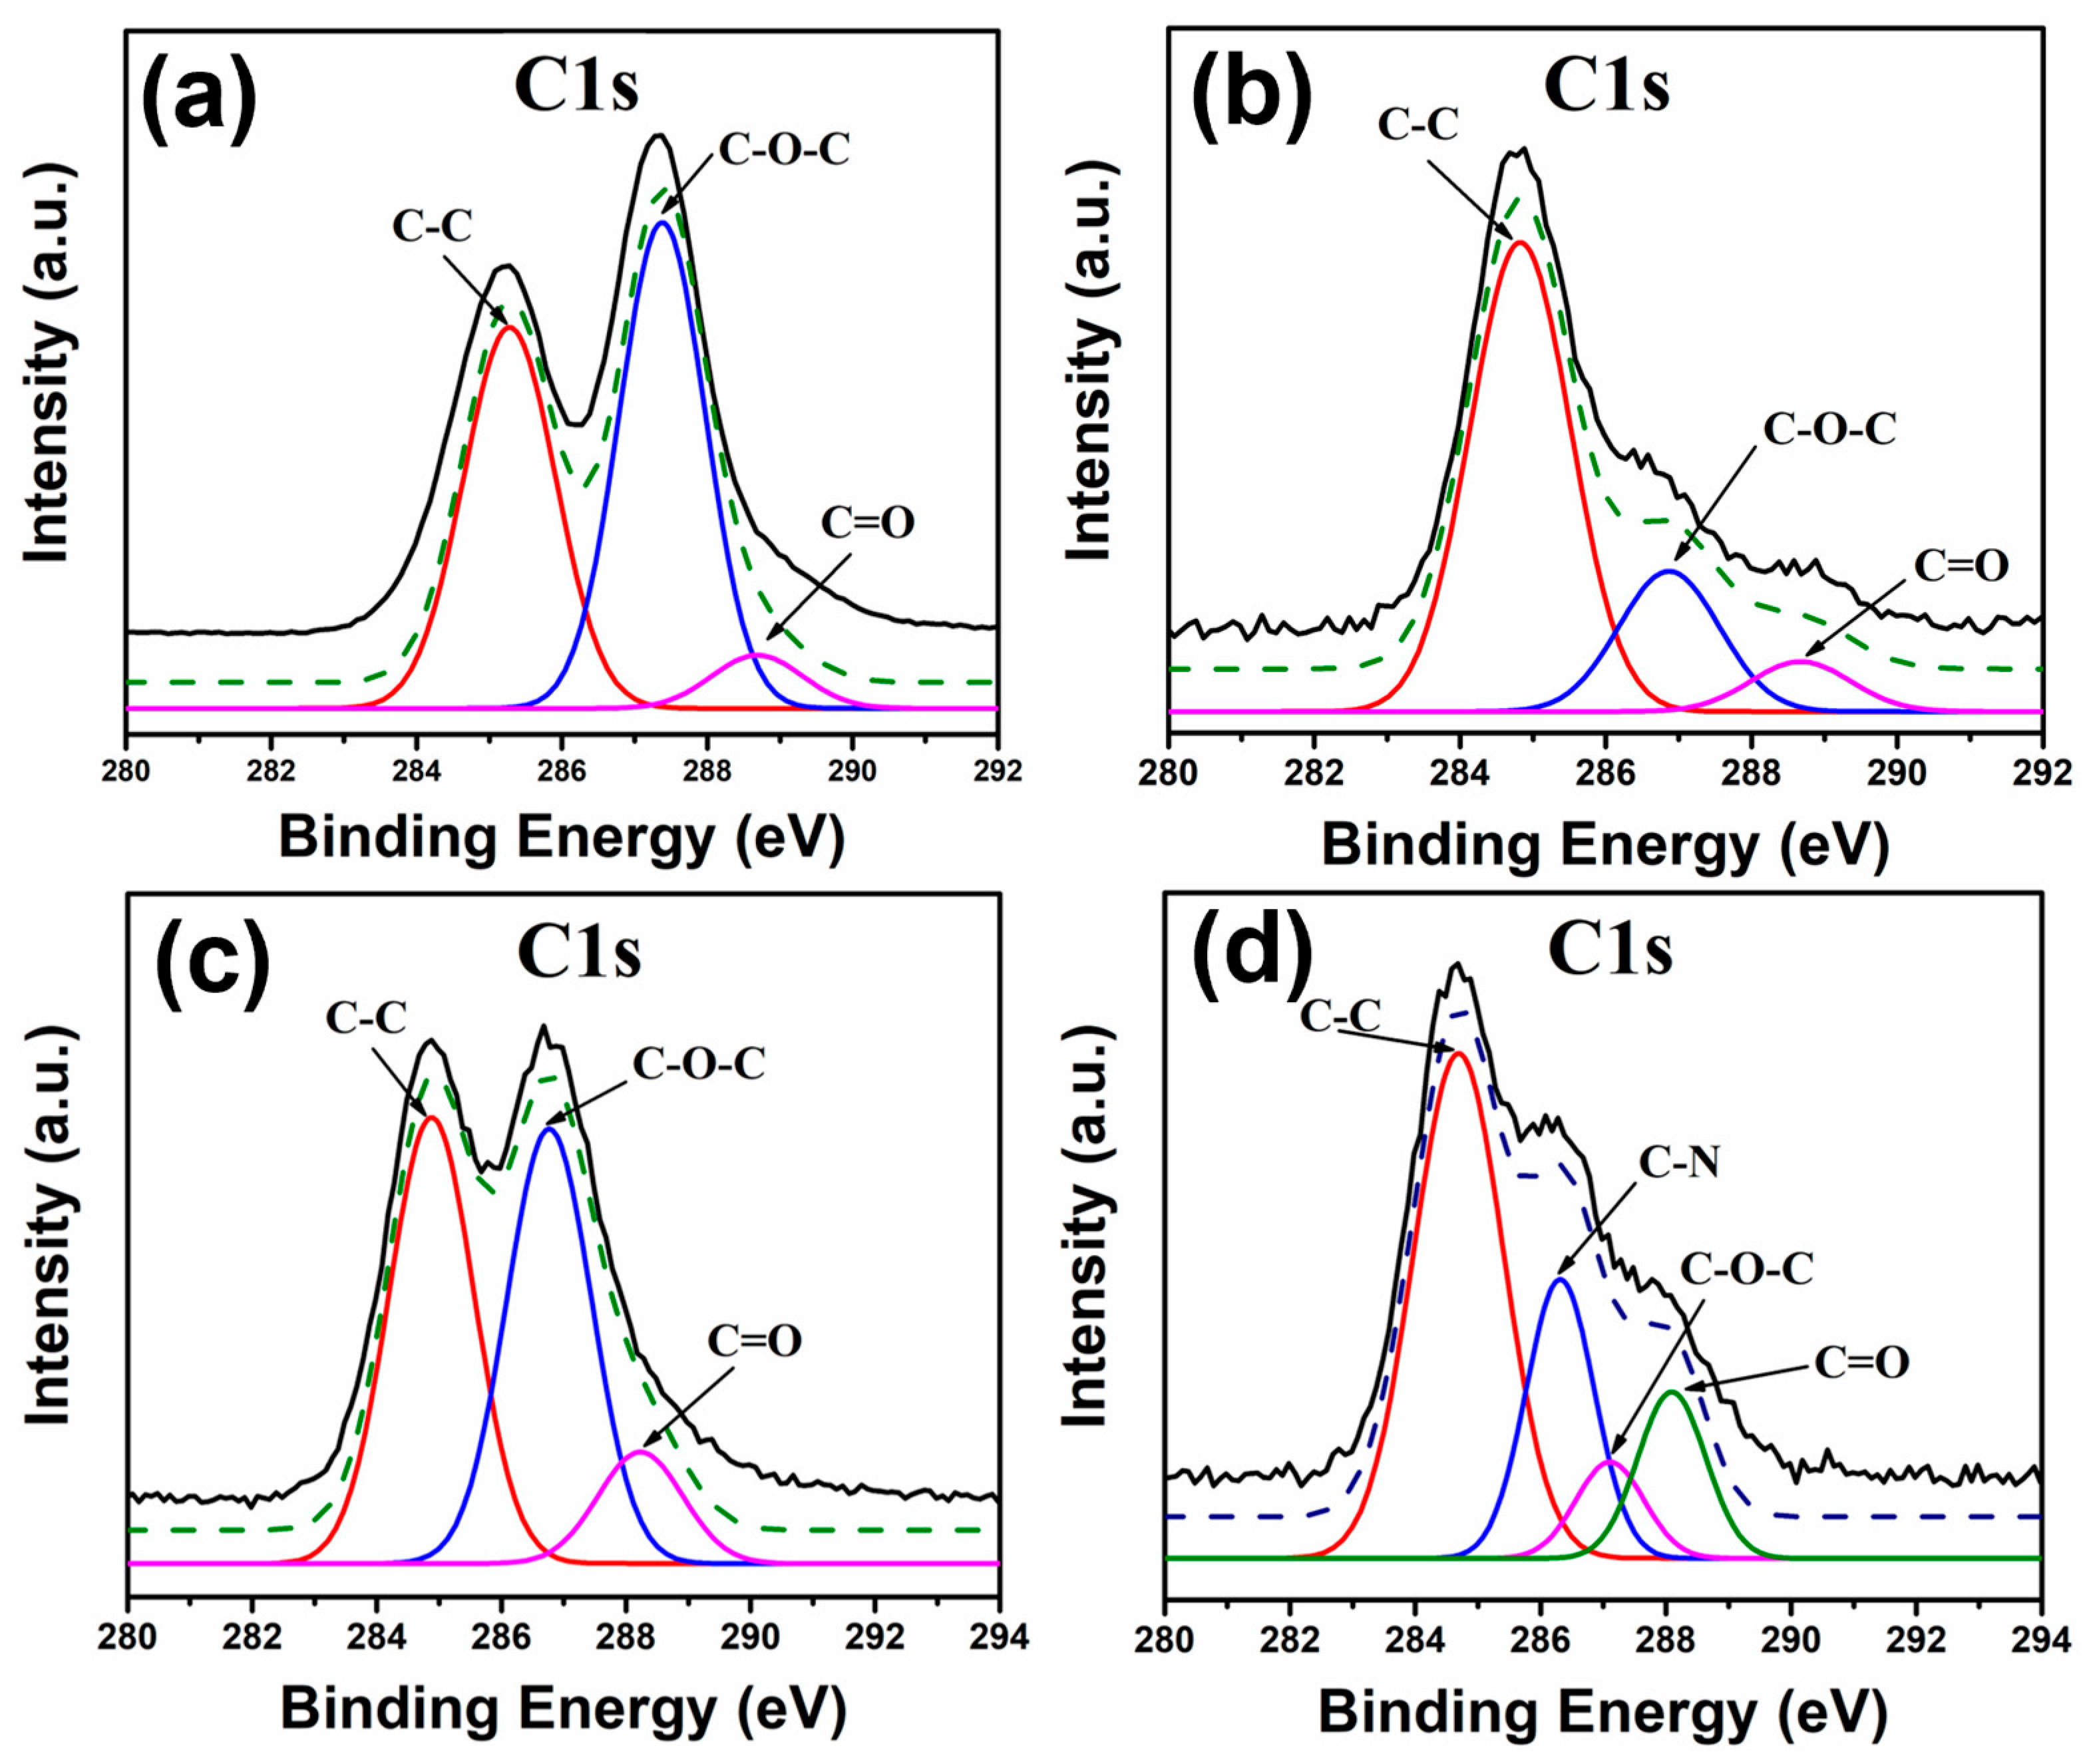
Following the analysis of the NHMs, the XPS spectra were acquired. For these analyses, the C1s and the Pb4f peaks were studied. For the case of the C1s peak, the GO sample (
Figure 8a) displayed three signals at ~288 eV, ~287 eV and ~284 eV, which correspond to the functional groups C=O, C-O-C and C-C [
41], respectively.
In the PbS-EDT/GO sample (
Figure 8b), the same signals were observed as in the GO sample, with the only difference being observed in the intensity of the epoxy group (C-O-C) signal, which decreased considerably in the PbS-EDT/GO sample. For the case of the PbS-TBAI/GO sample (
Figure 8c), the same signals were observed; again, the only difference between this sample and the previous one was the intensity of the signals deconvoluted for the different functional groups. Finally, for the PbS-L-Cys/GO sample (
Figure 8d), four signals were obtained at ~284 eV, ~286 eV, 287 eV and ~288 eV, corresponding to the presence of the C-C, C-N, C-O-C and C=O functional groups [
41], respectively.
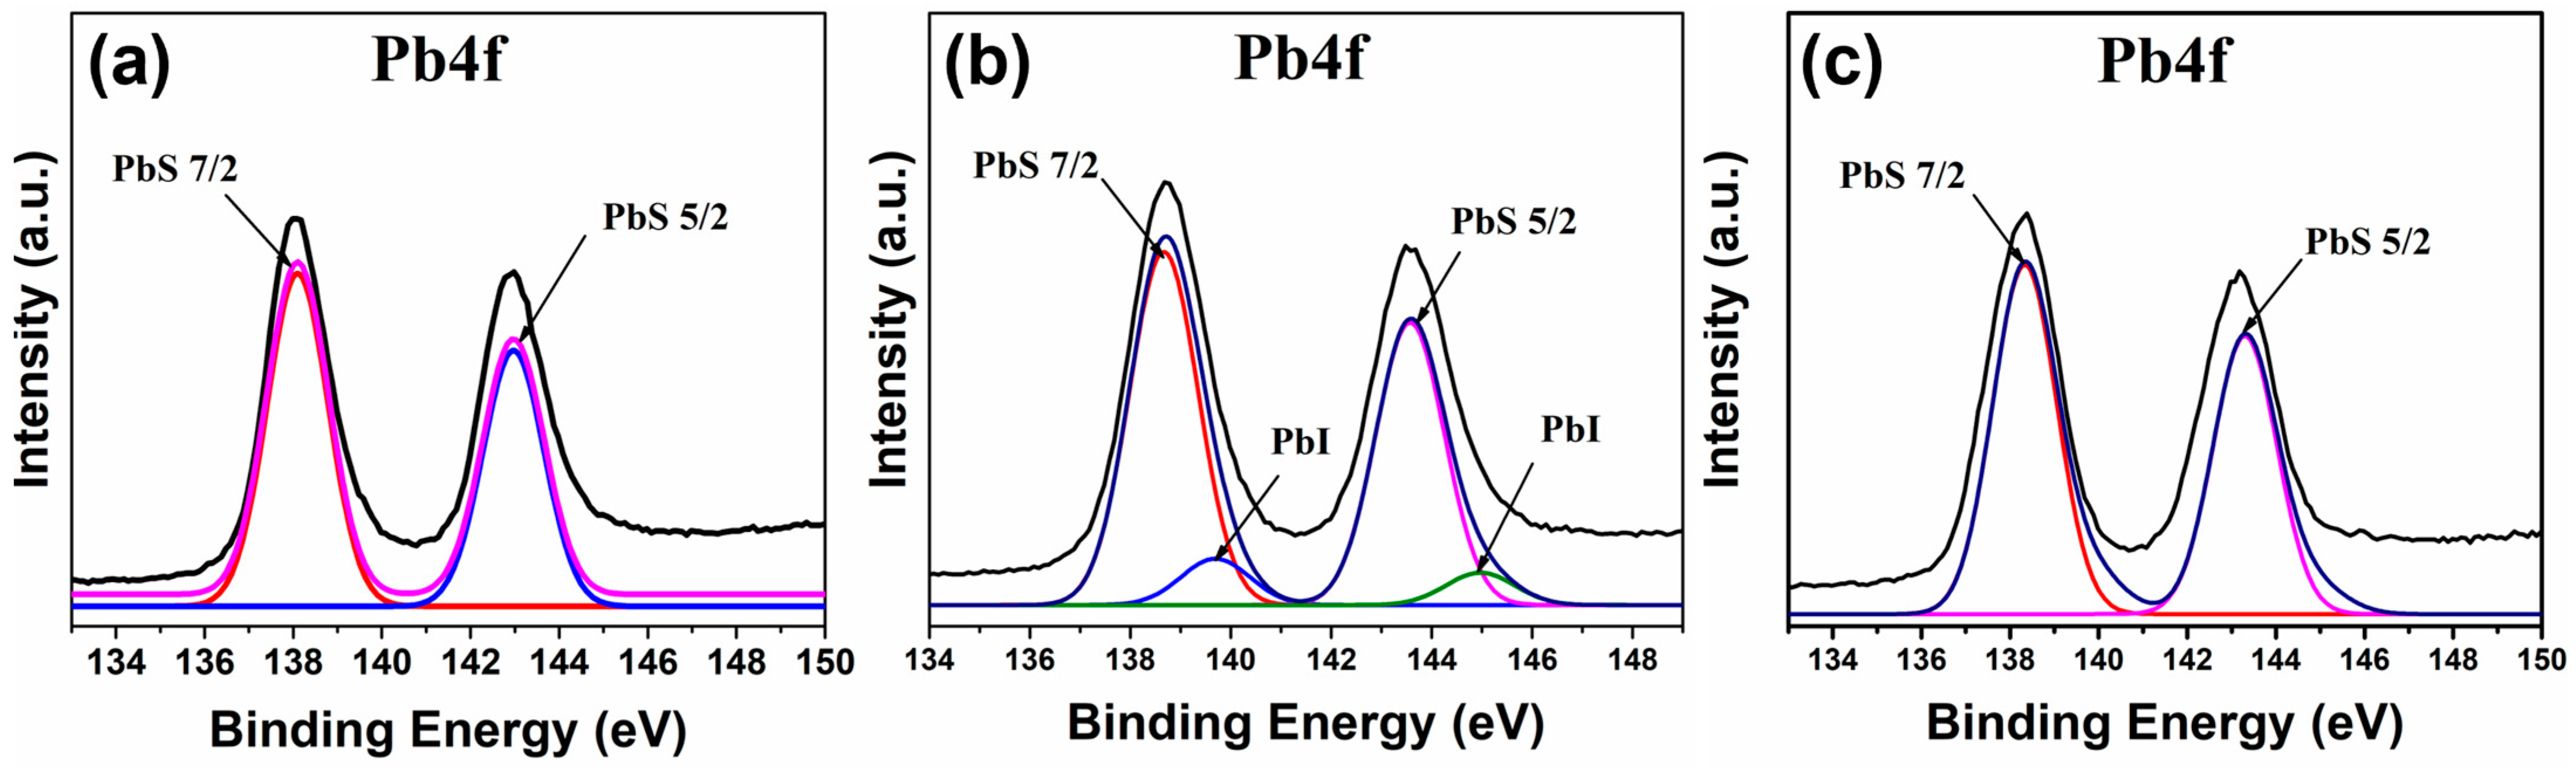
Figure 9 shows the XPS Pb4f peak for the NHMs analyzed. In all three samples, the peaks observed at ~138 eV and ~143 eV correspond to the PbS 7/2 and PbS 5/2 peaks, respectively, of the Pb-S bond [
30]. In the PbS-TBAI/GO sample (
Figure 9b), an additional signal at ~140 eV and ~145 eV can be detected, which is related to the Pb-I bond found in the sample [
31].
All these results (FTIR, Raman and XPS) confirm the formation of the hybrid materials in solution, because clear signals related to the PbS QDs with different capping ligands and GO are present in all the results from the characterization techniques. Particularly, Raman spectroscopy showed clear signals of the PbS QDs’ surface phonon vibrations and the D and G bands of the GO (
Figure 7). Additionally, Raman spectroscopy suggested a strong interaction between the PbS QDs and the GO flakes, reflected by the variations observed in the Raman spectra of the hybrid materials and the PbS QDs. Moreover, the XPS results contributed more evidence on this regard, as the C1s peak showed clear differences between the three samples, especially when compared to the GO sample. The clear decrease in the intensity of the C-O-C signal in the C1s peak in the PbS-EDT/GO sample suggests a reduction in the GO due to the interaction with the PbS QDs and their capping ligand; additionally, the Pb4f peak for this same sample did not show any signals related to the degradation/oxidation of PbS, which suggests a strong interaction of the PbS QDs and the GO flakes that is not only reducing the GO but is also increasing the ambient stability of the PbS QDs when they are forming the hybrid material. Moreover, the lower Tuinstra–Koenig ratio for this same sample also supports the strong interaction between the PbS QDs’ surface and the GO flakes, which contributes to the restoration of the sp
2 hybridization between the C atoms in the GO. For the case of the PbS-TBAI/GO sample, the Raman results (Tuinstra–Koenig ratio) suggest increased disorder in the GO compared to the GO before the hybrid material formation, which can be attributed to the larger capping ligand molecule that prevents a more intimate interaction with the GO flake, like in the PbS-EDT case. The XPS C1s peak for this sample also showed a decrease in the C-O-C signal compared to the GO sample before the hybrid formation, but it was not as clear as in the PbS-EDT case. The XPS Pb4f peak for this sample suggests the same ambient stability observed in the PbS-TBAI sample before the hybrid formation. Finally, the PbS-L-Cys/GO sample showed remarkably comparable results to the PbS-TBAI/GO sample, as their Tuinstra–Koenig ratios were remarkably similar and the ambient stability of the PbS QDs seemed to be similar before and after the hybrid formation. The main difference between these two samples was observed in the C1s peak, where several signals related to the functional groups found on L-Cysteine molecule were observed. Based on the FTIR, Raman and XPS results shown in this work, it is suggested that chemical bonds (covalent) and Van der Waals interactions are taking place in this type of NHM, as has been previously reported by other authors [
42,
43,
44]. The FTIR and XPS results suggest a strong chemical interaction occurring between the capping ligand molecules on the QDs’ surface and the GO flakes, as a chemical reduction is happening in the GO due to the replacement of O-rich functional groups on their surface by the molecules in the capping ligands, whereas the Raman spectra also suggest an interaction between the atoms on the surface of the PbS QDs and the GO flakes, based on the variations observed in the QDs’ surface vibrations. Further studies will be required to make a precise determination of the importance and prevalence of both mechanisms.
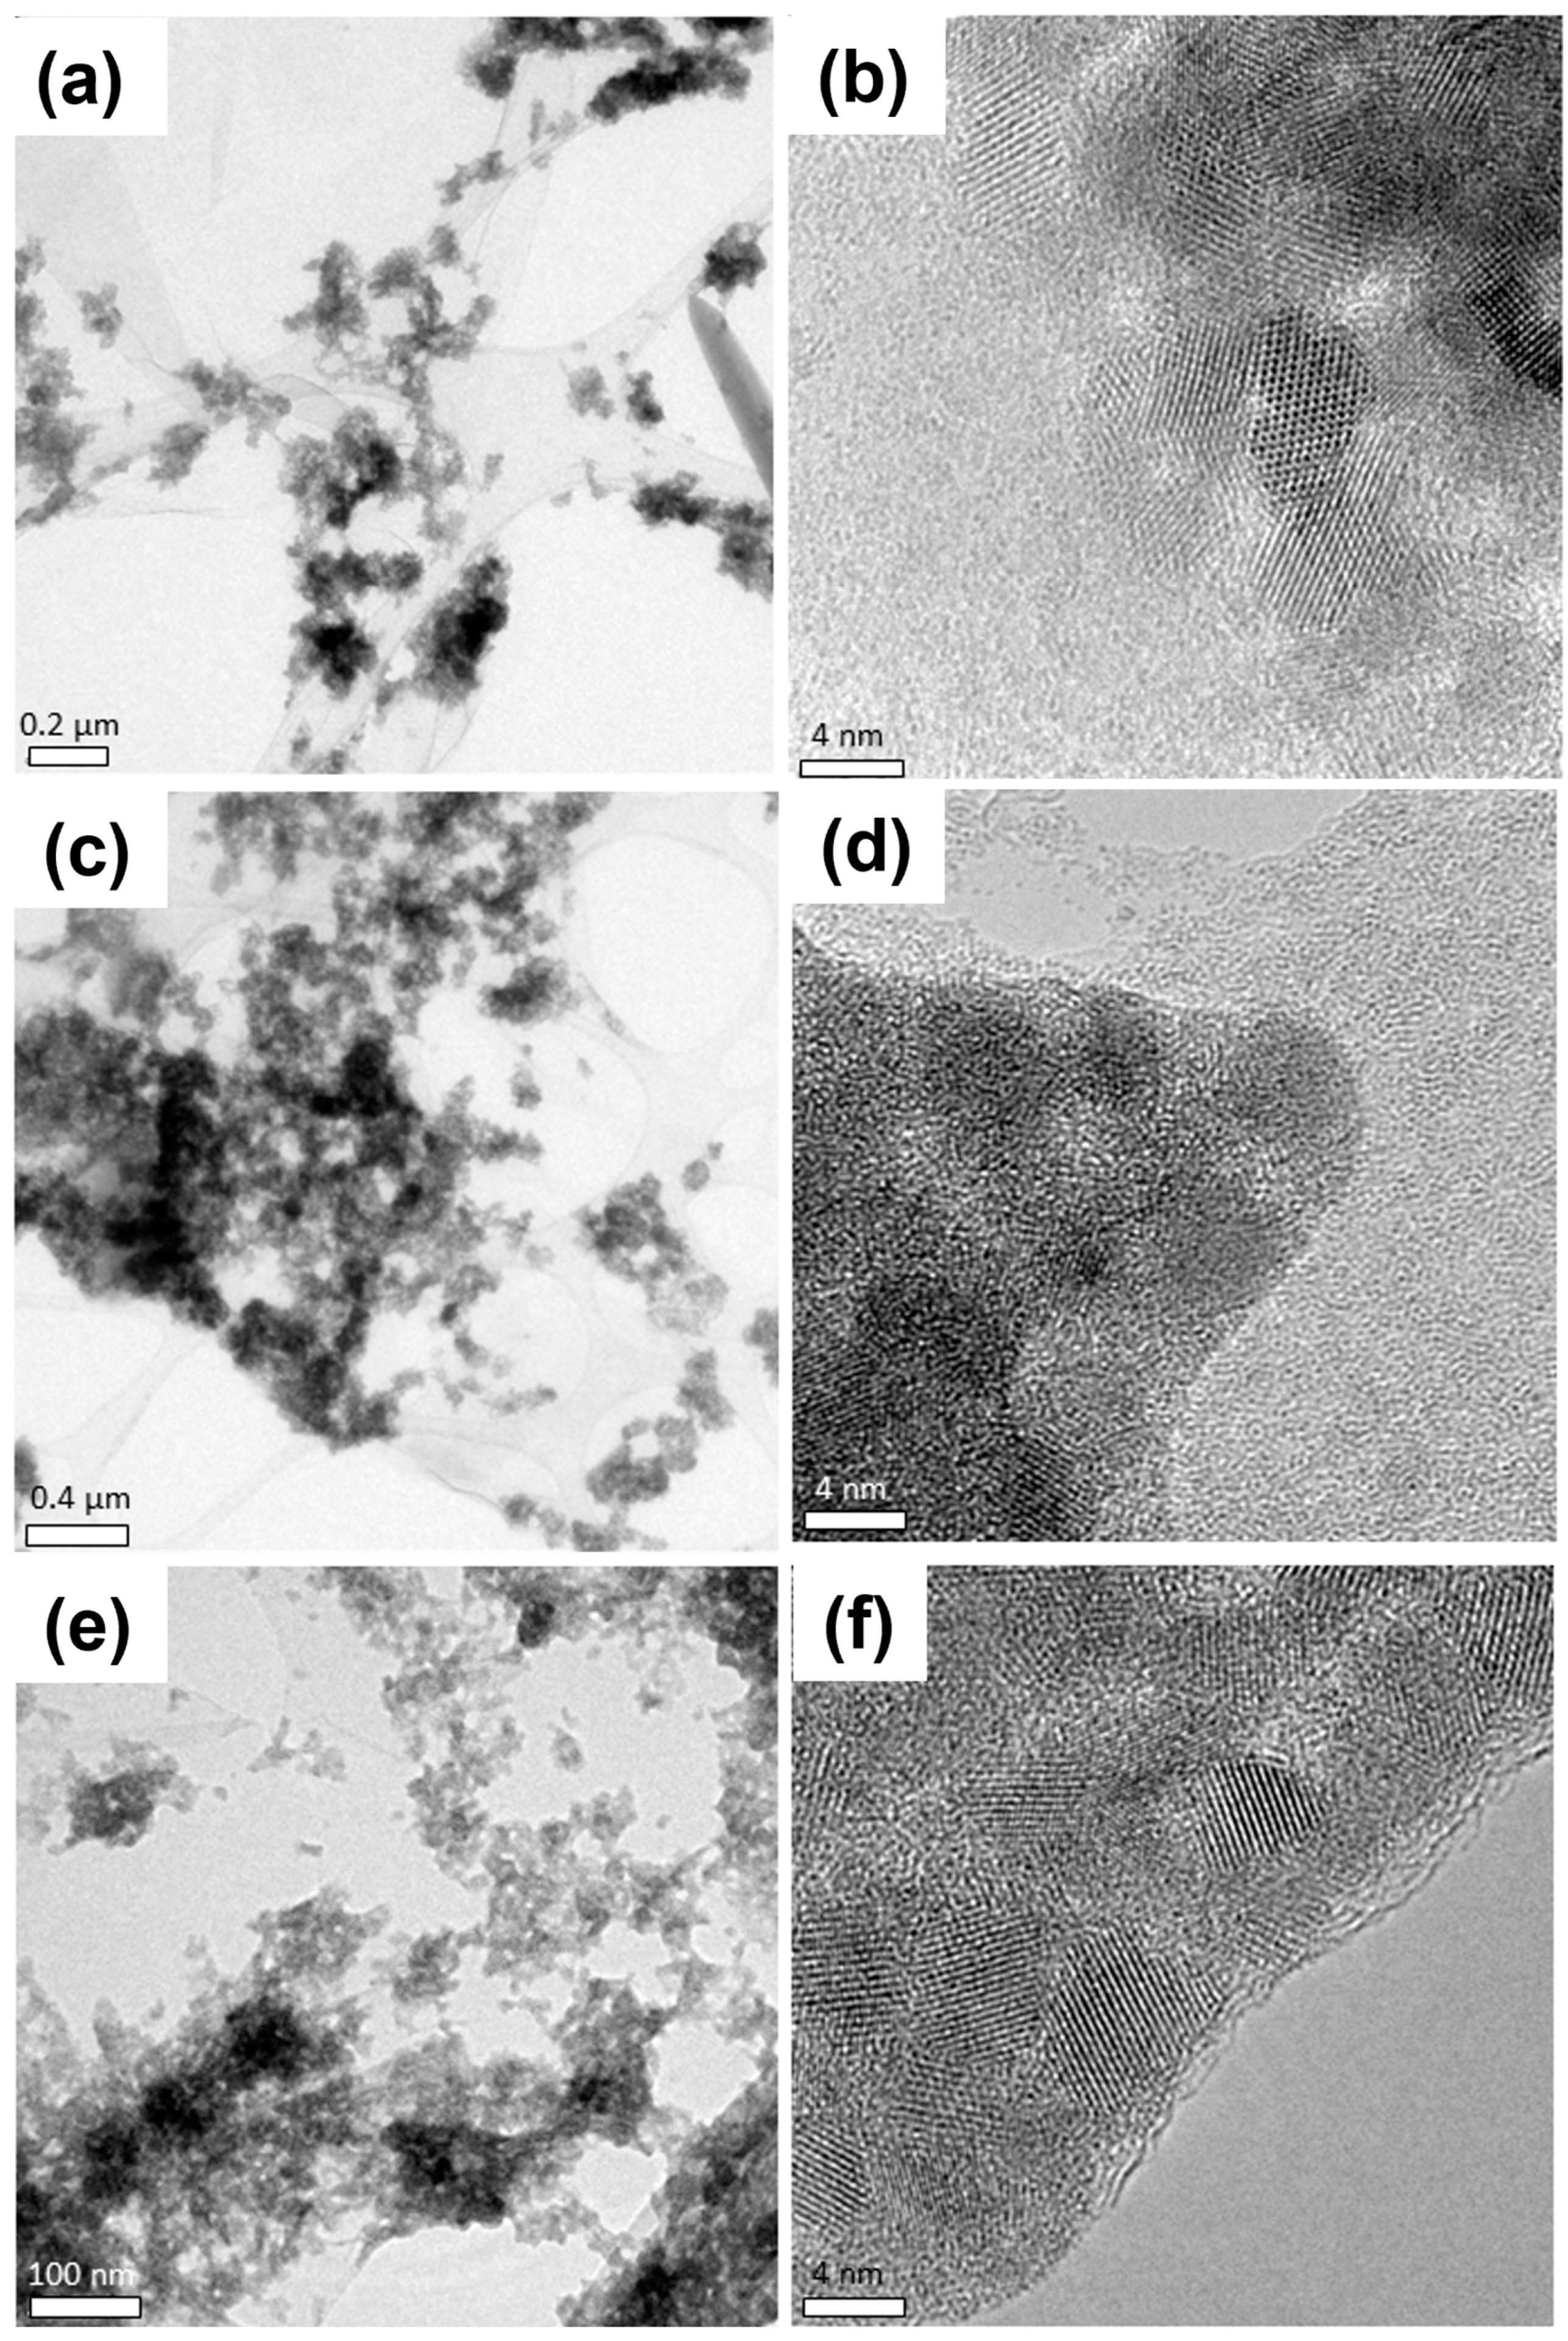
The most relevant TEM results of the studied NHMs are shown in
Figure 10. In all samples, the GO flakes can be observed to be “decorated” by the PbS QDs; however, the PbS QDs can be seen to form agglomerates on the GO flakes. In the PbS-EDT/GO sample, the GO can be observed with “folds” close to the center of the image, and the PbS-EDT QDs are observed to form agglomerates that are randomly distributed on the GO flakes. HRTEM images from this sample (
Figure 10b) show a higher magnification of the PbS QD agglomerates, where a clear lattice resolution can be seen on the PbS QDs, showing the high crystallinity of the ligand-exchanged PbS QDs, whereas the contrast observed in the region of the GO flake corresponds to the contrast observed in amorphous materials. Comparable results can be observed for the other two NHMs. The PbS-TBAI/GO sample also showed clear aggregates of PbS QDs that were randomly distributed on the GO flakes (
Figure 10c); again, higher-magnification images showed amorphous contrast in the region corresponding to the GO flake and crystalline contrast in the PbS QD agglomerates (
Figure 10d). Finally, images of the PbS-L-Cys/GO sample showed the same trend, a high number of PbS QDs agglomerates randomly distributed on the GO flakes (
Figure 10e), while HRTEM images (
Figure 10f) showed the high crystallinity of the PbS-L-Cys QDs and the amorphous nature of the GO flakes.
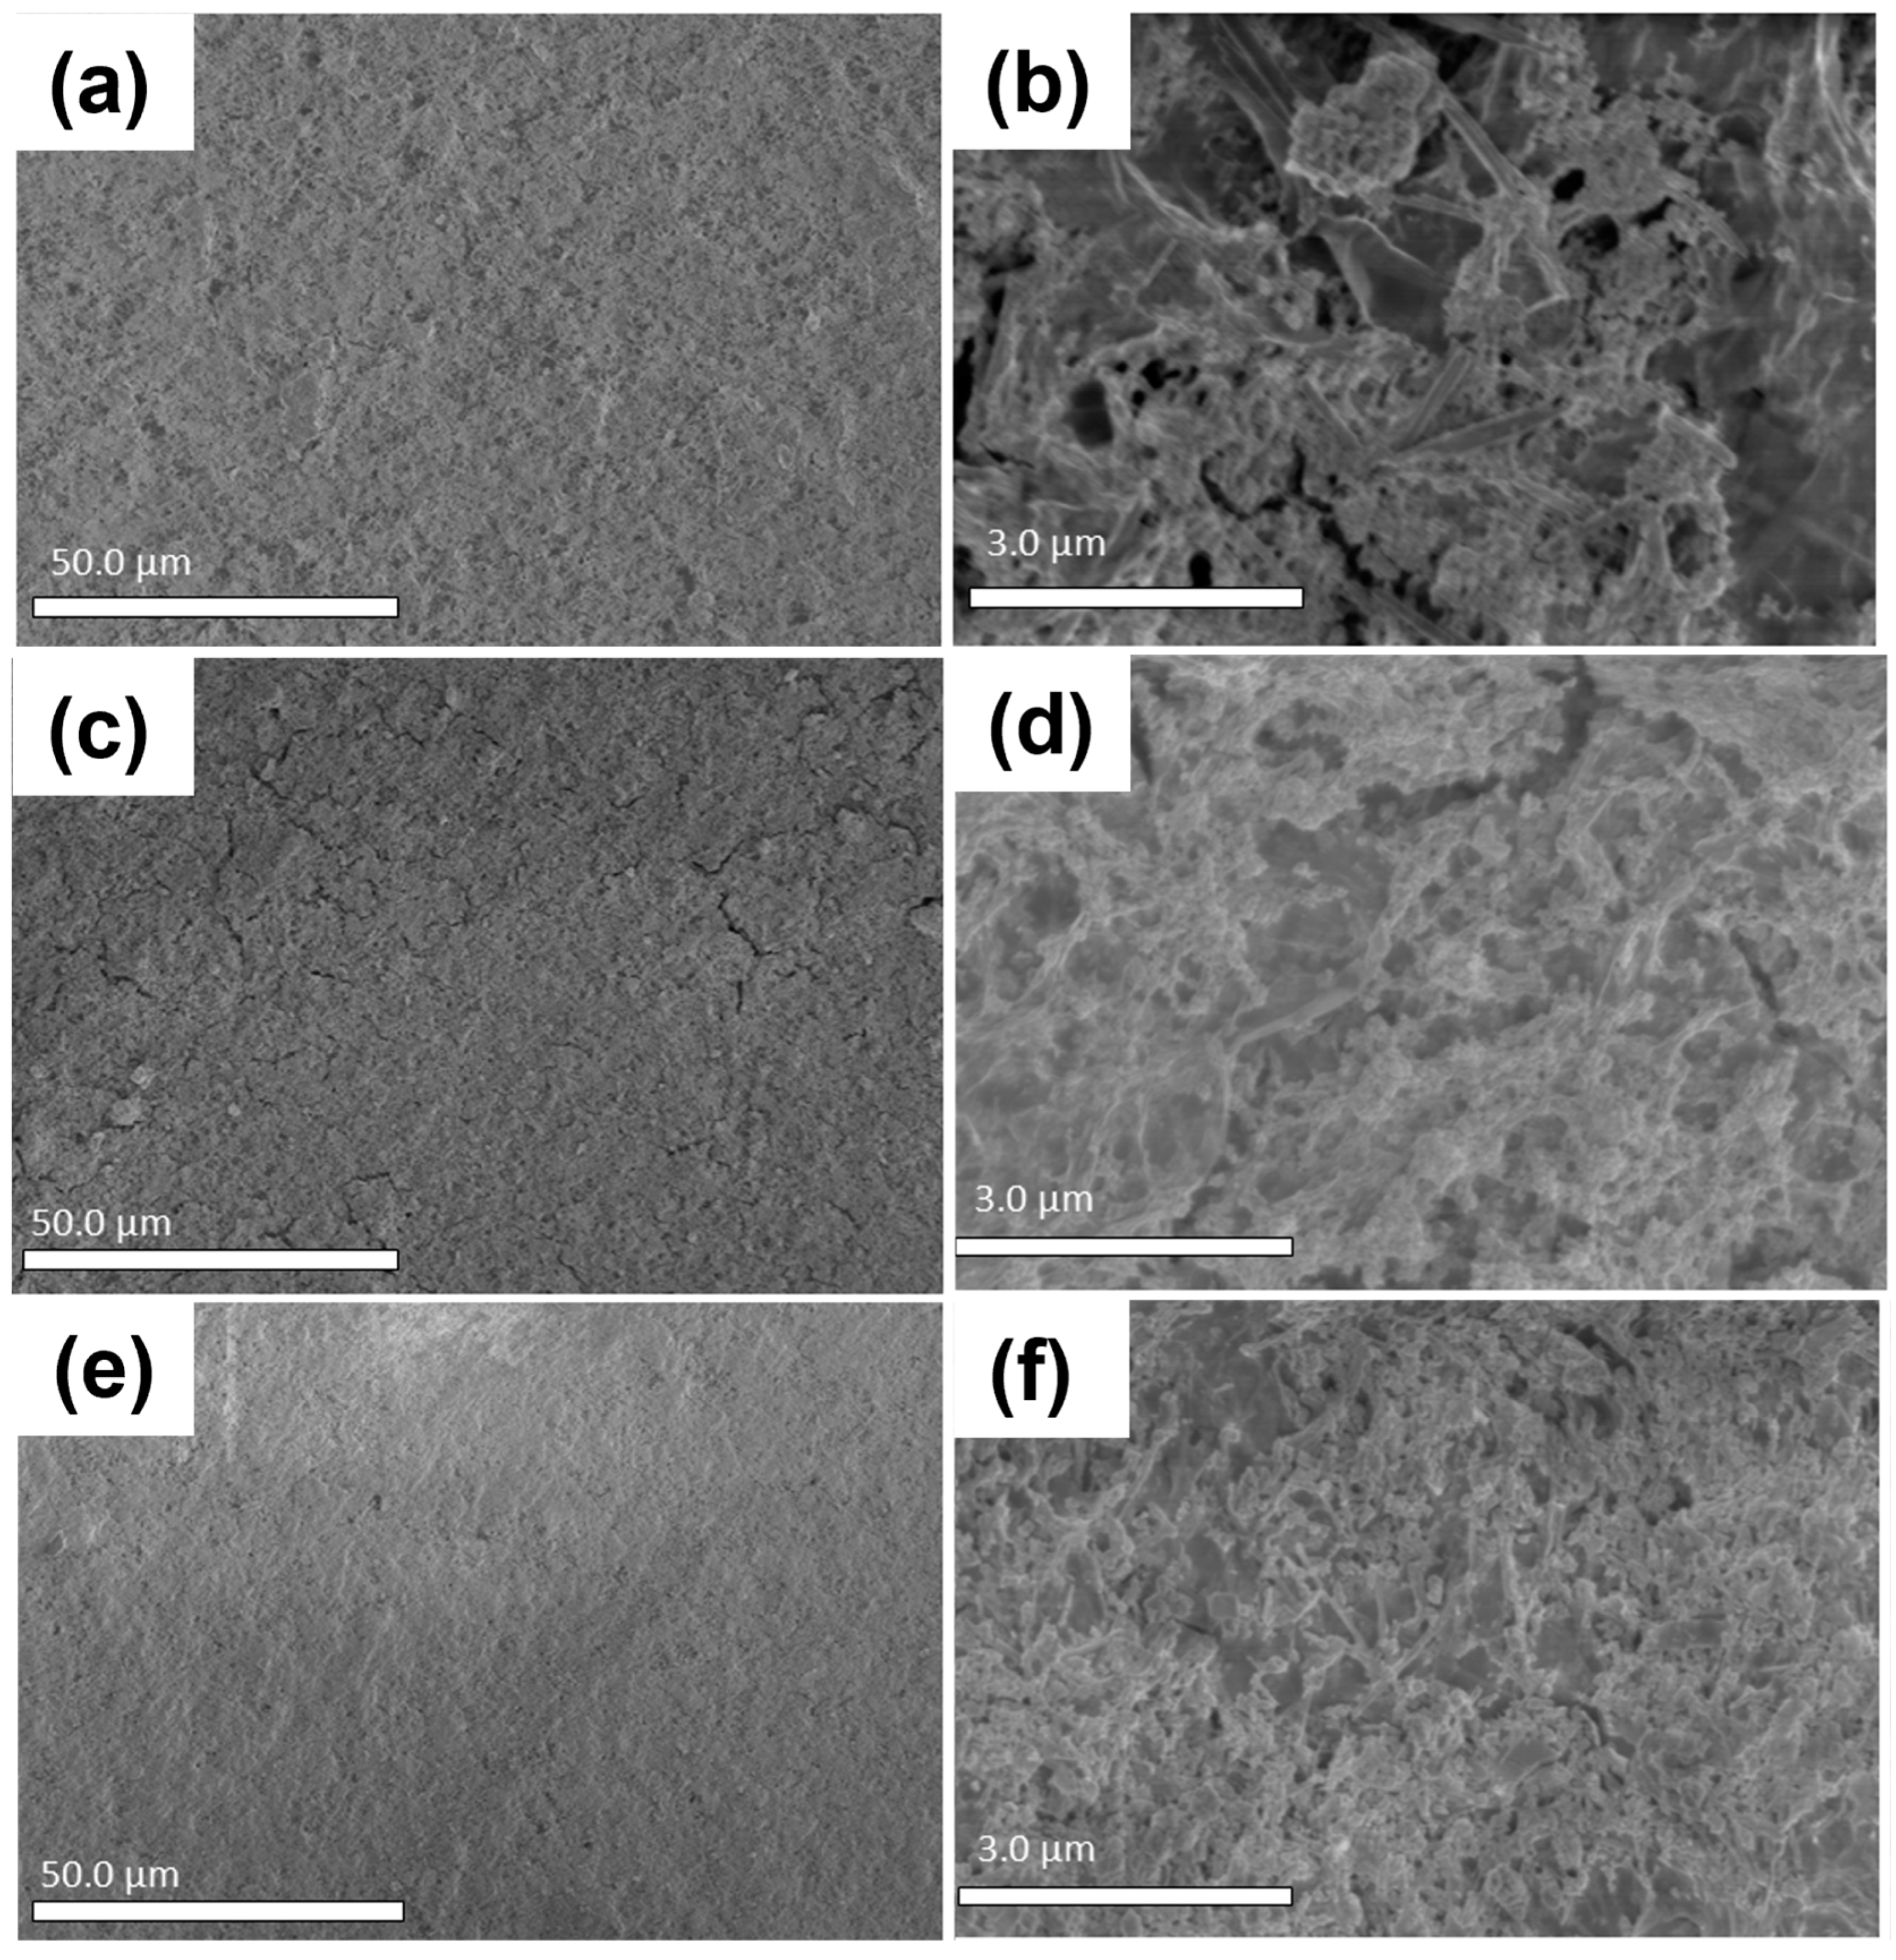
Thin films deposited from the NHMs via spin coating were studied using SEM. Surface morphology and quality were determined based on this analysis, and the most relevant results are shown in
Figure 11. In all three cases, at lower magnification, the thin films seemed to be homogenous, covering the substrate with a good surface quality; however, as the magnification was increased, the quality of the surface was not as good as originally observed. At higher magnifications, the GO flakes could be observed, and the PbS QD agglomerates, previously observed with TEM, were also clearly seen in enormous quantities randomly distributed on the GO flakes all over the thin films. The same results were observed in all three NHMs studied.
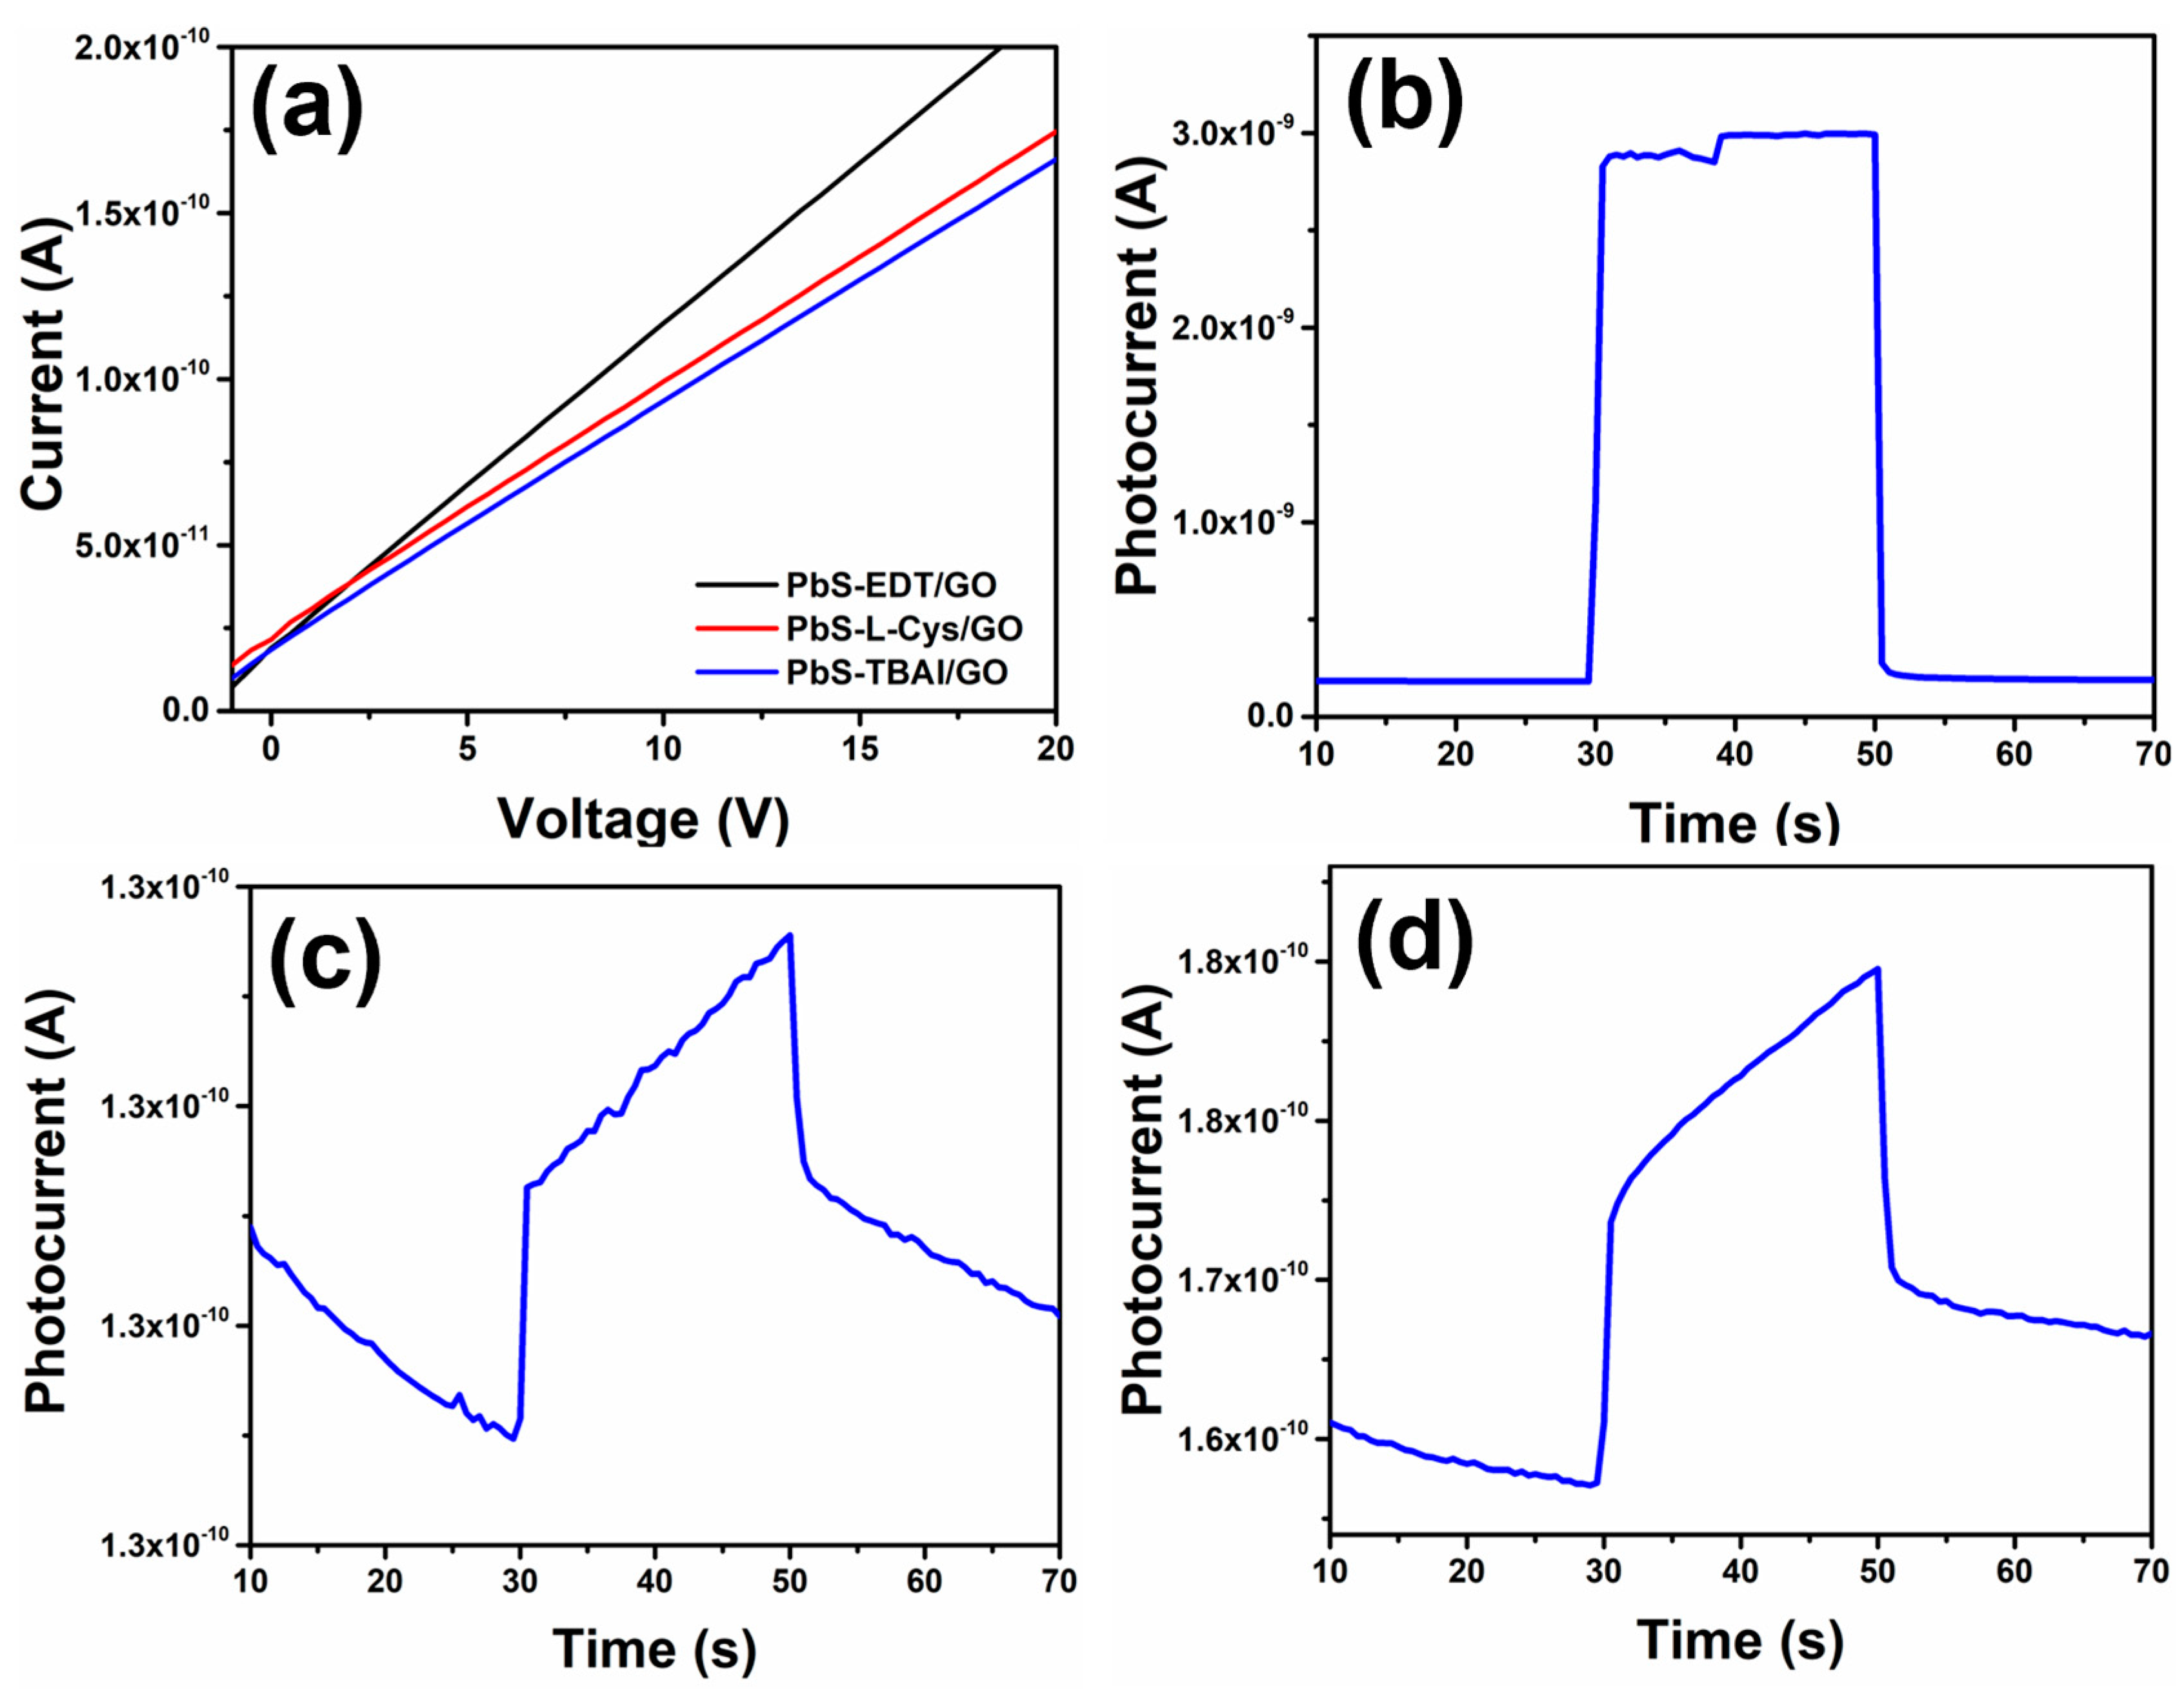
Finally, the I–V curves and photoresponse were acquired for the different NHMs’ thin films, and the results obtained are shown in
Figure 12. I–V curves for all three NHMs’ thin films displayed an ohmic response, as indicated by the linear dependence between the applied voltage and the measured current (
Figure 12a). The values of the measured currents were in the range of 10
−10 A, while the resistance calculated for these NHMs’ thin films was in the range of 10
−11 Ω; such a high resistance value is related to insulator materials, materials with low charge carrier mobilities due to the obstacles found by the charge carriers when moving through this kind of material. This electrical behavior can be related to the FTIR and XPS results previously discussed, where the presence of O-rich functional groups was observed in the GO. The presence of these functional groups reduces the mobility of the charge carriers through the GO structure. Moreover, the TEM and SEM results showed that the PbS QDs formed large agglomerates that were randomly distributed on the GO flakes throughout the NHMs’ thin films, also affecting the thin films’ surface quality. These factors negatively affect the charge carrier mobility through the NHMs’ thin films, producing very low currents. The PbS-EDT/GO sample showed the lowest resistance and the highest current measured, as it was the NHM with the lowest signal related to the presence of O-rich functional groups, as was observed in the XPS results previously discussed (
Figure 8b). On the other hand, the three NHMs’ thin films displayed a clear photoresponse, with a low photogenerated current in the range of nA (
Figure 12b–d). Hybrid material PbS-EDT/GO (
Figure 12b) displayed a photogenerated current of ~2.8 nA, while the PbS-L-Cys/GO sample (
Figure 12d) showed a photogenerated current of ~0.02 nA and the PbS-TBAI/GO sample had a photogenerated current of ~0.007 nA. Even though all three NHM samples displayed a clear photogenerated current when exposed to light, a more symmetrical response in the photocurrent curve, along with the highest value, was observed in the PbS-EDT/GO sample. Such low values for the photogenerated current in the NHMs indicate a poor charge carrier transfer from the PbS QDs to the GO. This could be related to several factors, one of them being the presence of the O-rich functional groups in the GO, as shown in the XPS results, which affects the work function of the GO flakes, hence, affecting the valence and conduction band values, as has been previously reported [
6,
45]. Because PbS-EDT/GO sample showed a clear decrease in the C-O-C signal in the XPS spectrum, which can be associated with some degree of reduction in the GO, thus improving the charge carrier transport and transfer properties in the GO, this could partially explain the superior charge transport and transfer properties of this NHM sample. Additionally, surface chemistry and crystallography can also affect PbS QDs’ electronic structure, as previously reported [
12,
13,
46]. The capping ligand-exchange procedure changes the electronic structure of the PbS QDs, varying their HOMO and LUMO levels. The proper alignment between these HOMO and LUMO levels in the PbS QDs with the valence and conduction bands in GO will determine if there is an effective charge carrier transfer between these nanostructures, as has been reported elsewhere [
6,
45]; moreover, it has also been reported that the interaction between PbS QDs with EDT as the capping ligand and GO produces a band alignment that promotes the transfer of photogenerated electrons from PbS QDs to GO [
6,
45]. It is proposed that in the PbS-TBAI/GO and PbS-L-Cys/GO samples, the HOMO and LUMO levels in the PbS QDs after the ligand exchange do not align properly with the valence and conduction band levels in GO after the hybrid material is formed, preventing an effective charge carrier transfer between these nanostructures and, hence, producing lower photogenerated currents. Further studies are needed to confirm this interpretation.


 ,
, 

