Article

Retention of Engineered Nanoparticles in Drinking Water Treatment Processes: Laboratory and Pilot-Scale Experiments

1
Stadtwerke Düsseldorf AG, Wiedfeld 50, 40589 Düsseldorf, Germany
2
NextPharma Oy, Niittyhaankatu 20, 33720 Tampere, Finland
3
BASF Personal Care and Nutrition GmbH, Henkelstraße 67, 40589 Düsseldorf, Germany
4
Enercity AG, Ihmeplatz 2, 30449 Hannover, Germany
5
Hochschule Niederrhein, Adlerstr. 32, 47798 Krefeld, Germany
*
Authors to whom correspondence should be addressed.
Appl. Nano 2024, 5(4), 279-310; https://doi.org/10.3390/applnano5040018
Submission received: 25 October 2024 / Revised: 28 November 2024 / Accepted: 2 December 2024 / Published: 5 December 2024

Abstract

:
While microparticles can be removed by a filtration step at a drinking water treatment plant (DWTP), engineered nanoparticles (ENPs), which are widely used in industry, commerce and households, pose a major problem due to their special properties, e.g., size, reactivity and polarity. In addition, many ENPs exhibit toxic potential, which makes their presence in drinking water undesirable. Therefore, this study investigated the removal of ENPs in the laboratory and at a pilot-scale DWTP. Eight ENPs were synthesized and tested for stability in different types of water. Only three of them were stable in natural water: cetyltrimethylammonium bromide-coated gold (CTAB/AuNPs), polyvinylpyrrolidone-stabilized gold and silver nanoparticles (PVP/AuNPs, PVP/AgNPs). Their retention on quartz sand, silica gel and fresh anthracite was low, but CTAB/AuNPs could be retained on fresh river sand and thus should not overcome riverbank filtration, while PVP/AuNPs and PVP/AgNPs showed no retention and may be present in raw water. During ozonation, PVP/AuNPs remained stable while PVP/AgNPs were partially degraded. The advanced oxidation process (AOP) was less effective than ozone. PVP/AgNPs were almost completely retained on the pilot plant anthracite sand filter coated with manganese(IV) oxide and ferrihydrite from raw water treatment. PVP/AuNPs passed the filter with no retention. In contrast to PVP/AuNPs, PVP/AgNPs and CTAB/AuNPs were also retained on activated carbon. The integration of a flocculation step with iron(III) salts can improve ENP removal, with PVP/AuNPs requiring higher flocculant doses than PVP/AgNPs. PVP/AuNPs, in particular, are well-suited for testing the effectiveness of water treatment. Further data on the occurrence of stable ENPs in raw water and their behavior during water treatment are needed to perform a risk assessment and derive the measures.

1. Introduction

Engineered nanoparticles (ENPs) are of particular interest to industry, medicine and research due to their chemical, optical, electronic and magnetic properties [1]. Increasing industrial, commercial, medical and household applications lead to a permanent release in aquatic environment with ecological and health implications [2,3]. The release of ENPs via wastewater treatment plants and drain-off into surface waters, which are also indirectly used for drinking water production, makes it necessary to know the stability and behavior of ENPs in natural waters and their elimination during the water treatment process [4,5,6,7,8].
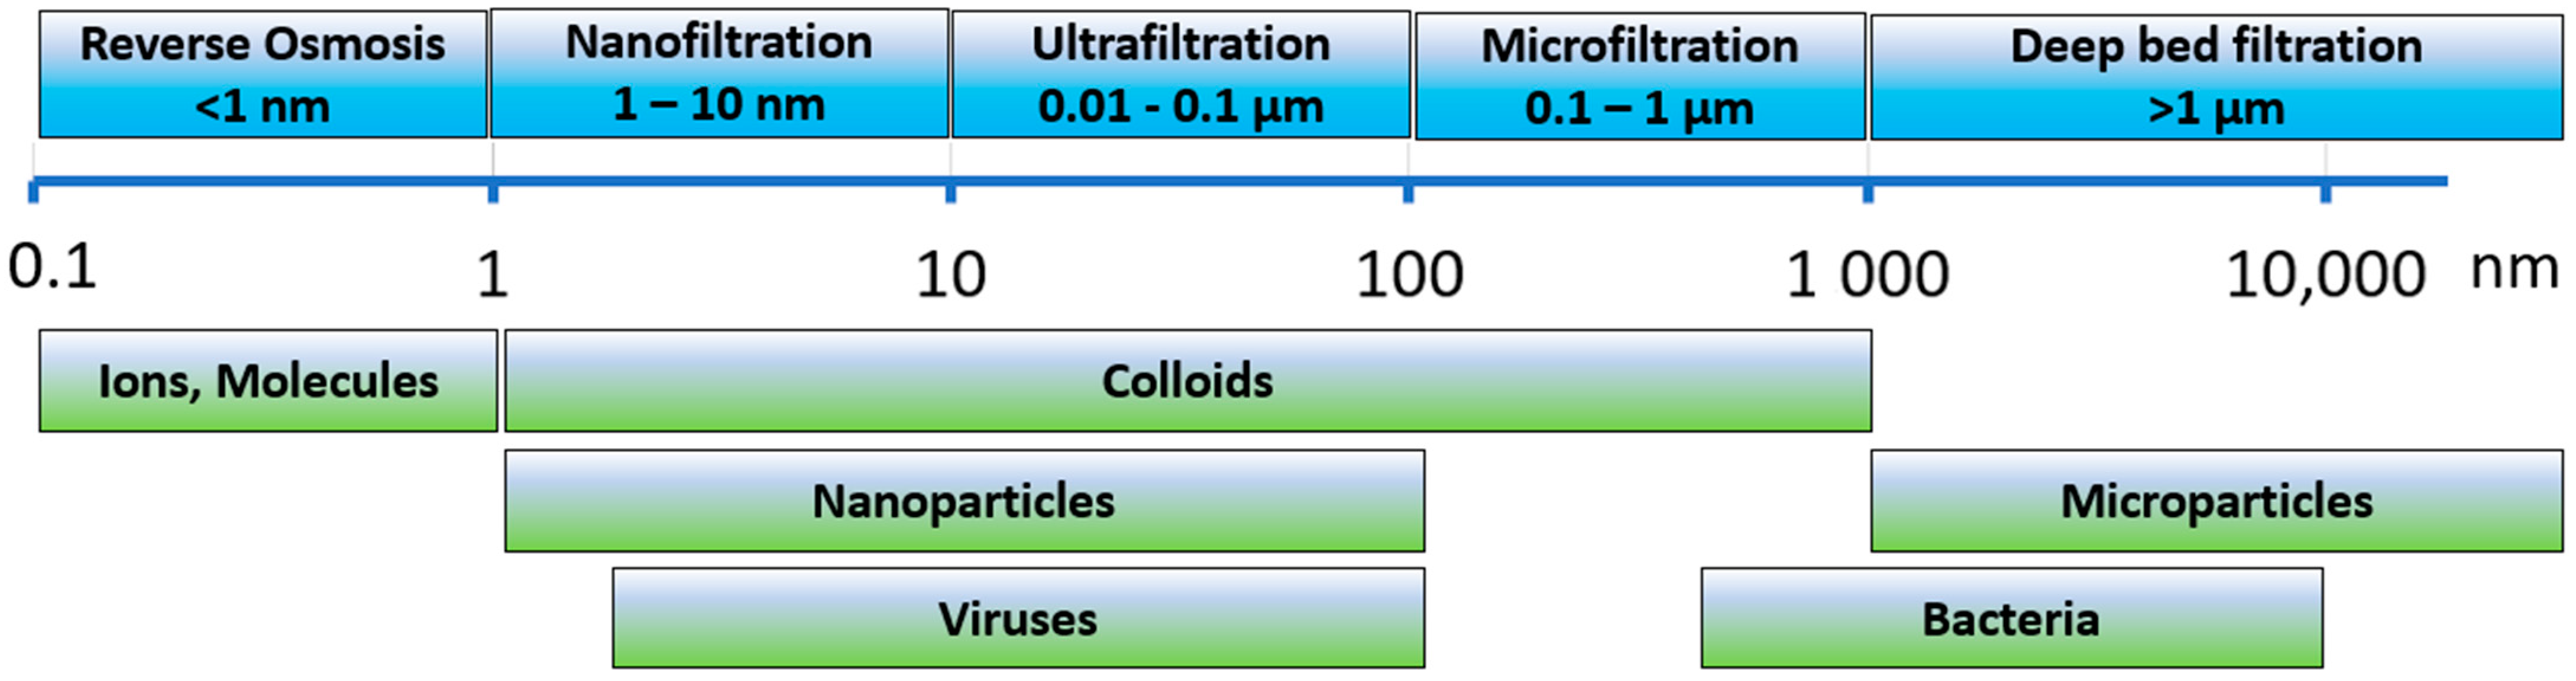
Nanoparticles (NPs) are defined as nanocrystals or aggregates ranging in size from 1 to 100 nm (Figure 1). As such, they are part of the colloid group, which includes dispersed, molecular, and associative colloids defined by their physical behavior [9,10]. Due to their small size, NPs have a very high surface area-to-mass ratio, and a high surface energy, which accelerate aggregation and reactions, and are also responsible for quantum effects such as localized surface plasmon resonance (LSPR), the absorption of light at specific wavelengths [11]. Because NPs try to reduce their high surface energy by aggregation, free nanoparticles are usually not stable. This can be prevented in aqueous media by a protective shell (anions, surfactants, polymers). Anions like citrate form a negatively charged coordination sphere around NPs, which prevents aggregation by electrical repulsion, while neutral polymers separate the NPs by steric hindrance [12]. Since NPs in an aqueous solution are mostly negatively charged, the addition of positively charged ions can cause coagulation and result in precipitation, which can be used as a separation technique in water treatment [13,14]. Ligand stabilization is especially important when using ENPs under destabilizing conditions, e.g., low pH or high salt concentration [15,16]. NPs are formed naturally by the large-scale weathering of minerals, degradation of natural organic matter (NOM), and anthropogenic materials such as plastics. In contrast, ENPs are manufactured for technical, medical or other applications. They have a defined composition, size and shape, and are synthesized using top–down or bottom–up methods [1]. Metallic nanoparticles are of increasing interest due to their widespread use in chemical catalysis [17], sensing [18], electronics [19] and health applications [3,20]. For example, the silver NP market was valued at $1.5 billion in 2020 and is projected to reach $6.6 billion by 2030, growing at a CAGR of 15.6% from 2021 to 2030 [21]. The use of gold NPs in electronic goods such as electronic chips, printing inks, and medical assays is widespread, and the market value in the United States was $4.7 billion in 2022 and will increase at a CAGR of 10.6% from 2023 to 2031 to $11.8 billion in 2031 [22].
The environmental release modeling of silver ENPs in all relevant matrices predicted a silver concentration of 1.51 ng/L in surface water in the EU [2]. Antunes et al. reviewed the synthesis, application, environmental behavior and mitigation strategies of AgNPs, and found published values ranging from 0.1 to 3.2 µg/L, which is in good agreement with the predicted value [23]. After release into surface water, ENPs can directly impact the aquatic environment as NPs or transformed material. The degradation of metallic ENPs often results in the release of their metal and ligands, so their transformation products must also be considered in the toxicological assessment. For example, Louie et al. found that the PVP coating of PVP/AuNPs were rapidly oxidized upon UV irradiation, which reduced the colloidal stability of the AuNPs [24]. While dissolved organic matter often has a stabilizing effect on ENPs, the presence of multivalent ions can lead to bridging and flocculation [25]. Silver NPs are known to readily oxidize to elemental silver covered with an oxide layer, which has a long-lasting negative potential for ecosystems. Metallic silver released from AgNPs is more toxic to microorganisms than bulk silver due to the increased surface area [26].
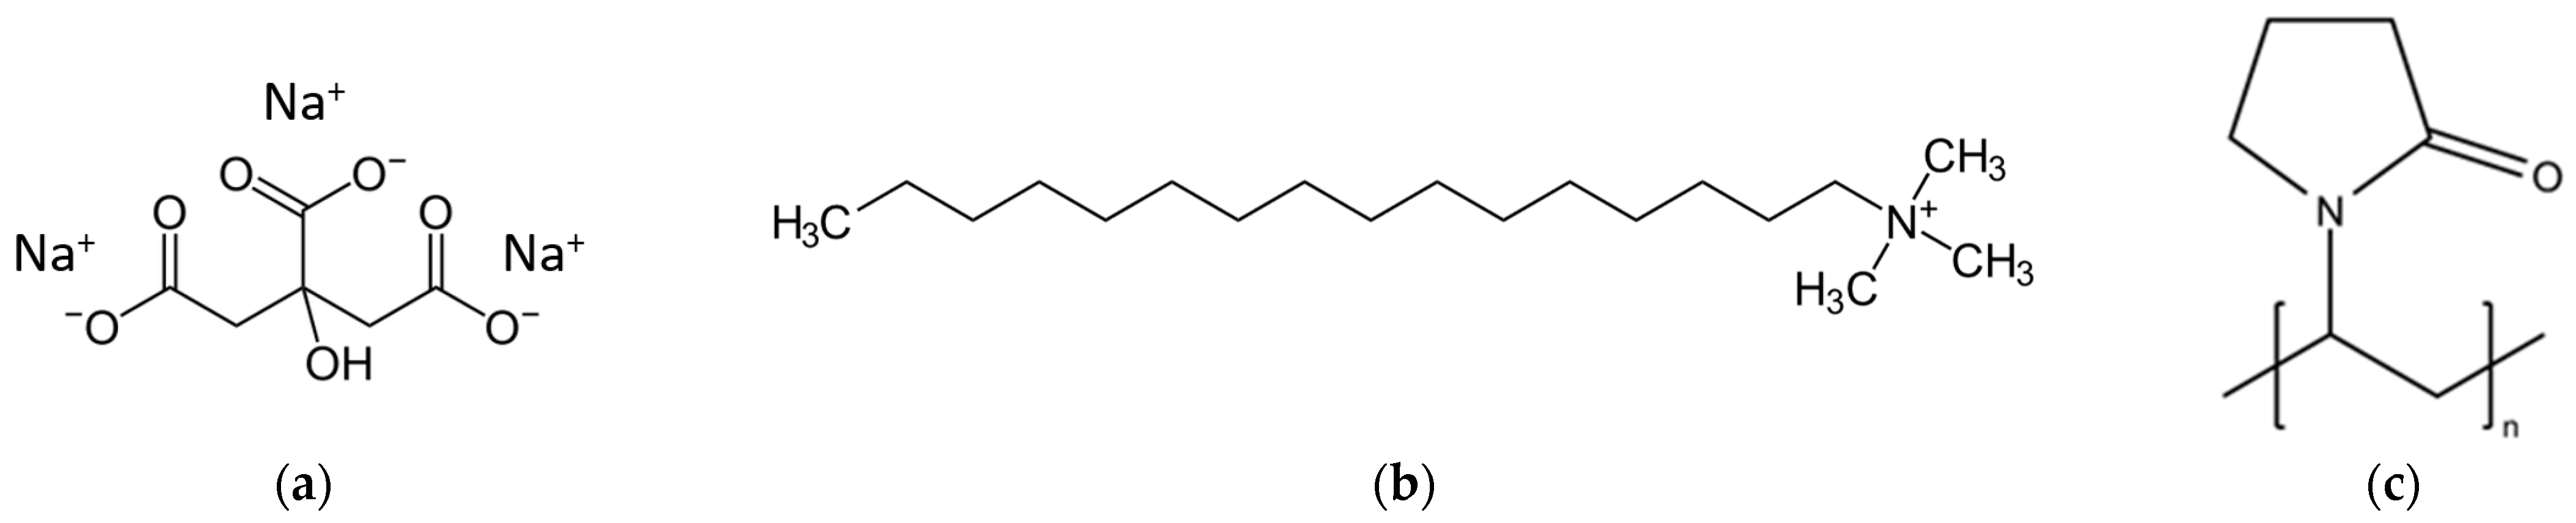
Important stabilizers for ENPs are citrate (CA), cetyltrimethylammonium bromide (CTAB) and polyvinylpyrrolidone (PVP). CA (Figure 2a) is the anion of citric acid with a molecular weight of 189 g/mol. The stability of CA-capped NPs mainly depends on the pH due to CA protonation, which reduces the repulsive forces and stability, and to the presence of multivalent ions, which can link the nanoparticles into chains and further into aggregates and coagulates [27]. CA/AuNPs are, therefore, subject to aging [28]. Citrate is non-toxic and a metabolite of the citric acid cycle. In contrast, CTAB (Figure 2b), a cationic surfactant, protects NPs by forming a bilayer around the NP core, resulting in a positive-charged NPs in water. The hydrophilic amine groups of the inner layer bind to the gold surface, while the amine groups of the outer layer interact with the aqueous phase [29]. Two groups have recently elucidated the self-assembly of CTAB around the metallic core [30,31]. CTAB is toxic and has been shown to affect biological systems by promoting cell lysis, and is used as an apoptosis-promoting anticancer agent [32,33].
PVP (Figure 2c) is a nonionic, linear and atactic polymer with molecular weights ranging from 2.5 to 2500 kDa. It is non-toxic and is used in pharmaceutical formulations [34]. In NP synthesis, PVP can serve as a surface stabilizer, growth modifier, dispersant, and reducing agent [35]. Studies have shown that both oxygen and nitrogen atoms of the pyrrolidone ring are responsible for the adsorption of PVP on the surface of silver NPs [36]. Silver nanoparticles (AgNPs) have a significant impact on the aquatic environment, as demonstrated in numerous studies [23,37,38,39,40]. They can be absorbed through the respiratory tract, digestive system, and skin, and have recently been reviewed [41]. PVP/AgNPs cause cytotoxic and inflammatory responses in the lungs of healthy adult female rats after intratracheal instillation [42]. Although gold is known to be an inert metal, CTAB/AuNPs have been shown to be taken up by cells and bound to serum proteins [43,44]. CTAB/AuNPs bind strongly to enzymes, which is used for analysis [29]. A recent review has highlighted the toxicological aspects of AuNPs [45].
The detection and quantification of ENPs in the environment is still challenging due to the low concentration, structural heterogeneity and transformation [5,7]. However, there are several methods currently available for the determination of ENPs in fresh water [8,46,47,48]. In this study, the size- and shape-dependent localized surface plasmon resonance (LSPR) of gold and silver nanoparticles was used for analysis [11,49]. LSPR can be used to determine both the concentration and the change in size of the metal core in ENPs due to aggregation. As the concentration decreases, the adsorption decreases, and as the particle size increases, a red shift of the absorption maximum is observed [50,51]. The Lambert–Beer law (Equation (1)) describes the attenuation of light by an appropriate absorption band of a dissolved substance. The logarithm of the quotient, lg(I0/I), is called the absorbance (A) and is proportional to the concentration (c) of the substance, which allows for its quantitative determination (: optical path length, ε: molar attenuation coefficient).
lg(I0/I) = A(λ) = ε × c ×
Due to the low concentration, small size and wide variety of stabilized ENPs, the options for removing ENPs from natural waters are limited. There are many studies in the laboratory, but few on removal at a pilot or technical DWTP [4,5,8]. Lawler and coworkers used flocculation and filtration to remove CA/AgNPs, and identified calcium ion concentration and NOM as important factors [52]. Hofman-Caris et al. spiked various water qualities with CA/AuNPs and CA/AgNPs, and found ENP reductions of 57 to 77% with coagulation/flocculation/sedimentation (CFS). Preloaded sand provided good retention up to 82% for AuNPs and 85% for AgNPs, while purified sand was ineffective. Activated carbon (AC) had a low retention rate of about 30% [53]. In a laboratory-scale study, Chalew et al. spiked various water samples with unstabilized ENPs and tested CFS, microfiltration (MF), and ultrafiltration (UF) as treatment methods [54]. CFS resulted in partial reductions of 2–20% for Ag in finished water. Breakthrough after MF was 1–45%, and after UF was 0–2%. Although the majority of aggregated or stable NPs were removed, the authors concluded that “NPs should be regarded as emerging drinking water contaminants and that drinking water treatment processes should be enhanced to fully remove NPs in order to reduce their potential harmful health outcomes”. In their review, Westerhoff et al. estimated a low risk of ENPs for drinking water based on the fact that conventional DWTPs remove >80% [55]. In contrast, Sousa and Teixera stated that data on the contamination of raw water and drinking water are insufficient, and that the detection of ENPs in drinking water poses a risk to human health because their properties make their removal difficult [5]. Park et al. concluded that ENPs pose a serious threat to the environment and human health if water treatment is inadequate. An important question is the extent to which ENP removal processes are efficient [7]. Reverse osmosis is probably the only single process that can completely remove NPs from raw water (Figure 1). This paper considers the treatment processes commonly used by many waterworks: ozonation, advanced oxidation process (AOP), flocculation, anthracite sand filtration and adsorption on activated carbon.
Ozonation is used for oxidation or disinfection in larger DWTPs. Ozone (O3) has a high standard oxidation potential (+2.07 V) and is commonly used in water treatment for disinfection and oxidation of iron(II), manganese(II), and NOM. In addition, O3 can micro-flocculate the colloidal components of natural water by destabilizing them [56]. The oxidation reactions of O3 (aq) cover a wide range of second-order rate constants from <0.1 M−1s−1 to 10−8 M−1s−1, while the hydroxyl radical reaction is diffusion controlled with k(∙OH) from 109 M−1s−1 to 1010 M−1s−1 [57]. The radical process often leads to a reaction even with compounds that are difficult to oxidize. It is known that CA/AuNPs react reversibly with O3 [58], while polyphosphate/AgNPs were partially oxidized [59].
The radical process can become the dominant reaction channel, for example, through the addition of hydrogen peroxide, in which case it is referred to as an Advanced Oxidation Process (AOP) [60]. The process must be optimized to achieve maximum OH radical yield and is mainly dependent on the concentrations of ozone, hydrogen peroxide and pH. Due to parallel radical scavenging processes, the yield of hydroxyl radicals is only ~50% [61]. Partial aggregation of PVP/AgNPs was observed during laboratory ozonation, which increased with reaction time and pH [62].
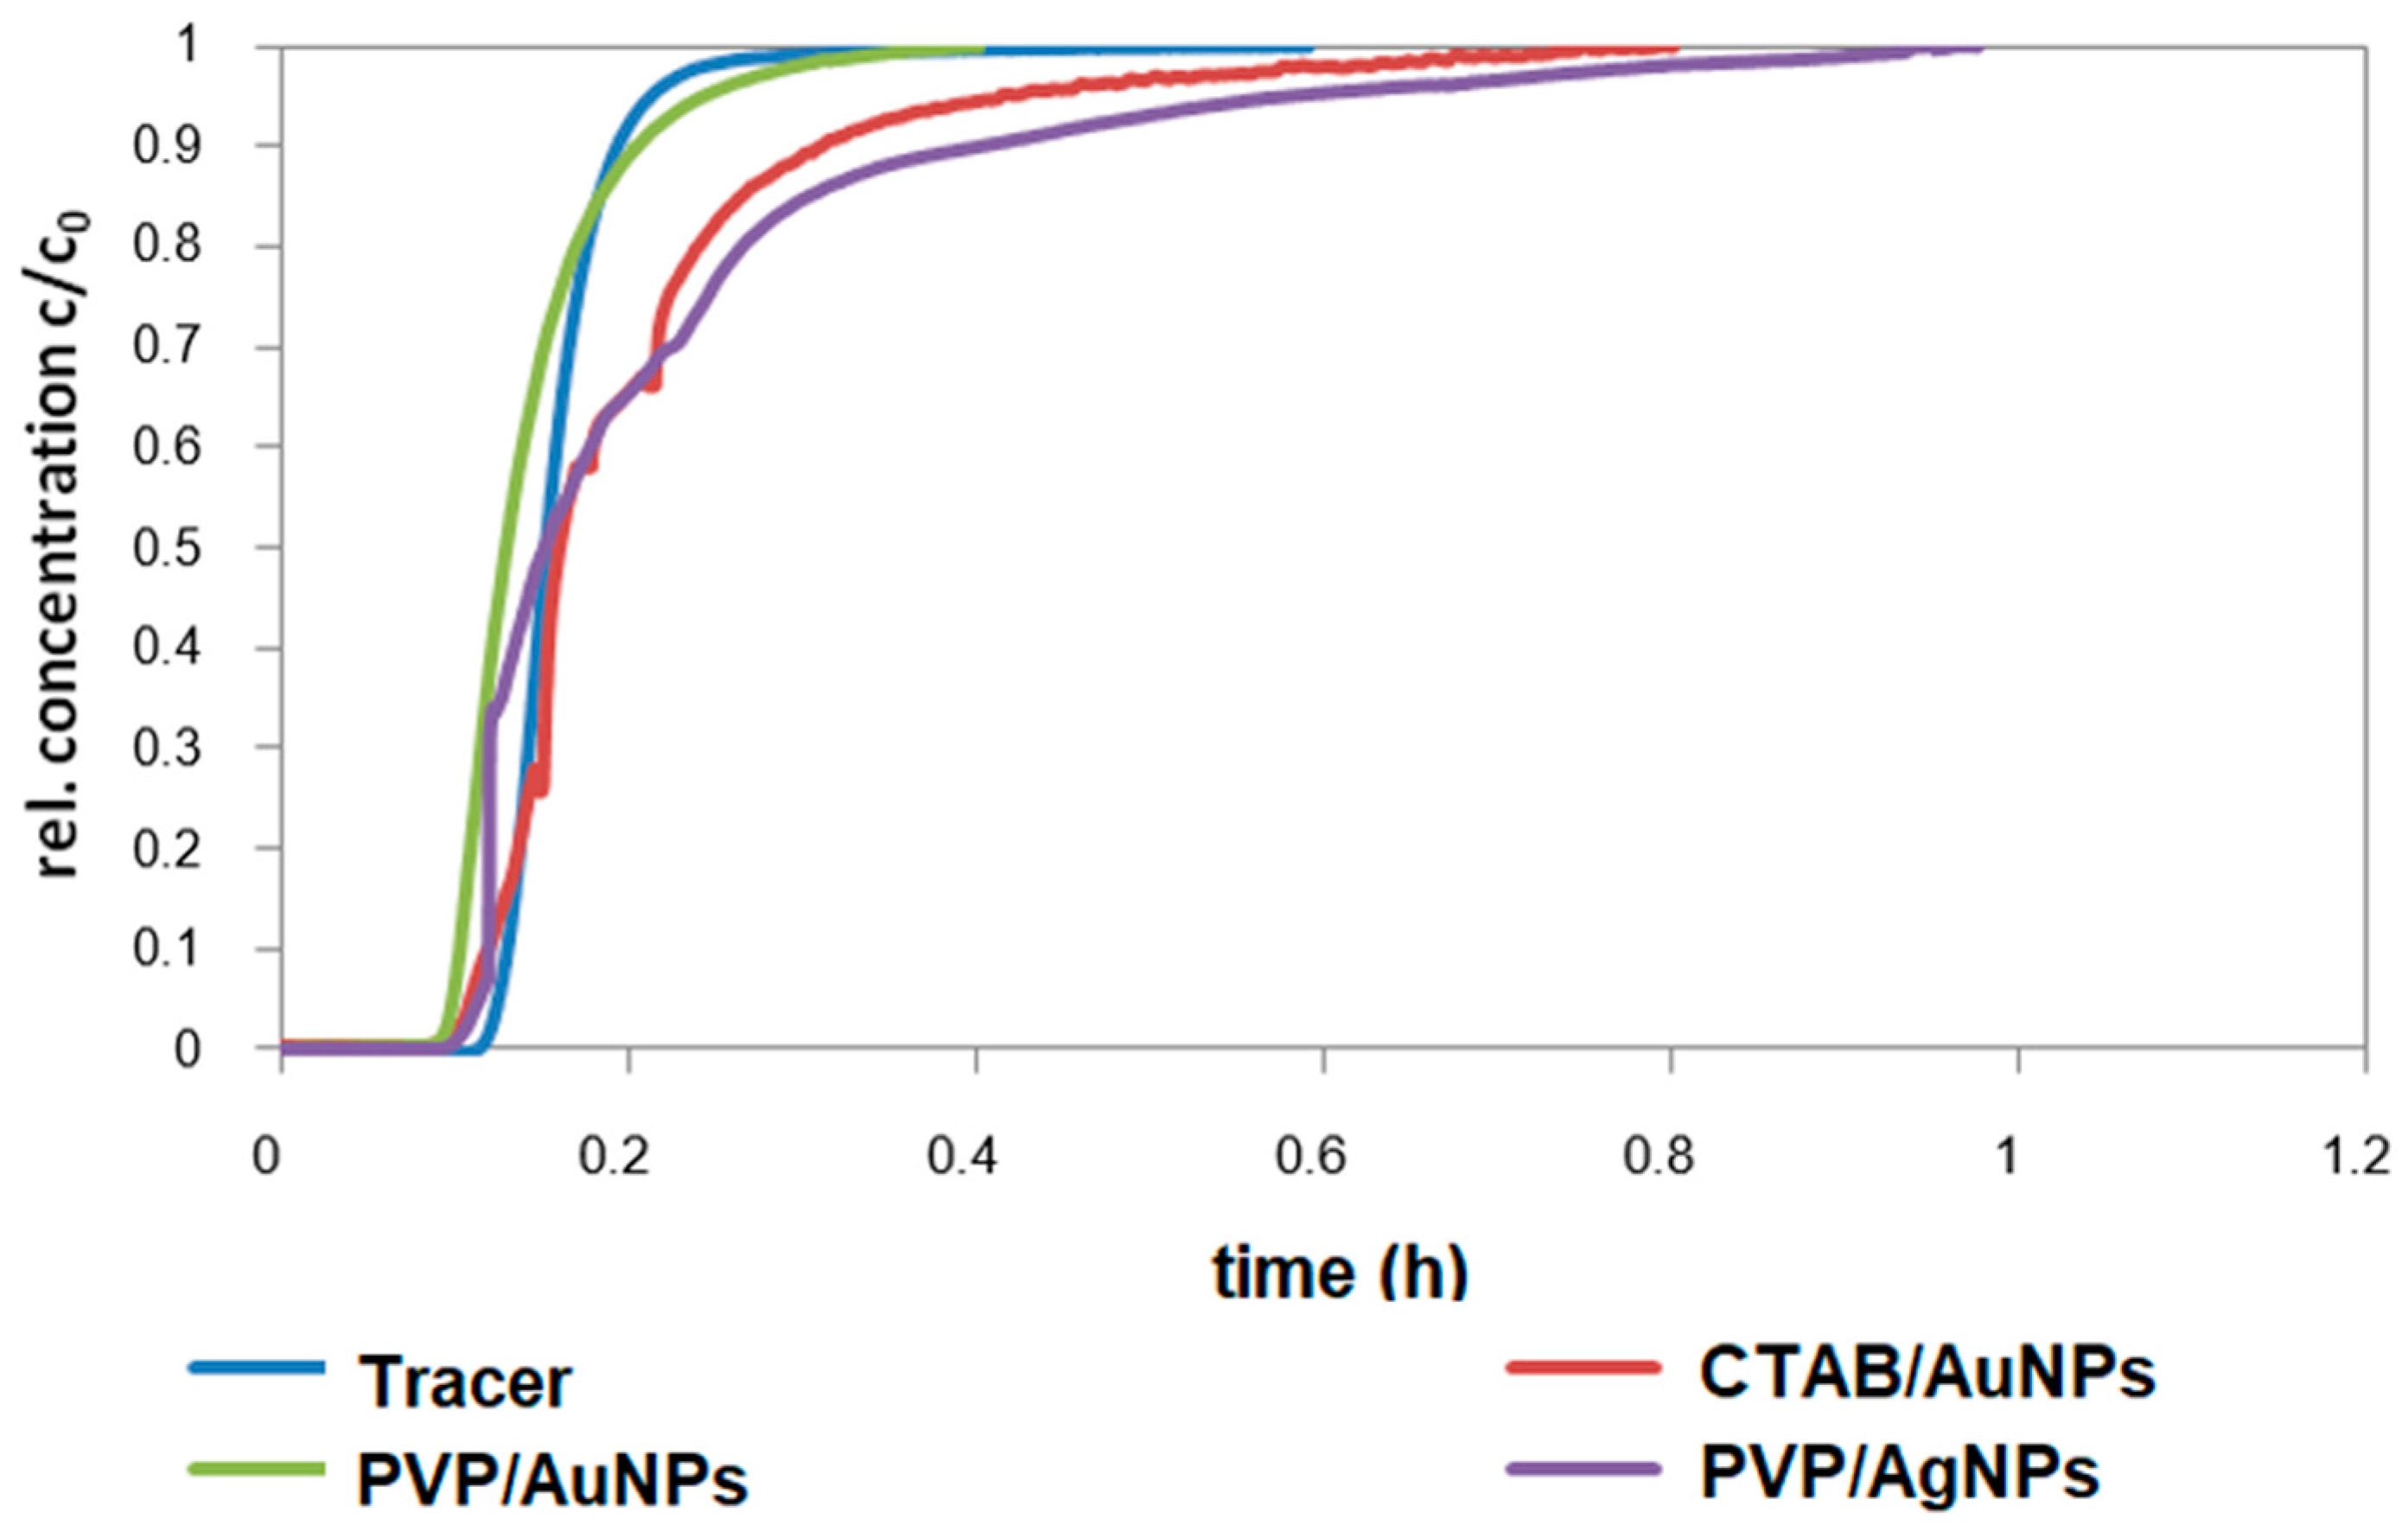
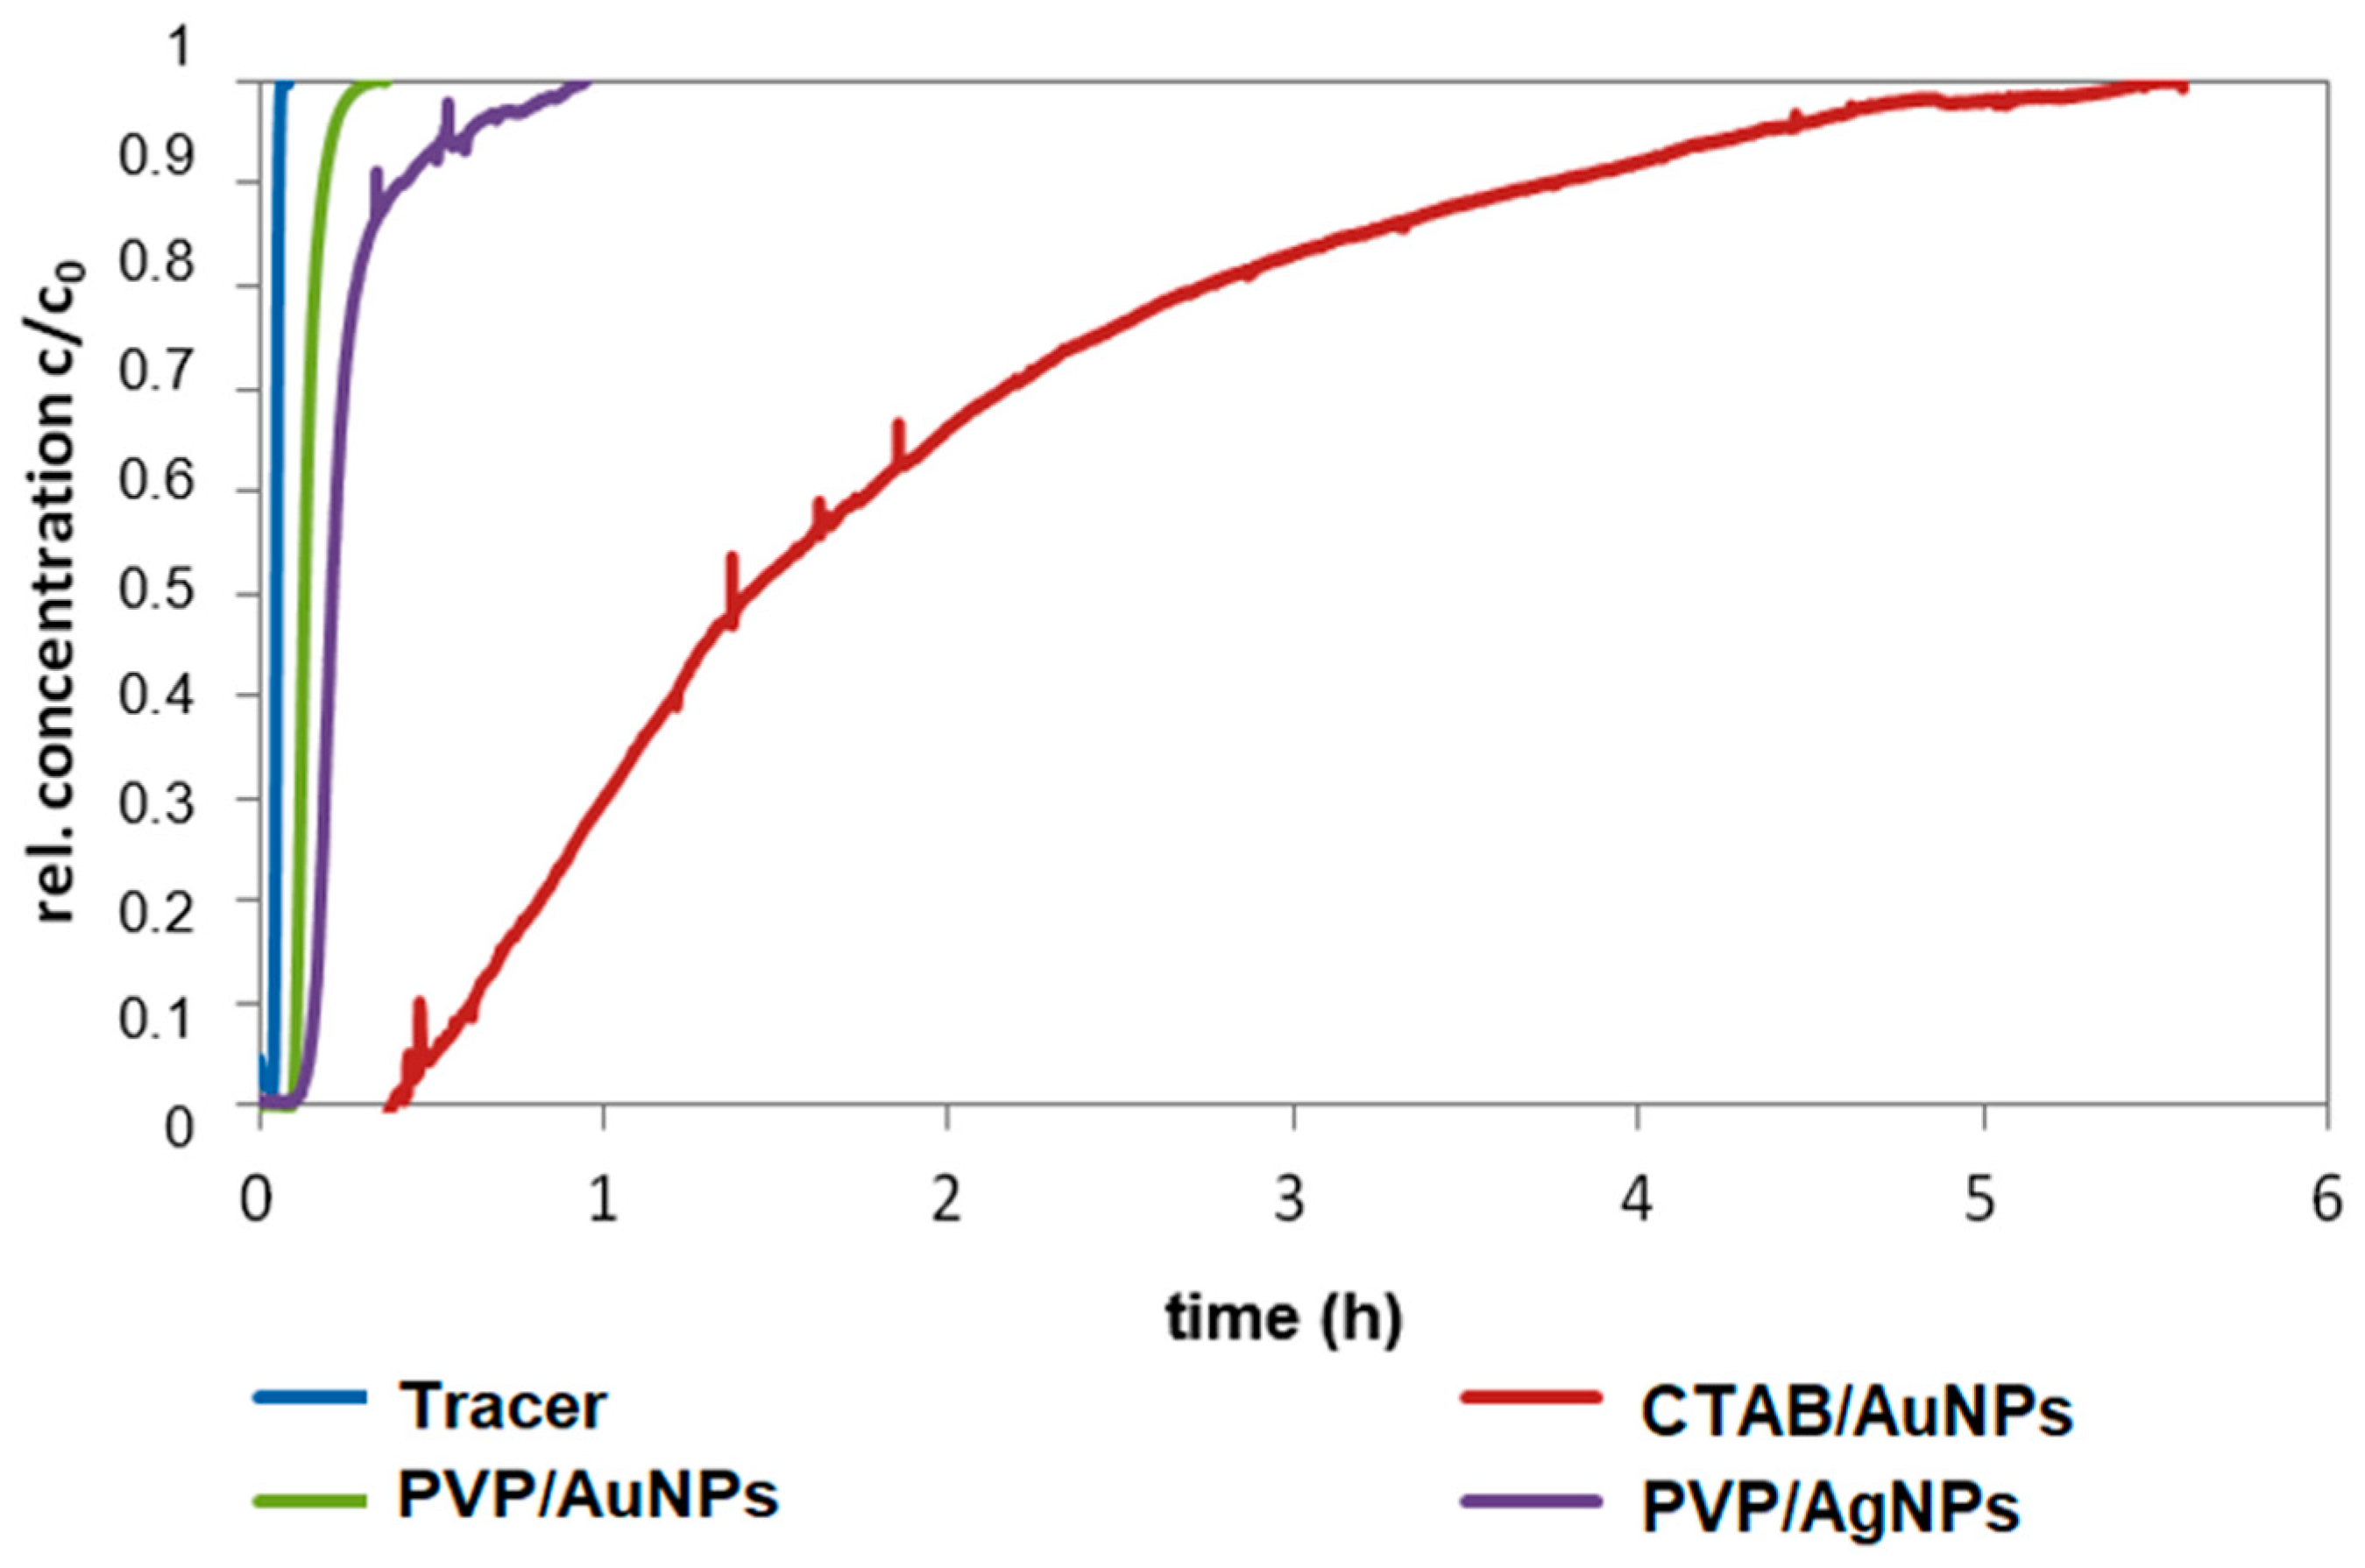
Filtration is the retention of suspended (>1 mm) and dispersed (<1 mm) particles on a filter material. In deep-bed filtration, particles are removed during the flow of a suspension through a deep granular bed [63]. Various mechanisms are responsible for retention, including inertia, interception, sedimentation, and electrostatic forces, while the forced fluid flow is directed toward the outlet [64]. The NP retention on porous material, e.g., riverbank filtration, retention on filter materials and adsorbents can be described with the colloid filtration theory (CFT). The relevant mechanisms are filtration, adsorption, and partitioning of colloids in water-saturated, porous media [65].
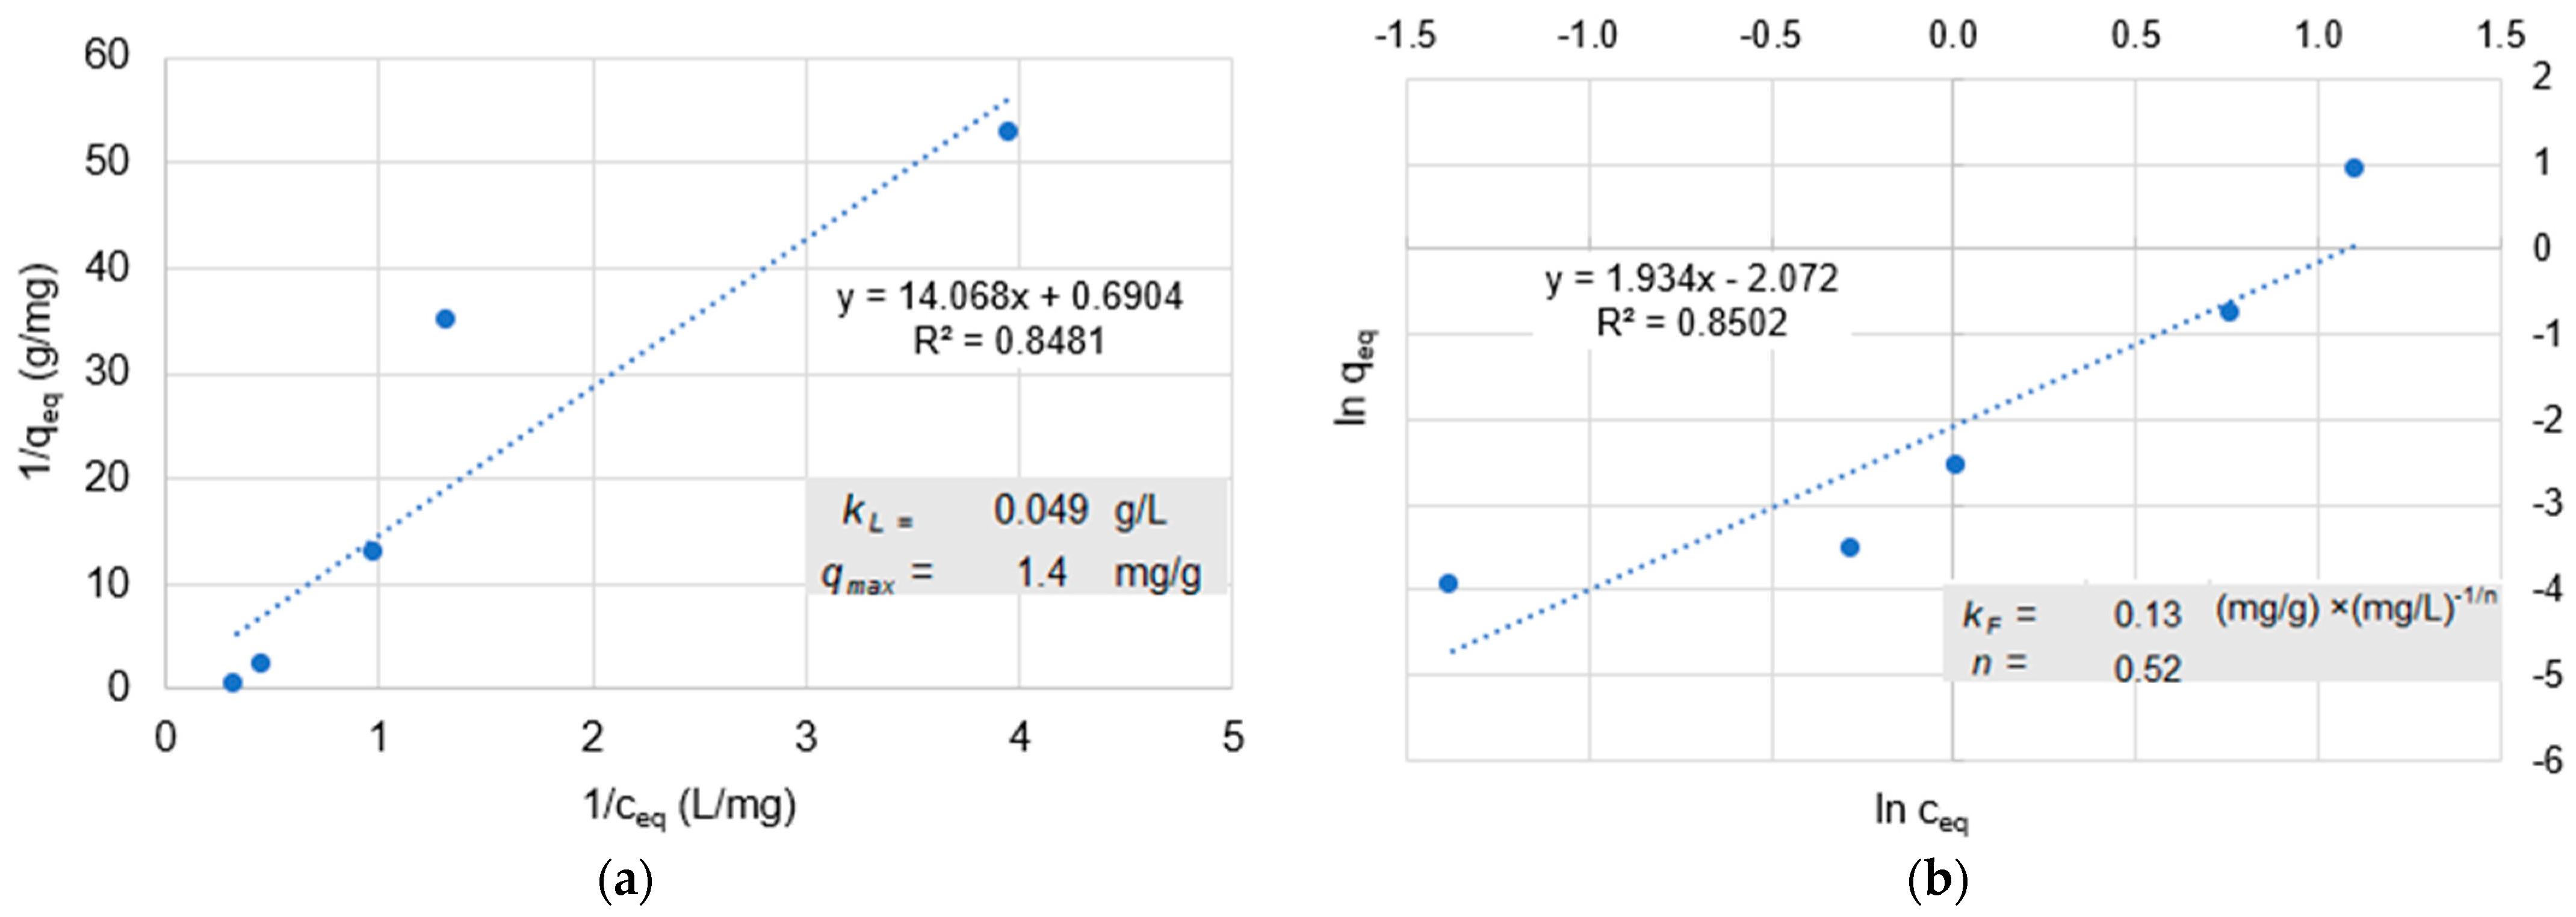
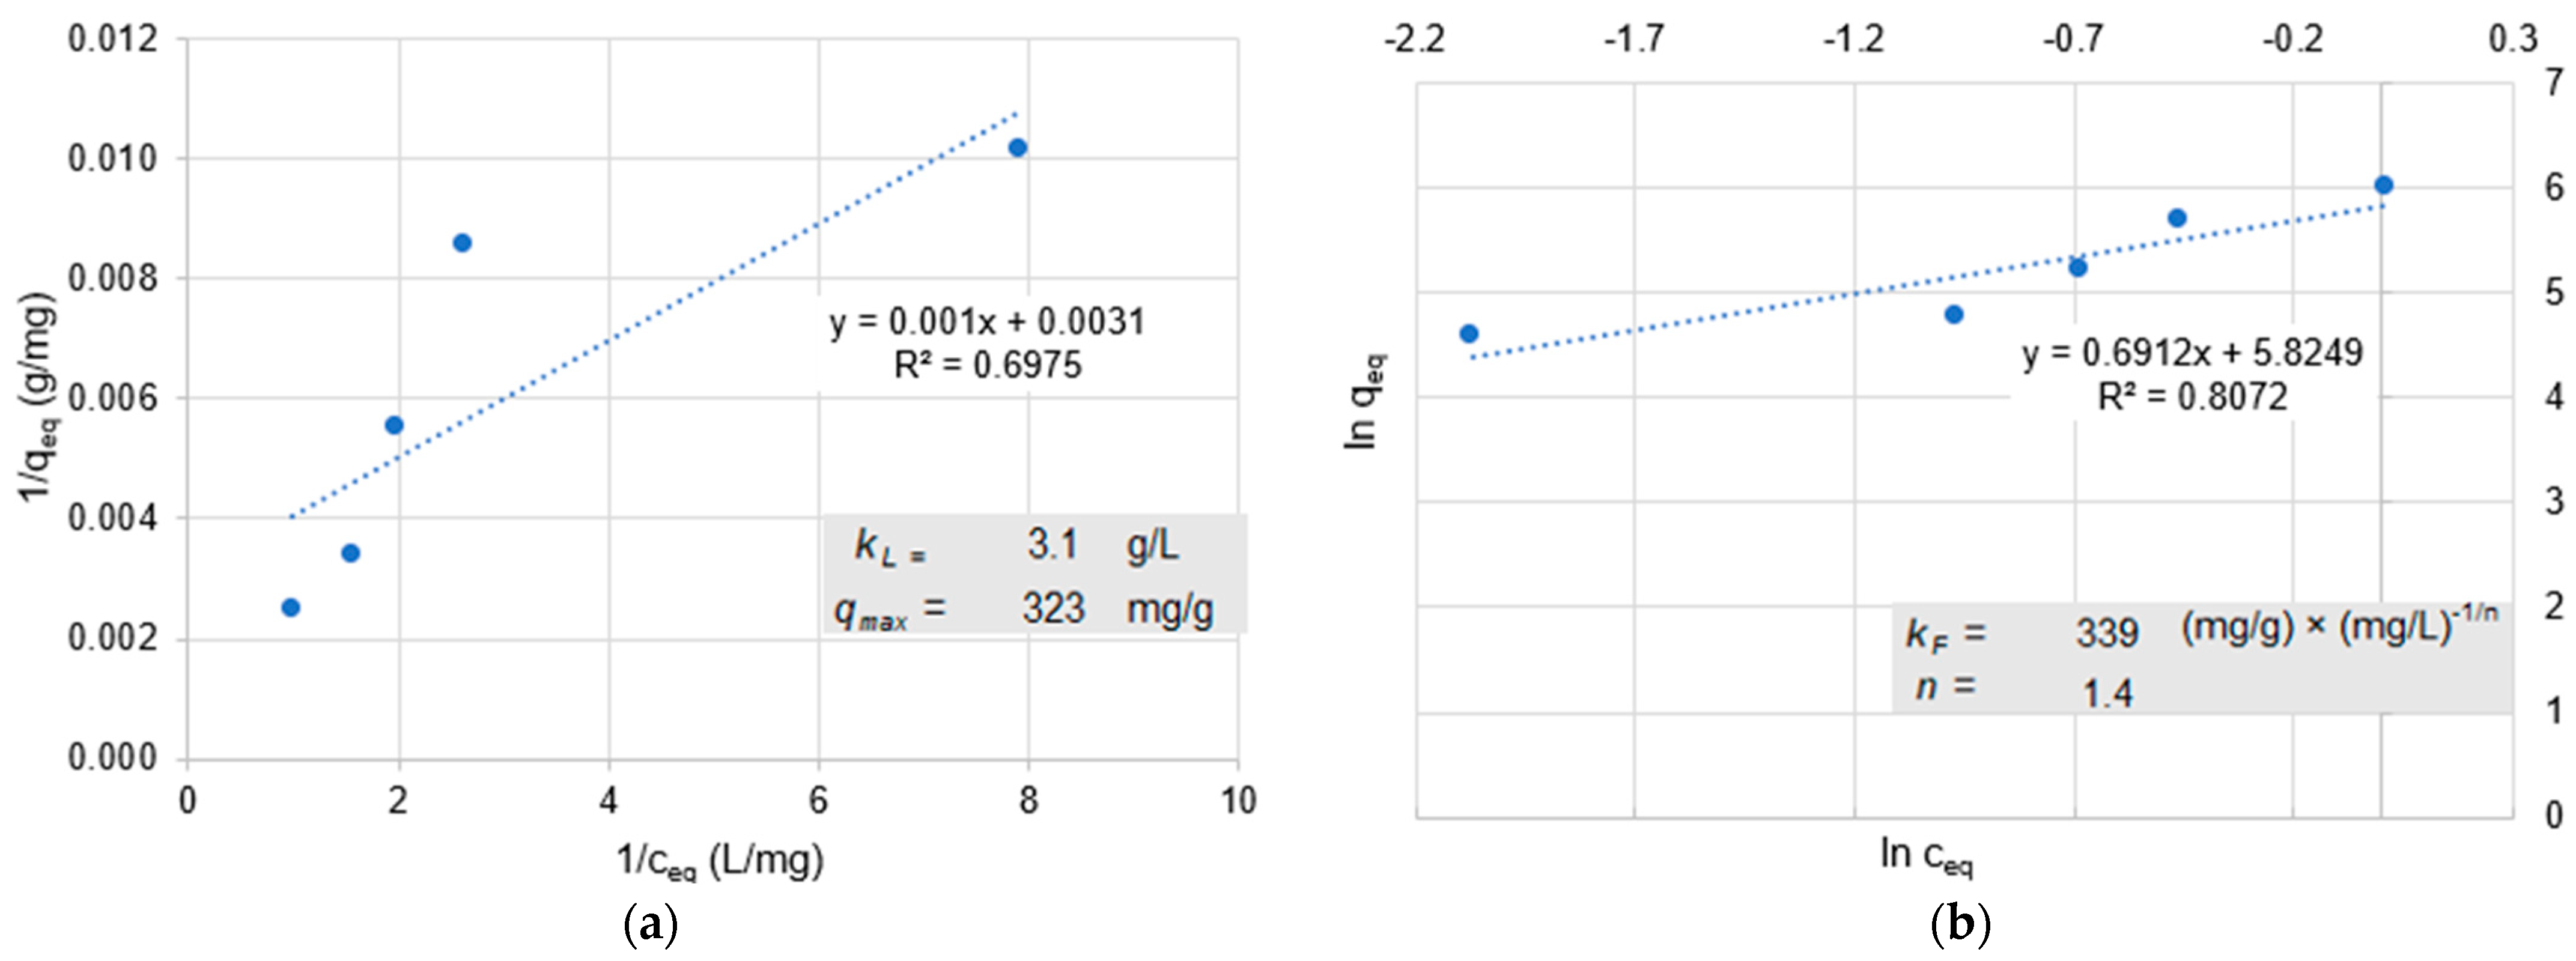
Adsorption is the process of attaching a compound to the outer or inner surface of an adsorbent [
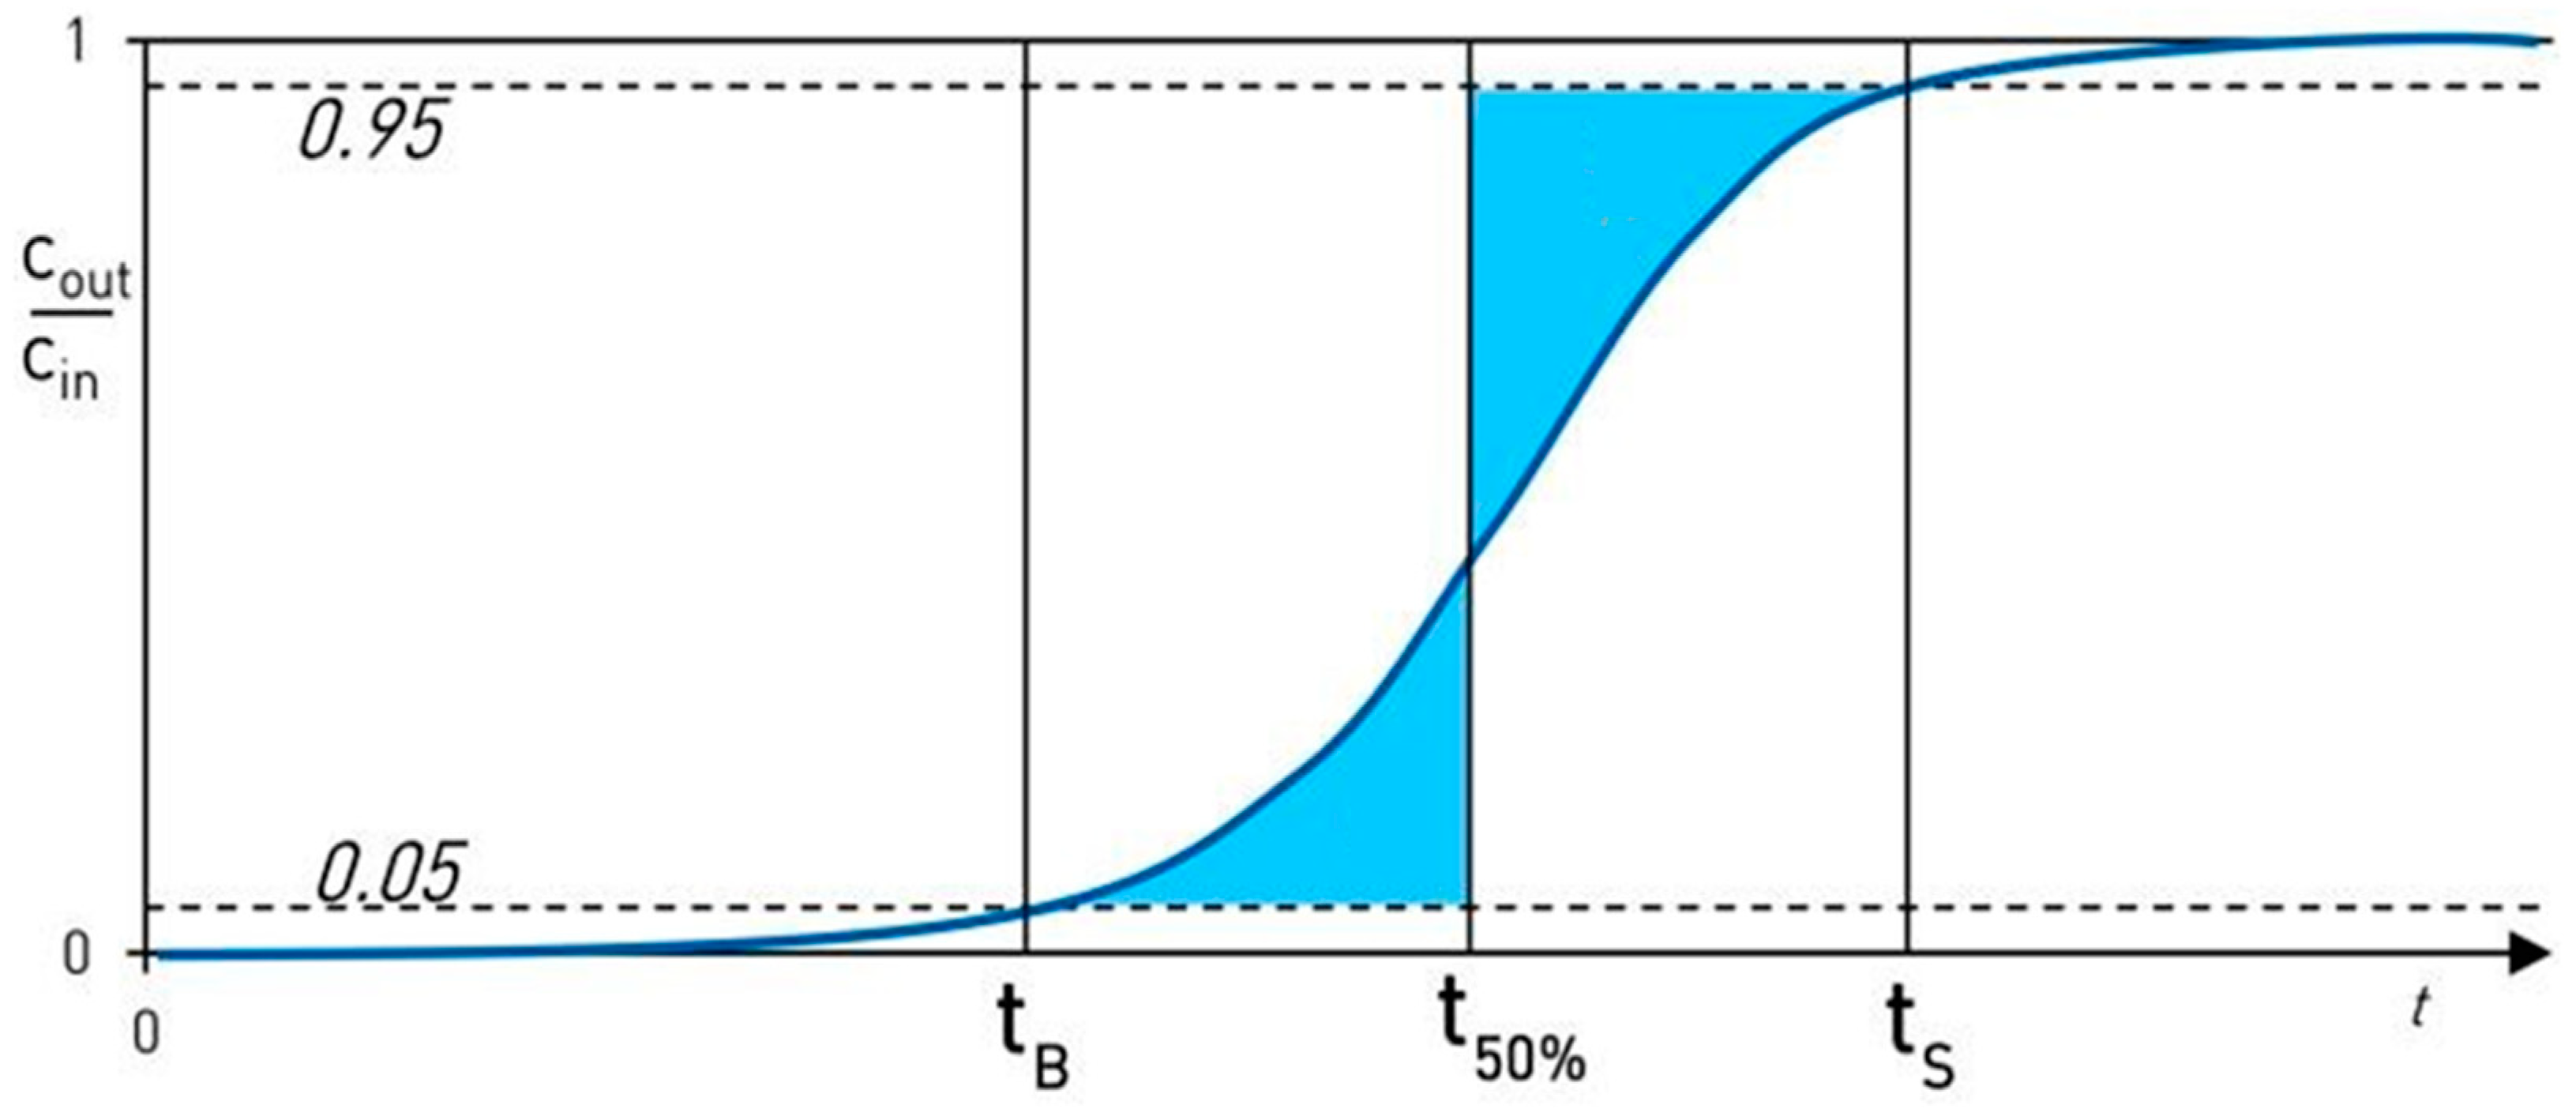
66]. Adsorption depends on the physical and chemical properties of the adsorptive, the solvent, and the adsorbent, such as the surface structure and the process conditions. In batch tests, the equilibrium loading capacity is determined as a function of the equilibrium concentration at a constant temperature. An adsorption isotherm is obtained by plotting the two values. Closer to technical implementation than batch tests are column tests, in which adsorption occurs as the solution or dispersion of the adsorptive passes through the adsorbent and the residual concentration in the effluent is measured as a function of the eluted pore volume or time [67]. Activated carbon is often used in DWTPs as an adsorbent because it contains many pores of different sizes and diameters. Macropores have a diameter of more than 30 nm, followed by mesopores with a diameter of 30 to 2 nm, and micropores in the range of 2 to 0.4 nm. The macropores and mesopores, in particular, may be important for the adsorption of NPs [23]. The Langmuir or Freundlich isotherms are mainly used to describe the adsorption of solutes in water.
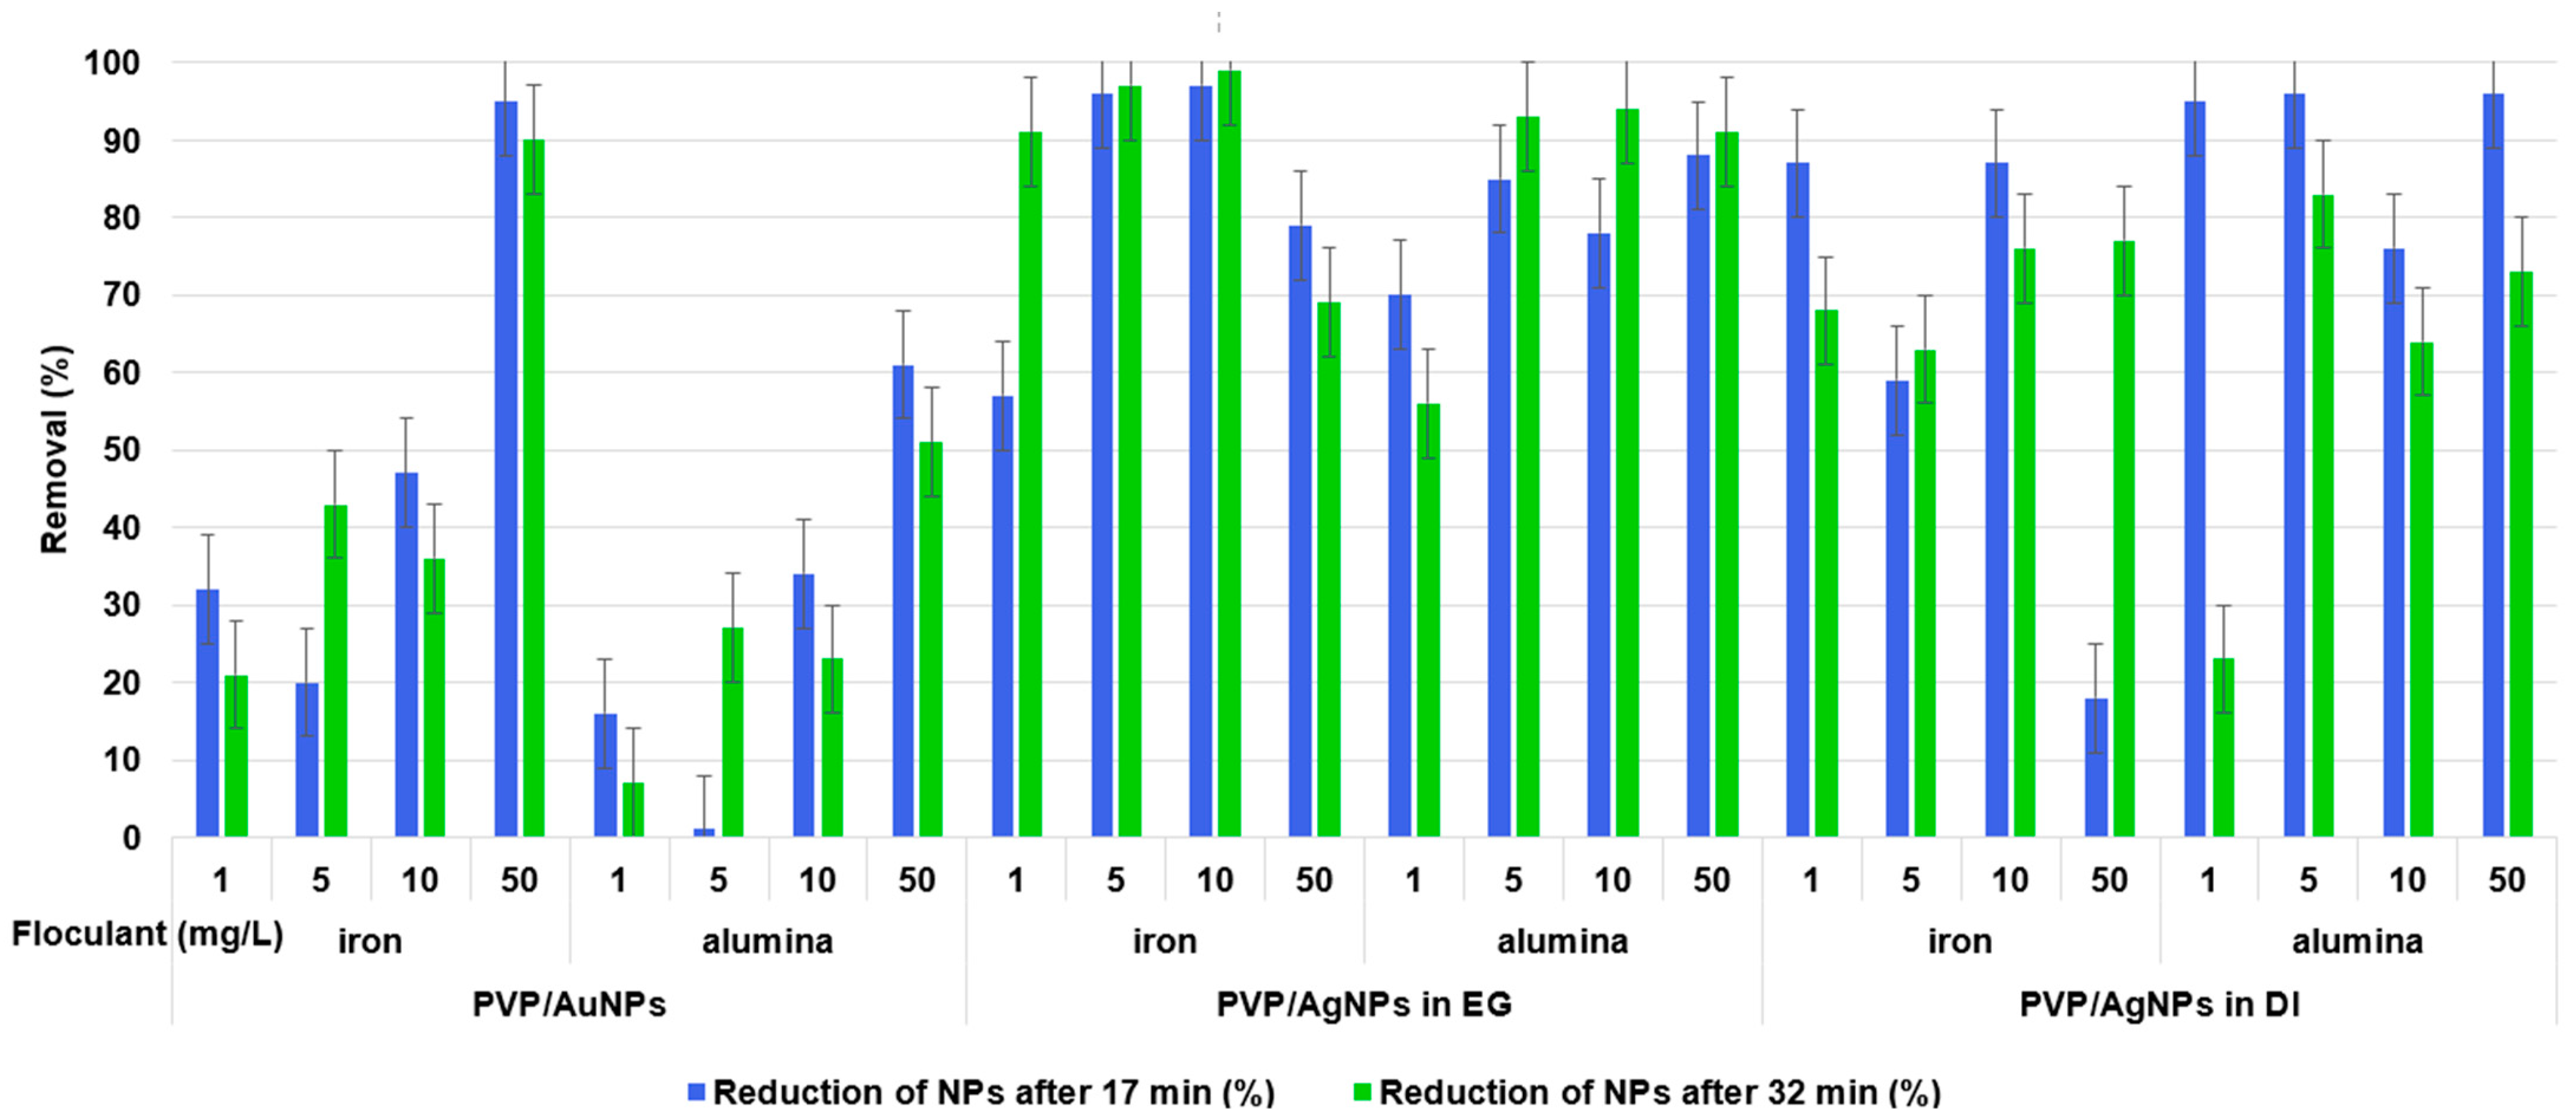
Flocculation can be used to remove turbidity, color, bacteria, biological matter or other substances from water. Flocculation always involves the use of flocculants to overcome the electrostatic repulsion forces of suspended particles (coagulation), followed by flocculation and sedimentation (CFS) [68]. Multivalent ions, which have a greater potential-changing effect than monovalent ions, are preferred. The most common flocculants are ferric chloride (FeCl3) and aluminum chloride/sulfate (AlCl3/Al2(SO4)3), which are used as solutions and mixed with the water to be treated [69]. By adding polyvalent metal salts which hydrolyze to hydroxy species in water, dense and easily separable flakes can be formed. When particles are captured and bound in one process, it is called sweep flocculation [70]. Polyvinyl alcohol (PVA)-stabilized AgNPs with a core size of 5 to 20 nm and a concentration of 1 mg/L in natural water can only be flocculated with high flocculant concentrations of 30 to 485 mg/L, while the presence of NOM improves the removal efficiency, and a pH of about 7.5 was found to be optimal [14]. Hofman-Caris et al. used batch CFS with low doses of 0.5 to 1.5 mg/L iron(III) and observed a reduction in CA/AuNPs by 8 to 77% depending on the water quality [53].
The waterworks considered here are located near the river Rhine and the raw water treatment is carried out by bank filtration, ozonation, anthracite and activated carbon filtration. The underground passage of the river water through the collimated riverbed and quaternary sands cleans it on its way to the extraction wells. Particles and microorganisms are retained, organic matter is microbiologically degraded, and peak concentrations of salts in the river are smoothed and reduced [71,72,
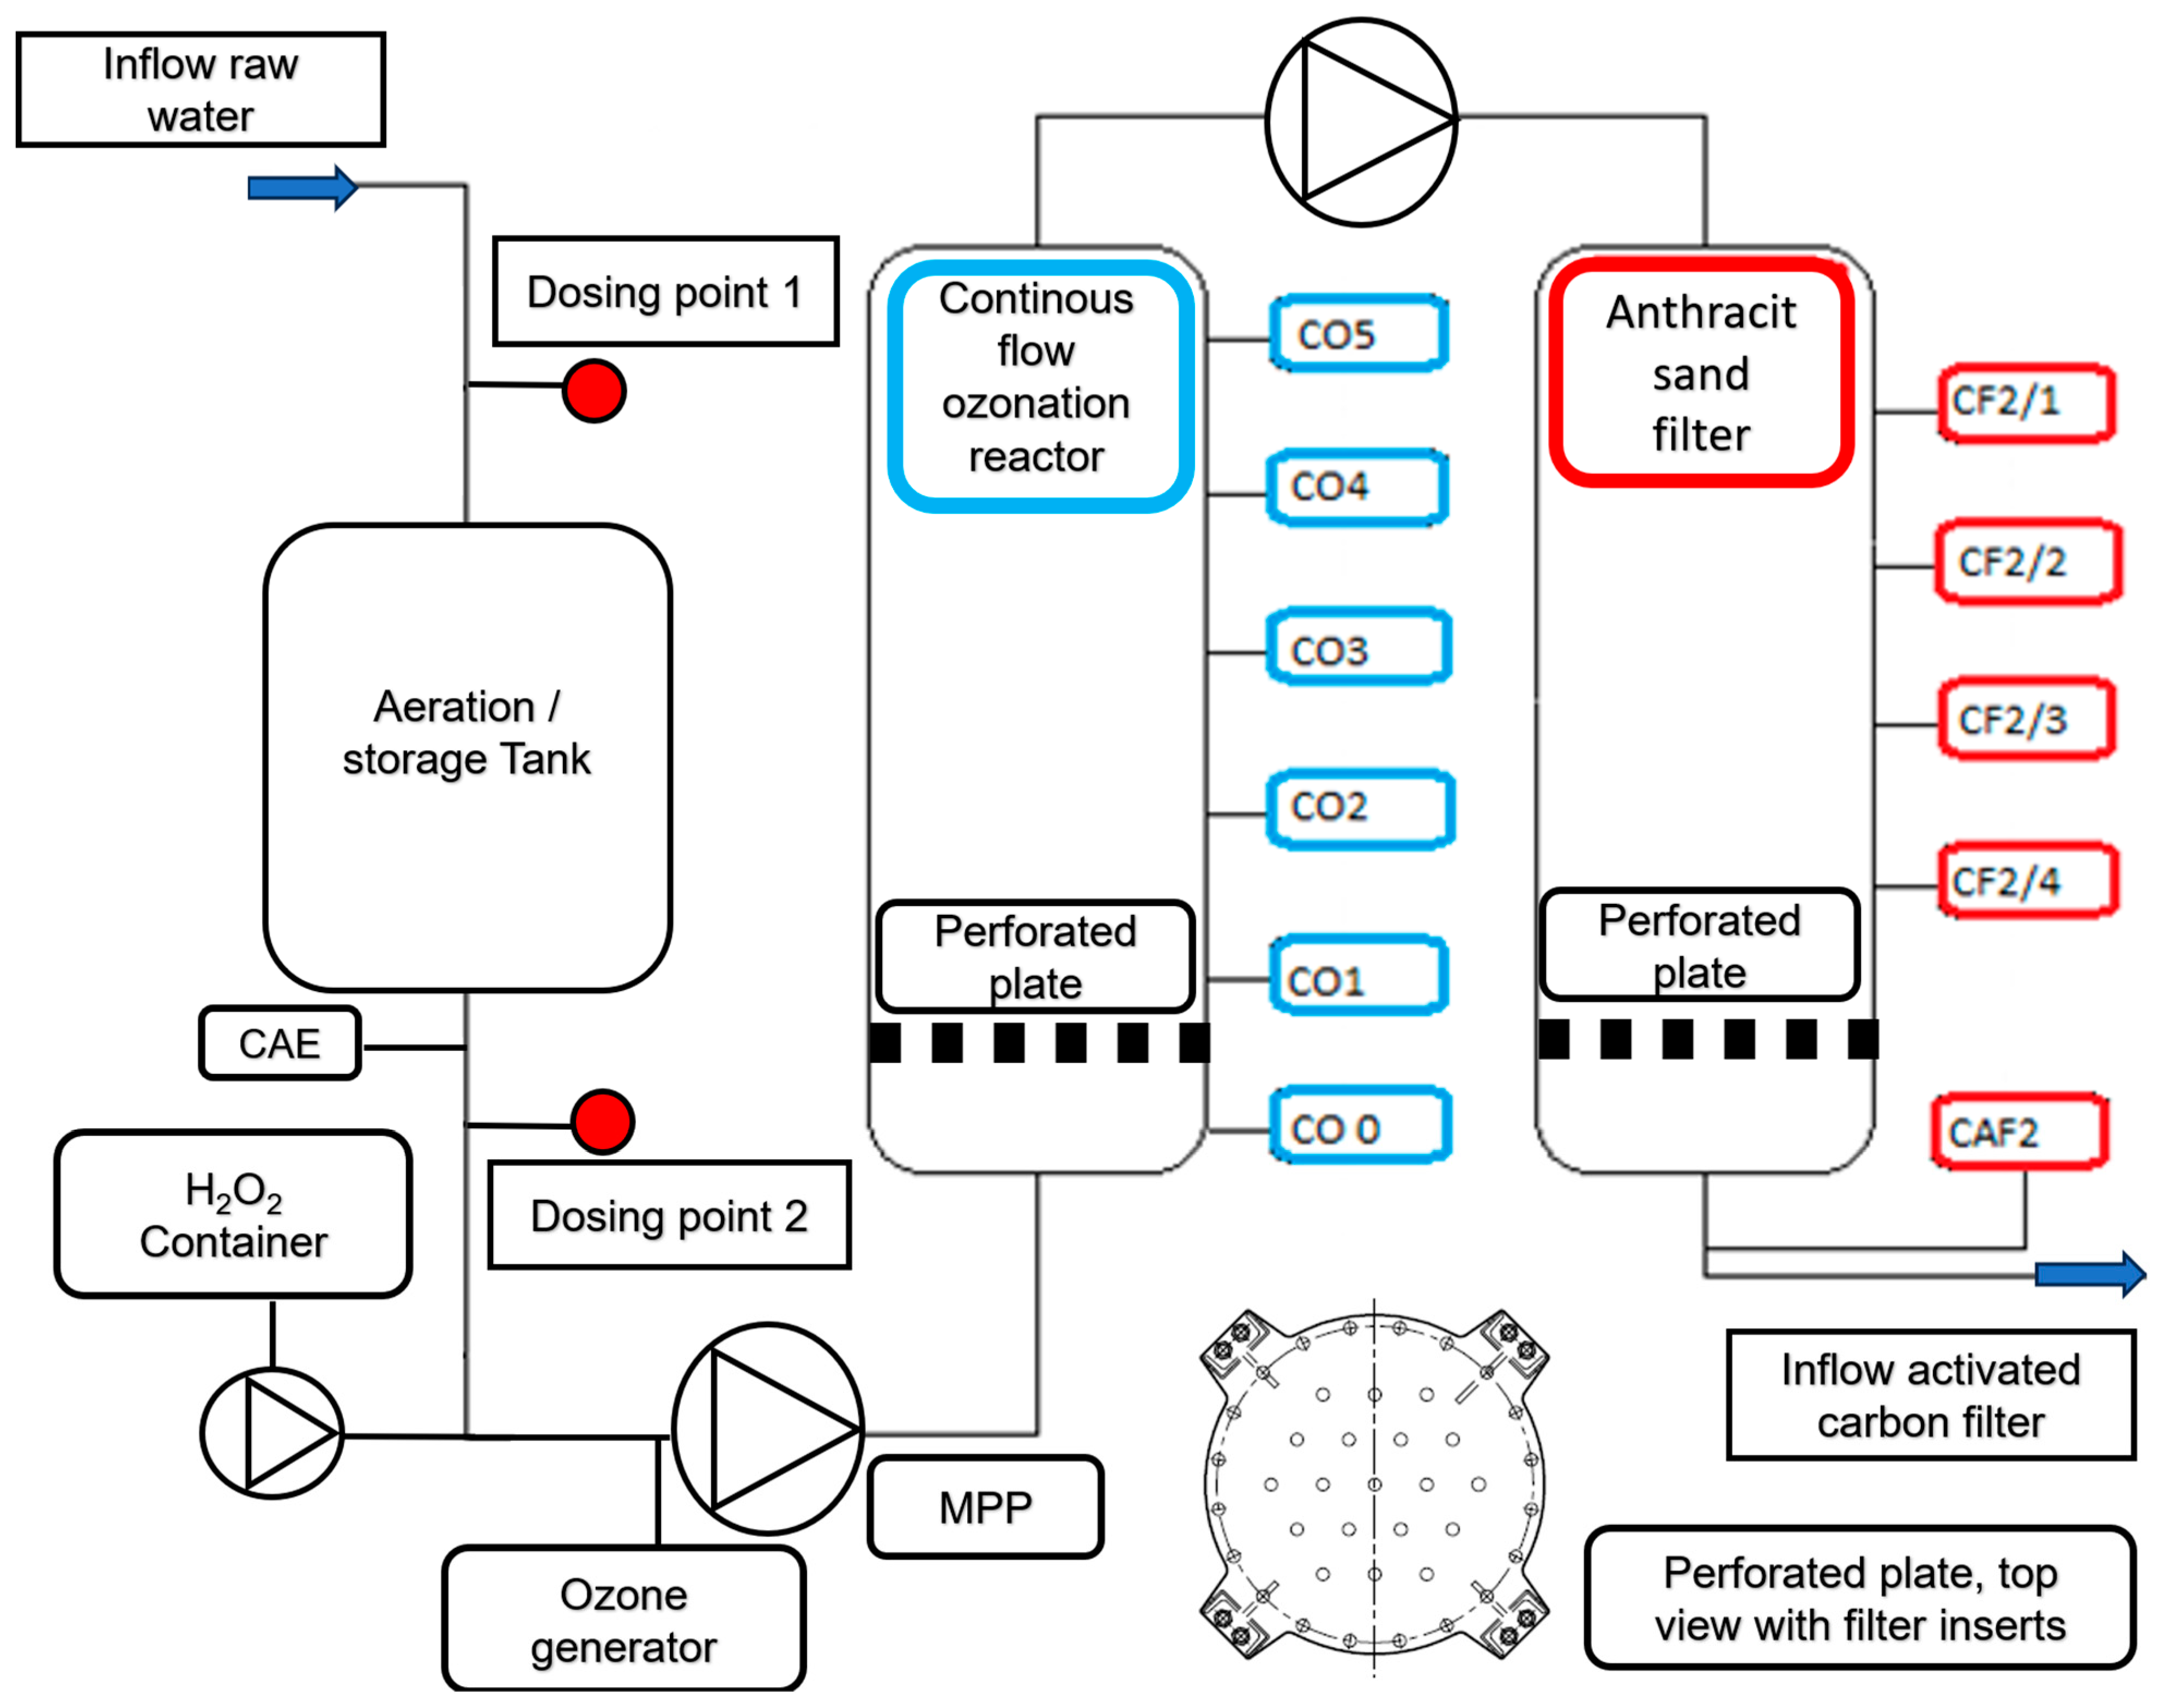
73]. At the DWTP, raw water is treated with ozone to disinfect and oxidize dissolved iron(II) and manganese(II). Filtration through anthracite removes the particles generated during ozonation. Trace organic compounds (TrOCs) and their transformation products, NOM, and heavy metals are adsorbed on granular activated carbon. In order to gain further insight into the treatment processes and identify the risks and improvement potentials of a conventional water treatment plant, e.g., the removal of TrOCs and chromium(VI), a modular pilot plant was built and operated [74,75].
The objective of this study was to demonstrate the behavior of stabilized ENPs at a DWTP for risk assessment. Although there are many laboratory tests for the removal of ENPs, their behavior in a working pilot plant or technical DWTP has rarely been described [52,53,54]. The results of the study can be used as a basis for risk assessment by authorities and water suppliers. First, several ENPs were synthesized and tested for their stability in natural water (surface and drinking water). The stable ENPs were then tested for retention in riverbank filtration on a laboratory scale using Rhine sand as a model, while purified quartz sand and silica gel were studied as references. The ENPs not retained during bank filtration were then investigated for retention during filtration on fresh and used anthracite and for adsorption on activated carbon. CFS was studied as an upgrade in DWTPs for ENP removal. The most stable ENPs were injected into the pilot plant for a short period of time and their behavior in ozonation, AOP and retention on anthracite sand filter was determined. This work is the first to consider the retention of stabilized ENPs throughout the process chain from surface water to drinking water, which is essential for a comprehensive risk assessment.

2. Materials and Methods

2.1. Materials

All chemicals used in this work were of analytical grade and were used as supplied, unless otherwise noted (Supplementary Data, Section S1). Eight different ENPs, which were expected to be stable in natural water, were prepared according to the published methods (Table 1). The detailed synthesis protocols and characterization can be found in the Supplementary Data, Section S2.

2.2. Water Qualities

Rhine water (RH), raw water (RW) and drinking water (DW) were used for the experiments [84]. RH was sampled unfiltered at the LANUV Rhine monitoring site in Düsseldorf. As surface water, it has a higher turbidity and a higher total organic carbon (TOC) content, but a lower hardness compared to RW and DW. The RW consists of about 70% Rhine bank filtrate and about 30% groundwater, and can be classified as hard, well-mineralized water. The DWTP increases the oxygen and pH of the RW and removes dissolved iron, manganese and most of the total organic carbon (TOC). The complete results of the chemical analysis of RH, RW and DW are presented in the Supplementary Data, Section S3.

2.3. Pilot Plant

The pilot plant was designed by Stadtwerke Düsseldorf (SWD) and built by Cornelsen Umwelttechnologie GmbH, Essen, Germany. The LPRO plant was built by Grünbeck Wasseraufbereitung GmbH, Höchstädt a.d. Donau, Germany (GENO Nano RKF1800 S). The electrical installation, plant control and data management were installed by SWD. The pilot plant consisted of two treatment lines. In this study, the aeration, the ozonation continuous flow reactor (Figure 3; 2.3) and the deep-bed filter (Figure 3; 3.1) with 13 sampling points were used. A detailed description of the sampling points is given in the Supplementary Data, Section S4. A schematic representation of the pilot plant is shown in Figure 3.
Raw water was continuously pumped into the storage tank with built-in aeration (KoiPRO Air Blow 100 Hi, Happykoi GmbH & Co. KG, Hamm, Germany). During aeration, the pH increased by ~0.2 due to carbon dioxide stripping. Ozone was generated by plasma discharge with an Anseros ozone generator COM-AD-01-IP, Tübingen, Germany and the gaseous ozone concentration was measured with an ozone analyzer BMT 964, Berlin, Germany. The gaseous ozone in oxygen (20 L/h) was mixed into the water with a multiphase pump (PBU 201-E10-Cr Edur Pumpenfabrik, Kiel, Germany) with a sampling point (MPP) and fed into the continuous flow ozonation reactor (CFR). Residual ozone in the water (dissolved, free ozone) was analyzed using a Hach Orbisphere 410 controller O3 equipped with an Orbisphere C1100-SOS ozone sensor (range 0 ppb–50 ppm O3, accuracy ±0.4 ppb), Loveland, Colorado, USA, at the CO0 or CO5 sampling points. The CFR outlet was brought to 6.5 bar using a booster pump and pumped to the anthracite sand deep-bed filter. The flow rate was adjusted at 2.0 m3/h. For the AOP experiments, a hydrogen peroxide (H2O2) solution was injected just prior to the ozone inlet with a Smart Digital DDA dosing pump (Grundfos GmbH, Erkrath, Germany). The spiking of the pre-treated RW with NPs was carried out at dosing point 2 with an Ismatec BVP ISM444B pump, Glattbrugg, Switzerland. After CAF2, a pressure control valve was installed in the outlet to maintain the pressure at 5.0 bar, the typical network pressure. The specifications of the main system components are listed in Table 2.

2.4. Ozonation and AOP Experiments, and the Behavior of ENPs on the Filter at a Pilot Scale

For ozonation, a dose of 500 ppb O3 was applied at CO0, resulting in different residual ozone levels at the outlet of the ozonation reactor (CO5) depending on the raw water quality. After stabilization, the ENP dispersion was injected into the water stream at dosing point 2 (Figure 3). Samples were collected at the MPP sampling point and the residual dissolved ozone was destroyed by the addition of a spatula tip of activated carbon for PVP/AuNPs or 1 mL of 0.01 mol/L sodium thiosulfate for PVP/AgNPs. This way, samples with different reaction times could be obtained, e.g., for PVP/AuNPs from 0 to 10 min, and for PVP/AgNPs from 0 to 35 min. The procedure was repeated in AOP mode at the same ozone dose. In this case, a 1% H2O2 solution was injected into the water stream so that the residual ozone concentrations at CO0 decreased to ~10 ppb. The samples were collected at the end of CFR (CO5), in the filter stage (CF2/1–4) and at the outlet of the deep-bed filter (CAF2). The removal during ozonation and flocculation or retention on the filter material was calculated with respect to the initial value according to Equation (2), where ci and ce are the influent and effluent concentrations, respectively.
Retention / removal   ( % ) = 1 C e C i × 100

2.5. Small-Scale Ozonation and AOP of ENPs

To investigate the influence of ethylene glycol (EG) on the stability of PVP/AgNPs, the pilot plant ozone generator was used. PVP/AgNPs in both EG/water and water were diluted 1:200 with RW, resulting in 250 mL each with a concentration of 0.004 mg/L Ag. The oxygen/ozone gas stream was passed for 2 min through a 500 mL wash bottle containing 250 mL of diluted NP dispersion. For AOP, 1 mL of 1% H2O2 was added to each sample and the UV-Vis spectra were recorded after 30 min.

2.6. Analytical Methods for ENPs

For the size and shape analysis of NPs, a Philips CM 200 FEG, 200 KV transmission electron microscope (TEM) was used to measure the size of NPs. The coating of the filter material was analyzed by XPS using an Ulvac-Phi VersaProbe II equipped with a monochromatic Al Kα light source with a photon energy of 1486.6 eV and a beam diameter of 100 μm. The angle between the sample and the analyzer was 45°. Electrical conductivity (EC), pH and temperature were measured and recorded using a Multi 3430 IDS connected to TetraCon® 925, SenTix® 980P, SensoLyt®, SenTix® or ORP 900P sensors from WTW, Weinheim, Germany. Dynamic Light Scattering (DLS) measurements were made with a Zetasizer Nano S, Malvern Panalytical GmbH, Kassel, Germany. UV-Vis measurements were performed using a Lambda 35 spectrophotometer with WIN-LAB software, version 6.0.3, PerkinElmer Life and Analytical Sciences, Shelton, CT, USA, equipped with a 10 or 50 mm flow cell (high-performance quartz glass 200–2500 nm, Cat. No. 176,700, Hellma GmbH & Co. KG, Müllheim, Germany). The investigated ENPs show light absorption in the visible light spectrum due to LSPR; therefore, the wavelength range for the analysis was set to 200 nm to 800 nm. The scanning speed was 480 nm/min, the data interval was 1 nm and the slit width was 1 nm. The respective water was measured as background and subtracted by the software. An XS204 analytical balance (repeatability 0.1 mg) from Sartorius, Göttingen, Germany, was used for mass determinations in the range of 10–1000 mg.

2.7. Laboratory Stability Tests of ENPs

The synthesized ENPs were investigated for their behavior in deionized water (DI), drinking water (DW) and surface water (RH) to simulate their behavior in the environment and in DWTPs. In a typical procedure, 1 mL of the prepared ENP dispersion was diluted to 50 mL with DI, DW and RH, respectively. The LSPR absorbance was measured by UV-Vis in scanning mode (1 cm cuvette) at specific times, as indicated in Section 3.1. Citrate-coated AuNPs (CA/AuNPs) were additionally exposed to different ions. The stock solutions of the salts were diluted according to Table 3, followed by the addition of a 1:10 diluted CA/AuNP dispersion. The results are presented in Section 3.1.1.
The influence of the calcium ion concentration was then investigated in detail. For this purpose, different volumes of a calcium chloride solution (c = 2.73 g/L Ca2+) were added to a CA/AuNP dispersion and the change in gold LSPR at 519 nm was examined at different times (45 s, 30 min, 1.5 h and 20 h). The volumes added and the final concentrations obtained are listed in Table 4.

2.8. Adsorption Isotherms of ENPs

In addition to many other models, adsorption processes can be described using the Langmuir or Freundlich adsorption isotherm models [85]. The Langmuir isotherm assumes that the adsorbent has a homogeneous surface that can be covered with a monolayer of adsorbate and that the adsorbates do not interact with each other. Thus, the isotherm is a function of the adsorbed amount (q) with respect to the equilibrium concentration of the adsorptive (ceq), and exhibits a hyperbola that approaches a limit value of qmax as the substrate concentration c increases (Equation (3)):
q e q = k L × q max   ×   c e q 1 + k L × c e q
where kL is the Langmuir constant that is dependent on temperature, adsorbent surface, and qmax describes the monolayer capacity [86]. The Langmuir isotherm shown in Equation (3) can be converted to a linear form (Equation (4)), where the slope represents (kL × qmax)−1 and the intercept represents qmax−1:
1 q = 1 q m a x + 1 k L   ×   c e q   ×   q m a x
In contrast, the Freundlich adsorption isotherm is an empirical relationship between the amount adsorbed on the surface of a solid (adsorbate) and the concentration of the solute in the liquid according to Equation (5):
q e q = k F × c e q 1 / n
where the constant kF indicates the extent of adsorption and n describes the intensity of adsorption. To evaluate the experimental data, Equation (5) is logarithmized to obtain a linear form, where the slope is n−1 and the intercept is ln kF.
In this study, CTAB/AuNPs, PVP/AuNPs and PVP/AgNPs dispersed in DW were tested for adsorption on quartz sand (sterilized and washed), Rhine sand, silica gel and activated carbon. Depending on the ENPs studied, different concentrations of adsorbent and ENPs were used. The adsorption of ENPs was tested as follows: adsorbent (100 mg) was dispersed in 1 L of drinking water with stirring, and the volumes of 0, 2, 3, 5, 8, and 10 mL were taken and made up to 10 mL with DW. A 1:20 dilution of the nanoparticle dispersion was prepared according to Supplementary Data, Section S2, and 10 mL each was added to the adsorbent dispersions. The mixtures were stirred overnight (370 rpm) at (25 ± 1) °C to reach adsorption equilibrium. A blank was prepared by mixing 10 mL of nanoparticle dispersion with 10 mL of drinking water. The absorbance was measured by UV-Vis spectrometry and the adsorption isotherm was calculated. A shaker was used for the sand adsorption experiments. In addition, the sand was weighed and added directly to 10 mL of drinking water. The adsorption isotherms are presented in Section 3.2.

2.9. Column Experiments on ENP Retention

A breakthrough curve describes the passage of a substrate through a porous filter column by plotting the outlet concentration as a function of time (Figure 4). The shape of the curve and the rate at which the substrate penetrates the filter bed depend on the feed concentration, the solvent, the feed flow rate, the column height, shape and type of adsorbent, and the temperature [70,87]. The bed can be divided into three parts. The part near the inlet has the maximum loading with the initial concentration (cin). The breakthrough time (tB) indicates the moment when the contaminant leaves the column at a concentration of 5% of cout and the filter bed is still effective. When the concentration of cout exceeds 95% of ceq, the saturation time (tS) is reached and the bed is exhausted [88]. An interesting value is the time at which the filter is loaded to 50% (half saturation time). This can be determined from the integral below (A) and above (B) the breakthrough curve, as shown by the blue areas in Figure 4.
In the mass transfer zone (MTZ), the difference between the times tB and tS, the interphase mass transport of the substrate takes place (blue area in Figure 4). The MTZ migrates through the porous bed until breakthrough occurs. As a function of time, the concentration at the outlet increases until it equals the initial concentration. The load Xi of the adsorbent can be calculated using Equation (6) [89], as long as the initial concentration ci,E of the adsorbate and the flow rate ( V ˙ E ) do not change significantly (MAds describes the mass of the adsorbent).
X i t = V ˙ E × c i , i n M A d s 0 t 1 c i t c i , E d t
Breakthrough curves are characterized by the efficiency factor (ηi,Ads) according to Equation (7):
η i , A d s = X i , B X i , A d s
where Xi,B is the load of the adsorber bed at breakthrough time tB and Xi,Ads is the load of the adsorber bed at equilibrium (maximum load at saturation time tS).
Breakthrough curves were determined by continuously pumping the diluted NP dispersion through a column filled with the appropriate adsorbent. A 0.45 µm filter was installed downstream of the outlet to retain the particles. The UV-Vis spectrometer in kinetic mode was set to the wavelength in Section 2.6, equipped with a 5 cm cuvette, slit width 1 nm, run time 0–10 min with one measurement per second. The DW was pumped through the column and the background was recorded and zeroed, exchanged for the NP dispersion in the appropriate water and pumped through the adsorbent column, and the effluent was passed through the cuvette in the UV-Vis spectrometer and discarded. Retention on porous materials was performed at (25 ± 1) °C with PVP/AuNPs, CTAB/AuNPs and PVP/AgNPs diluted with Rhine water on 10 g river sand, washed and sterilized quartz sand and silica gel columns (0.5 g) at a flow rate of 0.8 mL min−1. Detailed data of the adsorptives are provided in Supplementary Data, Table S6.1. For ground-activated carbon (Norit® ROW 0.8 Supra), the mass was reduced to 0.5 g and the flow rate was increased to 2.0 mL min−1. Further tests were conducted to determine the breakthrough behavior using 3.15 g of fresh and 3.40 g of used wet anthracite from the pilot plant. The used anthracite had previously been used at the pilot plant for 2 years. Detailed data on the column packing data are given in the Supplementary Data, Tables S6.2 and S6.3. After each filter column test, a tracer breakthrough curve was recorded with a solution of chromium(III) chloride hexahydrate (0.01 M). The corresponding breakthrough curves are discussed in Section 3.3.

2.10. Laboratory Flocculation Experiments of ENPs

The precipitation of ENPs using commercially available flocculants was studied with two different types: Trifloc® S based on ferric chloride with 13.8% iron and Gilufloc® 40 based on aluminum chloride/sulfate with 10% Al2O3. The ENP dispersions were diluted with DW and precipitated with flocculant concentrations of 1 mg/L, 5 mg/L, 10 mg/L and 50 mg/L iron(III) or Al2O3, respectively. The experiments were performed at pH 7.4. The flocculation procedure is described in Table 5 and the NP dispersions used are documented in Supplementary Data, Table S7.

3. Results

3.1. Stability Analysis of the Synthesized ENPs

The stability of the synthesized ENPs in Table 1 was determined by diluting the colloidal dispersions in DI, DW and RH, as described in Section 2.7.

3.1.1. Stability of Citrate/AuNPs in Water

CA/AuNPs with a 12 nm core exhibited an LSPR at 519 nm in DI and were stable for at least 9 days (see Supplementary Data, Table S8), with the sample stored at 15 °C between measurements. After the addition of DW or RH, the color of the NP dispersion immediately changed from red to blue–violet, and led to the irreversible precipitation of dark blue particles the next day (Figure 5). Thus, the CA/AuNPs were not stable in DW or RH.
The addition of sodium chloride or magnesium sulfate, according to Table 3, to CA/AuNPs in DI, as described in Section 2.7, resulted in no color change or precipitation. In contrast, the addition of calcium chloride caused an immediate color change from red to blue. To evaluate the critical coagulation concentration (CCC), defined Ca2+ concentrations according to Table 6 were added to a CA/AuNP dispersion and the change in LSPR over time was examined. The addition of Ca2+ to the CA/AuNP dispersion in DI resulted in an increase in absorbance after 45 s for all concentrations compared to the calcium-free reference, while a broadening of the absorption band was observed at the highest Ca2+ concentration (5.5 mg/L). However, the wavelength maximum remained constant at 517 nm. After 30 min, the dispersion containing 4.1 mg/L (0.1 mM) Ca2+ solution showed a strong broadening of the absorption, while the dispersion containing 5.5 mg/L Ca2+ already showed a second maximum at about 610 nm.
After 1.5 h, the long wavelength band was also prominent at 4.1 mg/L Ca2+, and the long wavelength showed a red shift to 590 nm. After 20 h, the 4.1 mg/L Ca2+ dispersion showed two maxima at 530 nm and 638 nm, with the long wavelength band having a lower intensity, while for the 5.5 mg/L Ca2+, the long wavelength band had a higher absorbance at 680 nm than at 530 nm. The images of the samples and the UV-Vis spectra are documented in the Supplementary Data, Figure S8. Calcium concentrations > 4 mg/L (0.1 mM) led to coagulation for CA/AuNP, which corresponds to a CCC of 0.1 mM Ca2+.

3.1.2. Stability of Mercapto Propionate/AuNPs in Water

The MPA/AuNPs with a 2.2 nm core were synthesized according to Supplementary Data, Section S2.2, and showed a red color in DI with a maximum LSPR at 534 nm. When DW or RH were added, a color change to blue–violet was observed. While the absorption maximum at 534 nm and the absorbance remained constant, the peak broadened significantly and the absorbance was reduced by 20% (see Supplementary Data, Section S9). The process in DW and RH proceeded within 1 day and led to irreversible particle aggregation and precipitation within 3 days.

3.1.3. Stability of Mercaptoethane Sulfonate/AuNPs in Water

The MES/AuNPs with a core size of 20 nm were synthesized according to Supplementary Data, Section S2.3 and showed a characteristic red LSPR at 520 nm. However, the color changed to bluish purple after dilution with DW or RH. The absorption shifted to 553 nm at a lower absorbance and the presence of a second maximum at 668 nm in both DW and RH indicated aggregation (see Supplementary Data, Section S10). While the absorbance at the long wavelength remained constant in DW compared to the dilution in DI, it decreased in RH. The next day, an irreversible precipitation of dark blue particles occurred in DW and RH.

3.1.4. Stability of Triphenylphosphine Monosulfonate/AuNPs in Water

The TPPMS/AuNPs with a core size of 12 nm were synthesized according to Supplementary Data, Section S2.4, and resulted in an LSPR band at 525 nm. The addition of DW resulted in a red shift to 645 nm, accompanied by a color change from the typical red to blue. Rhine water (RH) caused a shift of the spectral maximum to 560 nm, associated with peak broadening and a color shift to bluish purple (see Supplementary Data, Section S11). Irreversible precipitation was observed the next day.

3.1.5. Stability of Cetyltrimethylammonium Bromide/AuNPs in Water

The CTAB/AuNPs with a core size of 12 nm were synthesized according to the Supplementary Data, Section S2.5. They exhibited LSPR absorption at around 528 nm with a ruby red color. Dilution with DI or DW did not result in any visual colorimetric change or shift of the LSPR band, as shown in Figure 6. However, the absorbance increased when RH was added. The CTAB/AuNPs were found to be stable in RH and DW, and were further investigated.

3.1.6. Stability of PVP/AuNPs in Water

PVP/AuNPs were synthesized according to Joshi [80], as described in Supplementary Data, Section S2.6. A ruby red dispersion with an LSPR band at 526 nm was obtained. TEM revealed that the PVP/AuNPs had a diameter of 10 to 25 nm for the Au core and their shape was mainly icosahedral (Supplementary Data, Figure S2.6.1). DLS revealed a monodisperse distribution in solution (Supplementary Data, Figure S2.6.2) with a hydrodynamic size of 59.4 nm (Z-average). PVP/AuNPs were stable with respect to LSPR wavelength and absorbance in DI, DW and RH, as seen in Figure 7.
Several batches were synthesized for dosing at the pilot plant. Stability was tested over 5 days in DI, DW and RH. While the highest decrease in absorbance was found in DI (−5.2%), the changes in DW and RH were small, at +0.2% and −1.0%, respectively (Supplementary Data, Table S2.6). For PVP/AuNPs, Sharma et al. found that when the pH of the dispersion was lowered from 6.7 to 1.0, the color of the solution changed from deep red to blue due to the formation of aggregates. The color of the solution returned to red when the pH of the solution was adjusted back to 6.7, indicating a reversible process [90].

3.1.7. Stability of PVP/AgNPs in Water

The yellow PVP/AgNPs were obtained after synthesis in glycerol/water, according to Elechiguerra et al. [81], as a clear dispersion (Figure 8) with an LSPR maximum at 424 nm. The obtained PVP/AgNPs were polydisperse with core sizes ranging from 1 to 25 nm (Supplementary Data, Figure S2.7.1), which was confirmed by DLS with a bimodal distribution with a hydrodynamic-size maxima of 2 and 40 nm (Z-averages). The dilution of the NP dispersion with DI, DW and RH did not cause any spectral changes.
For the small column experiments with anthracite, ozonation and dosing at the pilot plant, PVP/AgNPs were synthesized in EG according to Carotenuto et al. [82] due to better upscaling and higher stability (Supplementary Data, Section S2.7.2). In EG, they exhibited an LSPR absorption maximum at 401 nm (Supplementary Data, Figure S2.7.2.1), which increased to 424 nm on dilution with DI. According to TEM, PVP/AuNPs had a diameter of 10 to 50 nm for the Ag core and their shape was icosahedral (Supplementary Data, Figure S2.7.2.2). DLS revealed a monodisperse distribution with a hydrodynamic size of 93 nm (Z-average).
Several batches were synthesized for dosage at the pilot plant. Stability was tested over 5 days in DI, DW and RH. A large decrease in absorbance was found for DI (−25.9%), while the changes in DW and RH were small at +5.7% and +2.9%, respectively (Supplementary Data, Section S2.7.2). Since it was not intended to separate the ENPs from the reaction medium for the pilot plant dosage, a small fraction of PVP/AgNPs was separated and dissolved in DI, as described in Supplementary Data, Section S2.7.2, to evaluate the EG influence in small-scale ozonation experiments.

3.1.8. Stability of PVP/PBNPs in Water

Prussian blue nanoparticles were prepared according to Supplementary Data, Section S2.8, and showed an intense blue color with an absorption maximum at 690 nm. However, the addition of DW or RH immediately led to aggregation and flocculation, as documented in Supplementary Data, S12.

3.2. Adsorption Isotherms of Stable ENPs

Stable gold and silver NPs, namely CTAB/AuNPs, PVP/AgNPs and PVP/AuNPs were tested for adsorption on quartz sand, silica gel and activated carbon (ground Norit ROW 0.8 supra) in batch experiments, as described in Section 2.8. CTAB- and PVP-coated gold nanoparticles showed no adsorption on any of the adsorbents used. In addition, no adsorption was found for PVP/AgNPs on the activated carbon. Therefore, only the adsorption results on quartz sand and silica gel were investigated in detail. With the adsorption isotherm data on sand and silica gel in Supplementary Data, Tables S13 and S15, the adsorption isotherms for PVP/AgNPs were plotted (see Supplementary Data, Figures S14 and S16). The corresponding Langmuir and Freundlich evaluations are shown in Figure 9a,b, and for silica gel in Figure 10a,b.
It is obvious that neither the Freundlich nor the Langmuir model agree with the experimental data. According to the IUPAC classification of adsorption isotherms [91], the adsorption of PVP/AgNPs on sand (Supplementary Data, Figure S14) can be assigned to Type III isotherms, which result from adsorption on non-porous materials. This type is found in systems where the interactions between the adsorbate species are stronger than the (weak) interactions between the adsorbates and the surface [67].
On the other hand, the absorption isotherm on silica gel (Supplementary Data, Figure S16) showed an S-shaped PVP/AgNP adsorption isotherm on silica gel (Figure 10), which can be assigned to type IV and type V, describing multilayer adsorption on porous materials [67].

3.3. Breakthrough Behavior of Stable Nanoparticles

CTAB/AuNPs, PVP/AuNPs and PVP/AgNPs in water and EG were tested for retention on column filter beds at the laboratory scale, as described in Section 2.9. The adsorptive concentrations are documented in Supplementary Data, Table S6.1, the filter materials in Supplementary Data, Table S6.2, and the column characteristics for anthracite and sand fillings in Supplementary Data, Table S6.3.

3.3.1. Breakthrough Behavior of ENPs on Quartz Sand

Quartz sand is a typical filter material for particle retention on deep-bed filters and was used as the bottom layer at the pilot plant’s two-layer filter. The tested nanoparticles showed similar breakthrough times (tB) on quartz sand ranging from 0.09 to 0.10 h (Figure 11). A good correlation of the nanoparticles with the tracer curve was found up to a relative concentration of about c/c0 = 0.5, which corresponds to the half saturation time (t0.5) of 0.13 to 0.16 h. Thereafter, a decrease in the slope was observed for CTAB/AuNPs and PVP/AgNPs. The graphical determination of the saturation time (ts) is subject to error due to the asymptotic development after 50% breakthrough, which does not give the exact value for ts. Therefore, the calculated efficiency factors (ηi,Ads) for CTAB/AuNPs and PVP/AgNPs are only approximations (see Supplementary Data, Table S17.1). According to the results, it can be assumed that CTAB/AuNPs, PVP/AuNPs and PVP/AgNPs are not significantly retained by fresh quartz sand.

3.3.2. Breakthrough Behavior of ENPs on Rhine Sand

While the quartz sand was sterile and clean, the Rhine sand represented natural bank filtration, so the adsorber bed also contained naturally occurring biofilm and Rhine particles. The resulting breakthrough curves are shown in Figure 12; discontinuities in the graphs were caused by bubbles in the cuvette. The evaluation of the breakthrough curves is documented in Supplementary Data, Table S17.2. It is noticeable that PVP/AgNPs and PVP/AuNPs breakthrough at about the same time (0.10 h and 0.11 h) as the tracer (0.13 h), while CTAB/AuNPs are retained significantly longer and breakthrough occurs at 0.42 h. In this case, a significant interaction of the Rhine sand with the CTAB/AuNPs can be assumed.

3.3.3. Breakthrough Behavior of PVP-Coated ENPs on Silica Gel

Mesoporous silica has a high surface area-to-volume ratio compared to quartz. Silica gel is highly hygroscopic and can be used as a gelling agent, filter, adsorbent and desiccant. CTAB/AuNPs were not tested with silica gel and anthracite because they would be retained on Rhine sand and would not enter the raw water. Instead, the influence of the EG was investigated by examining PVP/AgNPs in water without EG. The results of the retention of ENPs on silica are shown in Figure 13. Note that the silica mass was reduced to 500 mg and the flow rate was higher at 2 mL/min. It has to be considered that the silica gel mass was reduced to 500 mg and the flow rate was higher at 2 mL/min. The presence of EG reduced the breakthrough time for PVP/AgNPs. All breakthrough parameters are listed in the supplementary Data, Table S17.3.

3.3.4. Breakthrough Behavior of ENPs on Activated Carbon

The breakthrough curves on activated carbon (0.5 g ground Norit® ROW 0.8 Supra) showed different behavior for each of the three ENPs (Figure 14). PVP/AuNPs broke through shortly after the tracer (0.05 h), indicating no significant adsorptive–adsorbent interaction. In contrast, CTAB/AuNPs remained on the column for tB = 0.85 h and showed a sharp breakthrough with an adsorption efficiency of 86%, indicating fast kinetics. PVP/AgNPs were retained even longer with tB = 0.97 h and showed, in contrast, a broad breakthrough (ηi,Ads = 35%), indicating slow adsorption kinetics [65]. The breakthrough parameters are given in Supplementary Data, Table S17.4.

3.3.5. Breakthrough Behavior of PVP-Coated ENPs on Anthracite

For pilot-scale experiments, further column experiments with PVP/AuNPs and PVP/AgNPs were performed on fresh and used anthracite (Figure 15 and Figure 16). In addition, for PVP/AgNPs, the influence of EG in the dosing solution was of interest for use at the pilot plant. Therefore, the PVP/AgNPs in EG/water and in water were diluted with RH and tested under comparable conditions. The breakthrough parameters are given in the Supplementary Data, Tables S17.5 and S17.6.
For fresh anthracite, the breakthrough order was PVP/AgNPs in EG/water, PVP/AuNPs and PVP/AgNPs in water. Although the column material and flow conditions (see Supplementary Data, Table S6.3) were different from quartz sand, the ENPs showed a similar retention behavior. A modified elution curve and earlier breakthrough time of PVP/AgNPs (tB = 0.64 h vs. 0.73 h) was observed with EG in the dispersion.
In contrast, the used anthracite showed a strong retention of PVP/AgNPs in water, which was particularly evident in the half saturation time of 1.08 h. The wide mass transfer zone leads to a low adsorption efficiency of 23%. The reason for the longer retention of PVP/AgNPs on the used anthracite was probably due to the deposition of raw water components on the filter material. The XPS analysis of the particles in the filter rinse water showed, besides the main components, carbon (60 atom%) and oxygen (30 atom%), 4 atom% manganese, 3 atom% calcium and 1 atom% iron. HR-XPS showed a signal at 641.8 eV, which can be attributed to manganese(IV) oxide, pyrolusite (641.8 eV) and a weak signal at 710.4 eV, which can be attributed to iron(III) oxide hydrate (ferrihydrite) at 710.3 eV [92]. Again, it was observed that EG had a strong influence on retention in small column experiments, causing the PVP/AgNPs to elute earlier. Therefore, a higher dilution was used at the pilot plant to reduce the influence of EG.

3.4. Flocculation of ENPs

The results of the precipitation of PVP/AuNPs, PVP/AgNPs in EG and PVP/AgNPs in DI with the flocculants Trifloc® S and Gilufloc® 40, as described in Section 2.10, are shown in Figure 17 as percentage NP removal by a given flocculant concentration after 17 and 32 min; numerical data are given in Supplementary Data, Table S18.

3.5. Ozonation/AOP of PVP-Coated ENPs and Their Behavior in the Two-Layer Filter

To investigate the removal of PVP/AuNPs and PVP/AgNPs during ozonation/AOP and retention in the anthracite sand filter, the respective ENP dispersions were dosed at the pilot plant (Figure 3), as described Section 2.4. Only temporary NP dosing could be performed at the pilot plant. Samples were collected at the most likely retention times of ozonation (Supplementary Data, Table S5.1) and filtration (Supplementary Data, Table S5.3) at sampling points CO5, CF2/1 to CF2/4, and CAF2, shown in Figure 3.

3.5.1. PVP/AuNPs at the Pilot Plant

The PVP/AuNPs were dosed at the pilot plant (see Supplementary Data, Table S19) for ozonation and AOP (see Section 2.4). The residual ozone at CO0 decreased from 500 ppb to 460 ppb during dosing, indicating a low ozone demand of the NP dispersion. The time-dependent change in absorbance of the samples as a function of reaction time is shown in Table 7.
Since there was no change in LSPR absorption, the PVP/AuNPs appeared to be stable to ozone and hydroxyl radicals. After sampling, their behavior was investigated on the anthracite sand filter. The measured UV-Vis absorbances of the samples are shown in Figure 18. At sampling points CO5 (near the CFR outlet), CF2/1 and CF2/2, sampling was too late to capture the maximum concentrations, while at CF2/3 and CF2/4 the maxima were detected. Since an LSPR absorbance of 0.004 was expected (dosing solution absorbance: 1.0, RW flow: 2.0 m3/h and NP dispersion flow: 0.12 L/min), this is consistent with the mean value at CO5 (A = 0.0036 ± 0.0004), while a mean absorbance of 0.0053 ± 0.0021 was measured at the filter outlet (CAF2). The UV-Vis data are documented in the Supplementary Data, Table S20. The evaluation of the mean and maximum absorbance is given in the Supplementary Data, Table S21. It is evident that the PVP/AuNPs passed the ozonation and the two-layer filter to a high degree, probably completely.

3.5.2. PVP/AgNPs at the Pilot Plant

The PVP/AgNP dilution was dosed at the pilot plant under the conditions described in the Supplementary Data, Table S22. During the experiment, it was observed that the residual ozone concentration at CO5 decreased to zero with the NP dosage, indicating a high ozone demand. As shown in Table 8, a small reduction in the absorbance of PVP/AgNPs was observed, which is within the error range, while no effect was observed for AOP.
To test the ozone consumption of ethylene glycol alone, 140 mL EG and 2.89 g PVP-40 kDa were dissolved in water to 1.0 L and dosed into the pilot plant under comparable conditions. Again, strong ozone consumption was observed, as shown in the Supplementary Data, Figure S23. Since EG, as a competitor of ozone, was probably responsible for the increased consumption, small-scale ozonation and AOP were performed with PVP/AgNPs in EG/water and with PVP/AgNPs in water (see Section 2.5). The absorbance values of PVP/AgNPs in EG/water and in water after treatment are summarized in Table 9.
Apparently, the presence of EG protects the PVP/AgNPs. While AOP without EG caused no degradation, ozone caused a moderate decrease in and blueshift of the LSPR, indicating ENP degradation. After ozonation at the pilot plant, the samples were collected from the sampling points of the two-layer filter. The measured UV-Vis absorbances of the samples are shown in Figure 19.
In contrast to PVP/AuNPs, the PVP/AgNP sample series always detected the absorption maxima with the same sampling times as for PVP/AuNPs. Since an LSPR maximum absorption of 0.075 was expected (dosing NP dispersion absorption: 1.0, RW flow: 2.0 m3/h and NP solution flow: 15 L/min), a reduction of 38% was already observed during ozonation (A = 0.0466). At the filter outlet (CAF2), a mean absorbance of 0.0031 ± 0.0015 was measured, corresponding to a reduction of approximately 94% in the two-layer filter. The UV-Vis measurements are documented in Supplementary Data, Table S24 and the evaluation in Supplementary Table S25.

4. Discussion

4.1. Stability of Nanoparticles

Of the eight ENPs synthesized, only three were found to be stable in natural water. The behavior of citrate-capped AuNPs in natural waters is discussed first, since research groups have worked with these ENPs under environmental conditions [53,93]. As shown in Figure 5, CA/AuNPs are not stable in natural water, because Ca2+ destabilized the CA/AuNP dispersion. A critical coagulation concentration (CCC) of 4 mg/L (0.1 mM) Ca2+ was determined for the CA/AuNPs (Section 3.1.1). Johnston et al. reported an increase in the hydrodynamic diameter of 5 nm CA/AuNPs in a 0.08 mM CaCl2 solution from 7.2 to 29.1 nm after 30 min, which is in agreement with the results of this study [27]. Hofman-Caris et al. used these particles at a pilot plant and found strong retention with river water containing 61 mg/L calcium [53]. Natural organic matter (NOM) is able to stabilize CA/AuNPs at low concentrations as in DW, but aggregation was found at concentrations of >2 mg/L C. When CA/AuNPs are diluted in Rhine water, the blue coloration with an absorption maximum at 680 nm indicates aggregation (see Figure 5), where a TOC of 2.9 mg/L is sufficient to temporarily protect the nanoparticles from precipitation. Nason et al. attribute this to a hydrophobic interaction [94]. Regarding the mechanism, Johnston et al. found that a dilute Ca2+ solution induces strong interparticle bridges in CA/AuNPs that favor particle attachment to the chain ends, leading to the formation of small branched chains in TEM and a strong red shift in LSPR [27]. Therefore, CA/AuNPs are not stable in natural water, even if a minor stabilization by NOM has to be taken into account [24]. The instability of the remaining ENPs is probably also caused by the presence of calcium ions.
In contrast, CTAB/AuNPs, PVP/AuNPs and PVP/AgNPs were stable in DW and RH up to ionic strengths of 10 mM and 2 mM calcium ions. Chanana et al. found that CTAB/AuNPs were resistant in various biological media, even at higher gold concentrations of up to 20 mg/mL [95]. CTAB/AuNPs synthesized with excess CTAB, as in this work, show a positive zeta-potential and high stability [30]. PVP/AuNPs and PVP/AgNPs were stable up to 2 mM Ca2+, which is consistent with the results of Fjordbøge et al. [93]. Lead et al. [96] reported that PVP/AuNPs are resistant to high ionic strength and calcium ions for use in column experiments [96]. In a further study, Lead et al. proved 7 nm PVP/AuNPs to be very stable against aggregation during pH changes or addition of inorganic ions, even up to 4 g/L (0.1 M) Ca2+ [97]. Only at high NaCl concentrations of >10 mM or at pH < 5 was degradation observed, leading Kónya et al. to conclude that PVP/AgNPs have excellent biorelevant colloidal stability [98]. CTAB/AuNPs, PVP/AuNPs and PVP/AgNPs are sufficiently stable in used surface water.

4.2. Column Filter Tests

In terms of stability, only CTAB/AuNPs, PVP/AuNPs and PVP/AgNPs are candidates for breakthrough in riverbank filtration. On columns filled with quartz sand (Figure 11), the three ENPs were only weakly retained with low breakthrough times. Later, at the half saturation time, CTAB/AuNPs and PVP/AgNPs were retained longer, indicating a weak interaction for clean quartz sand with CTAB/AuNPs and PVP/AgNPs, which is confirmed by Fjordbøge et al. who found high mobility and up to 90% recovery for 12 nm PVP-65 kDa/AuNPs on cleaned fine filter sand with a porosity of 0.42, which is close to the quartz sand used here, with a porosity of 0.43 [93].
Increasing the surface area by using silica gel to 600 m2/g improved the capacity and retention of PVP/AgNPs, which eluted before PVP/AuNPs, as shown in Figure 13. The high mobility of PVP/AgNPs on silica surfaces was reported by Keller et al., which implies a high relevance for environmental transport [99]. On silica gel, PVP/AuNPs are retained for the longest time, with a tS of 0.24 h compared to the tracer with tS = 0.05 h.
The riverbank filtration zone consists of sediment, sand and gravel covered with biofilm, the population of which varies over the seasons due to temperature, oxygen and nutrient supply [73,100]. In the laboratory experiment, this corresponds to the Rhine sand column under oxidic conditions, where PVP/AuNPs and PVP/AgNPs were weakly retained. In contrast, a strong retention of CTAB/AuNPs was observed with a low slope of the breakthrough curve, indicating a slow kinetic retention in the bank filtration [65]. Sahle-Demessie et al. investigated the retention of PVP/AgNPs on different filter materials of a DWTP and found that the sand filter achieved retention of bare ENPs, but only minimal retention of polymer-coated ENPs [101]. They reported that biofilm in used filter media increased the adsorption of ENPs, but this effect was less significant for PVP/AgNPs. Recently, Hamann, Arndt and coworker reported that the biofilm in the Rhine sediment retained 6 to 12 times more microplastic particles than clay without biofilm [102], which is of interest because the PVP-protected nanoparticles have a similar surface to some plastics. In this study, it is also probable that biofilm or extracellular polymeric substances (EPSs) were responsible for the retention on the Rhine sand columns. EPSs are long-chain polymers with a polysaccharide structure that are produced by microorganisms and released into their immediate environment, i.e., they are extracellular [103]. Therefore, it can be assumed that CTAB/AuNPs are retained during bank filtration, while PVP/AuNPs and PVP/AgNPs must be considered as potential contaminants of the raw water.
After ozonation, a two-layer filter was installed at the pilot plant and simulated by laboratory-scale column filter experiments using fresh and used anthracite. As expected, fresh anthracite, a non-porous carbonaceous filter material, resulted in a lower retention for PVP/AuNPs than for PVP/AgNPs in EG (Figure 16). For PVP/AuNPs, the retention increased to tS = 0.86 h and to tS = 1.92 h for PVP/AgNPs, while the PVP/AgNPs in EG/water were less retained (tS = 0.94 h). Thus, the presence of EG increased the mobility of PVP/AgNPs in both experiments. It is evident that EPSs or biofilm are not responsible for the retention of PVP/AgNPs dispersed in water, but probably manganese(IV) oxide and ferrihydrite formed from manganese(II) and iron(II) in the raw water during ozonation. The oxides covered the surface of the anthracite grains and were identified in the solids of the filter-rinsed water by XPS. As a result, PVP/AgNPs were effectively retained on the used anthracite covered with manganese(IV) oxide and ferrihydrite, although the efficiency factor of ηi,Ads = 24% was low, indicating slow adsorption and desorption processes. Zhang, Zu et al. studied the transport of 1, 40 and 360 kDa PVP-capped AgNPs on various filter media, including cleaned sand, kaolinite, humic acid and ferrihydrite-coated sand, and found increasing mobility and recoveries with an increasing PVP molecular weight [104]. For PVP-40 kDa/AgNPs, they found the highest mobility and recovery on humic acid-coated sand, followed by partial retention on kaolinite and complete retention on ferrihydrite-coated sand, which is consistent with the results obtained here.
Activated carbon filtration is often part of drinking water treatment to remove traces of organic and inorganic compounds [74,75]. Therefore, column filtration tests were also performed with ground Norit® ROW 0.8 Supra, an extruded activated carbon used for water purification in DWTPs. As shown in Figure 14, PVP/AgNPs (tB = 0.85 h) and CTAB/AuNPs (tB = 0.97 h) were strongly retained before breakthrough occurred. For CTAB/AuNPs, the adsorption and desorption processes were faster, with a ηi,Ads of 86% and a tS of 1.29 h, while for PVP/AgNPs a ηi,Ads of 35% and a tB of 4.66 h were evaluated, indicating slow kinetics. Although CTAB/AuNPs were retained on the carbon, the adsorption isotherms showed no adsorption. Other mechanisms of colloid retardation, such as diffusion into mesopores and macropores of the carbon, may be responsible for the retention [65]. McGillicuddy et al. found that 25 nm PVP/AgNPs at a concentration of 100 ppb were adsorbed on mesoporous activated carbon (Norit® AC1) [105]. For the 100 ppb level, they determined the removal rate of ~38% for the ground material. In contrast, PVP/AuNPs showed a comparable breakthrough as the tracer, indicating a low adsorptive–adsorbent interaction; and therefore, PVP/AuNPs cannot be removed by adsorption on activated carbon. Since CTAB/AuNPs could be largely retained by adsorption on biofilm/EPSs during bank filtration, only the behavior of PVP-coated ENPs was investigated at the pilot plant.

4.3. Pilot Plant Results

The first process step investigated at the pilot plant was the ozonation of the raw water. The PVP/AuNPs were found to be stable at 500 ppb ozone in the raw water (Table 7). This is consistent with the small reduction in residual ozone during PVP/AuNP dosing of 40 ppb. Pacey et al. found that CA/AuNPs react reversibly with ozone depending on the ozone concentration [58]. Even AOP, with the generation of hydroxyl radicals at the same ozone level, did not cause any significant degradation of PVP/AuNPs (Table 7). PVP/AuNPs then entered the two-layer filter and passed without any retention (Figure 18), confirming the small column results. Thus, PVP/AuNPs were neither degraded at the pilot plant with ozonation/AOP, nor retained during filtration on an anthracite coated with manganese dioxide and ferrihydrite.
For PVP/AgNPs, small-scale ozonation experiments at the pilot plant resulted in an 18% reduction of LSPR in water/EG, which increased to 54% in water without EG. Thus, the presence of ethylene glycol resulted in a lower degradation rate. This is in agreement with Rindone et al., who found that ozone reacts with EG in water at pH 4 to 9, oxidizing the methylene groups to carbonyl groups [106]. AOP resulted in a 16% reduction in PVP/AgNPs in EG/water and a 13% reduction in AgNPs in water. It is obvious that AOP is less suitable for the reduction of PVP-coated ENPs. In addition, a blue shift of the LSPR maximum was observed, which was higher for ozonation than for AOP, indicating a reduction in the size of the silver core [50,51]. In the pilot plant ozonation, the removal of PVP/AgNPs was found to be about 38%, which is between the small-scale ozonation of PVP/AgNPs in EG/water and in water. The reason for the reduced yield is the presence of ozone-depleting EG. Due to the lower oxidation potential of silver compared to gold, oxidation of the silver core is also possible without loss of the PVP coating. For example, Morozov et al. found that when polyphosphate-stabilized AgNPs were oxidized with ozone at one silver atom per NP, a decomposition of three ozone molecules occurred, while the colloidal stability of the ENPs decreased [107].
The subsequent two-layer filter resulted in a PVP/AgNP retention of approximately 94%. The highest PVP/AgNP retention of ~50% was observed in the upper part of the anthracite layer, followed by ~30% in the upper part of the sand layer (CF2/3), where the highest density of manganese(IV) oxide and ferrihydrite particles are expected in the two-layer filter. This is consistent with small column experiments, where strong retention was observed with used anthracite from the pilot plant. Thus, PVP/AgNPs were partially removed during ozonation and almost completely removed on the two-layer filter.

4.4. Flocculation

One way to retain PVP/AuNP is to upgrade the DWTP by integrating a CFS process. As shown in Figure 17, CFS with iron(III) or aluminum(III) can reduce the ENP load. However, the required dose of 50 mg/L iron to flocculate 90–95% of PVP/AuNPs was high, while aluminum(III) was less effective with a reduction of 51–61% for 50 mg/L Al2O3. For example, both flocculants exceeded the permitted addition according to the German Drinking Water Ordinance, which specifies a maximum addition of 12 mg/L for iron and 19 mg/L for aluminum (17 mg/L alumina) [108]. In contrast, PVP/AgNPs were flocculated at lower concentrations of 1 mg/L iron or alumina, and increasing the flocculant concentration did not increase the removal, but the stability of the flocs. However, at 5 mg/L iron, at least 20 to 43% of PVP/AuNPs and 59 to 63% of PVP/AgNPs can be removed. To our knowledge, the flocculation of PVP-stabilized Au and Ag nanoparticles with Fe(III) or Al(III) has not been reported, so no comparative data are available. However, data are available for metallic ENPs [54], CA-coated NPs [52,53] and PVA-coated NPs [14], where the efficiencies showed high variability and strong dependence on ENP, dosage, type of flocculant and water matrix. In four cases, the NP removal at 32 min was lower than at 20 min, taking into account the uncertainty of the measurements, and in three cases, it was the lowest flocculant concentration. At low flocculant concentrations, there is a risk that the flocs will not be stable and NPs will be mobilized again. These particles would not be effectively removed in a subsequent deep-bed filtration step with a 1 µm cutoff. The presence of organic matter (here, EG) resulted in improved floc stability for PVP/AgNPs at half the ENP concentration and constant flocculant dosage.

4.5. Summary

Eight ENPs were synthesized and their stability in natural water was investigated. Only three NPs were stable in surface and drinking water: CTAB/AuNPs, PVP/AuNPs and PVP/AgNPs (Table 10). In the laboratory, the retention of ENPs on quartz sand, silica gel and fresh anthracite was weak or not relevant. CTAB/AuNPs can be retained on biologically active sand, representing the bank filtration. In contrast, PVP/AuNPs and PVP/AgNPs can overcome bank filtration and contaminate raw water resources. During pilot-scale ozonation, PVP/AuNPs showed no degradation, while PVP/AgNPs were partially removed. Reduced degradation was observed in the presence of organic matter (here EG). AOP resulted in no reduction for AuNPs and a slight reduction for PVP/AgNPs.
On the two-layer filter, PVP/AgNPs were almost completely retained on manganese dioxide/ferrihydrite layers on the filter grains, which was consistent with small-scale column experiments. However, CTAB/AuNPs and PVP/AgNPs were retained on activated carbon with different mechanisms. PVP/AuNPs cannot be retained on biologically active river sand, which served as a model for bank filtration, or removed in the conventional DWTP with ozonation, particle filtration and activated carbon filtration. A flocculation process can be added to improve PVP/AuNP removal. However, in water with low TOC (here <0.3 mg/L), the flocculant doses are high and the flocs are unstable, releasing some ENPs.

5. Conclusions

It is reassuring for water suppliers and consumers that the majority of ENPs can be removed by natural bank filtration, followed by treatment in a conventional DWTP, even if the selection chosen here is not representative. It became clear that bank filtration alone is not fully effective and that ENPs need to be removed in a DWTP, as in the case of PVP/AgNPs. A multi-barrier approach, in which the treatment steps are complementary and partially overlapping, is shown to be effective. However, one ENP (PVP/AuNP) was identified that is unlikely to be removed by bank filtration or conventional treatment, and that could be used as a sensor in the future. Therefore, it remains of great importance to minimize the contamination of surface and groundwater with ENPs in order to avoid costly treatment processes such as nanofiltration or reverse osmosis. Due to their high stability, special attention should be paid to the use and discharge of PVP-stabilized ENPs into surface waters [35]. If nanomaterials are approved, manufacturers should be required to conduct a baseline study of their behavior in natural water and during water treatment, as is the case for new pesticides. It is economically more beneficial for water suppliers and society to prevent the release of ENPs into the environment, even if legal limits have not yet been set. This work shows that more environmental data on ENPs need to be collected from a variety of sources and complemented by experiments to provide robust data on their behavior to enable a comprehensive risk assessment [109]. Accordingly, there is still a long way to go for the international community and citizens to achieve an open and FAIR (findable, accessible, interoperable and re-usable) approach to data, although this is an important prerequisite for achieving the United Nations Sustainable Development Goals (UN SDGs), in particular the Millennium Development Goal on access to clean water [110]. The ECHA CHEM database was of little help for this work, as the extraction with EUON—EU Observatory for Nanomaterials [111] yielded only one ENP hit with “silver in nanoform”, while gold was not listed at all. In 2023, Nielsen et al. concluded that >90% of the original EU nanosafety recommendations have been met to a medium or high degree [112]. The authors point to the need for advanced measurement tools and risk assessments. However, the safety of nanomaterials is an international issue, and in their analysis, Gonzalez et al. call for the “implementation of global regulations to promote nanotech research according to a precautionary principle focused on an environmental and health protection approach to ensure the safe and responsible use and application of nanotechnologies” [113]. Similar conclusions were reached in a review by Kumar et al., who recommended the implementation of appropriate regulatory frameworks and future research focusing on advanced investigation and mitigation strategies [8], which the authors fully support.

Supplementary Materials

The following supporting information can be downloaded at: https://www.mdpi.com/article/10.3390/applnano5040018/s1.

Author Contributions

Conceptualization, N.K., G.K., L.S. and S.B.; pilot plant construction, P.J. and N.K.; methodology, L.S., S.B., G.K. and N.K.; implementation P.J., L.S., S.B. and D.S.; analytics, L.S., S.B. and D.S.; validation, G.K., P.J. and N.K.; literature review, L.S., S.B. and N.K.; formal analysis, G.K. and N.K.; data curation N.K.; writing—original draft preparation, N.K.; writing—review and editing, G.K., P.J., D.S., L.S. and S.B.; visualization, L.S., S.B. and N.K. All authors have read and agreed to the published version of the manuscript.

Funding

This research received no external funding.

Institutional Review Board Statement

Not applicable.

Informed Consent Statement

Not applicable.

Data Availability Statement

Data are provided in the article and the Supplementary Materials.

Acknowledgments

The authors would like to thank Wolfgang Meyer-Zaika, University of Duisburg-Essen, Faculty of Chemistry for the TEM measurements of nanoparticles. For XPS measurements, they thank Ulrich Hagemann, ICAN, University of Duisburg-Essen. They express gratitude to Hans-Peter Rohns and Christoph Wagner, Stadtwerke Düsseldorf AG, for their kind support of the work and discussions. The authors would like to thank the people who helped with this work. They also appreciate the valuable work and suggestions of the reviewers.

Conflicts of Interest

The authors declare no conflicts of interest.

References

  1. Horikoshi, S.; Serpone, N. Introduction to Nanoparticles in Microwaves in Nanoparticle Synthesis; Wiley eBooks: Hoboken, NJ, USA, 2013. [Google Scholar] [CrossRef]
  2. Sun, T.Y.; Bornhöft, N.A.; Hungerbühler, K.; Nowack, B. Dynamic probabilistic modeling of environmental emissions of engineered nanomaterials. Environ. Sci. Technol. 2016, 50, 4701–4711. [Google Scholar] [CrossRef] [PubMed]
  3. Khan, I.; Saeed, K.; Khan, I. Nanoparticles: Properties, applications and toxicities. Arab. J. Chem. 2019, 12, 908–931. [Google Scholar] [CrossRef]
  4. Park, C.M.; Chu, K.H.; Her, N.; Jang, M.; Baalousha, M.; Heo, J.; Yoon, Y. Occurrence and removal of engineered nanoparticles in drinking water treatment and wastewater treatment processes. Sep. Purif. Rev. 2016, 46, 255–272. [Google Scholar] [CrossRef]
  5. Sousa, V.S.; Teixeira, M.R. Metal-based engineered nanoparticles in the drinking water treatment systems: A critical review. Sci. Total Environ. 2020, 707, 136077. [Google Scholar] [CrossRef]
  6. Tiede, K.; Hanssen, S.F.; Westerhoff, P.; Fern, G.J.; Hankin, S.M.; Aitken, R.J.; Chaudhry, Q.; Boxall, A.B.A. How important is drinking water exposure for the risks of engineered nanoparticles to consumers? Nanotoxicology 2015, 10, 102–110. [Google Scholar] [CrossRef]
  7. Yu, C.; Kim, S.; Jang, M.; Park, C.M.; Yoon, Y. Occurrence and removal of engineered nanoparticles in drinking water treatment and wastewater treatment processes: A review. Environ. Eng. Res. 2021, 27, 210339. [Google Scholar] [CrossRef]
  8. Singh, G.; Thakur, N.; Kumar, R. Nanoparticles in drinking water: Assessing health risks and regulatory challenges. Sci. Total Environ. 2024, 949, 174940. [Google Scholar] [CrossRef]
  9. Dörfler, H.-D. Grenzflächen und Kolloid-Disperse Systeme; Springer: Berlin/Heidelberg, Germany, 2002. [Google Scholar] [CrossRef]
  10. Christian, P.; Von Der Kammer, F.; Baalousha, M.; Hofmann, T. Nanoparticles: Structure, properties, preparation and behaviour in environmental media. Ecotoxicology 2008, 17, 326–343. [Google Scholar] [CrossRef]
  11. Eustis, S.; El-Sayed, M.A. Why Gold Nanoparticles Are More Precious than Pretty Gold: Noble Metal Surface Plasmon Resonance and Its Enhancement of the Radiative and Nonradiative Properties of Nanocrystals of Different Shapes. Chem. Inform. 2006, 35, 209–217. [Google Scholar] [CrossRef]
  12. Kang, H.; Buchman, J.T.; Rodriguez, R.S.; Ring, H.L.; He, J.; Bantz, K.C.; Haynes, C.L. Stabilization of silver and gold nanoparticles: Preservation and improvement of plasmonic functionalities. Chem. Rev. 2018, 119, 664–699. [Google Scholar] [CrossRef]
  13. Pamies, R.; Cifre, J.G.H.; Espín, V.F.; Collado-González, M.; Baños, F.G.D.; De La Torre, J.G. Aggregation behavior of gold nanoparticles in saline aqueous media. J. Nanoparticle Res. 2014, 16, 2376. [Google Scholar] [CrossRef]
  14. Sun, Q.; Li, Y.; Tang, T.; Yuan, Z.; Yu, C.-P. Removal of silver nanoparticles by coagulation processes. J. Hazard. Mater. 2013, 261, 414–420. [Google Scholar] [CrossRef] [PubMed]
  15. Heuer-Jungemann, A.; Feliu, N.; Bakaimi, I.; Hamaly, M.; Alkilany, A.; Chakraborty, I.; Masood, A.; Casula, M.F.; Kostopoulou, A.; Oh, E.; et al. The role of ligands in the chemical synthesis and applications of inorganic nanoparticles. Chem. Rev. 2019, 119, 4819–4880. [Google Scholar] [CrossRef]
  16. Fratoddi, I. Hydrophobic and Hydrophilic Au and Ag Nanoparticles. Breakthroughs and Perspectives. Nanomaterials 2018, 8, 11. [Google Scholar] [CrossRef]
  17. Astruc, D. Introduction: Nanoparticles in catalysis. Chem. Rev. 2020, 120, 461–463. [Google Scholar] [CrossRef]
  18. Fratoddi, I.; Cerra, S.; Salamone, T.A.; Fioravanti, R.; Sciubba, F.; Zampetti, E.; Macagnano, A.; Generosi, A.; Paci, B.; Scaramuzzo, F.A.; et al. Functionalized gold nanoparticles as an active layer for mercury vapor detection at room temperature. ACS Appl. Nano Mater. 2021, 4, 2930–2940. [Google Scholar] [CrossRef]
  19. Tan, H.W.; An, J.; Chua, C.K.; Tran, T. Metallic nanoparticle inks for 3D printing of electronics. Adv. Electron. Mater. 2019, 5, 1800831. [Google Scholar] [CrossRef]
  20. Anik, M.I.; Mahmud, N.; Masud, A.A.; Hasan, M. Gold nanoparticles (GNPs) in biomedical and clinical applications: A review. Nano Sel. 2021, 3, 792–828. [Google Scholar] [CrossRef]
  21. Silver Nanoparticles Market Size, Share, Competitive Landscape and Trend Analysis Report, by Synthesis Method, Shape and Application: Global Opportunity Analysis and Industry Forecast 2021–2030. Available online: https://www.alliedmarketresearch.com/silver-nanoparticles-market-A06923 (accessed on 11 August 2024).
  22. Gold Nanoparticles Market—Global Industry Analysis, Size, Share, Growth, Trends, and Forecast, 2023–2031. Available online: https://www.transparencymarketresearch.com/gold-nanoparticles-market.html (accessed on 26 November 2024).
  23. Islam, M.A.; Jacob, M.V.; Antunes, E. A critical review on silver nanoparticles: From synthesis and applications to its mitigation through low-cost adsorption by biochar. J. Environ. Manag. 2021, 281, 111918. [Google Scholar] [CrossRef]
  24. Louie, S.M.; Gorham, J.M.; Tan, J.; Hackley, V.A. Ultraviolet photo-oxidation of polyvinylpyrrolidone (PVP) coatings on gold nanoparticles. Environ. Sci. Nano 2017, 4, 1866–1875. [Google Scholar] [CrossRef]
  25. Philippe, A.; Schaumann, G.E. Interactions of Dissolved Organic Matter with Natural and Engineered Inorganic Colloids: A Review. Environ. Sci. Technol. 2014, 48, 8946–8962. [Google Scholar] [CrossRef] [PubMed]
  26. Gibała, A.; Żeliszewska, P.; Gosiewski, T.; Krawczyk, A.; Duraczyńska, D.; Szaleniec, J.; Szaleniec, M.; Oćwieja, M. Antibacterial and antifungal properties of silver Nanoparticles—Effect of a Surface-Stabilizing agent. Biomolecules 2021, 11, 1481. [Google Scholar] [CrossRef] [PubMed]
  27. Stover, R.J.; Moaseri, E.; Gourisankar, S.P.; Iqbal, M.; Rahbar, N.K.; Changalvaie, B.; Truskett, T.M.; Johnston, K.P. Formation of Small Gold Nanoparticle Chains with High NIR Extinction through Bridging with Calcium Ions. Langmuir 2016, 32, 1127–1138. [Google Scholar] [CrossRef]
  28. Grys, D.-B.; De Nijs, B.; Salmon, A.R.; Huang, J.; Wang, W.; Chen, W.-H.; Scherman, O.A.; Baumberg, J.J. Citrate coordination and bridging of gold Nanoparticles: The role of Gold Adatoms in AuNP Aging. ACS Nano 2020, 14, 8689–8696. [Google Scholar] [CrossRef]
  29. Tiwari, N.R.; Rathore, A.; Prabhune, A.; Kulkarni, S.K. Gold Nanoparticles for Colorimetric detection of hydrolysis of antibiotics by penicillin G acylase. Adv. Biosci. Biotechnol. 2010, 1, 322–329. [Google Scholar] [CrossRef]
  30. Li, R.; Wang, Z.; Gu, X.; Chen, C.; Zhang, Y.; Hu, D. Study on the assembly structure variation of cetyltrimethylammonium bromide on the surface of gold nanoparticles. ACS Omega 2020, 5, 4943–4952. [Google Scholar] [CrossRef]
  31. Ahmad, I.; Jan, R.; Khan, H.U.; Hussain, A.; Khan, S.A. Imaging, deposition, and self-assembly of CTAB stabilized gold nanostructures. SN Appl. Sci. 2020, 2, 1099. [Google Scholar] [CrossRef]
  32. Ito, E.; Yip, K.W.; Katz, D.; Fonseca, S.B.; Hedley, D.W.; Chow, S.; Xu, G.W.; Wood, T.E.; Bastianutto, C.; Schimmer, A.D.; et al. Potential use of cetrimonium bromide as an Apoptosis-Promoting anticancer agent for head and neck cancer. Mol. Pharmacol. 2009, 76, 969–983. [Google Scholar] [CrossRef]
  33. Carvalho, G.C.; Marena, G.D.; Karnopp, J.C.F.; Jorge, J.; Sábio, R.M.; Martines, M.A.U.; Bauab, T.M.; Chorilli, M. Cetyltrimethylammonium bromide in the synthesis of mesoporous silica nanoparticles: General aspects and in vitro toxicity. Adv. Colloid Interface Sci. 2022, 307, 102746. [Google Scholar] [CrossRef]
  34. Teodorescu, M.; Bercea, M.; Morariu, S. Biomaterials of PVA and PVP in medical and pharmaceutical applications: Perspectives and challenges. Biotechnol. Adv. 2019, 37, 109–131. [Google Scholar] [CrossRef]
  35. Koczkur, K.M.; Mourdikoudis, S.; Polavarapu, L.; Skrabalak, S.E. Polyvinylpyrrolidone (PVP) in nanoparticle synthesis. Dalton Trans. 2015, 44, 17883–17905. [Google Scholar] [CrossRef] [PubMed]
  36. Wiley, B.; Sun, Y.; Mayers, B.; Xia, Y. Shape-Controlled Synthesis of Metal Nanostructures: The case of silver. ChemInform 2006, 11, 454–463. [Google Scholar] [CrossRef]
  37. Fabrega, J.; Luoma, S.N.; Tyler, C.R.; Galloway, T.S.; Lead, J.R. Silver nanoparticles: Behavior and effects in the aquatic environment. Environ. Int. 2011, 37, 517–531. [Google Scholar] [CrossRef]
  38. Bone, A.J.; Colman, B.P.; Gondikas, A.P.; Newton, K.M.; Harrold, K.H.; Cory, R.M.; Unrine, J.M.; Klaine, S.J.; Matson, C.W.; Di Giulio, R.T. Biotic and abiotic interactions in aquatic microcosms determine fate and toxicity of AG nanoparticles: Part 2—Toxicity and AG speciation. Environ. Sci. Technol. 2012, 46, 6925–6933. [Google Scholar] [CrossRef]
  39. Wagner, S.; Gondikas, A.; Neubauer, E.; Hofmann, T.; Von Der Kammer, F. Spot the difference: Engineered and natural nanoparticles in the Environment—Release, behavior, and fate. Angew. Chem. Int. Ed. 2014, 53, 12398–12419. [Google Scholar] [CrossRef] [PubMed]
  40. Kühr, S.; Schneider, S.; Meisterjahn, B.; Schlich, K.; Hund-Rinke, K.; Schlechtriem, C. Silver nanoparticles in sewage treatment plant effluents: Chronic effects and accumulation of silver in the freshwater amphipod Hyalella azteca. Environ. Sci. Eur. 2018, 30, 7. [Google Scholar] [CrossRef]
  41. Talarska, P.; Boruczkowski, M.; Żurawski, J. Current knowledge of Silver and Gold Nanoparticles in Laboratory Research—Application, toxicity, Cellular Uptake. Nanomaterials 2021, 11, 2454. [Google Scholar] [CrossRef]
  42. Haberl, N.; Hirn, S.; Wenk, A.; Diendorf, J.; Epple, M.; Johnston, B.D.; Krombach, F.; Kreyling, W.G.; Schleh, C. Cytotoxic and proinflammatory effects of PVP-coated silver nanoparticles after intratracheal instillation in rats. Beilstein J. Nanotechnol. 2013, 4, 933–940. [Google Scholar] [CrossRef]
  43. Niżnik, Ł.; Noga, M.; Kobylarz, D.; Frydrych, A.; Krośniak, A.; Kapka-Skrzypczak, L.; Jurowski, K. Gold Nanoparticles (AUNPs)—Toxicity, Safety and Green Synthesis: A Critical review. Int. J. Mol. Sci. 2024, 25, 4057. [Google Scholar] [CrossRef]
  44. Alkilany, A.M.; Nagaria, P.K.; Hexel, C.R.; Shaw, T.J.; Murphy, C.J.; Wyatt, M.D. Cellular uptake and cytotoxicity of gold nanorods: Molecular origin of cytotoxicity and surface effects. Small 2009, 5, 701–708. [Google Scholar] [CrossRef]
  45. Sani, A.; Cao, C.; Cui, D. Toxicity of gold nanoparticles (AuNPs): A review. Biochem. Biophys. Rep. 2021, 26, 100991. [Google Scholar] [CrossRef]
  46. Jiang, C.; Liu, S.; Zhang, T.; Liu, Q.; Alvarez, P.J.J.; Chen, W. Current methods and prospects for analysis and characterization of nanomaterials in the environment. Environ. Sci. Technol. 2022, 56, 7426–7447. [Google Scholar] [CrossRef] [PubMed]
  47. Montaño, M.D.; Goodman, A.J.; Ranville, J.F. Past progress in environmental nanoanalysis and a future trajectory for atomic mass-spectrometry methods. NanoImpact 2024, 35, 100518. [Google Scholar] [CrossRef] [PubMed]
  48. Hodoroaba, I.V.-d.; Unger, W.; Shard, A. Characterization of Nanoparticles: Measurement Processes for Nanoparticles; Elsevier: Amsterdam, The Netherlands, 2019. [Google Scholar]
  49. Mayer, K.M.; Hafner, J.H. Localized surface plasmon resonance sensors. Chem. Rev. 2011, 111, 3828–3857. [Google Scholar] [CrossRef] [PubMed]
  50. Yeshchenko, O.A.; Dmitruk, I.M.; Alexeenko, A.A.; Kotko, A.V.; Verdal, J.; Pinchuk, A.O. Size and temperature effects on the surface plasmon resonance in silver nanoparticles. Plasmonics 2012, 7, 685–694. [Google Scholar] [CrossRef]
  51. Link, S.; El-Sayed, M.A. Size and temperature dependence of the plasmon absorption of colloidal gold nanoparticles. J. Phys. Chem. B 1999, 103, 4212–4217. [Google Scholar] [CrossRef]
  52. Lawler, D.F.; Mikelonis, A.M.; Kim, I.; Lau, B.L.T.; Youn, S. Silver nanoparticle removal from drinking water: Flocculation/sedimentation or filtration? Water Sci. Technol. Water Supply 2013, 13, 1181–1187. [Google Scholar] [CrossRef]
  53. Hofman-Caris, C.H.M.; Bäuerlein, P.S.; Siegers, W.G.; Mintenig, S.M.; Messina, R.; Dekker, S.C.; Bertelkamp, C.; Cornelissen, E.R.; Van Wezel, A.P. Removal of nanoparticles (both inorganic nanoparticles and nanoplastics) in drinking water treatment—Coagulation/flocculation/sedimentation (CFS), and sand/granular activated carbon filtration (ACF). Environ. Sci. Water Res. Technol. 2022, 8, 1675–1686. [Google Scholar] [CrossRef]
  54. Chalew, T.E.A.; Ajmani, G.S.; Huang, H.; Schwab, K.J. Evaluating Nanoparticle Breakthrough during Drinking Water Treatment. Environ. Health Perspect. 2013, 121, 1161–1166. [Google Scholar] [CrossRef]
  55. Westerhoff, P.; Atkinson, A.; Fortner, J.; Wong, M.S.; Zimmerman, J.; Gardea-Torresdey, J.; Ranville, J.; Herckes, P. Low risk posed by engineered and incidental nanoparticles in drinking water. Nat. Nanotechnol. 2018, 13, 661–669. [Google Scholar] [CrossRef]
  56. Von Sonntag, C.; Von Gunten, U. Chemistry of Ozone in Water and Wastewater Treatment: From Basic Principles to Applications; IWA Publishing: London, UK, 2012. [Google Scholar] [CrossRef]
  57. Von Gunten, U. Ozonation of drinking water: Part I. Oxidation kinetics and product formation. Water Res. 2003, 37, 1443–1467. [Google Scholar] [CrossRef] [PubMed]
  58. Puckett, S.; Heuser, J.; Keith, J.; Spendel, W.; Pacey, G. Interaction of ozone with gold nanoparticles. Talanta 2005, 66, 1242–1246. [Google Scholar] [CrossRef] [PubMed]
  59. Xia, X.; Zeng, J.; Oetjen, L.K.; Li, Q.; Xia, Y. Quantitative Analysis of the Role Played by Poly(vinylpyrrolidone) in Seed-Mediated Growth of Ag Nanocrystals. J. Am. Chem. Soc. 2012, 134, 1793–1801. [Google Scholar] [CrossRef] [PubMed]
  60. Staehelin, J.; Hoigne, J. Decomposition of ozone in water: Rate of initiation by hydroxide ions and hydrogen peroxide. Environ. Sci. Technol. 1982, 16, 676–681. [Google Scholar] [CrossRef]
  61. Von Sonntag, C. Advanced oxidation processes: Mechanistic aspects. Water Sci. Technol. 2008, 58, 1015–1021. [Google Scholar] [CrossRef]
  62. Amiri, P.; Behin, J. Assessment of aqueous phase ozonation on aggregation of polyvinylpyrrolidone-capped silver nanoparticles. Environ. Sci. Pollut. Res. Int. 2021, 28, 34838–34851. [Google Scholar] [CrossRef]
  63. Gitis, V.; Rubinstein, I.; Livshits, M.; Ziskind, G. Deep-bed filtration model with multistage deposition kinetics. Chem. Eng. J. 2010, 163, 78–85. [Google Scholar] [CrossRef]
  64. Zamani, A.; Maini, B. Flow of dispersed particles through porous media—Deep bed filtration. J. Pet. Sci. Eng. 2009, 69, 71–88. [Google Scholar] [CrossRef]
  65. Molnar, I.L.; Johnson, W.P.; Gerhard, J.I.; Willson, C.S.; O’Carroll, D.M. Predicting colloid transport through saturated porous media: A critical review. Water Resour. Res. 2015, 51, 6804–6845. [Google Scholar] [CrossRef]
  66. Murphy, O.P.; Vashishtha, M.; Palanisamy, P.; Kumar, K.V. A review on the adsorption isotherms and design calculations for the optimization of adsorbent mass and contact time. ACS Omega 2023, 8, 17407–17430. [Google Scholar] [CrossRef]
  67. Grünert, W.; Kleist, W.; Muhler, M. Catalysis at Surfaces; Walter de Gruyter GmbH & Co KG: Berlin, Germany, 2023; pp. 95–102. [Google Scholar]
  68. Bratby, J. Coagulation and flocculation in water and wastewater treatment. Water Intell. Online 2016, 15, 9781780407500. [Google Scholar] [CrossRef]
  69. Wilhelm, S. Wasseraufbereitung: Chemie und Chemische Verfahrenstechnik; Springer: Berlin/Heidelberg, Germany, 2008. [Google Scholar]
  70. Masschelein, W.J. Unit Processes in Drinking Water Treatment; CRC Press: Boca Raton, FL, USA, 2020. [Google Scholar]
  71. Eckert, P.; Irmscher, R. Over 130 years of experience with Riverbank Filtration in Düsseldorf, Germany. J. Water Supply Res. Technol.-AQUA 2006, 55, 283–291. [Google Scholar] [CrossRef]
  72. Knabe, D.; Dwivedi, D.; Wang, H.; Griebler, C.; Engelhardt, I. Numerical investigations to identify environmental factors for field-scale reactive transport of pathogens at riverbank filtration sites. Adv. Water Resour. 2023, 173, 104389. [Google Scholar] [CrossRef]
  73. Tufenkji, N.; Ryan, J.N.; Elimelech, M. Peer Reviewed: The promise of bank filtration. Environ. Sci. Technol. 2002, 36, 422A–428A. [Google Scholar] [CrossRef]
  74. Konradt, N.; Kuhlen, J.G.; Rohns, H.-P.; Schmitt, B.; Fischer, U.; Binder, T.; Schumacher, V.; Wagner, C.; Kamphausen, S.; Müller, U.; et al. Removal of trace organic contaminants by parallel operation of reverse osmosis and granular activated carbon for drinking water treatment. Membranes 2021, 11, 33. [Google Scholar] [CrossRef]
  75. Konradt, N.; Dillmann, S.; Becker, J.; Schroden, D.; Rohns, H.-P.; Wagner, C.; Müller, U.; Konradt, D.; Janknecht, P.; Hobby, R.; et al. Removal of Chromium Species from Low-Contaminated Raw Water by Different Drinking Water Treatment Processes. Water 2023, 15, 516. [Google Scholar] [CrossRef]
  76. McFarland, A.D.; Haynes, C.L.; Mirkin, C.A.; Van Duyne, R.P.; Godwin, H.A. Color my nanoworld. J. Chem. Educ. 2004, 81, 544A. [Google Scholar] [CrossRef]
  77. Yonezawa, T.; Kunitake, T. Practical preparation of anionic mercapto ligand-stabilized gold nanoparticles and their immobilization. Colloids Surf. A Physicochem. Eng. Asp. 1999, 149, 193–199. [Google Scholar] [CrossRef]
  78. Brubaker, J. Synthesis and Characterization of Gold Nanosalts. Bachelor’s Thesis, Wittenberg University, Springfield, OH, USA, 2006. Available online: https://etd.ohiolink.edu/acprod/odb_etd/ws/send_file/send?accession=wuhonors1148584040&disposition=inline (accessed on 17 August 2024).
  79. Pan, Y.; Neuss, S.; Leifert, A.; Fischler, M.; Wen, F.; Simon, U.; Schmid, G.; Brandau, W.; Jahnen-Dechent, W. Size-Dependent cytotoxicity of gold nanoparticles. Small 2007, 3, 1941–1949. [Google Scholar] [CrossRef]
  80. Joshi, N. Gold Nanoparticles and Their Polymer Composites: Synthesis Characterization and Applications. Master’s Thesis, University of Florida, Gainesville, FL, USA, 2010. Available online: https://digitalcommons.usf.edu/etd/3516 (accessed on 17 May 2024).
  81. Elechiguerra, J.L.; Burt, J.L.; Morones, J.R.; Camacho-Bragado, A.; Gao, X.; Lara, H.H.; Yacaman, M.J. Interaction of silver nanoparticles with HIV-1. J. Nanobiotechnol. 2005, 3, 6. [Google Scholar] [CrossRef]
  82. Carotenuto, G.; Pepe, G.P.; Nicolais, L. Preparation and characterization of nano-sized Ag/PVP composites for optical applications. Eur. Phys. J. B Condens. Matter Phys./Eur. Phys. J. B Condens. Matter Complex Syst. 2000, 16, 11–17. [Google Scholar] [CrossRef]
  83. Uemura, T.; Ohba, M.; Kitagawa, S. Size and surface effects of Prussian blue nanoparticles protected by organic polymers. Inorg. Chem. 2004, 43, 7339–7345. [Google Scholar] [CrossRef] [PubMed]
  84. Krapesch, M.; Klösch, M.; Brinke, W.T.; Habersack, H. The Rhine Catchment: A review of Sediment-Related Knowledge, monitoring, and a Future Research perspective. Water 2024, 16, 1121. [Google Scholar] [CrossRef]
  85. Xu, Z.; Cai, J.G.; Pan, B.C. Mathematically modeling fixed-bed adsorption in aqueous systems. J. Zhejiang Univ.-Sci. A (Appl. Phys. Eng.) 2013, 14, 155–176. [Google Scholar] [CrossRef]
  86. Azizian, S. Kinetic models of sorption: A theoretical analysis. J. Colloid Interface Sci. 2004, 276, 47–52. [Google Scholar] [CrossRef] [PubMed]
  87. Batu, V. Applied Flow and Solute Transport Modeling in Aquifers: Fundamental Principles and Analytical and Numerical Methods; CRC Press: Boca Raton, FL, USA, 2005. [Google Scholar]
  88. Gao, H.; Tatomir, A.B.; Karadimitriou, N.K.; Steeb, H.; Sauter, M. Effect of pore space stagnant zones on interphase mass transfer in porous media, for Two-Phase flow conditions. Transp. Porous Media 2022, 146, 639–667. [Google Scholar] [CrossRef]
  89. Schönbucher, A. Thermische Verfahrenstechnik: Grundlagen und Berechnungsmethoden für Ausrüstungen und Prozesse; Springer: Berlin/Heidelberg, Germany, 2013. [Google Scholar]
  90. Dhumale, V.A.; Gangwar, R.K.; Datar, S.S.; Sharma, R.B. Reversible aggregation control of polyvinylpyrrolidone capped gold nanoparticles as a function of pH. Mater. Express 2012, 2, 311–318. [Google Scholar] [CrossRef]
  91. Thommes, M.; Kaneko, K.; Neimark, A.V.; Olivier, J.P.; Rodriguez-Reinoso, F.; Rouquerol, J.; Sing, K.S.W. Physisorption of gases, with special reference to the evaluation of surface area and pore size distribution (IUPAC Technical Report). Pure Appl. Chem. 2015, 87, 1051–1069. [Google Scholar] [CrossRef]
  92. Biesinger, M.C.; Payne, B.P.; Grosvenor, A.P.; Lau, L.W.M.; Gerson, A.R.; Smart, R.S.C. Resolving surface chemical states in XPS analysis of first row transition metals, oxides and hydroxides: Cr, Mn, Fe, Co and Ni. Appl. Surf. Sci. 2011, 257, 2717–2730. [Google Scholar] [CrossRef]
  93. Fjordbøge, A.S.; Uthuppu, B.; Jakobsen, M.H.; Fischer, S.V.; Broholm, M.M. Mobility of electrostatically and sterically stabilized gold nanoparticles (AuNPs) in saturated porous media. Environ. Sci. Pollut. Res. 2019, 26, 29460–29472. [Google Scholar] [CrossRef]
  94. Nason, J.A.; McDowell, S.A.; Callahan, T.W. Effects of natural organic matter type and concentration on the aggregation of citrate-stabilized gold nanoparticles. J. Environ. Monit. 2012, 14, 1885. [Google Scholar] [CrossRef] [PubMed]
  95. Tebbe, M.; Kuttner, C.; Männel, M.; Fery, A.; Chanana, M. Colloidally stable and Surfactant-Free Protein-Coated Gold Nanorods in Biological Media. ACS Appl. Mater. Interfaces 2015, 7, 5984–5991. [Google Scholar] [CrossRef] [PubMed]
  96. Tejamaya, M.; Römer, I.; Merrifield, R.C.; Lead, J.R. Stability of citrate, PVP, and PEG coated silver nanoparticles in ecotoxicology media. Environ. Sci. Technol. 2012, 46, 7011–7017. [Google Scholar] [CrossRef]
  97. Hitchman, A.; Smith, G.H.S.; Ju-Nam, Y.; Sterling, M.; Lead, J.R. The effect of environmentally relevant conditions on PVP stabilised gold nanoparticles. Chemosphere 2013, 90, 410–416. [Google Scholar] [CrossRef]
  98. Rónavári, A.; Bélteky, P.; Boka, E.; Zakupszky, D.; Igaz, N.; Szerencsés, B.; Pfeiffer, I.; Kónya, Z.; Kiricsi, M. Polyvinyl-Pyrrolidone-Coated Silver Nanoparticles—The Colloidal, Chemical, and Biological Consequences of Steric Stabilization under Biorelevant Conditions. Int. J. Mol. Sci. 2021, 22, 8673. [Google Scholar] [CrossRef]
  99. Thio, B.J.R.; Montes, M.O.; Mahmoud, M.A.; Lee, D.-W.; Zhou, D.; Keller, A.A. Mobility of Capped Silver Nanoparticles under Environmentally Relevant Conditions. Environ. Sci. Technol. 2011, 46, 6985–6991. [Google Scholar] [CrossRef] [PubMed]
  100. Wang, H.; Knabe, D.; Engelhardt, I.; Droste, B.; Rohns, H.-P.; Stumpp, C.; Ho, J.; Griebler, C. Dynamics of pathogens and fecal indicators during riverbank filtration in times of high and low river levels. Water Res. 2021, 209, 117961. [Google Scholar] [CrossRef]
  101. Li, Z.; Hassan, A.A.; Sahle-Demessie, E.; Sorial, G.A. Transport of nanoparticles with dispersant through biofilm coated drinking water sand filters. Water Res. 2013, 47, 6457–6466. [Google Scholar] [CrossRef]
  102. Hamann, L.; Werner, J.; Haase, F.J.; Thiel, M.; Scherwaß, A.; Laforsch, C.; Löder, M.G.J.; Blanke, A.; Arndt, H. Retention of microplastics by biofilms and their ingestion by protists in rivers. Environ. Microbiol. Rep. 2024, 16, e70016. [Google Scholar] [CrossRef]
  103. Flemming, H.-C.; Wingender, J. The biofilm matrix. Nat. Rev. Microbiol. 2010, 8, 623–633. [Google Scholar] [CrossRef]
  104. Wang, K.; Ma, Y.; Sun, B.; Yang, Y.; Zhang, Y.; Zhu, L. Transport of silver nanoparticles coated with polyvinylpyrrolidone of various molecular sizes in porous media: Interplay of polymeric coatings and chemically heterogeneous surfaces. J. Hazard. Mater. 2022, 429, 128247. [Google Scholar] [CrossRef] [PubMed]
  105. McGillicuddy, E.; Morrison, L.; Cormican, M.; Dockery, P.; Morris, D. Activated charcoal as a capture material for silver nanoparticles in environmental water samples. Sci. Total Environ. 2018, 645, 356–362. [Google Scholar] [CrossRef] [PubMed]
  106. Brambilla, A.; Bolzacchini, E.; Orlandi, M.; Polesello, S.; Rindone, B. Reactivity of two models of non-ionic surfactants with ozone. Water Res. 1997, 31, 1839–1846. [Google Scholar] [CrossRef]
  107. Morozov, P.A.; Abkhalimov, E.V.; Chalykh, A.E.; Pisarev, S.A.; Ershov, B.G. Interaction of silver nanoparticles with ozone in aqueous solution. Colloid J. 2011, 73, 248–252. [Google Scholar] [CrossRef]
  108. List of Permitted Treatment Substances and Disinfection Processes According to Section 20 of the Drinking Water Ordinance. January 2023. Available online: https://www.umweltbundesamt.de/themen/wasser/trinkwasser/rechtliche-grundlagen-empfehlungen-regelwerk/aufbereitungsstoffe-desinfektionsverfahren-ss-20 (accessed on 26 August 2024).
  109. World Health Organization. Water Safety Plan Manual: Step-by-Step Risk Management for Drinking-Water Suppliers; World Health Organization: Geneva, Switzerland, 2023; Available online: https://www.who.int/publications/i/item/9789240067691 (accessed on 12 October 2024).
  110. Serrano, B.A.; Gheorghe, L.C.; Exner, T.; Resch, S.; Wolf, C.; Himly, M.; Falk, A.; Bossa, N.; Vazquez, S.; Papadiamantis, A.; et al. The role of FAIR nanosafety data and nanoinformatics in achieving the UN Sustainable Development Goals: The NanoCommons experience. RSC Sustain. 2024, 2, 1378–1399. [Google Scholar] [CrossRef]
  111. EUON—EU Observatory for Nanomaterials. Available online: https://euon.echa.europa.eu/search-for-nanomaterials (accessed on 2 October 2024).
  112. Nielsen, M.B.; Skjolding, L.; Baun, A.; Hansen, S.F. European nanomaterial legislation in the past 20 years—Closing the final gaps. NanoImpact 2023, 32, 100487. [Google Scholar] [CrossRef]
  113. Chávez-Hernández, J.A.; Velarde-Salcedo, A.J.; Navarro-Tovar, G.; Gonzalez, C. Safe nanomaterials: From their use, application and disposal to regulations. Nanoscale Adv. 2024, 6, 1583–1610. [Google Scholar] [CrossRef]
Figure 1. Classification of matter in water (green) and common separations methods (blue).
Applnano 05 00018 g001
Figure 2. (a) Trisodium citrate; (b) cetyltrimethylammonium bromide (CTAB); (c) polyvinylpyrrolidone (PVP).
Applnano 05 00018 g002
Figure 3. Schematic of the pilot plant with aeration, ozonation and anthracite sand filter with sampling points. A detailed description of the sampling points is provided in the Supplementary Data, Section S4.
Applnano 05 00018 g003
Figure 4. Breakthrough curve and determination of the 50% breakthrough time.
Applnano 05 00018 g004
Figure 5. UV-VIS spectra of CA/AuNPs (a) diluted in DI (green), DW (red) and RH (black); (b) CA/AuNPs dispersions diluted with DI, DW and RH (from left to right) with c(Au) = 17.9 mg L−1.
Applnano 05 00018 g005
Figure 6. UV-VIS absorption spectra of the diluted CTAB/AuNPs in DI (black), DW (red) and RH (green) with c(Au) = 10 mg L−1.
Applnano 05 00018 g006
Figure 7. UV-Vis absorption spectra of the diluted PVP/AuNPs in DI (black), DW (red) and RH (green) with c(Au) = 5.88 mg L−1.
Applnano 05 00018 g007
Figure 8. UV-Vis absorption spectra of the diluted PVP/AgNPs in DI (black), DW (red) and RH (green) with c(Ag) = 20.2 mg L−1.
Applnano 05 00018 g008
Figure 9. Adsorption isotherm data for PVP/AgNPs as Ag on sand (dots) with (a) Langmuir and (b) Freundlich regression lines.
Applnano 05 00018 g009
Figure 10. Adsorption isotherm data for PVP/AgNPs as Ag on silica gel (dots) with (a) Langmuir and (b) Freundlich regression lines.
Applnano 05 00018 g010
Figure 11. Breakthrough curves of stable ENPs in DW (flow rate 0.8 mL/min) for a 10 g quartz sand bed.
Applnano 05 00018 g011
Figure 12. Breakthrough curves of DW-stable ENPs in RH (flow rate 0.8 mL/min) for a 10 g non-treated Rhine sand bed.
Applnano 05 00018 g012
Figure 13. Breakthrough curves of stable NPs in RH (flow rate 2 mL/min) for a 0.5 g silica gel bed.
Applnano 05 00018 g013
Figure 14. Breakthrough curves of stable NPs in DW (flow rate 2.0 mL/min) for a 0.5 g activated carbon bed.
Applnano 05 00018 g014
Figure 15. Breakthrough curves of PVP-coated NPs in RH (flow rate 2 mL/min) for a fresh anthracite bed (3.15 g).
Applnano 05 00018 g015
Figure 16. Breakthrough curves of PVP-coated NPs in RH (flow rate 2 mL/min) for a used anthracite (3.40 g) from the pilot plant.
Applnano 05 00018 g016
Figure 17. Flocculation of ENPs. Error bars correspond to the relative combined uncertainty of ~7% (Supplementary Data, Table S18).
Applnano 05 00018 g017
Figure 18. Retention of PVP/AuNPs on a pilot scale with ozonation and anthracite sand filtration. The location of the sampling points is shown in Figure 3. The data points of the same sampling points are connected to improve clarity.
Applnano 05 00018 g018
Figure 19. Retention of PVP/AgNPs at the pilot plant with ozonation and anthracite sand filtration. The data points of the same sampling points are connected to improve clarity.
Applnano 05 00018 g019
Table 1. Synthesized engineered nanoparticles 1.
Nanoparticle AbbreviationCore Size (nm)Hydrodynamic Size Distribution, Z-Average (nm)Literature
Citrate-coated gold NPsCA/AuNPs12-[76]
Mercaptopropionic acid-coated gold NPsMPA/AuNPs2.2-[77]
Mercaptoethane sulfonate-coated gold NPsMES/AuNPs20-[78]
Triphenylphosphine monosulfonate-coated gold NPsTPPMS/AuNPs12-[79]
Cetyltrimethylammonium bromide-coated gold NPsCTAB/AuNPs12-[29]
PVP-55 kDa-coated gold NPsPVP/AuNPs10–25monomodal, 59 nm[80]
PVP-30 kDa-coated silver NPs in EG/waterPVP/AgNPs1–25bimodal, 2 and 40 nm[81]
PVP-30 kDa-coated silver NPs in DIPVP/AgNPs-DI10–50monomodal, 93 nm[82]
PVP-40 kDa-coated Prussian Blue NPsPVP/PBNPs 24monomodal, broad, 136 nm[83]
1 For details, see Supplementary Data, Section S2.
Table 2. Specifications for the main pilot plant components.
ComponentSpecification
Aeration/storage tankCylindrical tank, height: 120 cm, diameter: 160 cm; filling height: 70 cm, with built-in aeration (air/water ratio = 1:3).
Continuous flow ozonation reactor (CFR)Cylindrical tank, coated with Rilsan® polyamide 11, height: 250 cm, diameter: 61 cm; filling height: 360 cm. The most likely residence time was determined based on tracer experiments and with oxygen dosages between 6.5 min (CO1) and 20.3 min (CO5) at a flow of 2 m3/h (see Supplementary Data, Section S5.1).
Anthracite sand filterCylindrical tank, coated with Rilsan® polyamide 11, height: 231 cm, diameter: 61 cm. Support layer: 20 cm gravel, grain size 30 mm; 80 cm quartz sand, grain size 0.71–1.25 mm; and 70 cm anthracite, grain size 1.4–2.5 mm (Aquazit® N, Type II) from Euro-quarz, Dorsten, Germany. The filter efficiency of the flushed anthracite sand filter was determined in the range of 0.9 to 10 µm with a maximum of 88% at 2 µm (see Supplementary Data, Section S5.2.) and the measured retention time for NaCl is documented in Supplementary Data, Section S5.3.
Table 3. Volumes and concentrations for CA/AuNP stability experiments.
SaltcStock (g/L)Vadded (µL)cfinal (mg/L)
Na2SO41012550
NaCl207560
CaCl2 * 2 H2O1020080
Mg(NO3)2 * 6 H2O57.515
Table 4. Volumes and concentrations for calcium ions in CA/AuNP stability experiments.
ExperimentVadded (µL)c(Ca2+)final (mg/L)
100
2100.6
3501.4
41002.7
51504.1
62005.5
Table 5. Flocculation procedure.
Time (min)Action
0UV-Vis measurement of NP dispersion, stirring at 200 rpm, addition of flocculant
2Reduce stirrer speed to 50 rpm
12Stopp stirring, wait for precipitation
17 and 32Sample supernatant, filter through 0.2 µm syringe filter and measure UV-Vis
Table 6. Influence of calcium ions on the spectrum of CA/AuNPs in DI.
c (Ca2+)final (mg/L)λmax (nm)Absorbanceλmax (nm)Absorbanceλmax (nm)Absorbanceλmax (nm)Absorbance
45 s 30 min 1.5 h 20 h
05170.215170.205180.215170.20
0.65180.235170.215170.255190.24
1.45180.235170.215180.255200.24
2.75180.245170.225180.255210.25
4.15180.245190.21524/5900.23/0.20530/6380.23/0.21
5.55190.24522/6100.20/0.18525/6300.20/0.19530/6800.18/0.21
Table 7. Influence of ozonation/AOP on PVP/AuNP absorbance.
Ozonation Absorbance
Time (min)With Ozone With AOP
00.0990.101
1 0.098
20.1020.100
3 0.100
40.101
5 0.101
60.098
100.1020.098
200.101
300.100
400.101
600.100
900.101
1200.101
Mean0.1000.099
Standard deviation0.0010.001
Table 8. Influence of ozonation/AOP on PVP/AgNP absorbance.
OzonationAbsorbance
Time (min)With Ozone With AOP
00.0450.044
10.0620.051
20.0370.034
30.0320.028
50.0350.049
80.0330.053
130.0330.054
210.0340.038
340.0380.054
Mean0.0390.045
Standard deviation0.0100.010
Table 9. Results of the small-scale ozonation/AOP of PVP/AgNPs.
TreatmentPeak Maximum (nm)Peak Shift (nm)Absorbance Reduction of Absorbance (%)
AgNPs in water with EG
Without treatment 430 0.822
Ozonation 420−100.67318
AOP424−60.68716
AgNPs in water
Without treatment 424 0.424
Ozonation 407−170.19454
AOP416−80.36313
Table 10. Environment-stable ENPs and techniques for reduction in DWTPs.
Removal or Retention Rates of ENPs (%) 1
ProcessCTAB/AuNPsPVP/AuNPsPVP/AgNPs in Water
Ozonation-no removal54%
AOP-no removal13%
Quartz sand filtrationno retentionno retentionweak retention
Silica gel filtration-weak retentionweak retention
Rhine sand filtrationstrong retentionno retentionno retention
Anthracite filtration-weak retentionweak retention
Anthracite with FeO(OH), MnO2 filtration-weak retentionstrong retention
Activated carbon filtrationstrong retentionno retentionstrong retention
Flocculation with Fe(III)-20–43% (5 mg/L Fe)59–63% (5 mg/L Fe)
Flocculation with Al(III)-51–61% (50 mg/L Al2O3)83–96% (5 mg/L Al2O3)
1 Not colored: unsuitable, yellow-colored: moderately suitable, green-colored: well-suited.
Disclaimer/Publisher’s Note: The statements, opinions and data contained in all publications are solely those of the individual author(s) and contributor(s) and not of MDPI and/or the editor(s). MDPI and/or the editor(s) disclaim responsibility for any injury to people or property resulting from any ideas, methods, instructions or products referred to in the content.

