Article

Rapid Degradation of Organic Dyes by Nanostructured Gd2O3 Microspheres

Department of Physics, CUCEI, Universidad de Guadalajara, M. García Barragán 1421, Guadalajara 44100, Jalisco, Mexico
Appl. Nano 2025, 6(1), 1; https://doi.org/10.3390/applnano6010001
Submission received: 10 December 2024 / Revised: 7 January 2025 / Accepted: 8 January 2025 / Published: 13 January 2025

Abstract

:
Pollution of freshwater by synthetic organic dyes is a major concern due to their high toxicity and mutagenicity. In this study, the degradation of Congo red (CR) and malachite green (MG) dyes was investigated using nanostructured Gd2O3. It was prepared using the coprecipitation method, using gadolinium nitrate and concentrated formic acid, with subsequent calcination at 600 °C. Its morphology corresponds to hollow porous microspheres with a size between 0.5 and 7.5 μm. The optical bandgap energy was determined by using the Tauc method, giving 4.8 eV. The degradation of the dyes was evaluated by UV-vis spectroscopy, which revealed that dissociative adsorption (in the dark) played a key role. It is explained by the cleavage and fragmentation of the organic molecules by hydroxyl radicals (OH), superoxide radicals ( O 2 ) and other reactive oxygen species (ROS) produced on the surface of Gd2O3. For CR, the degradation percentage was ~56%, through dissociative adsorption, while UV light photocatalysis increased it to ~65%. For MG, these values were ~78% and ~91%, respectively. The difference in degradation percentages is explained in terms of the isoelectric point of solid (IEPS) of Gd2O3 and the electrical charge of the dyes. FTIR and XPS spectra provided evidence of the role of ROS in dye degradation.

1. Introduction

Rare-earth (RE) oxides are an important group of materials with remarkable physical and physicochemical properties. Although they are classified as ultra-wide bandgap semiconductor materials, except for CeO2, their electronic and dielectric characteristics have long attracted the attention of many research groups [1]. These properties are associated with the filling of the 4f electron shell, where for gadolinium atoms, it is half-filled with 7 electrons. As an oxide (Gd2O3), gadolinium ions adopt oxidation state +3, which is common to most RE oxides. This oxide has been used as a contrast agent in magnetic resonance imaging (MRI), photoluminescence, dielectrics, gas sensors, heterogeneous catalysis, and solid-state lasers, among others [2,3,4,5,6,7]. Its bandgap energy (Eg) is in the range of 4.85 to 5.4 eV, with a relative permittivity of approximately 13.6. For its preparation, different methods have been used, such as deposition by magnetron sputtering, coprecipitation, hydrothermal, sol–gel, and thermolysis of gadolinium precursors, to name a few [8,9,10,11,12,13,14,15]. These techniques yield unique morphologies, including thin films, nanotubes, microrods, nanospheres, etc. Table 1 shows their main characteristics, such as the regents used, the morphology and size of particles, and the temperature of formation. Recently, Ortega-Berlanga et al. have published a detailed review on the synthesis, properties, and applications in the health sciences of Gd2O3, rare earth-doped Gd2O3, and gadolinium oxysulfides [16].
On the other hand, as the availability of freshwater has decreased in many regions of the world, with its increasing pollution, wastewater treatment has received much attention in recent years. With this objective, dissociative adsorption and photocatalysis using cost-effective materials have been widely investigated. Their efficiency in the degradation of polluting substances depends on their capacity to generate hydroxyl groups (OH), superoxide radicals ( O 2 ), and other reactive oxygen species (ROS) [17]. In photocatalysis, ROS are produced by exposing the material to suitable electromagnetic radiation, usually in the ultraviolet region. The energy of the photons (hν) is transferred to the material, increasing the number of mobile electrical charges. For an n-type semiconductor, such as Gd2O3, electrons in the valence band (VB) move to the conduction band (CB) promoting ROS generation. In the case of dissociative adsorption, which is one of the most fundamental chemical reactions, ROS can be produced even in the dark. In both cases, ROS breaks the strong covalent bonds of the organic molecules of the dye, causing its degradation and eventual mineralization. Even though TiO2 and other transition metal oxides have been widely studied for water treatment, considerably less information is available on rare earth oxides [18]. For Gd2O3, the photocatalytic degradation of methyl orange (MO), in the presence of H2O2, was reported years ago [19]. However, since H2O2 itself promotes the formation of OH radicals, the role of the oxide was not adequately estimated. Gd2O3 has also been investigated to decompose other dyes such as acid orange 7 and acid yellow 23, using UV light and H2O2 [20]. Furthermore, the photocatalytic degradation of chloramphenicol (CAP), which is a neurotoxic substance, by Gd2O3 nanorods has also been published [21]. According to the authors, the radiation energy used in their experiments (>4.2 eV) exceeds the bandgap energy of the oxide, allowing its degradation. In a recent article, the photocatalytic degradation of malachite green (MG) by Gd2O3 was published; however, the characteristics of the light source are not available [22].
The objective of this work was to evaluate the effects of dissociative adsorption and photocatalysis in the degradation of organic dyes. For this purpose, the oxide was prepared by using a simple coprecipitation method, which according to previous work, can be abundantly produced as a non-agglomerated and nanostructured material [5]. Two typical synthetic dyes (Congo red and malachite green) were used as model molecules and experiments were performed under UV light and darkness. The degradation produced over time was quantified by UV-vis spectroscopy.

2. Materials and Methods

Gd2O3 was synthesized by dissolving 0.7 g of Gd(NO3)3·6H2O (99.9%, Aldrich, St. Louis, MO, USA) in 10 mL of concentrated formic acid, which contained 0.05 g of pectin (Aldrich) dissolved in it. After vigorous stirring at room temperature on a stir plate for approximately 5 min, a brown gas (NO2) evolved, with simultaneous formation of a white precipitate. The latter was dried by applying microwave irradiation intermittently for 20 min, using a power of 200 W. Then, the dried powder was annealed at 600 °C for 6 h, using a programmable temperature furnace (Thermolyne 48000). The crystal structure of the powder was analyzed by X-ray diffraction (XRD), using an Empyrean (PANalytical, Malvern, UK) diffractometer. In these experiments, the step size was 0.03° and the scanning speed was 5°/min. Prior to this characterization, the Gd2O3 powder was finely ground in an agate mortar and pestle, and the material was dispersed in glass slides. The surface morphology was observed by field emission scanning electron microscopy (FESEM), through a Mira (TESCAN, Brno, Czech Republic) microscope. The nanostructure of the oxide was inspected by transmission electron microscopy (TEM), in bright field, using a JEM-1010 (JEOL, Tokyo, Japan) microscope. The chemical composition was analyzed by X-ray photoelectron spectroscopy (XPS), using a Phoibos 150 (SPECS, Berlin, Germany) spectrometer. It works with a monochromatic X-ray source of energy 1486 eV, corresponding to the Al Kα transition. Fourier-transform infrared spectroscopy (FTIR), with a Nicolet iS50 spectrophotometer, was used to identify the functional groups in the samples. The optical Eg of Gd2O3 was determined by UV-Vis spectroscopy, using a double beam Helios Zeta spectrometer (Thermo Scientific, Waltham, MA, USA).
The degradation of Congo red (CR) and MG was evaluated using diluted solutions prepared by dissolving 5 mg of the dye in 1 L of deionized water. Then, 10 mg of the as-prepared Gd2O3 powder was sonicated in 40 mL of each solution. Photocatalytic degradation experiments were carried out under stirring while applying UV radiation with a light-emitting diode (LED) of a nominal wavelength (λ) of 365 nm. It is equivalent to a photon energy of 3.39 eV. The optical irradiance (Ee) of the LED was measured with a Thorlabs PM 100D optical power meter and set to 100 mW/cm2 using a DC power supply. The effect of dissociative adsorption on dye degradation was evaluated by experiments performed under stirring in the absence of light. In both processes, aliquots were collected at specific time periods, and without centrifugation, they were analyzed using UV-Vis spectroscopy. The degradation percentage was calculated by the following equation:
%   D e g r a d a t i o n = C 0 C C 0 × 100 % = A 0 A A 0 × 100 %
where C0 was the initial concentration of each solution and C corresponds to the concentration of the aliquots. A0 and A have the same meaning for absorbance.

3. Results

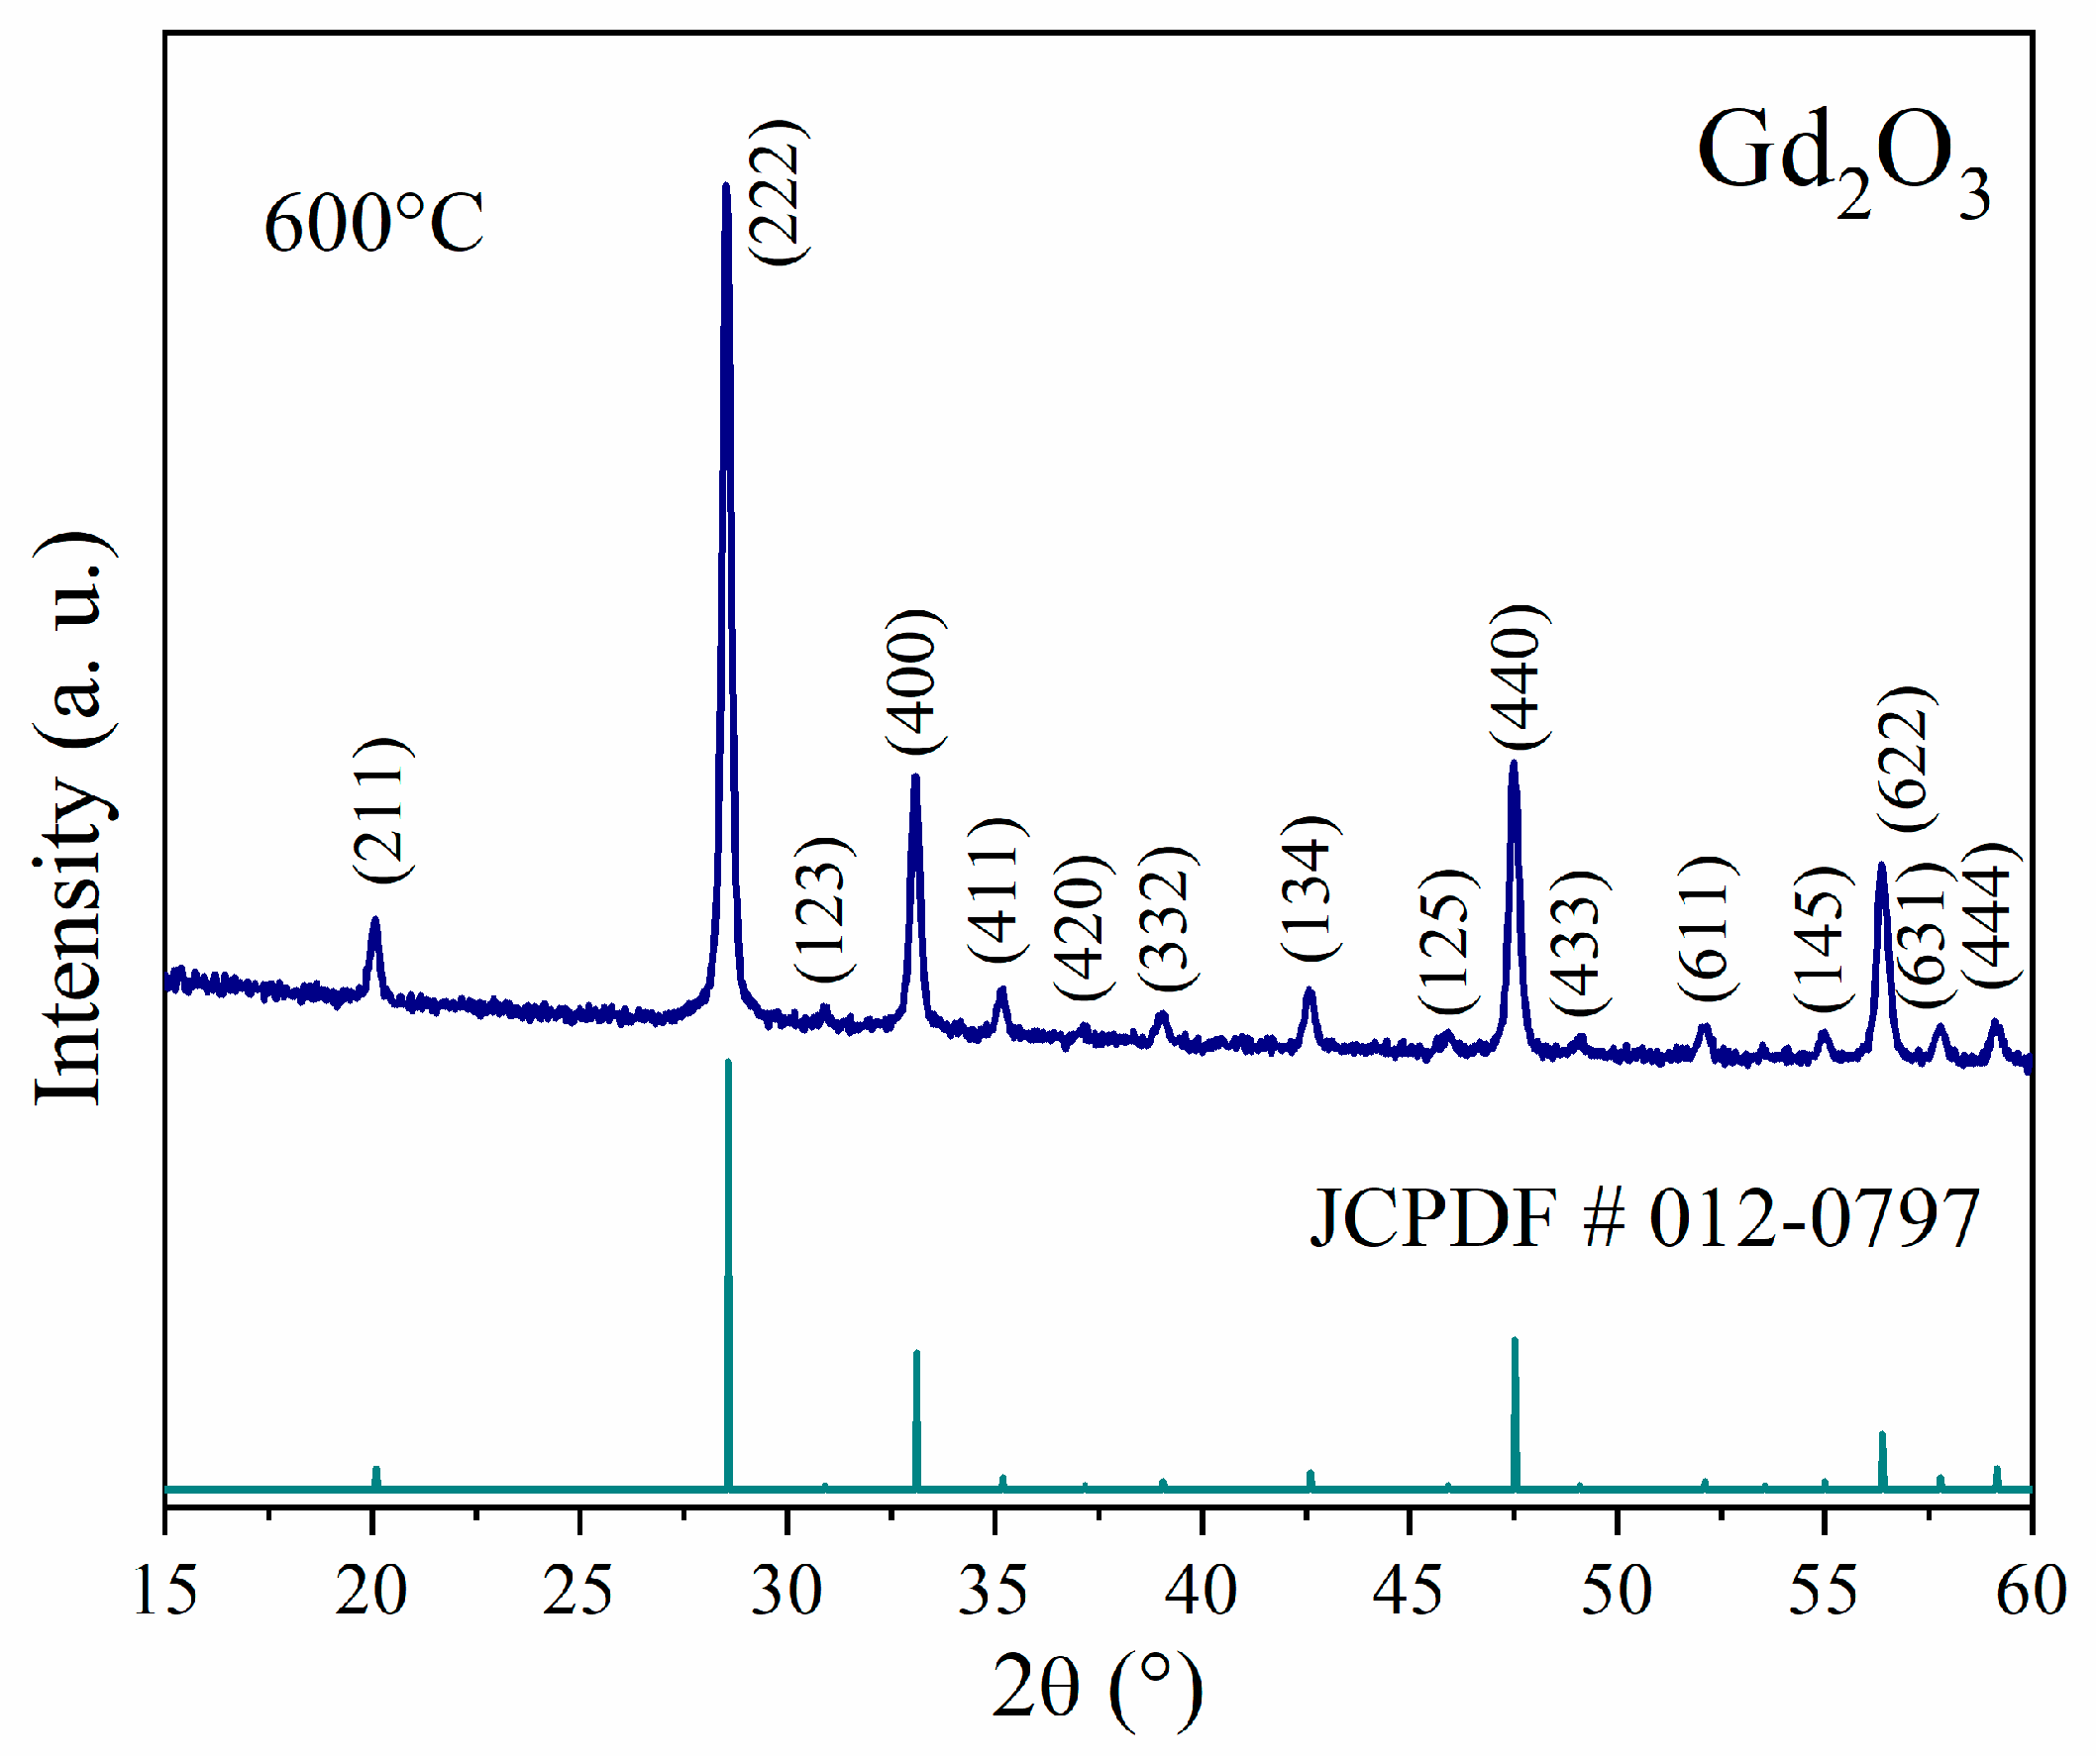
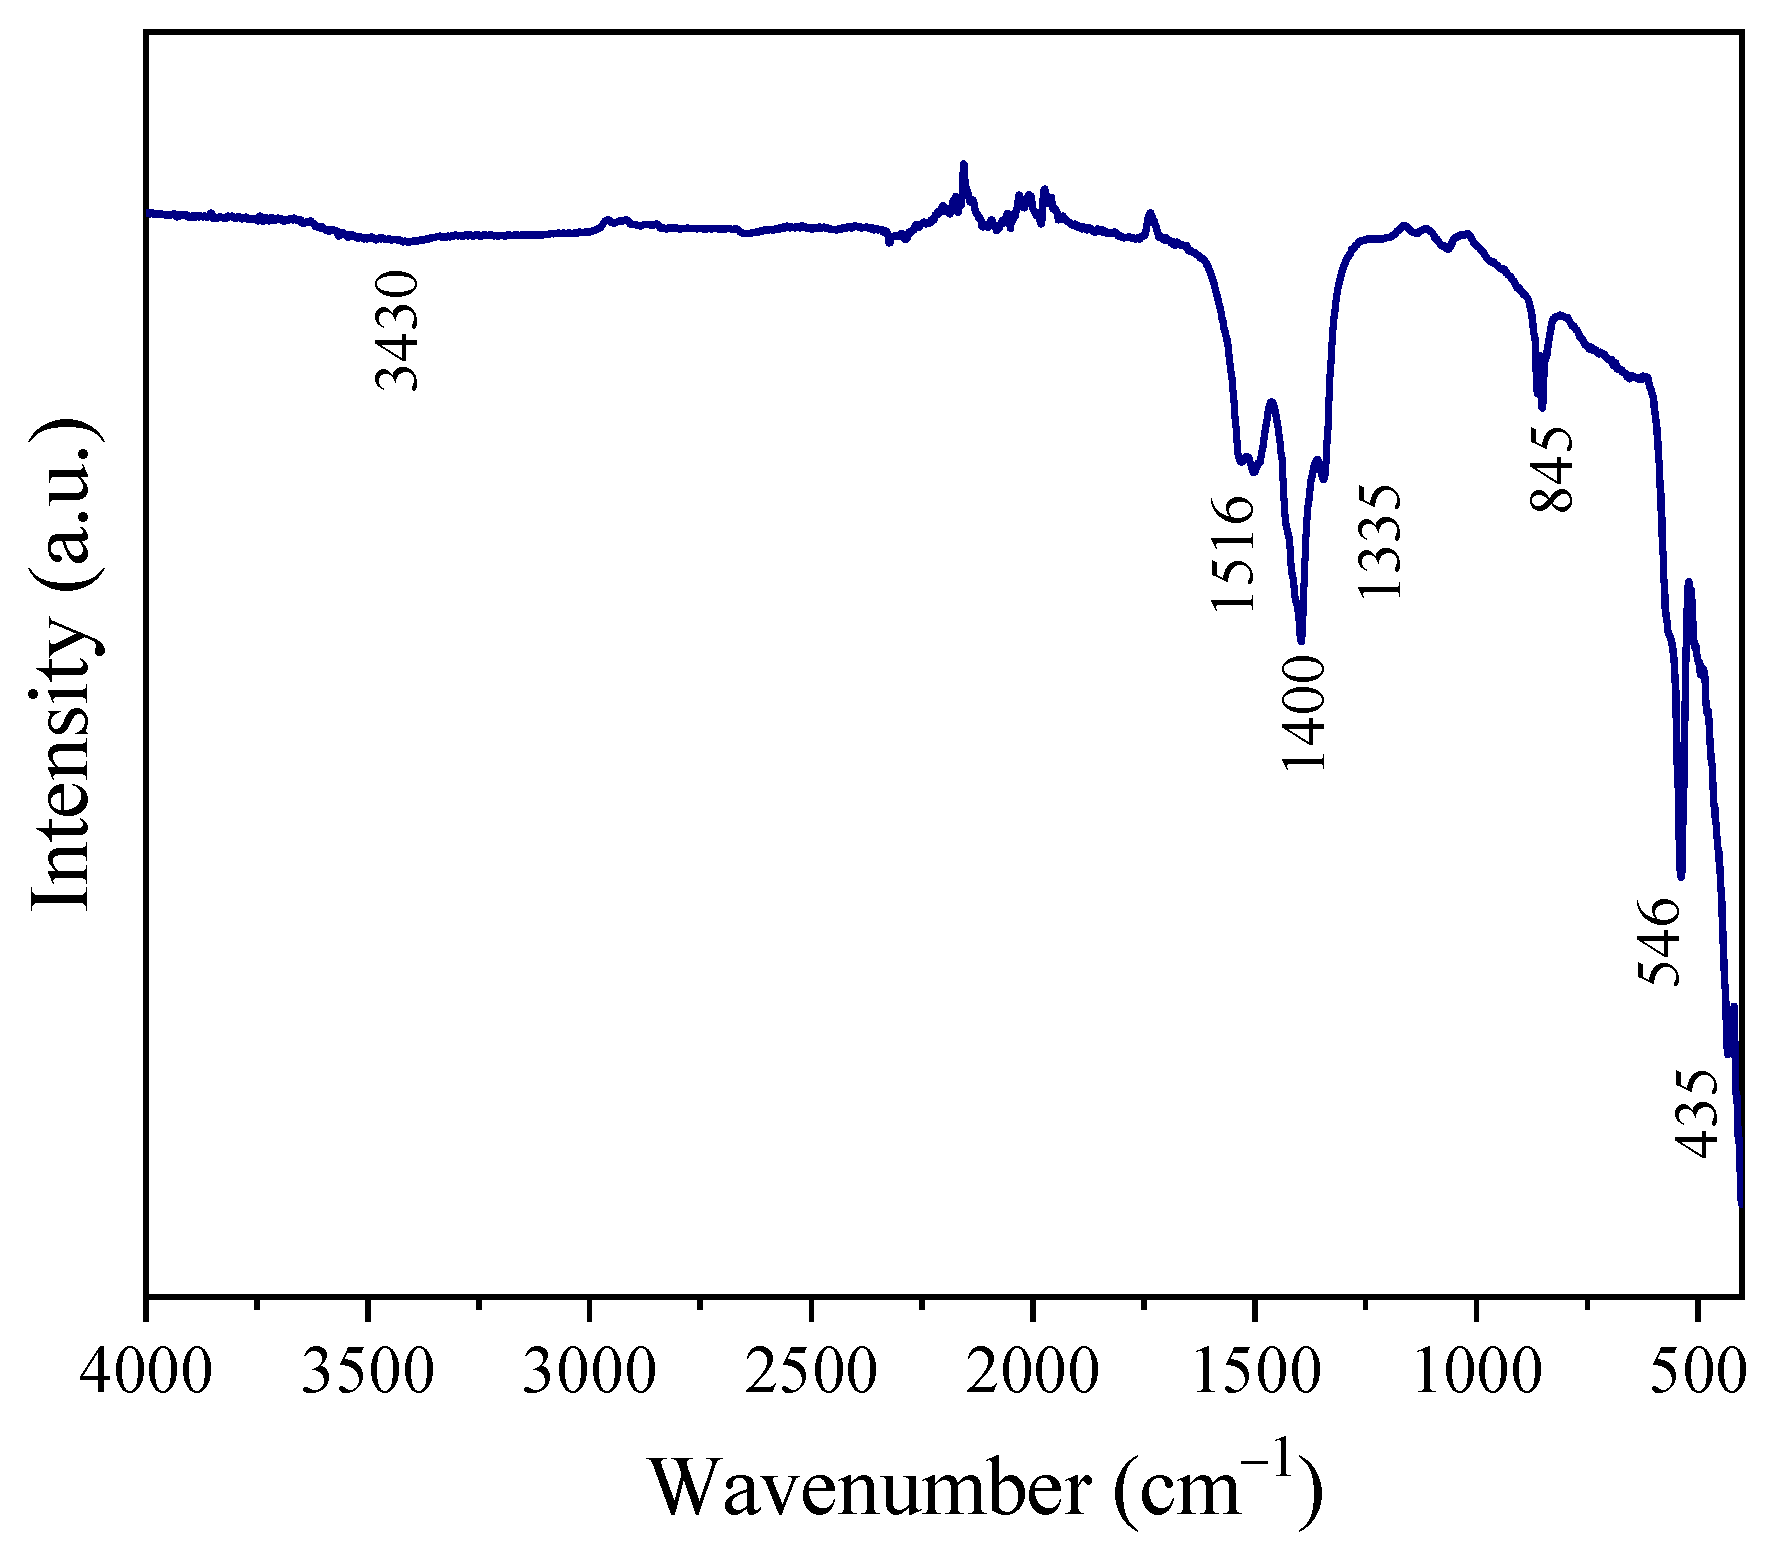
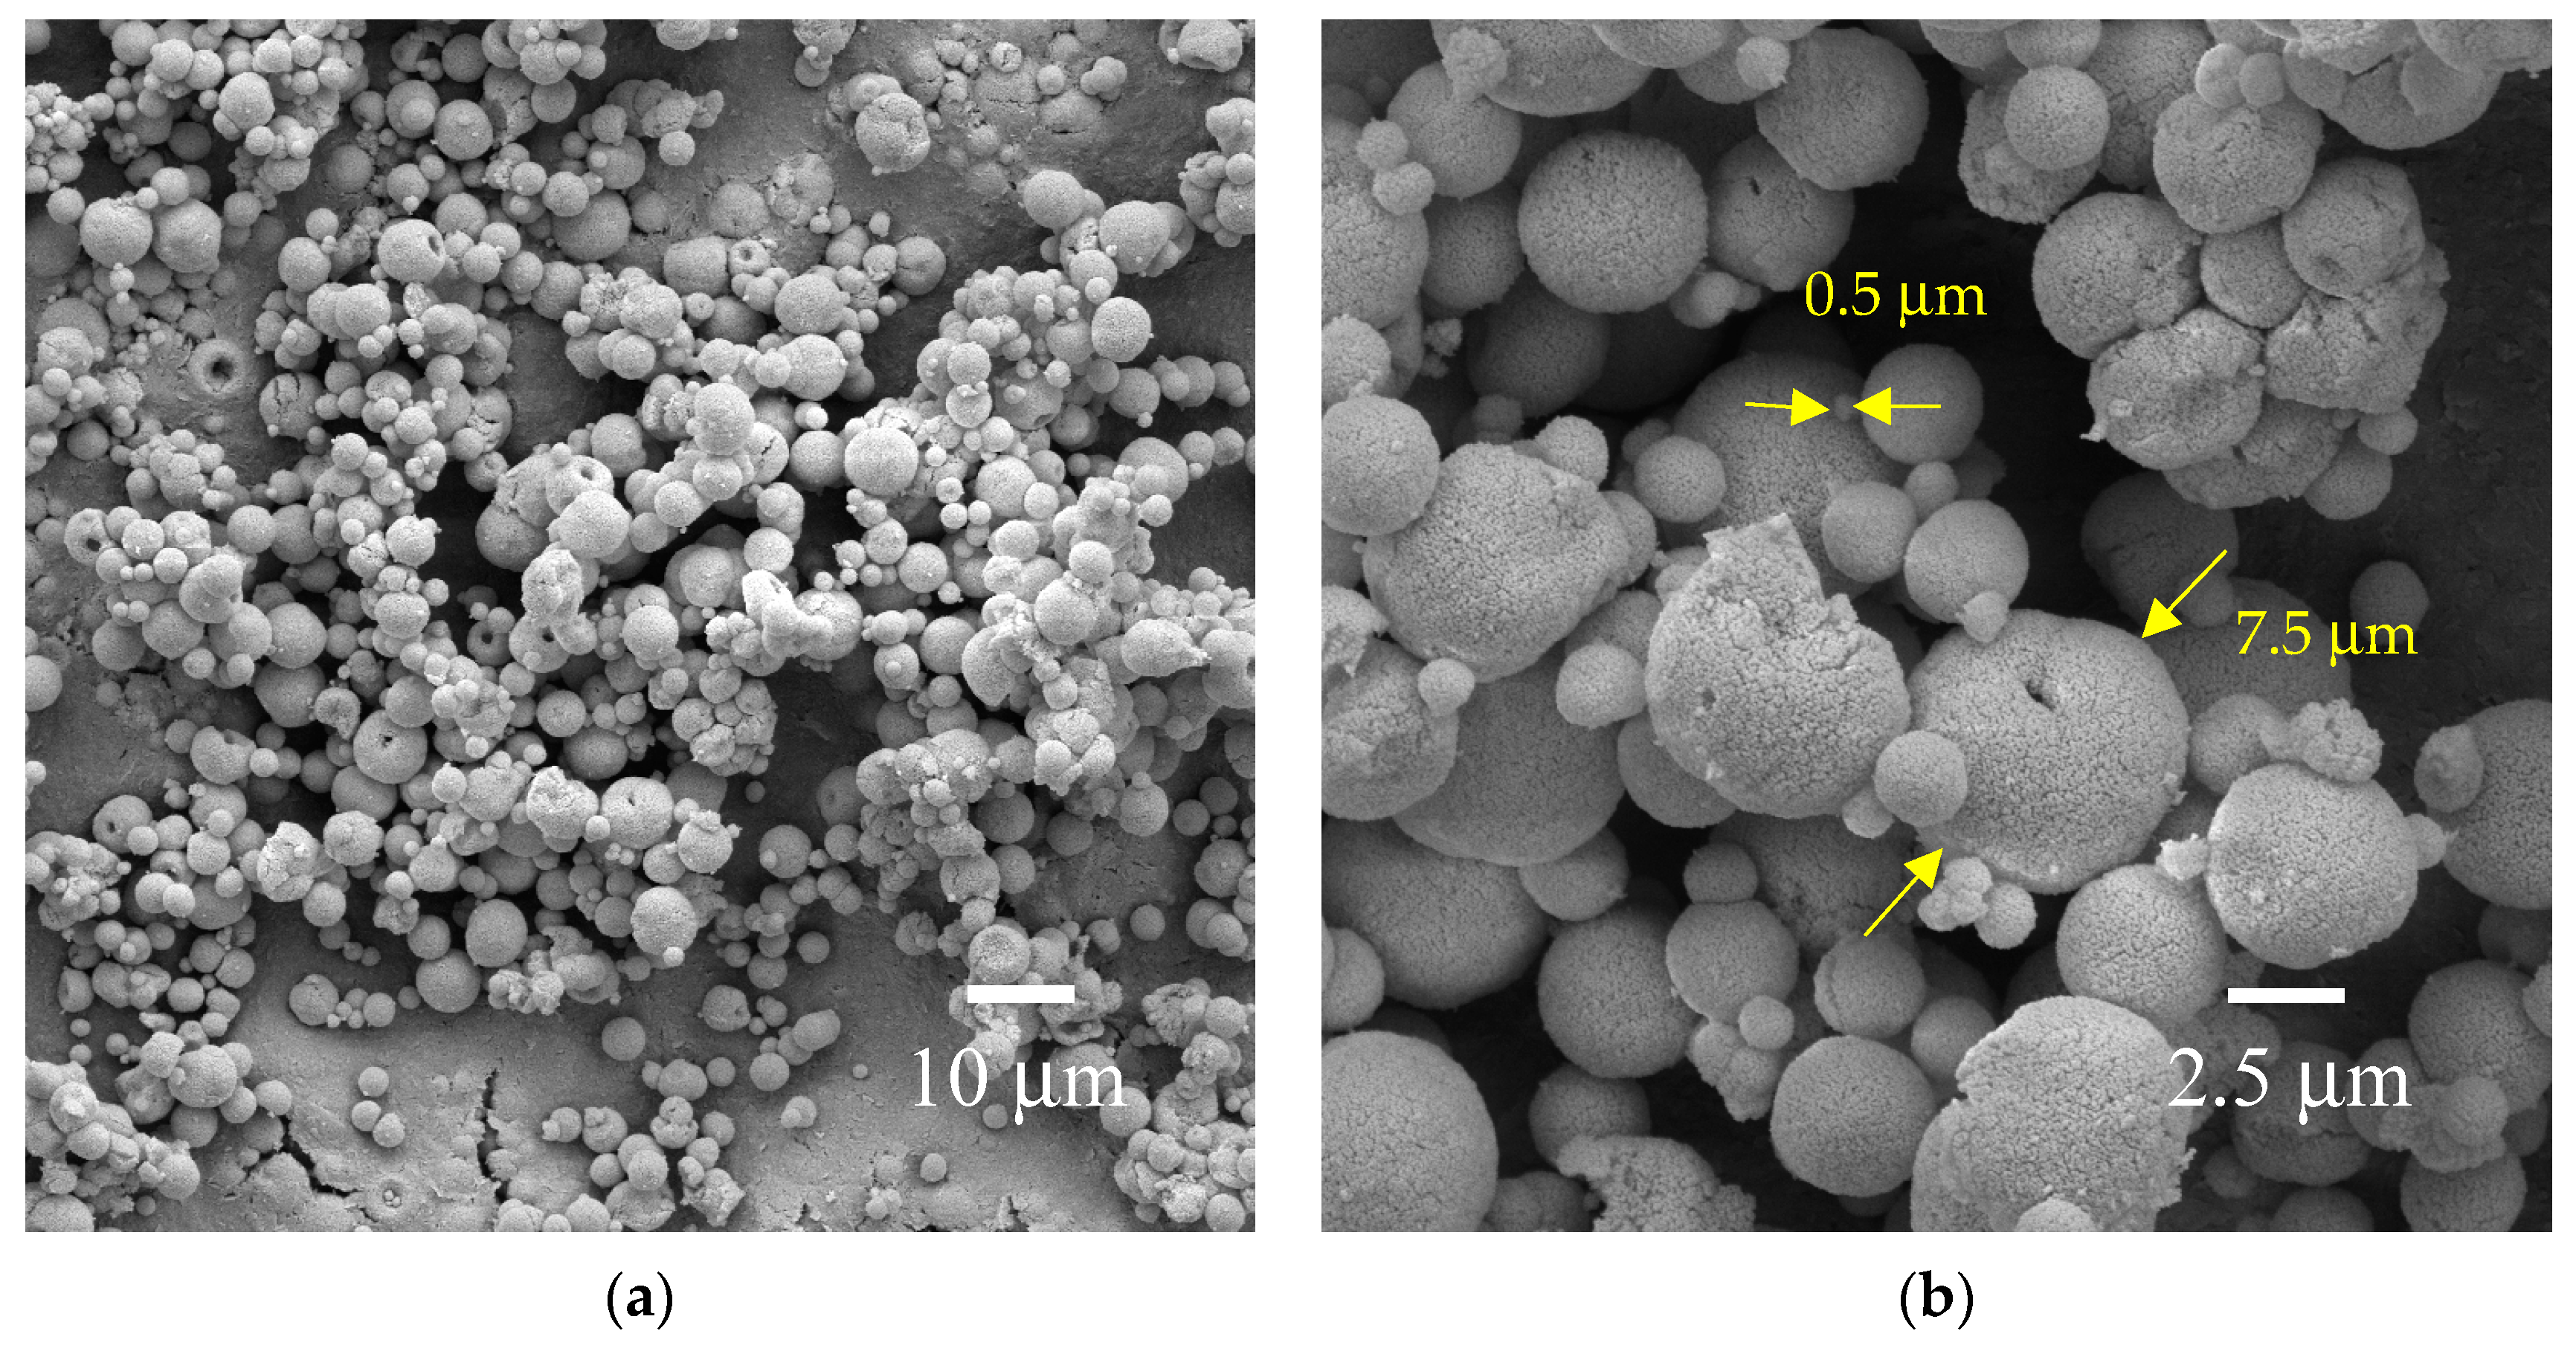
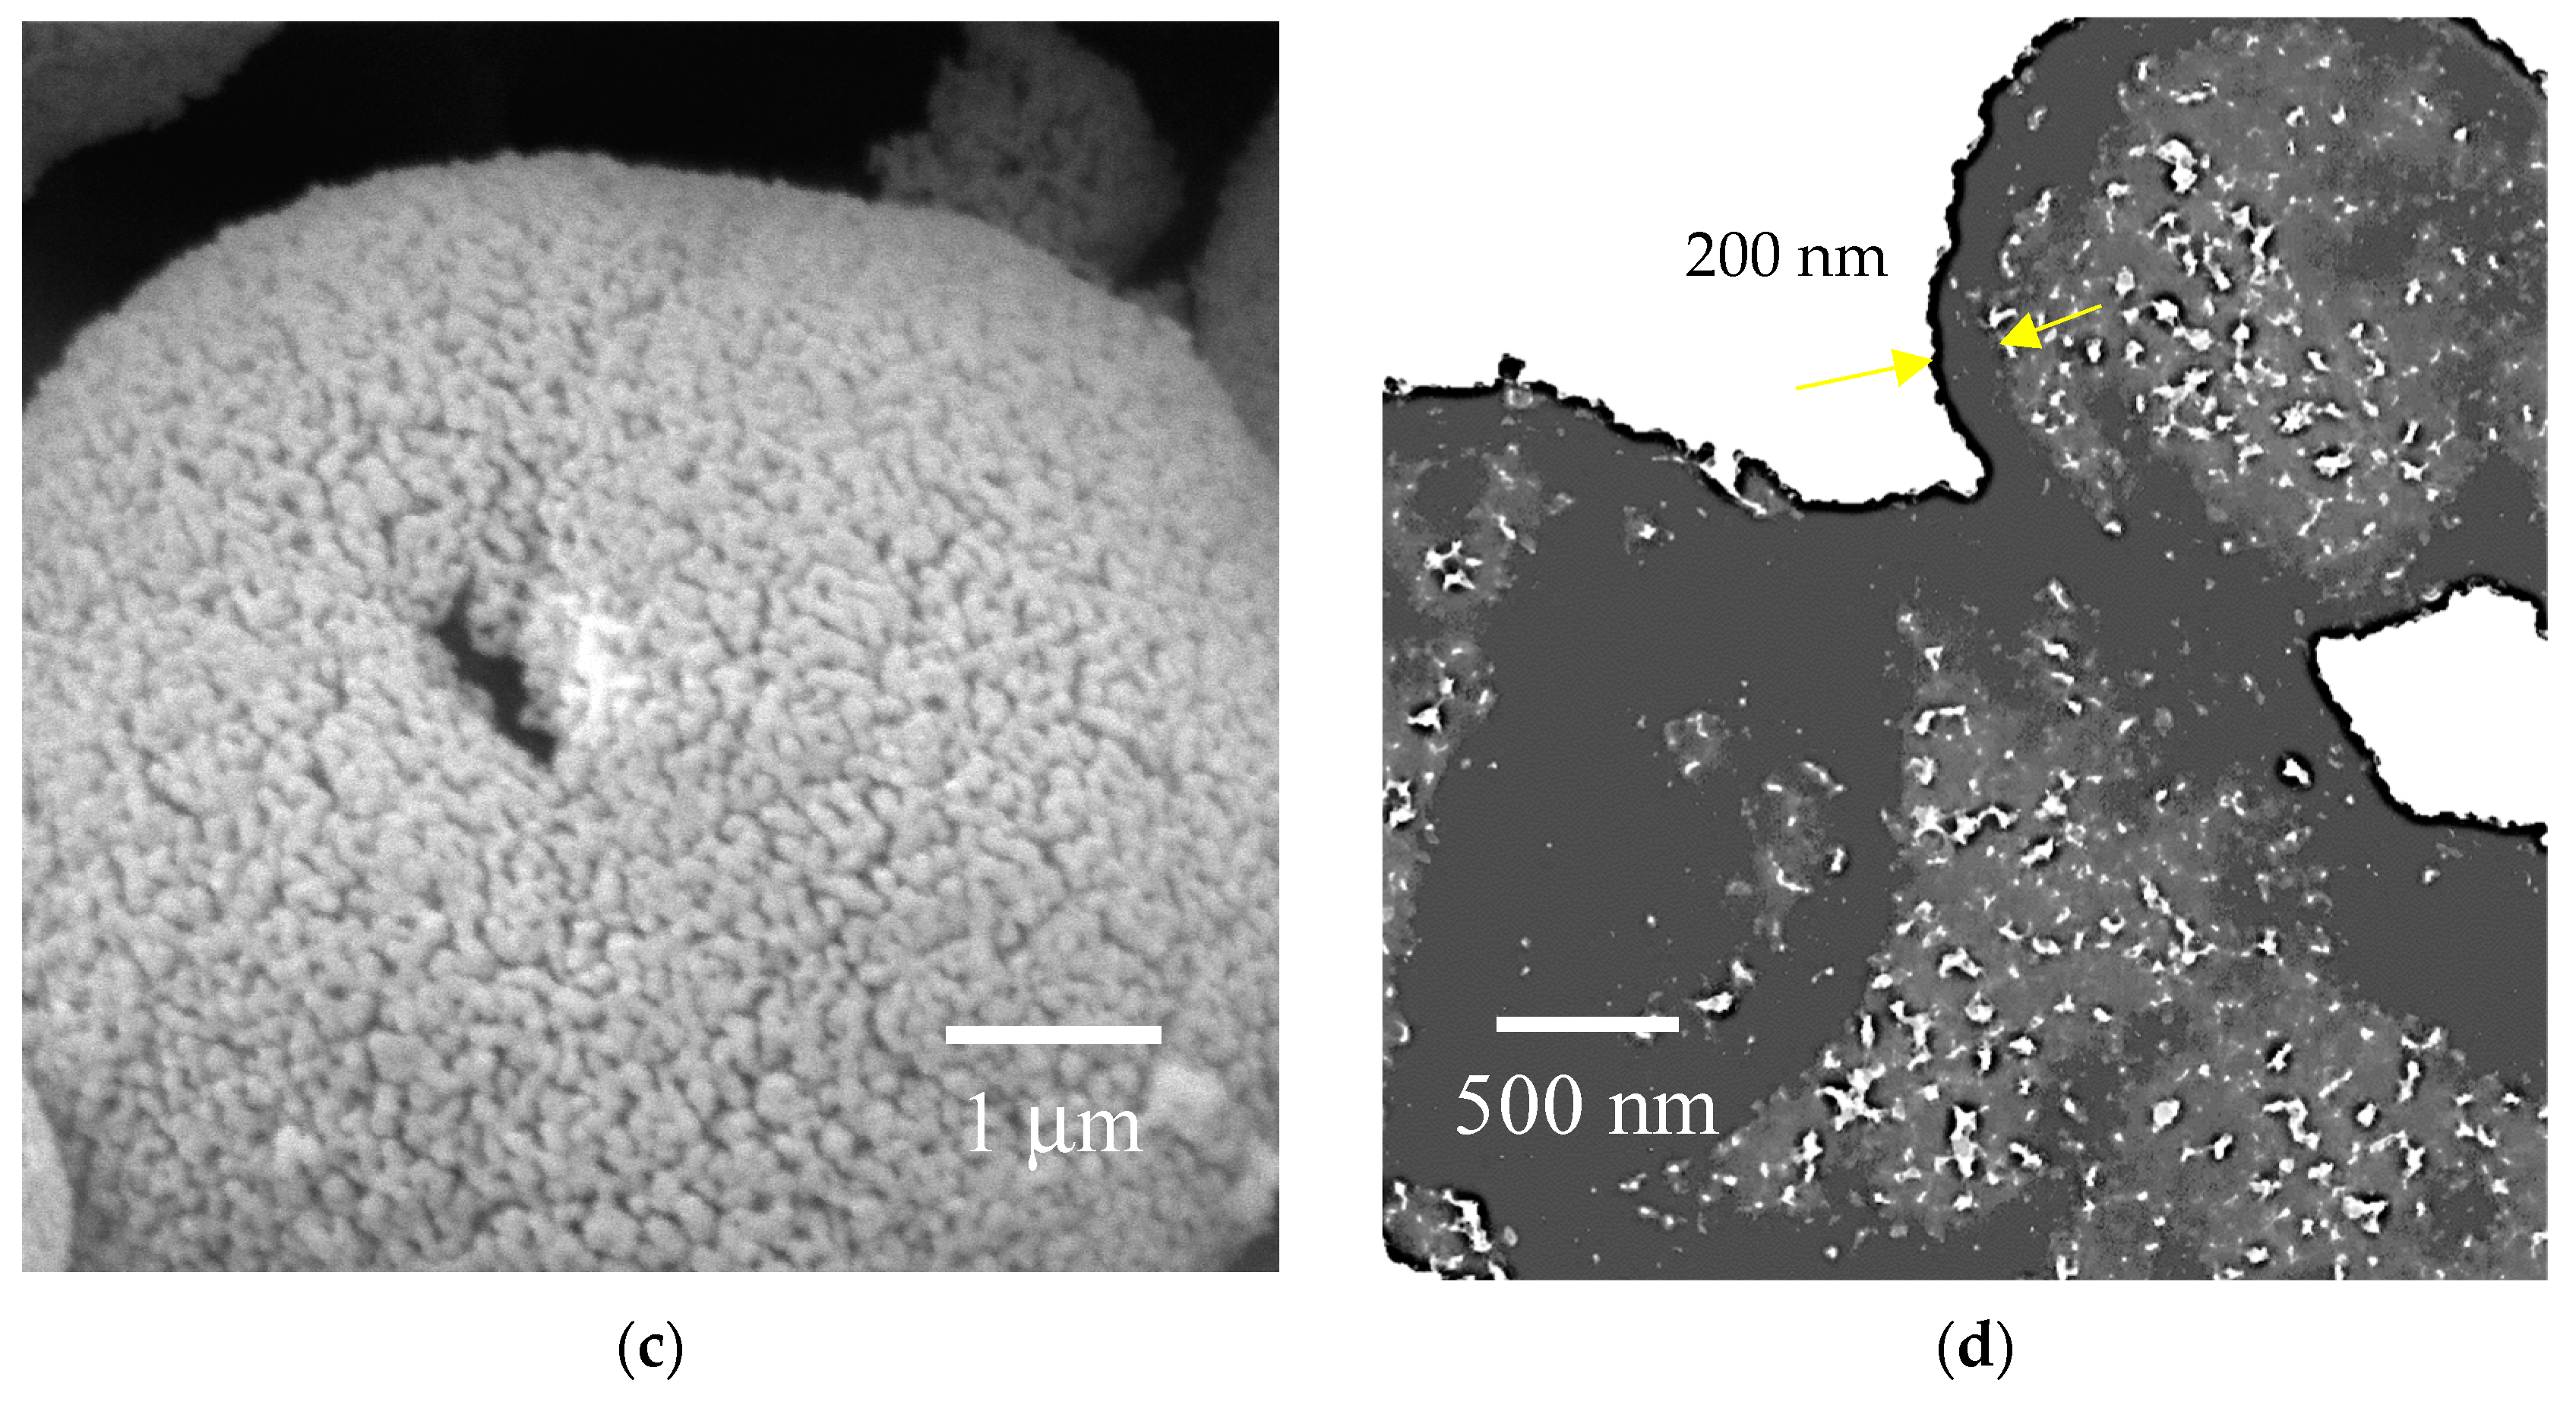
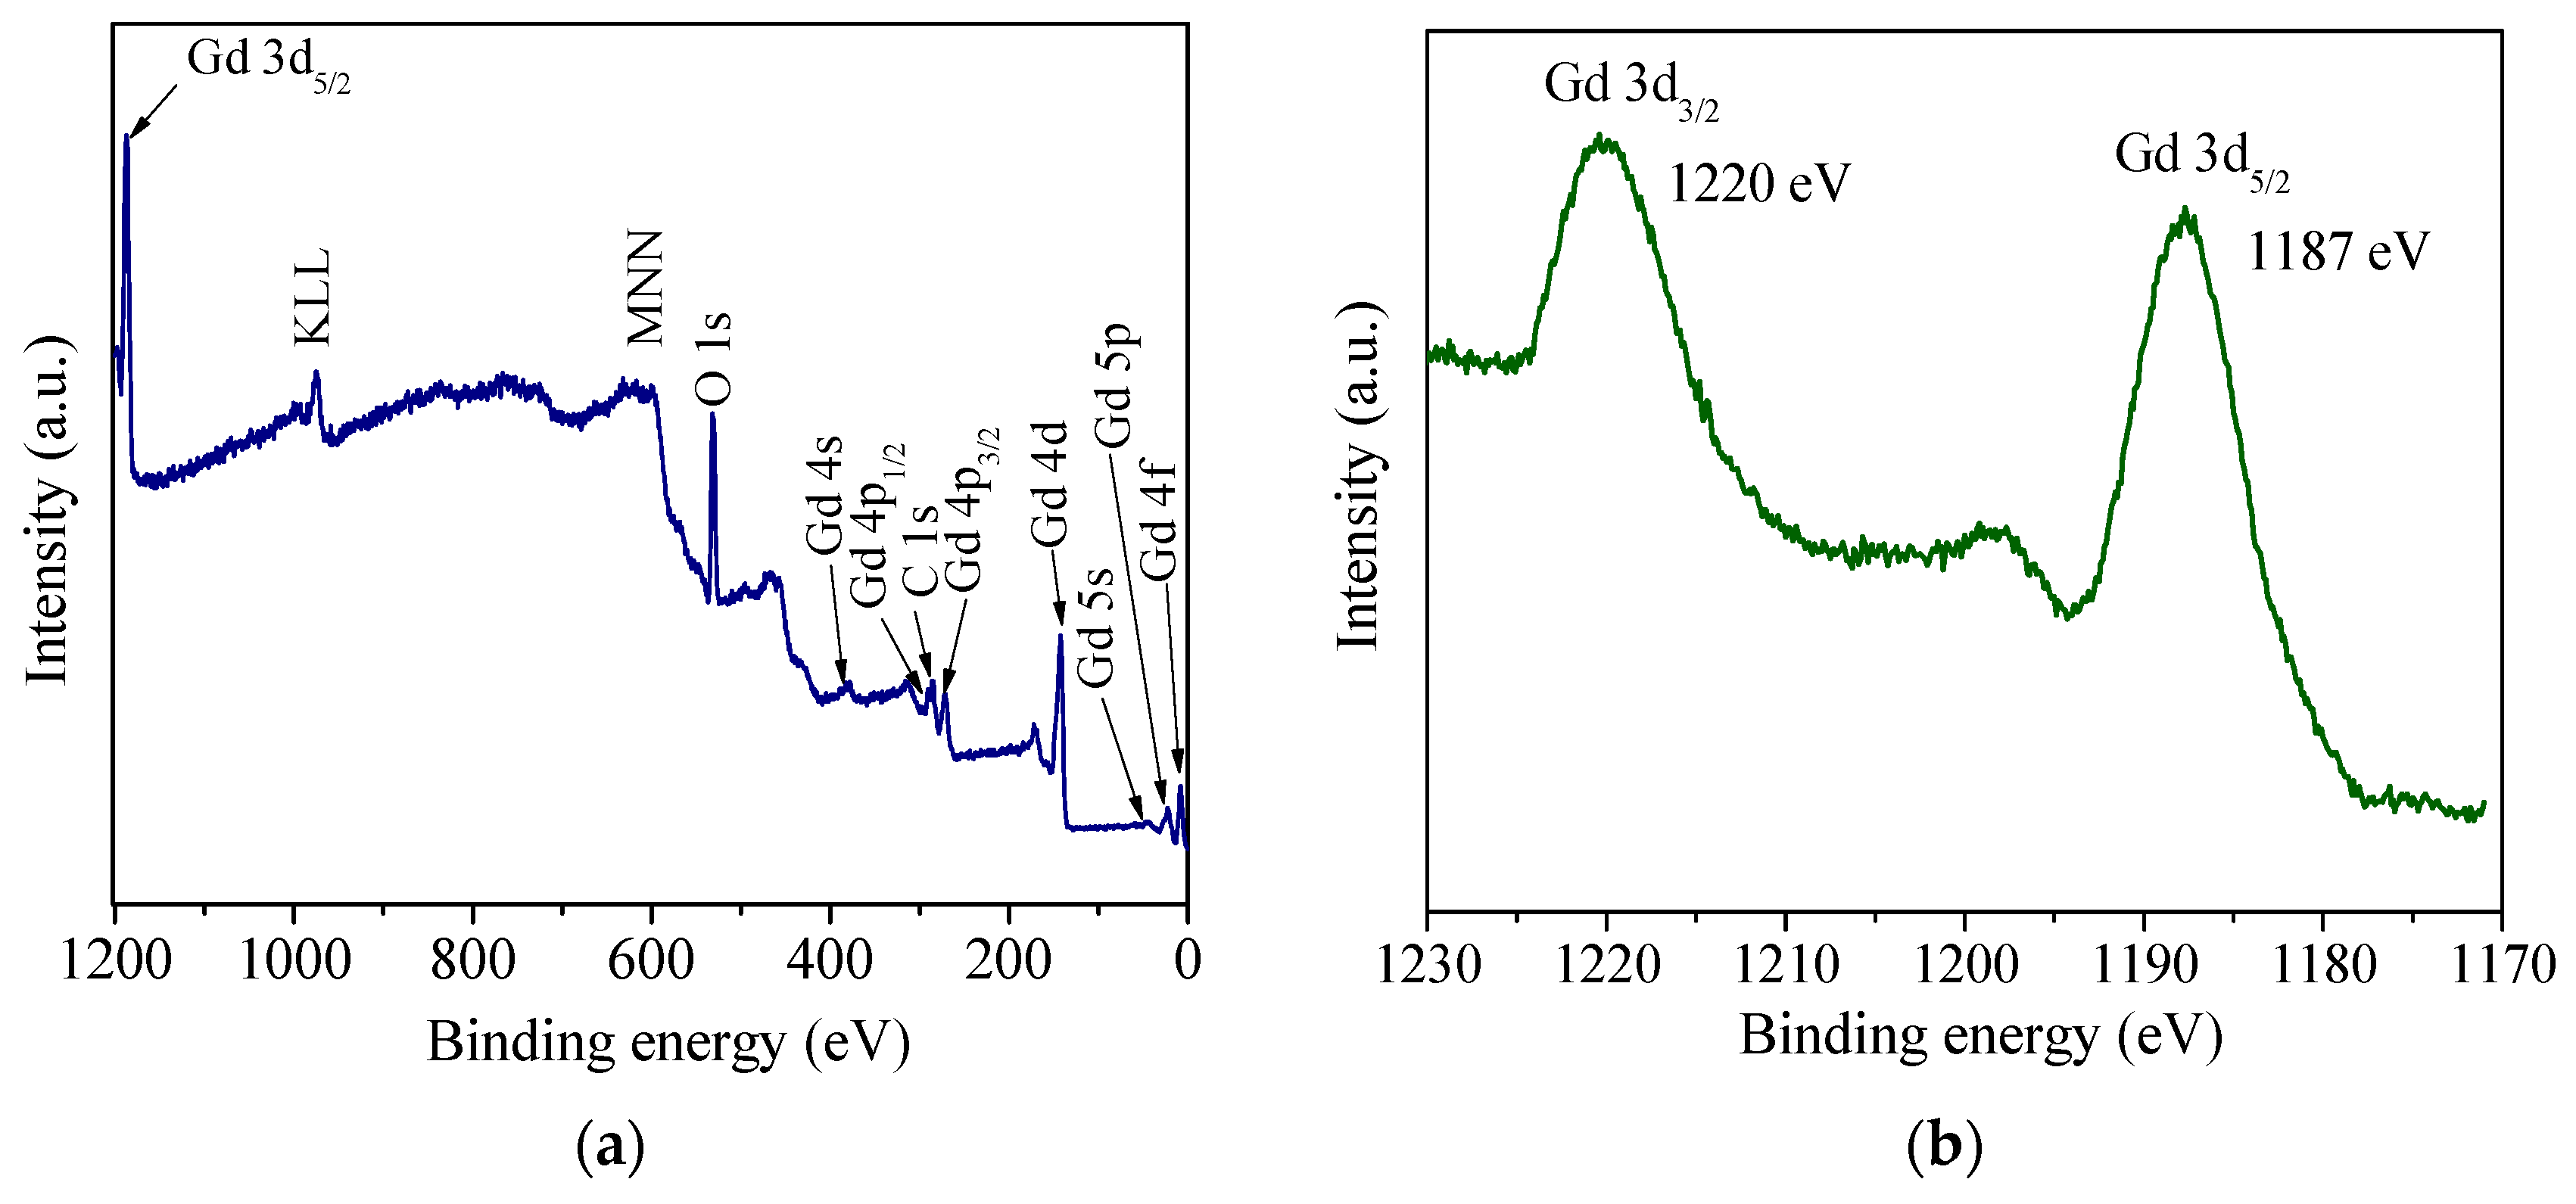
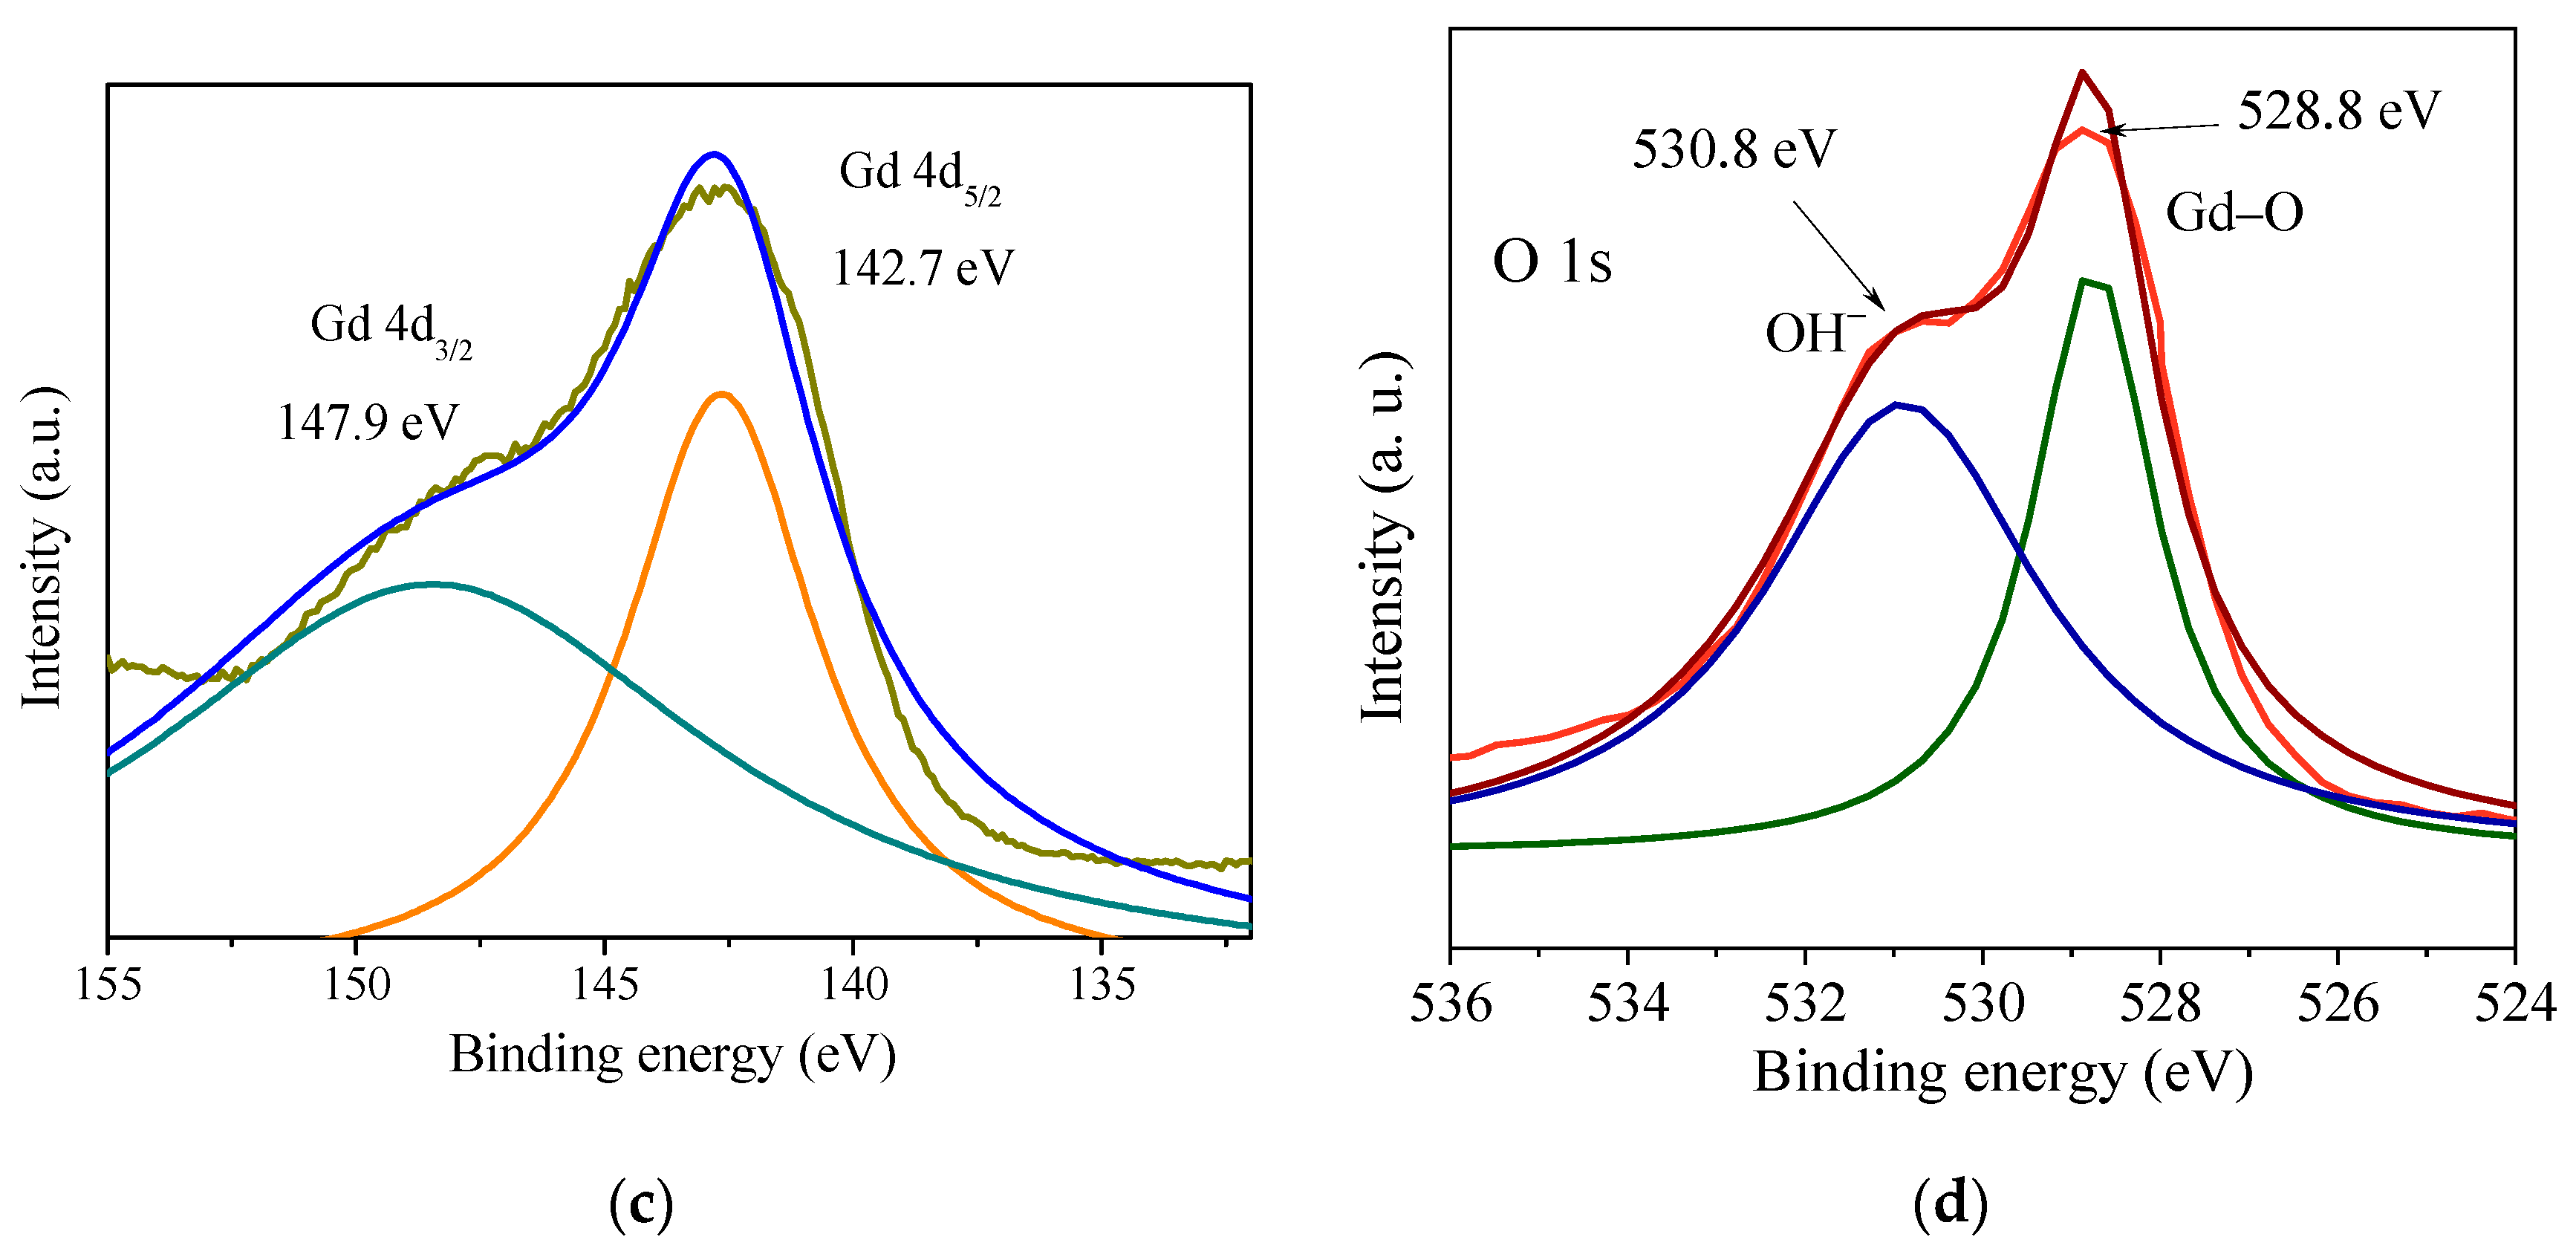
3.1. Crystal Structure, Morphology, and Surface Chemical Composition

Figure 1 shows a typical XRD pattern of Gd2O3 annealed at 600 °C, which was identified using the JCPDF file No. 012-0797. This oxide crystallizes in the cubic structure, with lattice parameter a = 10.815 Å and space group Ia − 3 (206). The presence of secondary phases or residues of organic matter was not detected in this analysis. From these results, the average crystallite size (D) was determined using the Scherrer equation:
D = 0.9 λ β cos θ
where λ is the wavelength of X-ray radiation (1.5406 Å), 0.9 is the shape factor, θ is the Bragg angle, and β is the full width at half maximum (FWHM) of XRD peaks. The resulting average crystallite size was 23.4 nm.
On the other hand, Figure 2 shows the FTIR spectrum of a Gd2O3 sample, where a wide band, centered at ~3430 cm−1, is associated with the symmetrical stretching of O–H groups. The presence of this band reflects the high hygroscopicity of the oxide and therefore the easy formation of hydroxyl radicals [3]. Furthermore, the bands located at 1516, and 1400 cm−1 are related to the asymmetric C–O stretching vibration of the CO3 groups, while the band observed at 1335 cm−1 is assigned to the symmetric vibration of these functional groups [23]. The origin of these bands can be attributed to the adsorption of CO2 molecules from the atmosphere. The band observed at 845 cm−1 can be related to the C–C bending vibration mode of carbon residues, which were produced during pectin combustion. However, their amount is not sufficient to be detected by XRD. Finally, the peaks located at 546 and 435 cm−1 are attributed to the Gd–O vibration modes of Gd2O3 [24]. In summary, these results show that Gd2O3 easily adsorbs water and carbon dioxide from the environment.
The surface morphology of Gd2O3 can be seen in Figure 3a–c, corresponding to non-agglomerated nanostructured hollow microspheres, with diameters between 0.5 and 7.5 μm. As reported in a previous work, the reaction between formic acid and gadolinium nitrate, at room temperature, produced gadolinium formate microspheres, through an exothermic reaction [5]. Subsequently, calcination at 600 °C caused the thermal decomposition of gadolinium formate, through Equation (3), producing Gd2O3, while the shape of the particles was preserved by the action of pectin. The latter being an economical and natural compound that also prevents the agglomeration of the microspheres.
G d ( H C O O ) 2   ( s ) + O 2 ( g ) G d 2 O 3 ( s ) + 2 C O 2 ( g ) + H 2 O ( g )
Furthermore, Figure 3d displays a TEM photograph, from which an average shell thickness of approximately 200 nm was determined. The average grain size of the interconnected nanoparticles was ∼80 nm, in accordance with previous work [5]. The highly porous structure shown in this image will facilitate the flow of dye solutions and their subsequent degradation.
Regarding the surface chemical composition, Figure 4a shows a wide XPS survey scan, where peaks associated with the electronic orbitals of gadolinium, oxygen, and carbon can be noticed. The carbon peak, centered at 285 eV, can be attributed to the adsorption of CO2 from the atmosphere, and the carbonaceous residues produced during the calcination of the precursor, as detected by FTIR spectroscopy. Figure 4b shows a narrow scan acquired around the gadolinium 3d signal, where two peaks located at 1220 and 1187 eV, correspond to the 3d3/2 and 3d5/2 levels [25]. Meanwhile, Figure 4c shows the emission corresponding to 4d peaks of gadolinium ions, where its deconvolution allowed the identification of peaks located at 147.9 (4d3/2) and 142.7 eV (4d5/2). For oxygen ions, Figure 4d shows a narrow scan obtained around the 1s level, which consists of two overlapped peaks, centered at 530.8 and 528.8 eV. The first is characteristic of OH groups, related to the oxide hygroscopicity, and the second is characteristic of Gd-O bonds [12,26].

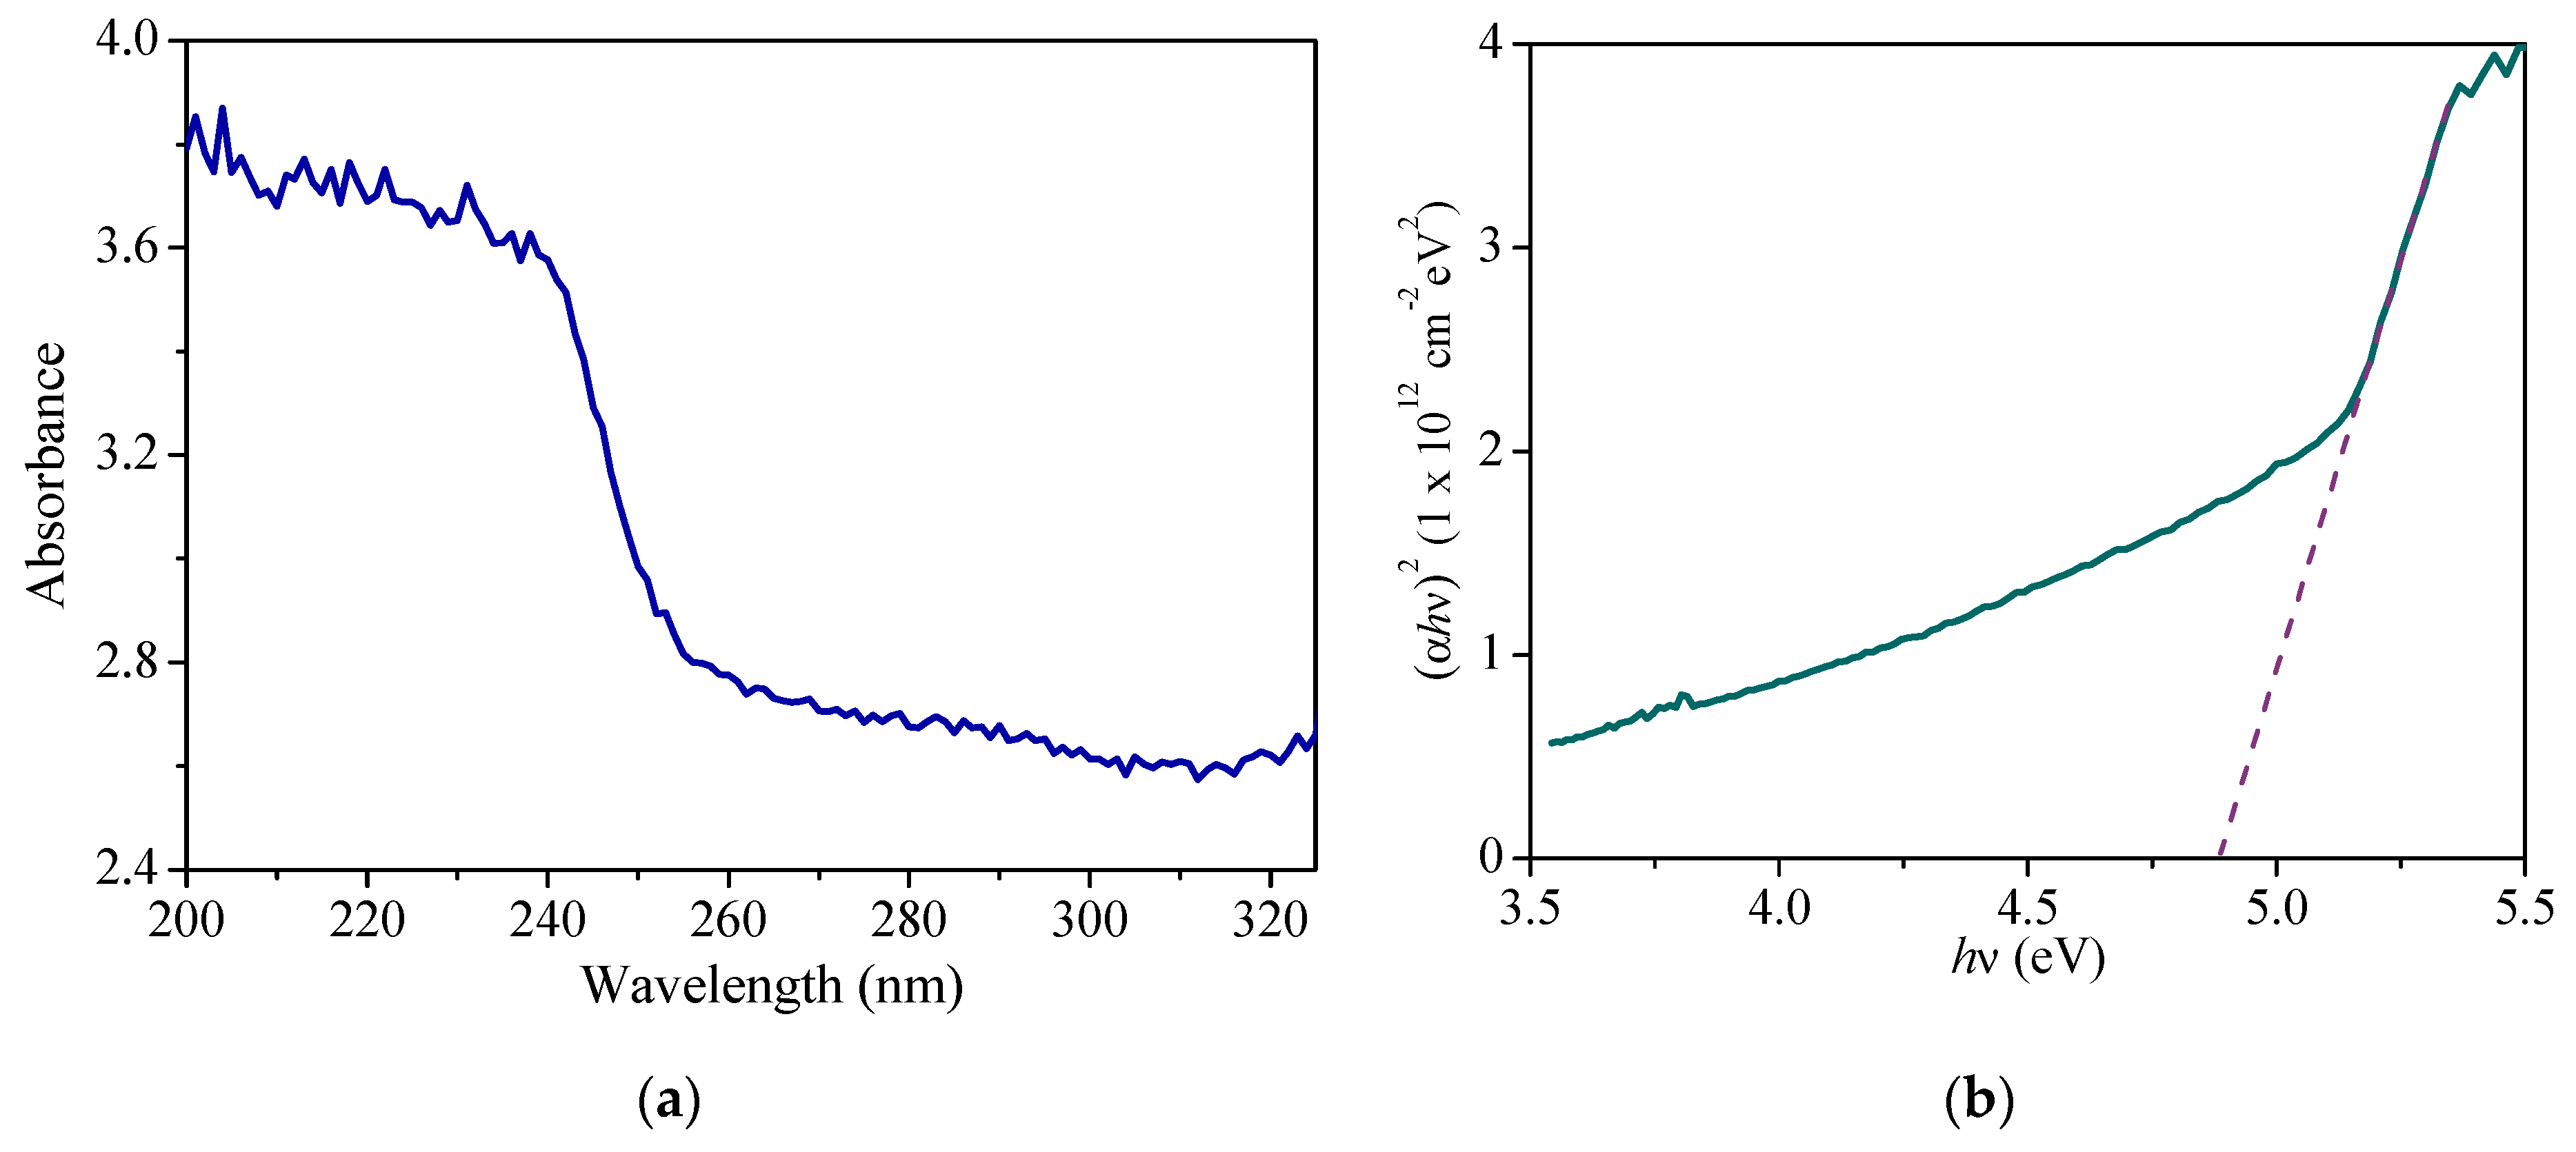
3.2. Determination of the Bandgap Energy

The bandgap energy of Gd2O3, determined by several methods, has been previously reported in the literature. Through high-temperature measurements, Lal and Gaur obtained a narrow Eg of 2.4 eV [27]. It was attributed to the effect of the 4fn and 4fn+1 levels of gadolinium atoms, whose energy lies between the conduction band (CB) and the valence band (VB). On the contrary, Prokofiev et al. reported an optical Eg of 5.4 eV, determined on single crystals [28]. They also found that La2O3, Gd2O3, and Lu2O3 have the highest Eg among rare-earth oxides. Eg of Gd2O3 corresponds to the difference in energy between VB (2p oxygen states) and CB (4f gadolinium orbitals). On the other hand, Gillen et al. using the Density Function Theory calculated Eg values between 4.85 and 5.3 eV, which agrees with the previously reported optical Eg [29]. For the present study, Figure 5a shows a typical absorbance vs. wavelength graph obtained from the as-prepared Gd2O3 powder. These data were processed to generate a (αhν)2 vs. graph (Figure 5b), according to the Tauc method, where α represents the optical absorption coefficient and the photon energy [30]. The intersection of the dotted line with the x-axis gave an Eg of ∼4.8 eV, which is close to the more accepted value for this material.

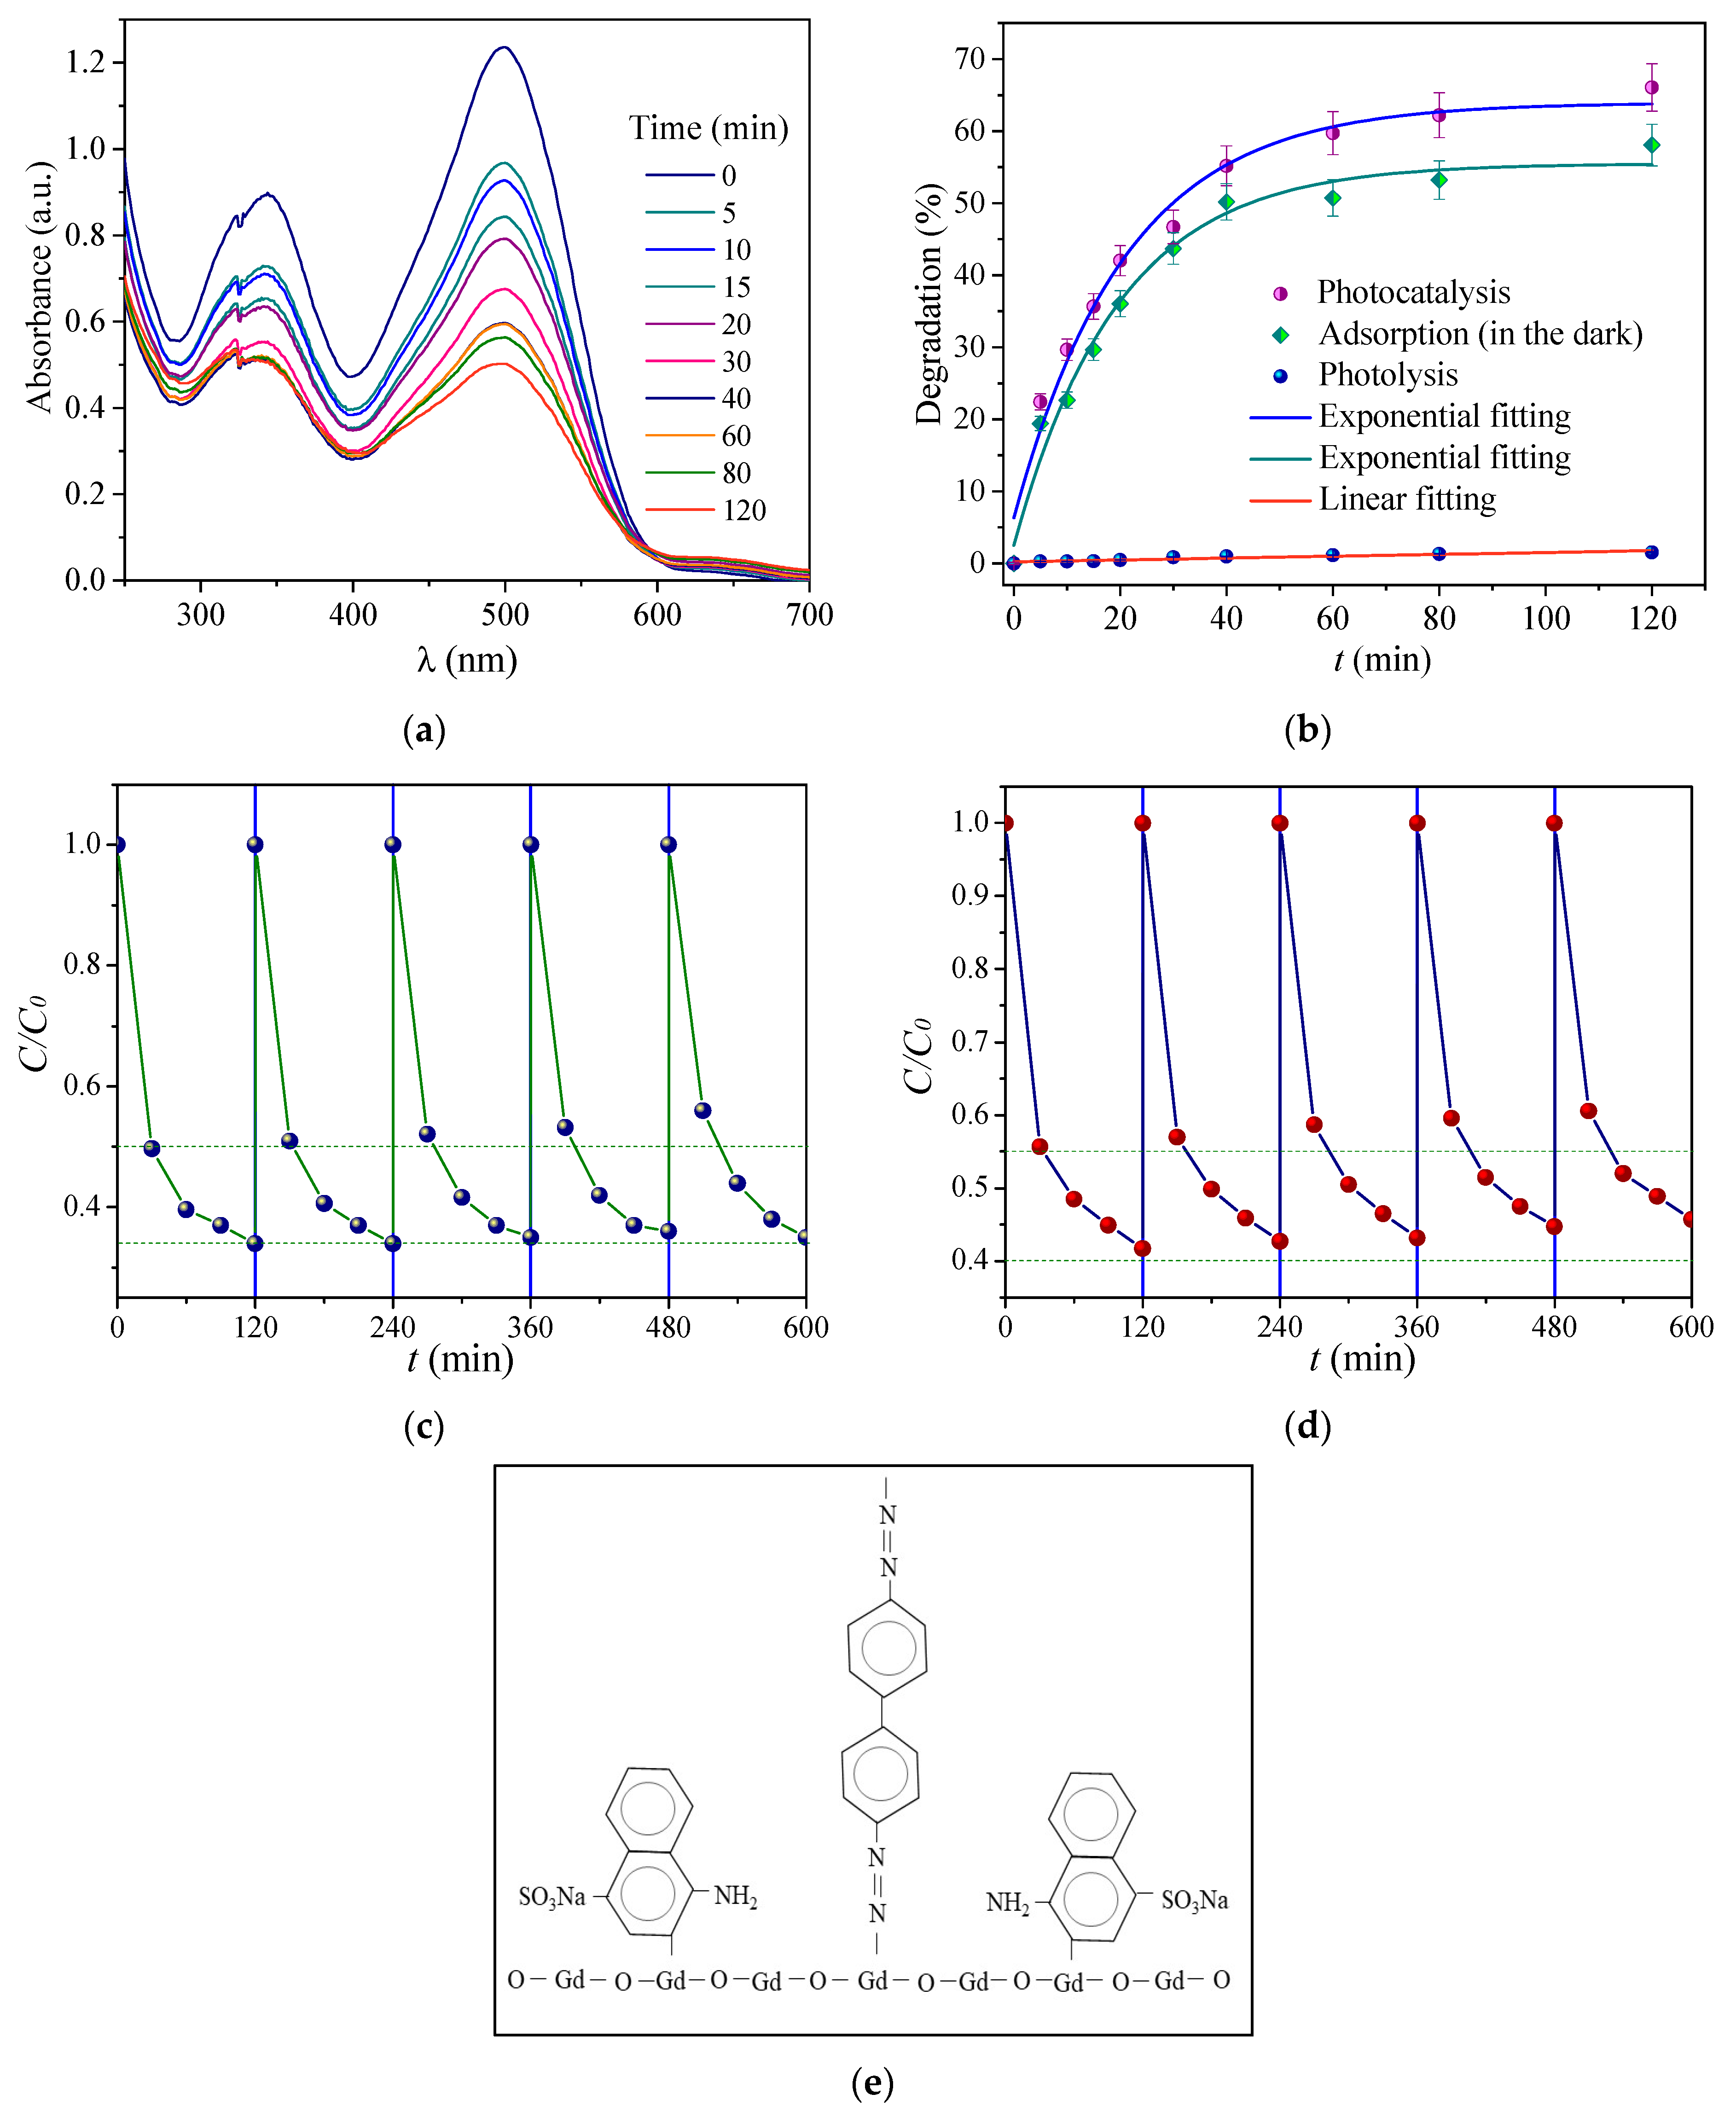
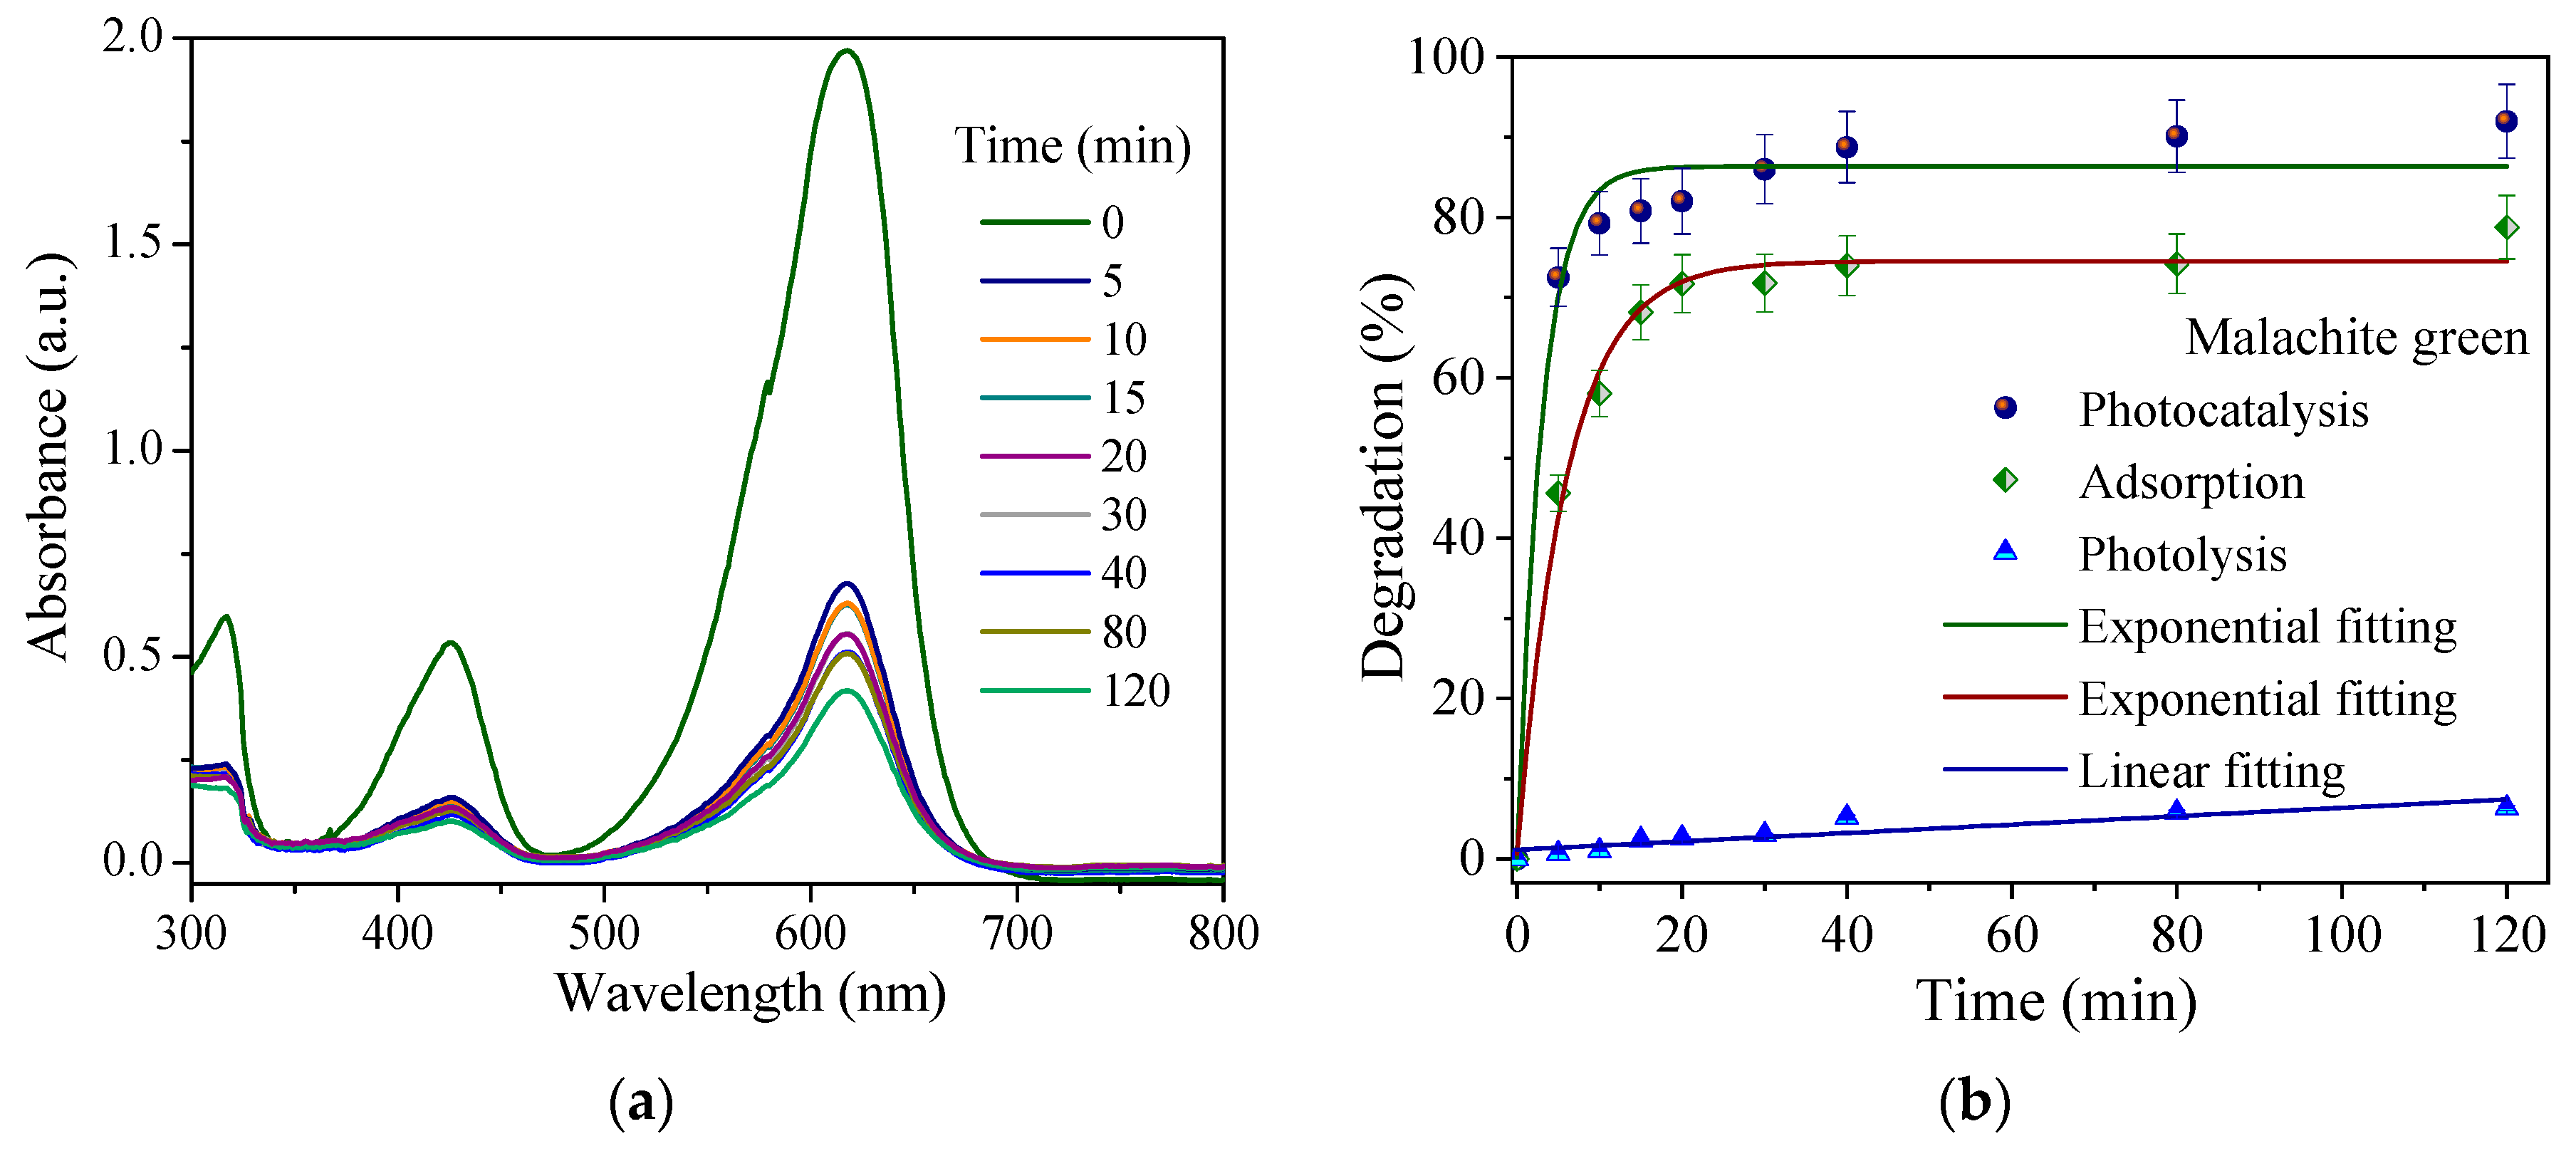
3.3. Degradation of Congo Red and Malachite Green

Congo red is an anionic diazo dye formed by six aromatic rings, grouped in pairs, joined by –N=N– bonds (chromophores) [31]. It is widely used to manufacture textiles, paper, plastic, inks, acid-base indicators, and leather, among others. Due to its high carcinogenicity and mutagenicity, its use has caused great concern worldwide and has been banned in many countries. However, it is frequently used as a target molecule to test the degradation capability of many semiconductor materials.
Figure 6a shows absorbance vs. wavelength spectra corresponding to the photocatalytic degradation of a CR solution, which shows a gradual decrease in intensity with exposure time to UV light. Using the main absorption band as a reference, which is centered at 498 nm, the percentage of degradation was determined according to Equation (1). Figure 6b displays the corresponding graph, and those obtained from adsorption (in the dark) and photolysis experiments. According to these results, photocatalysis produced 65% of the dye degradation, in the first 2 h, where dissociative adsorption contributed 56%. This reveals that adsorption played a relevant role in this process. Furthermore, since the bandgap energy of Gd2O3 is greater than the radiation energy used in these tests, it is unlikely that photocatalysis was the main pathway for dye degradation, as previously reported in the literature. On the contrary, due to the basic character of rare earth oxides, their high reactivity with water promotes the rapid formation of hydroxyl radicals (OH), superoxide radicals ( O 2 ), and other ROS that cause the cleavage and fragmentation of dye molecules [32]. The environmental toxicity of materials used for wastewater treatment is an important issue to consider before their use and commercialization. According to the literature, gadolinium-based contrast agents produce renal diseases and metabolic alterations in mice, which reveals their potential toxicity for other mammals [33]. However, the specific composition of such compounds was not reported in that study. On the other hand, a review by Malhotra et al. indicates the great toxicity of rare earth elements; however, this is significantly reduced when they form insoluble salts or oxides, which represents no harm to aquatic bacteria and protozoa [34]. Therefore, the reusability of Gd2O3 particles is an important topic to investigate. Figure 6c,d show cyclic test graphs obtained from photocatalytic and adsorption degradation tests. They indicate a reliable performance over several cycles, with degradation percentages like those shown before. Furthermore, Figure 6e shows a possible fragmentation scheme, where pairs of aromatic rings produced by the breaking of lower energy bonds attach to the Gd2O3 surface [35,36]. Hydration of Gd2O3 also leads to the formation of GdOOH, which is then transformed into Gd(OH)3 [12,26]. The bandgap energy of the latter differs significantly from that of Gd2O3, which is reported in the literature to be 3.1 eV [37]. This fact may explain the additional degradation of CR in UV light, as shown in Figure 6a, where Gd(OH)3 acted as a photocatalyst. The reactions involved in this process can be expressed as follows:
G d 2 O 3 + H 2 O 2 G d O O H
2 G d O O H + 2 H 2 O 2 G d ( O H ) 3
G d ( O H ) 3 + h v   e C B + h V B +
h V B + + O H O H
e C B + O 2 O 2
where  e C B  and  h V B +  are the CB electrons and VB holes, respectively. Since Gd2O3 is an n-type semiconductor material,  e C B  are the main charge carriers facilitating the formation of radicals O 2 . Finally, Figure 6b also shows the degradation produced by photolysis, which was approximately 1.5%, having a marginal effect.
The degradation curves of Figure 6b were analyzed using OriginPro 2024 software. It was found that the first two processes (photocatalysis and adsorption) can be modeled by an exponential function of the form:
        D = A 1 e t / B + A 2
where A1, B, and A2 are constants. The calculated Adjusted R2 values were 0.983 and 0.978, respectively, indicating its good accuracy. In the case of photolysis, its behavior was adequately fitted with a linear function, yielding an R2 of 0.87.
On the other hand, MG is a dye that shares the same characteristics of toxicity and carcinogenicity as CR [38]. It is classified as a triarylmethane dye and its strong color is due to the cation contained in its structure, which causes the absorption of light in the visible region. Regarding its degradation in UV light, Figure 7a shows UV-vis absorbance spectra collected during the first 2 h. Compared to those acquired from CR degradation, a faster process can be noted. Figure 7b shows the percentage degradation curves, corresponding to experiments performed in UV light (photocatalysis), in darkness (dissociative adsorption), and in photolysis. For them, the main absorbance peak of MG, located at 618 nm, was used as a reference. Again, dissociative adsorption had the main contribution, with approximately 78%, which increased to 91% in the presence of UV light, representing an increase of about 16%. In contrast, photolysis has a minimal effect of 6%. These results confirm the key role of adsorption in the overall degradation process. The Adjusted R2 values of the exponential functions used to model dye degradation were 0.976 for photocatalysis and 0.989 for dissociative adsorption.
The difference in degradation rates between CR and MG can be attributed to the ability of Gd2O3 to adsorb certain organic compounds, associated with its isoelectric point of solid (IEPS). The most accepted IEPS value for this oxide is 8, which indicates its basic nature [39,40,41,42]. The literature reports also a higher value of 10.9; however, it refers to Gd2O3 previously exposed to atmospheric CO2. Then, since MG is classified as a cationic dye, the difference in electrical charge favors its adsorption on the oxide, while subsequent degradation occurs by the process described above. On the contrary, the adsorption of CR molecules is less favorable because it is an anionic dye. Furthermore, it is important to consider that according to Sidorowicz et al., dyes containing conjugated double bonds in their aromatic rings, such as CR, are more difficult to degrade because electron delocalization prevents the generation of reactive sites [43].

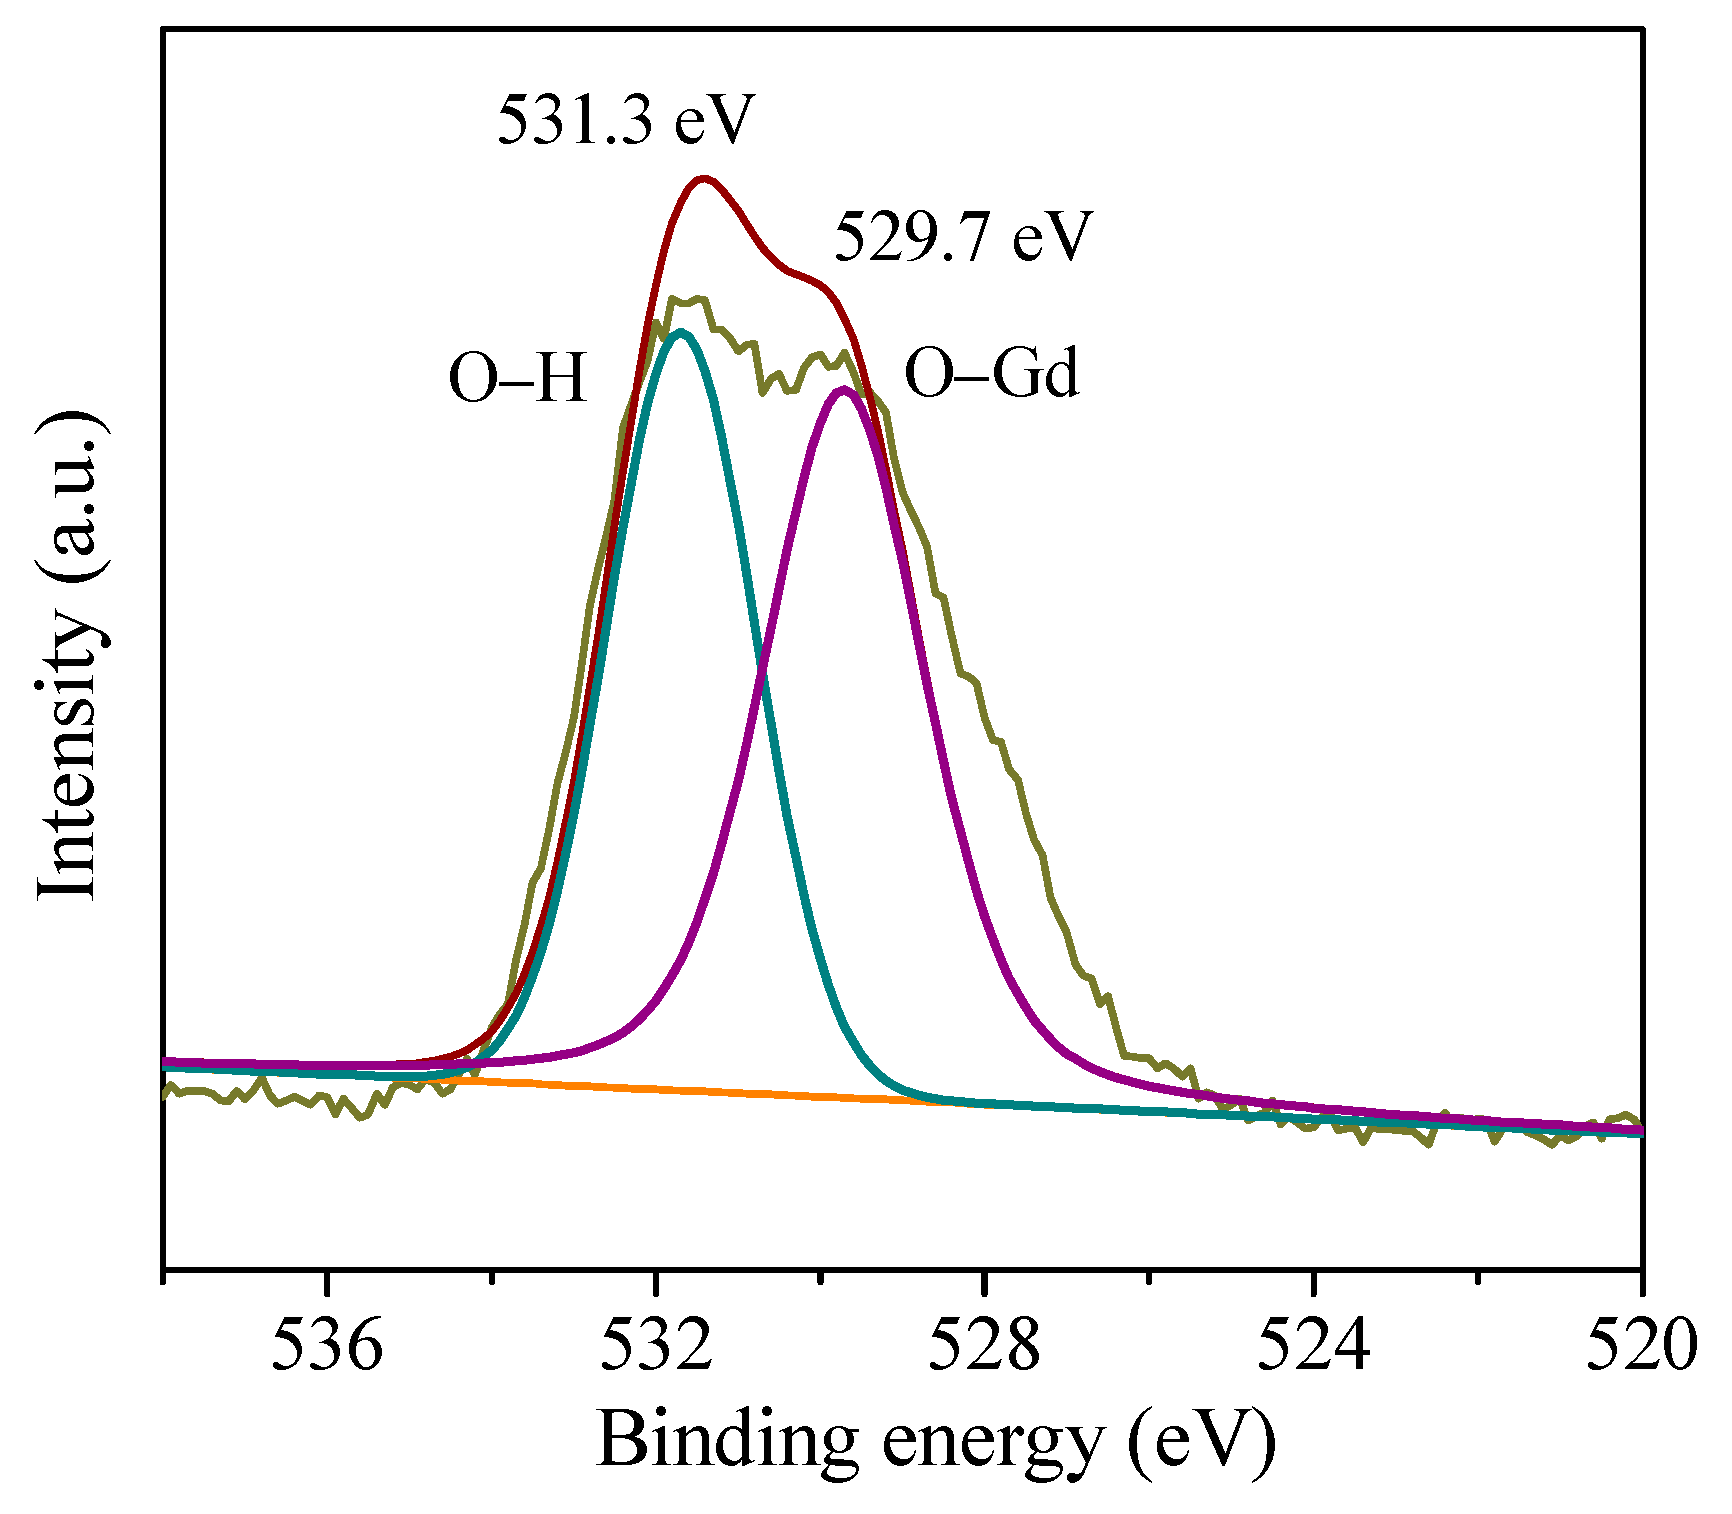
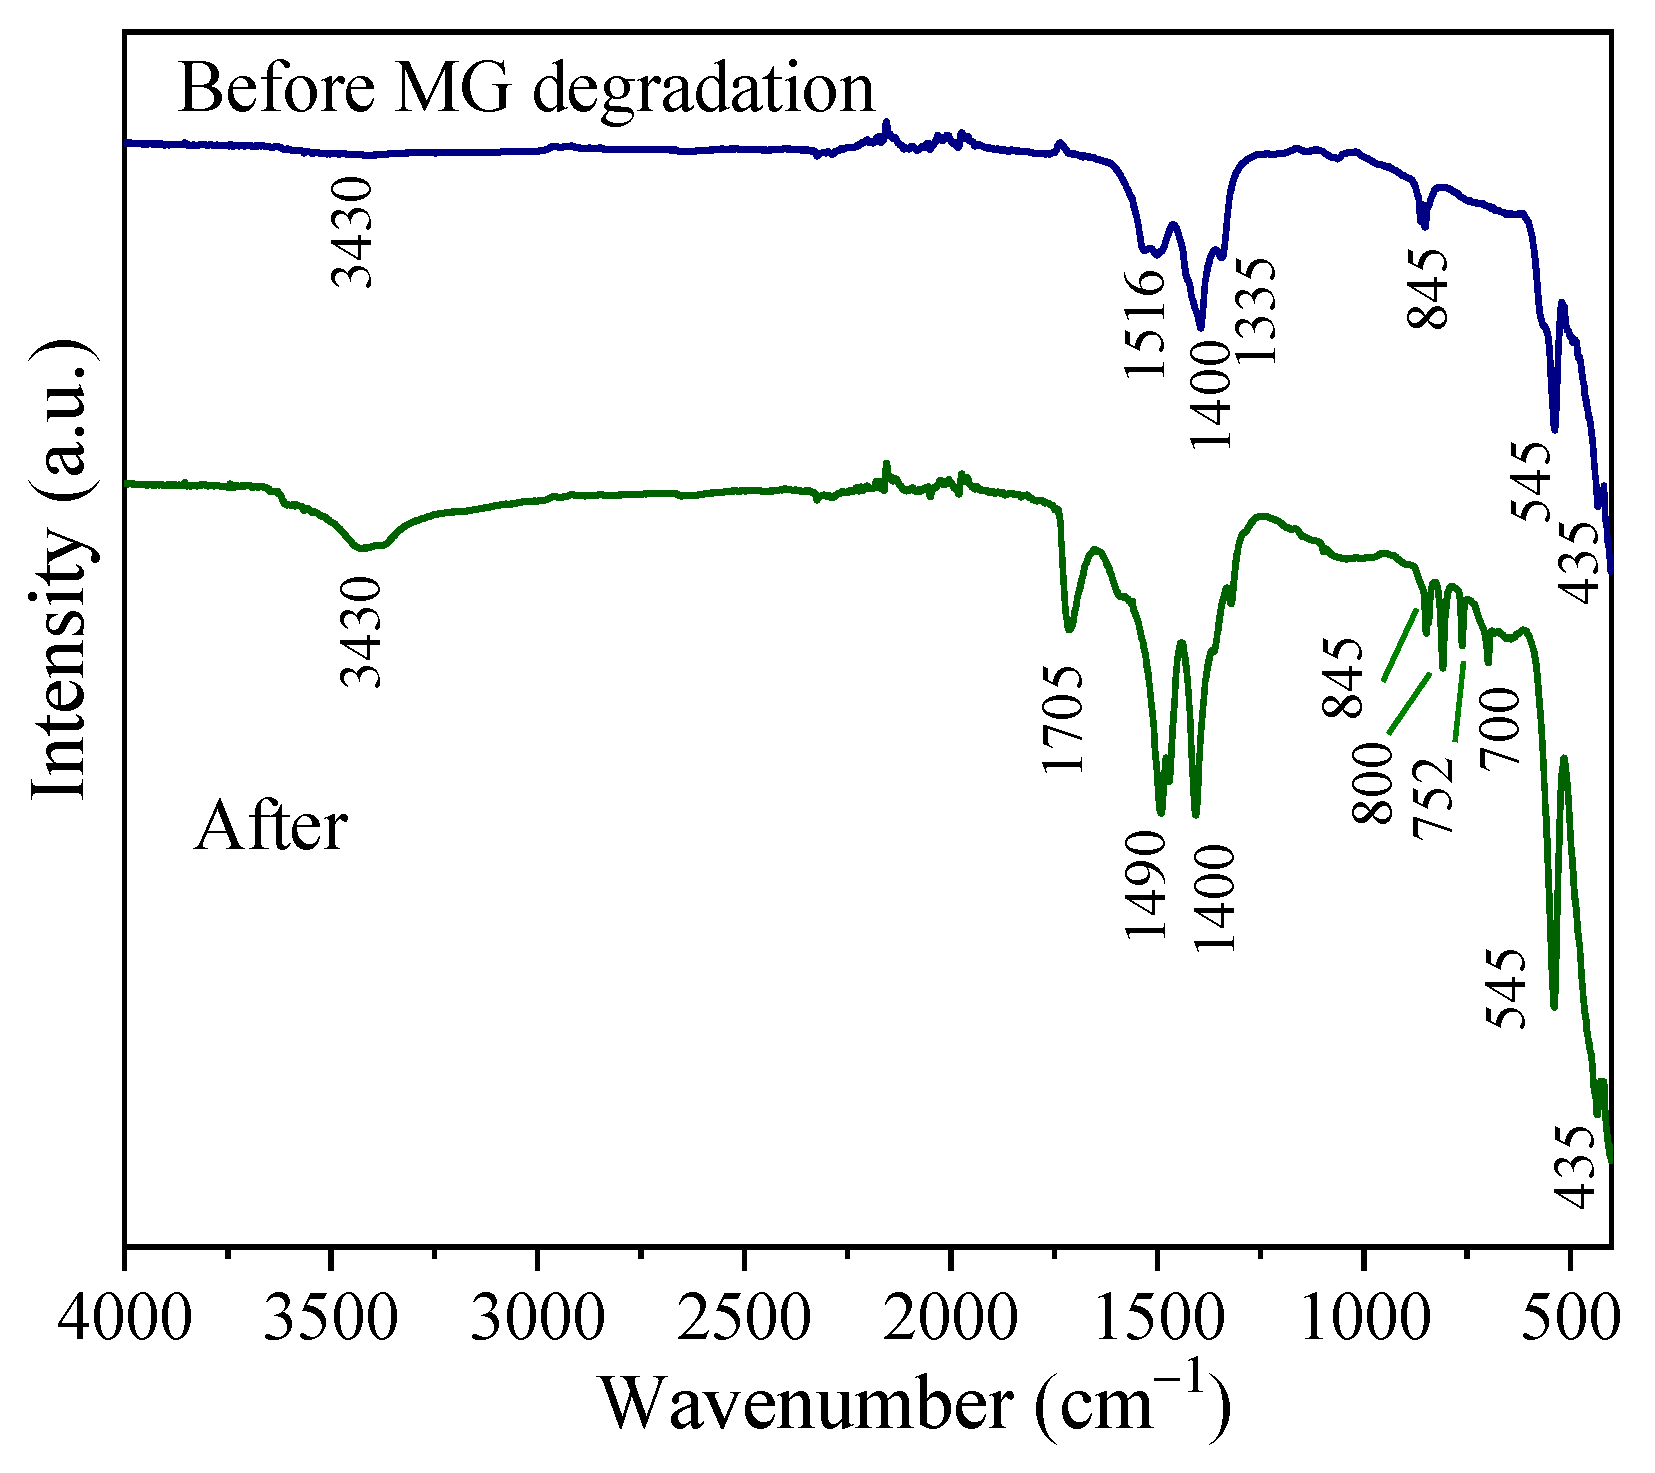
3.4. XPS and FTIR Spectra of Samples After Degradation

Evidence of the formation of OH radicals by semiconductor oxides during photocatalysis is a complex and continuously developing topic. For the different crystalline phases of TiO2, Nosaka and coworkers have proposed the pathways and analytical techniques needed to identify the formation of such radicals [44]. Although they can be applied to other n-type semiconductor materials, the available information is significantly limited. Indirect evidence of the formation of OH radicals has been explored in this work, which is based on analyses, using XPS and FTIR, of samples used in CR degradation. However, it is worth noting that clear evidence of the formation of ROS might be obtained from Electron Spin Resonance (ESR) Spectroscopy. Figure 8 shows a narrow XPS spectrum acquired around the O 1s peak, in which the deconvolution of two peaks centered at 531.3 and 529.7 eV were previously identified. Comparing these peaks with those shown in Figure 4d, a significant increase in the emission related to O–H bonds can be observed. This is attributed to the formation of GdOOH and Gd(OH)3 during oxide hydration and ROS release. In addition, Figure 9 displays the FTIR spectra of Gd2O3 before and after degradation. At first glance, a large increase in the band associated with the O–H stretch vibrational mode (~3430 cm−1) can be noticed. This is consistent with the corresponding XPS spectrum, providing evidence for the role of hydration and OH formation. At smaller wavenumbers, the peak observed at 1705 cm−1 is related to the C=N vibration mode, which is not present in the original sample. This band indicates the presence of adsorbed molecules containing these elements, in agreement with the model proposed in Figure 6c. Furthermore, the bands located at 1490 and 1400 cm−1, associated with C–O asymmetric vibration groups, are also present in the spectrum of the pristine samples. However, their intensity is increased because of the adsorption of organic molecules and CO2. Three bands observed between 800 and 700 cm−1 are assigned to the C–H bending vibration modes, which also confirms the adsorption of dye molecules. Finally, at smaller wavenumbers, the peaks at 545 and 435 cm−1 do not show significant changes, indicating that the low-energy vibrational modes of Gd–O remained unchanged.

4. Conclusions

Due to its physical properties, Gd2O3 has been used in important applications such as magnetic resonance, luminescence, and dielectrics; however, its ability to degrade organic pollutants has not been sufficiently studied. In this work, the rapid degradation of two common organic dyes by nanostructured Gd2O3 microspheres was investigated. Unlike previous works, the main mechanism of degradation was attributed to dissociative adsorption, which occurs in the absence of ultraviolet light or the addition of H2O2. In this process, the spontaneous formation of OH radicals and other ROS produced rapid decomposition of dye molecules, while photocatalysis enhanced it to a lesser extent. Comparing the results of the degradation percentages obtained here with those already published in the literature, with and without the addition of H2O2, it can be noticed that with respect to the degradation of dyes, a slight increase of ~5–10% was observed [19,20,22]. However, it was lower than that claimed for the decomposition of chloramphenicol, where ~98% was reported [21]. On the other hand, the XPS and FTIR spectra of the samples used in these experiments provided valuable information on the degradation mechanism. The difference in degradation rates can be associated with the IEPS of the oxide, the electrical charge of the dye, and the electron delocalization in conjugated double bonds of the aromatic rings of CR.

Funding

Financial support from the General Academic Coordination of the Universidad de Guadalajara, through the PRO-SNI 2024 program, is greatly appreciated.

Data Availability Statement

Experimental data are available upon request.

Acknowledgments

The author thanks María de Jesús Palacios Sánchez and Eulogio Orozco from the physical chemistry laboratory for FTIR characterization. XPS analyses were kindly carried out by the team of the laboratory of X-ray photoelectron spectroscopy, which received financial support from the CONAHCYT project: “Apoyo al Fortalecimiento y Desarrollo de Infraestructura Científica y Tecnológica” with reference number 270662.

Conflicts of Interest

The author declares no conflicts of interest in the publication of this study.

References

  1. Scarel, G.; Svane, A.; Fanciulli, M. Scientific and technological issues related to rare earth oxides: An introduction. In Rare Earth Oxide Thin Films; Fanciulli, M., Scarel, G., Eds.; Springer: Berlin/Heidelberg, Germany, 2007; pp. 1–14. [Google Scholar] [CrossRef]
  2. Saha, A.; Devi, P.S. Surface functionalized multifunctional Gd2O3—Fluorescein composite nanorods for redox responsive drug delivery and imaging applications. ACS Appl. Nano Mater. 2018, 1, 2898–2911. [Google Scholar] [CrossRef]
  3. Tamrakar, R.K.; Bisen, D.P.; Brahme, N. Comparasion of photoluminescence properties of Gd2O3 phosphor synthesized by combustion and solid state reaction method. J. Radiat. Res. Appl. Sci. 2014, 7, 550–559. [Google Scholar] [CrossRef]
  4. Bandyopadhyay, A.; Sharma, S.; Nath, M.; Karmakar, A.; Kumari, K.; Sutradhar, S. Dielectric study and magnetic property analysis of Gd2O3 nanorods/nanowire in combination with Monte Carlo simulation. J. Alloys Compd. 2021, 882, 160720. [Google Scholar] [CrossRef]
  5. Michel, C.R.; López, N.L.; Martínez-Preciado, A.H. Gas sensing properties of Gd2O3 microspheres prepared in aqueous media containing pectin. Sens. Actuatuators B. 2013, 177, 390–396. [Google Scholar] [CrossRef]
  6. Ning, L.; Liao, S.; Dong, C.; Zhang, M.; Gu, W.; Liu, X. Rare earth oxide anchored platinum catalytic site coated zeolitic imidazolate frameworks toward enhancing selective hydrogenation. ACS Appl. Mater. Interfaces 2020, 12, 7198–7205. [Google Scholar] [CrossRef]
  7. Druon, F.; Velázquez, M.; Veber, P.; Janicot, S.; Viraphong, O.; Buşe, G.; Ahmed, M.A.; Graf, T.; Rytz, D.; Georges, P. Laser demonstration with highly doped Yb:Gd2O3 and Yb:Y2O3 crystals grown by an original flux method. Opt. Lett. 2013, 38, 4146–4149. [Google Scholar] [CrossRef]
  8. Kuznetsova, Y.A.; Zatsepin, A.F.; Gavrilov, N.V. The high refractive index of Gd2O3 thin films obtained by magnetron sputtering. Opt. Mater. 2021, 120, 111382. [Google Scholar] [CrossRef]
  9. Külah, E.; Marot, L.; Steiner, R.; Romanyuk, A.; Jung, T.A.; Wäckerlin, A.; Meyer, E. Surface chemistry of rare-earth oxide surfaces at ambient conditions: Reactions with water and hydrocarbons. Sci. Rep. 2017, 7, 43369. [Google Scholar] [CrossRef]
  10. Jia, G.; Liu, K.; Zheng, Y.; Song, Y.; Yang, M.; You, H. Highly uniform Gd(OH)3 and Gd2O3:Eu3+ nanotubes: Facile synthesis and luminescence properties. J. Phys. Chem. C 2009, 113, 6050–6055. [Google Scholar] [CrossRef]
  11. Jegadeesan, P.; Sen, S.; Padmaprabu, C.; Srivastava, S.K.; Das, A.; Amirthapandian, S. Morphological and optical investigations on Gd2O3 nanostructures. Inorg. Chem. Commun. 2023, 150, 110493. [Google Scholar] [CrossRef]
  12. Kang, J.G.; Min, B.K.; Sohn, Y. Synthesis and characterization of Gd(OH)3 and Gd2O3 nanorods. Ceram. Int. 2015, 41, 1243–1248. [Google Scholar] [CrossRef]
  13. Xiao, H.; Li, P.; Jia, F.; Zhang, L. General nonaqueous sol-gel synthesis of nanostructured Sm2O3, Gd2O3, Dy2O3, and Gd2O3:Eu3+ phosphor. J. Phys. Chem. C 2009, 113, 21034–21041. [Google Scholar] [CrossRef]
  14. Huang, C.C.; Liu, T.Y.; Su, C.H.; Lo, Y.W.; Chen, J.H.; Yeh, C.S. Superparamagnetic hollow and paramagnetic porous Gd2O3 particles. Chem. Mater. 2008, 20, 3840–3848. [Google Scholar] [CrossRef]
  15. Liu, Y.; Dai, Y.; Li, H.; Duosiken, D.; Tang, N.; Sun, K.; Tao, K. Revisiting the factors influencing the magnetic resonance contrast of Gd2O3 nanoparticles. Nanoscale Adv. 2022, 4, 95–101. [Google Scholar] [CrossRef]
  16. Ortega-Berlanga, B.; Betancourt-Mendiola, L.; Del Angel-Olarte, C.; Hernández-Adame, L.; Rosales-Mendoza, S.; Palestino, G. An overview of gadolinium-based oxide and oxysulfide particles: Synthesis, properties, and biomedical applications. Crystals 2021, 11, 1094. [Google Scholar] [CrossRef]
  17. Jenks, W.S. Photocatalytic reaction pathways. In Photocatalysis and Water Purification; Pichat, P., Ed.; Wiley-VCH: Weinheim, Germany, 2013; pp. 25–52. [Google Scholar] [CrossRef]
  18. Schneider, J.; Matsuoka, M.; Takeuchi, M.; Zhang, J.; Horiuchi, Y.; Anpo, M.; Bahnemann, D.W. Understanding TiO2 photocatalysis: Mechanisms and materials. Chem. Rev. 2014, 114, 9919–9986. [Google Scholar] [CrossRef]
  19. Jiang, X.; Yu, L.; Yao, C.; Zhang, F.; Zhang, J.; Li, C. Synthesis and characterization of Gd2O3 hollow microspheres using a template-directed method. Materials 2016, 9, 323. [Google Scholar] [CrossRef]
  20. Jeon, S.; Ko, J.-W.; Ko, W.-B. Synthesis of Gd2O3 nanoparticles and their photocatalytic activity for degradation of azo dyes. Catalysts 2021, 11, 742. [Google Scholar] [CrossRef]
  21. Dhanalakshmi, S.; Kumar, P.S.; Karuthapandian, S.; Muthuraj, V.; Prithivikumaran, N. Design of Gd2O3 nanorods: A challenging photocatalyst for the degradation of neurotoxicity chloramphenicol drug. J. Mater. Sci. Mater. Electron. 2019, 4, 3744–3752. [Google Scholar] [CrossRef]
  22. Eprasatya, A.; Yulizar, Y.; Yunarti, R.T.; Apriandanu, D.O.B. Fabrication of Gd2O3 nanoparticles in hexane-water system using Myristica fragrans Houtt leaves extract and their photodegradation activity of malachite green. IOP Conf. Ser. Mater. Sci. Eng. 2020, 902, 012004. [Google Scholar] [CrossRef]
  23. Xu, D.; Zhang, Y.; Zhang, D.; Yang, S. Structural, luminescence and magnetic properties of Yb3+-Er3+ codoped Gd2O3 hierarchical architectures. CrystEngComm 2015, 17, 1106–1114. [Google Scholar] [CrossRef]
  24. Guo, H.; Yang, X.; Xiao, T.; Zhang, W.; Lou, L.; Mugnier, J. Structure and optical properties of sol–gel derived Gd2O3 waveguide films. Appl. Surf. Sci. 2004, 230, 215–221. [Google Scholar] [CrossRef]
  25. Moulder, J.F.; Stickle, W.F.; Sobol, P.E.; Bomben, K.D. Handbook of X-ray Photoelectron Spectroscopy; Perkin-Elmer: Eden Prairie, MN, USA, 1992. [Google Scholar]
  26. Jeon, S.; Hwang, H. Effect of hygroscopic nature on the electrical characteristics of lanthanide oxides (Pr2O3, Sm2O3, Gd2O3 and Dy2O3). J. Appl. Phys. 2003, 93, 6393. [Google Scholar] [CrossRef]
  27. Lal, H.B.; Gaur, K.A. Electrical conduction in non-metallic rare-earth solids. J. Mater. Sci. 1988, 23, 919–923. [Google Scholar] [CrossRef]
  28. Prokofiev, A.M.; Shelykh, A.I.; Melekh, B.T. Periodicity in the band gap variation of Ln2X3 (X = O, S, Se) in the lanthanide series. J. Alloys Compd. 1996, 242, 41–44. [Google Scholar] [CrossRef]
  29. Gillen, R.; Clark, S.J.; Robertson, J. Nature of the electronic band gap in lanthanide oxides. Phys. Rev. B 2013, 87, 125116. [Google Scholar] [CrossRef]
  30. Tauc, J. Amorphous and Liquid Semiconductors; Plenum Press: New York, NY, USA, 1974; pp. 171–186. [Google Scholar] [CrossRef]
  31. Yaneva, Z.L.; Georgieva, N.V. Insights into Congo red adsorption on agro-industrial materials-spectral, equilibrium, kinetic, thermodynamic, dynamic and desorption studies. A review. Int. Rev. Chem. Eng. 2012, 4, 127–146. [Google Scholar]
  32. Bernal, S.; Blanco, G.; Gatica, J.M.; Pérez-Omil, J.A.; Pintado, J.M.; Vidal, H. Chemical Reactivity of Binary Rare Earth Oxides. In Binary Rare Earth Oxides; Adachi, G., Imanaka, N., Kang, Z.C., Eds.; Kluwer: New York, NY, USA, 2004; pp. 9–15. [Google Scholar] [CrossRef]
  33. Do, C.; Ford, B.; Lee, D.Y.; Tan, C.; Escobar, P.; Wagner, B. Gadolinium-based contrast agents: Stimulators of myelo-idinduced renal fibrosis and major metabolic disruptors. Toxicol. Appl. Pharm. 2019, 375, 32–35. [Google Scholar] [CrossRef]
  34. Malhotra, N.; Hsu, H.S.; Liang, S.T.; Jmelou, M.; Roldan, M.; Lee, J.S.; Ger, T.R.; Hsiao, C.D. An updated review of toxicity effect of the rare earth elements (REEs) on aquatic organisms. Animals 2020, 10, 1663. [Google Scholar] [CrossRef]
  35. Cottrell, T.L. The Strengths of Chemical Bonds; Butterworth: London, UK, 1958; pp. 178–238. [Google Scholar]
  36. Kerr, J.A. Bond dissociation energies by kinetic methods. Chem. Rev. 1966, 66, 465–500. [Google Scholar] [CrossRef]
  37. Liu, S.; Cai, Y.; Cai, X.; Li, H.; Zhang, F.; Mua, Q.; Liu, Y.; Wang, Y. Catalytic photodegradation of Congo red in aqueous solution by Ln(OH)3(Ln = Nd, Sm, Eu, Gd, Tb, and Dy) nanorods. Appl. Catal. A Gen. 2013, 453, 45–53. [Google Scholar] [CrossRef]
  38. Srivastava, S.; Sinha, R.; Roy, D. Toxicological effects of malachite green. Aquat. Toxicol. 2004, 66, 319–329. [Google Scholar] [CrossRef] [PubMed]
  39. La, L.B.T.; Leong, Y.K.; Watts, H.P.; Au, P.-I.; Hayward, K.J.; Zhang, L.C. A novel approach for the preparation of nanosized Gd2O3 structure: The influence of surface force on the morphology of ball milled particles. Colloids Surface. A 2016, 506, 13–19. [Google Scholar] [CrossRef]
  40. Parks, G.A. The isoelectric points of solid oxides, solid hydroxides, and aqueous hydroxo complex systems. Chem. Rev. 1965, 65, 177–198. [Google Scholar] [CrossRef]
  41. Kosmulski, M. Isoelectric points and points of zero charge of metal (hydr)oxides: 50 years after Parks’ review. Adv. Colloid Interface Sci. 2016, 238, 1–61. [Google Scholar] [CrossRef]
  42. Kosmulski, M. Chemical Properties of Material Surfaces; Marcel Dekker: New York, NY, USA, 2001. [Google Scholar] [CrossRef]
  43. Sidorowicz, A.; Giacomo Fais, G.; Desogus, F.; Loy, F.; Licheri, R.; Lai, N.; Cao, G.; Concas, A. Eco-friendly photocatalytic treatment of dyes with Ag nanoparticles obtained through sustainable process involving Spirulina platensis. Sustainability 2024, 16, 8758. [Google Scholar] [CrossRef]
  44. Nosaka, Y.; Nosaka, A. Understanding hydroxyl radical (OH) generation processes in photocatalysis. ACS Energy Lett. 2016, 1, 356–359. [Google Scholar] [CrossRef]
Figure 1. XRD pattern of the powder calcined at 600 °C, in air, and the corresponding JCPDF pattern (at the bottom) used for its identification.
Applnano 06 00001 g001
Figure 2. FTIR spectrum of Gd2O3 annealed at 600 °C.
Applnano 06 00001 g002
Figure 3. (ac) FESEM images of Gd2O3 microspheres, and (d) TEM photograph of this sample.
Applnano 06 00001 g003aApplnano 06 00001 g003b
Figure 4. XPS spectra of a Gd2O3 sample: (a) wide scan showing peaks of gadolinium, carbon, and oxygen ions; (b,c) narrow spectra of Gd 3d and 4d orbitals, respectively, and (d) O 1s spectrum.
Applnano 06 00001 g004aApplnano 06 00001 g004b
Figure 5. (a) Absorbance vs. wavelength graph and (b) Tauc graph used to determine the optical bandgap energy of Gd2O3 (Eg = ~4.8 eV).
Applnano 06 00001 g005
Figure 6. (a) Absorbance spectra collected during the photocatalytic degradation of CR in UV light; (b) degradation percentage curves obtained from photocatalysis, adsorption, and photolysis, (c,d) cycling test graphs for photocatalytic and adsorption degradation, respectively, and (e) scheme of dissociative adsorption of a CR molecule by Gd2O3.
Applnano 06 00001 g006
Figure 7. (a) UV-Vis spectra of the photocatalytic degradation of MG, and (b) degradation percentage curves.
Applnano 06 00001 g007
Figure 8. Narrow XPS profile of the O 1 s peak measured after CR degradation.
Applnano 06 00001 g008
Figure 9. FTIR spectra obtained from Gd2O3 samples before and after CR degradation.
Applnano 06 00001 g009
Table 1. Summary of synthesis methods used to prepare Gd2O3 and the resulting particle morphology.
MethodReagentsMorphology and Size T (°C)Ref.
Magnetron sputtering Metallic GdThin films 370–800 nm thick200 [5]
Magnetron sputtering Gd2O3Thin films 8–90 nm thick600 [6]
Coprecipitation Gd(NO3)3, HNO3, NaOHNanotubes of length (l)
200–300 nm,
diameter (Ø) ∼40 nm
800 [7]
HydrothermalGd(OH)3, NaOHMicrorods with
Ø = 50–300 nm
600 [8]
Sol–gel Gd(C5H7O2)3Microspheres,
Ø = 50–300 nm
500 [9]
Sol–gel GdCl3, Gd(C3H7O)3Hollow spheres,
Ø ∼20 nm
580 [10]
Sol–gelGdCl3, NH4OHNanoparticles,
l = 50–200 nm
1100 [11]
ThermolysisGdCl3, C18H34O2Nanospheres,
Ø < 20 nm
320 [12]
CoprecipitationGd(NO3)3, CH2O2Microspheres,
Ø = 0.5–7.5 μm
600 This work
Disclaimer/Publisher’s Note: The statements, opinions and data contained in all publications are solely those of the individual author(s) and contributor(s) and not of MDPI and/or the editor(s). MDPI and/or the editor(s) disclaim responsibility for any injury to people or property resulting from any ideas, methods, instructions or products referred to in the content.

