Article

Comparative Analysis of the Corrosion Behavior of Plain and Nanoporous Copper

Department of Chemistry, State University of New York at Binghamton, Binghamton, NY 13902, USA
*
Author to whom correspondence should be addressed.
Electrochem 2025, 6(1), 1; https://doi.org/10.3390/electrochem6010001
Submission received: 17 November 2024 / Revised: 4 January 2025 / Accepted: 7 January 2025 / Published: 13 January 2025

Abstract

:
This research investigates the corrosion behavior of copper (Cu) through a comprehensive analysis of both plain and nanoporous Cu thin films. A combination of weight-loss methods for quantitative analysis, along with polarization testing and scanning electron microscopy, is employed for both quantitative and qualitative assessments of Cu corrosion dynamics. The corrosion mechanisms in chloride and nitrate solutions are compared, with an additional discussion on the influence of atmospheric oxygen (O2). The results demonstrate that chloride ions and the presence of O2 create the most severe corrosion conditions, while the concentration of salts has a relatively minor effect on the corrosion behavior. Notably, the comparative study reveals that nanoporous Cu exhibits a greater corrosion tendency, as indicated by more negative corrosion potentials. However, its corrosion rates are lower than those of plain Cu, as determined by corrosion current density measurements.

1. Introduction

Copper (Cu) is one of the metals with quite common participation in our daily lives. Cu is economically suitable, environmentally benign, and readily available. It offers excellent electrical and thermal conductivities, making it widely used in industry and technology. However, owing to its relatively high corrosion rate, various studies have taken the challenge to develop approaches and techniques for Cu corrosion mitigation. Approaches to address the Cu corrosion problem include coating methods, such as coating Cu with graphene [1], poly(pyrrole-co-N-methyl pyrrole) (P(Py-co-NMPy)) [2], and others. Additionally, self-passivation approaches involve using aluminum doping to passivate Cu [3], self-assembly methods using 5-Methoxy-2-(octadecylthio)benzimidazole (MOTBI) monolayers to assemble on a fresh Cu surface [4], and many common researched approaches relying on the addition of organic compounds as inhibitors. Examples of these inhibitors include 2-mercapto-4-amino-5-nitroso-6-hydroxy pyrimidine (MAP) [5], extracellular polymeric substances (EPS) [6], potassium 4-(2H-benzo[d][1,2,3]triazol-2-yl)benzene-1,3-bis(olate) (PBTB) [7], among others.
Nanoporous materials, characterized by a large surface area to volume ratio, exhibit excellent functional and structural properties, making them a subject of widespread research attention around the globe [8,9]. Nanoporous materials have been used as alternatives to nanoparticles in many different applications, such as electrocatalysis [10,11,12], actuation [13,14], plasmonics [15,16], supercapacitance [17,18], chemical sensing [19,20] etc. However, if corrosion-related scenarios find their way to impact the nanoporous material, related deleterious effects will significantly limit its practical applications. There is a lot of information in the literature regarding corrosion research on the behavior of plain metals in different conditions and media, such as different pH levels [21], different temperatures [22], and different gas or liquid environments [23]. Additionally, there are many reports in the literature on the use of TEM and XPS for studying the corrosion behavior of nanowires and nanoparticle-shaped nanometals, especially nano-Ag [24]. However, the lack of comprehensive resources providing details and specifics of the corrosion behavior of nanoporous Cu (NP Cu) and its quantitative comparison with the corrosion of plain Cu counterparts is an undisputed fact. Therefore, research on how the NP Cu corrodes and studies of its corrosion rates in comparison with its plain metal counterparts are rather necessary.
Among the literature sources, many reported on the corrosion behavior of plain Cu in both NaCl [6] and NaNO3 [25] solutions. It is known that different anions will have different impacts on the metals’ passivity behavior and thus prompt those metals to corrode differently as well. A work published earlier classified the inorganic anions into three distinct groups [26]. The first one contains halogen ions, with good examples being solutions of NaCl, NaBr, and NaI, which make the metal dissolve and form complexes at the equilibrium stage on the metal surface. The second one contains polyatomic ions presented by solutions of Na2SO4, NaNO3, and NaClO4, which make the metal easily dissolve in the solution in the form of its free ions. The third group comprises ions like OH, CO32−, and PO43− that will react with the corroding metal to form a plain passivity layer on its surface. In this work, we performed a thorough corrosion study of NP Cu along with its plain metal counterparts in solutions containing Cl and NO3 ions, respectively, with the objective to check on how the anion affects the corrosion behavior of typical precious metal nanomaterials.
While weight loss is the most straightforward method to determine the corrosion rate, it usually requires a very long time, often as long as a few months to assess the results. Polarization tests, as one of the most commonly used means to study metals’ corrosion behavior, are very reliable, as they not only allow for determining the corrosion potential but also provide means to quantify the corrosion rate based on the current density determined at the corrosion potential [27]. Additionally, the polarization test can examine the corrosion behavior in a few hours, which will definitely save time along with measuring very low corrosion rates owing to its remarkable sensitivity [28]. In this research, we will employ both approaches to quantitatively assess the corrosion behavior of our materials, and we also employ SEM imaging to examine and characterize the morphology of NP Cu in its synthesized and corroded forms, respectively.

2. Materials and Methods

2.1. Reagents

The following chemicals were used in this work as received from vendors: copper sulfate pentahydrate (CuSO4·5H2O; Aldrich (St. Louis, MO, USA), 99.995%), copper(II) chloride (CuCl2; Aldrich, 99.999%), zinc sulfate heptahydrate (ZnSO4·7H2O; J.T. Baker (Phillipsburg, NJ, USA), 99.7%), potassium pyrophosphate (K4P2O7; Aldrich, 97%), monosodium phosphate (NaH2PO4; Aldrich, 99%), sulfuric acid (H2SO4; J.T. Baker, ACS grade), nitric acid (HNO3; VWR Chemicals (Singapore), ACS grade), perchloric acid (HClO4; GFS Chemicals (Columbus, OH, USA), 70% veritas redistilled), sodium chloride (NaCl; J.T. Baker, 99.0%), sodium nitrate (NaNO3; Fisher, 99.0%). All solutions were prepared using Barnstead Nanopure® (Thermo Fisher Scientific, Waltham, MA, USA) water (resistance of 18.2 MΩ·cm).

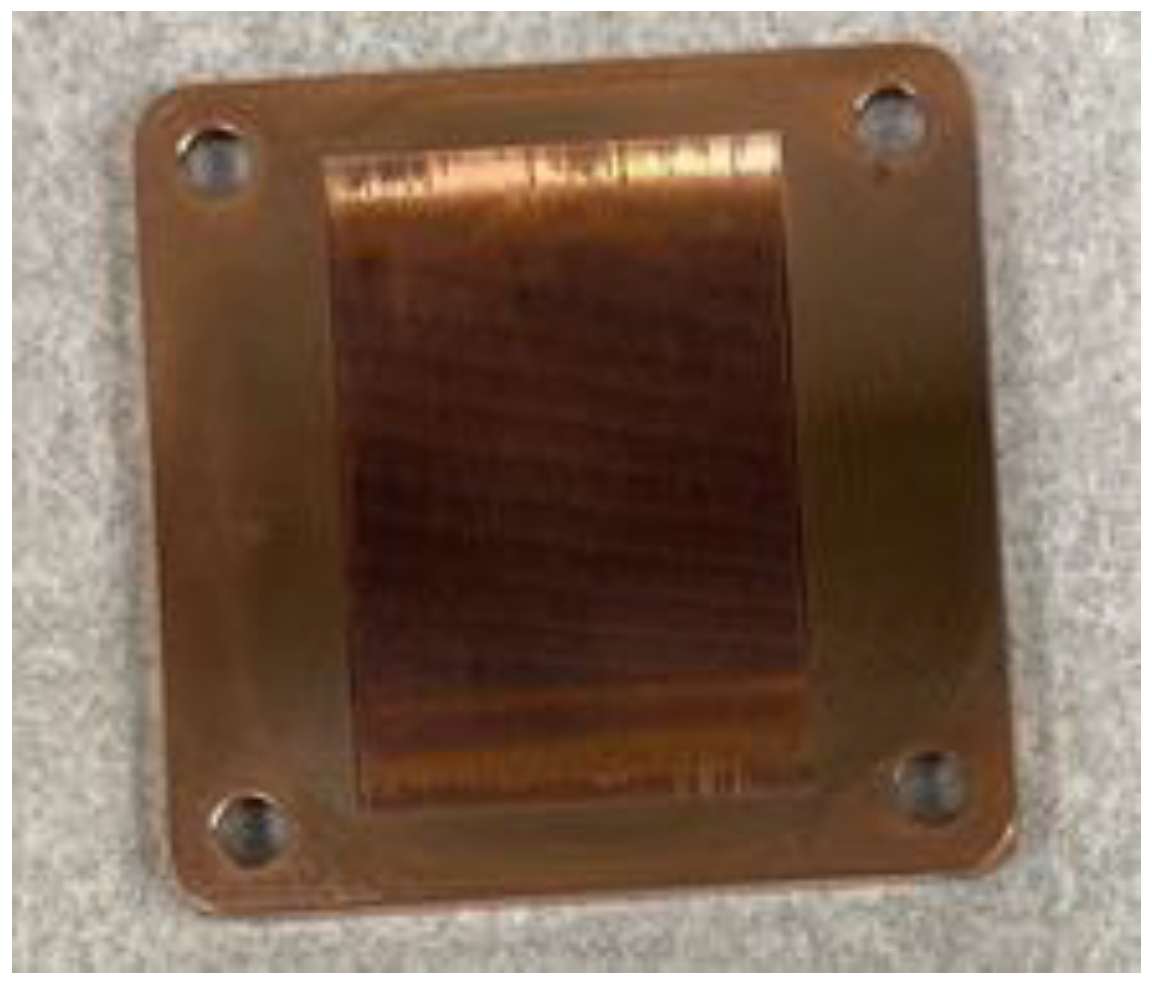
2.2. Electrode Preparation and Cell Setup

All electrochemical experiments were conducted using a three-electrode cell system, consisting of a working electrode (WE), a reference electrode (RE), and a counter electrode (CE). The WEs used included a Teflon-coated Au rotating disk electrode (RDE) with a surface area of 0.28 cm2, polycrystalline Au cylinders (0.28 cm2 surface area, 0.2 cm thick, and 0.60 cm diameter, 99.99% purity), or cylindrical Cu samples (99.99%, Advent Research Materials, Ltd., Witney, UK) with a surface area of 0.40 cm2, 0.20 cm thick, and 0.72 cm diameter, all of which facilitated the primary electrochemical reactions. All WEs were polished before use. Details of the WE polishing process can be found in our previously published paper [29]. WEs, with the exception of the RDE, were mounted on a conductive vacuum holder and brought into contact with the electrolyte using a hanging meniscus configuration that exposes to the electrolyte only the bottom face of the cylindrical samples [30]. A Hg/Hg2SO4 (saturated K2SO4) reference electrode (MSE, Pine Instruments, Grove City, PA, USA; 0.65 V vs. SHE) was used as the RE for all reactions, unless otherwise specified. The CE used was a platinum (Pt) wire, which was cleaned by briefly dipping it into heated nitric acid for a few seconds, followed by annealing with a propane torch prior to each experiment. All electrochemical experiments were controlled by a VersaSTAT3 potentiostat (Princeton Applied Research, Oak Ridge, TN, USA) in combination with VersaStudio software version 2.50.3. Further details of the setup can be found in our earlier paper [31].

2.3. Stripping Analysis

Electrochemical stripping analysis comprises two sequential stages: electrodeposition and stripping. During the deposition step, a potentiostatic technique was employed to maintain a constant reduction potential. A potential of −0.9 V was applied for the deposition step performed for 120 s in both CuCl2 solutions with various known concentrations to build a calibration curve and solutions containing corroded Cu with unknown concentrations for the real assay.
In the subsequent stripping process, a linear scanning voltammetry (LSV) technique was employed to scan the potential from a negative limit to a positive enough potential that guarantees the total stripping of the metal of interest. The potential was scanned from −0.65 V to 0 V at a scan rate of 50 mV/s. All stripping analysis processes were conducted on an Au RDE. Finally, by analyzing the charge under the stripping peak, a linear relationship between the Cu ion concentration and the stripping charge was established as the foundation of the targeted calibration curve. More details in Section 2.4.
Cu plates (purity grade 99.9%) with a surface area of 271 cm2 normally used for heat-transfer applications were employed for the corrosion rate tests [32]. The Cu plates were immersed in a beaker containing 200 mL of 3% NaCl. After a specific period, they were taken out, and the Cu concentration in the solution was tested. All corrosion testing solutions were open to the lab ambient for natural aeration. Figure 1 shows the shape and appearance of the plain Cu samples used for stripping analysis.

2.4. Establishing Calibration Curve for Stripping Analysis

Figure 2 illustrates the stripping peak for the oxidation of Cu pre-deposited on the Au RDE from various known concentrations of Cu-ion-containing solutions. The first peak is represented by Equation (1), and the second peak is represented by Equation (2) [33].
C u + C l C u C l a d s + e
C u C l a d s C u 2 + + C l a d s + e
The charge under the first peak has been used for calculation. The resulting values are employed to create a calibration curve with the concentration of Cu to establish their relationship, as depicted in Equation (3).
A n o d i c   C h a r g e   C = 0.0001534 × C o n c e n t r a t i o n   p p m

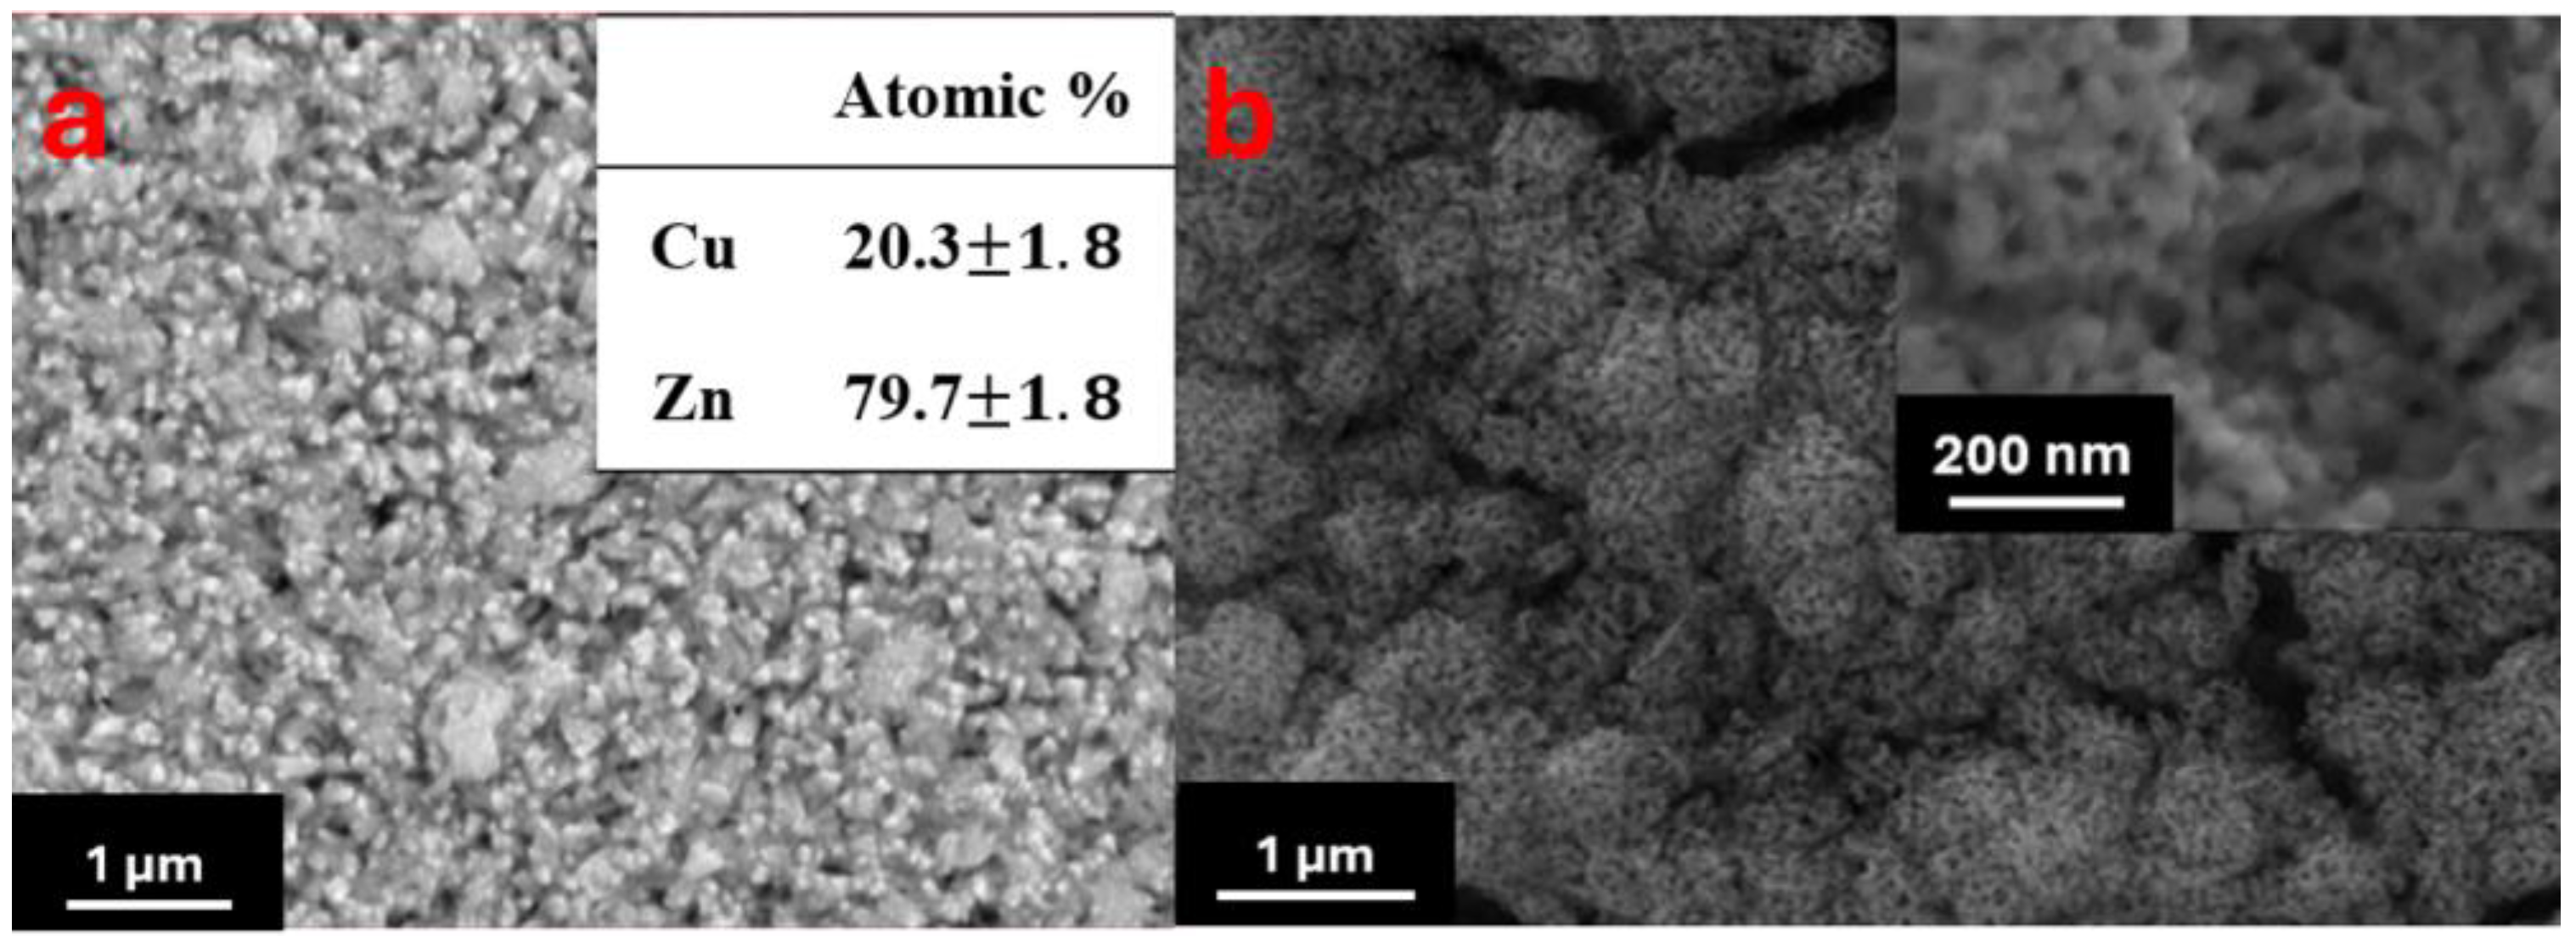
2.5. Preparation of NP Cu

For producing NP Cu, a Cu-Zn precursor alloy was first synthesized by electrodeposition on a polished Au WE in a solution containing 0.1 M K4P2O7, 7 mM NaH2PO4, 2 mM CuSO4, and 38 mM ZnSO4. Details of the WE polishing process can be found in our previously published paper [29]. The earlier introduced potentiostatic setup controlled the deposition potential at −2.0 V (vs. MSE) and stirred at 1200 rpm to deposit the CuZn alloy precursor until the targeted charge density of 1 C/cm2 was reached as detailed in our earlier paper [34]. This process was repeated five times per sample, yielding samples with sufficient thickness. LSV was then performed for the dealloying of the Cu-Zn sample, starting at −1.7 V and ending at −0.25 V with a scan rate of 1 mV/s to strip off the entire Zn content from the alloy, as described in another earlier work of our group [35]. The composition of Zn in the synthesized NP Cu has been confirmed to be less than 5 at% based on both previously published studies [34,35] and EDS test results. For further details, refer to our earlier papers [34,35].

2.6. Polarization Test

Cylindrical Cu samples (99.99%, Advent Research Materials, Ltd.) with a thickness of 2 mm and a surface area of 0.28 cm2, along with NP Cu prepared as described in the previous section, were utilized for the polarization tests. Four corrosion-testing electrolytes were used in this study: 1 wt.% NaCl, 3 wt.% NaCl, 1 wt.% NaNO3, and 3 wt.% NaNO3. The corrosion tests were conducted in two environments: one without purging (naturally aerated environment) and the other in a nitrogen (N2)-purged environment, performed for at least 15 min for de-oxygenation prior to the testing. In the first step of the polarization test, the open circuit potential (OCP) (Eoc) was measured for at least one hour (in some cases two hours) until it was stabilized. Following that, the potential was scanned from −0.25 V to +0.25 V vs. Eoc (with the range extending in some cases) at a scanning rate of ~0.17 mV/s [36]. A plot of the logarithm of the current density (log j) vs. potential (E) was generated, where j represents the current density in A/cm2, to determine the corrosion potential (Ecorr) and corrosion current (Icorr). The current was then used to calculate the corrosion rate (CR) in mils per year (mpy), where 1 mpy = 0.0254 mm per year. The CR was calculated using Equation (4), where Icorr is the corrosion current in A, K is a constant that defines the units for CR (1.29 × 10⁵ milli-inches/A-cm-year for mpy), EW is the equivalent weight in g/equivalent, d is the density in g/cm3, and A is the sample area in cm2 [37].
C o r r o s i o n   R a t e   ( C R ) = I c o r r · K · E W d · A

2.7. Characterization Techniques

Inductively coupled plasma optical emission spectroscopy (ICP-OES) using a PerkinElmer 2000 DV instrument was employed to quantitatively analyze the Cu ions dissolved in the analytes and compare the results with those obtained by stripping analysis.
Scanning Electron Microscopy (SEM), a non-destructive two-dimensional imaging technique, was employed to capture the surface morphology of the samples. The SEM used for this project was the FEG-SEM Zeiss Supra 55 VP, equipped with a top-view SE2 detector. Imaging was conducted at an accelerating voltage of 15 kV with a working distance of 5–6 mm.
Energy-dispersive X-ray spectroscopy (EDS) was employed for the quantitative analysis of the elemental composition of the samples, measuring atomic concentrations from the surface to a depth of at least 1 μm. The EDS system was integrated with an SEM, using an SE2 detector at an accelerating voltage of 15 kV and a working distance of 15 mm.

3. Results and Discussion

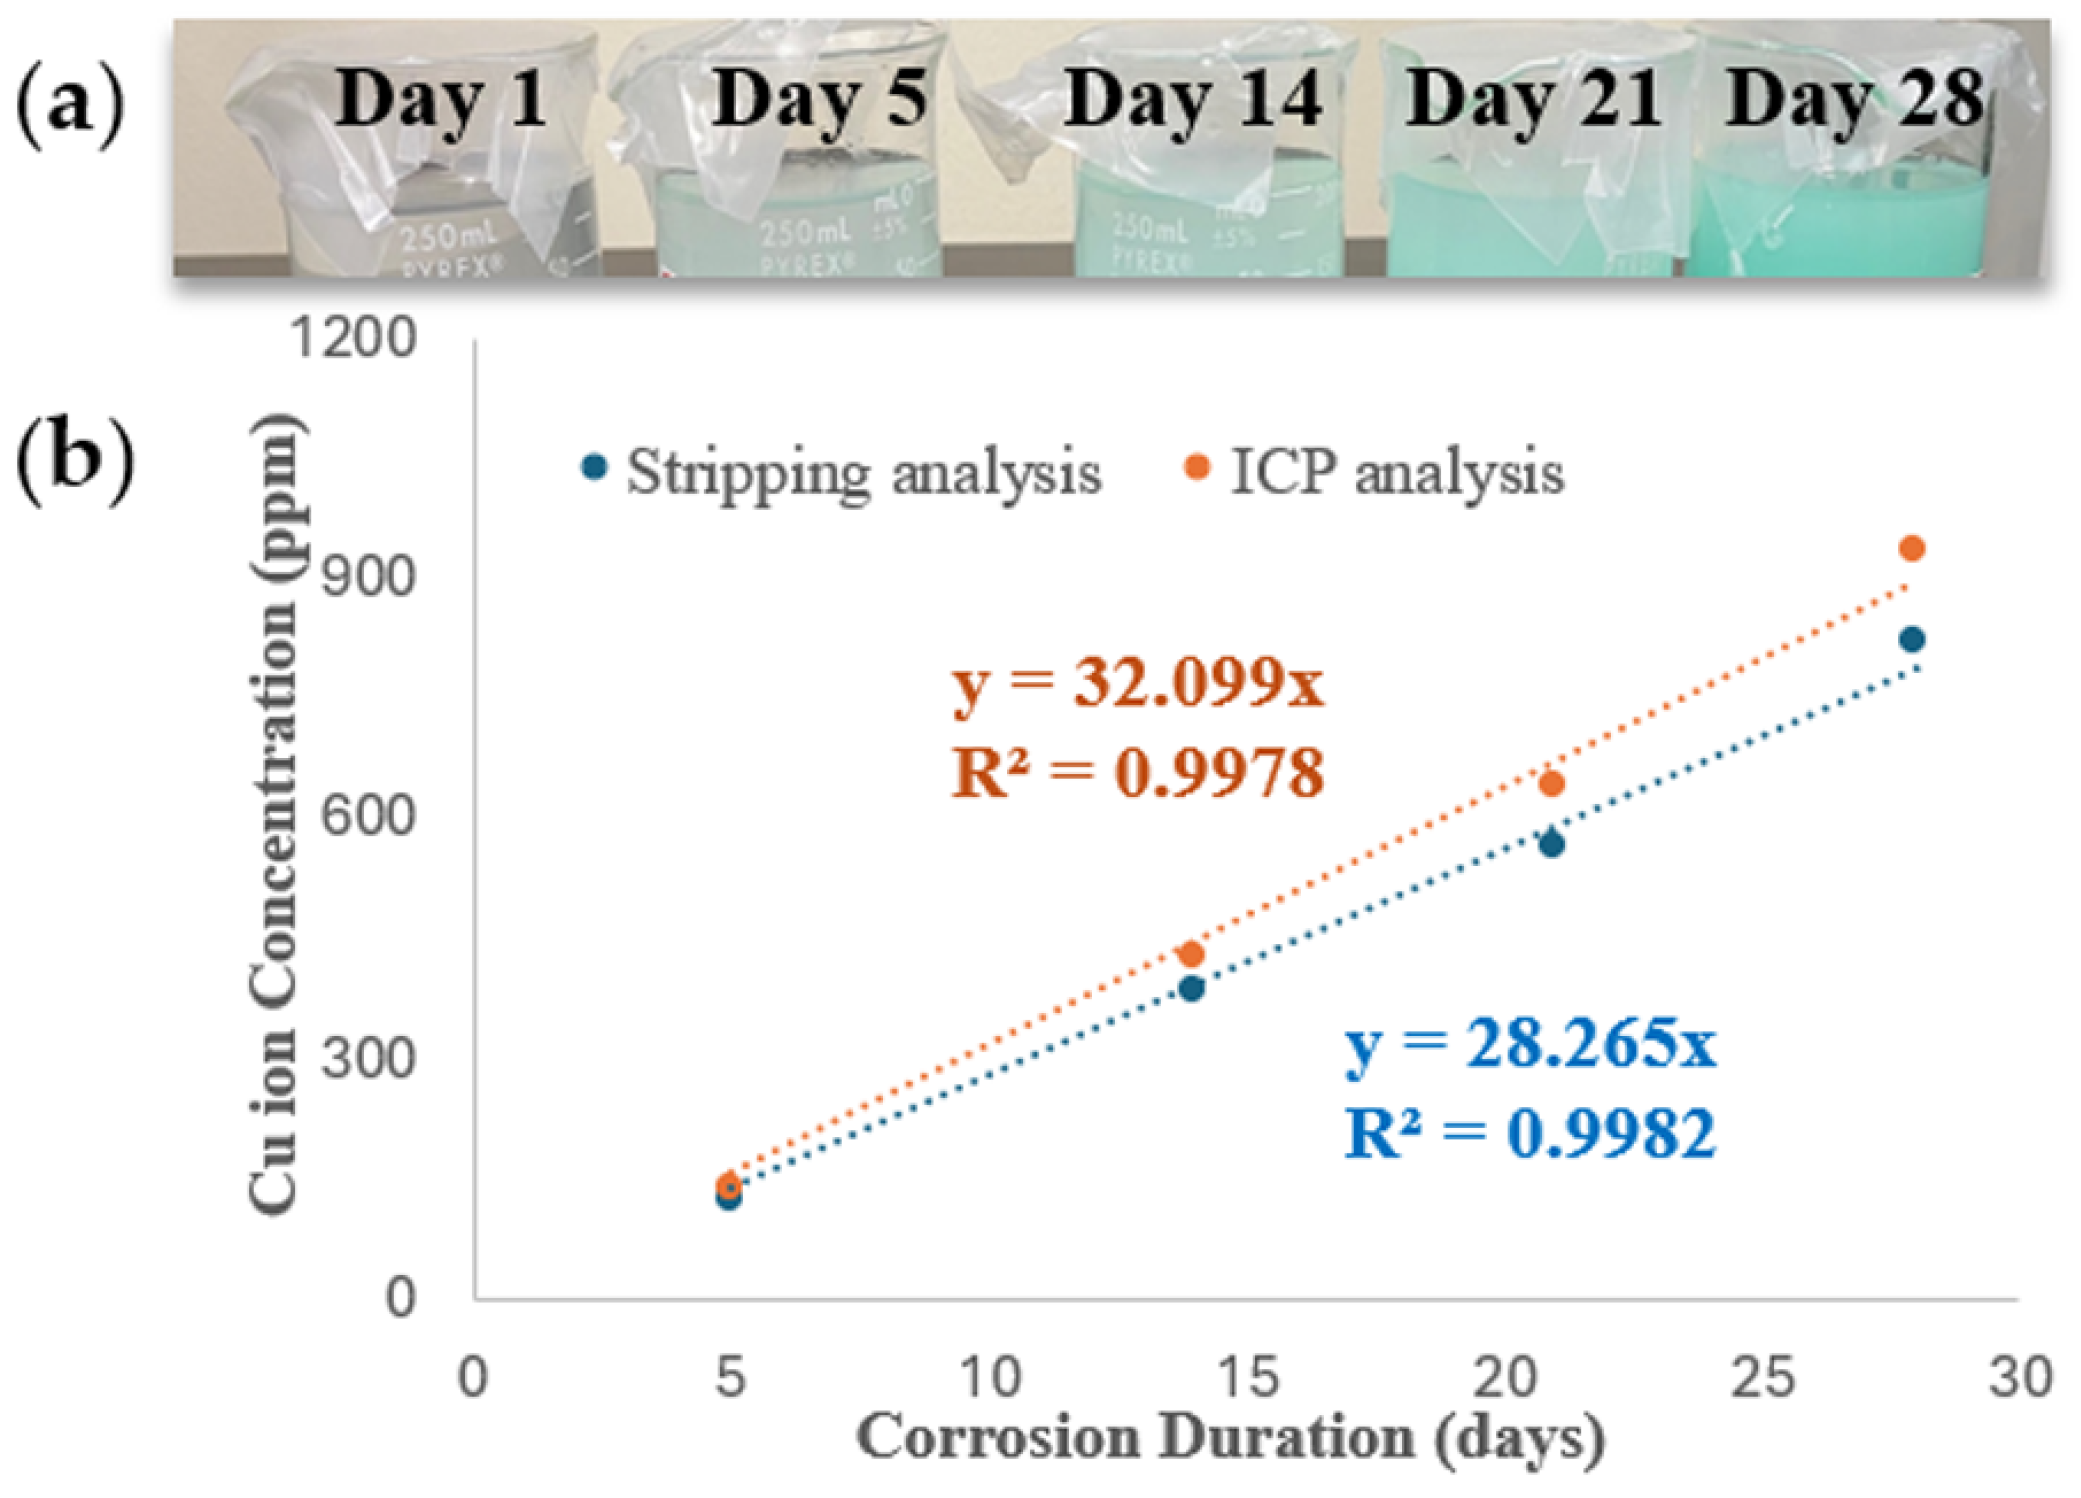
3.1. Quantitative Analysis of Plain Cu Corrosion Behavior Using Stripping Analysis and ICP-OES

In Figure 3a, the solutions are shown after specific days of immersive corrosion treatment of a Cu plate presented earlier in Figure 1. A few aliquots of solution were extracted from each beaker, diluted, and then subjected to stripping analysis to obtain the charge for the stripping peak. With the charge under the peak, the concentration of Cu ions in the original solutions that immersed the Cu plate for different days can be calculated. Finally, the relationship between corroded Cu amount and days can be determined. Besides the stripping analysis, Inductively Coupled Plasma—Optical Emission Spectrometry (ICP-OES) analysis was also performed for the unknown solution. Figure 3b presents the correlation between the concentration of Cu ions and the duration of corroded Cu over different days, and the slope will be used for calculating the CR. After data analysis, the CR for pure Cu is determined to be 0.334 mpy from the stripping analysis test and 0.380 mpy from the ICP test, demonstrating good agreement.

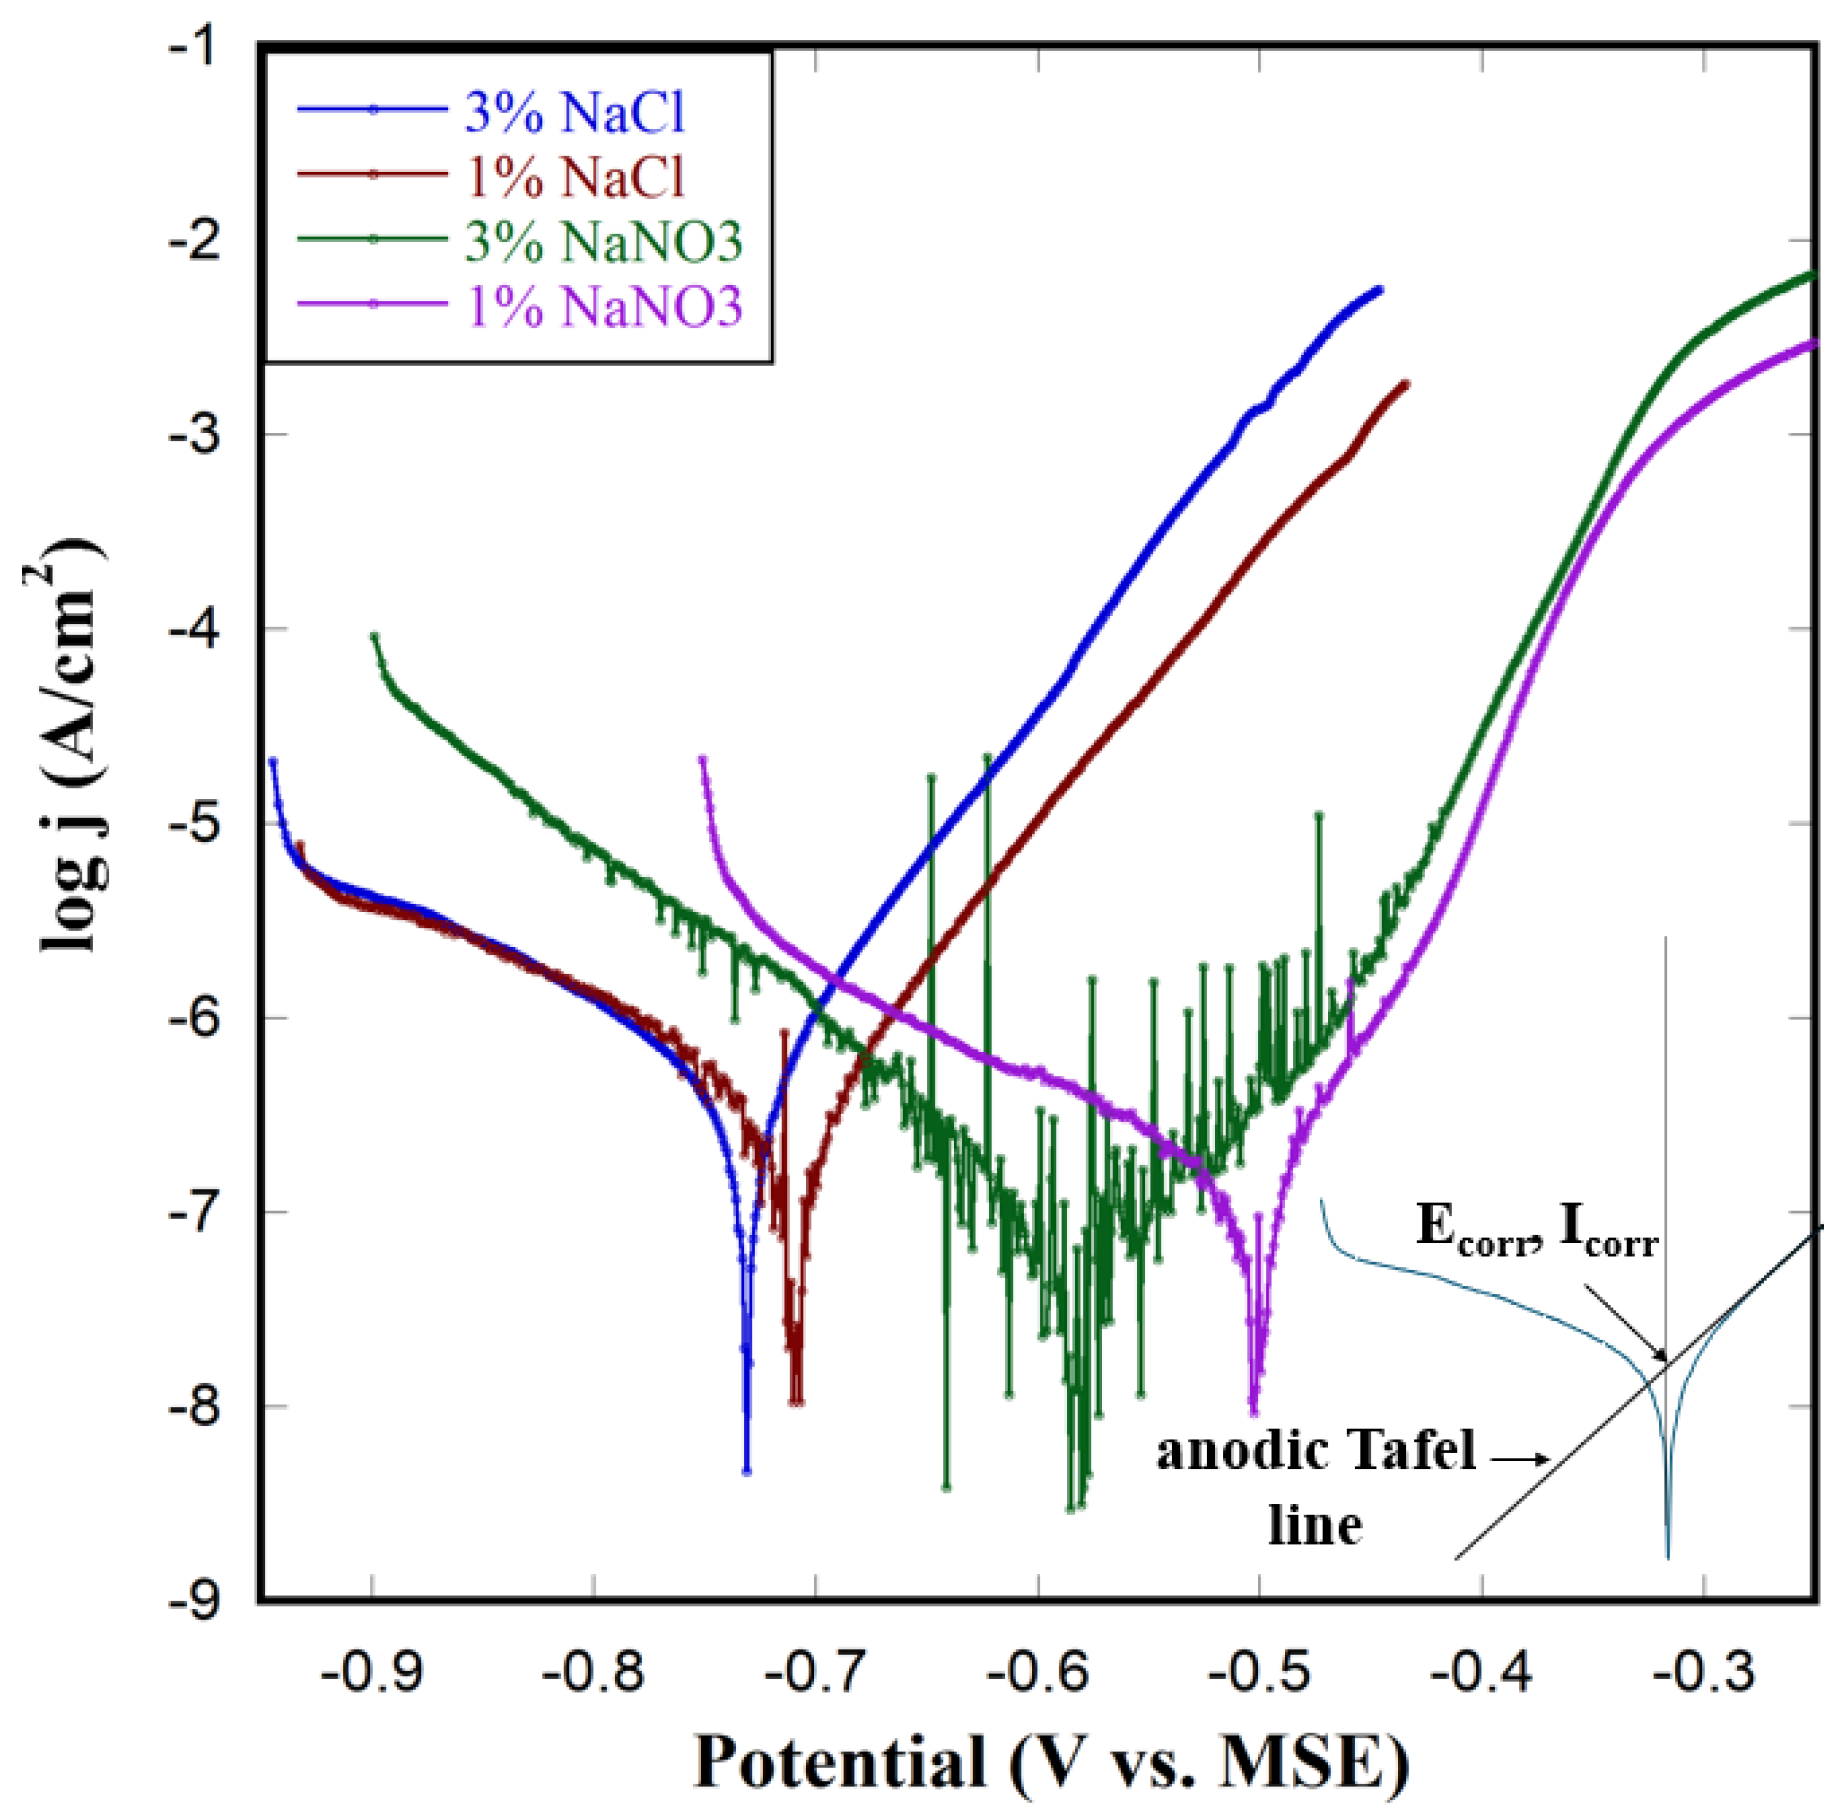
3.2. Polarization Tests on Plain Cu Within N2 Environment

Since weight loss methods require long-term testing to obtain corrosion results and provide no information about the corrosion process mechanism, we explored the use of polarization testing for the quantitative analysis of Cu corrosion behavior. During the polarization test, the process begins with the cathodic branch, where H+ ions in the solution are reduced to H2, as shown in Equation (5).
2 H + + 2 e H 2
The test then progresses to the corrosion potential, at which point the oxidation of the metal of interest commences. The corresponding reactions will be discussed later in this section [36]. The polarization test results for plain Cu corroded in different solutions in an N2-purged environment are presented in Figure 4, with the corresponding key corrosion parameters summarized in Table 1. To investigate the effects of different anions on corrosion, chloride (Cl) from NaCl and nitrate (NO3) from NaNO3 were used in the corrosion solutions. The Ecorr provides insight into the corrosion tendency of the metal in various environments under different conditions, while the Icorr directly relates to the rate of the corrosion reaction. Therefore, both Ecorr and Icorr are essential benchmarking parameters to consider when assessing the corrosion behavior of a metal in different conditions. The inserted diagram represents how to find the point to be used to illustrate the Ecorr and Icorr.
Several important conclusions can be drawn by comparing the Ecorr and Icorr at different conditions. Regarding the effect of concentration, the Ecorr shifts positively with the decrease in the salt concentration in the corrosion media, indicating that Cu is more corrosion-impacted at higher salt concentrations. Additionally, Icorr decreases with lower concentrations, concurrently meaning that higher concentrations result in faster corrosion rates. However, the shift in Ecorr is relatively small, within approximately 70 mV, and the CR increases only modestly—around 1.5 times—for a threefold increase in the salt concentration. This suggests that the concentration effect plateaus at a certain point and further. Beyond that point, higher concentrations do not lead to higher CR [38]. When comparing the Cl and NO3 ions effects on Ecorr and CR, the Ecorr values in Cl solutions are approximately 200 mV more negative, and the corrosion rates are about two times higher than those in NO3 solutions. To understand the difference in Ecorr between Cu in Cl and NO3 solutions, it is essential to consider the distinct corrosion mechanisms at play. In Cl solutions, Cu tends to adopt a +1-oxidation state, as shown in Equations (6)–(10). Specifically, Equations (6)–(9) outline two pathways where Cu reacts with Cl to form CuCl2,
  • 1st pathway
C u C u + + e
C u + + 2 C l C u C l 2
2nd pathway
C u + C l C u C l + e
C u C l + C l C u C l 2
which then leads to the formation of a Cu2O layer covering the Cu surface (as shown in Equation (10)) [6,39,40].
2 C u C l 2 + O H C u 2 O + 4 C l + H +
Conversely, in NO3 solutions, NO3 can be reduced to NO2 (Equation (11)) at potentials below 0.8 V (vs. NHE), equivalent to 0.15 V (vs. MSE). At more negative potentials, undergo further reduction to form NO or NH3, as demonstrated in Equations (12) and (13) [41,42].
N O 3 + 2 e + 2 H + H 2 O + N O 2
N O 3 + 3 e + 4 H + 2 H 2 O + N O
N O 3 + 8 e + 9 H + 3 H 2 O + N H 3
This makes Cu more likely to stabilize in the +2-oxidation state, as described in Equations (14) and (15) [25].
C u C u s u r f + + e
C u s u r f + C u s o l 2 + + e
This tendency is supported by previous research, which has successfully demonstrated Cu-containing alloys in nitrate electroreduction applications [43]. A published paper further supports this mechanism, stating that in NaNO3, Cu corrosion leads initially to the formation of Cu(I) oxide films, which subsequently transform into Cu(II) oxide films at higher potentials [25]. From the Pourbaix diagram, which maps the passivation zones of Cu species, the formation potential of Cu in the +1 state is more negative than that of Cu in the +2 state [44]. This observation explains why Ecorr is more negative for Cu in NaCl than in NaNO3. Additionally, the highly aggressive Cl ions adsorb onto the Cu surface, transforming slightly soluble Cu oxides into more soluble CuCl or CuCl2. This, in turn, increases the ease and rate of Cu dissolution, which accounts for the higher CR of Cu in NaCl solutions [45].
In addition, the polarization curve of Cu in 3% NaNO3 exhibits significant current oscillations, which we hypothesize to result from changes in the Cu oxidation state [25,43]. These oscillations are less pronounced at more negative potentials but become prominent near the corrosion potential. As previously mentioned, Cu initially tends to form Cu+, which can be further oxidized to Cu2+ under the influence of NO3. A similar oscillation phenomenon is observed for Cu in 1% NaNO3; however, due to the lower concentration of the electrolyte, the effect is less significant. Interestingly, these oscillations are absent in experiments conducted without N2 purging. This absence is attributed to the presence of oxygen (O2) in the non-purged solution, which facilitates the formation of a passive film on Cu, as evidenced by the decrease in current density in the anodic polarization region. This behavior will be discussed in greater detail in the next section. In the case of NP Cu, the oscillation phenomenon is less significant, likely due to the unique interpenetrating solid-void structure of NP Cu. These structural features distribute the electrochemical activity across multiple active sites, thereby reducing the overall effect of oscillations.

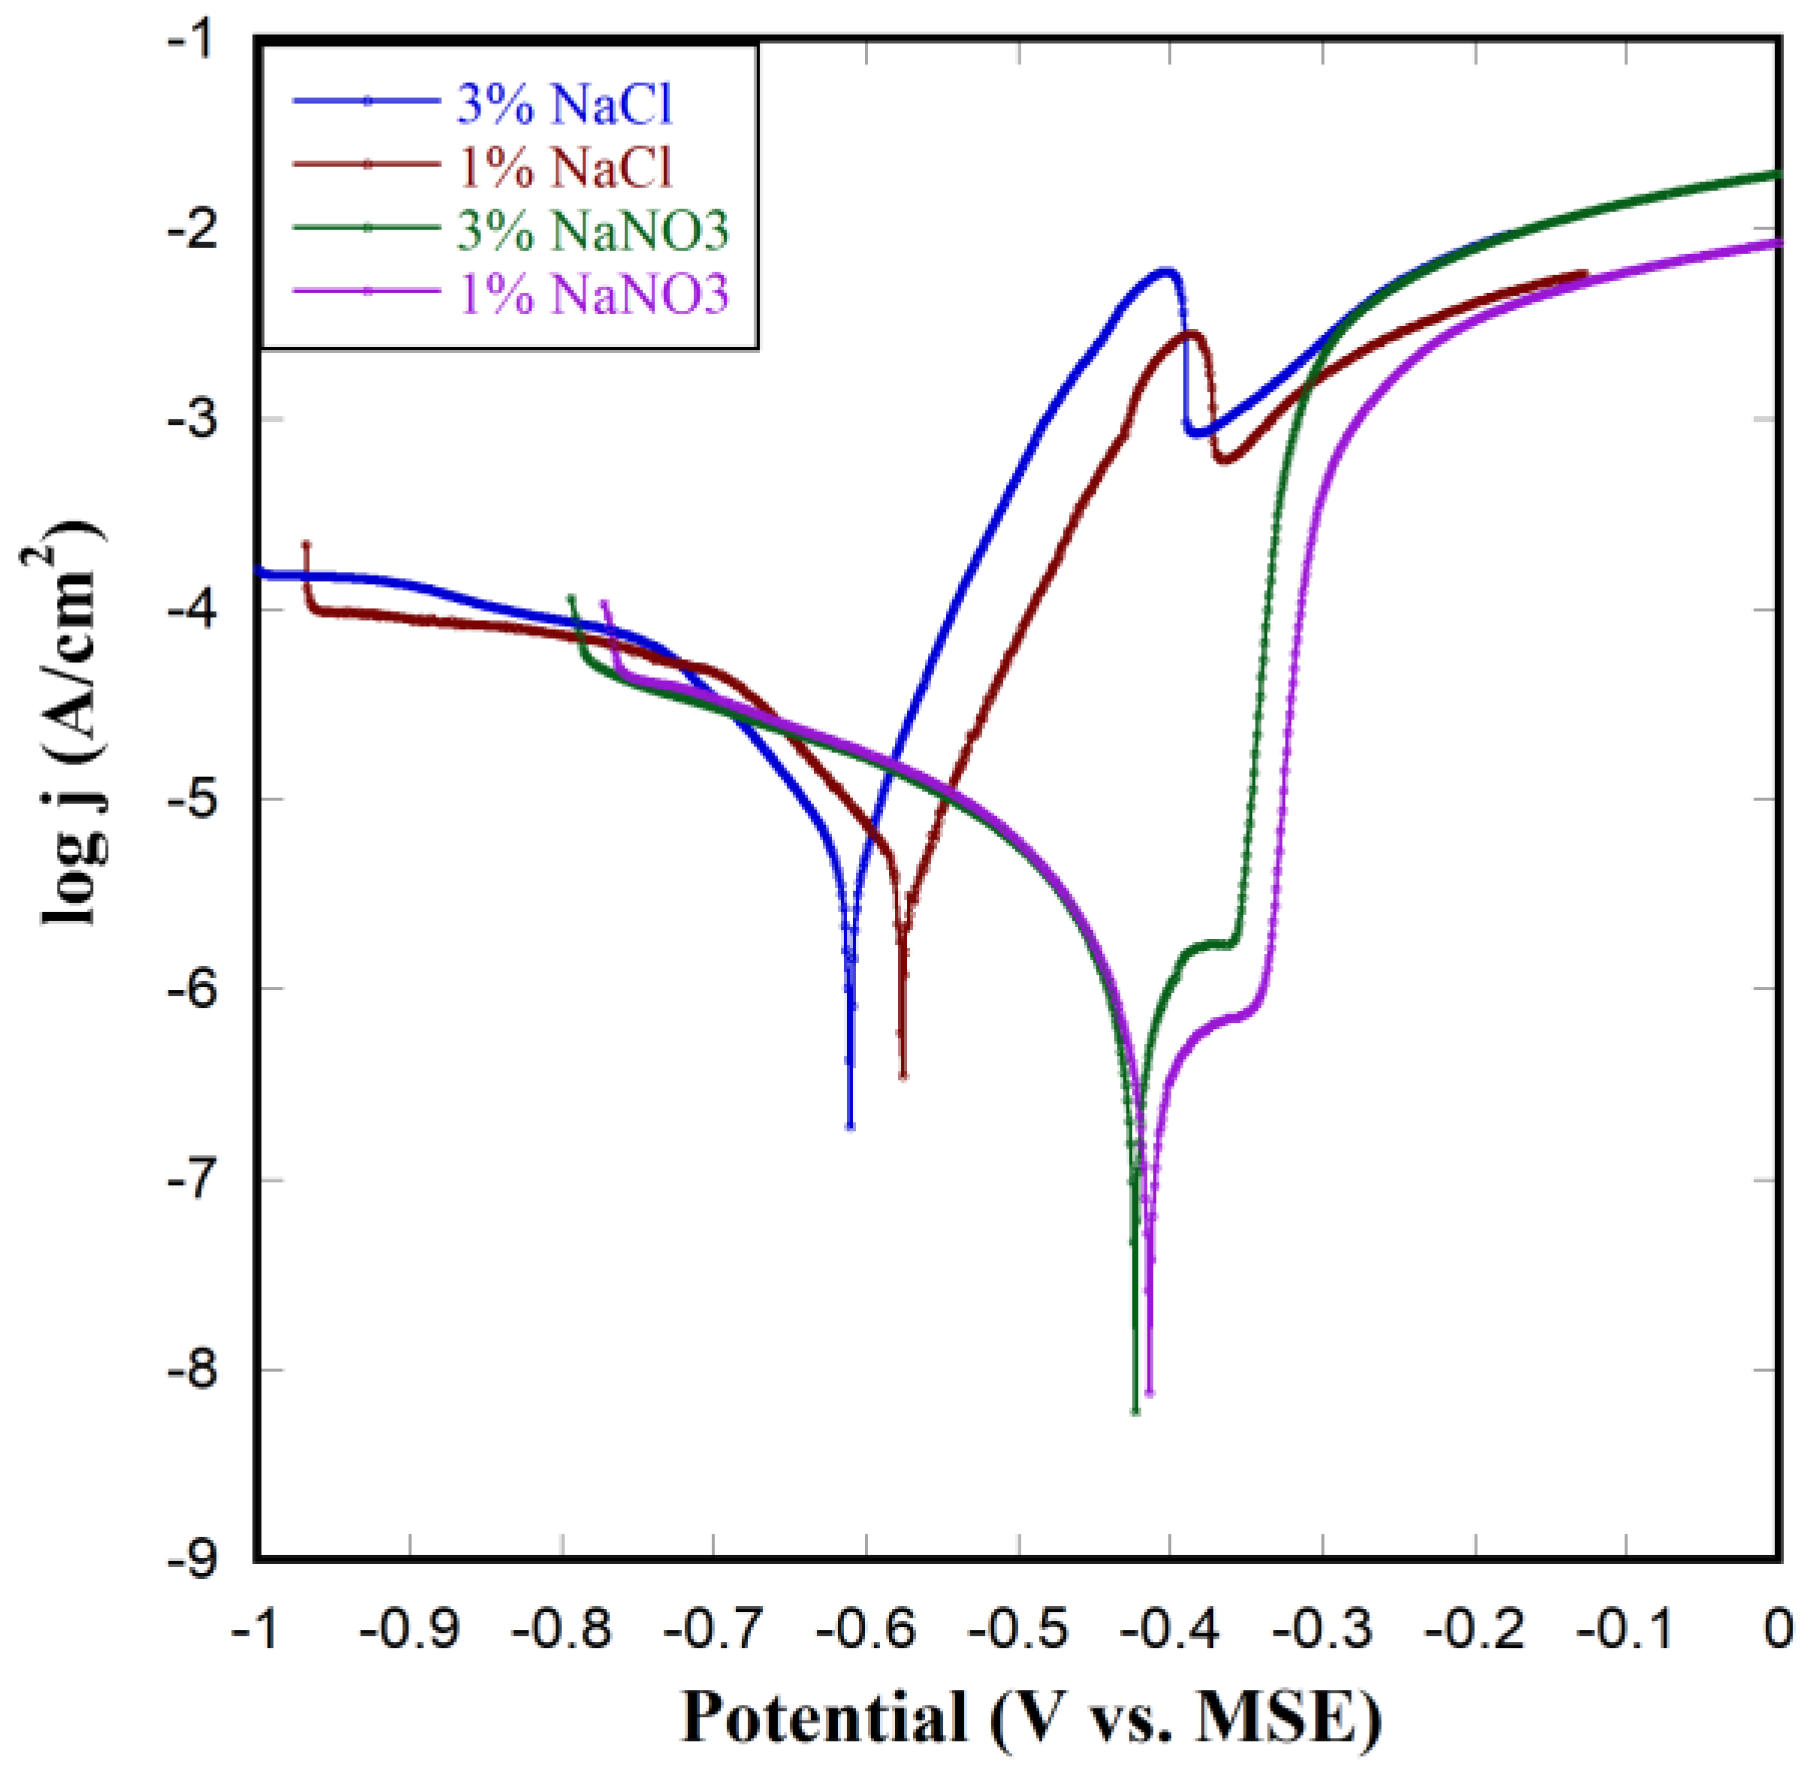
3.3. Polarization Test on Plain Cu Within Air Environment

In addition to testing the corrosion behavior in an N2-purged environment, we also aimed to evaluate the corrosion impact in the presence of O2. To perform this, we conducted the same set of corrosion tests on plain Cu in identical solutions, but without N2 purging, allowing the system to remain in ambient air. The polarization test results are presented in Figure 5, with the corresponding key corrosion parameters summarized in Table 2. The results followed a similar trend as the N2-purged environment: lower salt concentrations resulted in more positive Ecorr, though the difference was limited to around 40 mV, and the CR between solutions of different concentrations remained very similar. Once again, Cl ions were found to create a much more aggressive corrosion environment compared to NO3, with Ecorr values being approximately 200 mV more negative and corrosion rates about an order of magnitude faster in Cl ion solutions. The greater increase in the CR in the air-exposed solution is due to the ease with which Cu oxide and hydroxide compounds form in O2-containing environments. Chloride ions can transform slightly soluble Cu hydroxide or other Cu oxides into more soluble CuCl or CuCl2, which accelerates corrosion, whereas NO3 ions lack this functionality, which leads to a more pronounced difference between the two. Another noteworthy point is the current decrease observed around −0.35 V (vs. MSE) under both conditions, which was not evident in the polarization curves obtained under N2 purging. This decrease is attributed to the formation of a passive film caused by a reaction between the Cu and O2 in the air. Following this, the current transitions into a transpassive region [46]. A similar phenomenon is also observed in the nanoporous cases, while the intricate structure of NP Cu adds complexity to the passive film formation process. Under N2 purging, however, the limited O2 availability and the more negative potentials make this effect less pronounced, which explains why it was not significant in the earlier polarization diagrams.
Additionally, when comparing the corrosion behavior in different air environments, we observed that the Ecorr values were approximately 100 mV more negative in N2-purged environments, and the CR was about 10 times lower in Cl solutions and 2 times lower in NO3 solutions. It is noteworthy that such a difference between different anions has been quantitatively highlighted previously as well. Since Ecorr reflects the potential where the rates of the cathodic and anodic reactions are equal, it is consequently clear that the metal dissolution rate equals the O2 reduction rate. As the potential shifts to more positive values, the metal dissolution rate increases. At the same time, in O2-rich environments, the O2 reduction rate increases, which would be balanced by a higher Cu oxidation rate, thus effectively resulting in a potential shift to more positive values. This result aligns with previous literature. For instance, a study by Junwei Wang et al. reports that as O2 concentration decreases, the corrosion potential shifts negatively [47]. Similarly, research by A. Ismail et al. demonstrates that in deoxygenated solutions, the open circuit potential (OCP) also shifts negatively [48]. Additionally, O2 contributes to the oxidation of Cu from a +1 to a +2 state, which further explains the positive shift in Ecorr in oxygenated environments according to the Pourbaix diagram that we discussed before [44]. The higher CR in air is due to O2 acting as a promoting factor for any metal corrosion, which in turn accelerates the metal dissolution and/or formation of oxides, which generally weakens the metal’s structure [49].
Figure 6 presents SEM images of plain Cu before and after corrosion in different solutions for 2 days under naturally aerated conditions. Figure 6a shows a flat, smooth surface with no visible particles before corrosion. In contrast, Figure 6b,c reveal significant changes in surface morphology after corrosion in NaCl and NaNO3 solutions, respectively, with uniform changes across the entire surface. In NaCl solution, irregular spherical particles (50–300 nm) appear, lacking distinct edges or corners. Meanwhile, corrosion in NaNO3 results in irregular rectangular particles with sharp edges and corners (100–800 nm). This difference is attributed to the Cl ion’s ability to dissolve oxidized Cu, which, combined with the flat and plain surface, allows the reacted Cu species to dissolve into the solution, resulting in smaller, smoother particles. In contrast, NO3 does not exhibit this behavior, leading to larger, angular particles, as the mechanism has already been discussed.

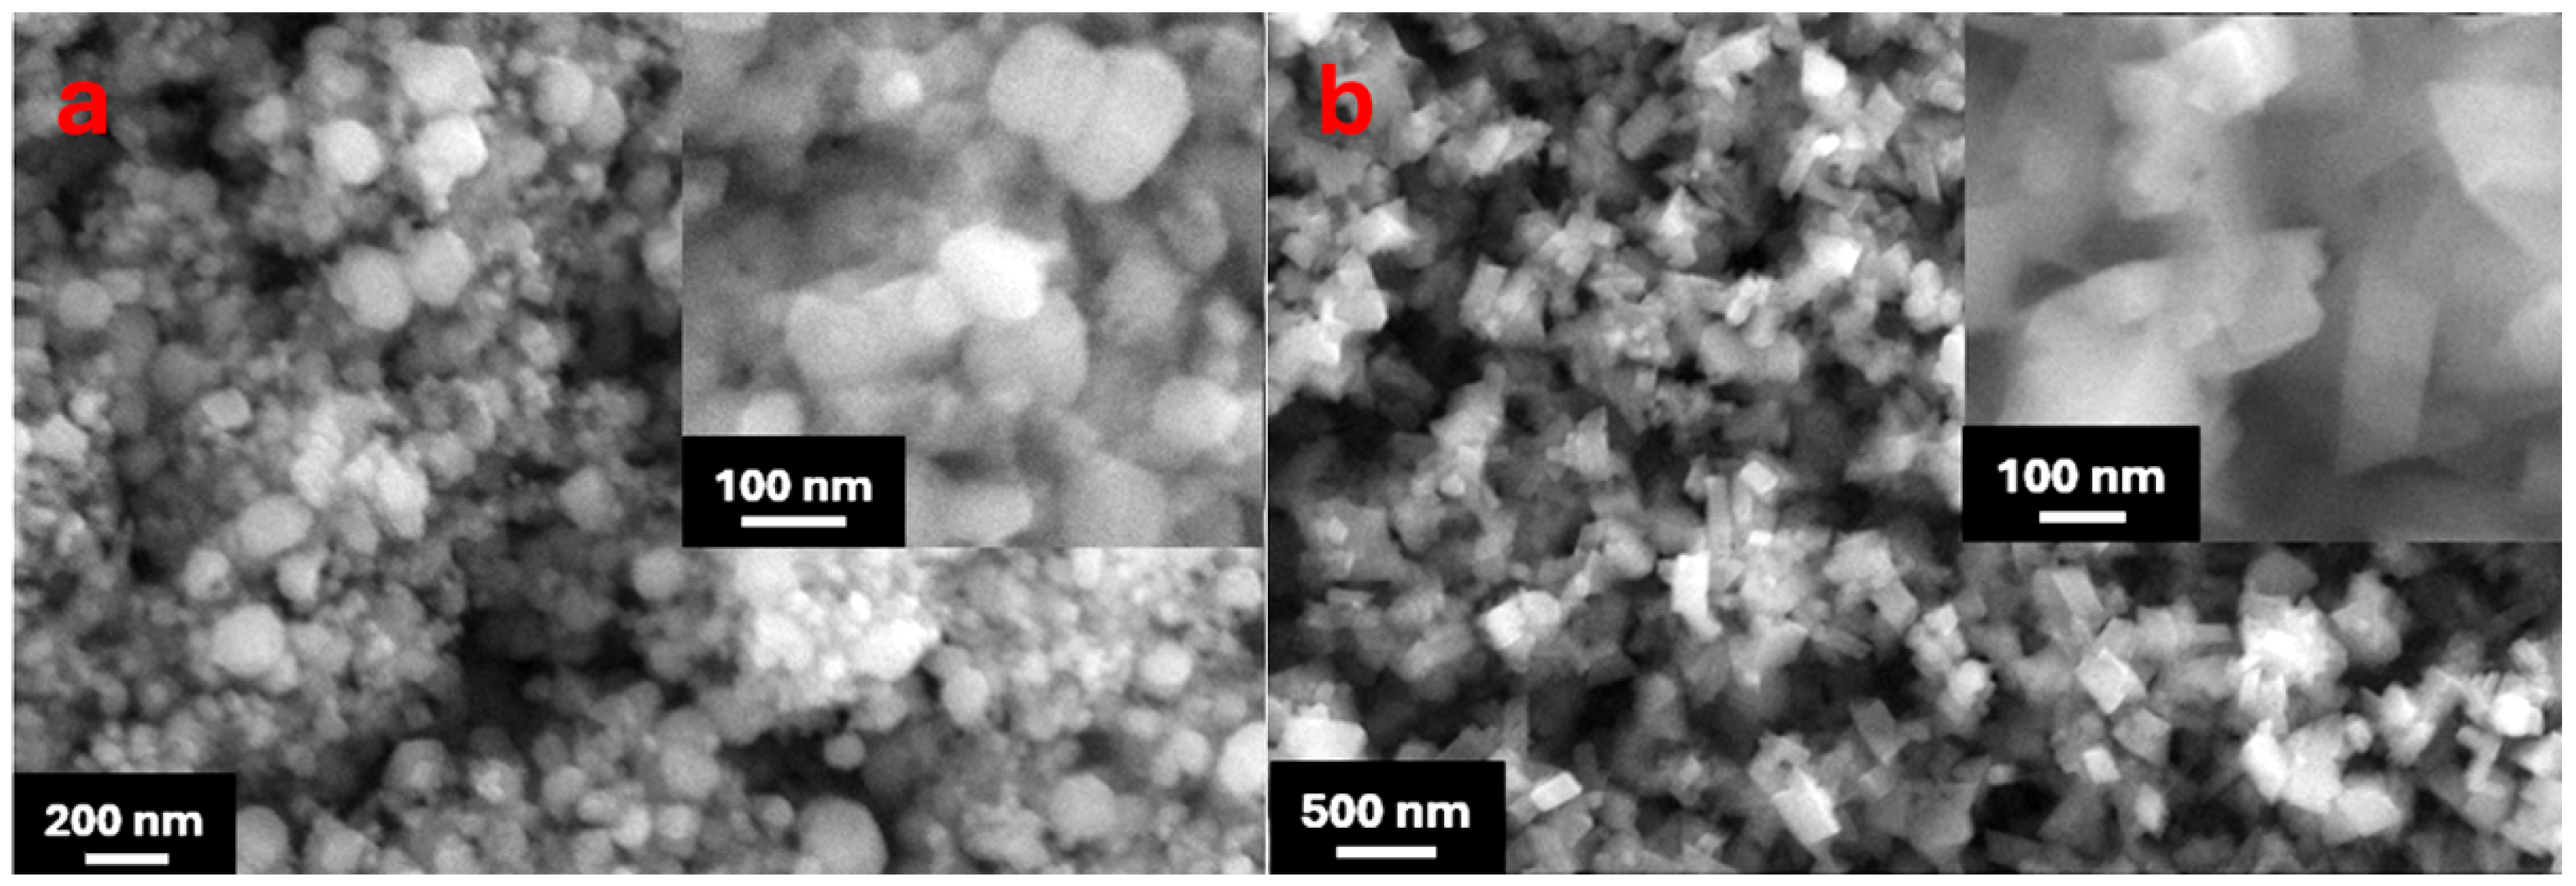
3.4. Corrosion of NP Cu in Different Solutions

Figure 7a presents the SEM image of the CuZn alloy before dealloying. The morphology exhibits a mixture of densely spherical and linear particles, with sizes ranging from 50 to 400 nm, and a relatively flat surface. This structure differs from that of the CuZn alloy reported in a previous paper from our group, where densely packed polygonal particles were formed [34]. We believe this difference arises from stirring, which alters the deposition route and prompts the structuring of the deposited metals differently. The purpose of stirring the solution is to facilitate the transport of depositing ions to the electrode and thus raise the odds of maintaining the deposition under activation control. This, in turn, is expected to keep the surface roughness under control up to sufficient sample thickness for corrosion testing and to expedite the deposition process, thereby minimizing the replacement of deposited Zn with Cu. As we maintain the deposition process at a constant overpotential, the deposition current is influenced by the stirring rate, as described by the Levich equation. The final composition ratio of Cu to Zn prior to dissolution was determined to be 1:4 from the EDS results, indicating a higher Cu concentration compared to the solution ratio of 0.5:9.5. This discrepancy is attributed to the replacement of some deposited Zn by Cu2+ ions in the solution, which we just described, given that copper is more noble. After dissolution, a typical interconnected NP Cu structure is observed, which is shown in Figure 7b, with ligament sizes ranging from 20 to 40 nm. The Zn composition was confirmed to be less than 5 at% through EDS analysis, with the remaining Zn entirely encapsulated by Cu within all ligaments of the as-prepared NP Cu structure [34]. This NP structure is sufficiently porous, and thus different from the plain Cu one, for our corrosion analysis.
Figure 8 illustrates the surface morphologies of NP Cu after corrosion in different anion solutions for two days under naturally aerated conditions. Corrosion changes are uniform across the entire NP Cu surface. Similarly to plain Cu, the images reveal that the type of anion significantly influences the morphology of the nanoporous surface structure. In NaNO3 solution, the NP Cu transforms into a spherical structure, whereas in NaCl solution, it adopts an irregular, rectangular morphology, differing from the morphologies observed for plain Cu. These differences arise from distinct corrosion mechanisms driven by the respective anions. Compared to plain Cu, the nanoporous structure provides more active surfaces for reaction, while the pores trap reaction products and hinder their diffusion. Despite these variations, both environments share a common effect: the nanoporous structure degrades, with ligament sizes coarsening and pores closing due to the formation of oxidized Cu compounds. This structural damage is more pronounced in NaNO3 solution, as NO3 lacks the capability to react with oxidized Cu and form soluble compounds. In contrast, Cl facilitates the transformation of oxidized Cu into more soluble species, such as CuClx(x−1)− or CuClx(x−2)−, mitigating the extent of structural coarsening, which is similar to what was discussed for plain Cu.

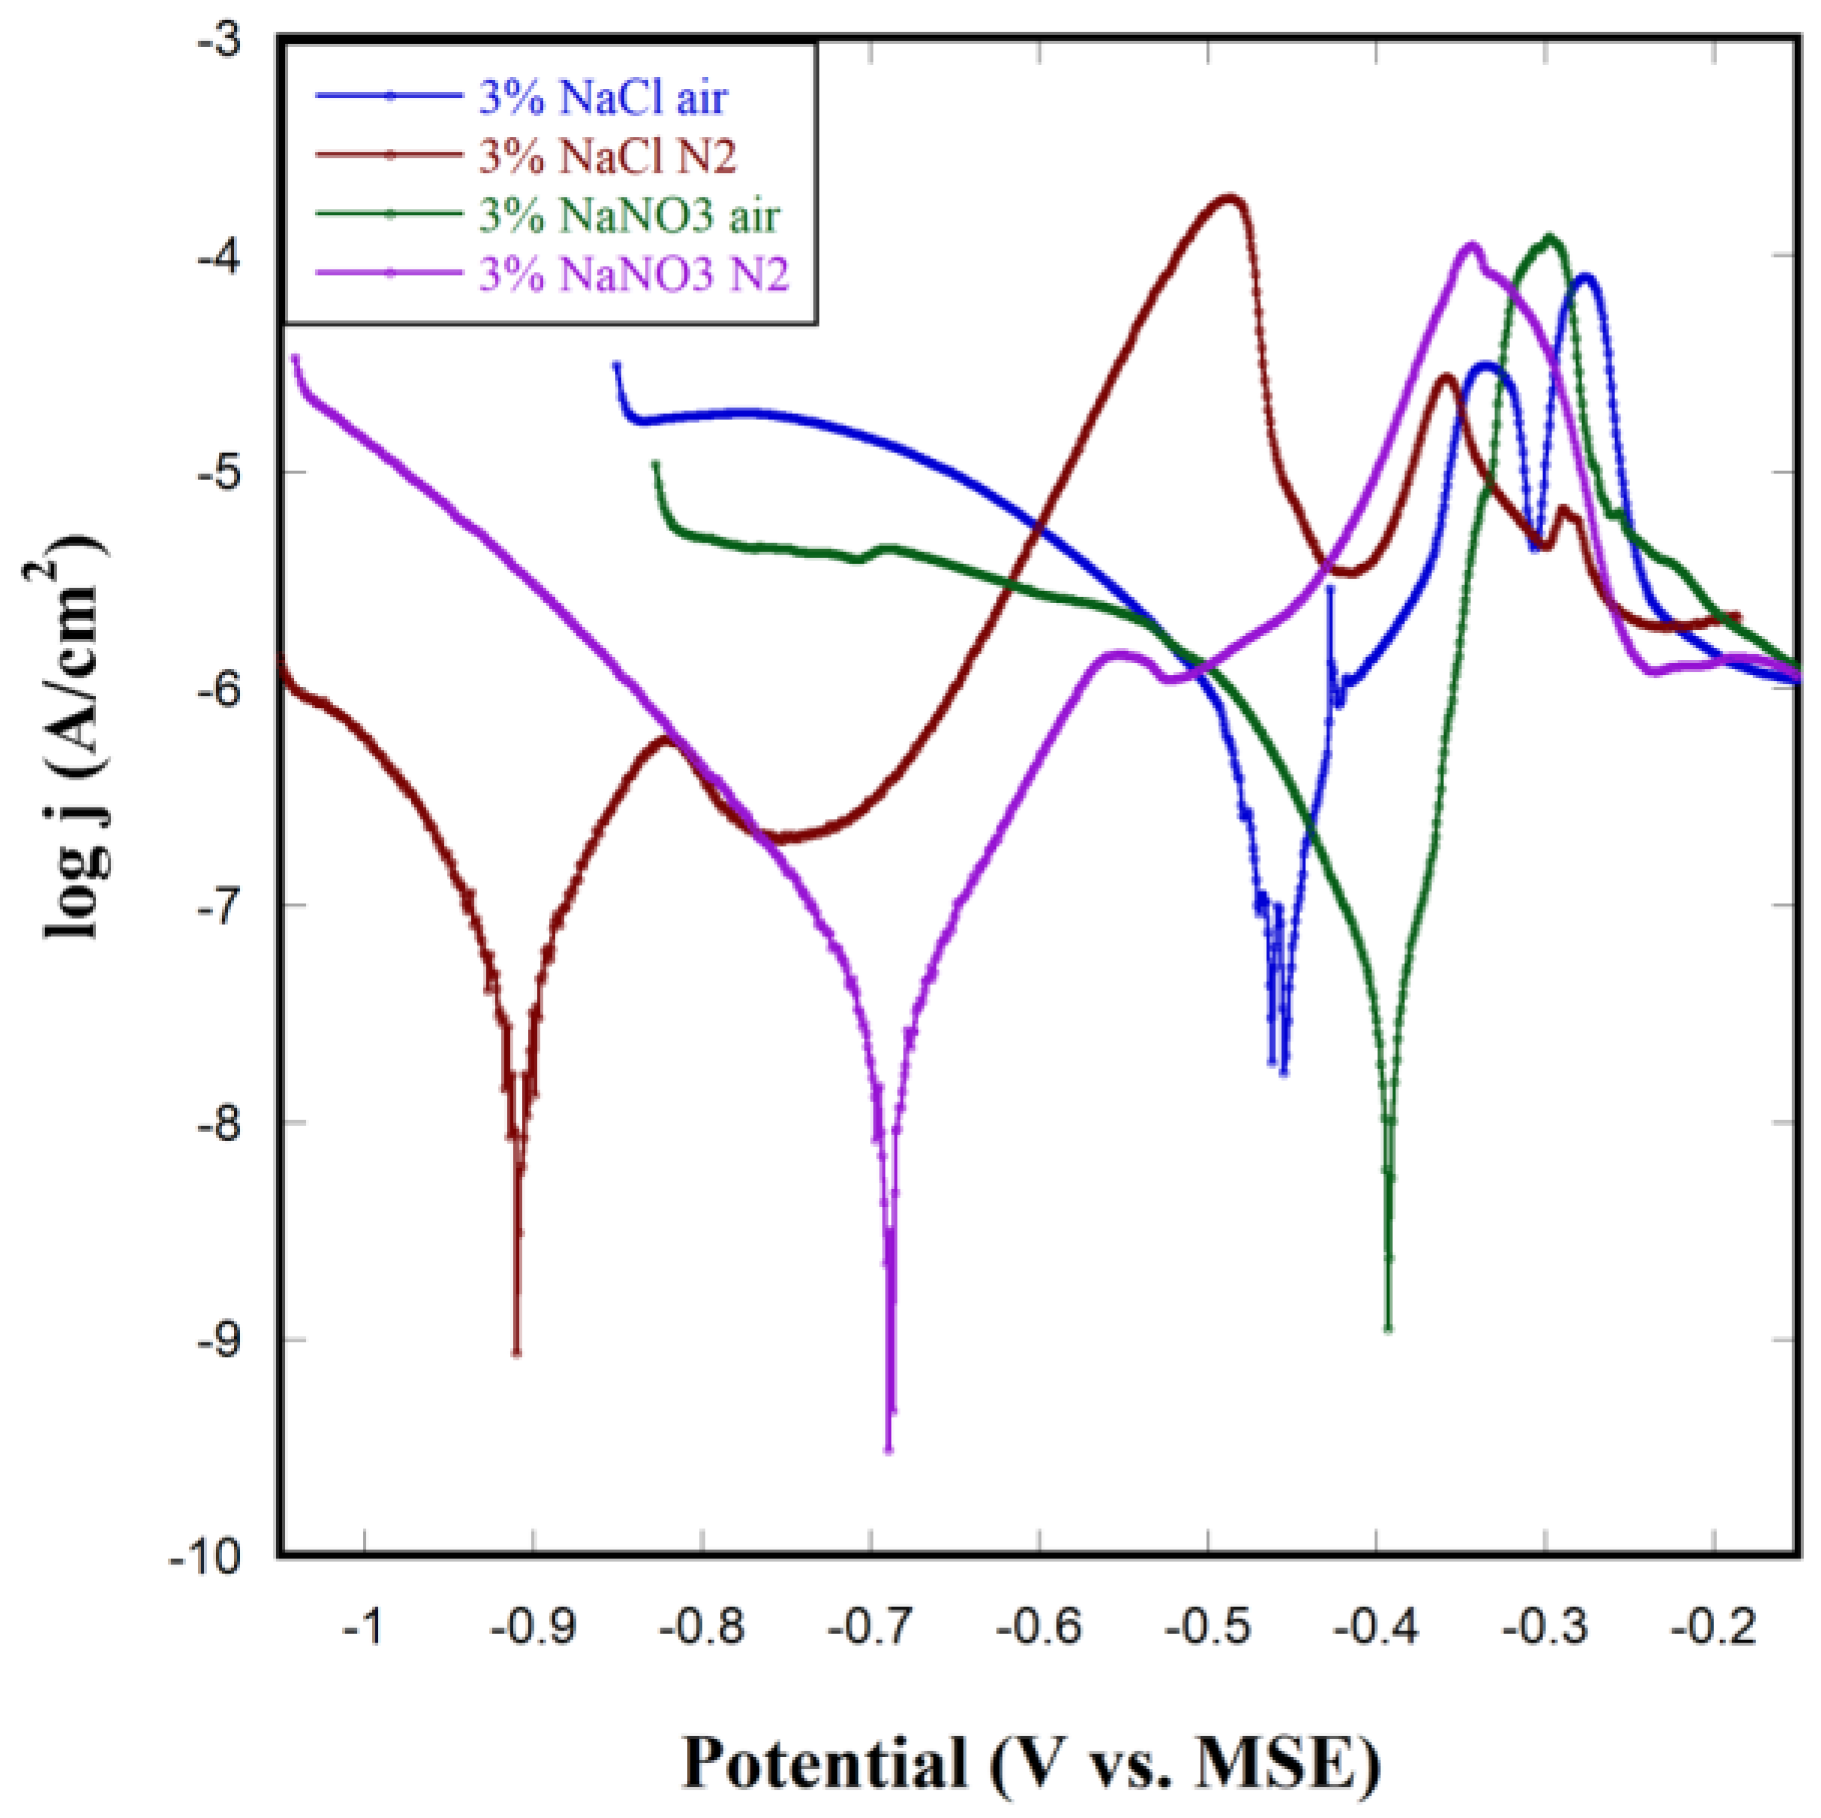
3.5. Polarization Test on NP Cu

The polarization test results for NP Cu are shown in Figure 9, with the corresponding data analyzed in Table 3. Since concentration did not significantly affect the results, a 3% concentration was selected for all salt solutions. Similar to plain Cu, the results show that Cl ions lead to more negative Ecorr values and higher CR compared to NO3 ions. Additionally, in a naturally aerated environment, the Ecorr values for NP Cu were more positive, and the CR was higher than in N2-purged conditions. This behavior aligns with that of plain Cu, where the O2 presence accelerated corrosion.
When comparing NP Cu with plain Cu, several key differences emerge. In N2-purged environments, NP Cu exhibits Ecorr values that are 100–200 mV more negative, indicating that corrosion initiation occurs more readily in NP Cu than in plain Cu when O2 is absent. Our group’s previous research showed that the dealloying potential shifts more negatively for nanoscale alloys compared to their bulk counterparts [50,51]. Since Ecorr is the point where the metal dissolution rate equals the O2 reduction rate, this shift in Cu dissolution rate pushes the Ecorr to more negative values. Additionally, a study by M. Al-Khateeb et al. [52] concluded that increased surface roughness enhances mass transfer rates in N2-purged environments, which aligns with our findings that NP Cu corrodes more easily than plain Cu in these conditions. Under naturally aerated conditions, NP Cu exhibits Ecorr values that are 30 mV more positive than those of plain Cu in NO3 solution and 160 mV more positive in Cl solution, indicating a significant dependence on the solution’s anion. To explain this difference, we should consider the distinct corrosion mechanisms of Cu in these environments. In Cl solution, Cu tends to exist in the +1 oxidation state under deoxygenated conditions. However, in an O2-rich environment, combined with the high surface activity of the nanoporous structure, O2 readily oxidizes Cu from a +1 to a +2 state. This change in oxidation state significantly alters the corrosion pathway, resulting in a much more positive Ecorr for NP Cu compared to plain Cu. In contrast, this effect is limited in NO3 solution, where Cu already favors a +2 oxidation state, making the Ecorr shift less pronounced.
When comparing the corrosion rates of NP Cu to plain Cu, NP Cu consistently showed lower CR across all conditions. J. Erlebacher et al. recently floated the idea of developing corrosion-resistant dealloyed materials [53], which in a way aligns with our findings that NP Cu exhibits lower CR compared to their plain counterparts when assessed on the basis of current density. Therefore, when factoring in the surface area enhancement of NP Cu—about 10 times greater than plain Cu—the nominal CR (based on nominal current measurements) still becomes comparable to that of plain Cu. This suggests that the CR is predominantly associated with exposed surface area, and the porous structure itself does not significantly alter the metal’s dissolution rate. Such behavior could be associated with rapid blocking of the interconnected pores in the bulk of the NP structure driven by a current oscillatory behavior demonstrated by S.G. Corcoran et al. [54] in epoxy-embedded Ag micro-wire electrodes and attributed to recurring salt film formation and its subsequent dissolution, which effectively slows down the corrosion process. This may also occur in NP Cu, with the porosity becoming covered and only the geometric surface area contributing to the corrosion process. Additionally, a paper by Qun Cao et al. [55] shows that large-scale surface roughness can lead to thin-layer electrochemical behavior, where analytes become trapped in pores, slowing the diffusion process. This aligns with our observation that NP Cu exhibits slower CR than plain Cu.

4. Conclusions

A systematic study compared the corrosion behavior of plain Cu and NP Cu using stripping analysis, ICP, and polarization tests. Polarization testing revealed that NP Cu has a higher corrosion tendency in O2-free environments, with a CR approximately 10 times slower than that of plain Cu as determined by corrosion current density measurements. Chloride ions were found to be more aggressive than nitrate ions, resulting in a more negative Ecorr and up to 10 times faster CR under identical other conditions. The salt concentration had a limited effect, while air exposure significantly accelerated CR, promoting metal oxide formation and altering Ecorr.
Future studies in this research direction will focus on other metals and their nanoporous counterparts, examining comparative trends, particularly for metals that form insoluble corrosion products in corrosive environments of interest. For instance, insoluble compounds such as AgCl, formed during Ag corrosion in NaCl environments, could influence corrosion behavior by hindering dissolution.

Author Contributions

Z.L.: conceptualization, methodology, resources, data curation, validation, investigation, visualization, writing—original draft. K.M.: data curation, validation, investigation. N.D.: conceptualization, methodology, supervision, project administration, funding acquisition, writing—review and editing. All authors have read and agreed to the published version of the manuscript.

Funding

IEEC at Binghamton University.

Institutional Review Board Statement

Not applicable.

Informed Consent Statement

Not applicable.

Data Availability Statement

Data are contained within the article.

Acknowledgments

The authors are grateful for the financial support provided by IEEC at Binghamton University.

Conflicts of Interest

The authors declare no conflicts of interest.

References

  1. Wlasny, I.; Dabrowski, P.; Rogala, M.; Pasternak, I.; Strupinski, W.; Baranowski, J.; Klusek, Z. Impact of electrolyte intercalation on the corrosion of graphene-coated copper. Corros. Sci. 2015, 92, 69–75. [Google Scholar] [CrossRef]
  2. Çakmakcı, İ.; Duran, B.; Duran, M.; Bereket, G. Experimental and theoretical studies on protective properties of poly (pyrrole-co-N-methyl pyrrole) coatings on copper in chloride media. Corros. Sci. 2013, 69, 252–261. [Google Scholar] [CrossRef]
  3. Lanzani, G.; Kangas, T.; Laasonen, K. Copper passivation by metal doping. J. Alloys Compd. 2009, 482, 33–42. [Google Scholar] [CrossRef]
  4. Rao, B.A.; Iqbal, M.Y.; Sreedhar, B. Electrochemical and surface analytical studies of the self-assembled monolayer of 5-methoxy-2-(octadecylthio) benzimidazole in corrosion protection of copper. Electrochim. Acta 2010, 55, 620–631. [Google Scholar]
  5. Khaled, K. Studies of the corrosion inhibition of copper in sodium chloride solutions using chemical and electrochemical measurements. Mater. Chem. Phys. 2011, 125, 427–433. [Google Scholar] [CrossRef]
  6. Chen, S.; Zhang, D. Study of corrosion behavior of copper in 3.5 wt.% NaCl solution containing extracellular polymeric substances of an aerotolerant sulphate-reducing bacteria. Corros. Sci. 2018, 136, 275–284. [Google Scholar] [CrossRef]
  7. Huang, H.; Wang, Z.; Gong, Y.; Gao, F.; Luo, Z.; Zhang, S.; Li, H. Water soluble corrosion inhibitors for copper in 3.5 wt% sodium chloride solution. Corros. Sci. 2017, 123, 339–350. [Google Scholar] [CrossRef]
  8. Polarz, S.; Smarsly, B. Nanoporous materials. J. Nanosci. Nanotechnol. 2002, 2, 581–612. [Google Scholar] [CrossRef]
  9. Erlebacher, J.; Aziz, M.J.; Karma, A.; Dimitrov, N.; Sieradzki, K. Evolution of nanoporosity in dealloying. Nature 2001, 410, 450–453. [Google Scholar] [CrossRef]
  10. Snyder, J.; Fujita, T.; Chen, M.; Erlebacher, J. Oxygen reduction in nanoporous metal–ionic liquid composite electrocatalysts. Nat. Mater. 2010, 9, 904–907. [Google Scholar] [CrossRef]
  11. Ding, Y.; Chen, M.; Erlebacher, J. Metallic mesoporous nanocomposites for electrocatalysis. J. Am. Chem. Soc. 2004, 126, 6876–6877. [Google Scholar] [CrossRef] [PubMed]
  12. Snyder, J.; McCue, I.; Livi, K.; Erlebacher, J. Structure/processing/properties relationships in nanoporous nanoparticles as applied to catalysis of the cathodic oxygen reduction reaction. J. Am. Chem. Soc. 2012, 134, 8633–8645. [Google Scholar] [CrossRef] [PubMed]
  13. Biener, J.; Wittstock, A.; Zepeda-Ruiz, L.; Biener, M.; Zielasek, V.; Kramer, D.; Viswanath, R.; Weissmüller, J.; Bäumer, M.; Hamza, A. Surface-chemistry-driven actuation in nanoporous gold. Nat. Mater. 2009, 8, 47–51. [Google Scholar] [CrossRef] [PubMed]
  14. Jin, H.J.; Weissmüller, J. Bulk nanoporous metal for actuation. Adv. Eng. Mater. 2010, 12, 714–723. [Google Scholar] [CrossRef]
  15. Biener, J.; Nyce, G.W.; Hodge, A.M.; Biener, M.M.; Hamza, A.V.; Maier, S.A. Nanoporous plasmonic metamaterials. Adv. Mater. 2008, 20, 1211–1217. [Google Scholar] [CrossRef]
  16. Spitzberg, J.D.; Zrehen, A.; van Kooten, X.F.; Meller, A. Plasmonic-nanopore biosensors for superior single-molecule detection. Adv. Mater. 2019, 31, 1900422. [Google Scholar] [CrossRef]
  17. An, C.; Wang, Z.; Xi, W.; Wang, K.; Liu, X.; Ding, Y. Nanoporous Cu@Cu2O hybrid arrays enable photo-assisted supercapacitor with enhanced capacities. J. Mater. Chem. A 2019, 7, 15691–15697. [Google Scholar] [CrossRef]
  18. Kondrat, S.; Perez, C.; Presser, V.; Gogotsi, Y.; Kornyshev, A. Effect of pore size and its dispersity on the energy storage in nanoporous supercapacitors. Energy Environ. Sci. 2012, 5, 6474–6479. [Google Scholar] [CrossRef]
  19. Liu, Z.; Du, J.; Qiu, C.; Huang, L.; Ma, H.; Shen, D.; Ding, Y. Electrochemical sensor for detection of p-nitrophenol based on nanoporous gold. Electrochem. Commun. 2009, 11, 1365–1368. [Google Scholar] [CrossRef]
  20. Li, Y.; Liu, Y.; Liu, J.; Liu, J.; Tang, H.; Cao, C.; Zhao, D.; Ding, Y. Molecularly imprinted polymer decorated nanoporous gold for highly selective and sensitive electrochemical sensors. Sci. Rep. 2015, 5, 7699. [Google Scholar] [CrossRef]
  21. Feng, Y.; Siow, K.-S.; Teo, W.-K.; Tan, K.-L.; Hsieh, A.-K. Corrosion mechanisms and products of copper in aqueous solutions at various pH values. Corrosion 1997, 53, 389–398. [Google Scholar] [CrossRef]
  22. Wan, Y.; Wang, X.; Sun, H.; Li, Y.; Zhang, K.; Wu, Y. Corrosion behavior of copper at elevated temperature. Int. J. Electrochem. Sci. 2012, 7, 7902–7914. [Google Scholar] [CrossRef]
  23. Abbott, W. The corrosion of copper and porous gold in flowing mixed gas environments. IEEE Trans. Compon. Hybrids Manuf. Technol. 1990, 13, 40–45. [Google Scholar] [CrossRef]
  24. Elechiguerra, J.L.; Larios-Lopez, L.; Liu, C.; Garcia-Gutierrez, D.; Camacho-Bragado, A.; Yacaman, M.J. Corrosion at the nanoscale: The case of silver nanowires and nanoparticles. Chem. Mater. 2005, 17, 6042–6052. [Google Scholar] [CrossRef]
  25. Scendo, M. Inhibition of copper corrosion in sodium nitrate solutions with nontoxic inhibitors. Corros. Sci. 2008, 50, 1584–1592. [Google Scholar] [CrossRef]
  26. Drogowska, M.; Brossard, L.; Ménard, H. Influence of anions on the passivity behavior of copper in alkaline solutions. Surf. Coat. Technol. 1988, 34, 383–400. [Google Scholar] [CrossRef]
  27. Munoz, A.I.; Espallargas, N.; Mischler, S. Tribocorrosion; Springer: Berlin/Heidelberg, Germany, 2020. [Google Scholar]
  28. Jones, D.A. Principles and prevention. Corrosion 1996, 2, 168. [Google Scholar]
  29. Lei, Z.; Borgesen, P.; Dimitrov, N. Electrodeposition Complexity and the Root Cause of Interfacial Voiding in Solder Joints with Plated Nickel. ACS Appl. Electron. Mater. 2024, 6, 457–464. [Google Scholar] [CrossRef]
  30. Herrero, E.; Clavilier, J.; Feliu, J.M.; Aldaz, A. Influence of the geometry of the hanging meniscus contact on the hydrogen oxidation reaction on a Pt (111) electrode in sulphuric acid. J. Electroanal. Chem. 1996, 410, 125–127. [Google Scholar] [CrossRef]
  31. Lei, Z.; Mull, K.; Dimitrov, N. New Electrochemical Approach for Synthesis of Nanoporous Silver. J. Electrochem. Soc. 2024, 171, 092502. [Google Scholar] [CrossRef]
  32. C110-GRADE COPPER. Available online: https://optimuspc.com/pages/materials (accessed on 4 October 2024).
  33. Shao, W.; Pattanaik, G.; Zangari, G. Influence of chloride anions on the mechanism of copper electrodeposition from acidic sulfate electrolytes. J. Electrochem. Soc. 2007, 154, D201. [Google Scholar] [CrossRef]
  34. Castillo, E.; Dimitrov, N. Electrodeposition of Zn-rich CuxZn(1−x) films with controlled composition and morphology. J. Electrochem. Soc. 2021, 168, 062513. [Google Scholar] [CrossRef]
  35. Castillo, E.; Zhang, J.; Dimitrov, N. All-electrochemical synthesis of tunable fine-structured nanoporous copper films. Mrs Bull. 2022, 47, 913–925. [Google Scholar] [CrossRef]
  36. Papavinasam, S. Electrochemical polarization techniques for corrosion monitoring. In Techniques for Corrosion Monitoring; Elsevier: Amsterdam, The Netherlands, 2021; pp. 45–77. [Google Scholar]
  37. G102-89; Astm, G. Standard Practice for Calculation of Corrosion Rates and Related Information from Electrochemical Measurements. ASTM International: West Conshohocken, PA, USA, 2004.
  38. Corrosion of Metals. Available online: https://xapps.xyleminc.com/Crest.Grindex/help/grindex/contents/Metals.htm (accessed on 23 September 2024).
  39. Kear, G.; Barker, B.; Walsh, F. Electrochemical corrosion of unalloyed copper in chloride media—A critical review. Corros. Sci. 2004, 46, 109–135. [Google Scholar] [CrossRef]
  40. Antonijević, M.M.; Milić, S.M.; Petrović, M.B. Films formed on copper surface in chloride media in the presence of azoles. Corros. Sci. 2009, 51, 1228–1237. [Google Scholar] [CrossRef]
  41. Dima, G.; De Vooys, A.; Koper, M. Electrocatalytic reduction of nitrate at low concentration on coinage and transition-metal electrodes in acid solutions. J. Electroanal. Chem. 2003, 554, 15–23. [Google Scholar] [CrossRef]
  42. Nishimura, K.; Machida, K.; Enyo, M. On-line mass spectroscopy applied to electroreduction of nitrite and nitrate ions at porous Pt electrode in sulfuric acid solutions. Electrochim. Acta 1991, 36, 877–880. [Google Scholar] [CrossRef]
  43. Xie, Y.; Dimitrov, N. Highly Active and Durable CuxAu(1–x) Ultrathin-Film Catalysts for Nitrate Electroreduction Synthesized by Surface-Limited Redox Replacement. ACS Omega 2018, 3, 17676–17686. [Google Scholar] [CrossRef]
  44. Salgado, J.A.M.; Chavarín, J.U.; Cruz, D.M. Observation of copper corrosion oxide products reduction in metallic samples by means of digital image correlation. Int. J. Electrochem. Sci. 2012, 7, 1107–1117. [Google Scholar] [CrossRef]
  45. Altun, H.; Sen, S. Studies on the influence of chloride ion concentration and pH on the corrosion and electrochemical behaviour of AZ63 magnesium alloy. Mater. Des. 2004, 25, 637–643. [Google Scholar] [CrossRef]
  46. Kearns, J.R.; Kearns, J.R.; Little, B.J. Microbiologically Influenced Corrosion Testing; ASTM International: West Conshohocken, PA, USA, 1994; Volume 1232. [Google Scholar]
  47. Wang, J.; Wen, W.; Xie, F.; Wu, B.; Yang, Y.; Cheng, J.; Zhang, S.; Zhang, X. Effects of oxygen concentration on the corrosion behavior of high entropy alloy AlCoCrFeNi in simulated deep sea. Heliyon 2024, 10, e32793. [Google Scholar] [CrossRef] [PubMed]
  48. Ismail, A.; Adan, N. Effect of oxygen concentration on corrosion rate of carbon steel in seawater. Am. J. Eng. Res. 2014, 3, 64–67. [Google Scholar]
  49. Metal Corrosion: Understanding the Causes, Effects, and Prevention. Available online: https://fakhriengineering.com/metal-corrosion-understanding-the-causes-effects-and-prevention/#:~:text=Oxygen%3A%20The%20presence%20of%20oxygen%20in%20the%20environment%2C,commonly%20known%20as%20oxidation%2C%20weakening%20the%20metal%E2%80%99s%20structure (accessed on 23 September 2024).
  50. Kamundi, M.; Bromberg, L.; Fey, E.; Mitchell, C.; Fayette, M.; Dimitrov, N. Impact of structure and composition on the dealloying of AuxAg(1–x) alloys on the nanoscale. J. Phys. Chem. C 2012, 116, 14123–14133. [Google Scholar] [CrossRef]
  51. Xia, J.; Ambrozik, S.; Crane, C.C.; Chen, J.; Dimitrov, N. Impact of structure and composition on the dealloying of CuxAu(1–x) bulk and nanoscale alloys. J. Phys. Chem. C 2016, 120, 2299–2308. [Google Scholar] [CrossRef]
  52. Al-Khateeb, M.; Barker, R.; Neville, A.; Thompson, H. The effect of surface roughness on diffusion and chemical reaction controlled limiting currents on a Rotating Cylinder Electrode in deaerated solutions with and without CO2. Corrosion 2018, 74, 971–983. [Google Scholar] [CrossRef]
  53. Erlebacher, J.; Baris, J.; Zhou, C.; Hou, S.; Wang, C.; Anber, E.; Lech, S.; Taheri, M. Dealloyed Materials for Corrosion Protection. In Proceedings of the Electrochemical Society Meeting Abstracts 244, Gothenburg, Sweden, 8–10 October 2023; p. 1277. [Google Scholar]
  54. Corcoran, S.; Sieradzki, K. Chaos during the growth of an artificial pit. J. Electrochem. Soc. 1992, 139, 1568. [Google Scholar] [CrossRef]
  55. Cao, Q.; Shao, Z.; Hensley, D.K.; Lavrik, N.V.; Venton, B.J. Influence of geometry on thin layer and diffusion processes at carbon electrodes. Langmuir 2021, 37, 2667–2676. [Google Scholar] [CrossRef]
Figure 1. Cu plate sample used for corrosion.
Electrochem 06 00001 g001
Figure 2. Stripping analysis for different concentrations of CuCl2 solution with a calibration curve inserted. The “1.0E-4” in the plot represents 1.0 × 10⁻⁴, and is applicable to all legend labels.
Electrochem 06 00001 g002
Figure 3. (a) Cu contained solution with Cu plate corroded after different days, (b) the Cu ion concentration of the solutions analyzed by two different methods.
Electrochem 06 00001 g003
Figure 4. The potentiodynamic polarization curves of plain Cu in various corrosion solutions within N2 purging, and the diagram illustrates how to extract the information of Ecorr and Icorr inserted.
Electrochem 06 00001 g004
Figure 5. The potentiodynamic polarization curves of plain Cu in various corrosion solutions without N2 purging.
Electrochem 06 00001 g005
Figure 6. SEM surface characterization of plain Cu: (a) before corrosion and after corrosion in (b) 3% NaCl and (c) NaNO3, both for 2 days. Insets of (b,c) depict a higher magnification view of surface morphology.
Electrochem 06 00001 g006
Figure 7. (a) SEM surface characterization of as-deposited CuZn alloy with their corresponding Cu and Zn ratios determined through EDS testing inserted, (b) SEM characterization of dealloyed NP Cu with an inset depicting a higher magnification view of the surface morphology.
Electrochem 06 00001 g007
Figure 8. SEM surface characterization of NP Cu corroded in (a) 3% NaNO3 and (b) 3% NaCl for 2 days, with insets depicting a higher magnification view of the surface morphology.
Electrochem 06 00001 g008
Figure 9. The potentiodynamic polarization curves of NP Cu in various corrosion conditions.
Electrochem 06 00001 g009
Table 1. Polarization results for plain Cu in various corrosion solutions within N2 purging.
SolutionsCorrosion Potential
(V vs. MSE)
Corrosion Current Density
(A/cm2)
Corrosion Rate
(×10−3 mpy)
3% NaCl−0.734.17 × 10−7381
1% NaCl−0.712.88 × 10−7263
3% NaNO3−0.572.51 × 10−7229
1% NaNO3−0.501.51 × 10−7138
Table 2. Polarization results for plain Cu in various corrosion solutions without N2 purging.
SolutionsCorrosion Potential
(V vs. MSE)
Corrosion Current Density
(A/cm2)
Corrosion Rate
(×10−3 mpy)
3% NaCl−0.624.26 × 10−63890
1% NaCl−0.573.98 × 10−63630
3% NaNO3−0.423.72 × 10−7340
1% NaNO3−0.412.24 × 10−7204
Table 3. Polarization results for NP Cu in various corrosion conditions.
NP Cu in Different ConditionsCorrosion Potential
(V vs. MSE)
Corrosion Current Density
(A/cm2)
Corrosion Rate
(×10−3 mpy)
3% NaCl N2−0.96.46 × 10−859.0
3% NaCl air−0.463.72 × 10−7340
3% NaNO3 N2−0.692.63 × 10−824.0
3% NaNO3 air−0.395.25 × 10−847.9
Disclaimer/Publisher’s Note: The statements, opinions and data contained in all publications are solely those of the individual author(s) and contributor(s) and not of MDPI and/or the editor(s). MDPI and/or the editor(s) disclaim responsibility for any injury to people or property resulting from any ideas, methods, instructions or products referred to in the content.

