Review

Wave-Induced Fatigue in Flexible Risers: State of the Art


by
Fernando Jorge Mendes de Sousa
1 and
José Renato Mendes de Sousa
2,*
1
Structures Department, Polytechnic School of UFRJ, Rio de Janeiro 21941-909, Brazil
2
Civil Engineering Program, COPPE/UFRJ, Rio de Janeiro 21941-909, Brazil
*
Author to whom correspondence should be addressed.
Appl. Mech. 2026, 7(2), 29; https://doi.org/10.3390/applmech7020029
Submission received: 21 December 2025 / Revised: 19 March 2026 / Accepted: 25 March 2026 / Published: 1 April 2026

Abstract

In recent years, the discovery of new ultra-deepwater reservoirs has significantly increased both the importance and the complexity of offshore oil production. One of the main challenges in qualifying structures to operate under such severe conditions is the fatigue limit state, particularly fatigue induced by ocean waves. Wave-induced fatigue remains, both at the design stage and during the operation of flexible risers, one of the most demanding issues for engineers responsible for ensuring their structural integrity. This study presents a state-of-the-art review of wave-induced fatigue analysis in flexible risers. It includes a brief historical overview of the problem, a summary of the fatigue assessment methodologies traditionally adopted in offshore engineering, a discussion of pioneering contributions to stress calculation, and an overview of the main research trends currently being pursued. These trends reflect emerging challenges related to fatigue life prediction, including the high computational cost of time-domain analyses, the presence of elevated contaminant levels in transported fluids, the development of new materials to reduce loads or enhance resistance to aggressive environments, and the assessment of remaining service life in the presence of damaged or corroded tensile wires. The potential use of monitored data to reduce uncertainties in numerical modelling is also addressed. Despite the challenges discussed, the main conclusion of this work is that ongoing technological developments are expected to ensure that flexible risers remain key components of offshore oil and gas production systems.

1. Introduction

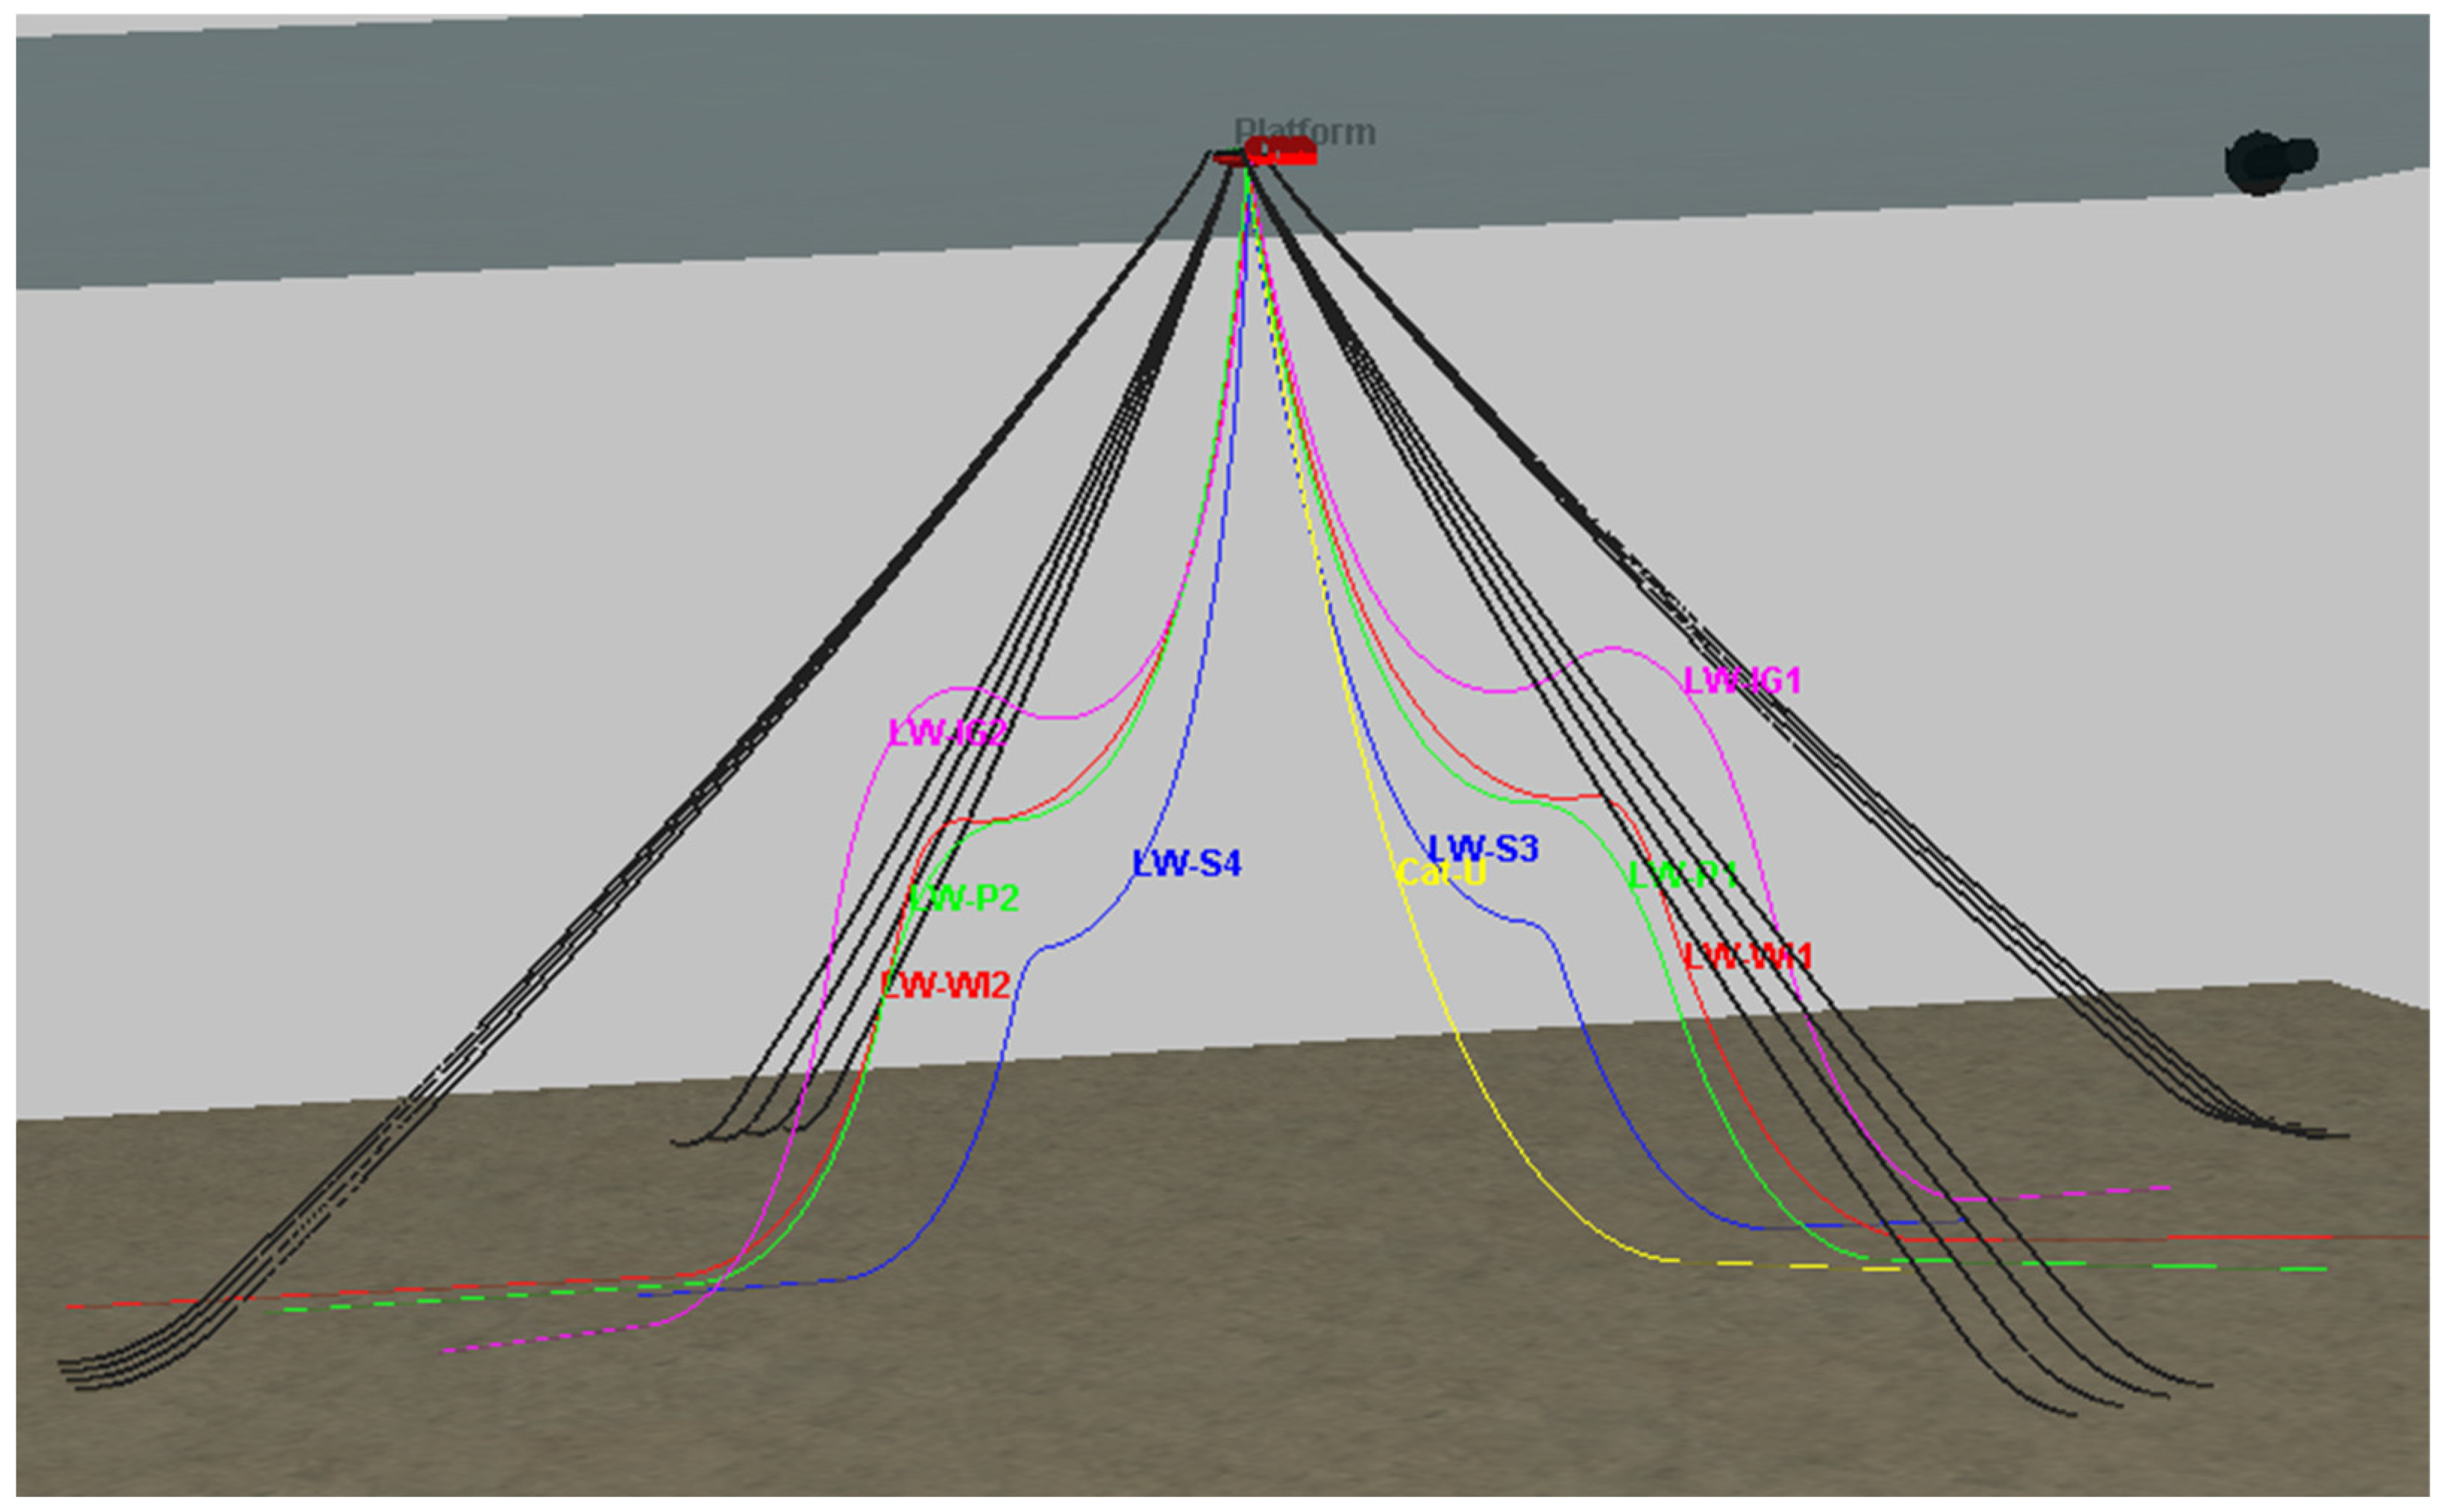
Currently, many countries worldwide, such as Brazil, Mexico, Nigeria and Norway, concentrate a significant share of their oil and gas production in offshore fields. To enable exploitation, the oil industry has systematically overcome challenges in increasingly deeper waters and harsh environments. In many of these projects, unbonded flexible pipes are key components in the oil production process. These structures are commonly used in complex offshore production systems comprising multiple risers arranged in different configurations and performing distinct functions (Figure 1).
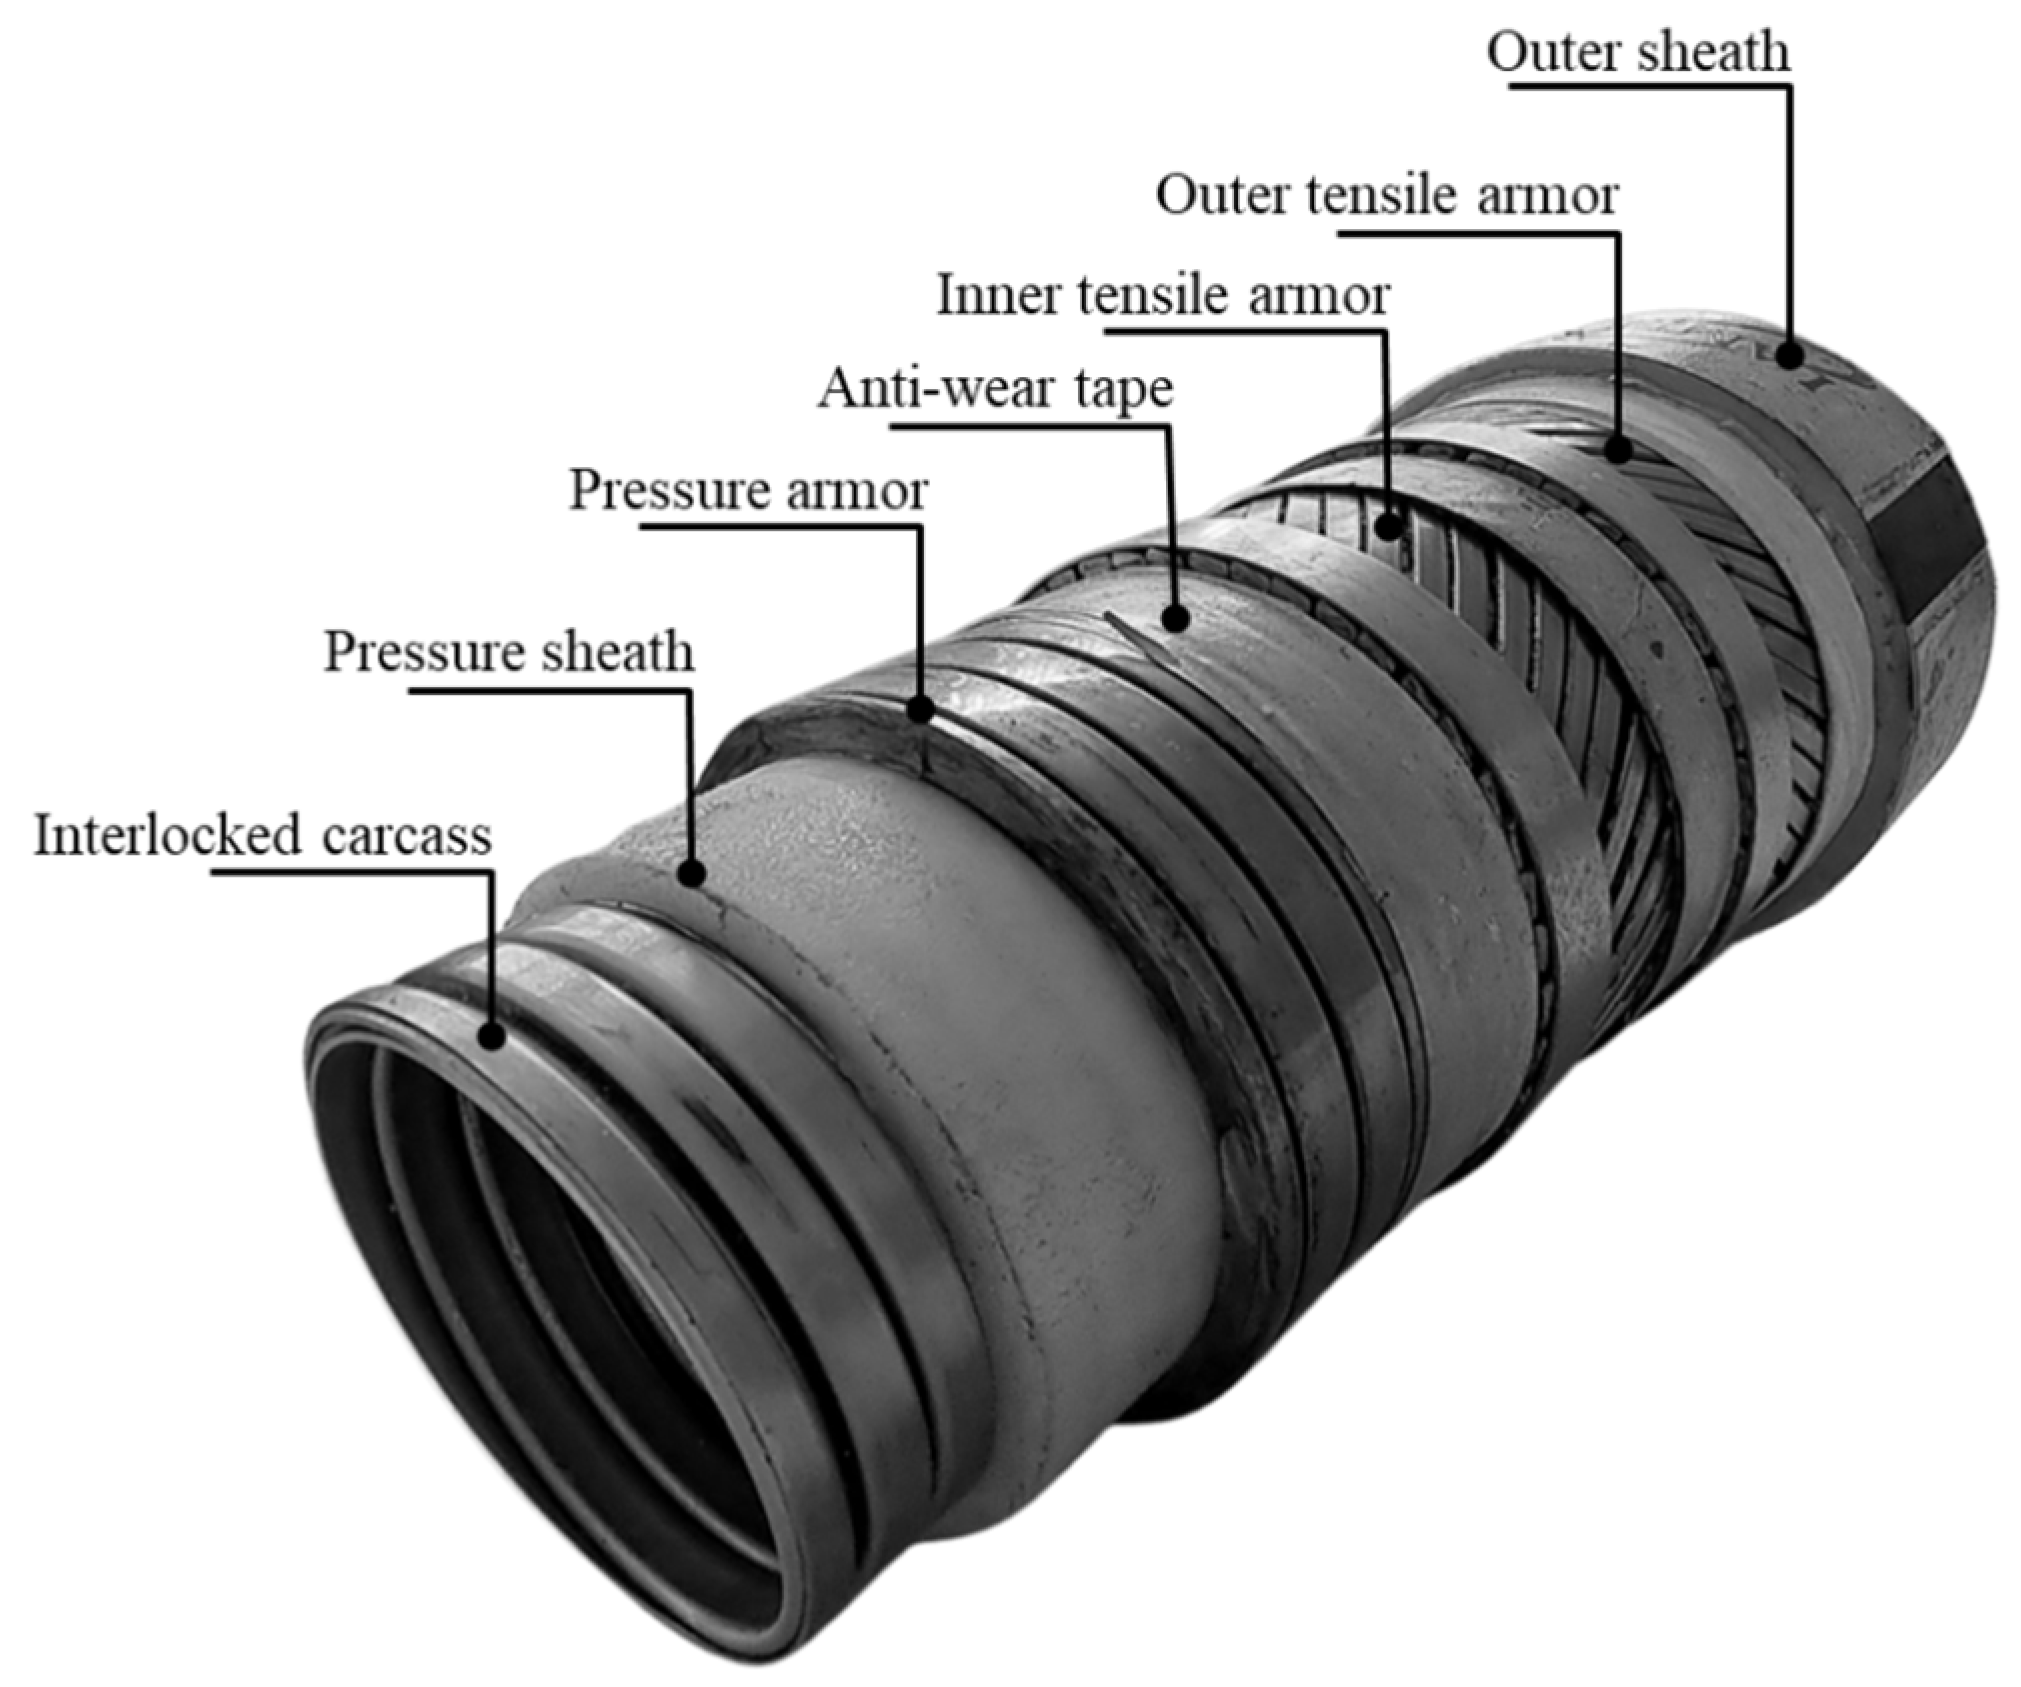
Unbonded flexible pipes are complex structures composed of multiple superimposed metallic and polymeric layers, each with specific functions, designed to transport fluids between platforms and wells [1,2] (Figure 2). The metallic layers, such as the interlocked carcass, the pressure armor, and the tensile armors, are designed to resist all mechanical loads (pressure, tension, bending, torsion). The polymeric layers, on the other hand, are primarily intended to provide leak-tightness to the pipe, preventing fluid ingress or egress, while also transmitting pressure-induced loads between the pipe’s structural layers. Examples of polymeric layers are the pressure sheath, the anti-wear tape, and the outer sheath. Materials used in these layers include, e.g., polyamide (PA), high-density polyethylene (HDPE), and polyvinylidene fluoride (PVDF). Table 1 summarizes the functions and the materials employed in the layers of these pipes.
The concept of flexible pipes was first conceived in 1942, during World War II, in the context of Operation PLUTO (PipeLine Under the Ocean [5]). However, their first applications were developed in the 1970s [6], initially in shallow waters. Since then, flexible pipes have evolved significantly, aiming to operate in increasingly deeper waters [7] and, at times, in aggressive environments [8,9].
One of the main reasons for the success of flexible pipes is their low bending-to-axial stiffness ratio, allowing them to withstand much higher curvatures than rigid pipes at the same pressure class. This characteristic makes them easier to transport and install, as they can be spooled without causing plastic deformation. To illustrate this point, a 6″ external diameter steel riser, operating at a water depth of 1000 m, requires a minimum wall thickness of 0.4″, leading to a bending-to-axial stiffness ratio of 2.5 × 10⁻³ m2. A typical 6″ flexible riser (internal diameter) for the same water depth has a bending to axial stiffness relation of 3.5 × 10⁻⁵ m2. Additionally, they can be reused, relocated, and are more adaptable to project changes.
As structures that connect platforms to wells, flexible pipes can be very long, on the order of several kilometers. Therefore, the requirements for proper operation can vary along their length [1]. Sections closer to the platforms must withstand intense dynamic loading, while sections in constant contact with the seabed must withstand high pressures and prevent heat loss to the surrounding environment, which could cause problems during a production shutdown [10].
According to these requirements, the American Petroleum Institute (API) [1,3,11] defines risers as pipes designed to withstand dynamic loads, while flowlines are suited for static loading conditions. The design of flexible risers must consider various potential failure modes; among them, fatigue is one of the most important. As oil and gas exploration expands into deeper waters, fatigue becomes critical, often more restrictive than extreme conditions, interference, and installation analysis [12].
Fatigue may be defined as a cycle-by-cycle accumulation of damage in a material undergoing fluctuating stresses and strains [13]. Any structure subjected to dynamic loads with cycles of positive stresses is susceptible to fatigue failure. Such failure usually occurs due to stress cycles that are not high enough to cause immediate rupture but, over time, can affect the riser’s structure (crack propagation) and, eventually, lead to failure.
A fatigue failure is divided into three main phases [13]: crack initiation, stable crack propagation, and fracture (unstable crack propagation). For structures in general, the duration associated with each of these phases is markedly different, with a significant portion of a structure’s service life typically consumed during the crack initiation phase. For welded materials, it is generally assumed that defects are already present in the structure, so that fatigue life is predominantly governed by the propagation phase. In the case of flexible risers, however, the S–N curves are usually associated with base materials and are obtained from experimental tests that account for, among other factors, the annulus environment.
Fatigue in risers can originate from two distinct sources. In the first, risers are directly affected by waves and ocean currents. These environmental loads also act on platforms, along with wind, causing dynamic motions that are, in turn, transmitted to the risers. Since wave loading is usually the dominant environmental factor, this is referred to as wave-induced fatigue [1]. In the second source, ocean currents can, under specific conditions, induce vortex-induced vibrations (VIV) in the risers, resulting in dynamic stress fluctuations. This type of fatigue failure is referred to as VIV-induced fatigue [14,15,16].
The evaluation of fatigue life in flexible risers presents several technical challenges, ranging from the selection and appropriate representation of sea states to the selection of S–N curves for damage assessment [17]. Hence, due to the complexity of the phenomenon and the uncertainties involved in its assessment, standards recommend the use of high safety factors, especially in regions where inspections cannot be readily performed (typical values are 3 and 10 for regions easily and not easily inspectable, respectively [4,18]). In this context, reducing conservatism is fundamental to designing optimized structures that will reduce the costs associated with their manufacturing, installation, and operation, ensuring their secure use in ultra-deepwater offshore applications.
Generally, one of the most serious consequences of fatigue failure in flexible risers is the rupture of tensile armor wires, which can lead to high torsion levels in the riser or even complete rupture [19]. Therefore, many authors have focused on evaluating and preventing fatigue in these armors [20,21,22,23].
In this way, the objective of this study is to present a literature review of fatigue analysis of tensile armor layers in flexible risers, with a focus on wave-induced fatigue. The review emphasizes recent publications but also highlights seminal works that remain highly relevant to the current state of knowledge on flexible risers. Phenomena recently related to fatigue failure, such as stress corrosion cracking by CO2 (SCC-CO2), originating from oil reservoirs containing high levels of contaminants, are also discussed.
The mathematical structures underlying wave-induced fatigue assessment workflows for flexible risers are also emphasized. The fatigue problem is interpreted as a sequence of interconnected mathematical operators acting on stochastic environmental inputs and structural response models. In this context, five fundamental pillars can be identified: (i) stochastic modelling of ocean waves through spectral representations and random processes; (ii) linear and nonlinear structural dynamics governed by differential equations and solved in the frequency or time domain; (iii) multi-scale mappings between global riser response and local cross-sectional stress states; (iv) cycle counting procedures, interpreted as nonlinear operators transforming stress time histories into damage-relevant cycle distributions; and (v) uncertainty quantification and reliability assessment, addressing variability in environmental loading, material properties, and model assumptions. By organizing the state of the art around these mathematical pillars, this review aims to clarify the theoretical foundations of wave-induced fatigue analysis, highlight the main sources of approximation and uncertainty, and identify open challenges where advanced mathematical and computational methods can contribute to improved fatigue life predictions.
Several review articles on flexible risers have been published in recent years; however, none are entirely dedicated to wave-induced fatigue. Pan et al. [17] presented a comprehensive review of fatigue in flexible risers, focusing on recent developments in global and local analyses, numerical solution methods, experimental investigations, and vortex-induced vibrations (VIV). Nevertheless, wave-induced fatigue is not treated as a central and exclusive topic, and some current trends were neglected. Liu et al. [24] discussed recent trends in the structural development of flexible risers; although fatigue is recognized as one of the primary drivers for new configurations, key aspects of fatigue life assessment are not examined in detail. Similar observations apply to the work of Li et al. [25], which focuses on predicting collapse pressure, and to Drummond et al. [19], whose focus is the analysis of failures in flexible risers. Therefore, a review specifically devoted to wave-induced fatigue can provide valuable support for engineers and researchers seeking a comprehensive understanding of this phenomenon.
From this point, the text is organized into three main sections. Initially, the main steps of a methodology recently included in API RP 17B [3] are presented, along with comments on possible alternatives for each step. Then, the main research lines are identified, divided into the study of simplified models, damaged wire structures, new materials, and the use of modern digital tools for fatigue assessment and residual-life monitoring of flexible risers. Finally, the work’s conclusions are presented.

2. Methodology for Wave Fatigue Assessment

2.1. Applicable Standards, Recommended Practices, and Reference Literature

The design of flexible risers involves several types of analyses, which are conducted in accordance with standards, recommended practices, and reference documents specifically developed for this class of structures. Among the main references are the standards and recommended practices issued by API [3,11] and ISO [26], as well as technical texts such as [4].
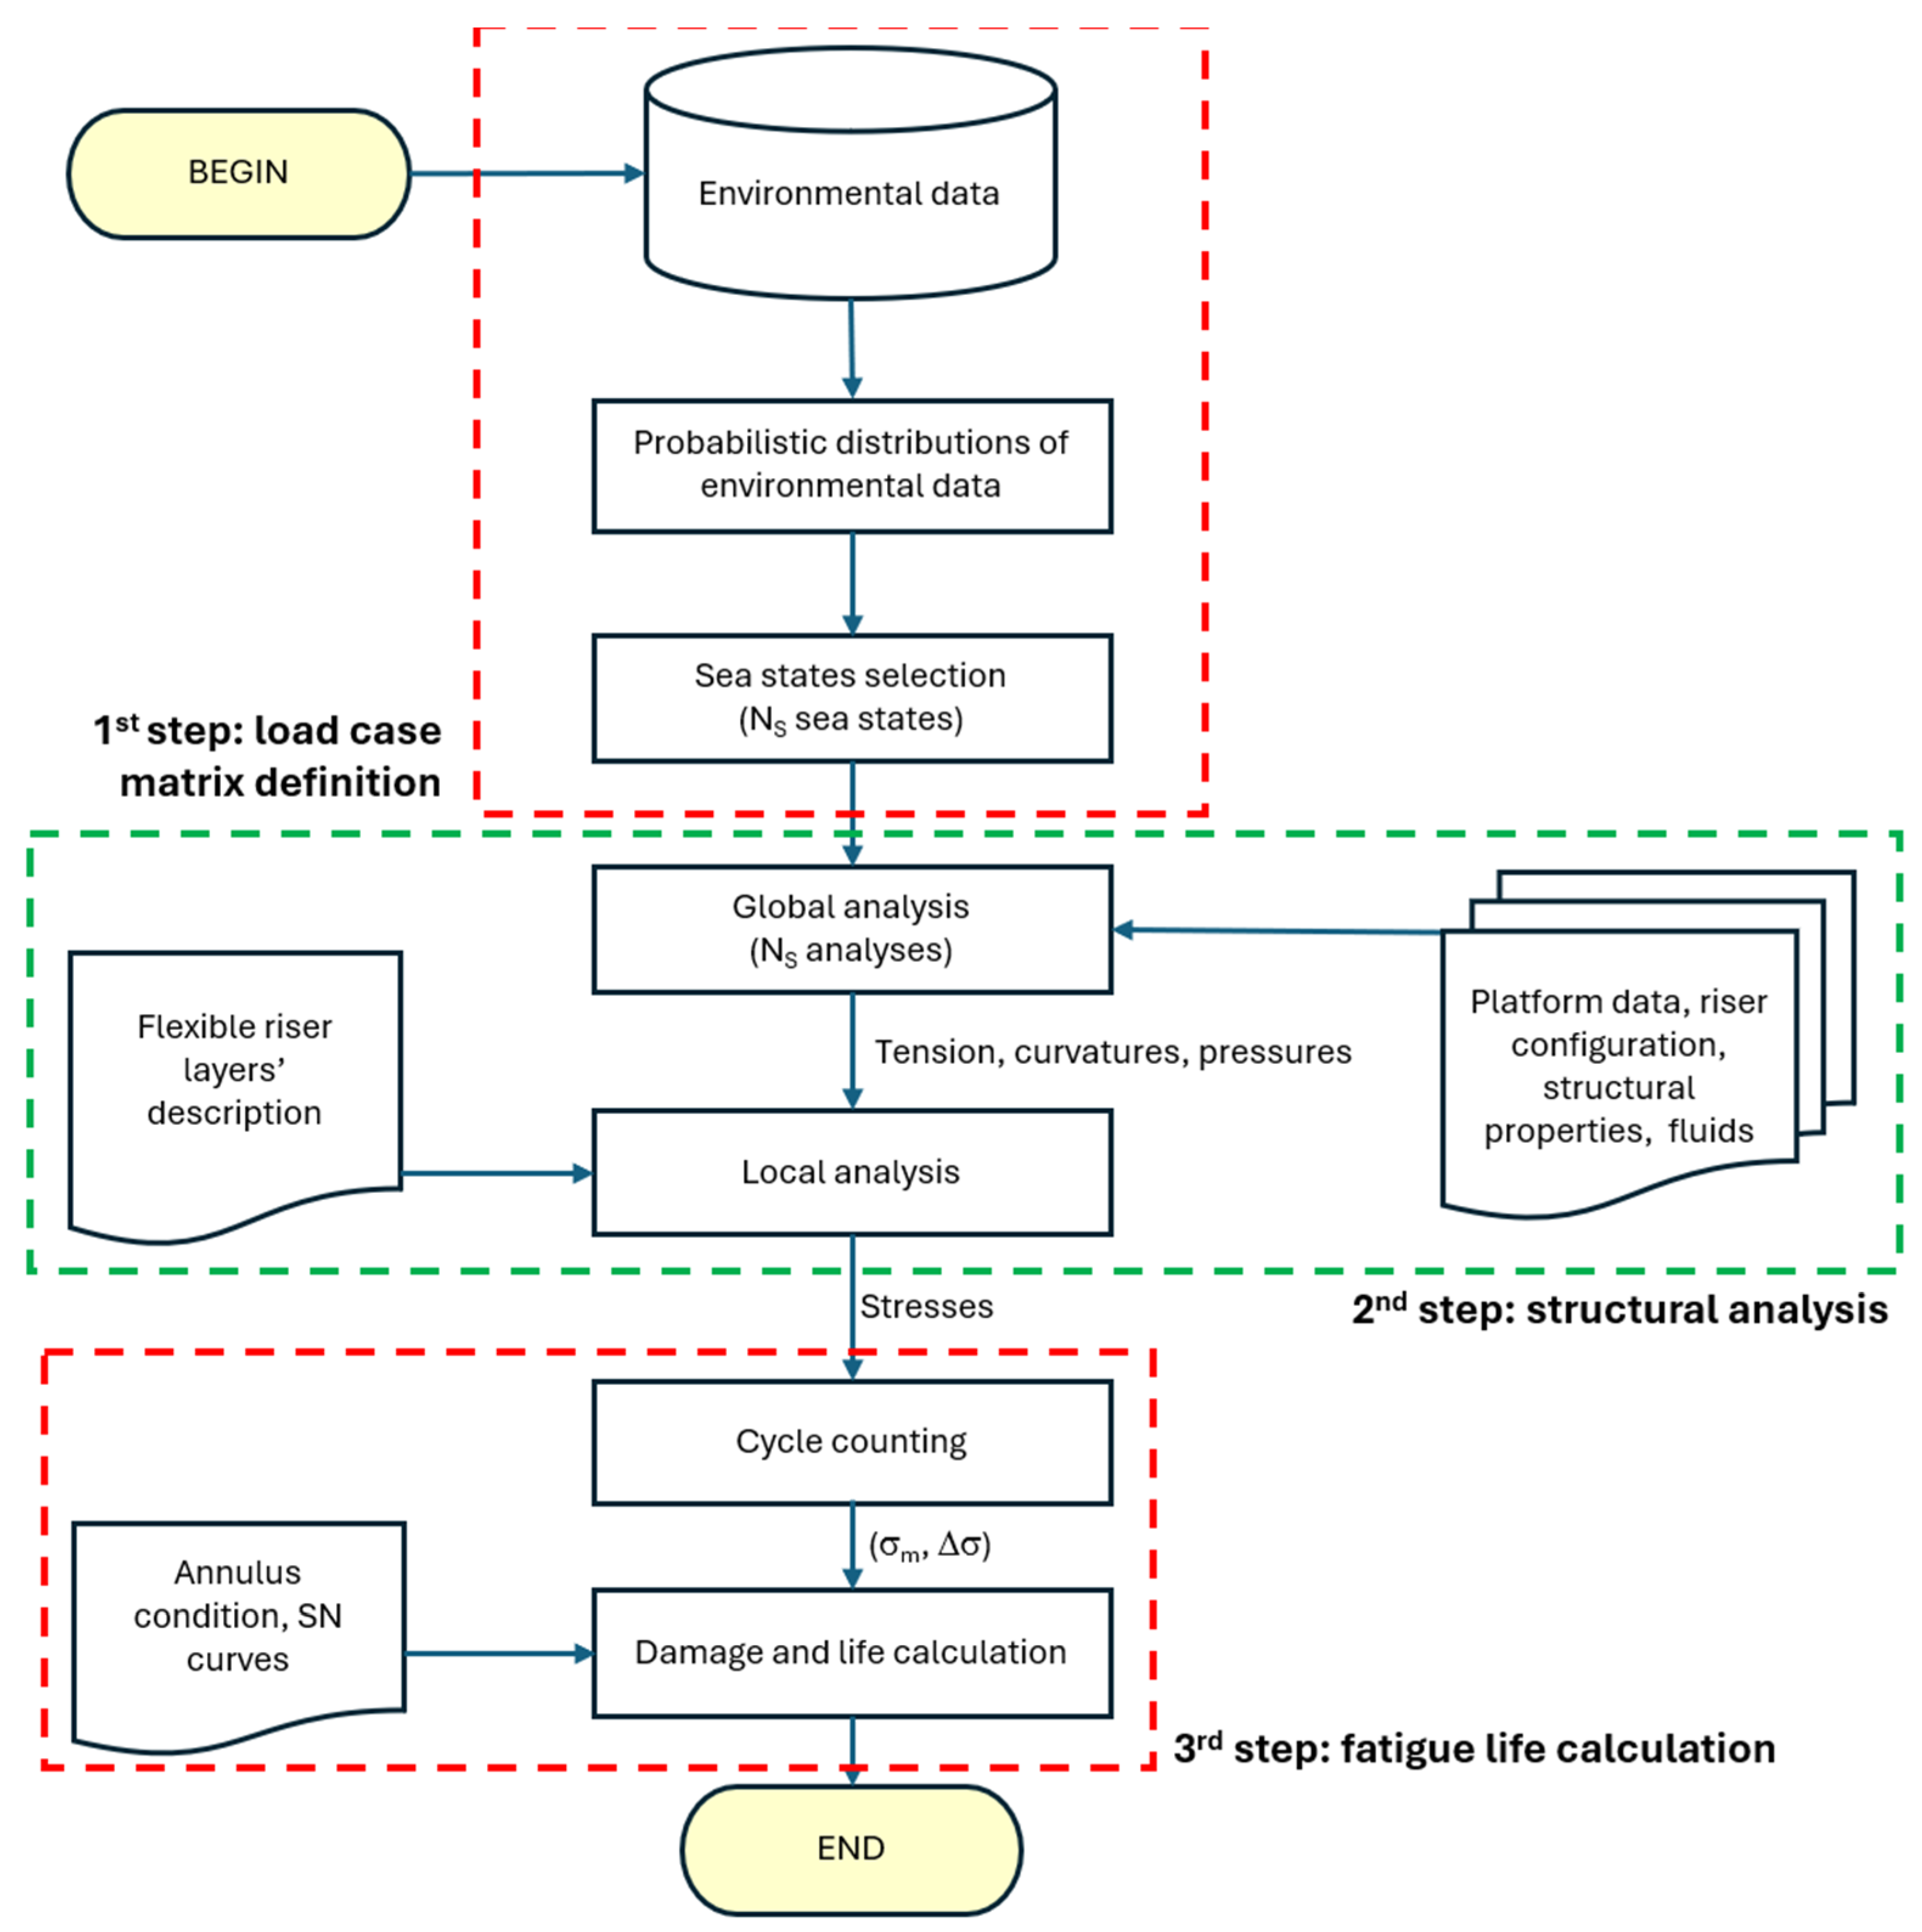
API RP 17B [3] includes an annex specifically dedicated to fatigue analysis. This annex establishes a flowchart to guide fatigue assessments, reflecting a methodology widely adopted in the literature. Figure 3 presents the API proposal, which can be divided into three main steps, briefly described below.
The first step in the process is selecting the sea states, when environmental loading data are collected and processed to establish the load case matrix.
The second step in the API RP 17B [3] is the structural analysis, starting with the global analysis. In its first substep, axial forces (tension, as torsion is usually neglected) and bending moments or curvatures are evaluated. Pressures, both internal and external, are normally assumed constant for each riser element. The environmental loading is represented by a stochastic description of the sea state [27]. The sea surface elevation is modelled as a realization of a stationary random process with prescribed power spectral density. This spectral representation constitutes the probabilistic input space of the fatigue problem.
The global structural response of the riser is obtained by solving the governing equations of motion, which may be expressed in operator form as a system of ordinary or partial differential equations. Depending on the adopted framework, the solution is obtained either in the frequency domain via linear transfer operators (response amplitude operators) or in the time domain via numerical time-integration schemes that account for geometric and material nonlinearities. In both cases, the mathematical objective is to map the stochastic wave input into time histories or spectral representations of global response quantities, such as displacements, curvatures, and axial forces.
Subsequently, the second substep of the structural analysis is a global-to-local transformation, in which the global response is converted into local stress states at critical cross-sections. This substep involves kinematic and constitutive mappings that translate curvature and tension into stress time histories, accounting for contact, friction, and relative slip between layers. From a mathematical perspective, this stage corresponds to a nonlinear operator acting on the global response space, often implemented using semi-empirical or numerical models.
The third step, the fatigue life calculation, begins by computing fatigue damage using cycle-counting algorithms, most commonly the Rainflow method [28], applied to the local stress time histories. The Rainflow method can be interpreted as a nonlinear transformation that maps a continuous stress signal into a discrete set of stress ranges and associated cycle counts. These cycles are combined with S–N curves to compute incremental damages, which are accumulated over time using linear or nonlinear damage summation rules, such as Palmgren-Miner’s rule [3].
Finally, long-term fatigue life is obtained by integrating damage contributions across multiple sea states, typically via weighted summation based on their occurrence probabilities. This final substep introduces an additional stochastic integration over the environmental input space, providing a natural framework for uncertainty quantification and reliability analysis. Variability in wave climate, material properties, and model parameters propagates through the computational pipeline, affecting the predicted fatigue life and motivating the use of probabilistic and sensitivity-based approaches.
The following sections detail each step in the methodology.

2.2. Loading Cases Matrix Definition

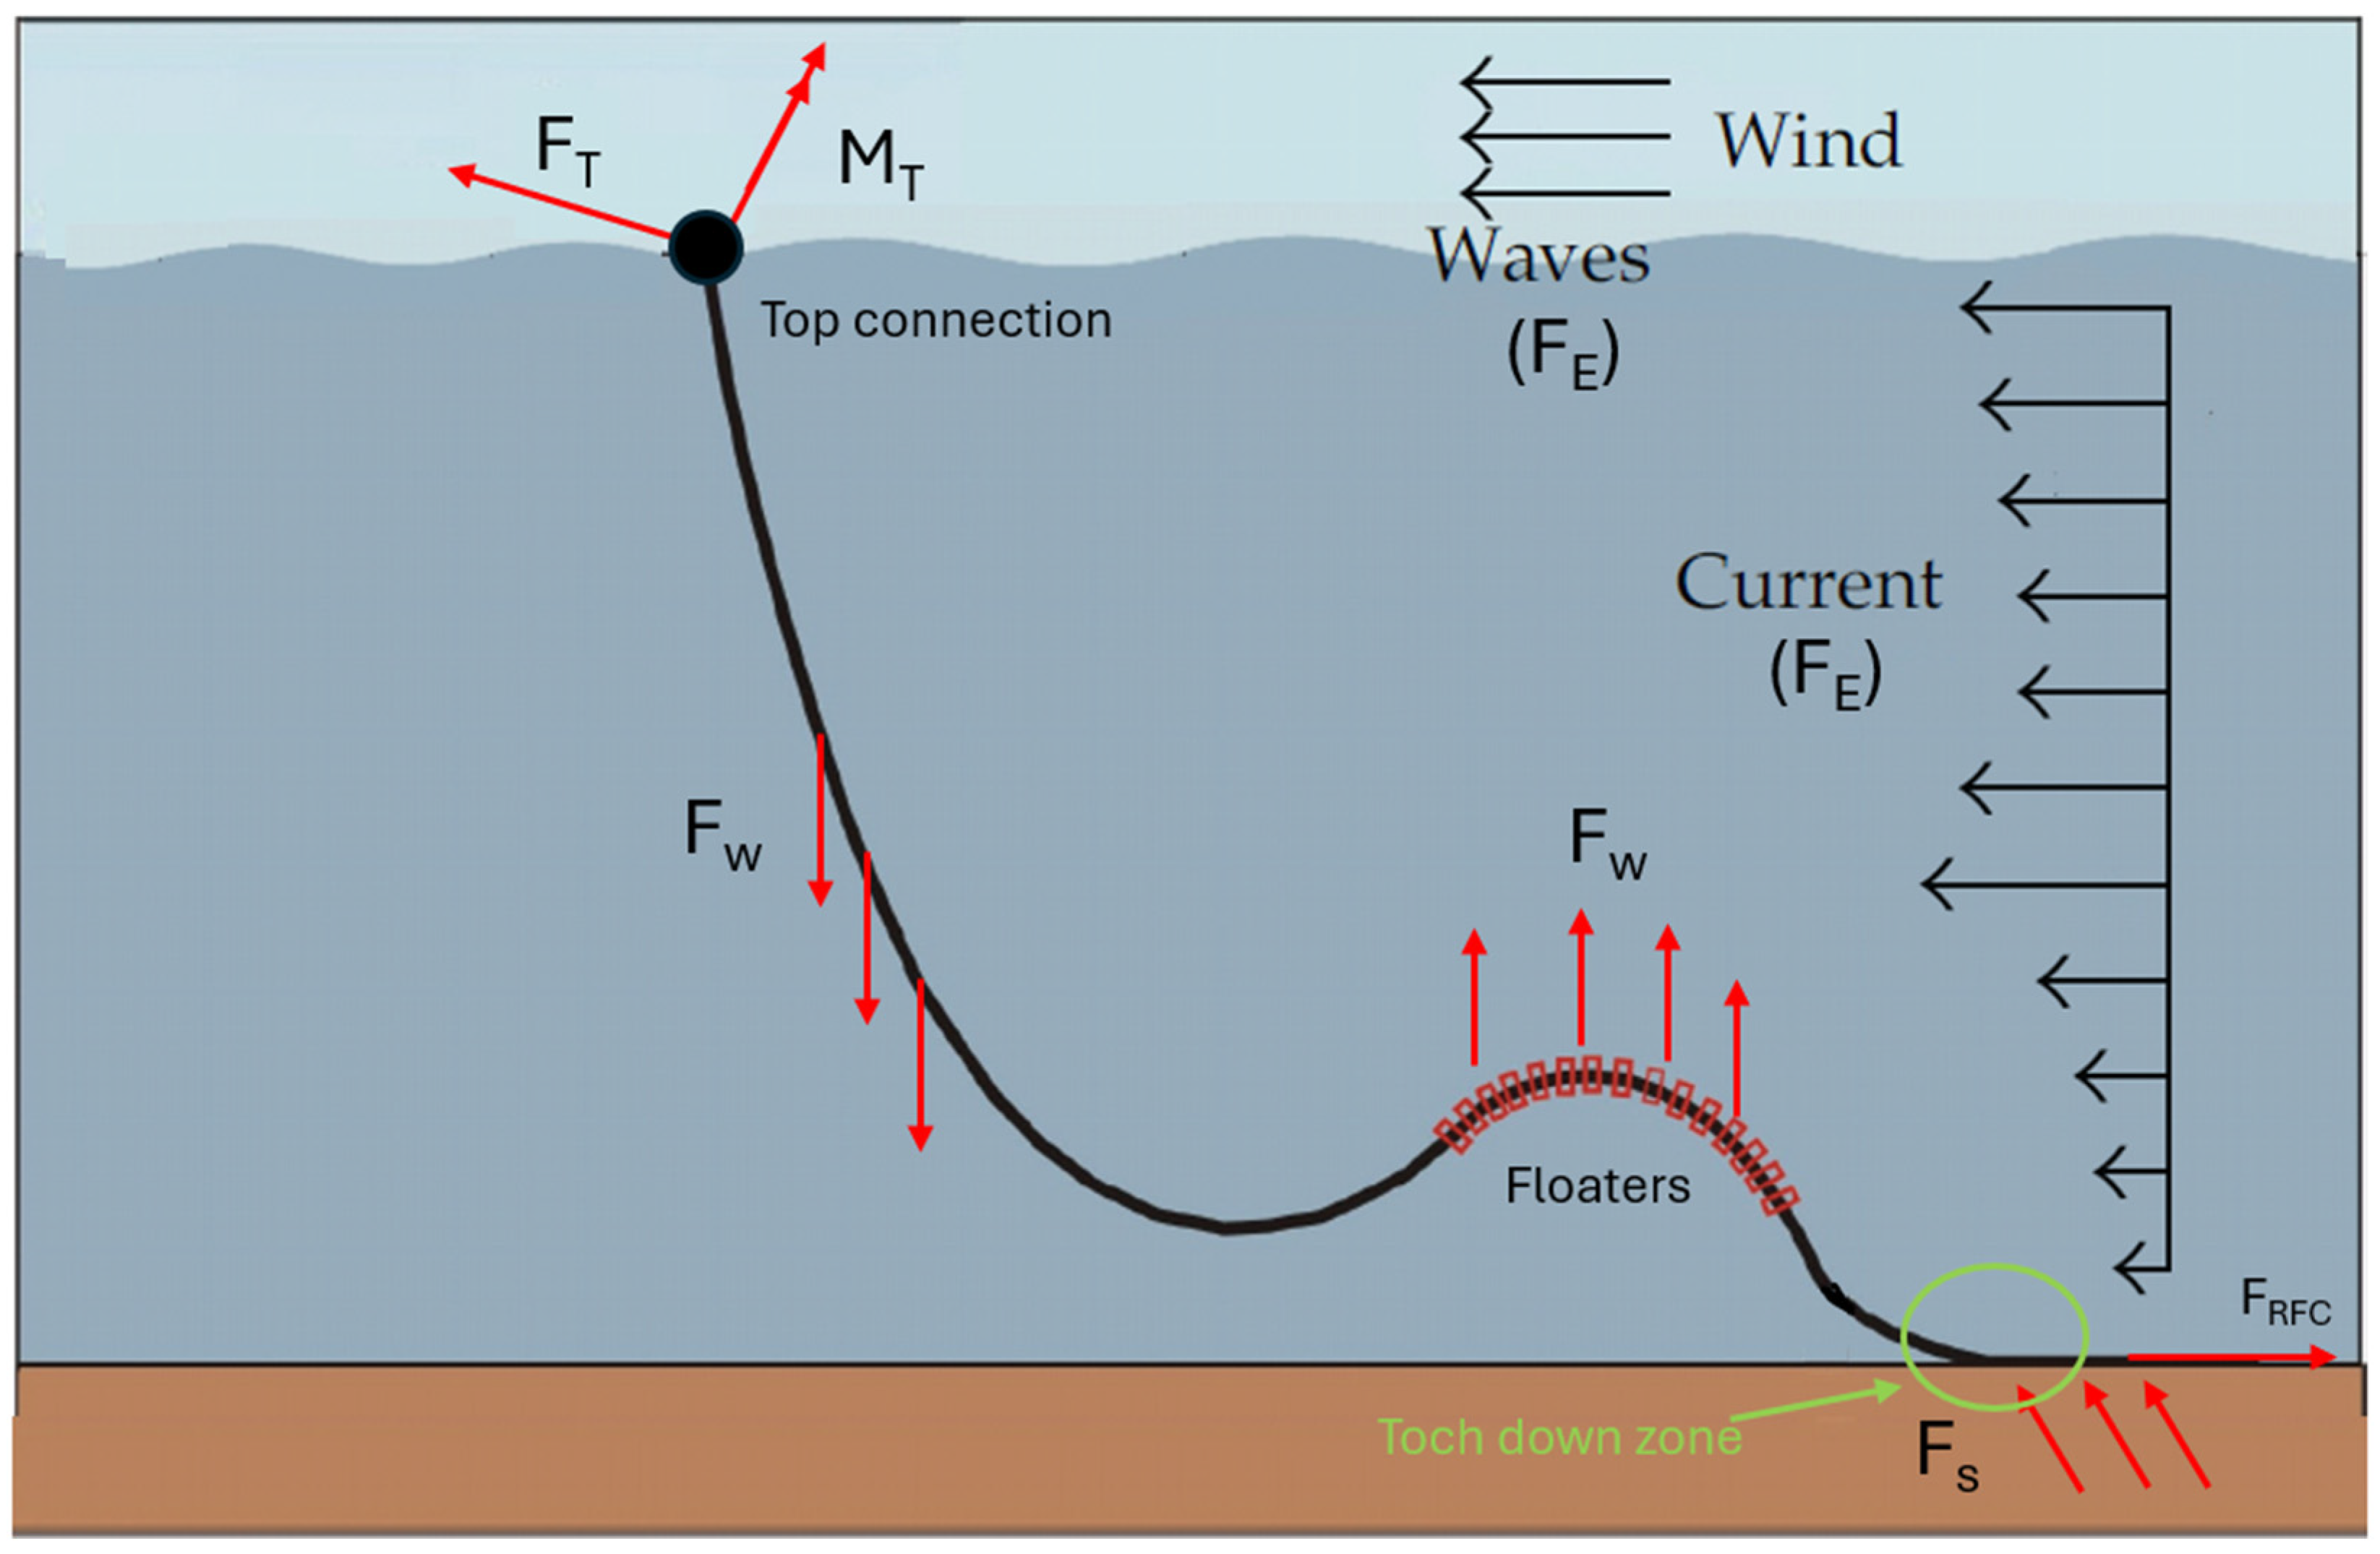
Characterizing the marine environment is essential for evaluating the fatigue life of offshore structures, since waves, currents, and winds, as shown in Figure 4, are the main external loads acting on risers and platforms [29].
In this context, the concept of sea state (as mentioned, for instance, by Sagrilo et al. [27]) plays an essential role in the design of offshore structures. Sea states are defined as time periods (typically 3 h) during which the parameters describing environmental loads remain stable. A sea state S can be defined through a vector composed of several parameters, such as:
S = H S S W , T P S W , θ S W , H S S S , T P S S , θ S S , V W , θ W , V C , θ C T ,
where H S S W is the significant wave height of wind-generated local waves; T P S W is the spectral peak period of local waves (depending on the spectra selected to represent the wave, it is also possible to use the zero upcrossing period, T Z S W ); θ S W   is the local wave incidence direction; H S S S is the significant height of swell waves, which are generated by distant storms; T P S S is the spectral peak period of swell waves ( T Z S S can also be used); θ S S is the swell incidence direction; and the parameters V W , θ W , V C , θ C represent, respectively, the speed and incidence direction for wind, and speed and propagation direction for current.
Environmental data on waves, wind, and currents can be obtained in two main ways. First, through direct measurement campaigns using specific sensors for each environmental load. Second, from computational simulations using complex models, which advantageously generate long-term data [30]. Combinations of both alternatives are also possible.
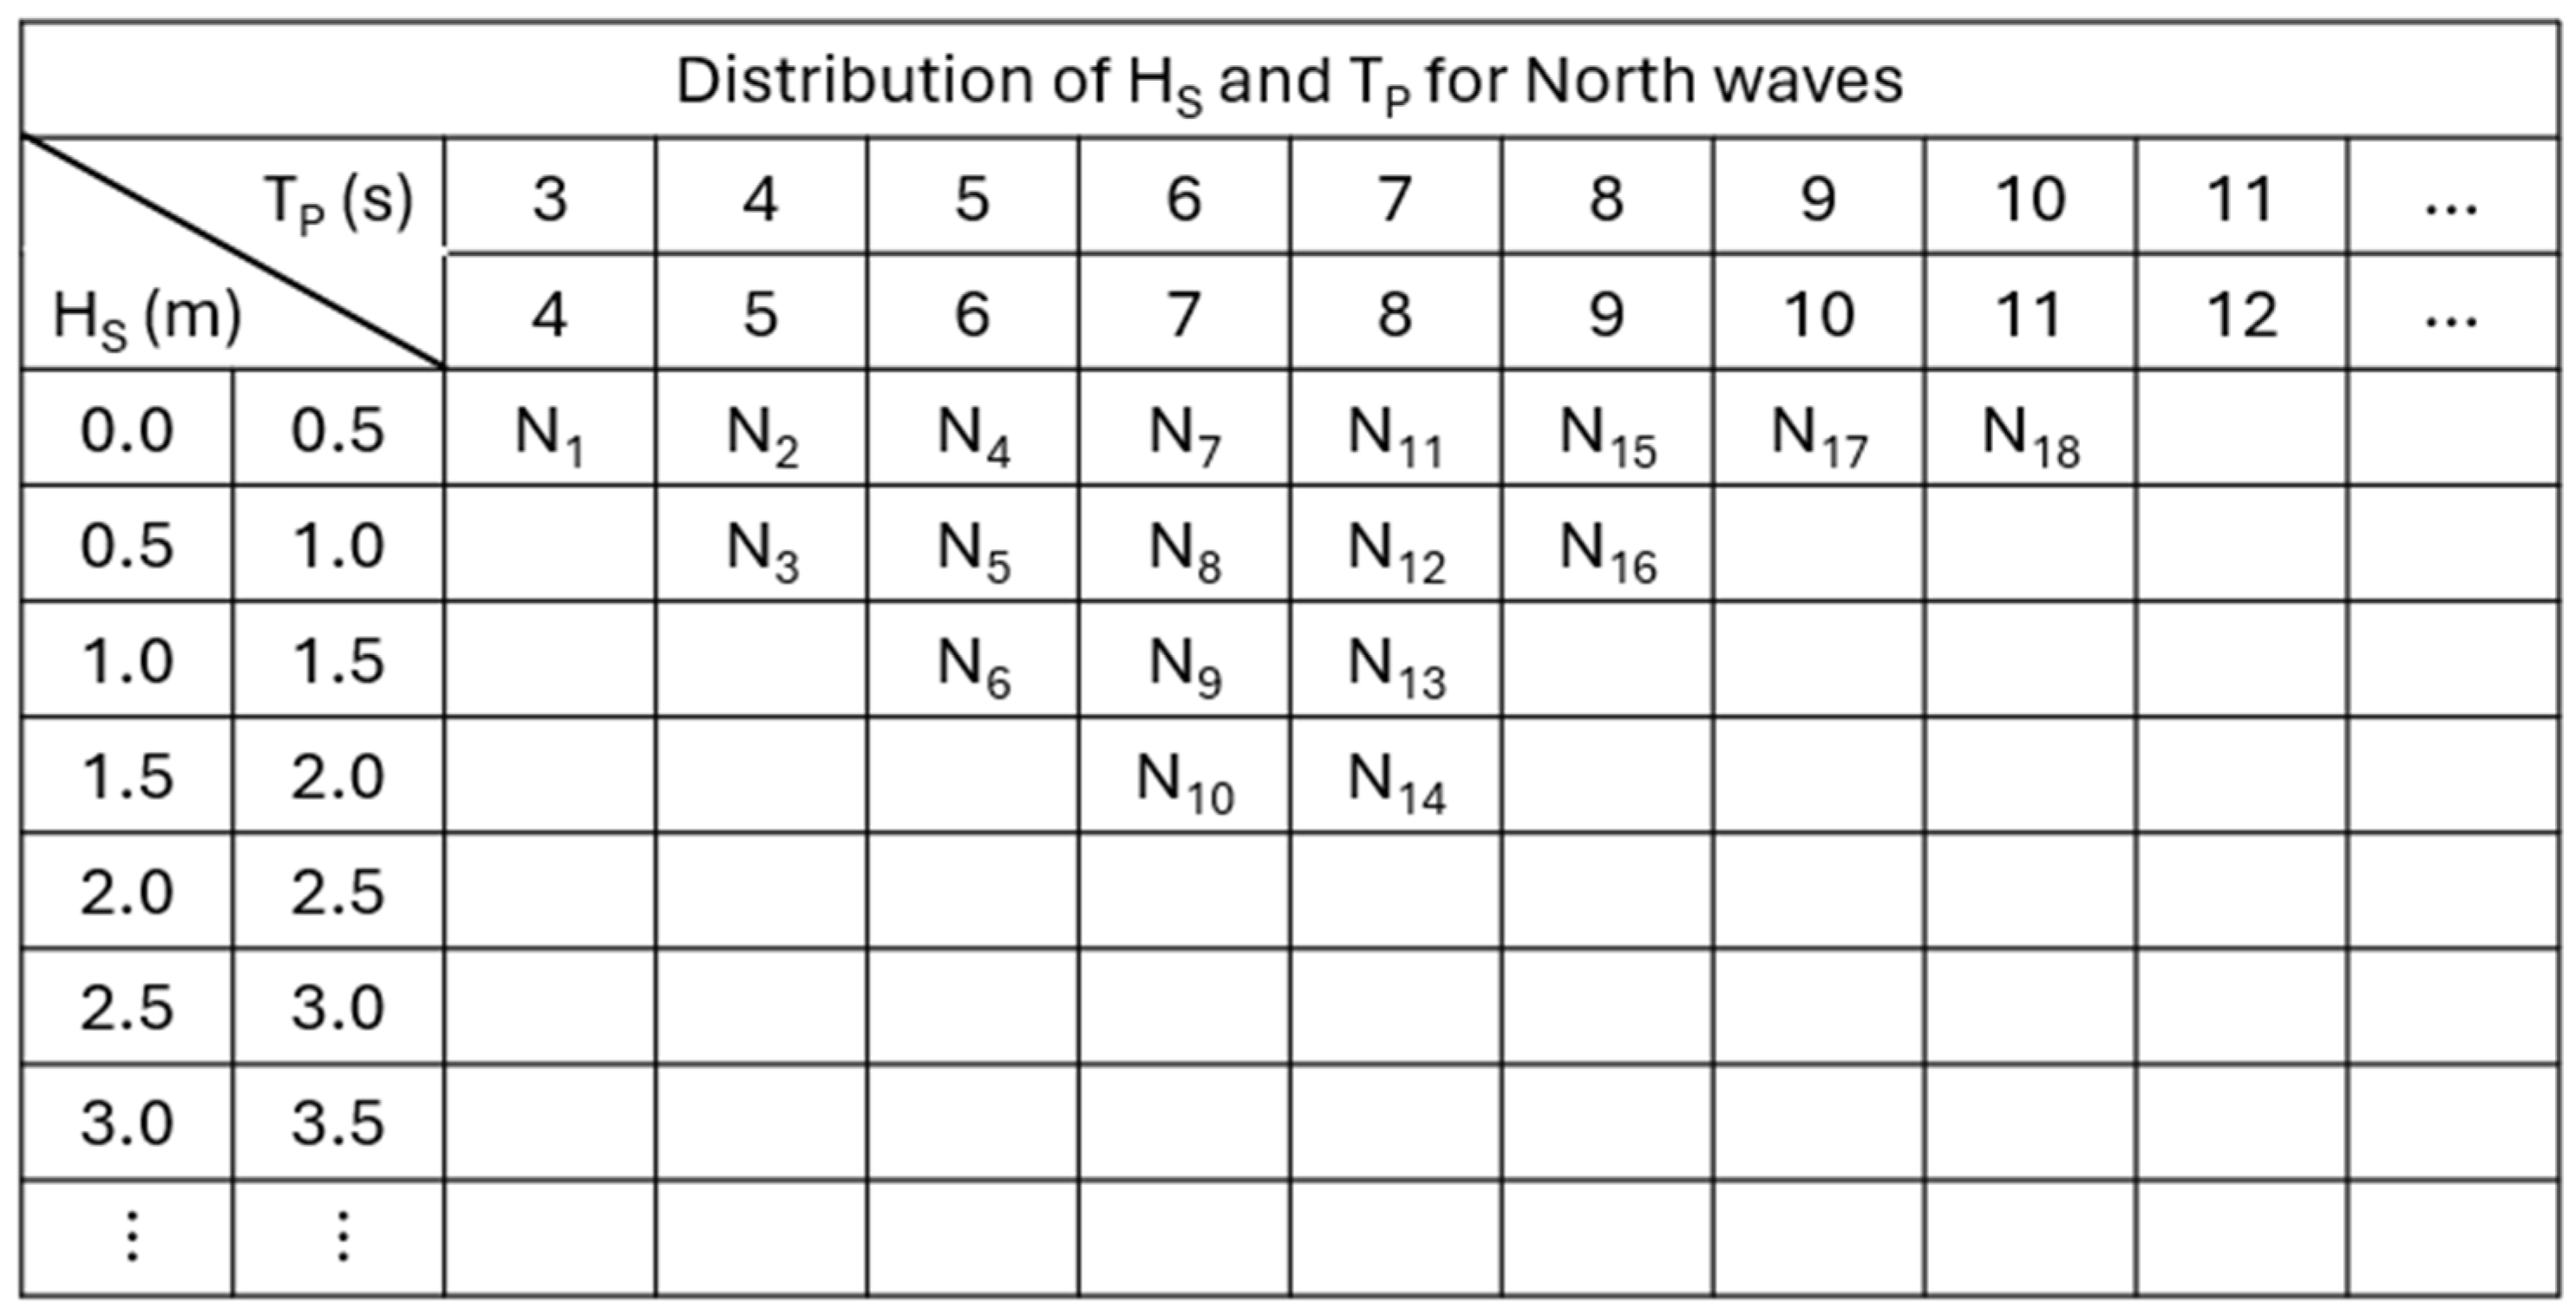
From environmental data obtained over long time periods, fatigue loading cases can be selected using several approaches. Sertã et al. [12] suggested generating wave scatter diagrams that show, for each direction, the number of wave occurrences (the “N’s” in Figure 5) for various combinations of significant wave heights (HS) and peak or zero upcrossing periods (TP or TZ). This approach allows for consideration of multimodal sea states (only one swell wave per bin). Parameters for currents and winds can either be taken from the scatter diagrams or assumed based on the analyst’s practice. It should be noted that the quality of the environmental data representation depends on the discretization used to generate the diagrams.
Cai et al. [31] proposed using probability distributions fitted to measured data to generate all possible combinations of environmental parameters. Then, the most likely combinations, accounting for 95% of the total occurrence probability, are selected for analysis, while low probability sea states are excluded.
Fatigue researchers for other structural types also emphasize the use of Monte Carlo simulations to generate load cases [32]. Load cases can be selected from raw measured data or from distributions fitted to the raw data, with the latter approach preferred.
The three methods mentioned for generating load cases for fatigue assessment involve high computational costs, which is one of the main challenges in fatigue analysis. This cost has been growing substantially since 1992, when Estrier [33] suggested a total of five load cases, considering regular sea states. Nowadays, it is usual to perform these analyses using a few thousand load cases. The consideration of irregular waves, which require long time series to guarantee the stabilization of the statistical parameters of tensions and curvatures, further increases this cost.
A common alternative to reducing computational costs is to use deterministic cases, which require deterministic wave-scatter diagrams. To generate these scatter diagrams, Sheehan et al. [34] proposed an adaptation of the method developed by Longuett-Higgins [35] to derive deterministic wave-height and period diagrams from irregular-wave scatter diagrams. Starting from an irregular wave scatter diagram like the one shown in Figure 5 and using the Longuet-Higgins distribution, the probability of occurrence for individual waves in a bin i of the deterministic equivalent diagram from an irregular sea state j is given by:
p i j ( H , T ) = τ 1 τ 2 ξ 1 ξ 2 p j ξ , τ . d ξ . d τ ,
where ξ1 and ξ2 are normalized wave heights defining diagram i, τ1 and τ2 are normalized wave periods defining diagram i, and pj(ξ, τ) is the Longuet-Higgins distribution applied to irregular wave j.
The annual occurrence number of regular waves (H, T) in bin i from irregular wave j is then obtained by:
N i j = p i j H , T . 31,536,000 T Z j . γ j ,
where γ j is the probability of occurrence, T Z j is the zero-upcrossing period of the irregular wave j and the number “31,536,000” represents the number of seconds in one year. Since deterministic analyses require significantly shorter simulation times, the reduction in computational cost can be substantial.
This method, however, has two limitations, as noted by Sousa et al. [36]. The irregular wave diagrams that are converted into regular waves must be unimodal, and the fatigue life results are susceptible to the discretization of the final regular wave diagram. A possible solution to the first issue is to use the sea surface elevation method to generate deterministic diagrams, while the second can be addressed conservatively by selecting the period that maximizes the heave acceleration at the riser top connection point as the representative period for each bin.

2.3. Structural Analysis, Substep One: Global Analysis

2.3.1. Overview

Flexible risers can be configured in several ways (free catenary, lazy or steep wave, lazy or steep S—Larsen et al. [4]) with internal diameters typically varying from 2.5″ to 16″. The greater the internal diameter, the harder it is to qualify the riser for deep water operations. In this way, the most common diameters in deep waters vary from 2.5″ to 8″.
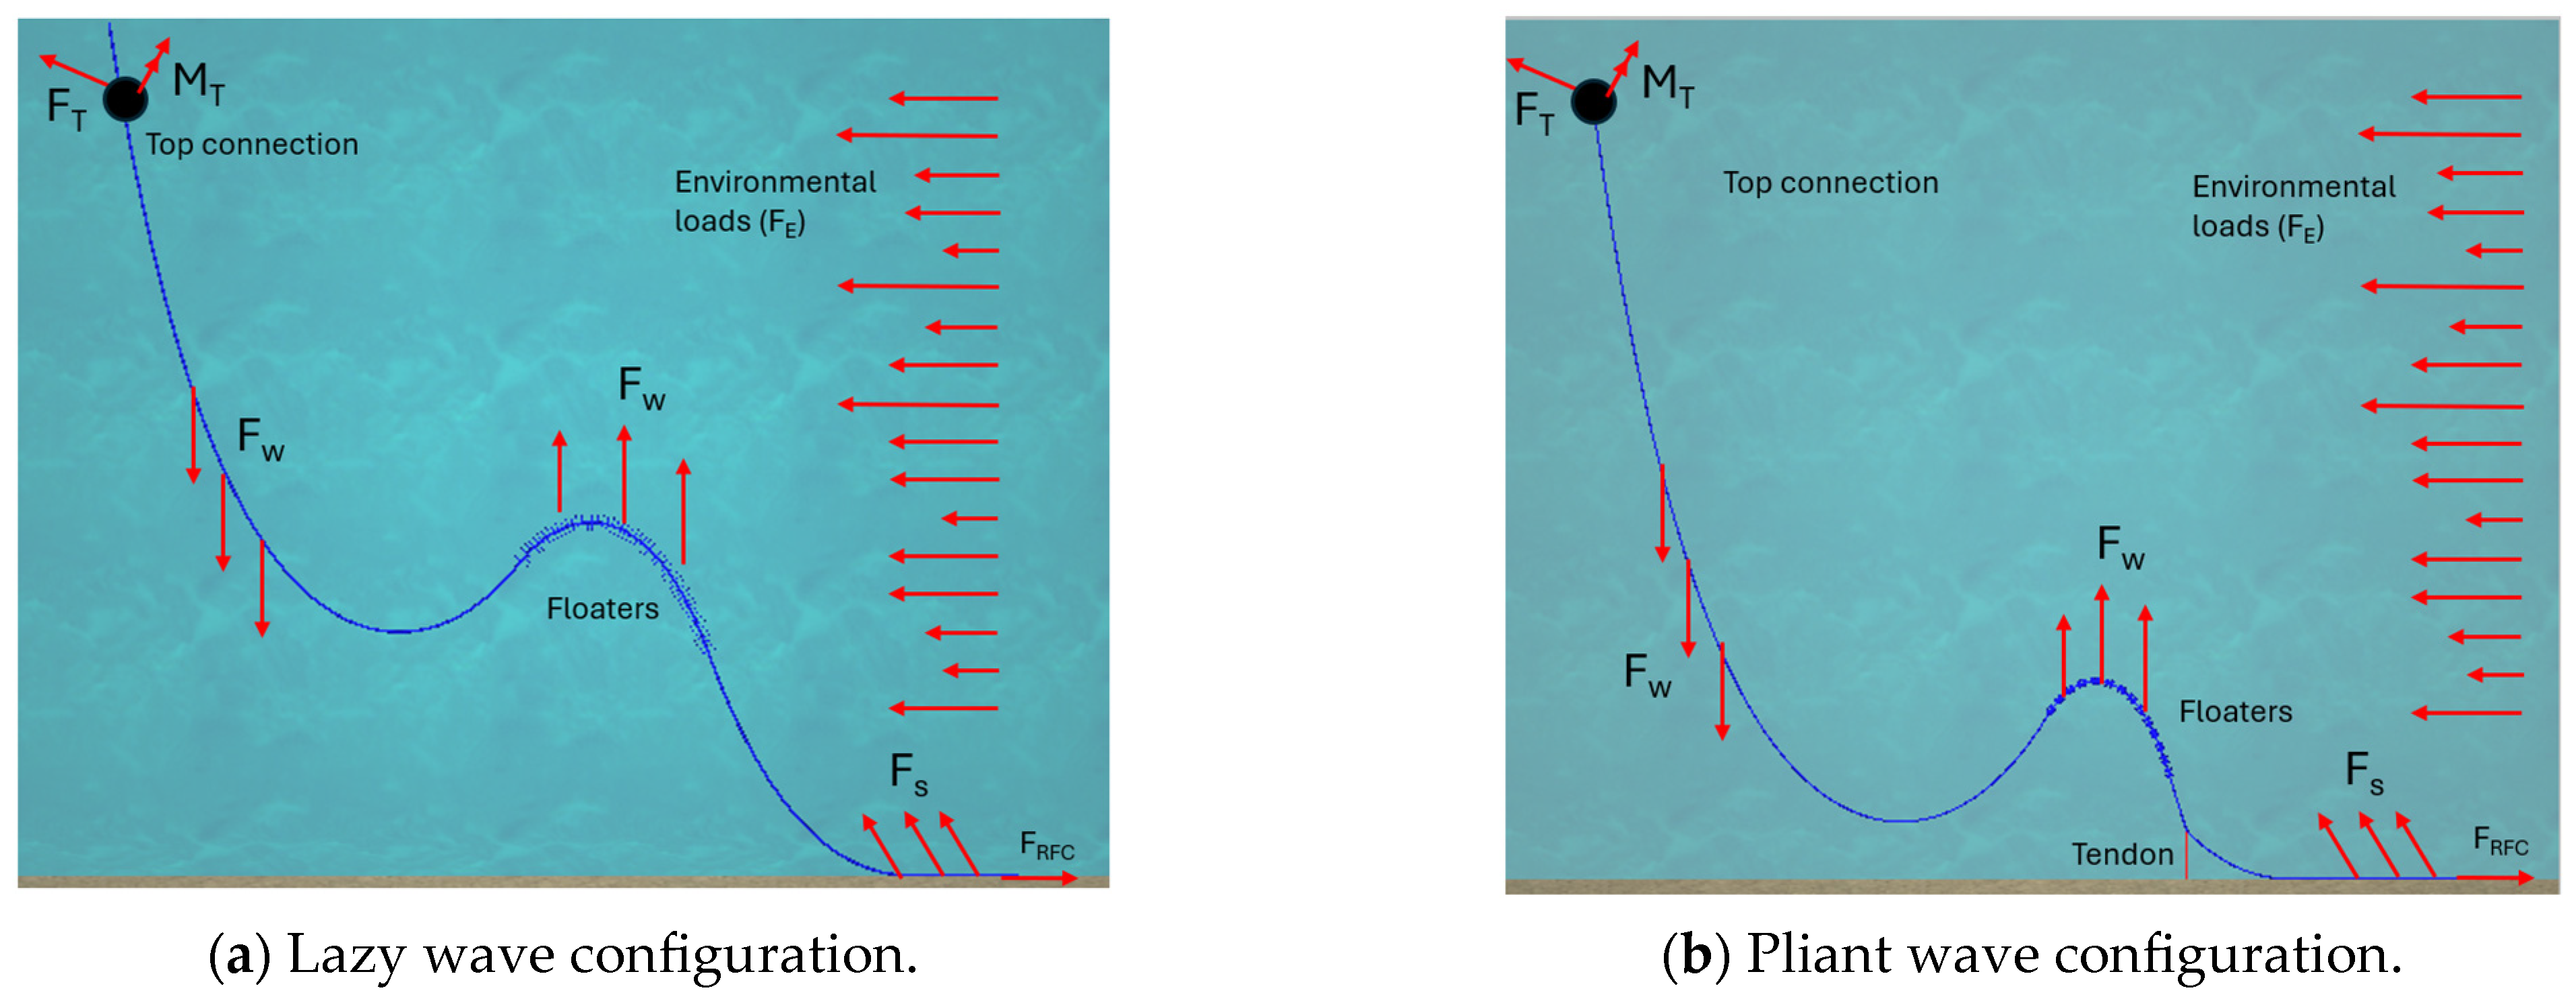
The configuration adopted for a flexible riser depends on several factors. In most cases, the preferred option is the free-hanging catenary, due to its operational and installation simplicity. However, for platforms that experience significant dynamic motions or operate in shallow water depths, implementing a free-hanging catenary configuration may be difficult due to excessive bending in the top region or at the TDZ (touch-down zone). In such cases, the lazy-wave configuration may represent a suitable alternative, for example, for risers connected to FPSO (floating, production, storage and offloading) platforms in deep waters. For shallower water depths, configurations such as steep-S, steep-wave, or pliant-wave may be adopted.
Figure 4 (page 8) presents a simplified free-body diagram that identifies the most important loads on a riser. Environmental actions (FE) and the riser soil interaction (FS) are three-dimensional and distributed forces, while the riser submerged weight (Fw) is a distributed force in the vertical direction. The riser top connection has prescribed motions in the six DOFs (degrees of freedom: 3 translations and 3 rotations). Force FT and couple MT are three-dimensional. The riser-flowline connection (RFC) has all six DOFs restrained. If the riser segment in contact with the seabed is sufficiently long, FRFC is a horizontal force.
Global analyses of risers aim to determine the loads along a riser (tensions, bending moments, or curvatures) over time, for each defined load case. They can be performed in several ways; Table A1, Table A2 and Table A3 in Appendix A summarize several mathematical frameworks used in these analyses.
First, global analyses can be performed in the frequency or time domain [1,37,38]. However, to correctly represent the structural behavior of flexible risers while accounting for geometric and physical nonlinearities, riser dynamic analyses typically employ the Finite Element Method (FEM) in the time domain [37].
Offshore structures’ designers currently have two time-domain dynamic analysis methodologies to choose from. In the first, known as decoupled analysis [37], each riser is modelled and studied individually. The production unit, mooring lines, and other risers are not included in the model. The platform’s dynamic motions at wave frequency are calculated by combining sea spectra with the platform’s RAO (Response Amplitude Operator), generated by specialized software (e.g., Wamit v. 6.4 [39]). From the motion spectrum, time series of platform movements in six degrees of freedom are determined. These movements are then imposed on the riser top connection, while the waves and currents’ loads are applied to the whole riser. Offsets and second-order motions must be calculated by specialized programs, such as MIMOSA [40] and applied directly to the platform.
The main advantage of this type of analysis is the ability to model risers with very detailed meshes. This approach is beneficial in sections with large curvatures, such as the top region, the Touch Down Zone (TDZ), and regions with floaters (as in lazy wave and pliant wave configurations, as shown in Figure 6).
However, the decoupling approach presents inherent limitations. The dynamic response of an offshore structure results from the coupled interaction among all its components. Platform motions (surge, sway, heave, roll, pitch, and yaw) are influenced not only by environmental actions, but also by the stiffness and damping contributions of risers and mooring lines. This interaction is fundamentally nonlinear. In addition, horizontal platform displacements, including mean offsets and second-order motions, are strongly influenced by risers and the mooring system.
Consequently, platform motions are specific to each combination of environmental loads and to the global behavior of the fully coupled system (platform, mooring lines, and risers). When the analysis of an individual riser is decoupled from the overall system, the main implication is that platform motions just approximate the true response. To mitigate these inconsistencies, conservative assumptions are typically adopted. As previously mentioned, horizontal offsets and second-order motions are usually estimated by specialized programs considering extreme combinations of environmental loads and multiple return periods. To partially account for nonlinear dynamic effects, response amplitude operators (RAOs) can be defined for different wave-height ranges or alternatively computed using models that explicitly include risers and mooring lines in the hydrodynamic representation.
The second approach, adopted by authors such as Alves et al. [22], involves joint modelling of the platform, mooring lines, and risers. In this case, the platform is modelled as a rigid body (6D buoy), considering hydrodynamic coefficients, damping, and excitation forces generated by specialized software [39]. The platform movements (mean, first-, and second-order) are also analyzed, as are the loads acting on each riser individually. This approach tends to produce very robust computational models, which may pose challenges when highly detailed meshes are required in some sections.
Software such as Orcaflex v.5.11c [41] and RIFLEX v5.0.1 [42] support both methodologies. Orcaflex allows the import of hydrodynamic data from Wamit [39], while RIFLEX can be coupled with SIMO [43], which models floating bodies to simulate interactions between the structure and the environment/platform motion.

2.3.2. Dynamic Analysis

Considering an offshore production system composed of a floating platform, several risers, and mooring lines, dynamic analyses are governed by the classical equation [41]:
M x , x ¨ + C x , x ˙ + K x = F e x t ( x , x ˙ , t ) ,
where M x , x ¨ is the system inertia matrix, C x , x ˙ is the system damping matrix, K x is the system stiffness matrix, and F e x t ( x , x ˙ ,   t ) is the external loads vector; x , x ˙ and x ¨ are the position, velocity, and acceleration vectors, including all the system’s components, respectively. When using coupled methodologies, this equation must be solved simultaneously for the entire system; for this reason, the platform motions are treated as analysis outputs, as previously mentioned.
On decoupled methodologies, on the other hand, the “system” is the riser being studied. The time series of dynamic motions at the riser’s top connection can be readily determined by considering only the platform RAO and the sea spectrum. This evaluation begins with the transference of the platform RAO to the riser’s connection point, using transfer distances measured on the platform’s local system of reference ( d x , d y and d z ).
This transfer is needed because rotations (roll, pitch, and yaw) affect linear motions (surge, sway, and heave). The transference can be performed using expressions based on complex notation:
R A O T s u r g e ω = A s u r g e ω e i ϕ s u r g e ω d y A y a w ω e i ϕ y a w ω + d z A p i t c h ( ω ) e i ϕ p i t c h ( ω ) , R A O T s w a y ω = A s w a y ω e i ϕ s w a y ω + d x A y a w ( ω ) e i ϕ y a w ω d z A r o l l ( ω ) e i ϕ r o l l ( ω ) , R A O T h e a v e ( ω ) = A h e a v e ( ω ) e i ϕ h e a v e ( ω ) d x A p i t c h ( ω ) e i ϕ p i t c h ( ω ) + d y A r o l l ( ω ) e i ϕ r o l l ( ω ) ,
where R A O T s u r g e , R A O T s w a y and R A O T h e a v e are the linear motions RAO’s transferred to the riser connection point, and A s u r g e A y a w and ϕ s u r g e ϕ y a w are the RAO’s amplitudes and phases, respectively, of the six motions at the platform motions centre. All these parameters depend on the angular frequency ω . The rotation RAOs are not altered by the transference, being equal to the original RAOs.
Motion spectra (for the six platform motions, represented generally as S m o v ( ω ) ), can be determined using the following equation:
S m o v ( ω ) = R A O T m o v 2 ( ω ) . S ( ω ) ,
where S ( ω ) is the wave spectrum. A time series of any motion at the riser top connection can then be obtained, for instance, using Equation (7). In this equation, the “ ± ” symbol reflects the need to guarantee consistency between the equation and the phases in the RAO generation.
M o v t o p ( x , t ) = i = 1 n ω 2 S m o v ( ω i ) ω cos ( k i x ± ω i t ± ϵ i ± θ i ) ,
In Equation (7), n ω , ω and the ω i ’s are the number of waves, the frequency interval, and the individual frequencies used in the spectrum discretization, respectively; k i is the wave number, the ϵ i ’s are the transferred RAO phases and θ i are random phases.
Once a time series of motions for the six DOFs at the top of the riser is obtained, the solution of Equation (4) requires the external loads vector, F e x t ( x , x ˙ , t ) , which includes weight, buoyancy, and environmental loads. For submerged offshore structures such as risers, Morison’s equation [41] is used to calculate the forces exerted by currents and waves on the riser (per unit length):
f = ( C m a f C a x ¨ ) + 1 2 ρ C d A v v ,
In Equation (8), C m , C a and C d are the inertia, the added mass, and the drag coefficients of the structure, is the mass of the fluid displaced by the structure, a f is the fluid acceleration, ρ is the water density, A is the drag area and v is the relative velocity between fluid and structure. Equations for determining fluid velocity and acceleration can be found in several relevant textbooks, such as [44].
Equation (4) represents a nonlinear system of second-order differential equations, where the external loads vector depends on the structural displacements and velocities squared (Equation (8)). Consequently, an incremental, iterative solution is required to perform numerical integration and determine the structure’s positions, velocities, and accelerations over time.
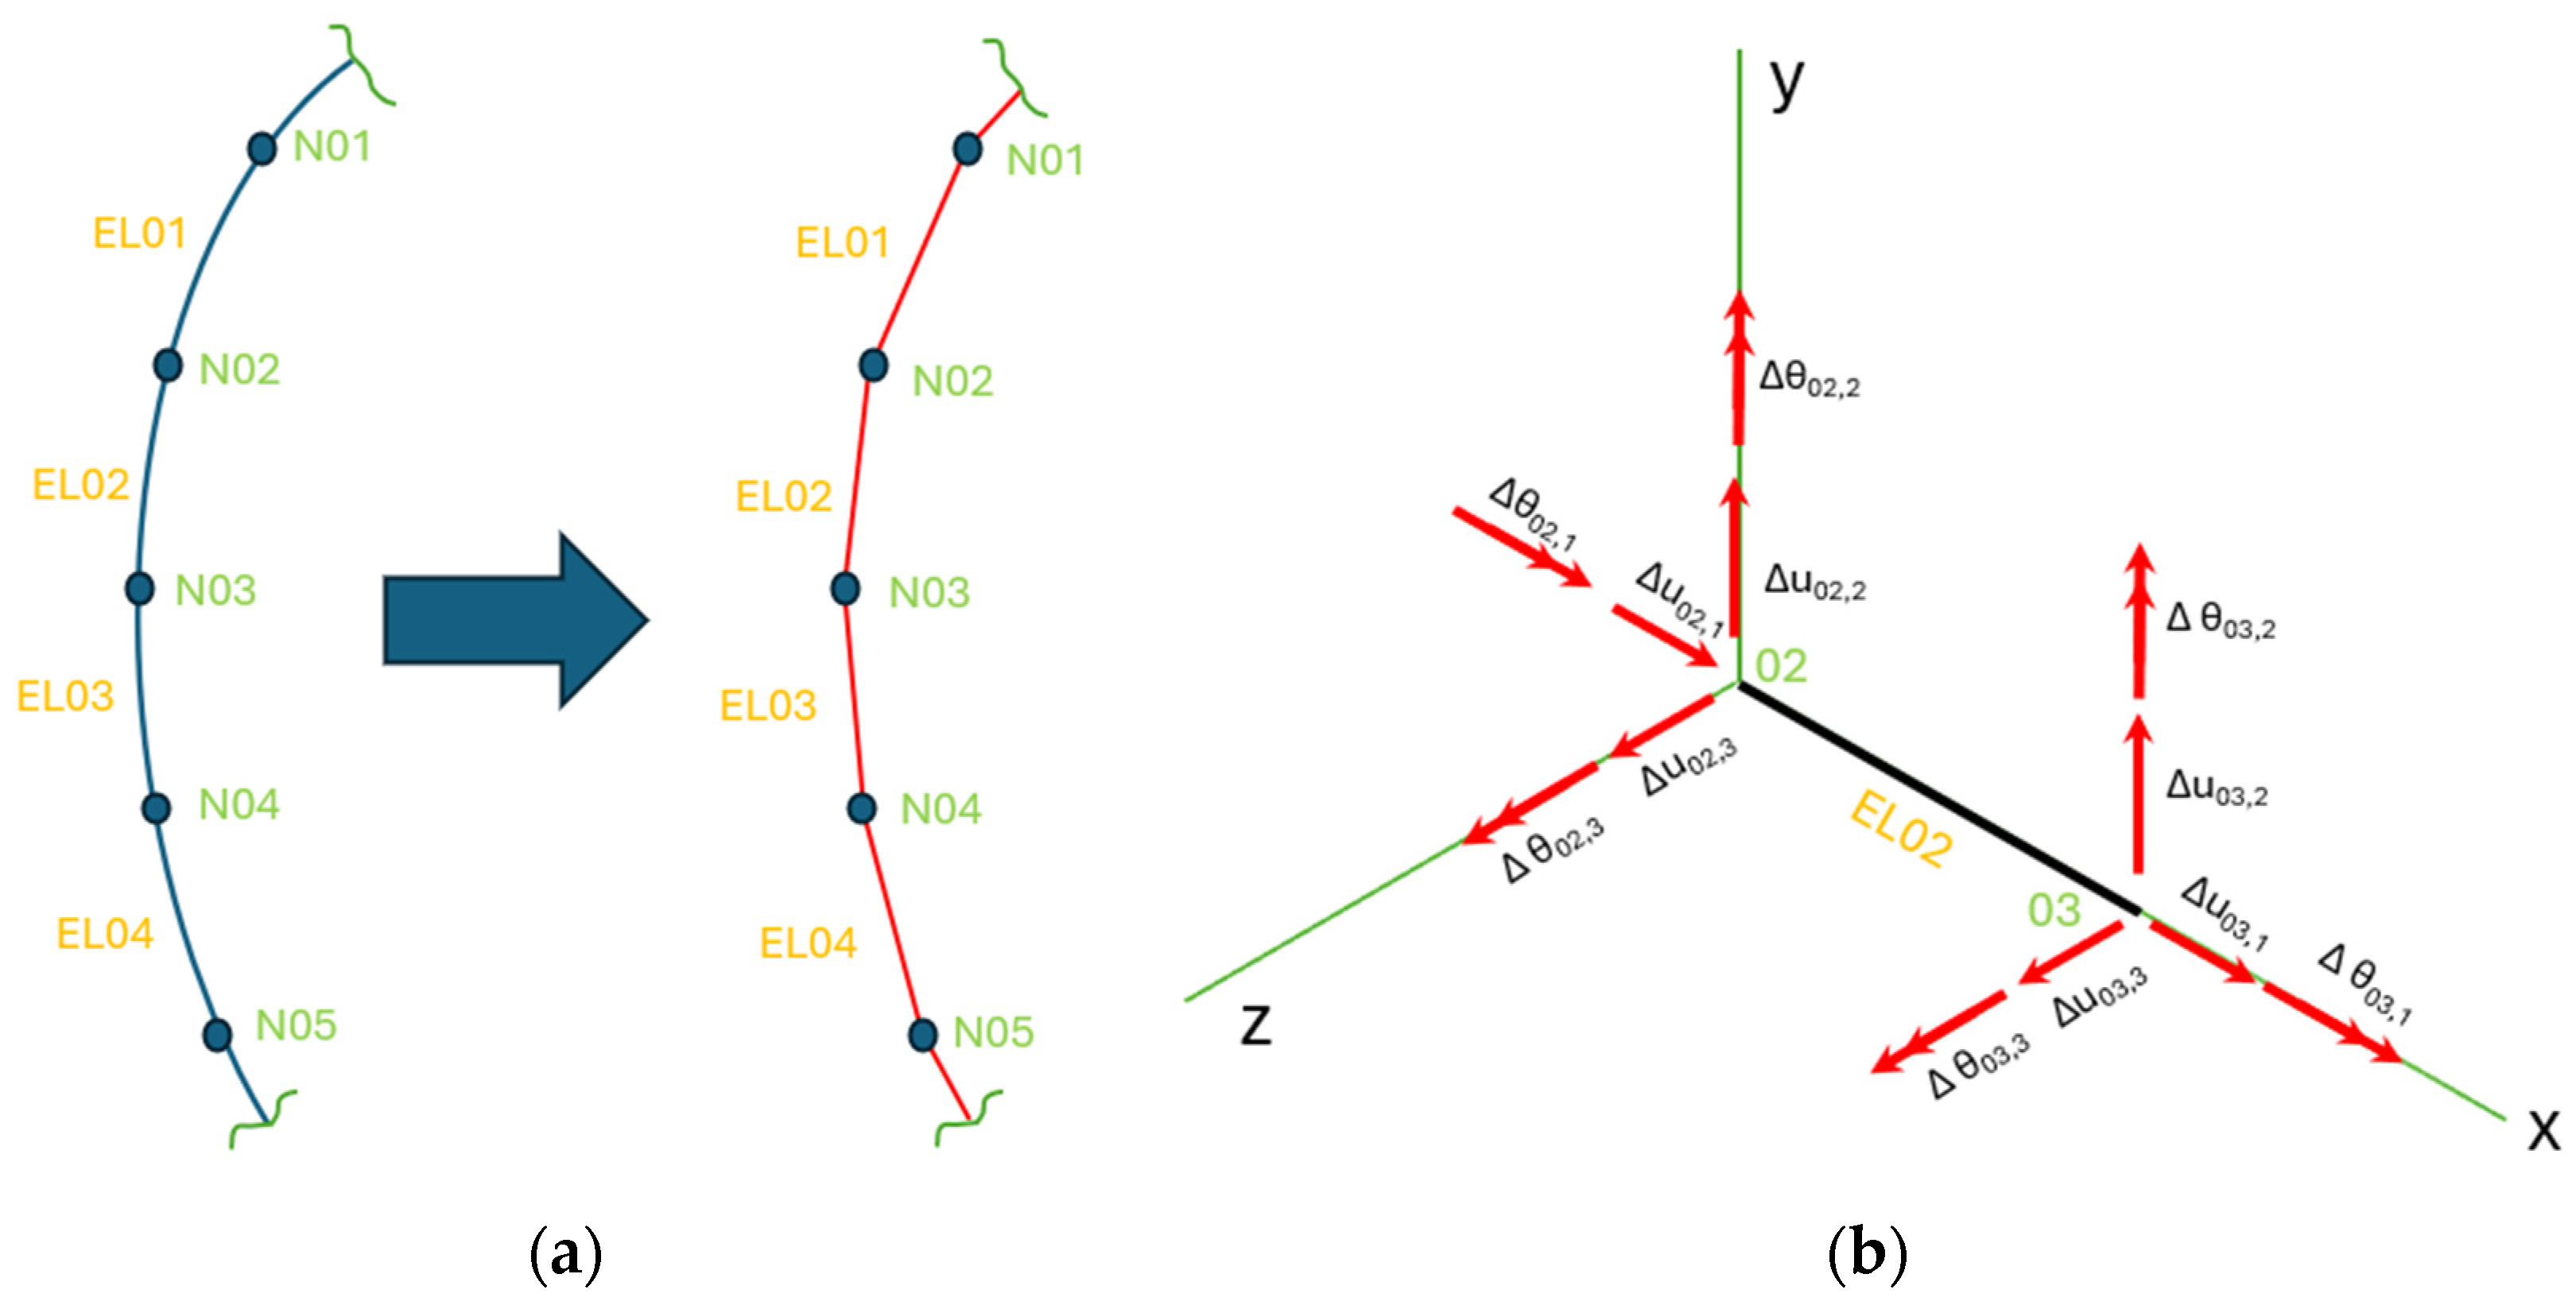
Using the FE method and a decoupled analysis methodology, computer programs such as RIFLEX [42] and ANFLEX [45] discretize the riser in three-dimensional beam elements (Figure 7), considering six degrees of freedom at each node, and solve the system of equations iteratively, recalculating inertia, damping, and stiffness terms at each step until convergence.
Beam finite elements with twelve degrees of freedom (six per node) provide an efficient and mechanically consistent basis for the global analysis of flexible risers. They allow the representation of axial, bending, and torsional stiffnesses within a fully three-dimensional formulation while remaining computationally efficient for long time domain simulations. Additionally, equivalent nonlinear moment–curvature relationships can be readily incorporated, making such elements particularly suitable for modeling the global structural behavior of multilayer flexible pipes.
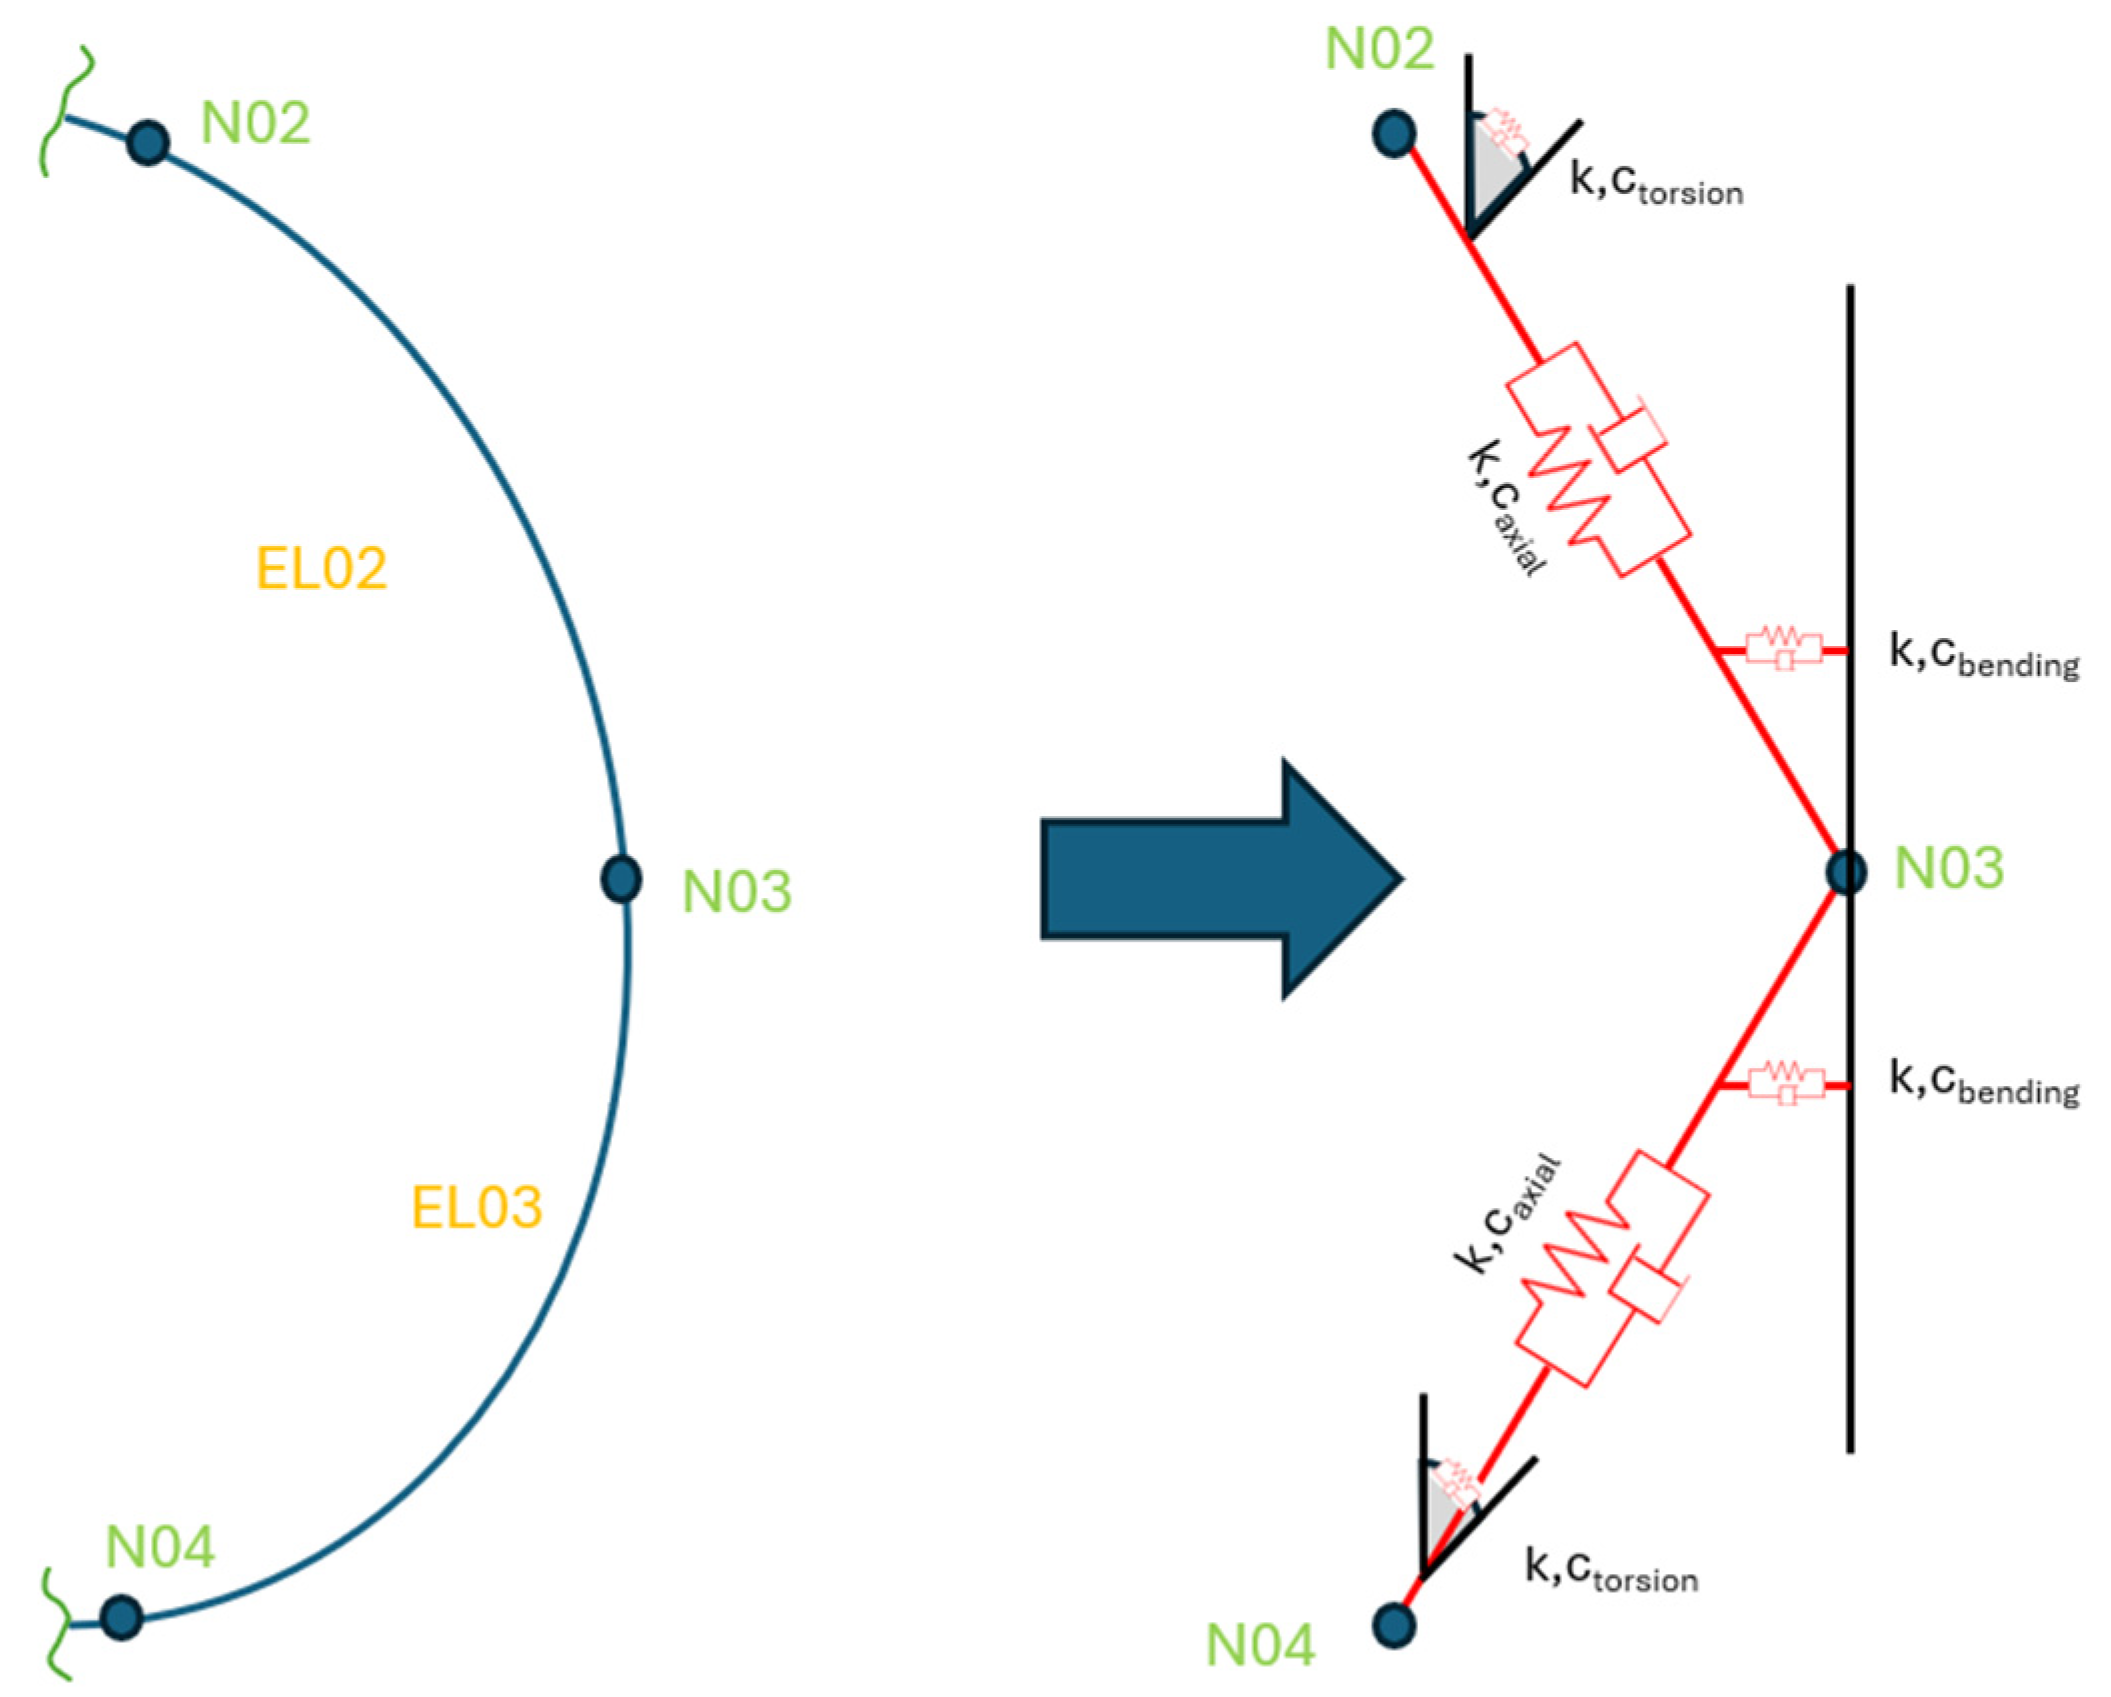
Orcaflex [41] uses a different approach to model the riser. It divides the line into massless segments, with nodes at each end of a segment (Figure 8). The segments account for the axial and torsional properties of the riser only, while other properties are lumped at the nodes. The bending properties are represented by rotational spring-dampers. The time-domain integration is nonlinear and uses explicit or implicit integration algorithms.
All these programs can account for both geometric and material nonlinearities, such as large displacements. It is also essential to account for wave spatial variation to accurately compute the fluid particle velocities and accelerations acting along the riser.
Regarding material behavior, flexible risers exhibit inherent nonlinearity due to interlayer slip. This slip depends on contact pressures and friction between layers. As discussed in the next section, this behavior is represented in numerical programs through a nonlinear relationship between bending moments and curvatures.
Finally, another important aspect is soil modelling, which is typically represented in a simplified way through nonlinear distributed springs [41,45]. These springs act along the entire portion of the riser in contact with the seabed up to the truncation point of the model, usually located at the connection between the riser and the flowline, where all degrees of freedom are restrained. The springs must account for vertical, lateral, and axial displacements.

2.3.3. Consideration of Hysteretic Behavior in Global Analyses

Regardless of the approach adopted for global analyses, standards such as API STD 2RD [1] emphasize the importance of careful flexible riser modelling to ensure the analysis results are accurate. Several authors have studied the influence of factors such as hysteretic behavior in bending and the proper modelling of the top connection on these results [46,47,48,49].
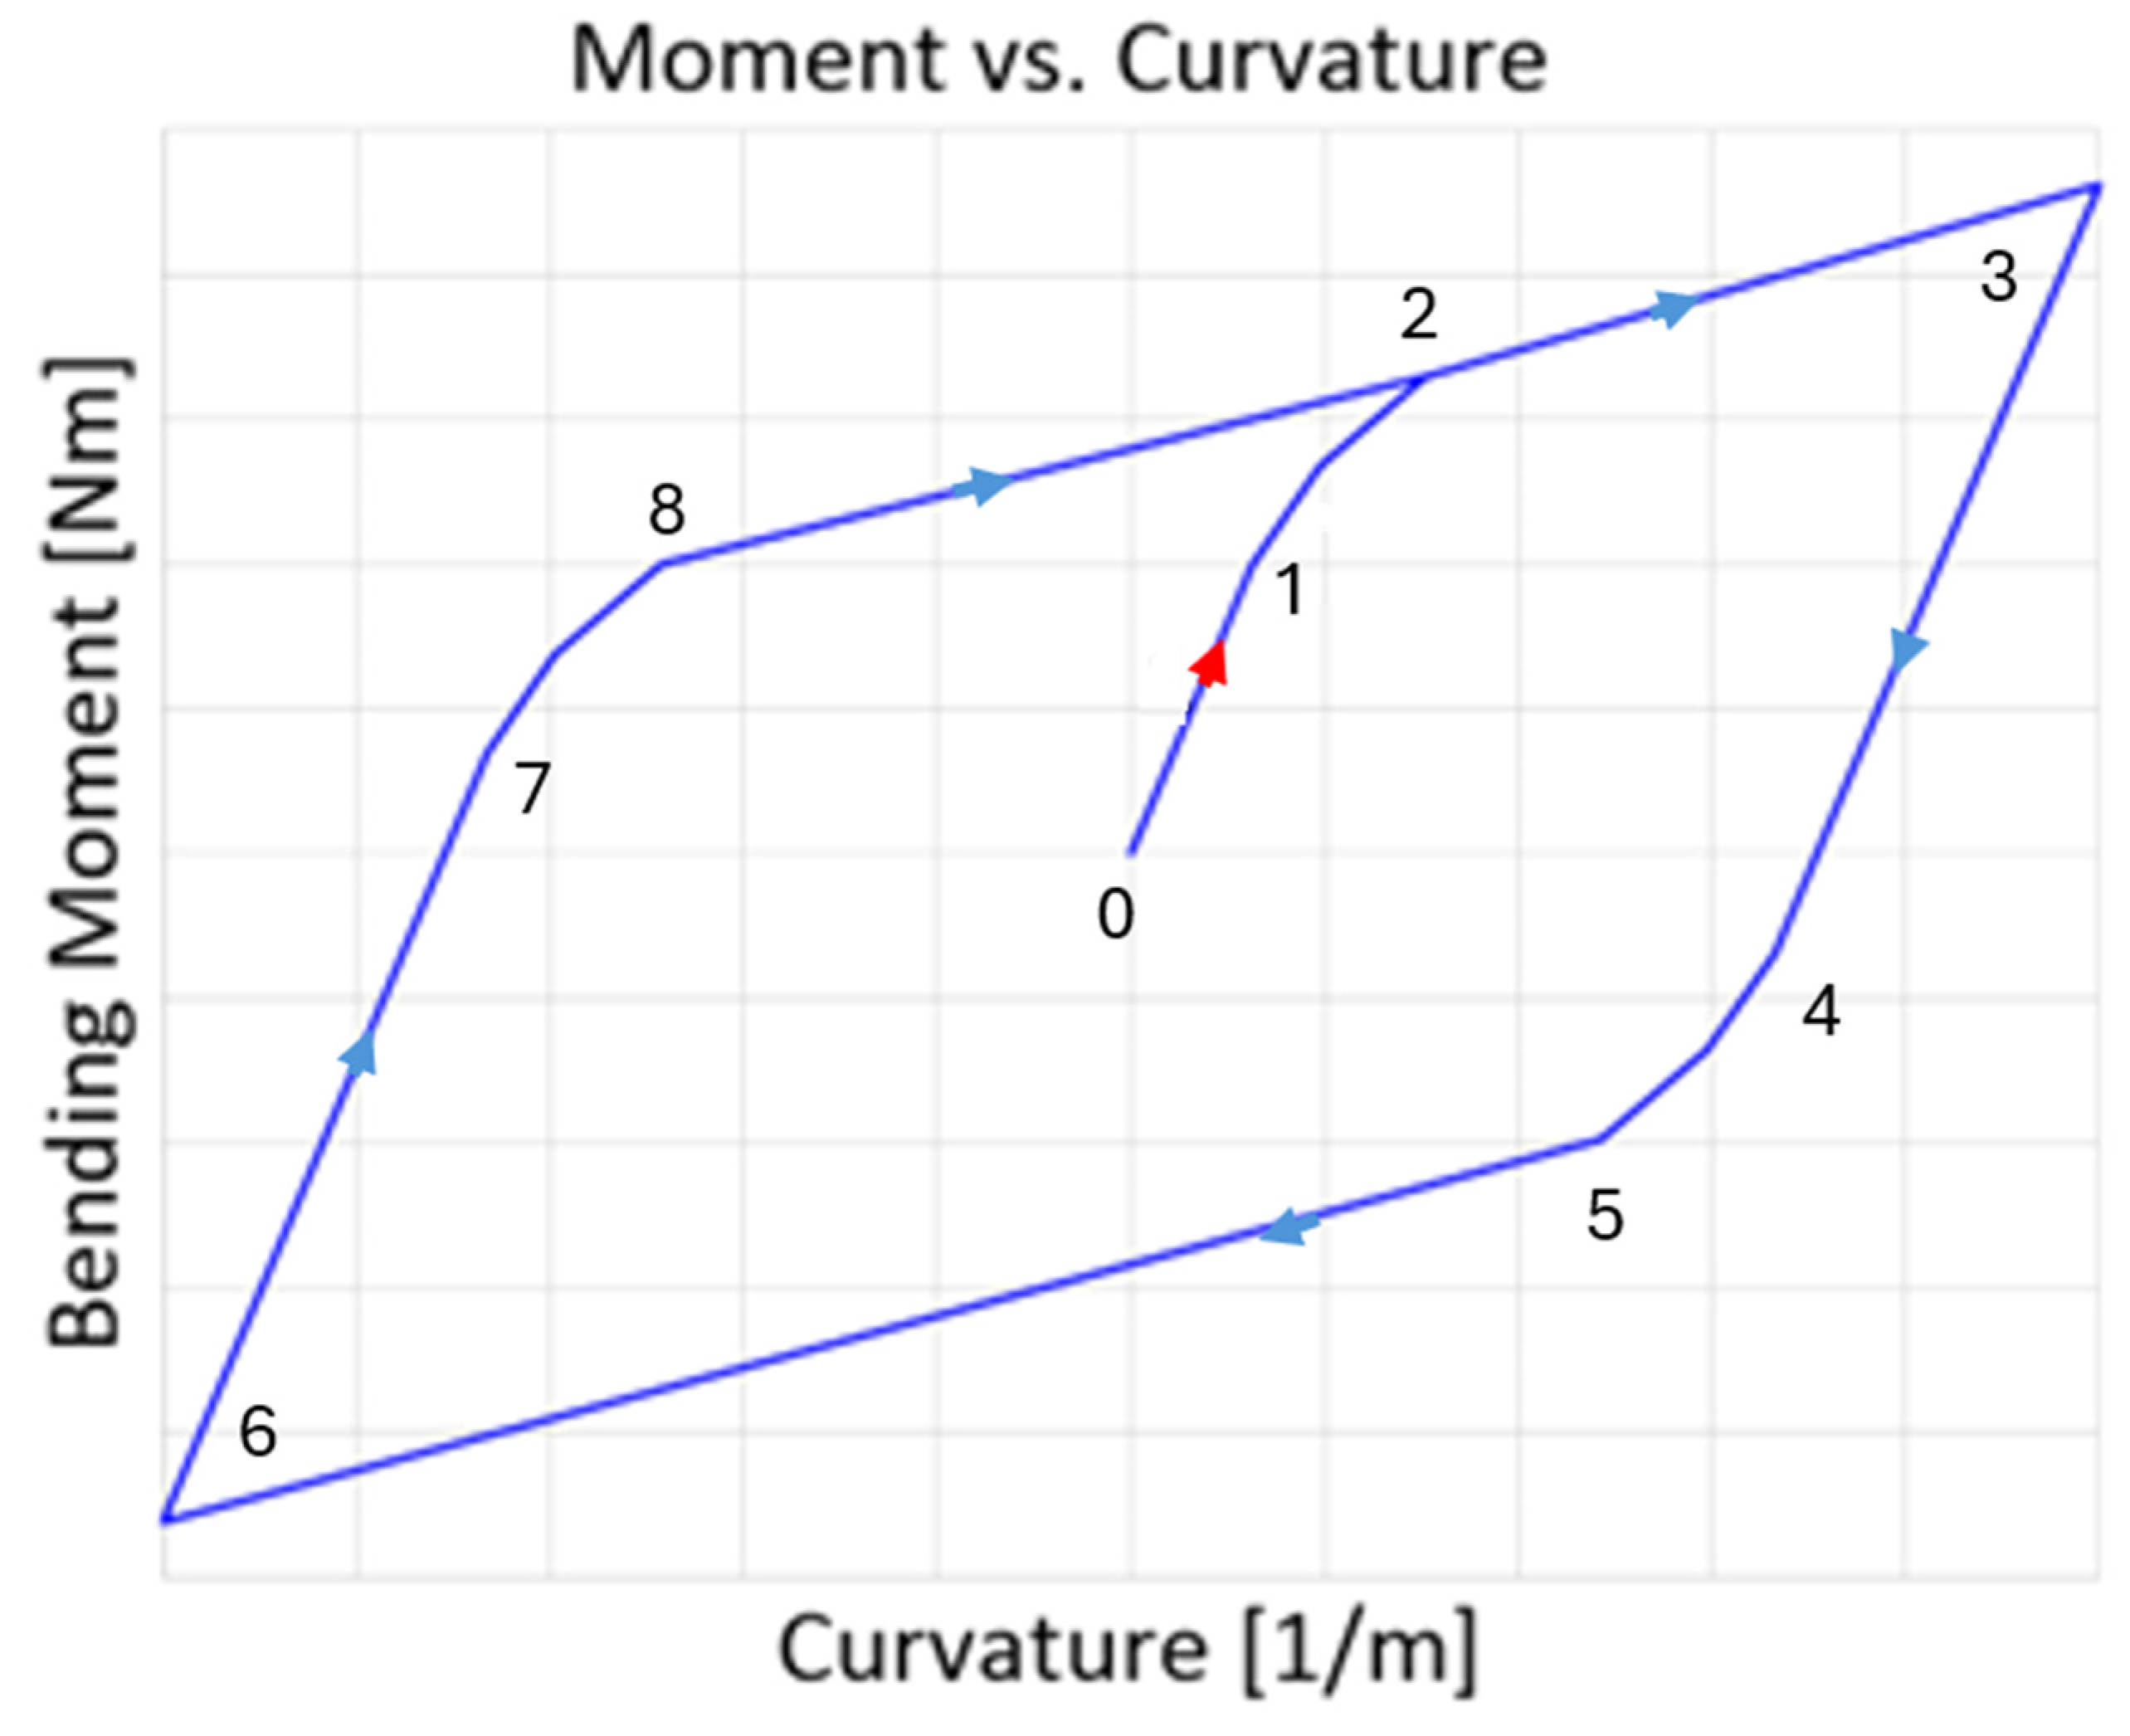
Unlike rigid risers, the moment-curvature relationship of flexible risers is nonlinear and influenced by interlayer slippage [46,49], as shown in Figure 9. This behavior tends to affect regions more susceptible to bending, such as the section of the riser inside the bend stiffener, the TDZ, and segments with floaters, especially in lazy-wave configurations [46]. In this way, it is possible to model only the segments with greater curvature variations using hysteresis, while keeping the other segments with a linear moment-curvature relationship (PHM—Partial Hysteresis Modelling method [46]).
The relationship between bending moment and curvature depends on the riser structure and on the friction and contact pressures between its layers. Contact pressures, in turn, are influenced by the axial tension and by the internal and external pressures acting on the pipe. When an initially straight riser (point “0” in Figure 9, adapted from [47]) begins to bend, the moment–curvature relationship is initially linear, and the bending stiffness is high (pre-slip condition), until point “1” is reached. From this point onward, sliding between the layers begins, and it continues until point “2” is reached.
In the segment “2–3”, the layers slide freely until the external loading reverses. After point “3” the internal friction is restored, and the riser again exhibits high bending stiffness. At point “4”, interlayer sliding begins once more, and the behavior described previously is repeated. Thus, under cyclic loading, the moment–curvature relationship follows the sequence “2–3–4–5–6–7–8–2”.
The values of bending moment and curvature vary substantially depending on the riser structure. As a reference for orders of magnitude, a 2.5-inch diameter riser may present a post-slip bending stiffness on the order of 2 kN·m2 and a maximum allowable curvature of 1 m−1. For an 8-inch riser, the corresponding values would be on the order of 250 kN·m2 and 0.25 m−1, respectively.
The hysteretic bending behavior results in nonlinear bending deformations at critical locations, and variations in axisymmetric loads affect the curvature response by changing the critical curvature and hysteresis curve. Also, the shear deformation of polymer layers significantly affects the fatigue damage of helical wires. These shear-deformed layers cause greater bending deformation than under the plane-remains-plane assumption but reduce fatigue damage in helical wires by decreasing the frictional stress range during bending.

2.3.4. Bend Stiffeners in Global Analysis

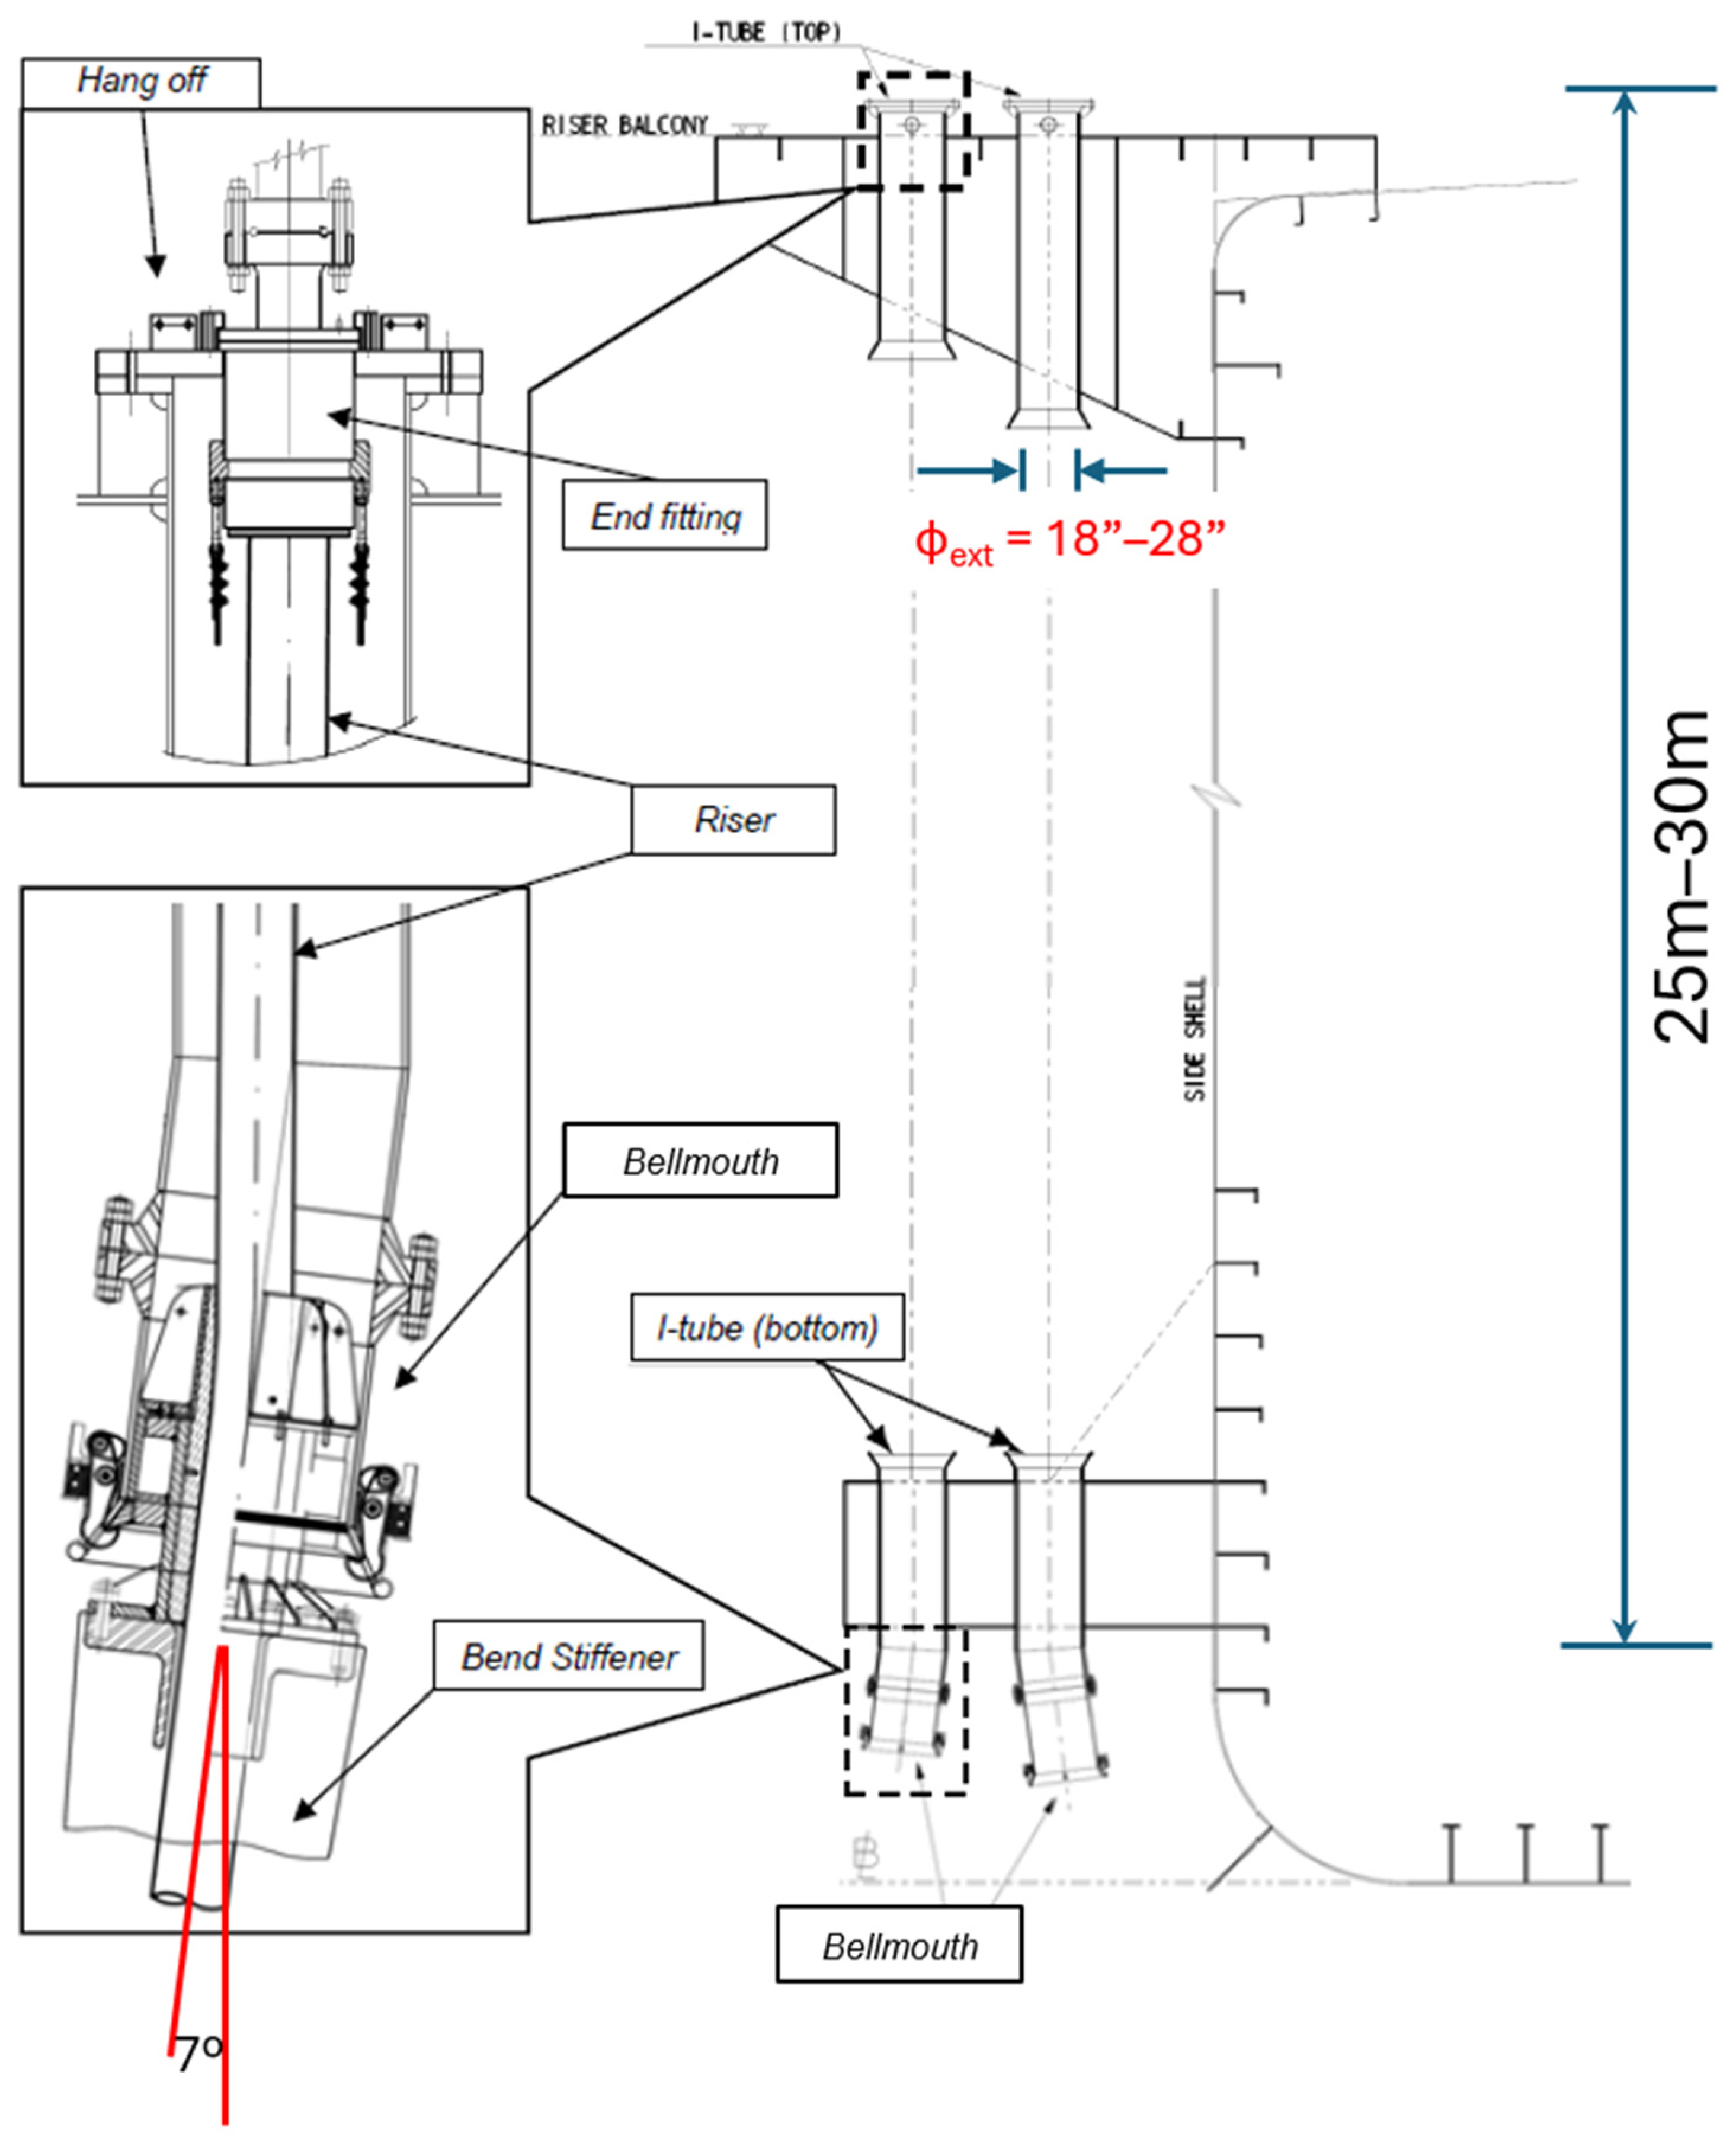
A bend stiffener’s main structural function is to provide a smooth transition in stiffness between the flexible riser and the platform, preventing excessive bending. It protects the flexible component from breaking or fatiguing over time (Figure 10 [50]).
To avoid re-simulating the entire line when the bend stiffener fails to meet design criteria (fatigue life or extreme curvatures), it is a common practice to decouple the bend stiffener design from the global line analysis. Decoupling is achieved by modelling the riser as pinned during analysis; then, using the tension and angular variation results, the bend stiffener can be verified separately.
This decoupling is supported by studies such as Boef and Out [51]. Assuming that bending is caused by tension and angular variations and that the bend stiffener’s cross-section varies smoothly in a conical shape, this model enables the use of simple numerical solutions to calculate curvatures along the bend stiffener. Their model is particularly suitable for loading conditions in which the excitation frequencies are not excessively high, so that rate-dependent and inertial effects in the elastomeric material remain negligible. Under such circumstances, the response of the bend stiffener can be represented by a nonlinear moment–curvature relationship. The model is well adapted for global riser analyses where an equivalent stiffness representation is required and where contact between the riser and the restrictor develops in a progressive, continuous manner. Under these conditions, the model provides an efficient and physically consistent approximation of the top connection’s behavior.
The possibility of decoupling the bend stiffener evaluation from the rest of the line has inspired several other studies. For example, Bazán et al. [52] developed an optimization algorithm to generate stiffeners with the smallest possible volume, thereby minimizing costs. The optimization includes criteria such as fatigue life and extreme curvatures.
Some authors proposed local models to calculate tensions and curvatures along the stiffener, based on global analyses in which the top connections are modelled with less detail. He et al. [48] developed a large-deflection beam formulation for the riser-bend stiffener top connection, considering interaction with an I-Tube. The end fitting is connected to the top of the I-Tube. The riser interacts with the vertical I-Tube and with the curved section in the bellmouth region. The developed mathematical formulation consists of three coupled differential equation systems (one for each section of the riser—straight I-Tube, bellmouth, and top riser plus bend stiffener). The authors concluded, through a 7″ riser case study, that the riser curvature in the end fitting region is affected by the sleeve shape and the I-Tube length. They also observed that the sleeve radius not only controls the initial contact angle and curvature distribution in the contact region, but also, below a certain radius, the riser no longer interacts with the curved section; it directly contacts the straight sleeve region, leading to a peak in riser curvature.
Finally, Lu et al. [53] developed a nonlinear finite element model that includes the bend stiffener to investigate in detail the mechanical behavior of the top connection segment, where curvature and contact pressure vary. They compared their proposed model with a constant curvature numerical model and an analytical model. For transversal bending stresses, all models showed good agreement. However, normal and friction stresses vary significantly across models, particularly under extreme loading, due to interactions between the riser and the bend stiffener.

2.4. Structural Analysis, Substep Two: Local Analysis

Once the time series of tensions and curvatures have been obtained for all evaluated sea states, the next step is to calculate the tensile stresses in the armor wire. The calculation of these stresses, as well as understanding the structural behavior of flexible risers, is much more complex than for rigid risers and is still evolving today.
As noted by Pan et al. [17], throughout the 1970s and 1980s, several studies contributed to improving the structural representation of flexible risers in both global and local analyses. Notable among these studies are those by Burke [54], Nordgren [55], Sparks [56], and Triantafyllou [57]. Subsequently, from the late 1980s onward, formulations for calculating stresses due to axisymmetric and bending loads began to be proposed, relying on analytical and numerical models.
The local mechanical response of flexible pipes under axisymmetric loading has been widely investigated through analytical and numerical approaches. Classical analytical models are based on equilibrium and compatibility equations and typically adopt simplifying assumptions, such as geometric regularity, plane-section reduction, neglect of shear and interlayer friction, and linear elastic behavior [58]. These hypotheses were foundational in early models proposed by Feret and Bournazel [59] and Batista et al. [60], and remain influential in subsequent developments.
In the 1990s and early 2000s, the incorporation of Clebsch–Kirchhoff curved-beam theory [61] enabled more refined representations of metallic armors and polymeric sheaths. By accounting for interlayer interaction and possible gap opening, these models improved predictions of axial compression and torsional responses, as demonstrated by Witz and Tan [62], McIver [63], and Custódio and Vaz [58]. The predictive capability of analytical formulations was rigorously evaluated in a blind benchmark coordinated by Witz [64], comparing several academic and industrial models against experimental tension and torsion data from a 2.5″ flexible pipe. The study showed that an accurate representation of layer separation is essential for reproducing the axisymmetric response. Similar conclusions were drawn in the experimental investigations of Ramos Jr. et al. [65] and de Sousa et al. [66].
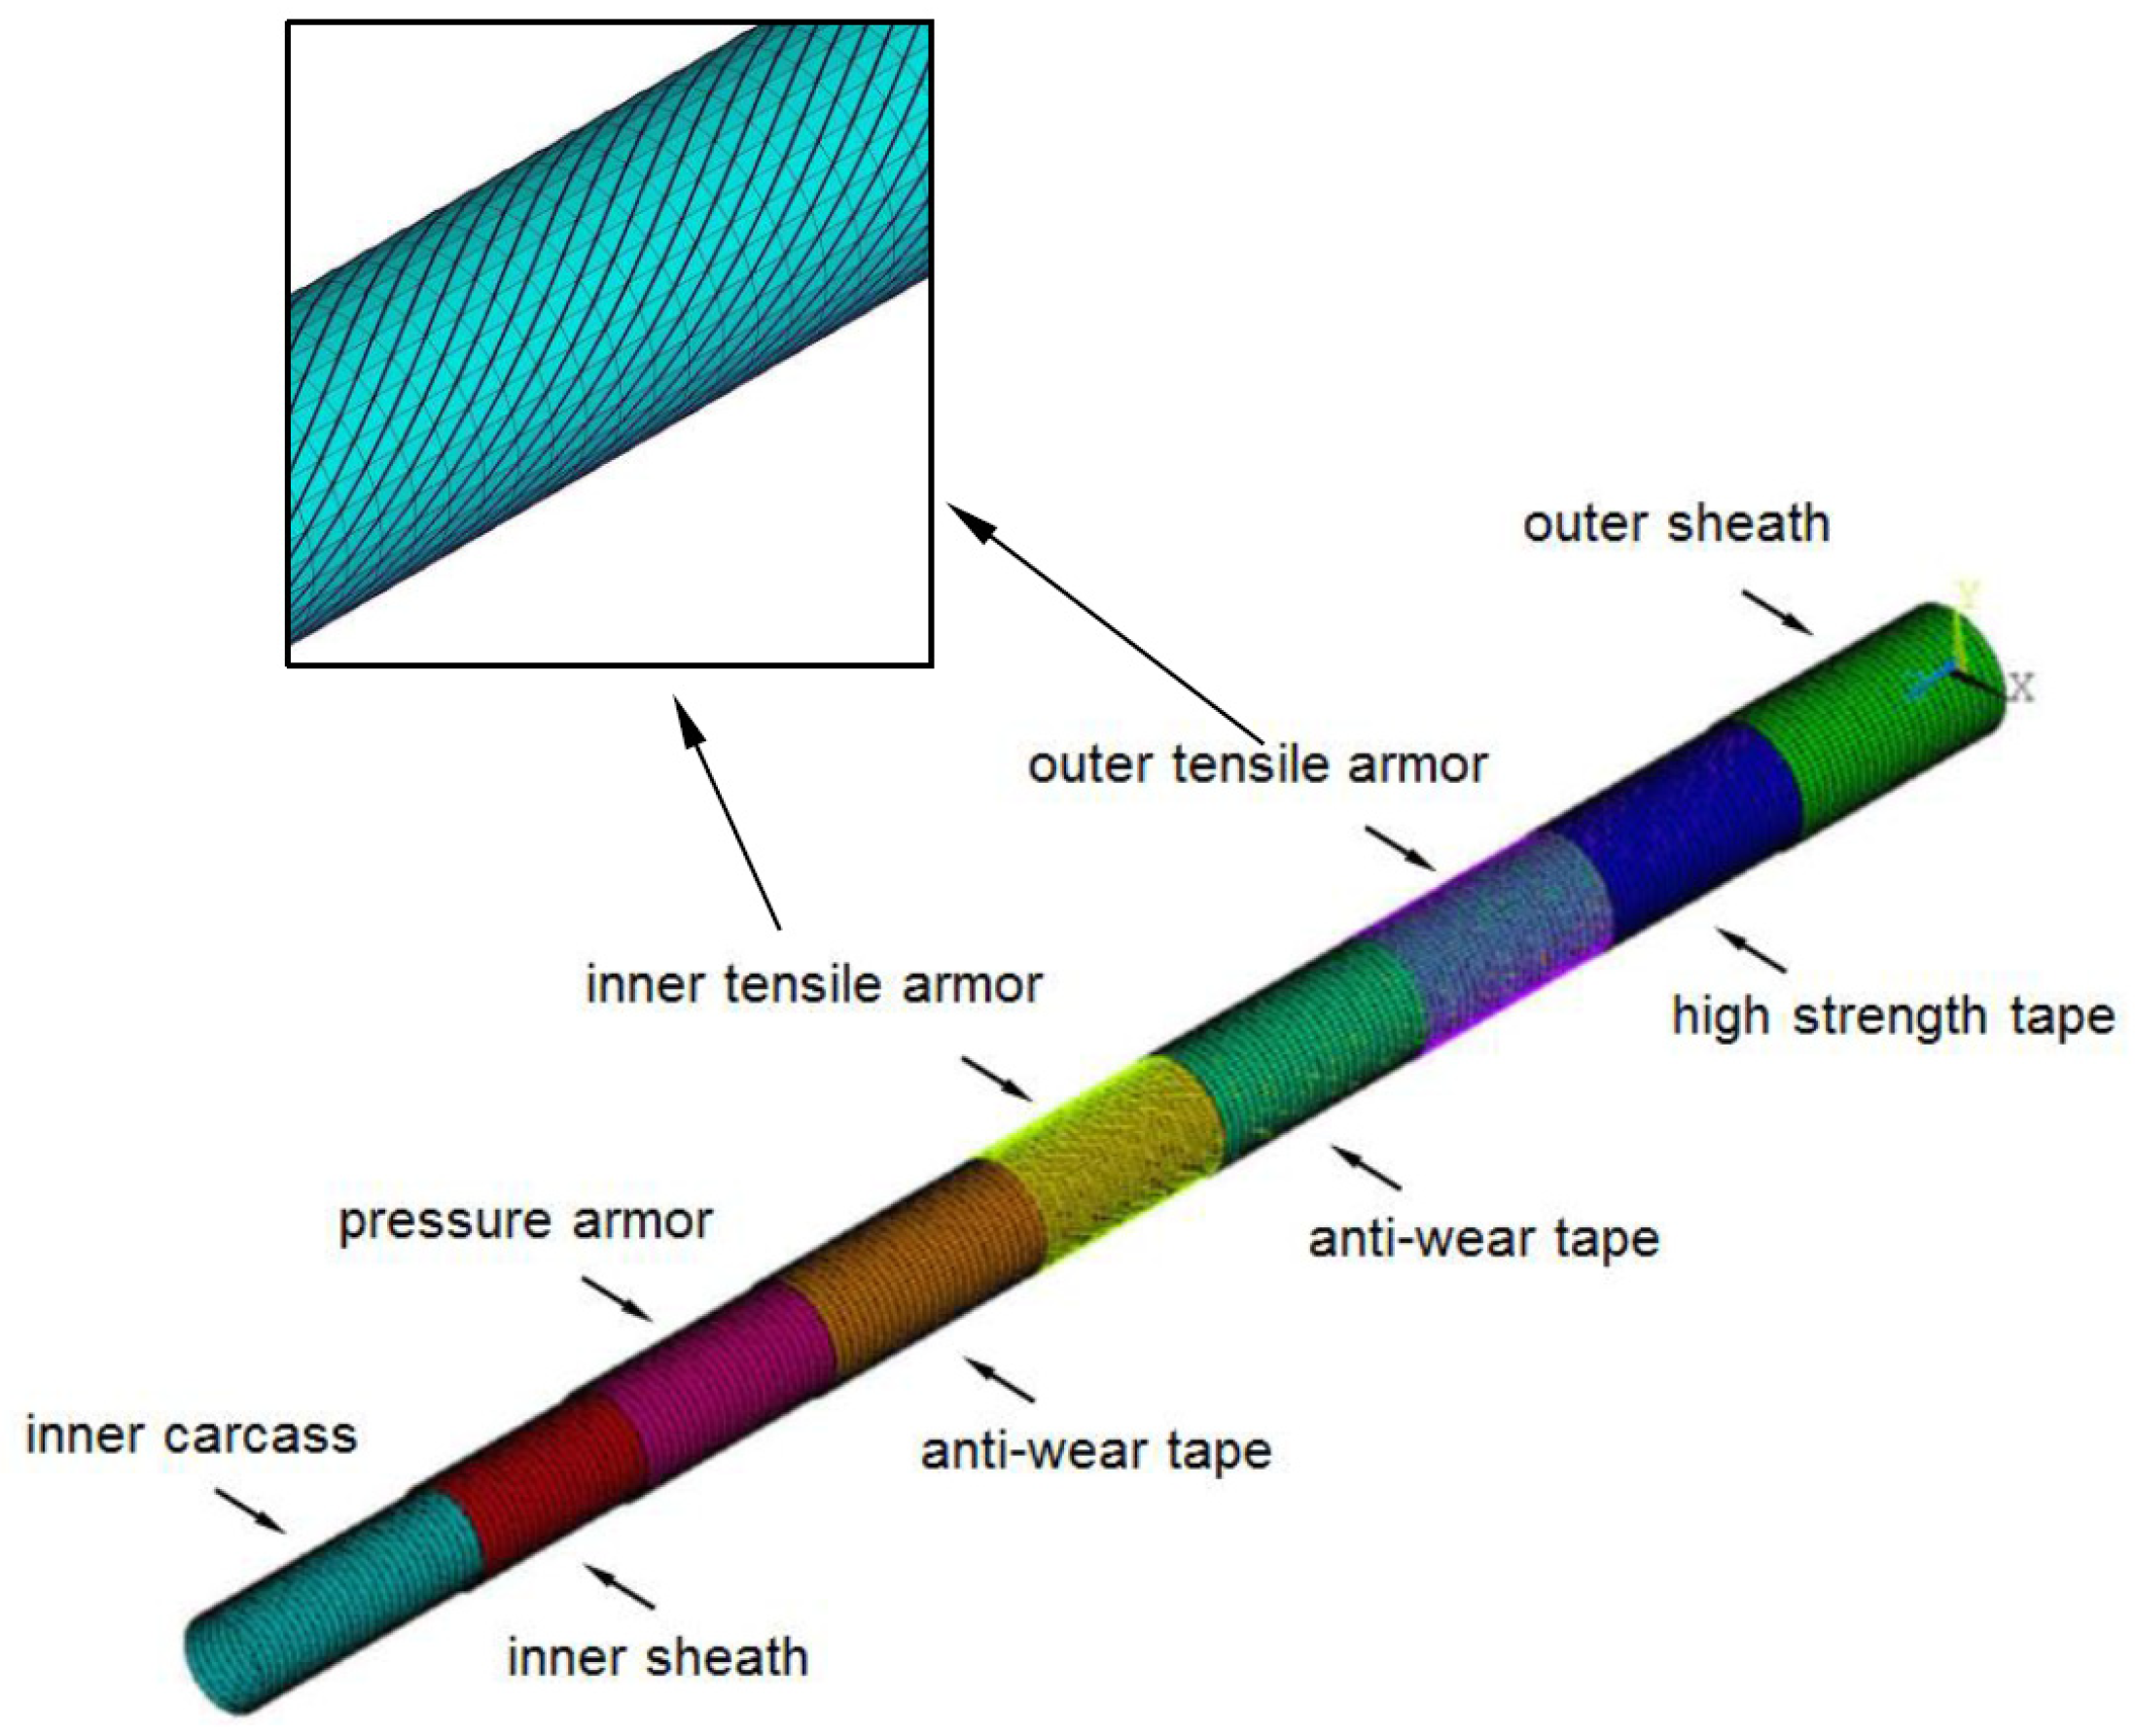
In contrast, numerical models, predominantly based on three-dimensional finite element (FE) formulations, require fewer simplifying assumptions but involve higher computational cost. These models employ solid, shell, and beam elements and can explicitly represent geometric imperfections, nonlinear interlayer contact (including friction and gap opening), and material nonlinearities. A generic view of one of these models is presented in Figure 11. For operational and axial failure analyses, complex pressure-layer cross-sections are often modeled using equivalent layers [67,68,69,70,71], while tensile armor layers are represented explicitly using beam or solid elements. To reduce computational effort, strategies such as repeated unit-cell modeling [72] and macroelements [73] have been proposed. Numerical models have been validated against experimental campaigns conducted by Witz [64], Ramos Jr. et al. [65], Saevik [68], and de Sousa et al. [74], generally showing good agreement with both measurements and analytical predictions.
While the axisymmetric response under moderate loading (essential for fatigue analysis) is reasonably well predicted by classical formulations, bending behavior remains comparatively more complex. Local bending analysis can be performed analytically or numerically. Analytical bending models may be classified into those predicting the bending moment–curvature relationship and those estimating stresses in tensile armor wires. These formulations, typically grounded in differential geometry and continuum mechanics, provide closed-form expressions with limited computational cost. In contrast, FE models simultaneously capture global curvature response and local stress distributions, albeit at significantly higher computational expense.
In all models, a central challenge in bending analysis is accurately modeling interlayer friction, particularly between tensile armor wires and adjacent layers, as it strongly influences stiffness, hysteresis, and stress redistribution. Classical studies on the bending behavior of unbonded flexible pipes began with Feret and Bournazel [59], who experimentally identified the characteristic moment–curvature hysteresis and motivated the development of the first analytical models based on differential geometry to describe interlayer slip mechanisms. These formulations were primarily aimed at predicting either the global bending stiffness (i.e., the moment–curvature relationship and its cyclic evolution) or the local stresses in tensile armor wires for structural integrity and fatigue assessments. Subsequent analytical extensions incorporated refined kinematic assumptions and additional mechanical effects, including torsion and shear, as well as alternative descriptions of wire trajectories (geodesic versus loxodromic), leading to dedicated models for reproducing the hysteresis loop and/or computing wire stresses [33,75]. In parallel, numerical FE approaches were introduced to explicitly model armor wires and surrounding layers, including contact and friction effects, enabling simultaneous prediction of the global bending response and local stress distributions, particularly for variable curvature conditions and near end fittings [63,76]. Other earlier developments sought to improve hysteresis prediction and mechanical consistency between stiffness and stress evaluations through refined analytical or hybrid formulations [77,78].
More recently, building upon the formulations of Kebadze and Kraincanic [78], Dong et al. [79] incorporated bending and torsion of individual helical elements, and demonstrated, through comparison with experimental tests reported by Witz [64], that an initial contact pressure was required to ensure convergence at low stiffness levels. Similarly, Ye et al. [80] introduced a correction factor to account for antiwear tapes, comparing predictions with experiments on a 4″ flexible pipe. Their results revealed pronounced hysteresis at low internal pressures, attributed to manufacturing-induced contact pressures, with discrepancies decreasing as pressure increased.
Further refinements were proposed by Kim et al. [81,82], who incorporated shear deformation in polymeric layers and curvature-induced variations in tension and contact pressure, improving agreement with FE simulations compared to Kebadze and Kraincanic [78]. Dai et al. [83] evaluated four different friction models through FE simulations and comparisons with the bending tests of Ye et al. [80], showing that a smoothed Coulomb formulation provided a suitable compromise between convergence and accuracy, although friction coefficients required calibration with internal pressure.
To improve computational efficiency, Wang et al. [84] developed a simplified three-dimensional FE model that reduced the number of layers and replaced surface-to-surface contact with a double-helix contact beam representation, achieving good agreement with experiments reported in [80] while significantly reducing computational cost. At the wire scale, Fang et al. [85] demonstrated via FE analysis that analytical models perform well for round helical wires but may lead to significant deviations when rectangular cross-sections are considered.
Complementing modeling efforts, Tang et al. [86] conducted large-scale experimental tests on an 8″ flexible pipe subjected to combined tension and bending. Using a four-point configuration with axial tensions up to 600 kN and curvatures up to 0.1 m−1, they monitored wire displacements and showed good agreement with analytical predictions based on tendon slip between loxodromic and geodesic paths.
Overall, the literature reveals a progressive evolution from simplified analytical formulations toward increasingly refined FE models capable of capturing nonlinear contact, frictional effects, and material behavior. However, the trend toward using sophisticated FE models may create challenges for fatigue life assessment, as these models require significant computational resources and may lead to excessively long total simulation times to obtain results. The fatigue analysis of flexible pipes requires a large number of local analyses that combine axisymmetric and bending loads. Hence, the direct use of numerical models is often infeasible, and more expedient approaches that rely on analytical models (possibly enhanced by results from numerical models) are desirable.
In this context, de Sousa et al. [20] proposed a set of functions for directly calculating tensile armor wire stresses from forces, pressures, and moments obtained from global analyses. These functions use coefficients determined with FE numerical models that include nonlinear contact behavior between layers. For axisymmetric loads, for example, the proposed expression for the axial stress is:
σ x a x i = f 1 a x T + f 2 a x C + f 3 a x P i n t + f 4 a x P e x t + f 5 a x T O , i   =   1 ,   n w ,
where nw is the number of wires in the flexible pipe layer; T , C , P i n t , P e x t , and T O are the tension, axial compression, internal pressure, external pressure, and torsion acting on the pipe section, respectively; and f j a x , j = 1 to 5, are coefficients that convert these axisymmetric loads into normal wire stresses.
In 2017, Larsen et al. [4] consolidated recommendations for the design and operation of flexible risers. The work proposed analytical formulas for stress calculations. For axisymmetric stresses, the formula proposed for structures composed of two layers of wires laid at equal and opposite angles, and with the same cross-section, is:
σ t = T w n A t cos α ,
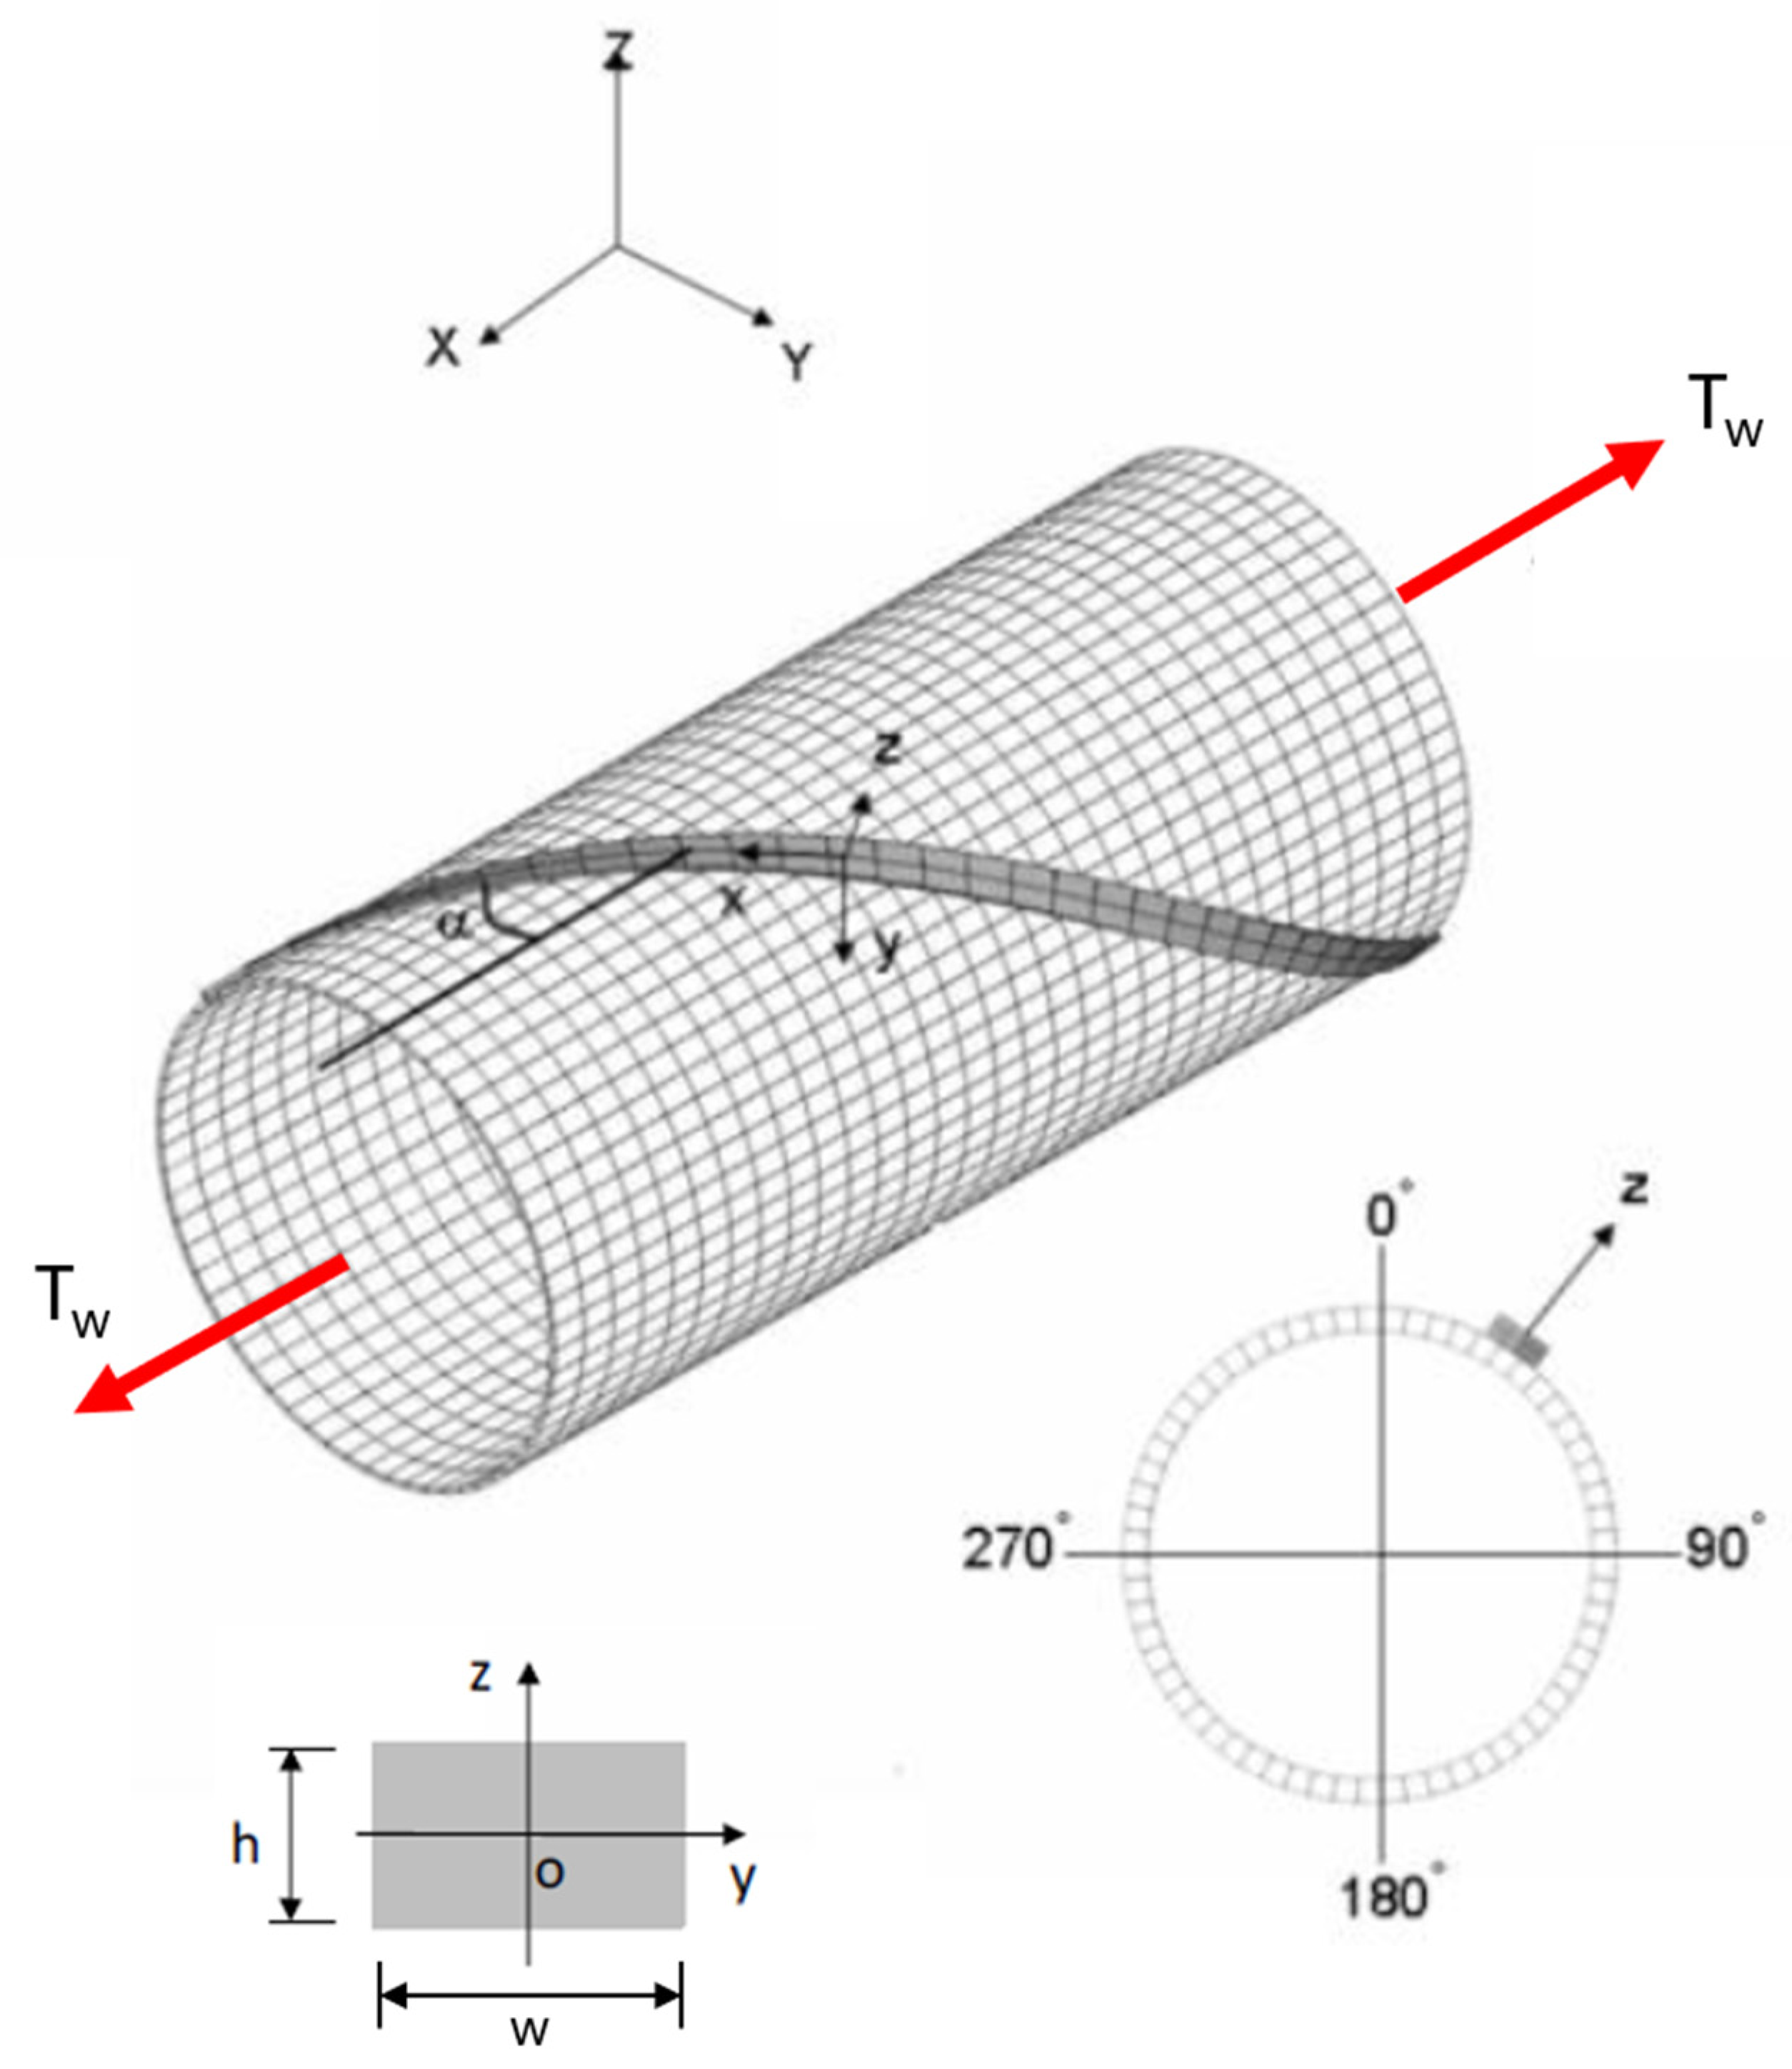
where Tw is the true wall tension (considering pressure effects), n is the total number of tensile armor wires, and A t is the wire cross-sectional area, calculated by the product h × w in Figure 12.
For bending, axial stresses are generated by the curvature along each wire and by friction effects (slippage between layers). The local bending behavior can be described by assuming that each wire follows a given path along the curved pipe surface, i.e., either a geodesic or a loxodromic.
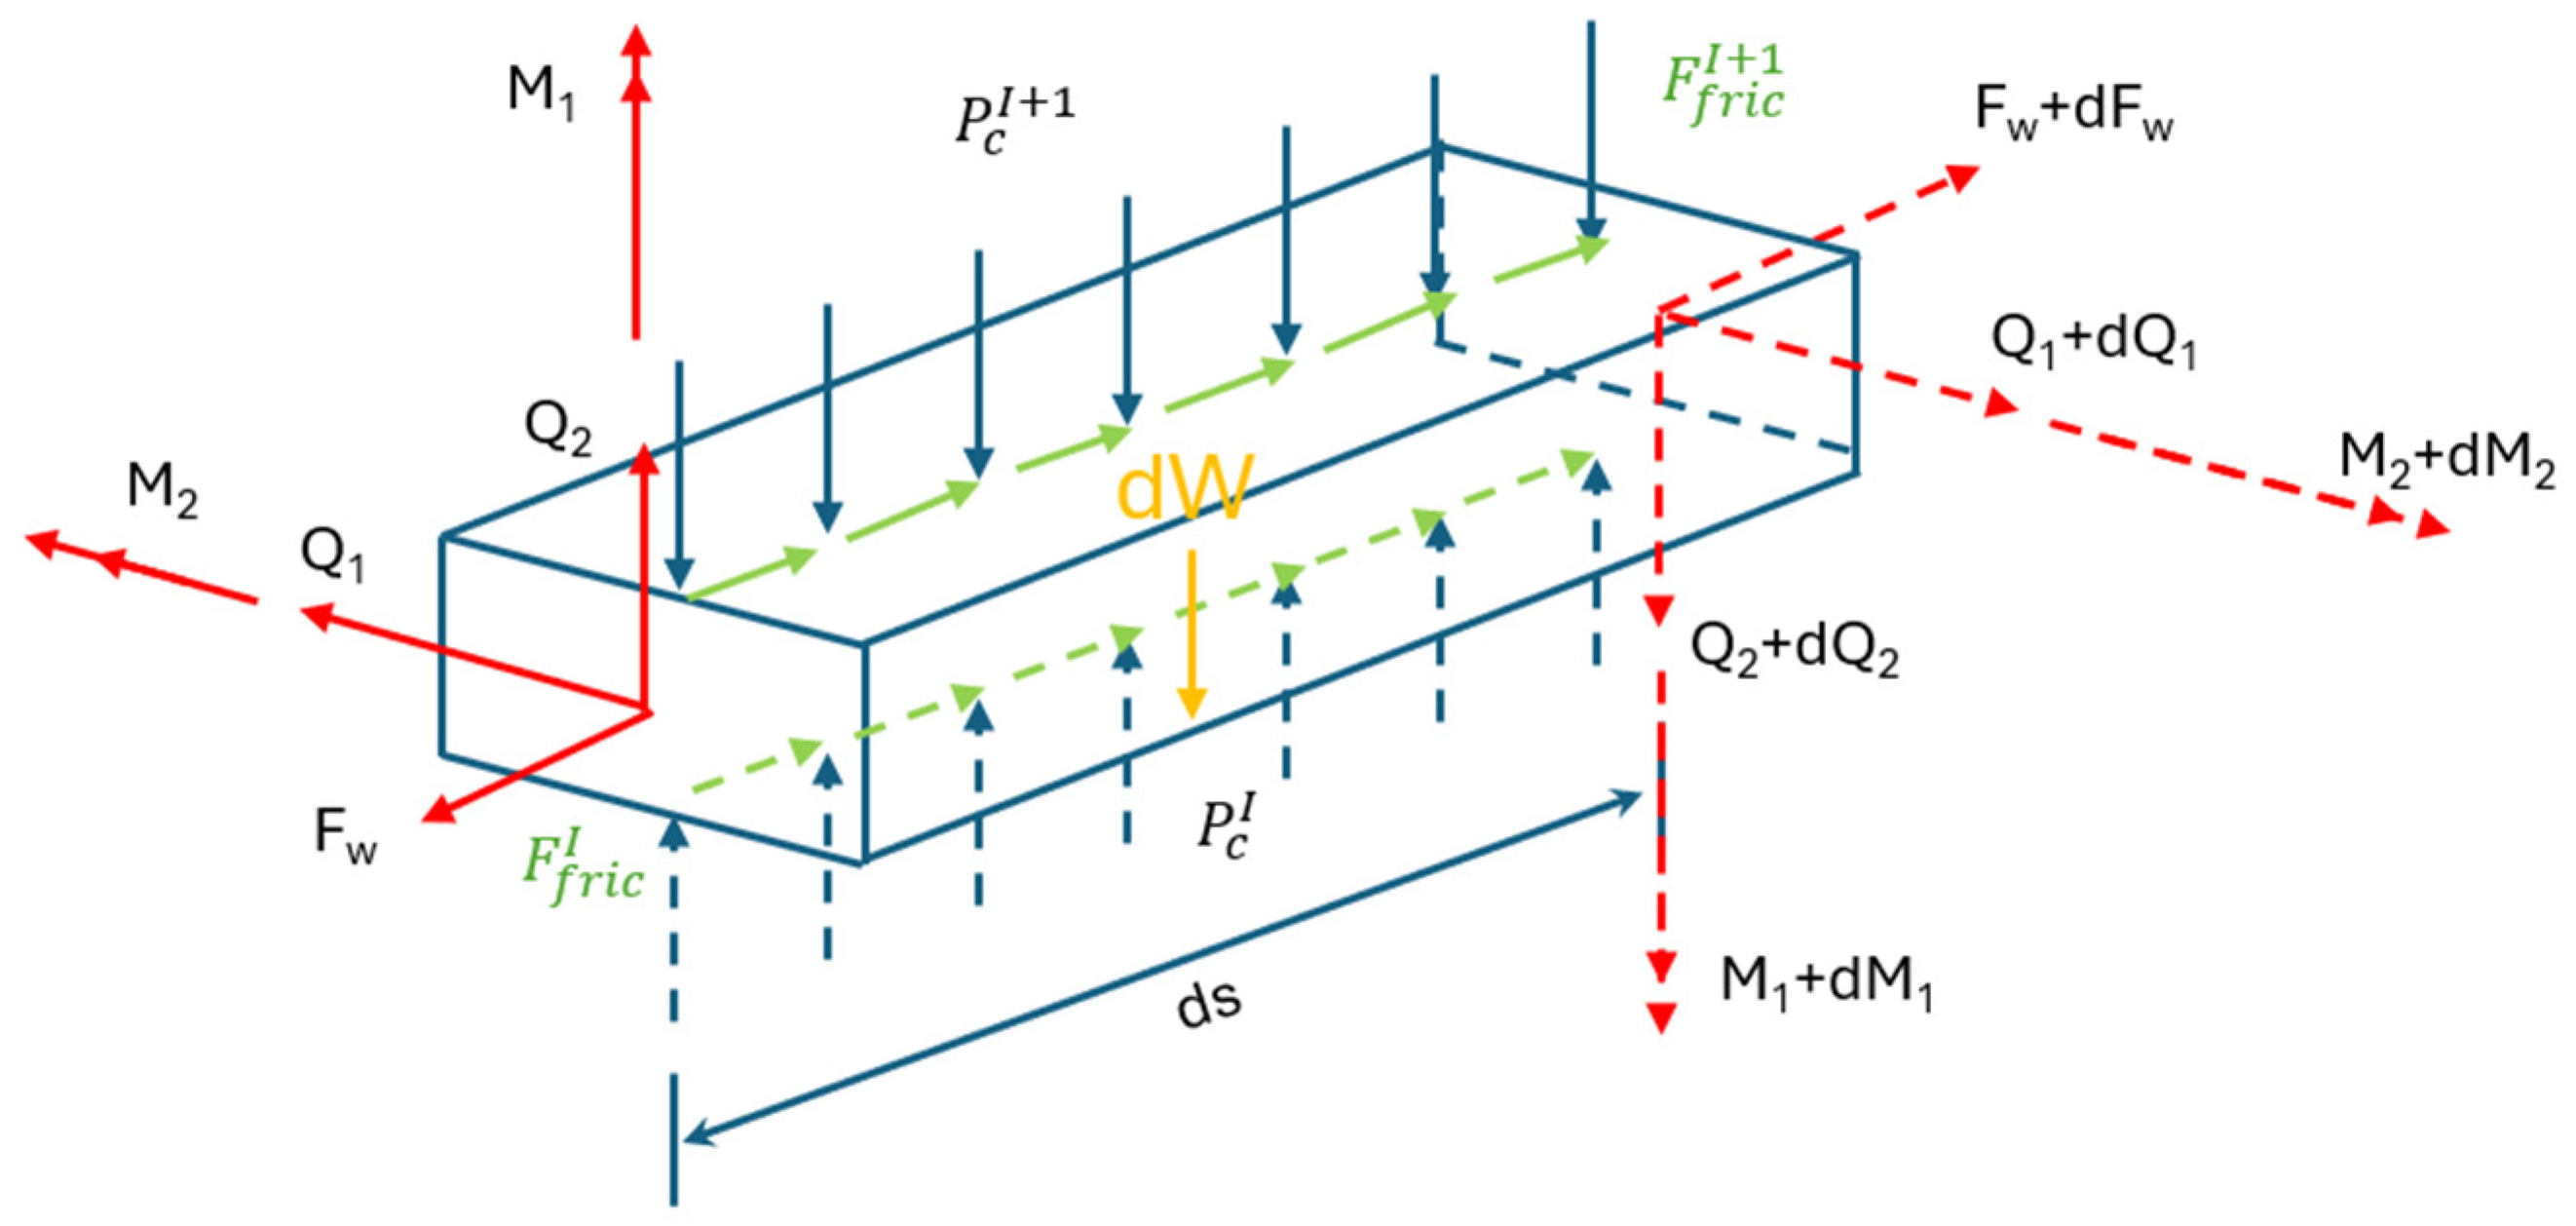
For a given bending moment, if the friction stresses imposed on the tensile armors exceed the frictional resistance capacity, relative slippage between tensile armors and adjacent layers is initiated. The curvature at which slippage begins (critical curvature), κ c r ( 1 ) , and the curvature corresponding to full layer slip, κ c r ( 2 ) (points “1” and “2” on Figure 9) are given by [4]:
κ c r ( 1 ) = μ · P c I + P c I + 1 E · e · c o s 2 α · s e n α ,
κ c r ( 2 ) = 4 π · κ c r ( 1 ) ,
where μ is the friction coefficient between tensile armors and adjacent layers, P c I and P c I + 1 are the contact pressures on the lower and upper faces of the tensile armor, E is the Young modulus, e is the tensile armor thickness, and α is the lay angle, as represented in Figure 13.
Based on a bilinear approximation, the maximum stress induced by friction in the tensile armor, at a given cross-section, is expressed as:
σ x a t κ = π 2 · a e · s e n α · μ · P c I + P c I + 1 · κ κ c r 2 ,     κ κ c r 2 π 2 · a e · s e n α · μ · P c I + P c I + 1 ,     κ > κ c r 2 ,
where a is the mean layer radius.
If transverse displacements of the wires during pipe bending are not allowed, the curvatures follow the loxodromic curve, i.e.,
κ l , y κ = c o s 4 α · κ ,     κ κ c r ( 2 ) c o s 4 α · κ c r ( 2 ) + c o s 2 α · c o s 2 · α · κ κ c r ( 2 ) ,     κ > κ c r ( 2 ) , κ l , z ( κ ) = 1 + s e n 2 α · c o s α · κ ,
Thus, at a given cross-section of the pipe, the maximum normal and binormal stresses are expressed as:
σ x y κ = E · e 2 · κ l , y κ , σ x z κ = E · b 2 · κ l , z κ ,
where κ l , y κ and κ l , z κ are curvature increments in y and z directions.
The friction coefficient μ between layers plays a fundamental role in stress calculation. Higher friction coefficients tend to significantly increase frictional stress and, consequently, reduce fatigue life. However, this coefficient is difficult to determine because it depends on the contact conditions between the tensile armor and the adjacent layers. To assess this influence, De Sousa et al. [20] conducted a sensitivity study in which μ ranged from 0 to 0.2, demonstrating fatigue-life variations spanning three orders of magnitude. Typical values of μ used in both engineering practice and academic studies range from 0.1 to 0.15 [87]. Higher values may be adopted for older pipes or in areas near the top connectors.
Finally, the total stresses acting at a given corner of each wire can be calculated by summing the axisymmetric stresses, friction-induced bending stresses, and normal and binormal stresses, considering the wire’s position along the cross-section [4]. The number of points to be evaluated must consider the three-dimensional nature of the loading; according to De Sousa et al. [20], a minimum of 16 wires (64 points) per armor layer is recommended.
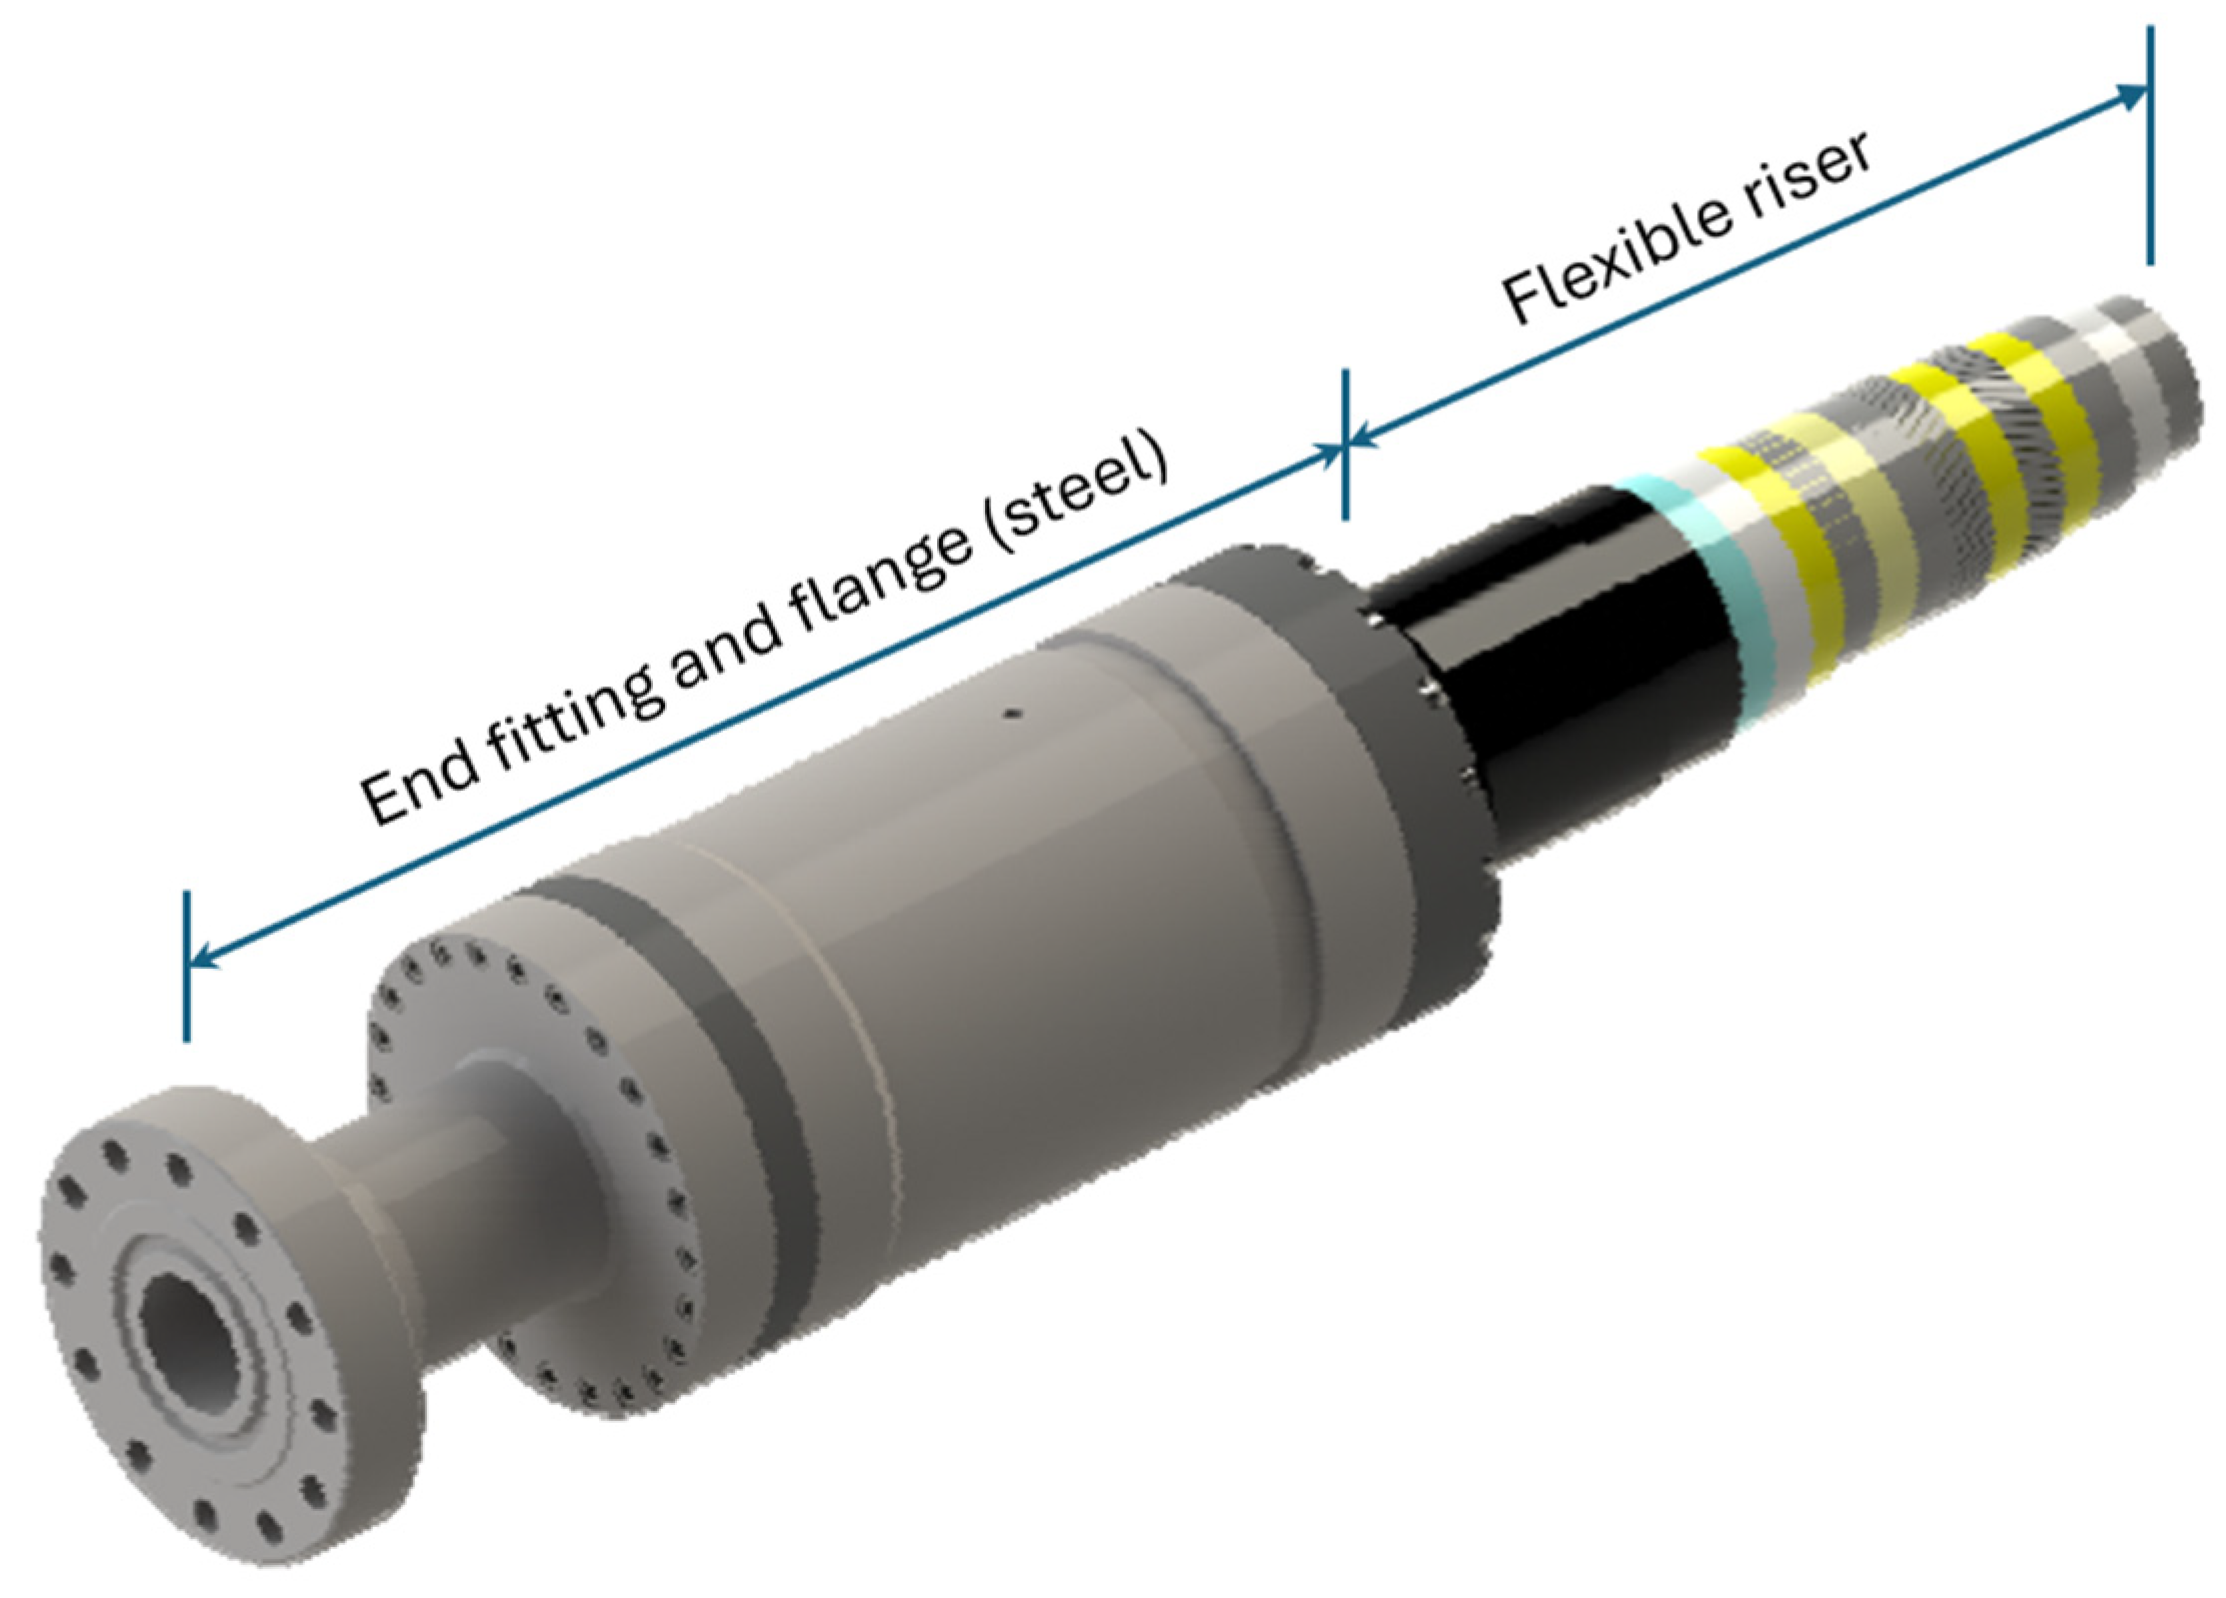
These stresses apply to the tubular body region. However, a critical region for the integrity of a flexible riser is the end fitting area (Figure 14). API RP 17B [3] provides a detailed description of these components. Authors such as Shen et al. [88] and De Sousa et al. [89] developed models to estimate these stresses, accounting for the geometry of the end fitting, the properties of the epoxy resin, and residual stresses from the FAT (Factory Acceptance Test). The results indicate the need to account for stress concentration factors to characterize stresses in end fittings, which are considerably higher than those in the tubular body.

2.5. Fatigue Life Calculation: Cycle Counting and Damage Accumulation

For each sea state and for all elements that compose the riser, time series of stresses need to be post-processed to separate stress cycles using the Rainflow Counting Method [28]. In this way, stress histograms and mean stresses for each point and evaluated sea state are generated.
To calculate fatigue damage, it is necessary to consider that S–N curves are developed under the assumption of constant mean stress or stress ratio (R). The stress ratio is defined as:
R = σ m i n σ m a x ,
where σ m i n and σ m a x are the minimum and maximum stresses used to generate each point on the S–N curve.
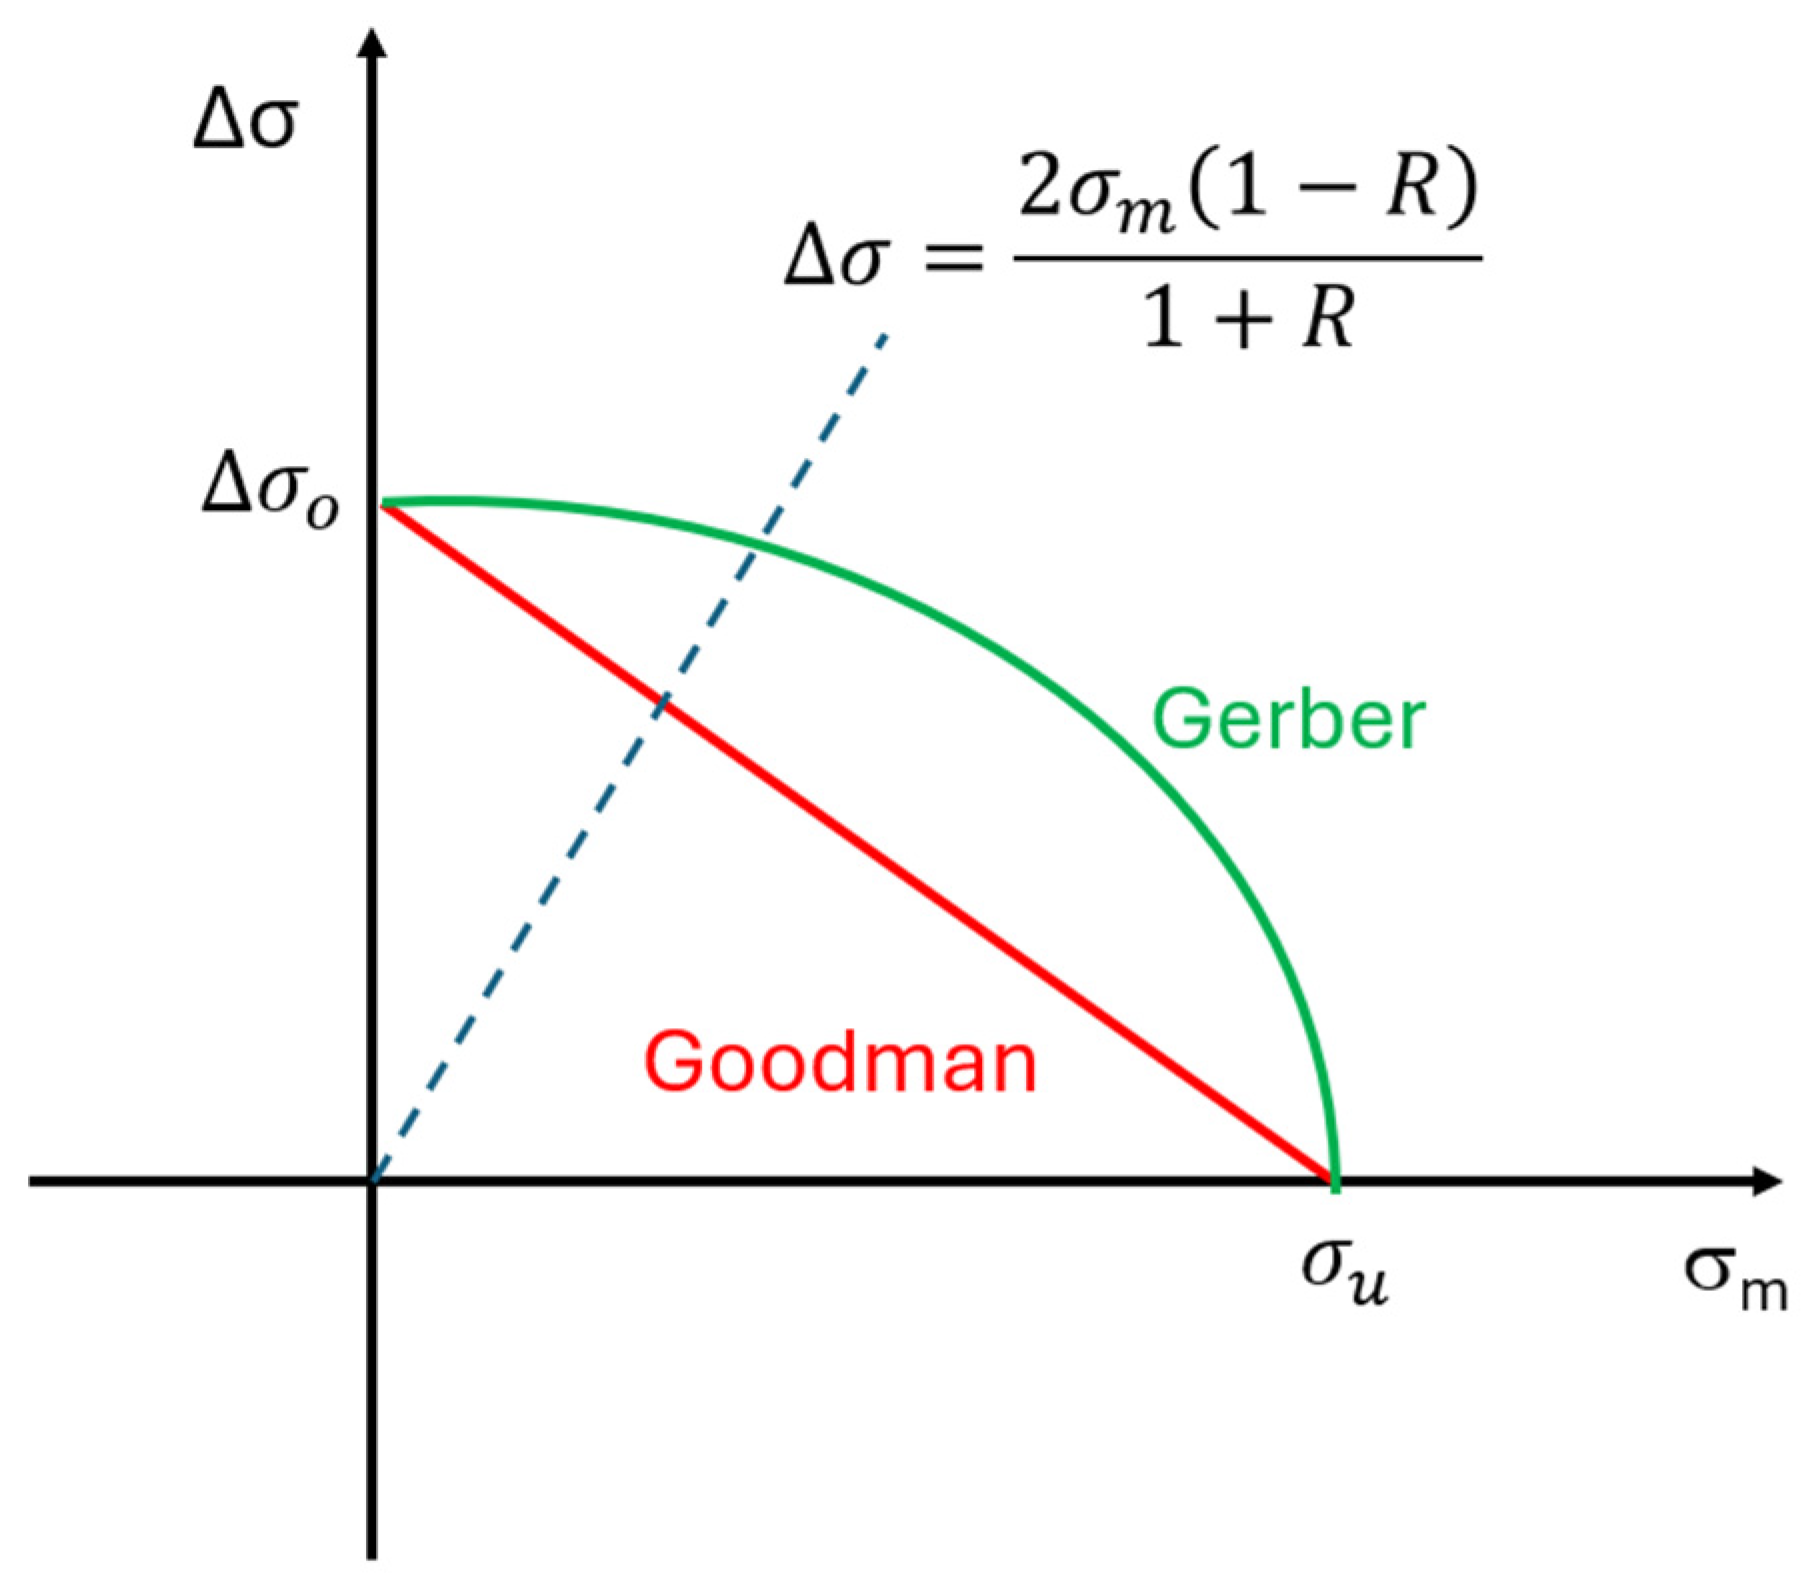
Therefore, it is necessary to correct stress ranges before using them in the S–N curves. The most used correction formulations are Goodman and Gerber corrections (Figure 15). According to Larsen et al. [4], considering S–N curves developed for constant stress ratios, the expressions used in the transformations are:
Δ σ 0 = Δ σ 1 σ m σ u n ,
Δ σ 0 = σ * 1 ( 1 + R ) σ * 2 ( 1 R ) σ u n ,
where Δ σ e σ m are the stress ranges and mean stresses obtained from the analyses; σ u is the ultimate tensile strength of the material; Δ σ 0 is the equivalent stress range assuming R = −1 (zero mean stress); σ * is the corrected stress range, to be used as input for the S–N curve; and n is equal to 1 for the Goodman correction, and 2 for the Gerber correction.
The use of S–N curves and the Palmgren–Miner rule is an industry standard, referenced in API RP 17B [3] and by Larsen et al. [4]. Alternatives to the linear Palmgren–Miner rule include nonlinear cumulative damage models that account for load-sequence effects [90], continuum damage mechanics formulations based on internal damage variables [91], and energy-based approaches that relate fatigue degradation to accumulated strain energy [92]. Although more physically consistent, these methods generally require additional material parameters and experimental calibration, which has limited their widespread adoption in flexible riser fatigue design.

2.6. Considerations About S–N Curves

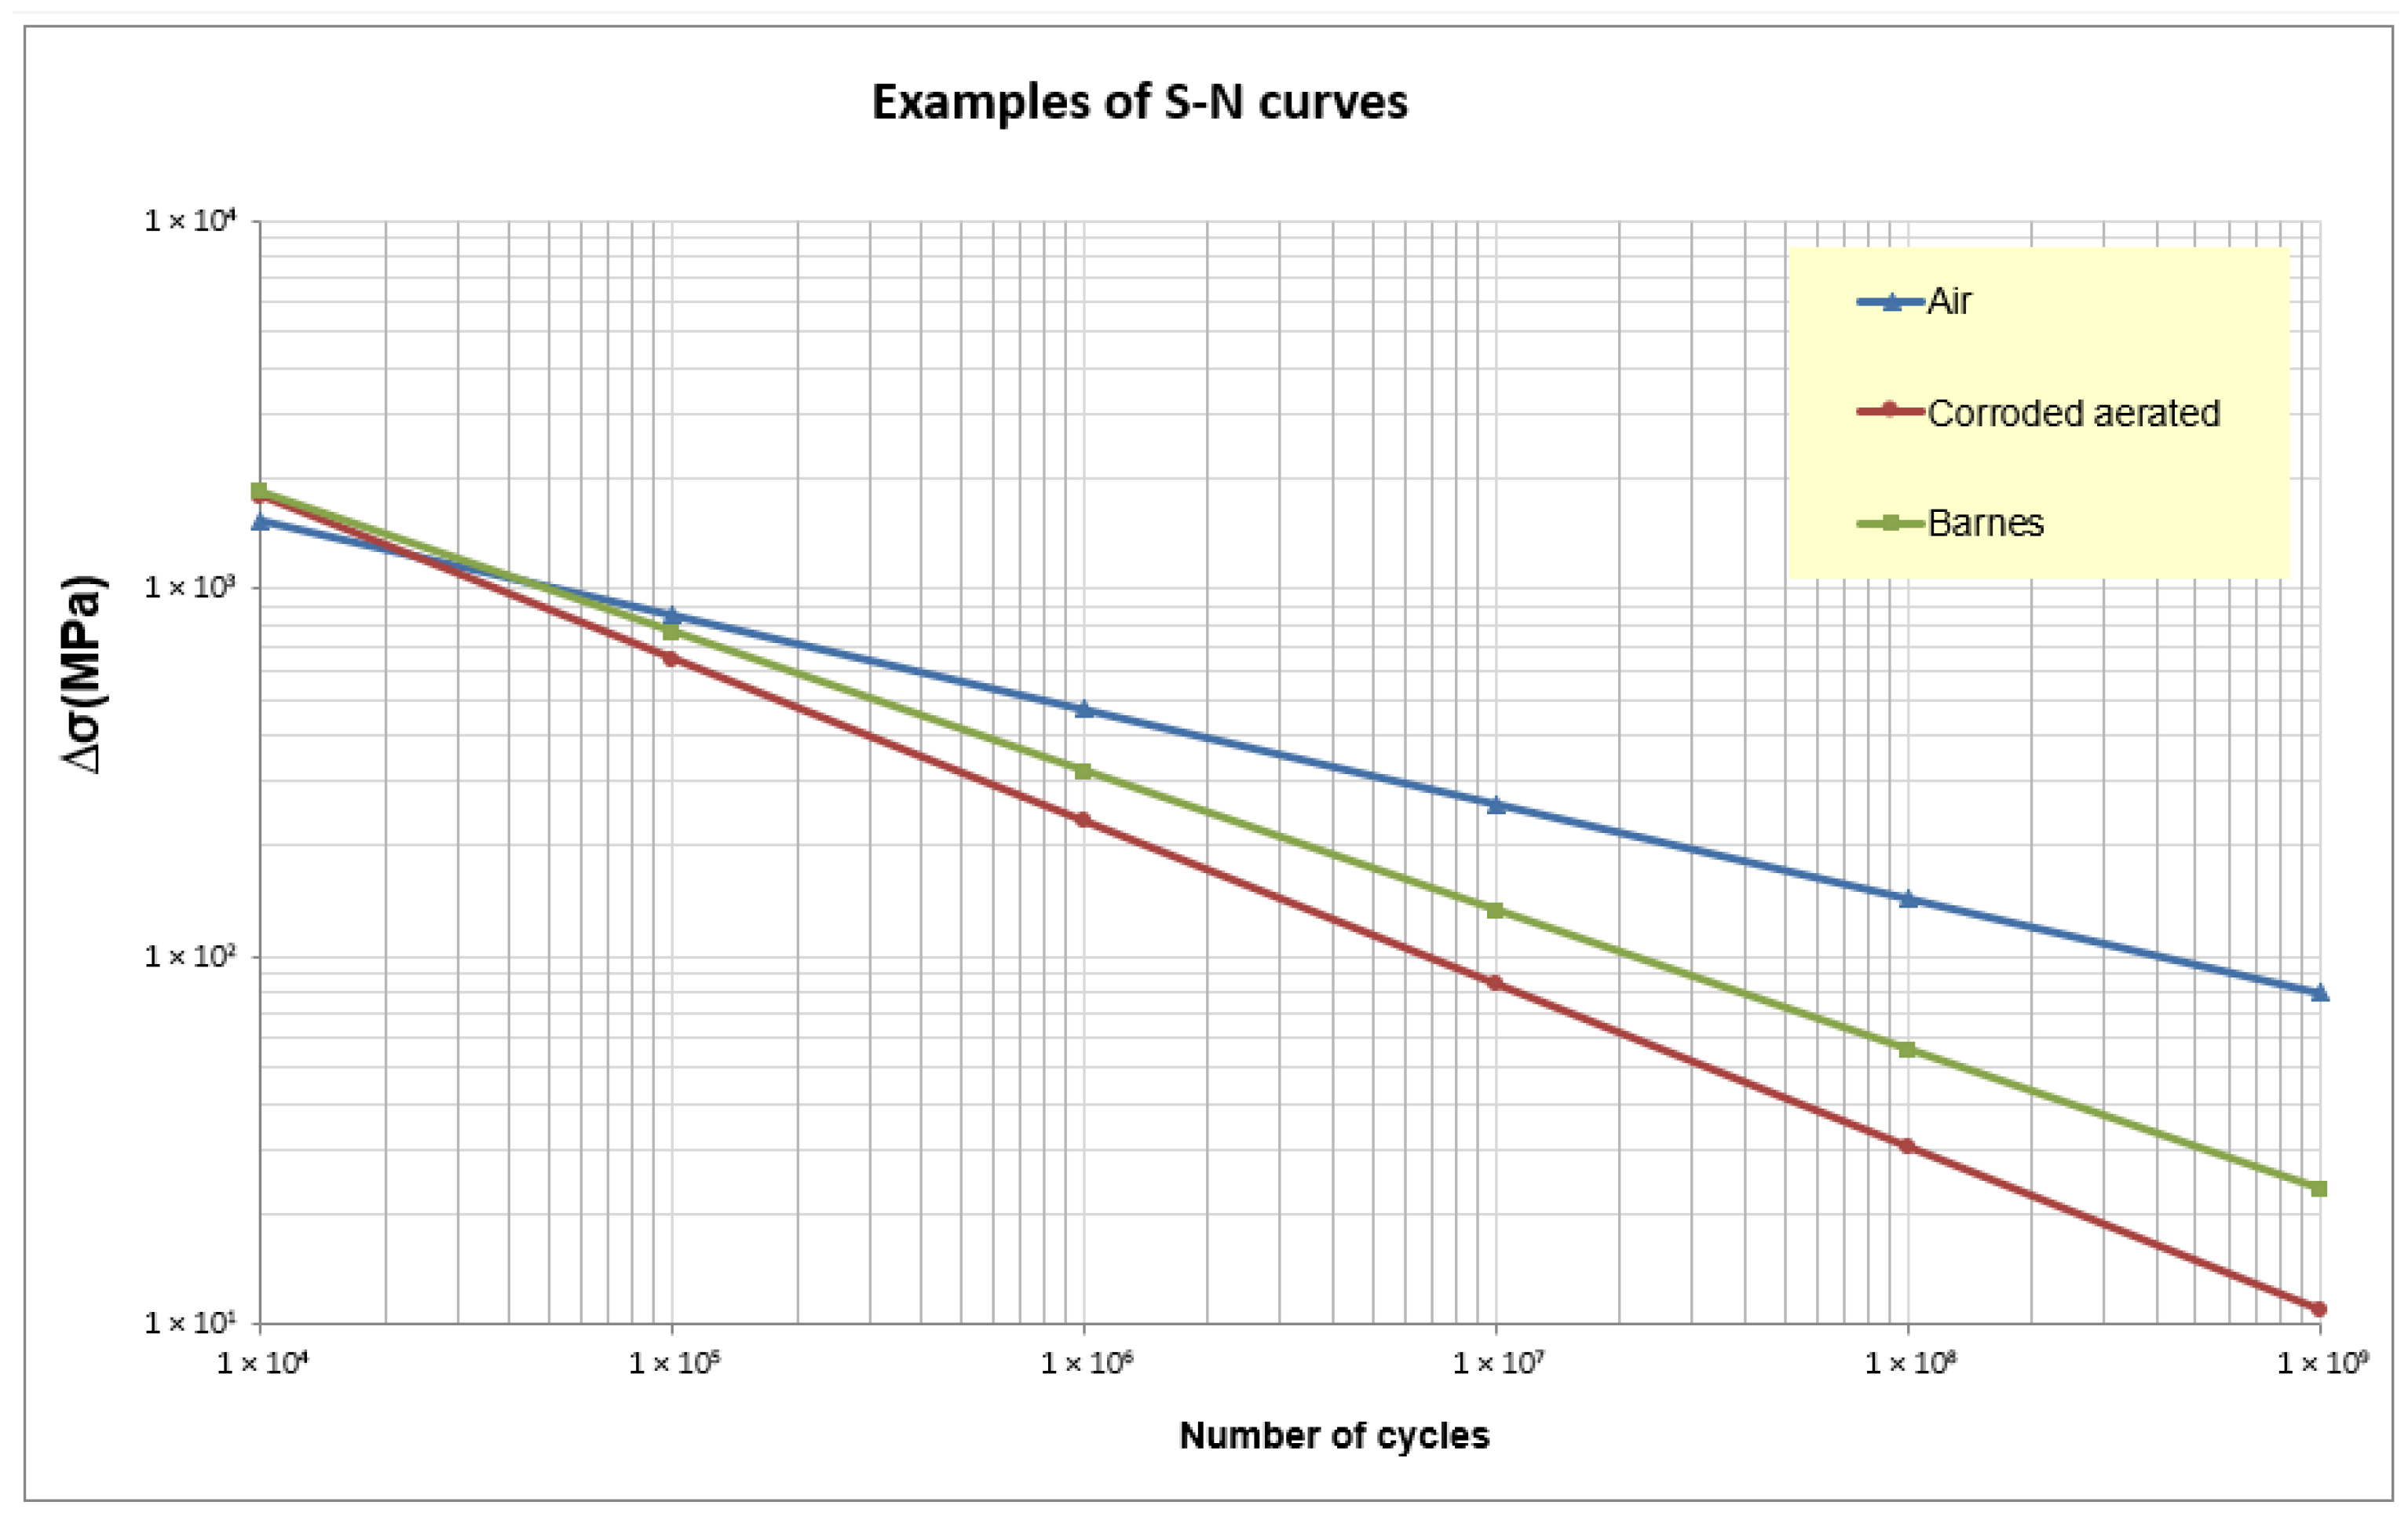
The general formulation of an S–N curve is given by [4,93]:
l o g 10 N = l o g 10 k 1 m l o g 10 σ
where N is the predicted number of cycles to failure under stress range σ , and k 1 and m are the parameters that define the S–N curve.
For flexible risers, S–N curves are obtained from experimental tests using samples of tensile armor wires under conditions that simulate their operating environment, i.e., the annulus condition (dry of flooded, presence of contaminants). In this way, the parameters that define S–N curves may vary substantially. Figure 16 presents some examples of design S–N curves; the three curves are linear, but, depending on experimental data, bilinear curves, such as those presented in [94], can also be used.
A current trend in the development of S–N curve data, directly related to the topic discussed in Section 3.4 of this work, is the generation of fatigue data accounting for corroded wires [94,95]. These studies involve both determining S–N curves and calibrating cycle reduction factors for different stress ranges to account for the effects of wire corrosion.

3. Current Research Trends

Currently, the literature presents several research possibilities on flexible risers, driven by multiple factors such as, among others:
  • Increasing water depths.
  • Fluids with corrosive potential towards tensile armor wires.
  • Increasing number of sea states in fatigue analysis (leading to high computational costs).
  • Need for rapid decision-making regarding riser operation.
  • Need to manage damage accumulation in several risers almost in real time.
Each one of the research lines described below is motivated by one or more of these factors.

3.1. Simplified Numerical and Analytical Models

The use of simplified numerical or analytical models is justified by the need to reduce computational costs in fatigue analyses when using more sophisticated analysis methodologies or to simplify local analyses. The two works mentioned below, in addition to several ones mentioned in Section 2.4, are examples of both situations.
Rahmati et al. [96] developed a numerical modelling method for flexible risers to be used in multiscale analyses. The key ideas of the approach are: (a) flexible risers can be accurately modelled with cyclic symmetry; (b) using this symmetry allows reducing the model to its smallest repeating unit; and (c) periodic boundary conditions are applied. The method effectively captures nonlinear effects while saving significant CPU time, as demonstrated in comparisons of pipe elements of varying lengths.
Yoo et al. [97] developed a simplified numerical model of a flexible structure, condensing the inner layers (carcass, inner plastic sheath, pressure armor, and anti-wear tape) into a single equivalent layer, modelled using solid elements with orthotropic material properties. The equivalent layer’s properties are analytically determined to maintain the original stiffnesses (axial, bending, and torsional). The model was calibrated using a detailed full model and applied to compression resistance analyses, showing good correlation with radial buckling strength.
Both referenced studies present comparisons between results obtained using the proposed models and those derived from fully detailed finite element models, in which all layers are explicitly discretized, and their interactions are considered. The main conclusion, common to all studies, is that, despite the complexity, local models can be simplified to better represent local behavior in global analyses.
The validation of these models should encompass a wide range of loading conditions and structural configurations, since operating conditions and the number and types of layers in a flexible riser may vary significantly by application.
Comparisons with experimental results obtained under controlled laboratory conditions can provide additional support for validating these modeling approaches.

3.2. Alternative Approaches for Fatigue Evaluation

Operational issues often require a quick understanding of their impact on riser fatigue life. On the other hand, advances in computational power allow more complex analyses. These two needs drive the development of new fatigue analysis methods, either faster approaches or ones that better capture structural behavior. Both research lines offer significant opportunities for further development.
For expedited methods, Sousa et al. [38] presented an analytical model for fatigue life prediction at the riser top connector, the bend stiffener, and the intermediate connectors. This model uses simplified equations and has been implemented in an application called WebFlex, used by PETROBRAS. Though conservative compared to time-domain FEM-based tools, it significantly reduces computational costs and can be used either to better select cases for detailed analysis or to assess the impacts of operational changes on fatigue life.
In practical engineering applications, simplified models are often required to provide computationally efficient yet conservative predictions. Achieving this balance typically involves adopting assumptions that substantially reduce computational costs while maintaining an adequate safety margin. A promising direction for future research is to reduce the inherent conservatism of such simplified approaches by systematically calibrating them against high-fidelity time-domain finite element analyses. Rather than merely ensuring conservative bounds, simplified models could be refined to more closely reproduce the stress ranges, response statistics, and accumulated fatigue damage predicted by comprehensive nonlinear simulations. Bridging this gap would allow for improved accuracy without sacrificing computational efficiency, thereby enhancing reliability assessments while avoiding unnecessary overdesign.
In the opposite direction, Edmans et al. [98] explored multiscale techniques that integrate local and global models to reduce uncertainties arising from traditional model separation. Two numerical models (fully and sequentially integrated) were discussed. According to the authors, the sequential procedure is distinguished from a standard global-local analysis by the inclusion of more realistic nonlinear behavior in the global analysis, tailored to the specific pipe design and operating conditions, and by the use of more accurate boundary conditions in the local analysis. The integrated model allows an evolving local configuration in selected elements to update the global analysis model in a staggered solution process. On the other hand, a detailed FE model of full-length flexible pipes, including individual riser layers, is complex and computationally expensive; for this reason, a sequential model was considered a better choice. From a detailed model, some analyses generate responses that are used to calibrate a group of equivalent properties. These properties are used in simpler analyses, whose results are later used as data input for more complex models.
A possible development in this area is to incorporate these ideas into a fully coupled analysis, in which risers, mooring lines, and the floating production unit are modeled simultaneously. This would reduce modeling uncertainties in several ways. However, these high-fidelity strategies entail substantial computational costs and pose significant challenges for numerical stability, model calibration, and data management. The increased model complexity also demands robust validation procedures and efficient solution algorithms to ensure that the anticipated gains in physical realism effectively translate into improved predictive capability.

3.3. Neural Networks and Machine Learning

Machine Learning, Artificial Neural Networks (ANN), and AI tools can be applied to reduce simulation times, group sea states with similar characteristics, and select the sea states that concentrate the most riser damage. The following works are recent examples of the use of these tools for fatigue analysis of flexible risers.
Silva and Araújo [99] used convolutional neural networks (NARX-CNN) to predict tension and curvature responses along flexible risers, including end fittings and touchdown zones. Their predictions matched experimental data well at end fittings but were less accurate in severe sea states at the touchdown zone.
Yuan et al. [100] presented a frequency-domain technique that builds transfer functions from selected time-domain simulations and predicts the total stress spectrum for other cases. Dirlik’s approximation method is used to estimate fatigue damage from the stress spectrum. Compared to the time-domain approach, it is considerably more efficient to implement. Since the frequency-domain technique presupposes the linearity of the riser response, discrepancies must be addressed through calibration factors. To improve accuracy, more transfer functions must be built before damage calculation. An artificial neural network (ANN) relates wave and stress spectra. Unlike general AI techniques, the type of neuron at each layer is selected to represent the dynamic behavior of the riser system, thereby improving model efficiency.
Subsequently, Yuan et al. [101] applied the previous work to the fatigue life estimation of flexible risers using monitored data. They mention the possibility of processing information from several sensors (relating their work to the ones mentioned in Section 3.5 of this article), including monitoring wire stress, riser motions, platform motions, and wave and current data. The work recommends monitoring temperature because the stress–strain curves for polymers depend on temperature and points out that pressure data are usually available in the field, which is important for computing bending stresses. The proposed method is applied in a case study composed of a free-hanging 6″ riser in a water depth of 2000 m in Brazil, focusing on the top region of the riser, and concluded that their results were conservative in the regions where damage is greater.
Dai et al. [102] used the AK-MDA approach with Kriging surrogate models to predict short-term fatigue damage distributions, reducing the number of sea states from 400 to 15 and achieving a 27-fold reduction in computational processing time.
Rodrigues et al. [103] developed an LSTM (Long Short-Term Memory) network to predict time series of axial tension and bending moments at the top region of a riser using a reduced number of loading cases. Testing on a free-hanging catenary riser, they simulated 24 sea states and predicted 3072 cases, reducing computational effort by 99%.
Although ANNs, machine learning, and AI techniques offer substantial computational acceleration for predicting stress time series in flexible risers, their applicability is inherently limited by data availability, representativeness, and extrapolation capacity.
These techniques are fundamentally interpolative: avoiding extrapolation requires ensuring that sea states that most significantly contribute to fatigue damage remain within the domain of environmental conditions used for training. If critical combinations of wave height, period, direction, or current intensity fall outside the training envelope, the network may yield unreliable stress predictions.
An additional challenge lies in selecting appropriate input variables, since the dynamic response of flexible risers depends on multiple, coupled environmental, geometric, and operational parameters, not all of which are directly measurable or easily characterized. Inadequate selections may lead to biased or incomplete models that fail to capture essential physical mechanisms.

3.4. Corroded and Broken Tensile Wires

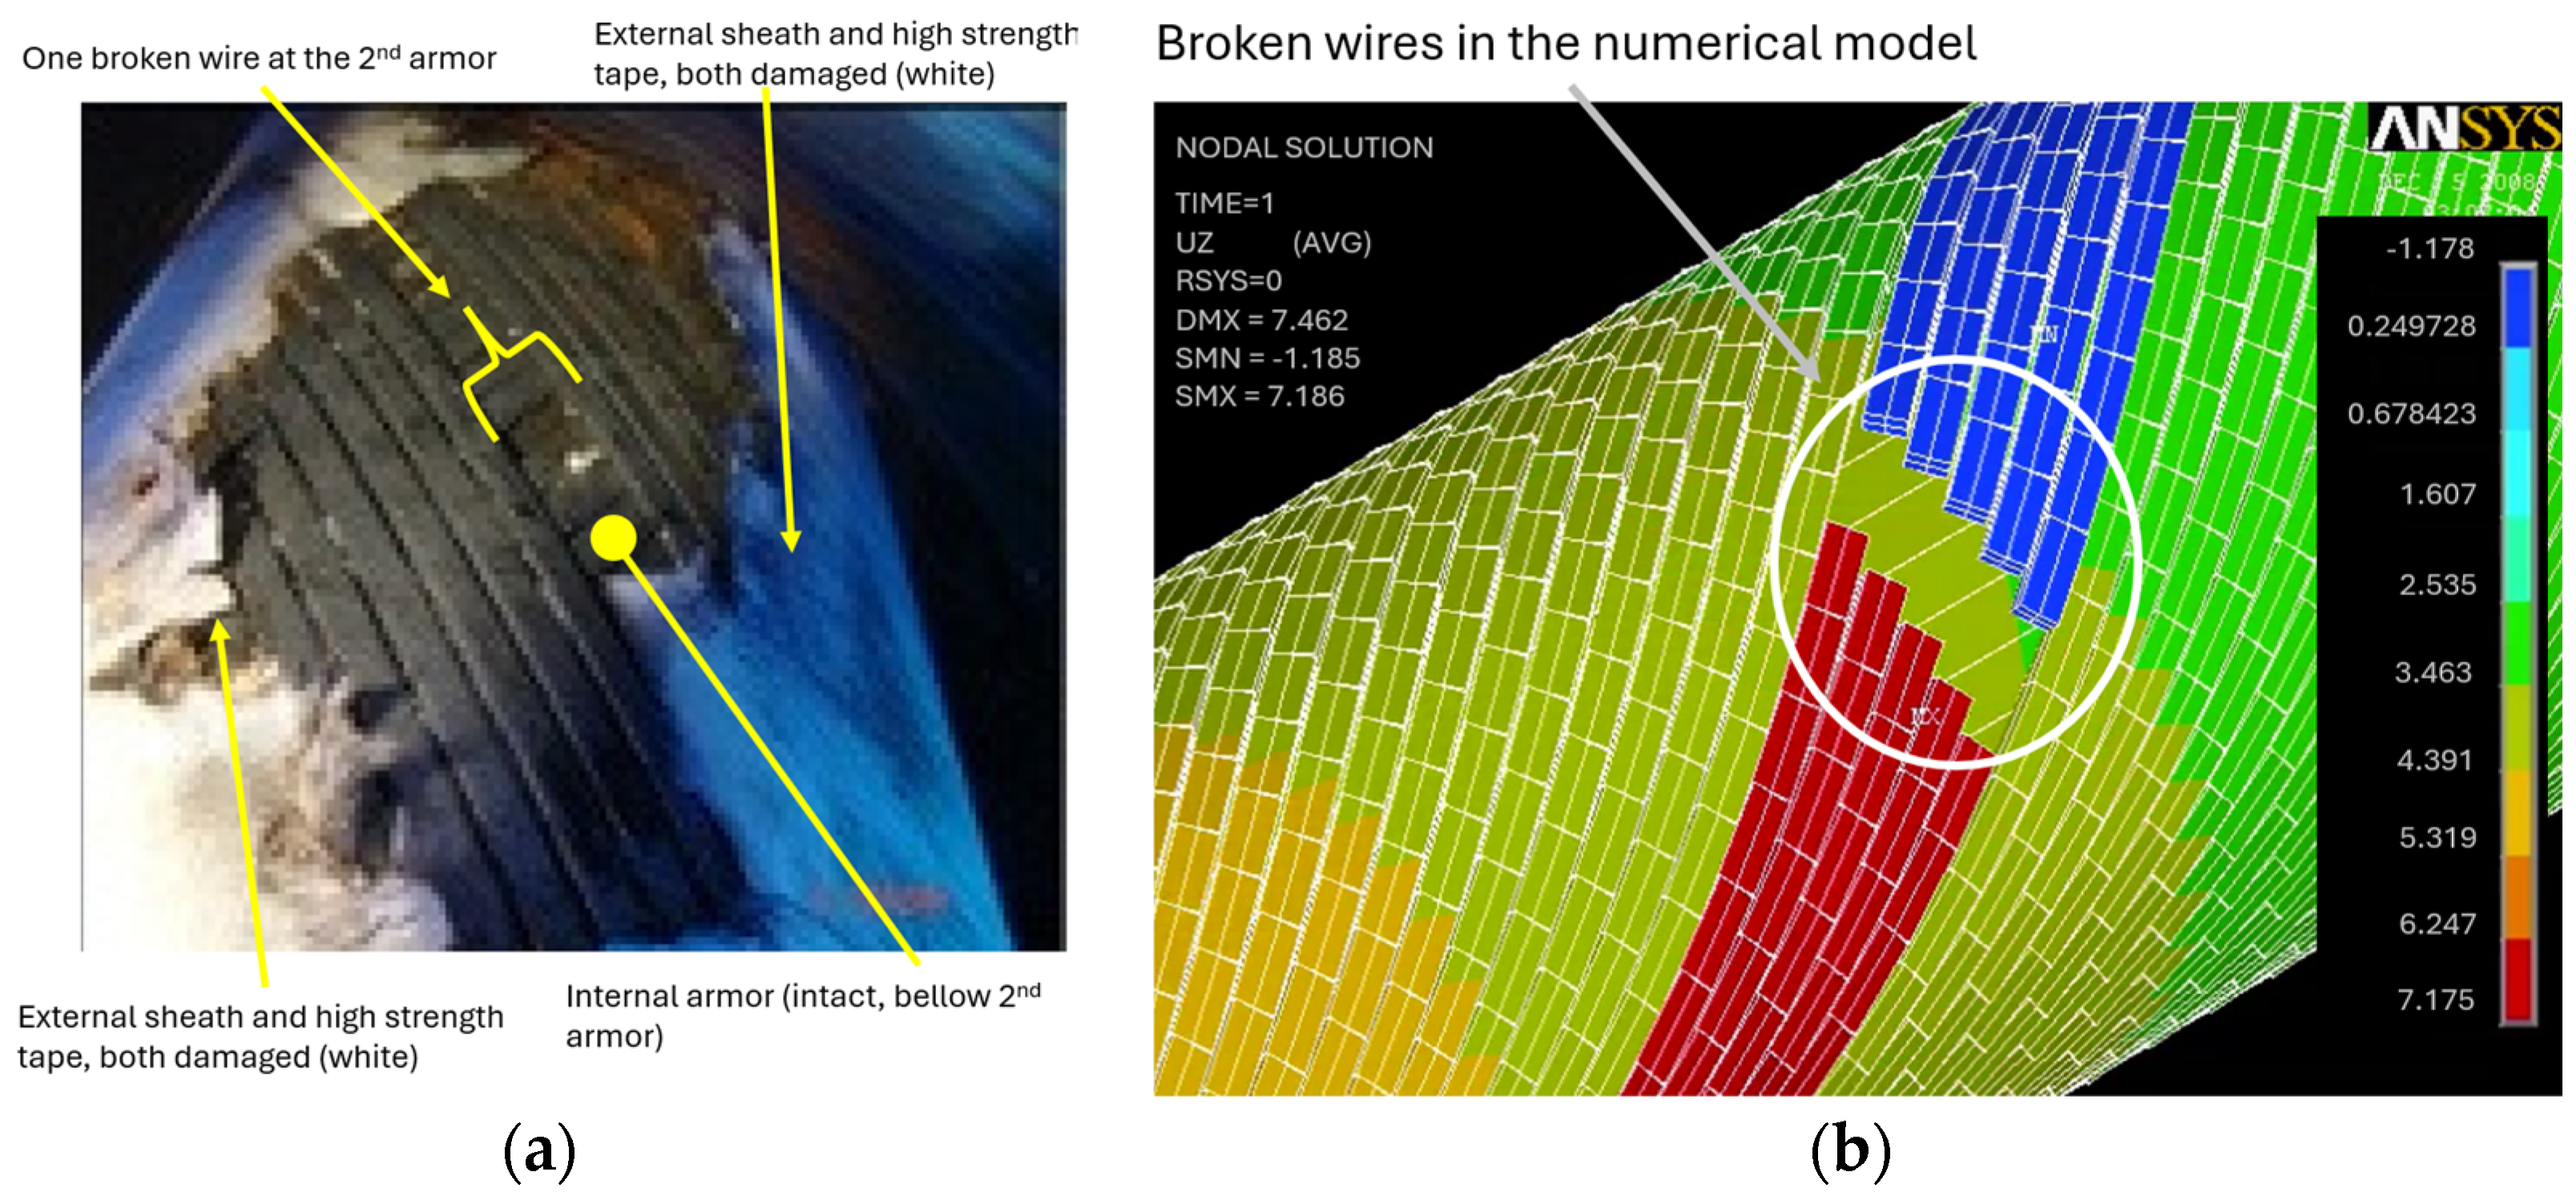
One of the most complex challenges in riser analysis is dealing with corroded (or even broken) tensile armor wires (Figure 17). Both issues tend to occur more frequently in the top region, where the riser may experience large curvatures. The combination of damage to the external polymer sheath and the presence of internal fluids containing contaminants may further exacerbate the problem. The following studies assist in decision-making relative to remaining fatigue life estimation and mitigation strategies.
De Sousa et al. [104] proposed a model using stress concentration factors (SCFs) to estimate stresses in wires adjacent to the broken ones. These SCFs are calculated using commercial FEM software like ANSYS (v.2024R1)® or ABAQUS® (v.2025). Fatigue life estimates showed a significant reduction with up to 10 broken wires in a 9.13″ riser.
Doynov et al. [87] used a nonlinear dynamic substructuring framework (NDS) to simulate the response of a damaged 2.5″ flexible pipe under tensile and bending loads, comparing their results with experimental data. In all cases, numerical predictions and test measurements agreed well, accurately capturing the redistribution of strains into the adjacent intact wires, which results in stress concentration factors.
Coser et al. [105] performed four-point bending fatigue tests on corroded tensile armor wire samples obtained from preconditioned short flexible pipes. The results were compared with those obtained using a reference S–N curve, assuming the wire is intact. The detrimental effect of the preconditioning procedure was observed. In parallel with the mid-scale test execution, a full-scale flexible pipe sample was preconditioned in the same corrosive environment used for the short sample. After 12 months, a dynamic tension-to-tension test was conducted, and the fatigue damage imposed during the test was calculated. A better correlation between the full-scale test results and the estimates was observed when using the S–N curves of pre-corroded armor wires.
Doynov et al. [21] applied their NDS model to fatigue analyses of a 7″ riser under irregular waves. Global intact riser analyses generated loads for a local model with damage, enabling fast simulation of long time series.
Lei et al. [106] studied the effect of damaged wires in an 8-layer riser. They concluded that broken inner tensile armor wires have a significant impact on the tensile properties of the flexible riser. The boundary conditions have little effect on the tensile stiffness but affect the failure mode. The riser undergoes torsional buckling under free tension, as observed in the field. The outermost pressure increases the interlayer effect between the tensile armor layer and the adjacent layer, thereby reducing the torsional angle of the flexible riser. The effect on the riser’s ultimate resistance can be neglected.
Lobo et al. [8] presented a literature review about SCC (stress corrosion cracking) induced by CO2. Following a failure in Brazil [107], this new failure mode became a significant concern for local operators, who must estimate the remaining life of risers with corroded wires and take steps to minimize its effects.
Brandão et al. [108], also based on the SCC-CO2 failure in Brazil, discussed necessary improvements to both conventional permeation models and annulus environment monitoring. Among other points, they suggested considering the residual stresses and strain history of the metallic armor wires, as well as the annulus conditions, to provide better information for material selection and pipe design.
De Sousa and Santos [109] proposed an empirical-analytical equation based on Symbolic Regression to estimate stress concentration factors for the analysis of flexible pipes with broken tensile armor wires. The SCFs are used to calculate stresses on the remaining wires. They built models of several risers using ANSYS®, varying the number of broken wires from 0% to 25% of the total wires in the outer tensile armor. The total number of FE analyses was 559, including all risers and variations in the number of broken wires. In each analysis, only the greatest SCF was recorded. These SCFs were used as input data for Eureqa® (v. 0.98 beta), and the expression obtained for the predicted SCF depends on eight dimensionless parameters that characterize the structures and are representative of the studied mechanism.
Lei et al. [110] studied analytical and numerical models for an 8-layer riser with corroded wires. Validated with experimental data obtained using corroded tensile armor wires machined to the shape of the sample provided by the manufacturer, the effects of corrosion location, degree, and boundary conditions on the tensile stiffness, ultimate load, and load ratio of the inner and outer tensile armor layers of the flexible riser were studied. The results showed that free boundary conditions are better adapted to changes in the load ratio of the inner and outer tensile armors under corrosion. UFRs are most likely to fail when corrosion occurs in the inner layer, and corrosion has a greater effect on the axial load capacity when it is oriented along the radial direction. The boundary conditions limit top axial torsion. When the wire corrosion thickness is 0.4 mm, the tensile stiffness decreases by 15.77% and 15.24% under the two boundary conditions, respectively.
All the cited studies emphasize the need to develop robust local models capable of accurately representing stress redistribution across the cross-section of a riser containing broken or corroded wires. They also highlight the importance of properly characterizing the annulus condition to select the appropriate S–N curve for fatigue calculations.
Possible directions for future research include developing more advanced finite element models for risers and improving methodologies for monitoring annulus condition. The latter aspect also suggests integrating these developments with Digital Twin frameworks, as discussed in Section 3.6, where real-time data acquisition and model-updating strategies may enhance predictive accuracy and uncertainty management.

3.5. Composites

Interest in composite materials is growing in offshore oil and gas, driven by deeper-water projects and the need to reduce top-tension loads. New problems, like SCC-CO2 in Brazil [107], have also motivated this research.
Composite risers fall into two categories, as mentioned by Amaechi et al. [111]:
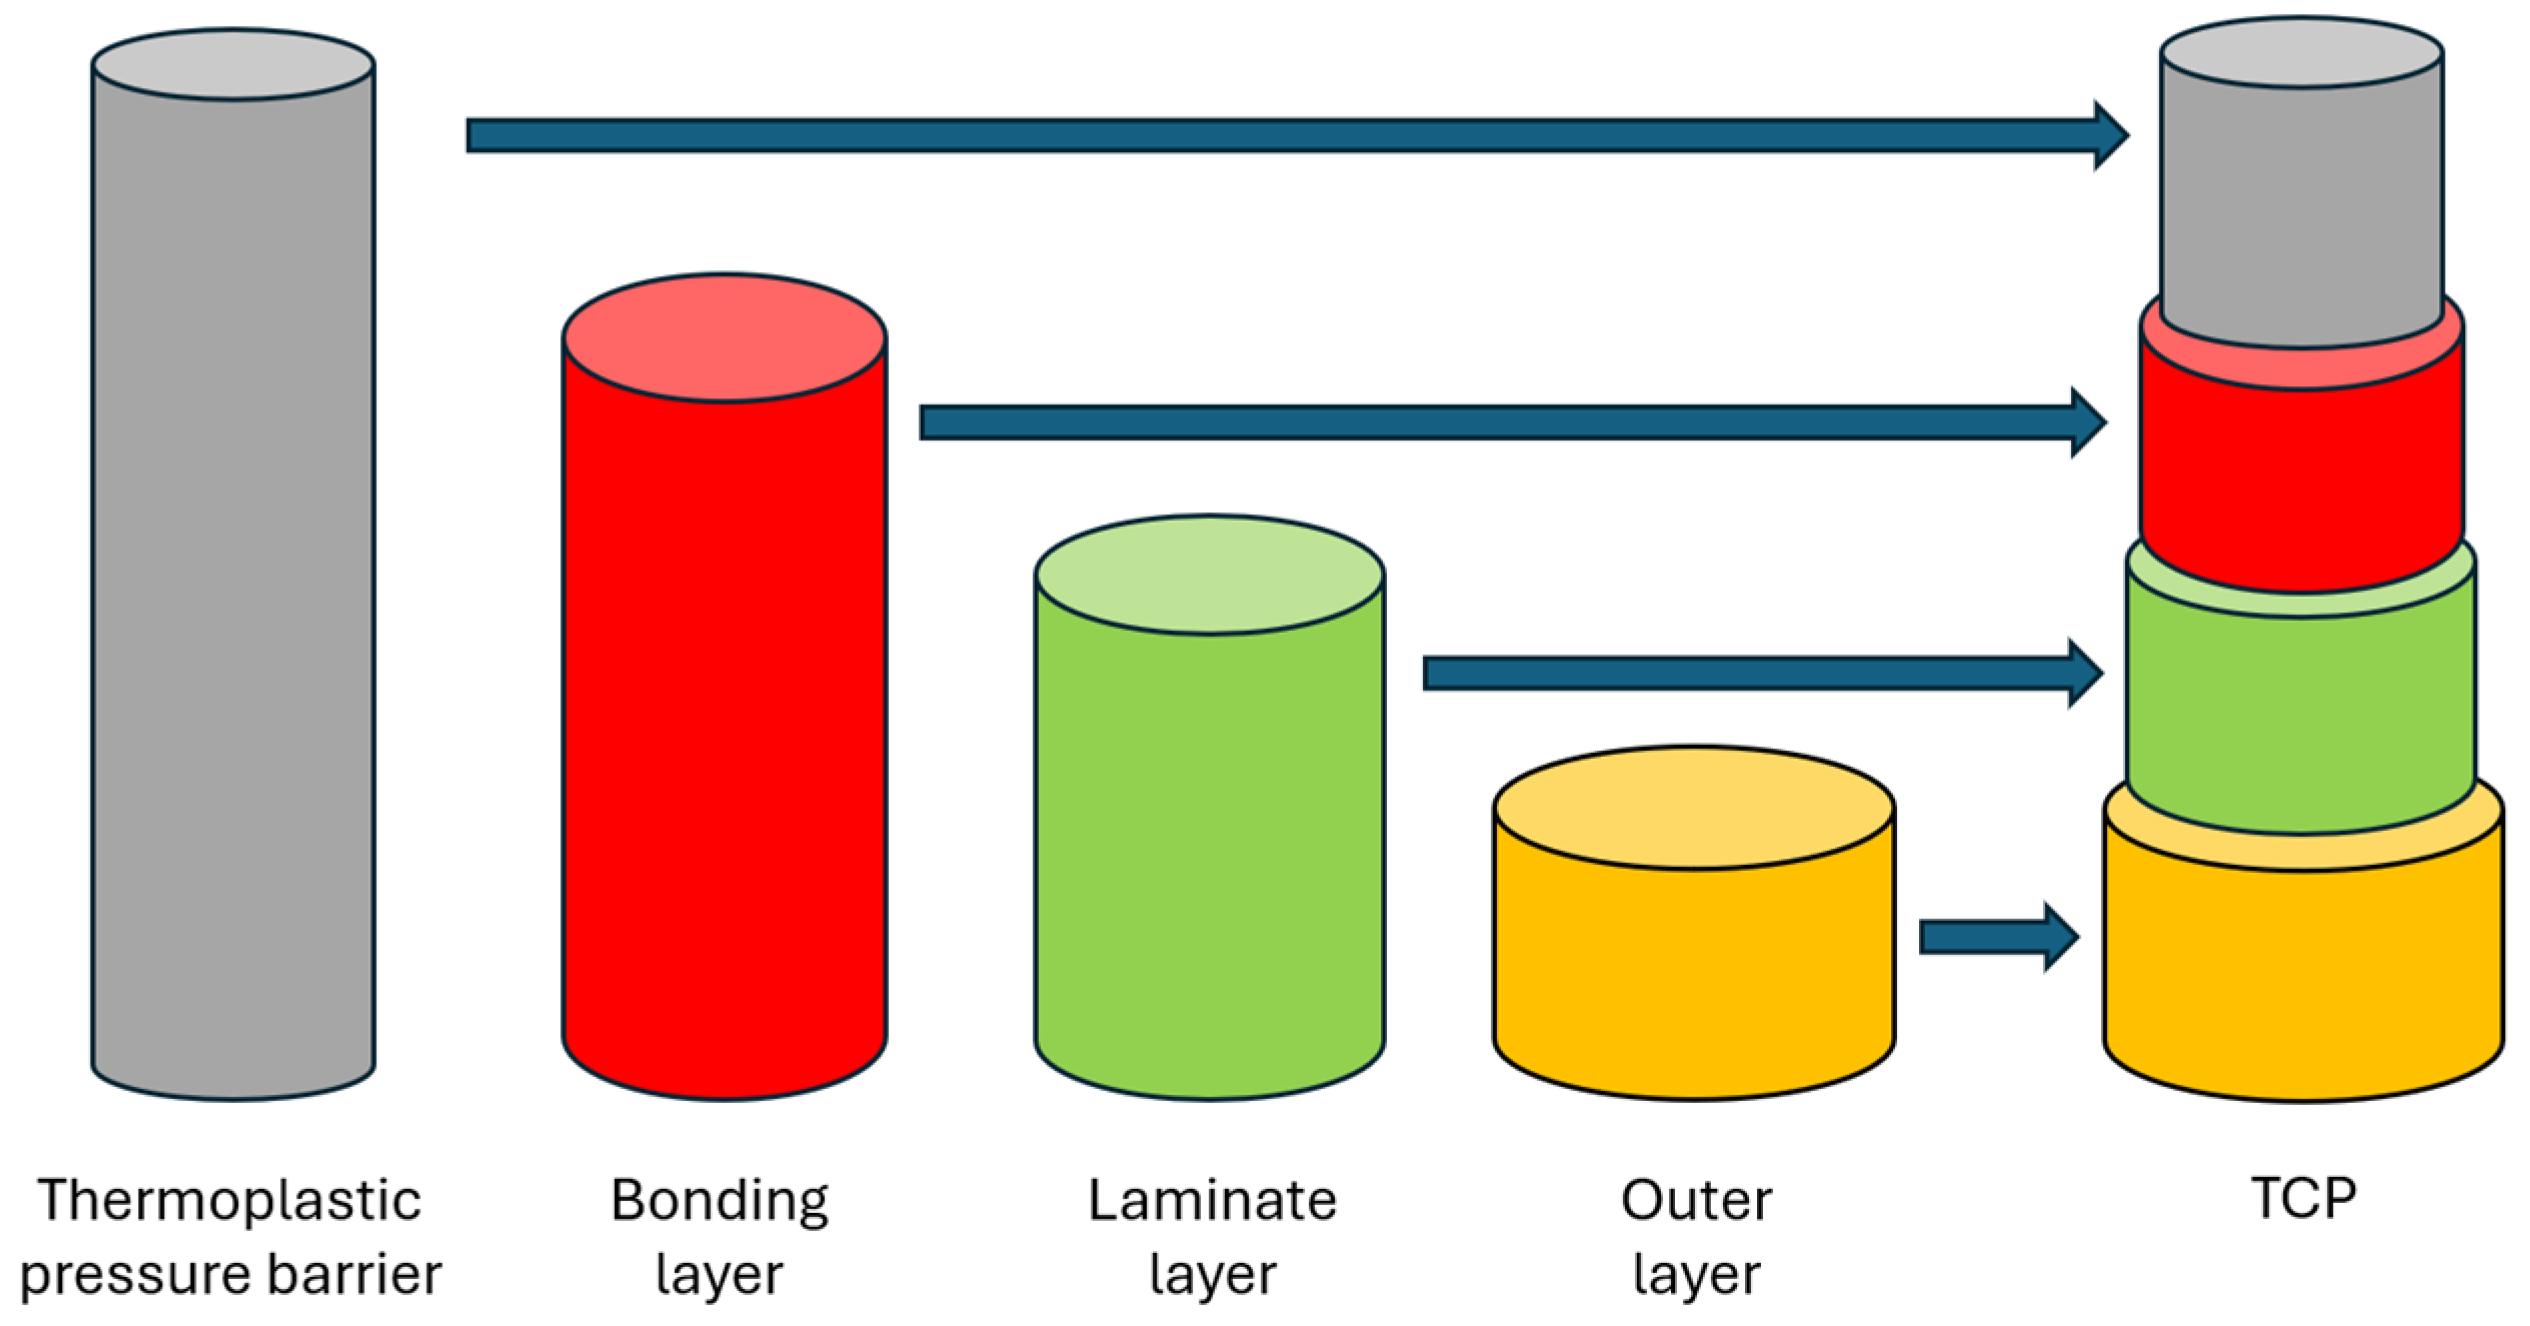
  • Thermoplastic Composite Pipes (TCP, Figure 18): solid layers of a single polymer with embedded fibers. The solid wall consists of four components: a thermoplastic pressure barrier, a bonding layer, a laminate layer, and an outer layer. These risers are corrosion-resistant, lightweight, and easy to install, with a simple design and higher fatigue life.
  • Hybrid Flexible Pipes (HFP): replace some steel layers with composites to improve durability. The mechanical behavior of the HFPs is analogous to that of conventional flexible pipes; however, when comparing pipes with similar axial stiffnesses, they tend to have lower full-slipping bending stiffness, as noted by Liu et al. [112]. It has some advantages over TCPs, such as composite wires bending more easily than carbon steel wires, resulting in reduced bending stiffness at small curvatures, and being lighter.
Despite the advantages, both designs face challenges, such as longer manufacturing times, the need for custom end-fittings, increased production complexity due to Metal-Composite Interfaces (MCI), the need to investigate matrix cracking, and full qualification pending due to design and environmental variability.
Most current composite riser studies focus on structural development, while fatigue studies are scarce. Among these fatigue studies, Rafiee and Eslami [113] proposed the CFDM (Cumulative Fatigue Damage Modelling) technique to estimate stresses, damage, and material degradation per cycle. Validated using a [90/±552/90] glass/epoxy pipe, it addresses the limitations of the traditional S–N method.
Wang et al. [114] studied TCPs using 3D anisotropic elasticity theory and a modified Hashin failure criterion to model stiffness degradation. Experimental validation showed degradation is driven by matrix tensile failure, progressing from the inner to outer reinforced layers.
The utilization of composites in risers still faces several technical challenges, as listed by Amaechi et al. [111]. Nevertheless, their potential advantages, particularly their high corrosion resistance and reduced structural weight, provide strong justification for the necessary technological and financial investments.

3.6. Use of Monitored Data and Digital Twin Tools

With improvements in the quality and cost of various types of sensors, it is now possible to monitor the movements of production units, environmental parameters such as waves, wind, and currents, and even deformations in the riser structure itself. These data can serve as inputs to fatigue analyses in near-real time, enabling monitoring of riser damage accumulation over time. However, the computational cost of such analyses is high, which justifies the numerous studies already published or under development on this topic.
Yuan et al. [115] proposed calculating riser fatigue life using monitored data. Many production units monitor movements, environmental loads from waves, wind, and currents, and riser pressures. Thus, the authors suggested using this data as a starting point for fatigue analyses, thereby eliminating uncertainties in estimating unit movements. After building the riser model, the monitored data is used as input to Orcaflex [41], which calculates forces and curvatures along the riser. These forces, together with the monitored pressures, are used in an analytical tool to calculate contact pressures, axisymmetric stresses, and frictional, normal, and binormal stresses due to bending in the tensile armor wires. Subsequently, the same tool uses the Rainflow method for stress-cycle counting, and damage is calculated using S–N curves and Miner’s rule, within a computational structure similar to the one previously identified as the traditional methodology (Section 2 of this work).
The authors also raise several relevant points for the use of this type of tool, such as the need to divide the monitored signals into small blocks; the possibility of eliminating the processing of signals with similar characteristics to already processed ones; and the need to consider an efficient data structure to store damage along the entire riser.
Following a similar approach, Hejazi et al. [116] proposed using one year of monitored data to calculate the fatigue life of flexible risers by applying the measured motions to the production unit and the monitored environmental loads to the riser. To compensate for the short period of acquired data, they proposed a factor to correct fatigue life, calculated using a data-driven procedure. This factor is based on a ratio of the average significant wave height measured over a long period (32 years in the study) to that during the reference year. The results obtained by the proposed procedure, contrary to expectations, yielded a shorter life than that obtained through traditional procedures.
Lee et al. [117] proposed using digital twin models with motion sensors attached to the platform and riser. The reference model was a Steel Lazy-Wave Riser (SLWR) connected to a spread-moored FPSO. FE-based riser digital twin models were then constructed to run with the synthetic sensor inputs. A machine learning algorithm that estimates the 3D current profile along the water column was employed to improve the digital twin models by inputting the estimated current profile as additional loads. The digital twin models, with or without the estimated current, produce the time histories of stresses along the riser, and the corresponding fatigue damage and life were assessed using the Rainflow counting method.
Finally, Sousa et al. [118] presented a digital twin application for flexible riser fatigue that uses monitored data on production unit movements and riser pressures, combined with simplified analytical or numerical models previously developed by the authors [38]. The adoption of these models, rather than time-domain FEM analyses, is justified by the need to reduce computational costs, thereby enabling the integrity management of multiple risers across several production units. The results indicate that fatigue lives calculated using monitored data tend to be longer than those predicted using traditional design approaches.
The use of Digital Twin tools may have a highly significant impact on the offshore industry. In addition to enabling more accurate estimates of the remaining service life of risers, the processing and analysis of monitored data may also allow for a reassessment of the assumptions adopted during the design phase, thereby reducing the level of conservatism typically embedded in fatigue analyses.
However, as noted in the previously mentioned works, this research line still requires further development in several areas. Since it is neither technically feasible nor economically viable to monitor stresses at all locations, in all risers, across all production units, it becomes necessary to carefully select the parameters and measurement points to be monitored. Based on these data, numerical models (either finite element or simplified), analytical formulations, or surrogate models must reproduce the accumulated fatigue damage in the riser. Consequently, the effective implementation of Digital Twins demands advances in sensing technologies, the development of appropriate models to represent riser behavior, and robust signal-processing tools to interpret sensor data.
The volume of data to be acquired and processed poses an additional challenge, requiring the design of systems that transform raw data into reliable, actionable information for decision-making.

4. Conclusions

As demonstrated, flexible risers are key components for economically viable offshore oil and gas exploitation. Although used since the 1970s, flexible riser technology continues to evolve. While a widely accepted methodology exists for fatigue analysis, emerging challenges have driven several distinct research lines. These efforts significantly enhance project quality and ensure the safe and efficient operation of flexible risers.
Based on the works previously mentioned, the following conclusions can be reached:
  • The formulation for calculating bending stresses in flexible risers has evolved substantially but still has room for improvement.
  • The oil industry may employ simple methodologies that provide rapid results, as well as more complex approaches that require significantly longer processing times.
  • The utilization of composite materials seems to be the key to reducing loads and may help to deal with aggressive environments (contaminants).
  • Neural networks, machine learning tools, and AI can help develop solutions that enable the use of robust computer models.
  • Digital Twins can contribute to improving the management of the operational integrity of huge production systems, but several aspects still need to be addressed.
Finally, another topic for future research is how to account for the effects of residual stress in fatigue analysis. Due to the way flexible risers are manufactured, transported, and installed at a given field location, the development of residual stresses is unavoidable. Their estimation and how to combine them with stresses obtained from time-domain analyses remain open questions. Therefore, appropriate methodologies must be developed to ensure a consistent and physically sound combination of residual and operational stresses.

Author Contributions

Original manuscript: F.J.M.d.S.; revision: J.R.M.d.S. All authors have read and agreed to the published version of the manuscript.

Funding

This research received no external funding.

Data Availability Statement

The original contributions presented in this study are included in the article. Further inquiries can be directed to the corresponding authors.

Conflicts of Interest

The authors declare no conflicts of interest.

Appendix A

Table A1. Comparison of mathematical frameworks for wave-induced fatigue assessment in flexible risers (time or frequency domain analysis).
Frequency Domain AnalysisTime Domain Analysis
Key assumptionsLinear structural response; Gaussian and stationary wave loading; small displacements; superposition principleIrregular sea states explicitly simulated; structural nonlinearities allowed; finite simulation length
Mathematical structureLinear operators mapping wave spectra to response spectra via RAOs; spectral moments; damage estimated via closed-form Rainflow approximationsNonlinear differential equations solved by numerical time integration; cycle counting via Rainflow algorithms; damage accumulation by Miner’s rule
Computational complexityLow to moderate; efficient for long-term fatigue using spectral integrationHigh; depends on time-step size, simulation length, and number of sea states
Main sources of error/uncertaintyInability to capture nonlinearities (contact, friction, large curvature); inaccuracies under non-Gaussian response; sensitivity to spectral discretizationStatistical convergence errors; numerical integration errors; sensitivity to rainflow implementation and simulation duration
Table A2. Comparison of mathematical frameworks for wave-induced fatigue assessment in flexible risers (decoupled or coupled analysis).
Decoupled Global–Local ApproachFully Integrated (Coupled)
Approach
Key assumptionsSeparation between global structural response and local cross-
sectional behavior; linear or weakly nonlinear coupling
Strong coupling between global dynamics and local mechanics; nonlinear interactions explicitly modelled
Mathematical structureSequential mapping: global motions → curvature/tension → local stress recovery modelsMulti-scale, coupled nonlinear systems; often finite element–based with internal contact/friction laws
Computational complexityModerate; widely used in industrial practiceVery high; often prohibitive for full fatigue life assessment
Main sources of error/uncertaintyError propagation between scales; simplified local contact and friction models; neglect of feedback from local damage to global
response
High sensitivity to material and contact parameters; numerical
stability issues; limited validation data
Table A3. Comparison of mathematical frameworks for wave-induced fatigue assessment in flexible risers (irregular or deterministic approaches).
Deterministic (Regular Wave)
Approach
Irregular (Stochastic) Wave
Approach
Key assumptionsPeriodic loading; representative wave selected; steady-state response assumedSea states described by wave spectra (e.g., JONSWAP, Pierson–Moskowitz); ergodicity assumed
Mathematical structureHarmonic excitation; closed-form or semi-analytical solutions for stresses and cyclesStochastic processes; spectral or time-series representations; probabilistic damage accumulation
Computational complexityLow; suitable for preliminary or screening analysesModerate to high; depends on discretization of spectra or the number of realizations
Main sources of error/uncertaintyPoor representation of real sea states; neglect of spectral bandwidth and load variabilityModel uncertainty in wave spectra; sampling errors; assumptions of stationarity and ergodicity

References

  1. American Petroleum Institute. Dynamic Risers for Floating Installations; API: Washington, DC, USA, 2025; API STD 2RD. [Google Scholar]
  2. Bai, Q.; Bai, Y.; Ruan, W. Advances in Pipes and Pipelines—Flexible Pipes; Scrivener Publishing (Wiley): Hoboken, NJ, USA, 2017. [Google Scholar]
  3. American Petroleum Institute. Recommended Practice for Flexible Pipe, 6th ed.; API: Washington, DC, USA, 2024; API RP 17B. [Google Scholar]
  4. Larsen, C.M.; Sævik, S.; Qvist, J. Design analysis. In Handbook on Design and Operation of Flexible Pipes; NTNU/4Subsea/MARINTEK: Trondheim, Norway, 2017; Volume I, Part B. [Google Scholar]
  5. Blair, J.S. Operation Pluto—The Hamel Steel Pipelines. D.Sc. Thesis, University of Glasgow, Glasgow, UK, 1948. [Google Scholar]
  6. Behar, I. Use of Coflexip flexible lines in the oil industry. In Proceedings of the 6th Offshore Technology Conference, Houston, TX, USA, 6–8 May 1974. [Google Scholar]
  7. Lambert, A.; Do, A.-T.; Felix-Henry, A.; Grosjean, F. Qualification of unbonded dynamic riser with carbon fiber composite armours. In Proceedings of the ASME 31st International Conference on Offshore Mechanics and Arctic Engineering (OMAE 2012), Rio de Janeiro, Brazil, 6–12 July 2012. [Google Scholar] [CrossRef]
  8. Lobo, C.V.F.; Ribeiro, M.L. SCC–CO2 failure mode: Literature review and available technologies used to inspect and assess the integrity of flexible pipes. In Proceedings of the Offshore Technology Conference 2023, Houston, TX, USA, 1–4 May 2023. [Google Scholar] [CrossRef]
  9. Wang, K.; Yu, X.; Zheng, L.; Zhang, E.; He, Y. Numerical investigation of gas permeation and condensation behaviour of flexible risers. J. Pet. Sci. Eng. 2021, 203, 108622. [Google Scholar] [CrossRef]
  10. Wang, J.; Meng, Y.; Han, B.; Liu, Z.; Zhang, L.; Yao, H.; Wu, Z.; Chu, J.; Yang, L.; Zhao, J.; et al. Hydrate blockage in subsea oil/gas flowlines: Prediction, prevention, and remediation. Chem. Eng. J. 2023, 461, 142020. [Google Scholar] [CrossRef]
  11. American Petroleum Institute. Specification for Unbonded Flexible Pipe, 5th ed.; API: Washington, DC, USA, 2024; API SPEC 17J. [Google Scholar]
  12. Sertã, O.; O’Keefe, B.; Takeda, C.; Lemos, C.A.D.; Vaillant, A.G. Enhanced fatigue methodologies for flexible risers and applications for Brazilian offshore conditions. In Proceedings of the Offshore Technology Conference 2008, Houston, TX, USA, 5–8 May 2008. OTC 19298. [Google Scholar]
  13. Naess, A.A. Fatigue Handbook—Offshore Steel Structures; Tapir: Trondheim, Norway, 1985. [Google Scholar]
  14. Hu, P.; Liu, X.; Gao, H.; Liu, Z.; Li, Y.; Hu, X.; Chang, Y.; Chen, G.; Sun, M.; Guo, X. Three-dimensional VIV characteristics of a flexible riser considering parameters uncertainty. Mar. Struct. 2026, 108, 104037. [Google Scholar] [CrossRef]
  15. Hu, P.; Liu, X.; Gao, H.; Zhao, R.; Hu, X.; Chang, Y.; Chen, G.; Li, W.; Sun, M. VIV model updating method of the flexible riser based on particle swarm optimization. Ocean Eng. 2026, 352, 124516. [Google Scholar] [CrossRef]
  16. Ma, K.; Wang, C.; He, W.; Zhang, L.; Zheng, R.; Amaechi, C.V.; Zhang, Z. The coupling effect of current, wave and platform movement on the dynamic characteristics of marine risers with different elastic modulus and constraint number. Appl. Ocean Res. 2025, 161, 104694. [Google Scholar] [CrossRef]
  17. Pan, Y.; Zheng, L.; Yang, S.; Wang, Y. A review of fatigue analysis of marine flexible risers. Geoenergy Sci. Eng. 2025, 246, 213555. [Google Scholar] [CrossRef]
  18. Bai, Y.; Jin, W.-L. Marine Structural Design, 2nd ed.; Elsevier: Oxford, UK, 2016. [Google Scholar]
  19. Drummond, G.P.; Pasqualino, I.P.; Pinheiro, B.C.; Estefen, S.F. Pipelines, risers and umbilicals failures: A literature review. Ocean Eng. 2018, 148, 412–425. [Google Scholar] [CrossRef]
  20. De Sousa, J.R.M.; Sousa, F.J.M.; Siqueira, M.Q.; Sagrilo, L.V.S.; Lemos, C.A.D. A theoretical approach to predict the fatigue life of flexible pipes. J. Appl. Math. 2012, 2012, 983819. [Google Scholar] [CrossRef]
  21. Doynov, K.; Cooke, N.; Pasala, D.; Majed, A. An irregular wave approach to fatigue life capacity for flexible risers with severed or corroded tensile armors. In Proceedings of the ASME 42nd International Conference on Ocean, Offshore and Arctic Engineering (OMAE 2023), Melbourne, Australia, 11–16 June 2023. OMAE2023-101167. [Google Scholar]
  22. Alves, M.C.; Corrêa, F.N.; De Sousa, J.R.M.; Jacob, B.P. A coupled global–local finite element methodology to evaluate the fatigue life of flexible risers attached to floating platforms. Mathematics 2024, 12, 1231. [Google Scholar] [CrossRef]
  23. Li, P.; Dai, T.; Jin, X.; Dong, L.; Liu, S.; Yang, S.; Xiang, X.; Kang, H.S. An efficient fatigue analysis for the nonbonded flexible riser. Ships Offshore Struct. 2022, 17, 2238–2253. [Google Scholar] [CrossRef]
  24. Liu, Q.; Qu, Z.; Chen, F.; Liu, X.; Wang, G. Review of the Development of an Unbonded Flexible Riser: New Material, Types of Layers, and Cross-Sectional Mechanical Properties. Materials 2024, 17, 2560. [Google Scholar] [CrossRef] [PubMed]
  25. Li, X.; Jiang, X.; Hopman, H. A review on predicting critical collapse pressure of flexible risers for ultradeep oil and gas production. Appl. Ocean. Res. 2018, 80, 1–10. [Google Scholar] [CrossRef]
  26. ISO 13628-2; Petroleum and Natural Gas Industries—Design and Operation of Subsea Production Systems—Part 2: Unbonded Flexible Pipe Systems for Subsea and Marine Applications, 2nd ed. ISO: Geneva, Switzerland, 2006.
  27. Sagrilo, L.V.S.; Prates de Lima, E.C.; Papaleo, A. A joint probability model for environmental parameters. J. Offshore Mech. Arct. Eng. 2011, 133, 031605. [Google Scholar] [CrossRef]
  28. ASTM E1049–85; Standard Practices for Cycle Counting in Fatigue Analysis. ASTM—ASTM International: West Conshohocken, PA, USA, 2011.
  29. Faltinsen, O.M. Sea Loads on Ships and Offshore Structures; Cambridge University Press: Cambridge, UK, 1990. [Google Scholar]
  30. Gibson, R.; Christou, M. Metocean criteria for the fatigue analysis of subsea pipelines. In Proceedings of the ASME 38th International Conference on Ocean, Offshore and Arctic Engineering (OMAE 2019), Glasgow, UK, 9–14 June 2019. OMAE2019-96363. [Google Scholar]
  31. Cai, Q.; Li, Z.; Hu, J.; Huang, B.; Pan, Y.; Wu, H.; Ren, Z. Fatigue study of unbonded flexible risers for ocean thermal energy conversion based on the joint distribution of wind, wave, and current. Appl. Ocean Res. 2025, 154, 104306. [Google Scholar] [CrossRef]
  32. Chian, C.Y.; Zhao, Y.Q.; Lin, T.Y.; Nelson, B.; Huang, H.H. Comparative study of time-domain fatigue assessments for an offshore wind turbine jacket substructure using grid-based and Monte Carlo sampling methods. Energies 2018, 11, 3112. [Google Scholar] [CrossRef]
  33. Estrier, P. Updated method for the determination of the service life of flexible risers. In Proceedings of the First European Conference on Flexible Pipes, Umbilicals and Marine Cables (MARINFLEX), London, UK, 10–11 November 1992. [Google Scholar]
  34. Sheehan, J.M.; Grealish, F.W.; Smith, R.J.; Harte, A.M. Characterization of the wave environment in the fatigue analysis of flexible risers. In Proceedings of the ASME 24th International Conference on Offshore Mechanics and Arctic Engineering (OMAE 2005), Halkidiki, Greece, 12–16 June 2005. OMAE2005-67507. [Google Scholar]
  35. Longuet-Higgins, M.S. On the joint distribution of wave periods and amplitudes in a random wave field. Proc. R. Soc. London. A. Math. Phys. Sci. 1983, 389, 241–258. [Google Scholar] [CrossRef]
  36. Sousa, F.J.M.; Rebello, A.M.V.; Sagrilo, L.V.S.; Siqueira, M.Q. An alternative methodology to evaluate the fatigue life of risers based on regular waves. In Proceedings of the ASME 32nd International Conference on Ocean, Offshore and Arctic Engineering (OMAE 2013), Nantes, France, 9–14 June 2013. OMAE2013-10914. [Google Scholar]
  37. DNV GL. Dynamic Risers; DNV: Høvik, Norway, 2018; DNVGL-ST-F201. [Google Scholar]
  38. Sousa, F.J.M.; Siqueira, M.Q.; De Sousa, J.R.M.; Campello, G.C. Analytical methodology to evaluate flexible risers fatigue lives at the top region. In Proceedings of the ASME 38th International Conference on Ocean, Offshore and Arctic Engineering (OMAE 2019), Glasgow, UK, 9–14 June 2019. OMAE2019-96372. [Google Scholar]
  39. WAMIT. WAMIT User Manual, versions 6.4/6.4S; WAMIT Inc.: Chestnut Hill, MA, USA, 2006.
  40. MARINTEK. MIMOSA User’s Documentation, version 6.3-06; MARINTEK: Trondheim, Norway, 2012.
  41. Orcina. OrcaFlex User Manual, version 11.5c; Orcina Ltd.: Ulverston, UK, 2025. Available online: https://www.orcina.com/webhelp/OrcaFlex/Default.htm (accessed on 20 December 2025).
  42. SINTEF. RIFLEX Documentation; SINTEF Ocean: Trondheim, Norway, 2025; Available online: https://sima.sintef.no/doc/4.8.0/riflex/theory/finite_element_formulation.html#finite_element (accessed on 20 December 2025).
  43. SINTEF. SIMO Documentation, version 4.28.1; SINTEF Ocean: Trondheim, Norway, 2024. Available online: https://sima.sintef.no/doc/4.8.0/simo/index.html (accessed on 20 December 2025).
  44. Chakrabarti, S. Handbook of Offshore Engineering; Elsevier: London, UK, 2005. [Google Scholar]
  45. PETROBRAS. ANFLEX v8.5 User Manual; PETROBRAS: Rio de Janeiro, Brazil, 2024. (In Portuguese) [Google Scholar]
  46. Kim, J.D.; Jang, B.S.; Yun, R.H.; Jeong, H.S. Improvement of the bending behavior of a flexible riser—Part II: Hysteretic modelling of bending stiffness in global dynamic analysis. Appl. Ocean Res. 2020, 101, 102249. [Google Scholar] [CrossRef]
  47. Costa, B.d.P.M.d.; Sousa, J.R.M.d.; Roitman, N.; Radke, E. Theoretical and Experimental Analysis of the Global Response of a Flexible Pipe Under Combined Axisymmetric and Bending Loads. J. Mar. Sci. Eng. 2025, 13, 2180. [Google Scholar] [CrossRef]
  48. He, Y.; Vaz, M.A.; Caire, M. Flexible riser–bend stiffener top connection analytical model with I-tube. Mar. Struct. 2020, 71, 102707. [Google Scholar] [CrossRef]
  49. Liu, Q.; Qu, Z.; Liu, X.; He, J.; Wang, G.; Wang, S.; Chen, F. Nonlinear slippage of tensile armor layers of unbonded flexible risers subjected to irregular loads. J. Mar. Sci. Eng. 2024, 12, 818. [Google Scholar] [CrossRef]
  50. Campello, G.C. Metodologia de Projeto para o Sistema de Ancoragem de Conectores de Dutos Flexíveis e Proposição de Nova Tecnologia. D.Sc. Thesis, COPPE/UFRJ, Rio de Janeiro, Brazil, 2014. (In Portuguese) [Google Scholar]
  51. Boef, W.J.C.; Out, J.M.M. Analysis of a flexible-riser top connection with bend restrictor. In Proceedings of the 22nd Offshore Technology Conference, Houston, TX, USA, 7–10 May 1990. OTC 6436. [Google Scholar]
  52. Bazán, F.A.V.; Prates de Lima, E.C.; Siqueira, M.Q.; Siqueira, E.F.N.; Lemos, C.A.D. A methodology for structural analysis and optimization of riser connection joints. Appl. Ocean Res. 2011, 33, 344–365. [Google Scholar] [CrossRef]
  53. Lu, H.; Vaz, M.A.; Caire, M. Flexible riser tensile armour stress assessment in the bend stiffener region. Eng. Struct. 2022, 254, 113849. [Google Scholar] [CrossRef]
  54. Burke, B.G. An analysis of marine risers for deep-water. J. Pet. Technol. 1974, 5, 123–131. [Google Scholar] [CrossRef]
  55. Nordgren, R.P. On computation of motion of elastic rods. J. Appl. Mech. 1974, 41, 777–780. [Google Scholar] [CrossRef]
  56. Sparks, C.P. Mechanical behaviour of marine risers: Mode of influence of principal parameters. J. Energy Resour. Technol. 1980, 102, 214–222. [Google Scholar] [CrossRef]
  57. Triantafyllou, M.S. Dynamics of cables and chains. Shock Vib. Dig. 1987, 19, 3–5. [Google Scholar] [CrossRef]
  58. Custódio, A.B.; Vaz, M.A. A Nonlinear Formulation for the Axisymmetric Response of Umbilical Cables and Flexible Pipes. Appl. Ocean Res. 2002, 24, 21–29. [Google Scholar] [CrossRef]
  59. Feret, J.J.; Bournazel, C.L. Calculation of stresses and slip in structural layers of unbonded flexible pipes. J. Offshore Mech. Arct. Eng. 1987, 109, 263–269. [Google Scholar] [CrossRef]
  60. Batista, R.C.; Bogarin, J.A.; Ebecken, N.F.F. Local Mechanical Behaviour of Multilayered Flexible Risers. In Proceedings of the 7th Symposium on Offshore Engineering, Rio de Janeiro, Brazil, 21–25 August 1989; pp. 494–510. [Google Scholar]
  61. Love, A.E.H. A Treatise on the Mathematical Theory of Elasticity, 4th ed; Cambridge University Press: London, UK, 1922; ISBN 978-1107618091. [Google Scholar]
  62. Witz, J.A.; Tan, Z. On the Axial-Torsional Structural Behaviour of Flexible Pipes, Umbilicals and Marine Cables. Mar. Struct. 1992, 5, 205–227. [Google Scholar] [CrossRef]
  63. McIver, D.B. A Method of Modelling the Detailed Component and Overall Structural Behaviour of Flexible Pipe Sections. Eng. Struct. 1995, 17, 254–266. [Google Scholar] [CrossRef]
  64. Witz, J.A. A Case Study in the Cross-Section Analysis of Flexible Risers. Mar. Struct. 1996, 9, 885–904. [Google Scholar] [CrossRef]
  65. Ramos, R., Jr.; Martins, C.A.; Pesce, C.P.; Roveri, F.E. A Case Study on the Axial-Torsional Behavior of Flexible Risers. In Proceedings of the 27th International Conference on Offshore Mechanics and Arctic Engineering (OMAE 2008), Estoril, Portugal, 15–20 June 2008. OMAE2008-57514. [Google Scholar]
  66. de Sousa, J.R.M.; Magluta, C.; Roitman, N.; Campello, G.C. On the Extensional-Torsional Response of a Flexible Pipe with Damaged Tensile Armor Wires. Ocean Eng. 2018, 161, 350–383. [Google Scholar] [CrossRef]
  67. Lu, H.; Vaz, M.A.; Caire, M. Alternative Analytical and Finite Element Models for Unbonded Flexible Pipes under Axisymmetric Loads. Ocean Eng. 2021, 225, 108766. [Google Scholar] [CrossRef]
  68. Saevik, S. Theoretical and Experimental Studies of Stresses in Flexible Pipes. Comput. Struct. 2011, 89, 2273–2291. [Google Scholar] [CrossRef]
  69. Muñoz, H.E.M.; de Sousa, J.R.M.; Magluta, C.; Roitman, N. Improvements on the Numerical Analysis of the Coupled Extensional-Torsional Response of a Flexible Pipe. J. Offshore Mech. Arct. Eng. 2016, 138, 011701. [Google Scholar] [CrossRef]
  70. Yoo, D.H.; Jang, B.S.; Yim, K.H. Nonlinear Finite Element Analysis of Failure Modes and Ultimate Strength of Flexible Pipes. Mar. Struct. 2017, 54, 50–72. [Google Scholar] [CrossRef]
  71. Malta, E.R.; Martins, C.A. Finite Element Analysis of Flexible Pipes under Axial Compression: Influence of the Sample Length. J. Offshore Mech. Arct. Eng. 2017, 139, 011701. [Google Scholar] [CrossRef]
  72. Lukassen, T.V.; Gunnarsson, E.; Krenk, S.; Glejbol, K.; Lyckegaard, A.; Berggreen, C. Tension-Bending Analysis of Flexible Pipe by a Repeated Unit Cell Finite Element. Mar. Struct. 2019, 64, 401–420. [Google Scholar] [CrossRef]
  73. Provasi, R.; Toni, F.G.; Martins, C.A. Friction Coefficient Influence in a Flexible Pipe: A Macroelement Model. Ocean Eng. 2022, 266, 112719. [Google Scholar] [CrossRef]
  74. de Sousa, J.R.M.; Magluta, C.; Roitman, N.; Londoño, T.V.; Campello, G.C. A Study on the Response of a Flexible Pipe to Combined Axisymmetric Loads. In Proceedings of the ASME 2013 32nd International Conference on Ocean, Offshore and Arctic Engineering (OMAE 2013), Nantes, France, 9–14 June 2013. OMAE2013-11384. [Google Scholar]
  75. Witz, J.A.; Tan, Z. On the Flexural Structural Behaviour of Flexible Pipes, Umbilicals and Marine Cables. Mar. Struct. 1992, 5, 229–249. [Google Scholar] [CrossRef]
  76. Sævik, S. On Stresses and Fatigue in Flexible Pipes. Ph.D. Thesis, Norwegian University of Science and Technology, Trondheim, Norway, 1992. [Google Scholar]
  77. Leroy, J.M.; Estrier, P. Calculation of Stresses and Slips in Helical Layers of Dynamically Bent Flexible Pipes. Oil Gas Sci. Technol. Rev. IFP Energ. Nouv. 2001, 56, 545–554. [Google Scholar] [CrossRef]
  78. Kebadze, E.; Krainkanic, I. Nonlinear Bending Behaviour of Offshore Flexible Pipes. In Proceedings of the Ninth International Offshore and Polar Engineering Conference (ISOPE), Brest, France, 30 May–4 June 1999. ISOPE-I-99-150. [Google Scholar]
  79. Dong, L.; Huang, Y.; Zhang, Q.; Liu, G. An Analytical Model to Predict the Bending Behavior of Unbonded Flexible Pipes. J. Ship Res. 2013, 57, 171–177. [Google Scholar] [CrossRef]
  80. Ye, N.; Saevik, S.; Zhou, C. Investigation of Antiwear Tape’s Influence on Bending Behavior of One Flexible Riser. In Proceedings of the Twenty-fourth International Ocean and Polar Engineering Conference (ISOPE), Busan, Republic of Korea, 15–20 June 2014. ISOPE-I-14-293. [Google Scholar]
  81. Kim, J.D.; Jang, B.S.; Yun, R.H. Application of Analytical Model in the Prediction of Dynamic Responses and Fatigue Damage of Flexible Risers: Part I—Improvement of Analytical Model Considering Shear Deformation and Varying Tension Effects. Mar. Struct. 2021, 79, 103044. [Google Scholar] [CrossRef]
  82. Kim, J.D.; Jang, B.S.; Kim, H.J. Application of analytical model in the prediction of dynamic responses and fatigue damage of flexible risers: Part II—Dynamic analysis of flexible risers in large-scale domain using a direct moment correction method. Mar. Struct. 2021, 79, 103051. [Google Scholar] [CrossRef]
  83. Dai, T.; Sævik, S.; Ye, N. Friction Models for Evaluating Dynamic Stresses in Non-Bonded Flexible Risers. Mar. Struct. 2017, 55, 137–161. [Google Scholar] [CrossRef]
  84. Wang, L.; Ye, N.; Yue, Q. A Novel Helix Contact Model for Predicting Hysteretic Behavior of Unbonded Flexible Pipes. Ocean Eng. 2022, 264, 112407. [Google Scholar] [CrossRef]
  85. Fang, P.; Li, X.; Jiang, X.; Hopman, H.; Bai, Y. Study of the Effects of Cross Section Shape on the Structural Behaviour of Helical Wires on a Bent Flexible Structure. In Proceedings of the 33rd International Ocean and Polar Engineering Conference (ISOPE), Ottawa, Canada, 19–23 June 2023. ISOPE-I-23-252. [Google Scholar]
  86. Tang, M.; Li, S.; Zhang, H.; Bian, X.; Zhao, X. Monitoring the Slip of Helical Wires in a Flexible Riser under Combined Tension and Bending. Ocean Eng. 2022, 256, 111512. [Google Scholar] [CrossRef]
  87. Doynov, K.; Rombado, G.; Cooke, N.; Majed, A. Validation of predictions of wire stress of flexible pipe with damaged tensile armor wires under combined tension and bending. In Proceedings of the ASME 39th International Conference on Ocean, Offshore and Arctic Engineering, virtual (OMAE 2020), Virtual, 3–7 August 2020. OMAE2020-18525. [Google Scholar]
  88. Shen, Y.; Ma, F.; Tan, Z.; Sheldrake, T. Development of the End Fitting Tensile Wires Fatigue Analysis Model: Sample Tests and Validation in an Unbonded Flexible Pipe. In Proceedings of the Offshore Technology Conference, Houston, TX, USA, 5–8 May 2008. OTC-19197. [Google Scholar]
  89. De Sousa, J.R.M.; Campello, G.C.; Sousa, F.J.M.; Vaillant, A.G.; Ellwanger, G.B. Fatigue analyses of a flexible riser considering end fitting effects. In Proceedings of the ASME 36th International Conference on Ocean, Offshore and Arctic Engineering (OMAE 2017), Trondheim Norway, 25–30 June 2017. OMAE2017-61792. [Google Scholar]
  90. Xu, H.; Gao, T.; Liu, L.; Tian, X.; Kang, J.; Cui, X.; Yang, S. An enhanced Manson-Halford fatigue life prediction model integrating load interaction and residual strength degradation. Eng. Fail. Anal. 2026, 183, 110215. [Google Scholar] [CrossRef]
  91. Paik, J.K.; Melchers, R.E. Condition Assessment of Aged Structures; Woodhead Publishing: Sawston, UK, 2008. [Google Scholar]
  92. Hwang, J.H.; Kim, D.-W.; Lim, J.-Y.; Hong, S.-G. Energy-Based Unified Models for Predicting the Fatigue Life Behaviours of Austenitic Steels and Welded Joints in Ultra-Supercritical Power Plants. Materials 2024, 17, 2186. [Google Scholar] [CrossRef]
  93. American Petroleum Institute. Planning, Designing, and Constructing Fixed Offshore Platforms—Working Stress Design; API: Washington, DC, USA, 2014; API RP 2A-WSD. [Google Scholar]
  94. Negreiros, L.A.S. Avaliação da Resistência à Fadiga e Corrosão-Fadiga da Armadura de Tração de um Riser Flexível Retirado de Operação. D.Sc. Thesis, Universidade Federal do Rio Grande do Sul (UFRGS), Porto Alegre, Brazil, 2016. (In Portuguese) [Google Scholar]
  95. Barnes, P.E. An Investigation into the Corrosion Fatigue Behaviour of High Strength Carbon Steel Tensile Armour Wires. Ph.D. Thesis, The School of Materials, Faculty of Engineering and Physical Sciences, University of Manchester, Manchester, UK, 2014. [Google Scholar]
  96. Rahmati, M.T.; Bahai, H.; Alfano, G. An accurate and computationally efficient small-scale nonlinear FEA of flexible risers. Ocean Eng. 2016, 121, 382–391. [Google Scholar] [CrossRef]
  97. Yoo, D.Y.; Jang, B.S.; Yun, R.H. A simplified multi-layered finite element model for flexible pipes. Mar. Struct. 2019, 63, 117–137. [Google Scholar] [CrossRef]
  98. Edmans, B.D.; Pham, D.C.; Zhang, Z.Q.; Guo, T.F.; Sridhar, N.; Stewart, G. An effective multiscale methodology for the analysis of marine flexible risers. J. Mar. Sci. Eng. 2019, 7, 340. [Google Scholar] [CrossRef]
  99. Silva, V.R.M.; Araújo, B.S. Convolutional neural networks applied to flexible pipes for fatigue calculations. In Proceedings of the ASME 39th International Conference on Ocean, Offshore and Arctic Engineering (OMAE 2020), Virtual, 3–7 August 2020. OMAE2020-18212. [Google Scholar]
  100. Yuan, J.; Zhu, L.; Hou, Y.; Tan, Z. Machine learning in fatigue analysis for an unbonded flexible riser. In Proceedings of the ASME 41st International Conference on Ocean, Offshore and Arctic Engineering (OMAE 2022), Hamburg, Germany, 5–10 June 2022. OMAE2022-83730. [Google Scholar]
  101. Yuan, J.; Zhu, L.; Hou, Y.; Tan, Z.; Wilson, E. Frequency domain analysis and machine learning technique in field fatigue monitoring of flexible risers. In Proceedings of the ASME 42nd International Conference on Ocean, Offshore and Arctic Engineering (OMAE 2023), Melbourne, Australia, 11–16 June 2023. OMAE2023-104905. [Google Scholar]
  102. Dai, T.; Zhang, J.; Ren, C.; Xing, Y.; Sævik, S.; Ye, N.; Jin, X.; Wu, J. Application of a data-driven approach for maximum fatigue damage prediction of an unbonded flexible riser. Ocean Eng. 2024, 306, 118053. [Google Scholar] [CrossRef]
  103. Rodrigues, T.C.; Lacerda, T.A.G.; Gonzalez, G.M.; Sagrilo, L.V.S.; Campello, G.C.; Souza, R.F.; Coser, T.B. An approach for obtaining dynamic responses of slender marine structures assisted by generalized artificial neural networks. In Proceedings of the ASME 43rd International Conference on Ocean, Offshore and Arctic Engineering (OMAE 2024), Singapore, 9–14 June 2024. OMAE2024-126626. [Google Scholar]
  104. De Sousa, J.R.M.; Sousa, F.J.M.; Siqueira, M.Q.; Sagrilo, L.V.S.; Campello, G.C.; Lemos, C.A.D. A methodology to predict the remaining fatigue life of a flexible pipe with broken tensile armor wires. In Proceedings of the ASME 33rd International Conference on Ocean, Offshore and Arctic Engineering (OMAE 2014), San Francisco, CA, USA, 8–13 June 2014. OMAE2014-23969. [Google Scholar]
  105. Coser, T.B.; Negreiros, L.A.S.; Campello, G.C.; Radke, E.D.; Rosa, C.D.; Souza, D.F.; Rodrigues, L.F.V.; Renck, T.S.; Tagliari, M.R.; Borges, M.F. Flexible pipe fatigue evaluation based on a dynamic full-scale test considering a preconditioning corrosion procedure. In Proceedings of the ASME 42nd International Conference on Ocean, Offshore and Arctic Engineering (OMAE 2023), Melbourne, Australia, 11–16 June 2023. OMAE2023-106952. [Google Scholar]
  106. Lei, Q.; Chen, C.; Zhu, X. Tensile failure behavior of unbonded flexible riser with damaged tensile armour wires. Ocean Eng. 2023, 267, 113112. [Google Scholar] [CrossRef]
  107. ANP. Safety Alert 001—CO2 Stress Corrosion Cracking (SCC–CO2); Brazilian National Petroleum Agency: Rio de Janeiro, Brazil, 2017. Available online: https://www.gov.br/anp/pt-br/assuntos/exploracao-e-producao-de-oleo-e-gas/seguranca-operacional-e-meio-ambiente/incidentes/arquivos-alertas-de-seguranca/alerta-12/safety-alert-12-ssm-co2-stress-corrosion.pdf (accessed on 20 December 2025).
  108. Brandão, M.; Pires, F.; Poloponsky, I.; Santos, F.; Lopes, D. Flexible pipes subjected to SCC–CO2: Review and means to increase reliability on service life applied to Brazilian pre-salt fields. In Proceedings of the Offshore Technology Conference, Houston, TX, USA, 16–19 August 2021. [Google Scholar] [CrossRef]
  109. De Sousa, J.R.M.; Dos Santos, A.C. Symbolic regression equations to predict the maximum stress concentration factors in flexible pipes with damaged tensile armors. In Proceedings of the ASME 43rd International Conference on Ocean, Offshore and Arctic Engineering (OMAE 2024), Singapore, 9–14 June 2024. OMAE2024-122906. [Google Scholar]
  110. Lei, Q.; Chen, C.; Luo, H.; Zhu, X. Analysis of tensile response of an unbonded flexible riser with uniform corrosion in tensile armor layers. Ocean Eng. 2025, 326, 120842. [Google Scholar] [CrossRef]
  111. Amaechi, C.V.; Reda, A.; Shahin, M.A.; Sultan, I.A.; Beddu, S.B.; Ja’e, I.A. State-of-the-art review of composite marine risers for floating and fixed platforms in deep seas. Appl. Ocean Res. 2023, 138, 103624. [Google Scholar] [CrossRef]
  112. Liu, Q.; Xue, H.; Tang, W. Behaviour of unbonded flexible riser with composite armour layers under coupling loads. Ocean Eng. 2021, 239, 109907. [Google Scholar] [CrossRef]
  113. Rafiee, R.; Eslami, F. Theoretical modeling of fatigue phenomenon in composite pipes. Compos. Struct. 2017, 161, 256–263. [Google Scholar] [CrossRef]
  114. Wang, Y.; Lou, M.; Liang, W.; Zhang, C. Numerical and experimental investigation on tensile fatigue performance of reinforced thermoplastic pipes. Ocean Eng. 2023, 287, 115814. [Google Scholar] [CrossRef]
  115. Yuan, J.; Hou, Y.; Wilson, E.; Tan, Z. A real-time fatigue monitoring platform for flexible risers. In Proceedings of the Offshore Technology Conference 2021, Houston, TX, USA, 16–19 August 2021. OTC 31267. [Google Scholar]
  116. Hejazi, R.; Grime, A.; Milne, I.; Watson, P.; White, E.; Mariani, A.; Lanoëlë, M. A data-driven framework for fatigue monitoring of operating flexible risers. In Proceedings of the ASME 41st International Conference on Ocean, Offshore and Arctic Engineering (OMAE 2022), Hamburg, Germany, 5–10 June 2022. OMAE2022-78017. [Google Scholar]
  117. Lee, Y.; Jin, C.; Kim, M.; Xu, W. Digital twin approach with minimal sensors for riser fatigue-damage estimation. Int. J. Nav. Archit. Ocean Eng. 2024, 16, 100603. [Google Scholar] [CrossRef]
  118. Sousa, F.J.M.; Siqueira, M.Q.; Lopes, G.K.; Lacerda, T.A.G.; Campello, G.C.; Souza, R.F.; Coser, T.B.; Almeida, R.C.; Oliveira, F.E.S. A digital twin to estimate the remaining fatigue life of risers. In Proceedings of the ASME 43rd International Conference on Ocean, Offshore and Arctic Engineering (OMAE 2024), Singapore, 9–14 June 2024. OMAE2024-128205. [Google Scholar]
Figure 1. An offshore production system composed of lazy wave risers, umbilicals (catenary configuration), a platform, and mooring lines (taut leg configuration). The mooring lines (in black) are configured in four groups, each composed of four lines. Umbilicals are labeled “Cat-U” (in yellow). The lazy wave risers (“LW”) have different functions: oil production (“LW-P”, in green), water injection (“LW-WI”, in red), gas lift (“LW-S”, in blue), and gas injection (“LW-IG”, in pink).
Applmech 07 00029 g001
Figure 2. Unbonded flexible pipe.
Applmech 07 00029 g002
Figure 3. Fatigue calculation for flexible risers—adapted from the workflow proposed in API RP 17B [3].
Applmech 07 00029 g003
Figure 4. Simplified free-body diagram of a lazy wave riser indicating environmental loads. The force and the couple at the top connection in the platform (FT and MT) are three-dimensional. Forces exerted by the seabed (FS) are also three-dimensional (in the riser plane, vertical and longitudinal; perpendicular to the riser plane, they oppose lateral displacements). FW is the riser self-weight, including fluids. At the floaters’ region, it also includes the floaters’ weight and buoyancy. Environmental loads are also three-dimensional and affect the whole riser length. FRC is the horizontal force at the riser-flowline connection.
Applmech 07 00029 g004
Figure 5. Wave scatter diagram.
Applmech 07 00029 g005
Figure 6. Riser configurations using floaters. The forces and labels in these figures follow the same assumptions as in Figure 4.
Applmech 07 00029 g006
Figure 7. (a) Riser discretization in beam elements, indicating nodes and elements’ numbers; and (b) for element EL02, co-rotated beam element (6 DOF by node). Rotations are represented by double arrows.
Applmech 07 00029 g007
Figure 8. Representation of riser discretization by Orcaflex (adapted from [41]).
Applmech 07 00029 g008
Figure 9. Typical bending hysteresis curve of a flexible riser.
Applmech 07 00029 g009
Figure 10. Riser connection system at an FPSO platform: bend stiffener, bellmouth, and I-Tube.
Applmech 07 00029 g010
Figure 11. FE model for the local analysis of flexible pipes.
Applmech 07 00029 g011
Figure 12. Representation of one wire in a tensile armor layer, indicating the wire angle α, the riser, and the wire local reference systems and the wire dimensions (height h and width w). True wall tension T w is distributed among all wires.
Applmech 07 00029 g012
Figure 13. Simplified free-body diagram representing forces in a differential element of a tension wire. Friction stresses and contact pressures are applied on the upper and lower faces of the wire.
Applmech 07 00029 g013
Figure 14. Flexible riser connected to an end fitting. The layers of the flexible riser are shown schematically.
Applmech 07 00029 g014
Figure 15. Goodman and Gerber corrections to consider mean stress effects. The dotted line indicates the constant stress ratio R for which the S–N curve was obtained.
Applmech 07 00029 g015
Figure 16. Examples of design S–N curves.
Applmech 07 00029 g016
Figure 17. (a) Damaged wires in a flexible riser; (b) Numerical model (displacements, mm).
Applmech 07 00029 g017
Figure 18. Thermoplastic Composite Pipe (TCP).
Applmech 07 00029 g018
Table 1. Typical materials and functions of flexible pipes’ layers [3,4].
LayerFunctionMaterial *
Interlocked carcassProvides collapse resistance.Stainless steel (AISI 304L/316L) and high-alloy stainless steel (Duplex).
Pressure sheathContains the process fluid within the pipe bore.HDPE, XLPE, PA11, PA12, and PVDF.
Pressure armorPartially supports the pressure sheath and internal pressure loads.
Provide additional radial capacity to compressive radial loads.
Carbon steel.
Antiwear tapePrevents metal-to-metal contact.PA and PP.
Inner and outer tensile armorsProvide tensile strength, partial pipe resistance against internal pressure, and contain end-cap loads.High-strength carbon steel.
Outer sheathKeeps the tensile armors in position after forming, prevents seawater ingress, and protects steel wires from corrosion, abrasion, and mechanical damage.HDPE and PA.
* Typical materials. Others may be used depending on the pipe application.
Disclaimer/Publisher’s Note: The statements, opinions and data contained in all publications are solely those of the individual author(s) and contributor(s) and not of MDPI and/or the editor(s). MDPI and/or the editor(s) disclaim responsibility for any injury to people or property resulting from any ideas, methods, instructions or products referred to in the content.