Article

Cool It! On Energy Dissipation, Heat Generation and Thermal Degradation: The Microstructurothermal Entropy and Its Application to Real-World Systems

by
Jude A. Osara
Department of Mechanics of Solids, Surfaces and Systems, University of Twente, 7522 NB Enschede, The Netherlands
Appl. Mech. 2025, 6(3), 62; https://doi.org/10.3390/applmech6030062
Submission received: 3 May 2025 / Revised: 11 July 2025 / Accepted: 13 August 2025 / Published: 18 August 2025
(This article belongs to the Special Issue Thermal Mechanisms in Solids and Interfaces)

Abstract

Thermodynamic free energy is used to elucidate the significance of energy dissipation-induced temperature rise on the performance, reliability, and durability of all systems, biological, chemical and physical. Transformation (a measure of reliability) and degradation (a measure of durability) are distinguished. The temperature rise mechanism is characterized by the microstructurothermal (MST) energy/entropy. A framework to quantify the contributions of the MST entropy to system transformation and degradation is introduced and demonstrated using diverse multi-physics systems: cardiovascular strain in humans, charge capacity of batteries, tribological wear of journal bearings, and shear strength of lubricating greases. Various levels of temperature-induced degradation are observed in the systems. Thermal degradation rate increases with process and energy dissipation rates. The benefits of active cooling on systems and materials are shown. This article is recommended to engineers, scientists, designers, medical doctors, and other system analysts for use in dissipation/degradation characterization and minimization.

1. Introduction

The adverse effect of heat and high temperatures on our bodies and everything around us is evident. According to the United Nations Environment Program (UNEP) [1], electricity consumption used for cooling is predicted to double (increase of over 110%) by the year 2040 with current practices. Hence, research and technological advances in energy-efficient processes and cooling methods are of utmost importance. However, quantifying the degradation impact of heat remains nontrivial and intractable.
When we rub our hands together, we feel them getting hot. Continuous rubbing leads to pain, a sensory signal detected and measured by the nociceptors, and interpreted by the central nervous system. Further rubbing leads to skin breakage. In technical parlance, the heat we feel is generated by friction between both hands, the pain is an indication of interfacial degradation, and the skin breakage is system failure.
Friction, the resistance to motion, accompanies all relative motion between two surfaces, hence the above phenomena—from heat generation to failure—are spontaneously experienced by all dynamic systems. Other examples include: discharging and charging of energy storage and transfer systems—such as batteries, capacitors, fuel cells, among others—in which resistance to the motion/flow of an energy carrier (or charge) generates heat that can lead to instability [2,3]; heat generation in lubricated tribological systems leading to lubricant degradation, as experienced in grease-lubricated bearings and gears in which the grease degrades with use [4,5]; and the extensively documented polymer degradation due to heat [6].
The universe—macroscopic and microscopic—is governed by the laws of thermodynamics. All energy conversions and transfers are accompanied by energy dissipation: microstructural organization/disorganization, and heat generation. For example, plastic loading of a metal, a running athlete, turbulence, an exothermic reaction, product formation from raw materials, etc. In all these systems, if the heat is not mitigated or dissipated, failure ensues. Manufacturers often specify an operational temperature range for their devices, to minimize or inhibit degradation. Temperature rise in a non-thermal system can induce and exacerbate higher-order mechanisms such as side reactions and nonlinear degradation phenomena. In lithium-ion batteries, temperature increases can accelerate solid electrolyte interphase (SEI) growth, gas evolution, and/or induce phase transitions in the solid-state electrode materials [7]. Electric vehicle battery packs cannot operate continuously without adequate thermal management systems [8].
The aforementioned systems are examples of non-thermal or work systems. These are systems in which heat is an accompanying mechanism to the primary mechanism (or energy conversion), usually a work input or output. In contradistinction, thermal systems utilize heat as the primary energy form. Examples of thermal systems are combustion engines and thermal energy storage systems. Here, components are made of special high-temperature materials which degrade when subjected to thermal cycling and temperatures near or above their operational limits. Heat transfer is a key interaction in thermal systems.
Several studies have correlated heat and temperature rise to the performance and degradation of non-thermal systems. Tatterson et al. [9] and Periad et al. [10] demonstrated the impact of heat stress on the physical performance and fatigue of humans. Liu et al. [11] investigated the heat generation mechanisms in rubber composites, identifying viscoelasticity and friction as dominant. They showed the impact of heat on composite material degradation. Amiri and Khonsari [12] showed a relationship between the initial temperature rise in a cyclically loaded metal rod and its fatigue life. Fouvry et al. [13] directly related fretting wear to the energy dissipated in a tribological contact. Doelling et al. [14] observed a linear relationship between wear volume in a boundary-lubricated contact and entropy transfer via forced cooling. Chatra et al. [15] correlated the churning temperature of lubricating grease with its operational life in a bearing. Lugt [16] presented an Arrhenius relationship between the temperature and the remaining useful life of grease. Osara and Bryant [17] proposed a temperature-only method for assessing system degradation.
Notwithstanding the readily observed and demonstrated impact of heat and high temperatures on an active system’s performance and degradation, most system analyses often neglect the effect of temperature rise due to the difficulty in quantifying (the significance of) the often low magnitude of heat storage—the thermal energy due to temperature rise or latent heat—relative to the primary interaction—the mechanism or energy conversion that generates the heat. For example, the electrochemical energy transferred to or from a battery in stable operation is orders of magnitude higher than the heat energy stored during the process. In engineering, it is commonplace and widely accepted to ignore effects that are orders of magnitude lower than their companioning effects, particularly when the former are difficult to characterize and evaluate.
To buttress the significance of the temperature rise mechanism, this article discusses energy dissipation-induced heat generation and storage, and quantifies the latter’s impact on degradation. The recently introduced microstructurothermal (MST) entropy [18]—non-existent in the widely used exergy analysis—is formulated and shown to be significant in the transformation and degradation of active macroscopic systems. The Degradation-Entropy Generation (DEG) and Transformation-Phenomenological Entropy Generation (TPEG) theorems are reviewed and applied to dissipative systems including human athletes, lithium-ion batteries, journal bearings, and lubricant grease.

2. Definitions

The following definitions are relevant to the discussions in this treatise, with some reproduced from our recent article [19]:
  • Observable: A metric such as a physical property, figure of merit or performance indicator is observable if it can be sensed and directly measured.
  • Primary (work) interaction: The most dominant/active process a system is undergoing. For example, while the temperature of a battery may rise during charging, the (Ohmic) charge transfer into the battery is the primary interaction. In a bearing, the mechanical work—the product of force/torque and displacement—is the primary interaction.
  • Energy dissipation: the loss of energy, typically via conversion into heat and microstructural disorganization.
  • Phenomenological: Characterized by observable phenomena, such as increase in temperature.
  • Transformation: A change in state quantified by the difference between the instantaneously observable time varying value of a non-monotonic transformation measure (or performance indicator) and its initial/reference value. Degradation often involves a negative transformation and healing often involves a positive transformation.
  • Phenomenological transformation w p h e n [19]: The instantaneously observed transformation of a system or material via a non-monotonic transformation measure or metric.
  • Microstructurothermal MST entropy [18,19]: The entropy associated with the temperature rise mechanism.
  • Phenomenological entropy generation S p h e n [18]: The instantaneous entropy generation—observable through the state variables that characterize the active mechanisms—is the sum of all primary interaction/work and compositional change entropy generations S W , i , and MST entropy S μ T . Unlike total entropy generation S’ which is always non-negative, S p h e n is positive for energy addition and negative for energy extraction, in accordance with IUPAC sign convention. These concepts are further elucidated in Section 3.
  • Reversible transformation w r e v [19]: the quasi-static, near zero-degradation, or healthiest transformation of a system or material.
  • Hyperplane: a subspace of dimension n 1 where n is the dimension of the containing geometric space. In a three-dimensional (3D) space, a hyperplane is a two-dimensional (2D) or flat surface of the mathematical form: w = B 1 S 1 + B 2 S 2 + w 0 , where B 1 and B 2 are the orthogonal slopes of the plane, S 1 and S 2 are the coordinates in the space that locate points on the hyperplane, and w 0 is the offset from the origin on the w-axis. The models presented in this study are hyperplanes in which S i are entropies and w is a transformation measure.

3. Methods

3.1. Free Energy Dissipation

The first law of thermodynamics gives the rate of change in a stationary system’s internal energy [18]
U ˙ = Q ˙ W ˙ + ( u + P V ) N ˙ e + μ k N ˙ k
as the net sum of the rate of heat transfer into the system Q ˙ , the rate of work done by the system W ˙ , energy transfer rate via net matter flow ( u + P V ) N ˙ e and internal compositional energy changes μ k N ˙ k (e.g., via chemical reactions). Here, u is the specific internal energy of the matter entering and exiting the system, P is pressure, V is volume, N e is the net amount of matter entering and exiting the system, μ k is the chemical potential, and N k is the amount of material changing within the system. The dot (·) notation represents the time rate of change d ( ) d t . In thermal systems—primarily used for their thermal energy or heat content—the internal energy and enthalpy changes give a good indication of useful energy. However, in non-thermal systems—primarily used for their non-thermal energies, e.g., mechanical, electrical, chemical and nuclear—the internal energy change is unsuitable for useful energy analysis. For these classes of systems, the thermodynamic free energies, Legendre transforms of the internal energy, are appropriate [20].
The first is the Gibbs free energy G = U + P V T S —which indicates the extremum (maximum/minimum) compositional energy change a system can undergo—useful for biological, chemical/nuclear and energy storage systems. The Gibbs free energy is a maximum when the amount N of active species k decreases, also called system decomposition, and a minimum when the amount of active species increases, also called system formation. According to the second law of thermodynamics, real systems undergoing real processes lose energy via entropy generation S . Entropy generation is not directly observable or measurable, but can be estimated via a combination of the first and second laws with the free energies [18]. To obtain general forms of the relevant fundamental relations, the conjugate variables of pressure and volume in compression work P V are replaced with generalized force Y and generalized displacement X in generalized work Y X . Then the rate of change in the Gibbs free energy of a real system is [18]
G ˙ = S T ˙ + X Y ˙ + μ k N ˙ k T S ˙
where S is entropy content, T is temperature, X is generalized position or displacement, Y is generalized force, μ is chemical potential, and N is amount of active species k. Here, for system decomposition, T ˙ > 0 , Y ˙ < 0 , and N ˙ k < 0 to render G ˙ < 0 . The signs reverse for system formation. For both system decomposition and formation, the second law asserts a non-negative entropy generation S ˙ 0 [21].
The second is the Helmholtz free energy A = U T S —which indicates the extremum energy a system can give or receive via external work interaction—useful for physical systems such as mechanical, electrical, magnetic, electrochemical, among others. The Helmholtz free energy is a maximum when the system is loaded or work is obtained from it, e.g., a running athlete or discharging battery, and a minimum when work (external energy) is added to it, e.g., a feeding athlete or a recharging battery. The rate of change in the Helmholtz free energy is [18]
A ˙ = S T ˙ Y X ˙ + μ k N ˙ k Phenomenological energy T S ˙ Degraded energy
For energy extraction, T ˙ > 0 , X ˙ > 0 , and N ˙ k < 0 to render A ˙ < 0 . The signs reverse for energy addition. For both energy extraction and addition, the second law asserts a non-negative entropy generation S ˙ 0 .
In biological and energy storage systems, the internal compositional change is directly coupled with the external transfer of work. For such systems, the externally accessible Helmholtz free energy is more convenient to measure and, as such, can replace the Gibbs free energy [18]. Consequently, almost all non-thermal systems can be characterized using the Helmholtz free energy. Combining all active external work rates Y X ˙ and internal chemical reaction rates μ k N ˙ k into the sum of i primary active interaction rates i Y i X ˙ i , Equation (3) is re-written as
A ˙ = i Y i X ˙ i S T ˙ Phenomenological energy T S ˙ Degraded energy
The first two right-hand side terms in Equation (4) form the Helmholtz phenomenological energy change rate [18] which we will use in Section 4 and Section 5. It consists of physically observable and measurable variables.
Owing to the thermodynamic state principle, the Helmholtz free energy change rate A ˙ can also be evaluated along non-dissipative, reversible transformation paths, via theoretical quasi-static interactions—e.g., elasticity, reversible charge transfer, frictionless mechanical work, isothermal and isobaric chemical reaction, etc.—in which generalized forces Y i (including chemical potential μ k ) = Y r e v , i do not degrade over time. Substitute into Equation (4) to obtain
A ˙ = i Y r e v , i X ˙ i Reversible work = i Y i X ˙ i S T ˙ Phenomenological energy T S ˙ Degraded energy
Equation (5) is a form of the recently proposed Phenomenological Entropy Generation (PEG) theorem [18]. For systems undergoing i concurrent interactions, A ˙ = i A ˙ i = i Y r e v , i X ˙ i is the sum of the ideal energy changes accompanying all i sub-interactions. Rearranging yields the rate of free energy/work dissipation or unavailable free energy as
A ˙ d i s s = i ( Y r e v , i Y i ) X ˙ i free energy / work dissipation = S T ˙ MST energy storage + T S ˙ energy degradation
the portion of the reversible (or maximum) work rate Y r e v X ˙ unavailable for actual work Y X ˙ , manifest as the sum of the Microstructurothermal (MST) energy rate S T ˙ —observable/measurable via the temperature rise rate T ˙ —and the unobservable/unmeasurable energy degradation rate T S ˙ .
The MST energy S d T is the internally accumulated portion of the free energy dissipated (by mechanisms such as friction), physically observed via the temperature rise of the system. It is the perceived thermal response to external load or internal system change. In the MST energy, entropy content S—a measure of the system’s microstructural organization—drives the temperature rise d T . Temperature can vary in time and space, for example, in systems with high thermal gradients. In steady-state, very slow and/or isothermal processes, T ˙ 0 to render S T ˙ 0 . Hence, the MST energy storage quantifies the degree of disorganization or entropy accumulation in a system’s microstructure under thermal stress. Examples of microstructure-related mechanisms are coarsening, agglomeration, and grain growth at increased temperatures. The MST term captures microscale fluctuations, higher-order mechanisms, and associated structural phenomena such as phase distribution and grain orientation. See Section 3.1.3 and Section 3.1.4 for more on the MST term.
Equation (6) suggests that free energy dissipation has two constituent mechanisms:
  • the phenomenon: microstructurothermal energy storage via the temperature rise (this is still a form of energy which may or may not be useful—for example, for process heating—and may be partially recovered by cooling); and
  • the noumenon: the permanently lost energy.
A noumenon is a thing that exists, whether or not we can perceive or experience it. Conversely, a phenomenon is a thing we can observe/perceive or experience via our senses.

3.1.1. Availability Analysis (Exergy Destruction) vs. Utility Analysis (Energy Degradation)

In engineering thermodynamics [22,23], exergy—the portion of a system’s total energy available for useful work, relative to a thermodynamic dead state—is commonly used to measure the quality of the system’s energy. The Gouy-Stodola theorem [24] defines exergy destruction rate, the rate at which energy is lost due to irreversibilities (or imperfections), as
i ( Y r e v , i Y i ) X ˙ i = T 0 S ˙
where T 0 is the thermodynamic dead state temperature, often the temperature of the extended surroundings as a thermal reservoir. Equation (7) assumes that the system is in equilibrium with the surroundings at the end of the process, whereas Equation (6) makes no such assumption but, instead, evaluates the useful energy in the active system at its instantaneous temperature T which depends on the system’s heat generation and transfer rates, and typically remains different from the extended surroundings temperature T 0 . Therefore, two systems can have the same exergy destruction rate T 0 S ˙ but different energy degradation rates T S ˙ . Comparing Equations (6) and (7), Gouy-Stodola’s exergy destruction is this article’s free energy dissipation (or work dissipation), the unavailable energy for useful work. Subtracting the Microstructurothermal energy (the temperature rise mechanism) from the exergy destruction then gives the irreversible and permanent energy degradation (and, when divided by temperature, entropy generation). Substitute (7) into (6) and rearrange to render
Energy degradation ( T S ˙ ) = Exergy destruction ( T 0 S ˙ ) MST energy storage ( S T ˙ ) .
Equation (6) governs a system’s instantaneous non-equilibrium energy utility [25], while Equation (7) governs a system’s energy availability relative to a theoretical universal standard/reference equilibrium state. For example, in a battery, free energy dissipation rate is T 0 S ˙ = ( Y r e v Y ) X ˙ = ( v O C v ) I and the MST energy storage rate—via the Gibbs–Duhem formulation and Faraday’s law [26]—is S T ˙ = C v ˙ . Substitute into Equation (8) to obtain the rate of energy degradation in the battery
T S ˙ = ( v O C v ) I + C v ˙ .
Here, v is the battery’s voltage, v O C is the open-circuit (unloaded) voltage, I is the current, and C is the battery’s charge content. This article employs Equation (6) (re-stated in Equation (8)) to quantify a system’s utility (performance, reliability, and durability) via the two active mechanisms of work W (accompanied by free energy/work dissipation) and temperature rise T. More examples are derived in Section 4.

3.1.2. Entropy Generation

All the variables in Equation (6), except entropy generation rate S ˙ , can be readily measured or estimated. Rearranging Equation (6), entropy generation rate is suitably evaluated as
S ˙ entropy generation = i ( Y r e v , i Y i ) X ˙ T work dissipation entropy S T ˙ T MST entropy storage .
Entropy generation rate S ˙ , the left-hand side term in Equation (10), and the work (or free energy) dissipation entropy rate S ˙ W , d i s s , i (the first right-hand side term) are always positive in real systems, during both degradation and growth/formation (or manufacture). MST entropy storage rate S ˙ μ T , the second right-hand side term, can be positive or negative depending on the temperature change rate, the latter negative in a cooled system. Figure 1 illustrates the above concepts for a loaded system (doing work), represented by a downward accumulating work/energy, see the reversible and actual work lines, green-dashed and blue-dotted, respectively. For product formation or energy addition, the work/energy trends upwards. In both cases, energy dissipation (the pink dashed line), the difference between reversible and actual works, is always positive, trending upwards. The MST energy (red line), depending on temperature changes, is non-monotonic. Note that true reversibility does not involve temporal or rate effects [20]; hence, the reversible work defined here involves pseudo-, quasi- or near-reversibility. It is the maximum work obtainable.
In very slow systems with minimal energy dissipation, all three terms in Equation (10) are small and of similar order of magnitude. As the process rate ( X ˙ ) increases, the generalized force, strength or potential Y i decreases faster, and the work (or free energy) dissipation rate increases. Recall the experience of a battery’s voltage dropping faster with increase in discharge current. For a system to perform work for an extended time period, the work rate must be significantly higher than the MST energy rate, seemingly justifying the negligence of the temperature rise (or thermal energy storage) term in the analyses of long-running non-thermal systems. As I will show with the real-world examples in Section 4, the actual adverse impact of thermal energy accumulation can be significant. In some systems, work and MST energy rates could be of the same order of magnitude.

3.1.3. Microstructurothermal (MST) Energy and Entropy Storage

Equation (6) indicates that the unavailable energy during system transformation or energy conversion includes microstructure-disorganizing entropy generation and an inter-dependent rise in temperature. In Equation (6), both MST energy and energy degradation rates determine free energy dissipation rate. A non-dissipative system, for which A ˙ d i s s = 0 , is isothermal ( T ˙ = 0 ) and generates no entropy ( S ˙ = 0 ), hence Y = Y r e v . In a very slow process, these increments are minimal, as experienced in a slow-discharging battery, a slow-running/walking athlete, or soft rubbing of hands. In a fast process, free energy dissipation is high as evidenced in the high temperature rise during fast discharging/recharging of a battery, fast hand rubbing, and increasing sweat rate of an athlete. For the athlete, the sweat rate increases to regulate temperature rise rate which would otherwise lead to organ failures [10].
The MST energy storage rate ( S T ˙ ) is a product of accumulated entropy content S and the resultant temperature change rate T ˙ . A system’s entropy content, relative to an initial/reference state 0, is [18]
S = m c ln T T 0 thermal + β ( X X 0 ) thermo mechanical λ ( N N 0 ) chemical
a function of material properties: heat capacity c, coefficient of thermal stress β = α E (the product of thermal expansion coefficient α and load modulus E), thermochemical decay coefficient λ (when chemical reactions are active); and state/process variables: mass m, temperature T, generalized displacement X and amount of reactive species N. The system’s state/response/process variables ( T , X , Y , m , N ) depend on active interaction rates (e.g., athlete speed or electric current), loads and conditions (e.g., external temperature control). For continuous processes, material properties ( c , β , λ ) can be assumed steady over a wide range of values of the state variables, to simplify computations. In reality, the material properties may vary with changing state variables. For a dissipative process, Equation (11) shows that entropy content S increases over time as temperature increases, X accumulates and N decreases. The first term includes the contribution of thermal energy rise (which increases the kinetic energy of the atoms/molecules) to accumulated entropy. The second term quantifies the combined contributions of the system’s thermomechanical response (via the thermal expansion/strain coefficient) and the non-thermal response (via the load modulus). The third term is the contribution of the thermo-chemical response, i.e., the effect of temperature change on the system’s internal compositional energy—the energy in each constituent basic unit or element. An example is the voltage-temperature coefficient often used in energy conversion and storage systems.
Conjugating the entropy content—composed of material properties—with temperature rise—which initiates and/or accelerates several higher-order mechanisms—the MST energy/entropy storage characterizes nonlinear and transient phenomena including instabilities. Equation (6) shows that to minimize free energy dissipation, the MST energy storage must be minimized, which will, in turn, reduce energy degradation. When active or forced cooling is used to minimize temperature rise, removing the MST energy/entropy from the cooled system’s Helmholtz or Gibbs energy/entropy balance must add the heat flow (or cooling) energy/entropy to the cooling source’s energy/entropy balance.

3.1.4. Fluctuations, Instabilities, and Critical Phenomena
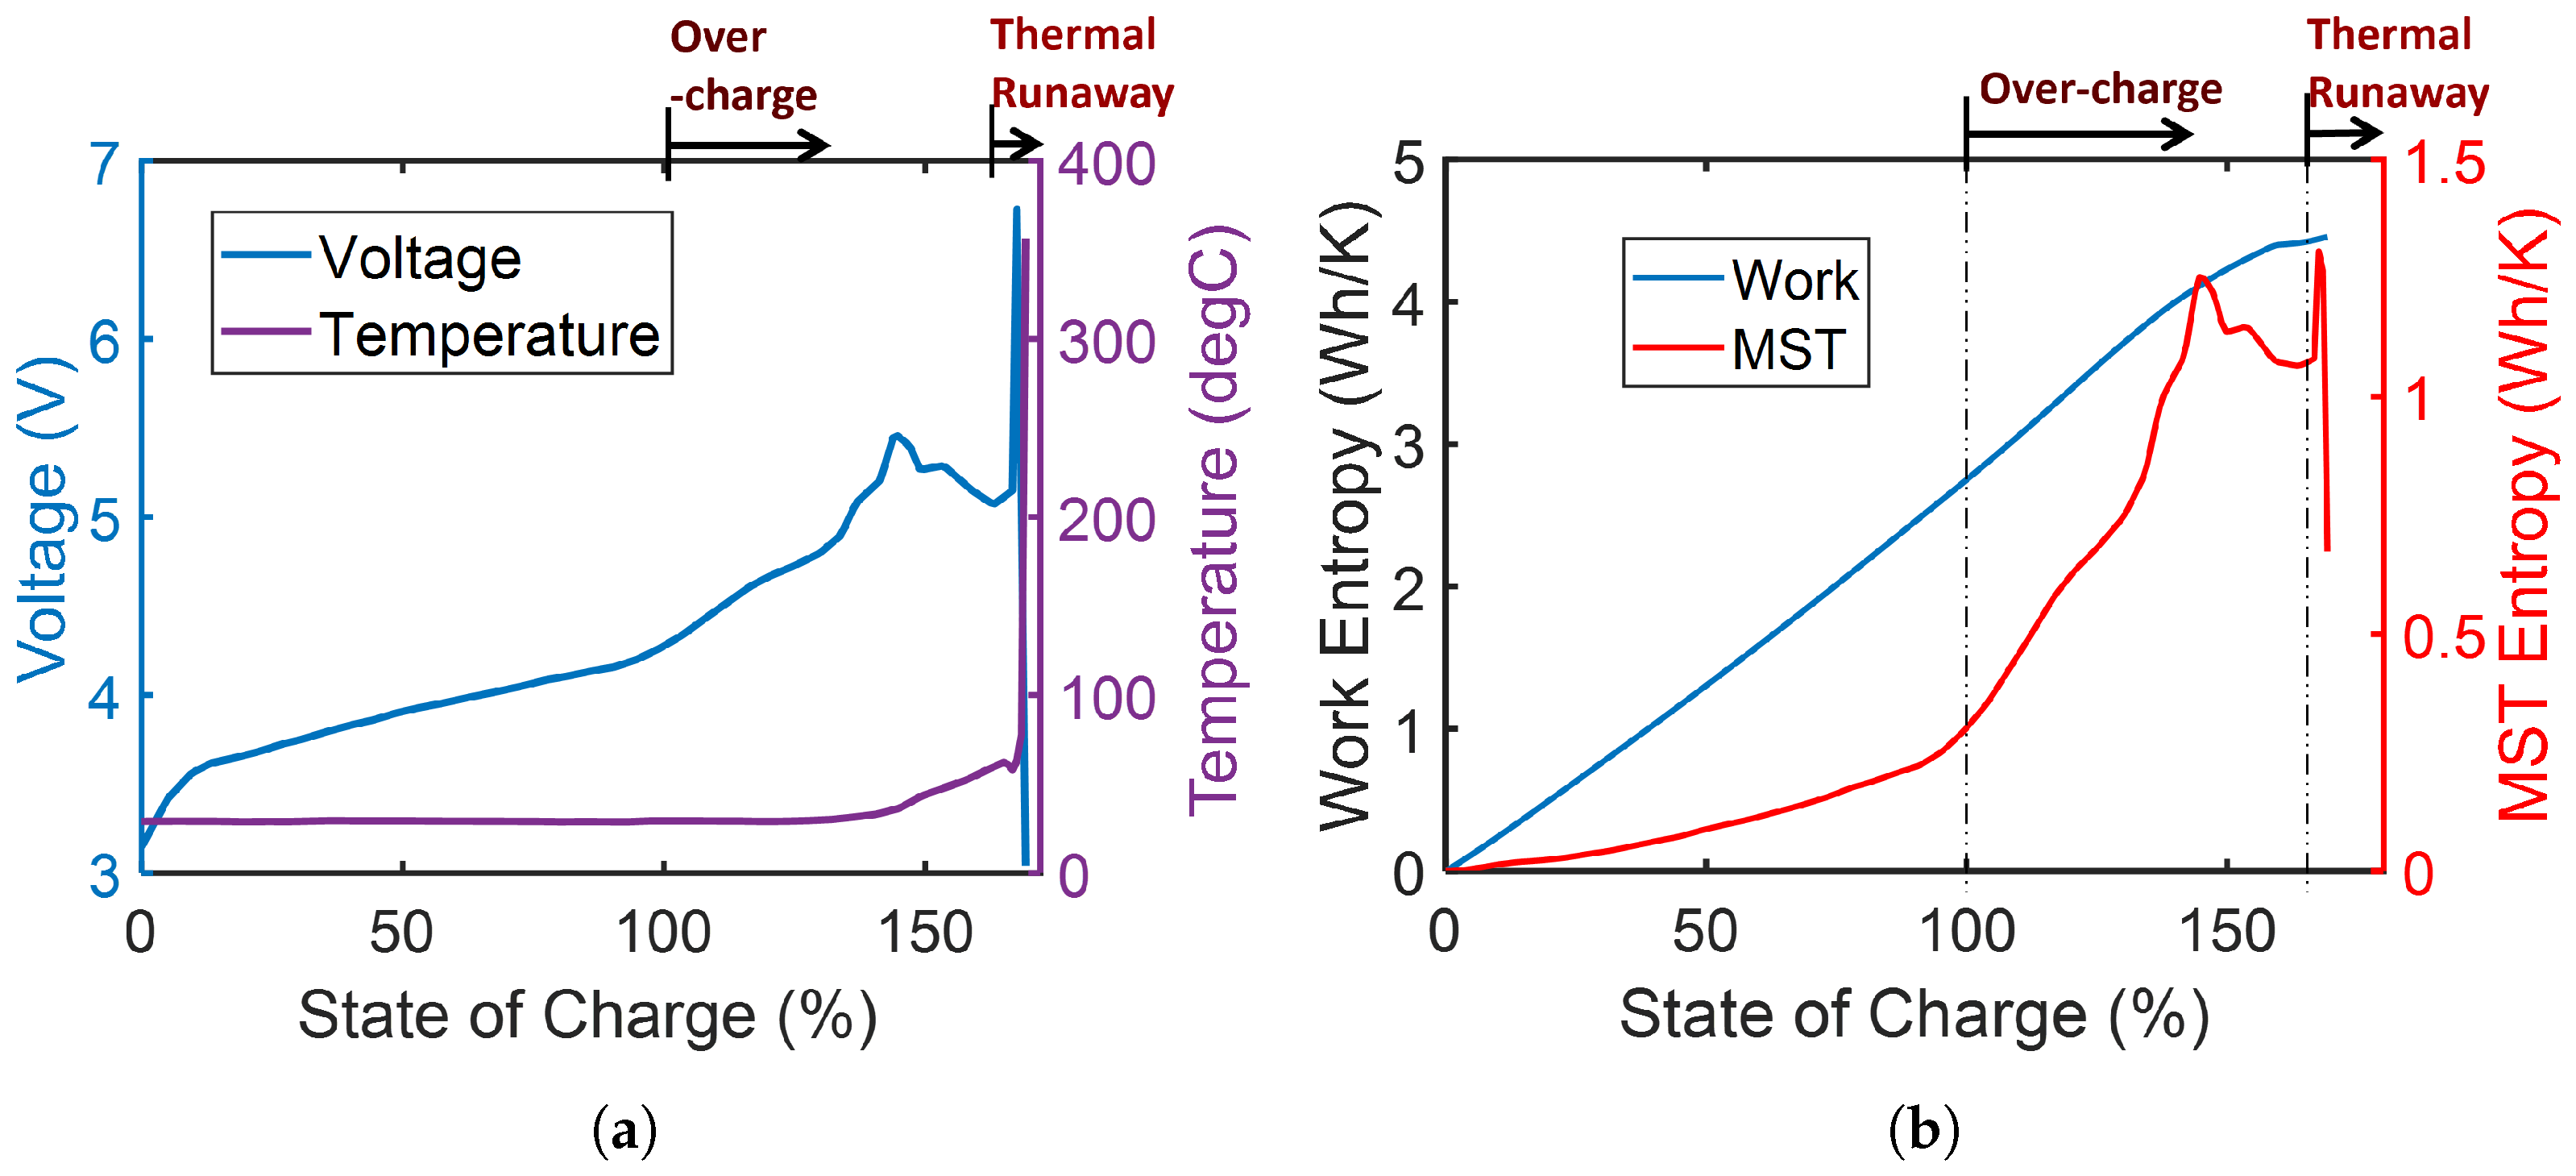
In this section, I will show one of the limitations of using only the work entropy or work dissipation entropy, as done in most entropy characterizations which often involve forms of the Gouy-Stodola theorem and Prigogine’s minimum entropy generation [27]. I will show that the MST entropy, computed from changes in temperature and potential—both measures of the internal state of the system—indicates fluctuations, instabilities, and critical phenomena.
When the free energy dissipation-induced heat generation continues to raise the system’s temperature—for example, with insufficient cooling—the system will inevitably become unstable and suddenly fail. This is experienced as thermal runaway in batteries [19], leading to fire and explosions in large battery packs [28]. Prolonged activity in a hot and humid environment can lead to serious non-fatal and fatal injuries to the human body [29]. Low-cycle fatigue of solid materials is typically accompanied by a sudden rise in temperature at onset of failure [30]. These critical phenomena are not typically evident in the primary work interaction signal. The MST energy and entropy, functions of instantaneous temperature, bear and anticipate fluctuations, instabilities and critical phenomena.
Figure 2 shows an example of a lithium-ion battery undergoing over-charge leading to thermal runaway. The experimental measurements are described in reference [31] from where the voltage and temperature profiles in Figure 2a are obtained. Ouyang et al. [31] observed no physical changes to the battery until the battery was charged to 145% state of charge (SOC). Subsequently, they observed battery swelling, rupture and finally ignition at almost 170% SOC. Voltage continued to rise until about 148% when the battery started to swell. Then voltage dropped continuously until the battery became too unstable, resulting in a sudden spike in voltage and physical rupture. The battery subsequently ignited, dropping the voltage to zero with a spike in temperature.
Using the definitions in Equation (9) and references [18,26], primary work entropy v I / T (Ohmic work divided by temperature) is the blue plot in Figure 2b. The accompanying MST entropy C v ˙ / T , is the red plot. Detailed battery analysis is presented in Section 4.3. The discussion here focuses on showing that of the two often active mechanisms, the MST mechanism is the only indicator of fluctuations and critical phenomena. Examining both left and right vertical axes’ scales shows that work entropy is consistently higher than MST entropy. However, work entropy maintains a linear profile beyond full charge (100% state of charge), showing a slight change at rupture. The MST entropy, on the other hand, bearing the characteristics of voltage and temperature changes, shows an increase in slope at the start of over-charge, demarcating the first instability, well before physical changes were observed in the battery. Other ensuing mechanisms—observed during the experiment as battery expansion and, ultimately, ignition [31]—are visible in the MST entropy profile (which has a non-monotonic behavior) well in advance of rupture and thermal runaway. At ignition, the MST entropy drops as voltage drops and temperature spikes. In the MST entropy signal, rupture and ignition are marked by discontinuities while the work entropy signal is continuous during thermal runaway events.
Figure 2. (a) Voltage and temperature measured; (b) the active work and MST entropies computed during charge and over-charge of a 20-Ah commercial lithium-ion battery versus the battery’s state of charge. The over-charge instabilities are only evident in the MST entropy.
Applmech 06 00062 g002

3.2. Heat Generation and Storage

Dissipative mechanisms, such as friction, plasticity, electrical resistance, etc., generate heat. Via the rate-form thermal energy balance, this heat generation in an active system
Q ˙ g e n heat generation = m c T ˙ heat storage · ( k T ) heat diffusion
induces a rise in its temperature (the first right-hand side term in Equation (12)) and heat diffusion (the second right-hand side term).
Equation (12) applies only to thermal mechanisms (involving temperature changes only), whereas Equation (6) includes all active (thermal and non-thermal) mechanisms. Comparing Equation (12)’s heat storage m c T ˙ with Equation (6)’s microstructurothermal energy storage S T ˙ (with Equation (11) substituted for S) shows that the latter includes, in addition to the specific heat capacity c present in the former, non-thermal material properties ( β and λ ) characterizing material/system response to the prevalent work/energy interactions. Note that there are interactions in which thermal mechanisms dominate entropy content, rendering S m c log T T 0 where T 0 is a standard/reference temperature. Onsager [32] and Pauli [33] correlated Equation (6)’s entropy generation with Equation (12)’s heat diffusion. Thus, Equation (12) is subsumed in Equation (6). For convenience in system characterization, heat generation is often assumed equal to energy dissipation, an assumption that neglects other possibly significant mechanisms.

3.3. Effect of Temperature Rise on Reliability (Transformation) and Durability (Degradation)

In this section, I apply two related theorems to estimate the transformation and degradation impact of temperature rise on a system. I will show that a system’s transformation determines its performance and reliability while a system’s degradation determines its durability.

3.3.1. Durability via the Degradation-Entropy Generation Theorem

Bryant et al. [34], after observing a direct correlation between entropy transfer via heat and interfacial wear in a steady-state boundary-lubricated tribological interface, derived and proposed a universal theory of degradation for continuous processes:
w = j B j S j
where w is a user-selected monotonic degradation measure and S j are monotonic entropy generations accompanying j active interactions (or mechanisms). The fundamental relation for entropy generation is given in Equation (10). Degradation coefficients B j are obtained as the partial differentials of time-accumulated degradation measure with respect to time-accumulated entropy generation components ( B j = w S j ). Equation (13) is the Degradation-Entropy Generation (DEG) theorem and pertains to degradation/durability analysis. Proof and more details are in reference [34].
Via the state principle [35,36], the number of active mechanisms j is the sum of the primary interaction (work/reaction) mechanisms W i and the thermal mechanism T, i.e., j = { W i , T } [19]. Substituting entropy generation (Equation (10)) into the DEG model (Equation (13)) yields, for a process duration from time t 0 to t,
w = w r e v w p h e n permanent degradation = i B W , d i s s , i t 0 t ( Y r e v , i Y i ) X ˙ T d t primary interaction degradation + B μ T , d i s s t 0 t S T ˙ T d t MST degradation
re-written as
w = B W , d i s s , i S W , d i s s , i w W , i + B μ T , d i s s S μ T w μ T
where the first right-hand side term ( w W , i = B W , d i s s , i S W , d i s s , i ) is the total energy dissipation-induced degradation and the second term ( w μ T = B μ T , d i s s S μ T ) is the degradation due to temperature rise. The work dissipation coefficient(s) B W , d i s s , i and the MST coefficient B μ T , d i s s weight the individual contributions of the respective entropy generation terms. Non-dissipative (reversible or ideal) transformation w r e v is the reference transformation from which subsequent transformations w p h e n are subtracted to obtain degradation w. In non-monotonically transforming systems (systems that intermittently receive and give energy, such as rechargeable batteries), self-regulating/reorganizing systems (systems that can self-adjust internally in response to external loads), and dissipative structures, w can be negative, indicating health restoration or healing. The degradation model, Equation (14), employs only the dissipated energy and temperature rise, consequently quantifying a system’s durability. Here, the work output is not independently considered.

3.3.2. Reliability via the Transformation-Phenomenological Entropy Generation Theorem

After restating the DEG theorem in the form of Equation (14), Osara and Bryant [19] extracted from it the Transformation-Phenomenological Entropy Generation (TPEG) theorem which correlates a user-selected non-monotonic performance or transformation measure/indicator w p h e n with non-monotonic phenomenological entropy generation S p h e n :
w p h e n = B p h e n S p h e n
where S p h e n is the phenomenological entropy generation. Dividing the phenomenological energy rate in Equation (5) by temperature T—with all active external work rates Y i X ˙ i and internal chemical reaction rates μ k N ˙ k summed together (for brevity) as the primary interaction i Y i X ˙ i —the phenomenological entropy generation rate is
S ˙ p h e n = i Y i X ˙ i T work entropy S W , i + S T ˙ T MST entropy S μ T
Recall Section 3.1 discussion where, via the IUPAC sign convention, the negative signs here indicate energy extraction, for example, in a loaded tribological interface or a discharging battery. For energy addition and/or product formation, the signs reverse. Transformation coefficients B p h e n are the partial differentials of time-accumulated transformation measure with respect to time-accumulated phenomenological entropy generation terms ( B p h e n = w p h e n S p h e n ). Details, proofs, and practical applications are in references [18,19].
Substituting phenomenological entropy generation PEG (Equation (17)) into the TPEG model (Equation (16)) yields
w p h e n transformation = i B W , i t 0 t Y i X ˙ i T d t primary interaction transformation + B μ T t 0 t S T ˙ T d t MST transformation
re-written as
w p h e n = B W , i S W , i w p h e n , W , i + B μ T S μ T w p h e n , μ T
where the first right-hand side term ( w p h e n , W , i = B W , i S W , i ) is the contribution to total transformation by the primary active interaction/work and the second term ( w p h e n , μ T = B μ T S μ T ) is the transformation effect of temperature rise. The primary interaction or work coefficient(s) B W , i and the MST coefficient B μ T weight the respective contributions of the phenomenological entropy generation terms to the overall transformation. The transformation model, Equation (18), employs only the work output and temperature rise, consequently quantitative of a system’s reliability/performance. Here, energy dissipation/degradation is not used.

3.3.3. Quantifying Transformation and Degradation: Key Aspects

Both the TPEG and DEG models, Equations (18) and (14), describe hyperplanes in multi-dimensional domains. The entropy generation terms are the coordinates of the subspaces. The orthogonal slopes of the hyperplanes are the transformation and degradation coefficients.
The DEG model, Equation (13), describes monotonic degradation w via the monotonic entropy generation S (energy degradation). In contradistinction, the TPEG model, Equation (16), describes non-monotonic transformation w p h e n via the non-monotonic phenomenological entropy generation S p h e n (entropy accompanying observable energy transformation). S  includes energy degradation only while  S p h e n  includes energy conversion and dissipation, hence overall transformation. Recall Equations (2) and (3) which describe Gibbs and Helmholtz free energy changes as the differences between these two terms S and S p h e n (expressed as energies via a multiplication by temperature T). To reiterate, the transformation TPEG model governs system performance and reliability while the degradation DEG model governs system durability.
The MST term has similar appearances in Equations (18) (transformation) and (14) (degradation). However, two separate MST coefficients are required, one for transformation ( B μ T ) and the other for degradation ( B μ T , d i s s ). Moreover, in Equation (18), the total transformation is given by w p h e n while, in Equation (14), the total degradation is the primary interaction degradation w W , i = B W , d i s s , i S W , d i s s , i . Therefore, the fractional contribution of temperature rise (via the MST entropy) to total transformation is evaluated as
T R C p h e n = w p h e n , μ T w p h e n ,
and the fractional contribution to total degradation is
T R C = w μ T w W , i .
In references [18,19,37], Osara and Bryant introduced the dissipation factor
J = S μ T S W , i
to quantify the fraction of work output dissipated as thermal energy. A highly dissipative process or system has a high dissipation factor J, making it a relevant parameter in dissipative dynamics and system analysis.
Quantification must rely on one transformation/degradation indicator (or measure) for each analysis. When instrumentation permits, the use of multiple indicators is recommended to facilitate a more comprehensive characterization of the degradation modes. The appropriate transformation/degradation measure is determined by the system property that underpins the system’s utility or functional value. For example, wear causes malfunctioning and eventual failure of a tribological interface; hence, volumetric wear rate is an appropriate degradation measure. A battery is primarily used to store charge; hence, charge capacity fade is an appropriate degradation measure.
Note the variables in degradation model, Equation (14), bearing the reversible ( r e v ) subscript. Given no real system or process is spontaneously reversible, as true reversibility does not consider time effects [20], estimates can be used for practical applications. Pseudo-reversible experiments can yield near-zero-degradation transformation of a system. For example, slow-cycling a battery at a constant optimum temperature. In cases where such data are not available, theoretical models of reversible systems can yield constant references for use in estimating dissipation and degradation. For example, elasticity-based theories can be used to estimate the zero-degradation transformation of mechanical systems. A third option involves identifying and using the data-point that represents the system’s healthiest state in the available dataset. I will use this third option in the first example in Section 4. When a consistent method is used, the results are representative. This is an important consideration when interpreting the magnitudes of the computed parameters. These concepts will be demonstrated in Section 4 using real-world examples.

3.3.4. Process Types and the B Coefficient Signs

Thermodynamics characterizes energy conversions. As such, the signs in the energy and entropy balances indicate process directions and system changes. The IUPAC sign convention considers energy addition positive and energy extraction negative. Thus, energy increase is positive and energy decrease is negative. A work-performing system loses its available energy over time, i.e., energy extraction. This convention is used in this article. A negative transformation (via a decreasing transformation measure) reduces the system’s available energy, whereas a positive transformation (via an increasing transformation measure) increases the system’s available energy. An increasing degradation measure indicates a declining state of health, whereas a decreasing degradation measure indicates healing or system health restoration. Hence, the direction (increase or decrease) of a transformation and a degradation measure impacts the transformation/degradation coefficient signs. For consistency in interpretation of coefficient signs, a rule of thumb is hereby presented.
All active system–process interactions can be categorized into the following groups:
  • Work output or system use (energy extraction):
    Negative/decreasing transformation and positive/increasing degradation: When a system is loaded or in use, it loses its strength, capacity or potential, thereby experiencing negative transformation and positive material degradation. This category is common. For example, when used to power a device, a battery transfers charge out (negative transformation) while also increasing its inability to hold charge (positive degradation). Another example is an athlete outputting power (negative transformation) during a sports activity, and experiencing increase in muscle fatigue over time (positive degradation). However, in this human scenario, if the transformation measure selected is heart rate, it may increase as the athlete increases their power output, e.g., an accelerating runner or cyclist. For such cases, the transformation coefficient signs simply reverse.
    Negative/decreasing transformation and negative/decreasing degradation: This occurs when a loaded system spontaneously recovers while still under load. This category is uncommon, for example, dissipative structures.
  • Manufacturing or system formation (energy addition):
    Positive/increasing transformation and negative/decreasing degradation: When energy and/or material is added to a system, it increases its strength, capacity or potential, experiencing a positive transformation accompanied by a negative material degradation (healing or growth). For example, a child gains energy from food (positive transformation) and grows (negative degradation). A used computer can be refurbished (negative degradation) by replacing old/malfunctioning components with new and better components (positive transformation). This example also applies to all system maintenance.
    Positive/increasing transformation and positive/increasing degradation: This occurs when a system degrades during energy and/or material addition. For example, when a battery fast charges (positive transformation), its capacity fade—i.e., inability to hold charge—increases (positive degradation), a key problem in battery and electric vehicle industries. Installing a high-performance microprocessor (positive transformation) in a computer with weak voltage regulator module will cause overheating and hardware damage (positive degradation).
The above categorization theoretically anticipates coefficient signs ( s g n ( B j ) ) for continuous processes (i.e., excludes sudden instabilities and discontinuities). For a system in use, transformation coefficients are positive— s g n ( B W ) = + 1 and s g n ( B μ T ) = + 1 —when the entropy terms are negative— s g n ( S W ) = 1 and s g n ( S μ T ) = 1 . For system formation/renewal or energy addition, transformation coefficients are also positive: s g n ( S W ) = + 1 & s g n ( S μ T ) = + 1 . Note that B μ T can be negative in the presence of fluctuations in S μ T due to heat generation and/or flow.
Degradation coefficient signs are less consistent in renewable, rechargeable, or replenishable systems such as batteries and self-regulating systems such as humans. In monotonically degrading systems (increasing degradation) such as commonly found in tribological interfaces, the work dissipation coefficient is positive s g n ( B W , d i s s ) = + 1 and the MST coefficient is negative s g n ( B μ T , d i s s ) = 1 . During system formation, with increasing health (or decreasing degradation), the signs reverse. Note that self-regulating (or self-reorganizing) mechanisms that can restore or degrade system health can reverse the here-anticipated coefficient signs. An example is presented in Section 4.1.
These concepts are summarized in Table 1. This sign convention is formulated for continuous processes, using the underlying theoretical framework. The actual signage obtained from a given experimental dataset could differ.

4. Examples

In this section, I apply the above theory to biological and physical systems using existing measurements in the literature to estimate the various entropy terms and substituting into Equations (18) and (14). The examples, selected to demonstrate the proposed framework in diverse, multi-physics, multi-scenario applications, are as follows:
  • Human athletes exercising in warm and cool weathers (Section 4.1 and Section 4.2). This demonstrates application to biological and self-regulating systems.
  • Lithium-ion battery discharging and recharging (Section 4.3). This demonstrates energy addition and extraction, as well as healing. It also showcases application to electrochemical and energy storage systems.
  • Journal bearing oscillating (Section 4.4). This combines multiple independent tests under changing operational conditions. It also demonstrates application to a tribological system.
  • Lubricating greases shearing (Section 4.5). This demonstrates application to two systems of the same material class with different properties and capacities.
In each example, system-process variables Y and X, temperature T, and a performance/degradation indicator w p h e n , w are monitored over a period of time t. Entropies S W and S μ T associated with the active mechanisms ( j = { W , T } ) are computed from the measured parameters. As stipulated by the transformation (TPEG) and degradation (DEG) models in Equations (18) and (14), respectively, and following the analysis procedure outlined in reference [19], a transformation measure and a degradation measure are plotted against the entropies in multi-dimensional spaces, with hyperplanes fitted. The orthogonal slopes of the hyperplanes yield the coefficient pairs: [ B W , B μ T ] and [ B W , d i s s , B μ T , d i s s ]. Table 2 summarizes the processes of obtaining the computation parameters.
In the first two examples, reversible entropy S r e v and transformation w r e v are obtained from data that indicate the best performance and healthiest state of the system, usually the extremum values (see the last paragraph in Section 3.3.3 for more on this). Table 3 summarizes the results of the analyses, showing the respective contributions of the active mechanisms—with emphasis on the thermal contribution. To directly quantify the effect of cooling, the first example, involving human athletes exercising in warm and cool weather, is used. The favorable effects of cooling demonstrated below are limited to the minimum of the serviceable temperature range of each system. For brevity, only one dataset per example is analyzed. Multiple datasets were analyzed in references [26,38]. While specific parameter values change as the system degrades, results remain consistent with model predictions. Moreover, the journal bearing example involves many separate tests under changing conditions. The signs of all the coefficients in Table 3, evaluated using real-world data from multi-physics systems, accord with the theoretical anticipations in Section 3.3.4.
Table 2. Multi-physics systems and their transformation and degradation parameters. Transformation and degradation indicators are selected based on available data. In the humans and batteries, the healthiest state recorded in the data is selected as the reversible transformation rate w ˙ r e v .
SystemTransformation (TPEG)Degradation (DEG)Comments
Indicator Work Entropy MST Entropy Indicator Dissipated Work Entropy
w ˙ phen S ˙ W S ˙ μ T w ˙ S ˙ W , diss
Human athletesHeart rate W ˙ ( t ) T s ( t ) m c log T ( t ) T 0 T ˙ ( t ) T s ( t ) Cardiovascular strain W ˙ r e v ( t ) W ˙ ( t ) T s ( t ) Power W ˙ and heart rate from Figure 3a, T ( t ) and T s ( t ) from Figure 3b
(increase in heart rate)Assumption: W ˙ r e v is the highest power recorded in cool weather.
BatteriesCharge rate v ( t ) I ( t ) T ( t ) C v ˙ ( t ) T ( t ) Capacity fade ( v O C v ( t ) ) I ( t ) T ( t ) I = current, v = voltage, C = charge content, from Figure 6.
Via Gibbs Duhem: S T ˙ = C v ˙ . Open-circuit voltage v O C can be estimated.
Assumption: v O C is the highest/initial voltage.
Journal bearingWear rate P ( t ) ω ( t ) T ( t ) m c log T ( t ) T 0 + V α H T ˙ ( t ) T ( t ) Wear rate P f ( t ) ω ( t ) T ( t ) P = torque, ω = angular speed, P f is friction torque, H is hardness.
Power dissipation W ˙ d i s s = P f w , from Figure 9a.
Lubricating greaseShear stress τ ( t ) γ ˙ ( t ) T ( t ) ρ c log T ( t ) T 0 + α G T ˙ ( t ) T ( t ) Shear strength loss τ ( t ) γ ˙ ( t ) T ( t ) τ = shear stress, γ ˙ = shear rate, G = shear modulus, α = thermal strain coeff.
Power dissipation density: W ˙ d i s s = τ γ ˙ .
t = time, T = temperature, m = mass, c = specific heat capacity, V = volume. Note that the MST entropy column applies to both transformation and degradation.
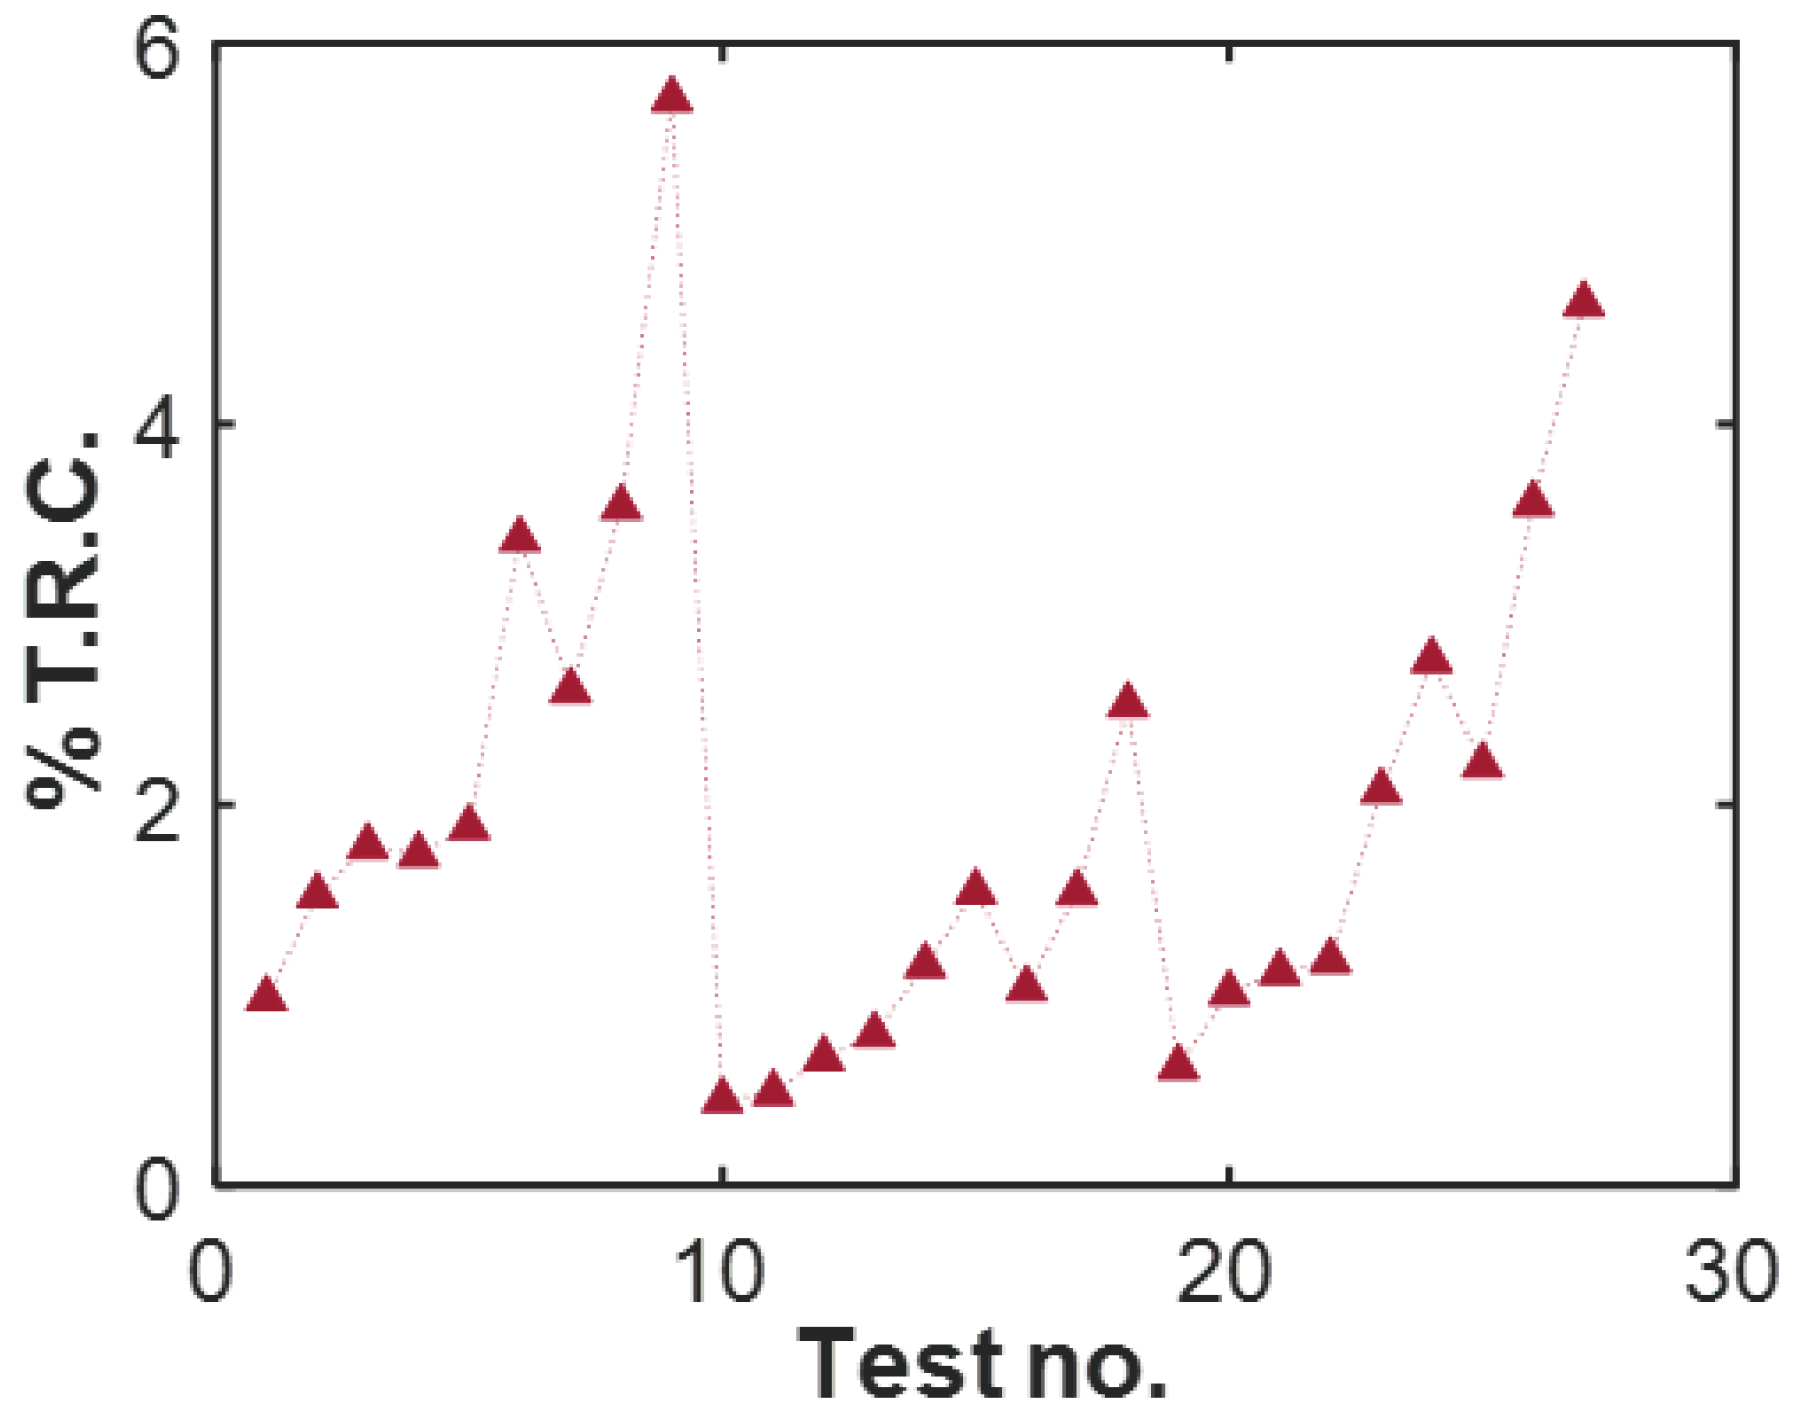
Table 3. Estimated contributions of the active mechanisms—work and thermal ( j = { W , T } ) —to the transformation and degradation of the example systems analyzed. End state values are presented. TRC = Fractional contribution of temperature rise. For the journal bearing, the values are from the 9th test; for the batteries, the 70th cycle.
System Transformation (TPEG)Degradation (DEG)Comments
w phen , W = B W · S W w phen , μ T = B μ T · S μ T TRC = w phen , μ T w phen w W = B W , diss · S W , diss w μ T = B μ T , diss · S μ T TRC = w μ T w W
Human athletesWarm(−2.58) · (−1600.54)(−11.27) · (−45.69)11.1%(−0.493) · (472.59)(−11.27) · (−45.69)−221% | S W , c o o l | > | S W , w a r m | | S W , d i s s , c o o l | < | S W , d i s s , w a r m |
Cool(−2.48) · (−1750.54)(−4.62) · (−49.87)5.04%(−1.003) · (322.58)(−10.44) · (−49.87)−161%Similar temperature profiles rendered similar S μ T .
BatteriesDischarge(90.90) · (−0.027)(25.80) · (−0.004)4.2%(0.130) · (0.005)(−0.06) ·(−0.004)36.9% | S W | > | S μ T | . Even though total charge and
(Re)Charge(82.35) · (0.031)(63.32) · (0.0022)5.5%(−46.1) · (0.0015)(−21.01) · (0.0022)66.8%C−rates are similar, | S μ T , C | < | S μ T , D | .
Journal bearing (0.0093) · (0.1)(−0.00027) · (−0.21)5.7% | B μ T , d i s s | < | B W , d i s s | due to relatively low temps.
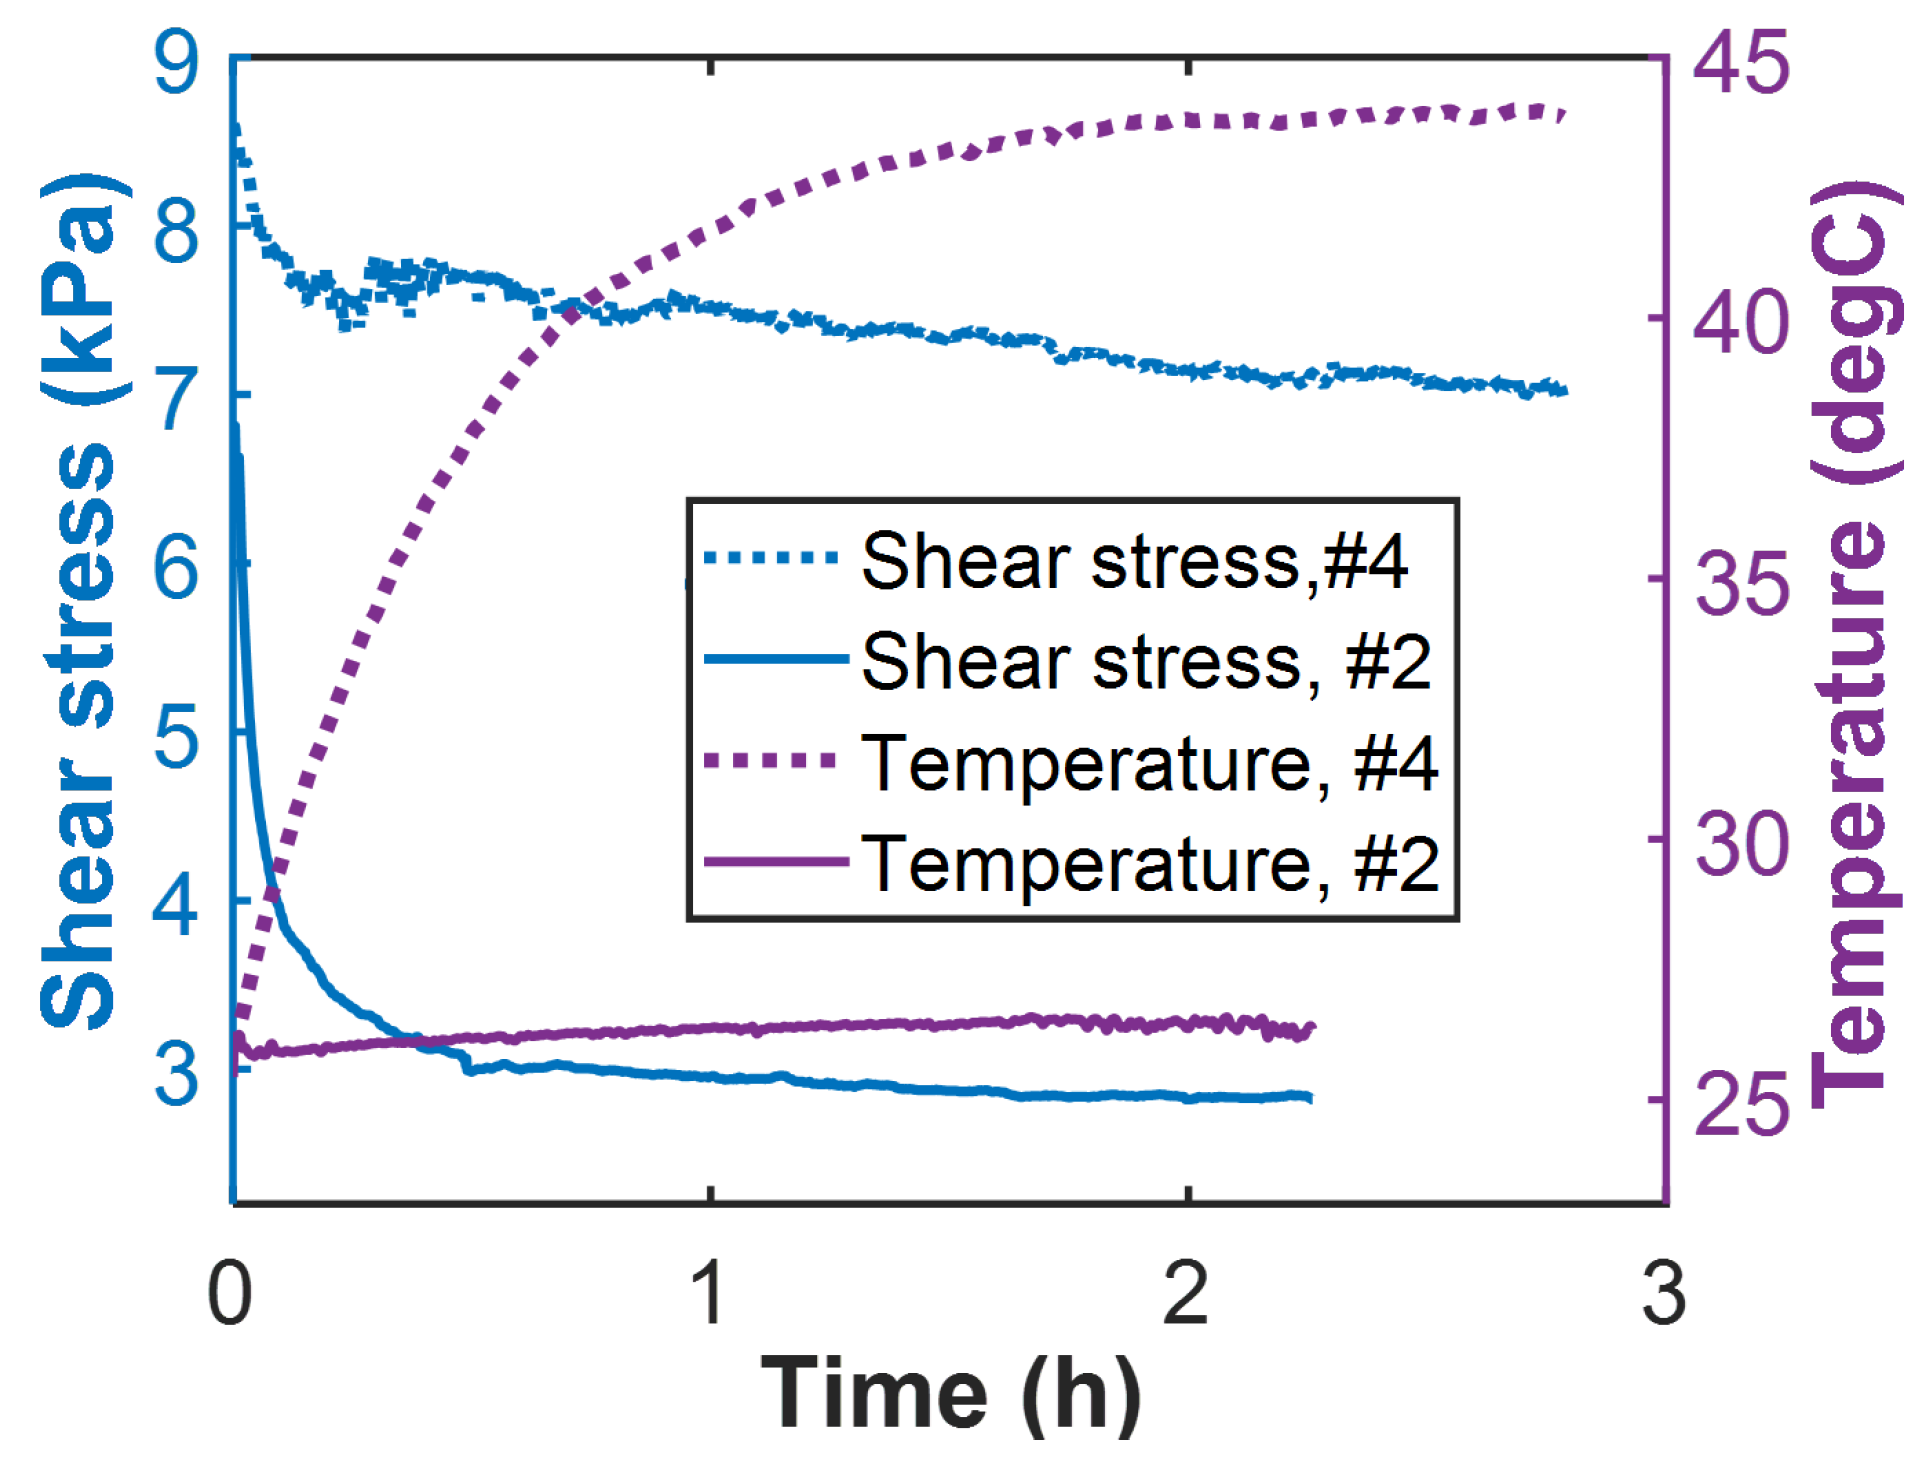
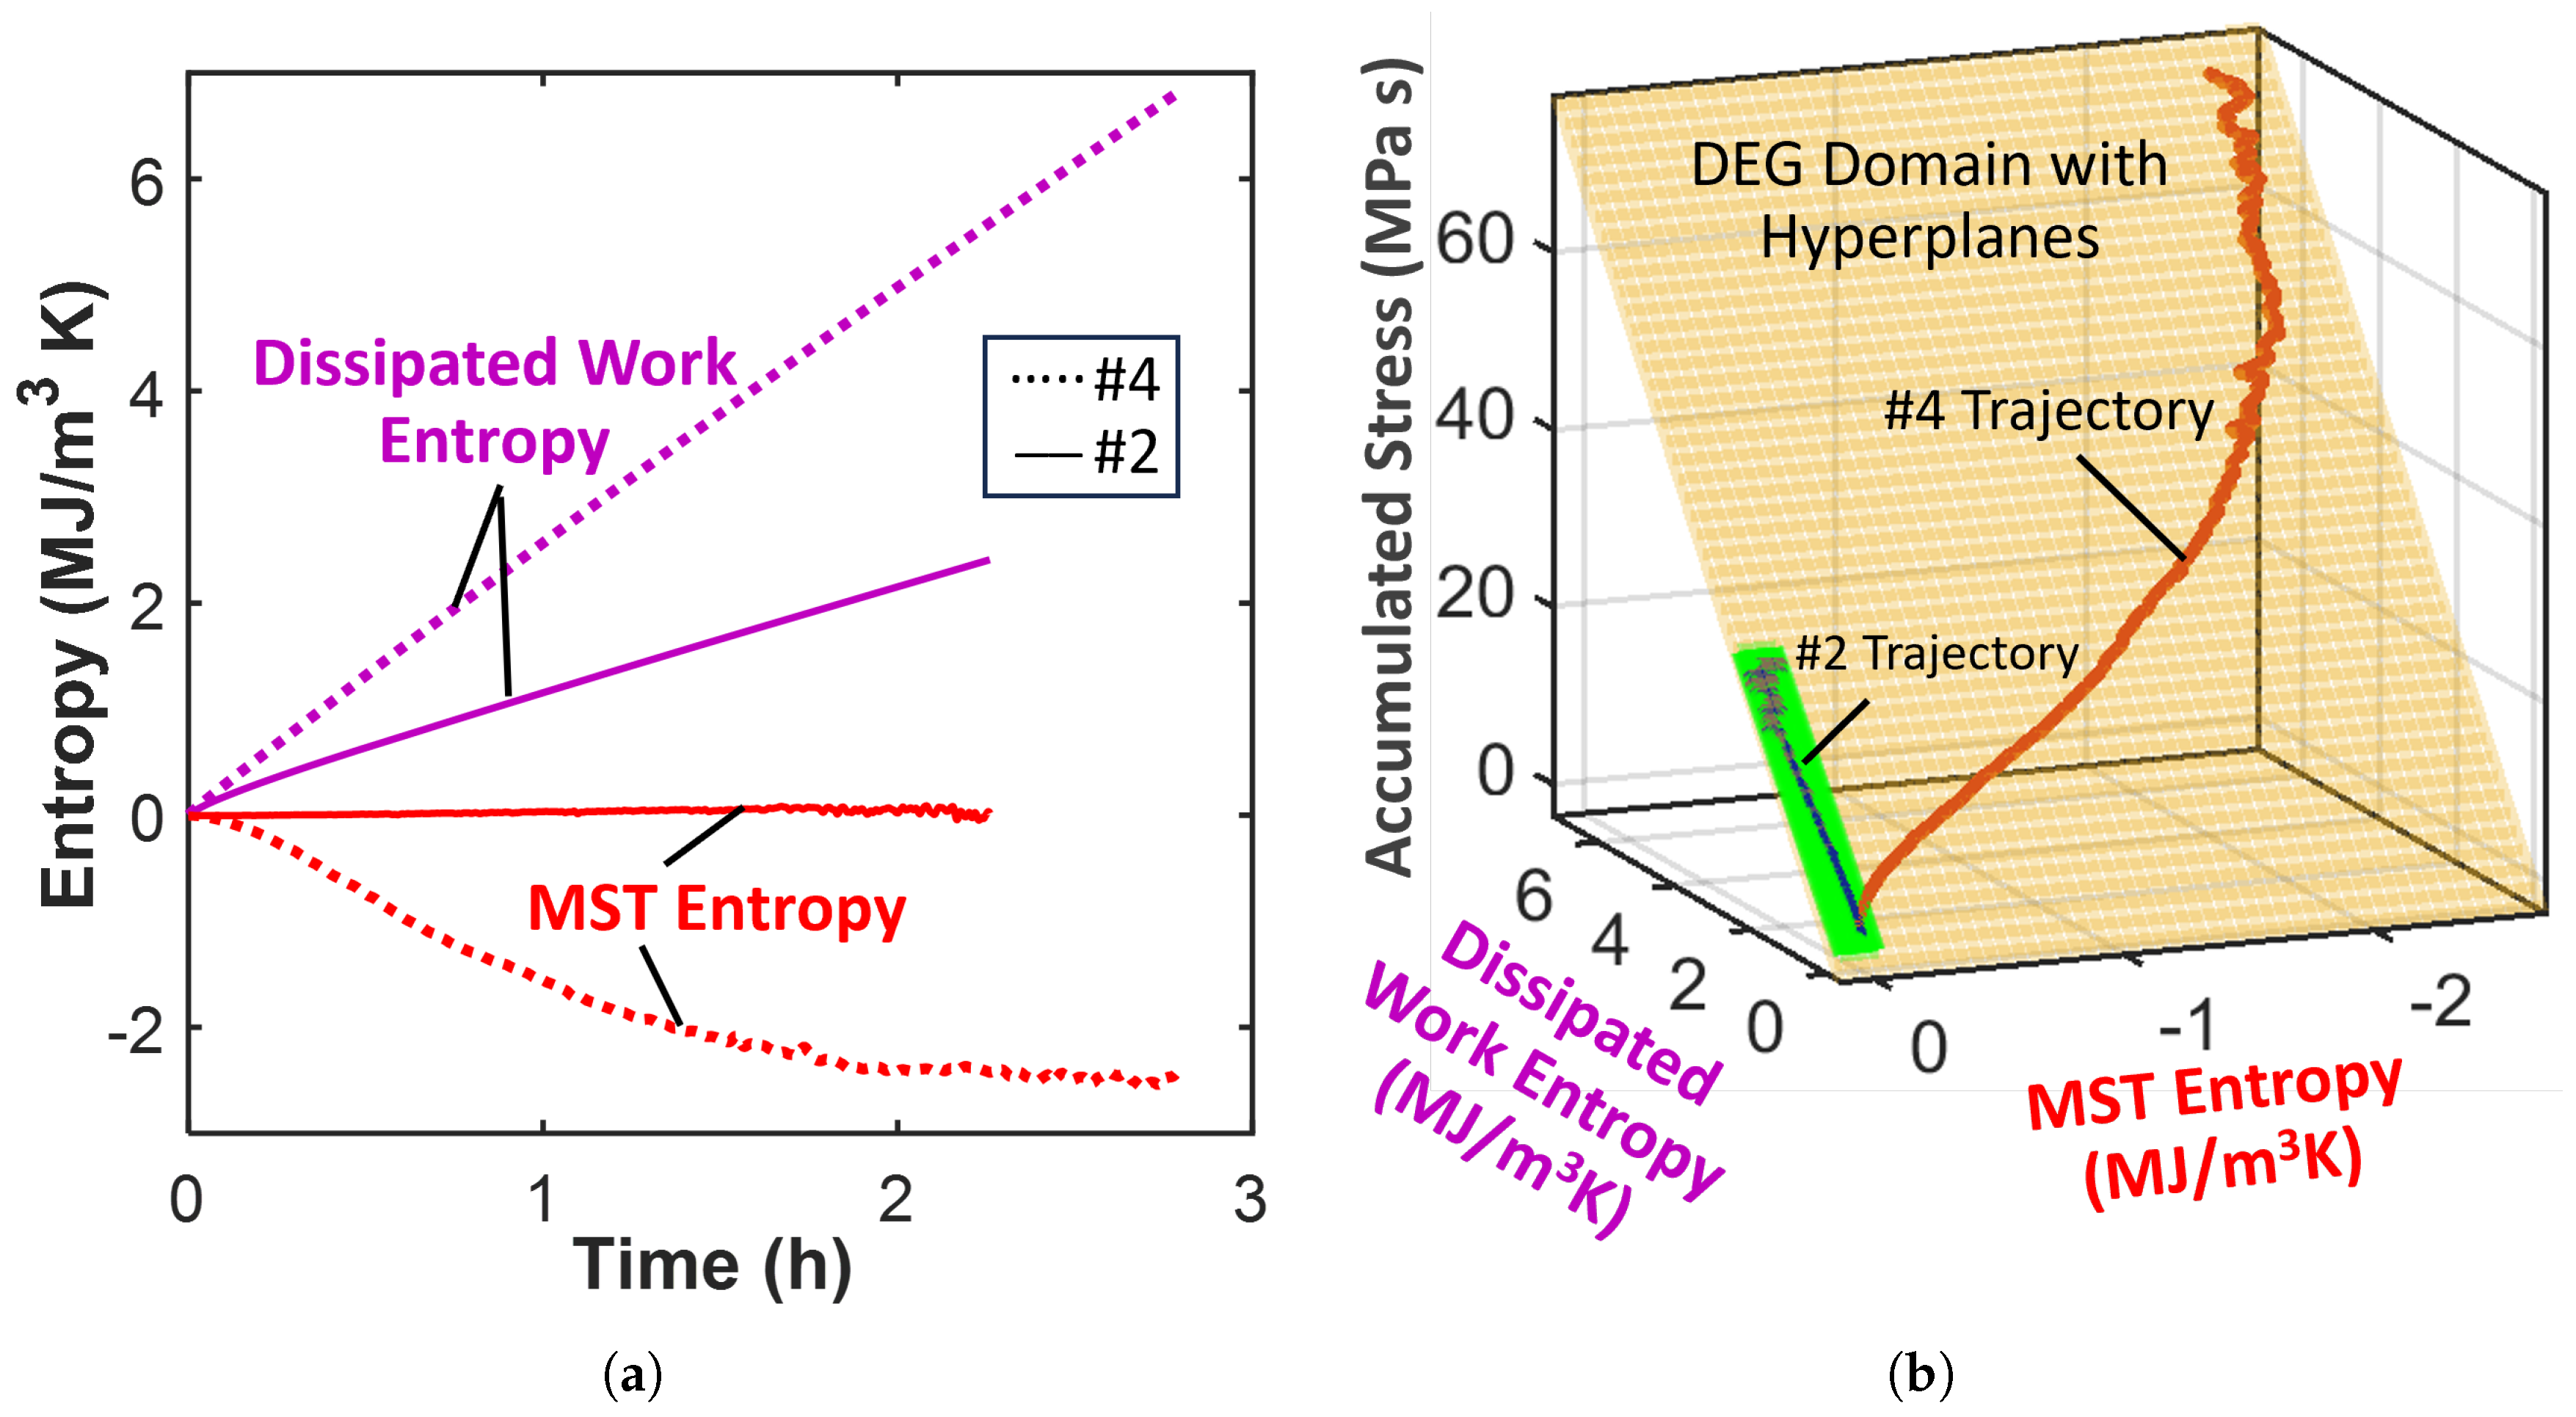
Lubricating grease#2 (10.38) · (2.24)(−0.031) · (0.017)−0.002%High heat gen. in #4 grease | S μ T , 2 | < < | S μ T , 4 | .
#4 (10.36) · (6.81)(−0.504) · (−2.44)1.7 % | B μ T , d i s s | < < | B W , d i s s | due to low temperatures.
w p h e n = w p h e n , W + w p h e n , μ T . In all the systems, coefficient signs accord with Section 3.3.4 discussion.

4.1. Humans

The first example is a self-regulating/self-organizing system: a human being. The discussions here apply to all biological systems. In sports and other physically intensive activities, the human body generates heat, most of which is stored in the body and can become adverse if not regulated or transferred out. Thermoregulation lowers heat stress and prevents muscle cell/tissue thermolysis [9,29,39]. Prolonged exercise/work in hot (and especially humid) environments is not safe for humans. Besides reducing exercise/work capacity and output via rapid exhaustion/fatigue, high temperatures can increase cardiovascular strain [10].
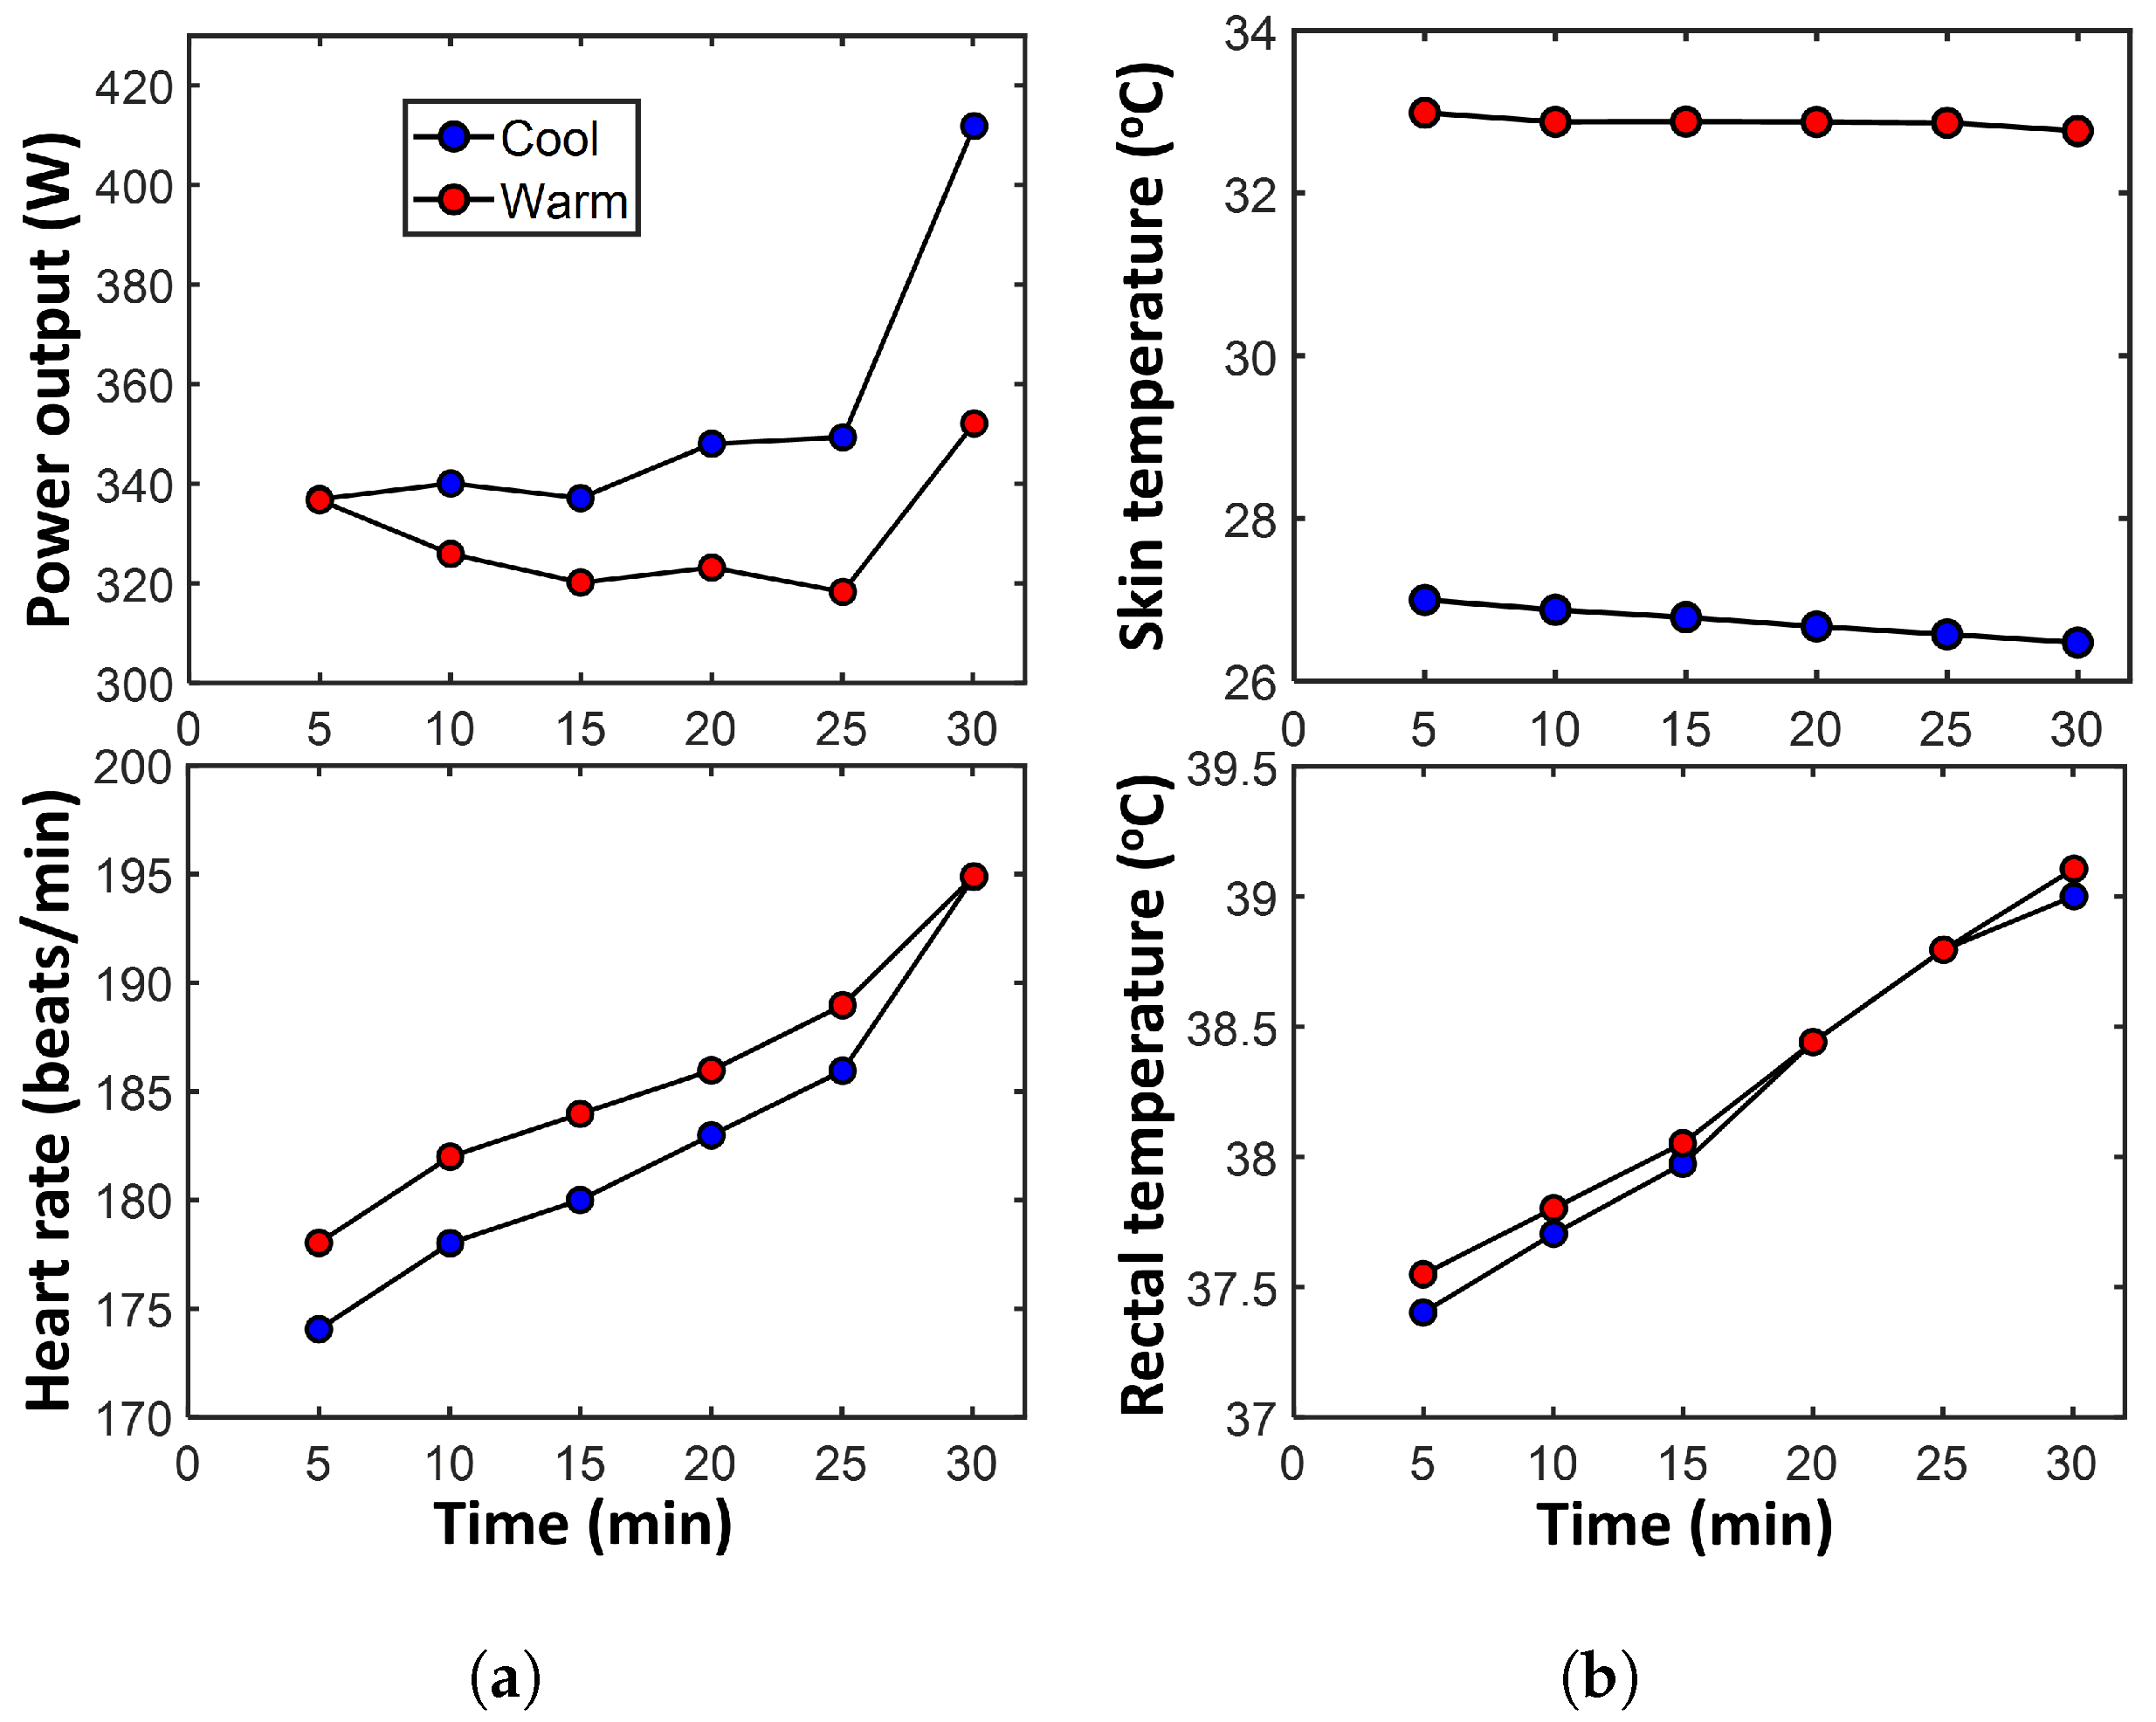
Tatterson et al. [9] measured the average power output, heart rate, skin temperature and rectal temperature in eleven elite road cyclists during a 30 min self-paced exercise at 23 °C and 32 °C ambient temperatures and 60% relative humidity. Their data is extracted with Rohatgi’s Webplotdigitizer [40] and reproduced in Figure 3. The rectal temperature is a measure of the body’s core temperature. In references [9,10], the authors noted the significant impact of heat stress on the observed hyperthermia, increasing cardiovascular strain and reducing power output. Figure 3 plots show that heart rate lowered when ambient temperature was reduced. The measured heart rates were averaged with standard errors of the means varying between 1 and 2%. The plots also show a concomitant increase in power output with cooling. Skin temperatures correlated with ambient temperatures, lower in cool weather, while core temperatures remained similar in both conditions. In addition to cardiovascular strain, thermal and perceptual strains also impact power output. Details of the physical mechanisms that govern cardiovascular response to hot and cool ambient environments are in reference [10]. Periad and co-authors [10], citing results from many studies, emphasize that higher skin temperatures and heart rates were primarily associated with lower work performance. Using Figure 3’s data, I estimate the various entropies associated with the active mechanisms and substitute them into the transformation and degradation models, Equations (18) and (14), respectively, for further analyses.
Figure 3. Measured (average) parameters during 30 min self-paced cycling by eleven elite road cyclists in cool and warm environments. (a) Power output (top) and heart rate (bottom). (b) Skin temperature (top) and rectal temperature (bottom). The blue markers are data points measured at 23 °C (cool) ambient temperature and the red markers are data points at 32 °C (warm). Reproduced with permission from [9].
Applmech 06 00062 g003

4.1.1. Transformation: Cardiovascular Strain via Heart Rate

The transformation analysis procedure is as follows:
  • Select heart rate as the indicator of cardiovascular strain w ˙ p h e n (the transformation measure). Note that the arterial blood pressure, stroke volume, and cardiac output also contribute to cardiovascular strain. However, given only one measurable parameter can be used for quantification as discussed in Section 3.3.3, the heart rate, indicative of autonomic strain/stress, is here selected. Moreover, in these cycling experiments, only the heart rate was measured. This assumption is further justified in Section 5.3.
  • Since power W ˙ is directly measured here, evaluate the work entropy S W = t ( W ˙ / T s ) d t as the numerical time integration of the average cyclist power output (Figure 3a) divided by skin temperature T s (Figure 3b);
  • MST entropy S μ T = t ( S T ˙ / T s ) d t is the product of the entropy content and the core temperature changes, divided by the skin temperature during the time interval. Here, the skin temperature T s is used as the heat transfer boundary temperature. As discussed in Section 3.2, the assumption of thermal mechanisms dominant over non-thermal mechanisms allows S m c log ( T ( t ) / T 0 ) , where m is mass and c is specific heat capacity. This gives a conservative estimate of the MST entropy as other active mechanisms would increase overall entropy content, see Equation (11). Xu et al. [41] determined the specific heat capacity of the human body to be 2890 J/kg K. An average cyclist is assumed to weigh 70 kg [42]. Here, T is rectal temperature and T 0 is a reference temperature, e.g., 298 K.
  • Plot the entropies against the heart beats—the time-integrated heart rate—and fit a surface/hyperplane to the trajectory.
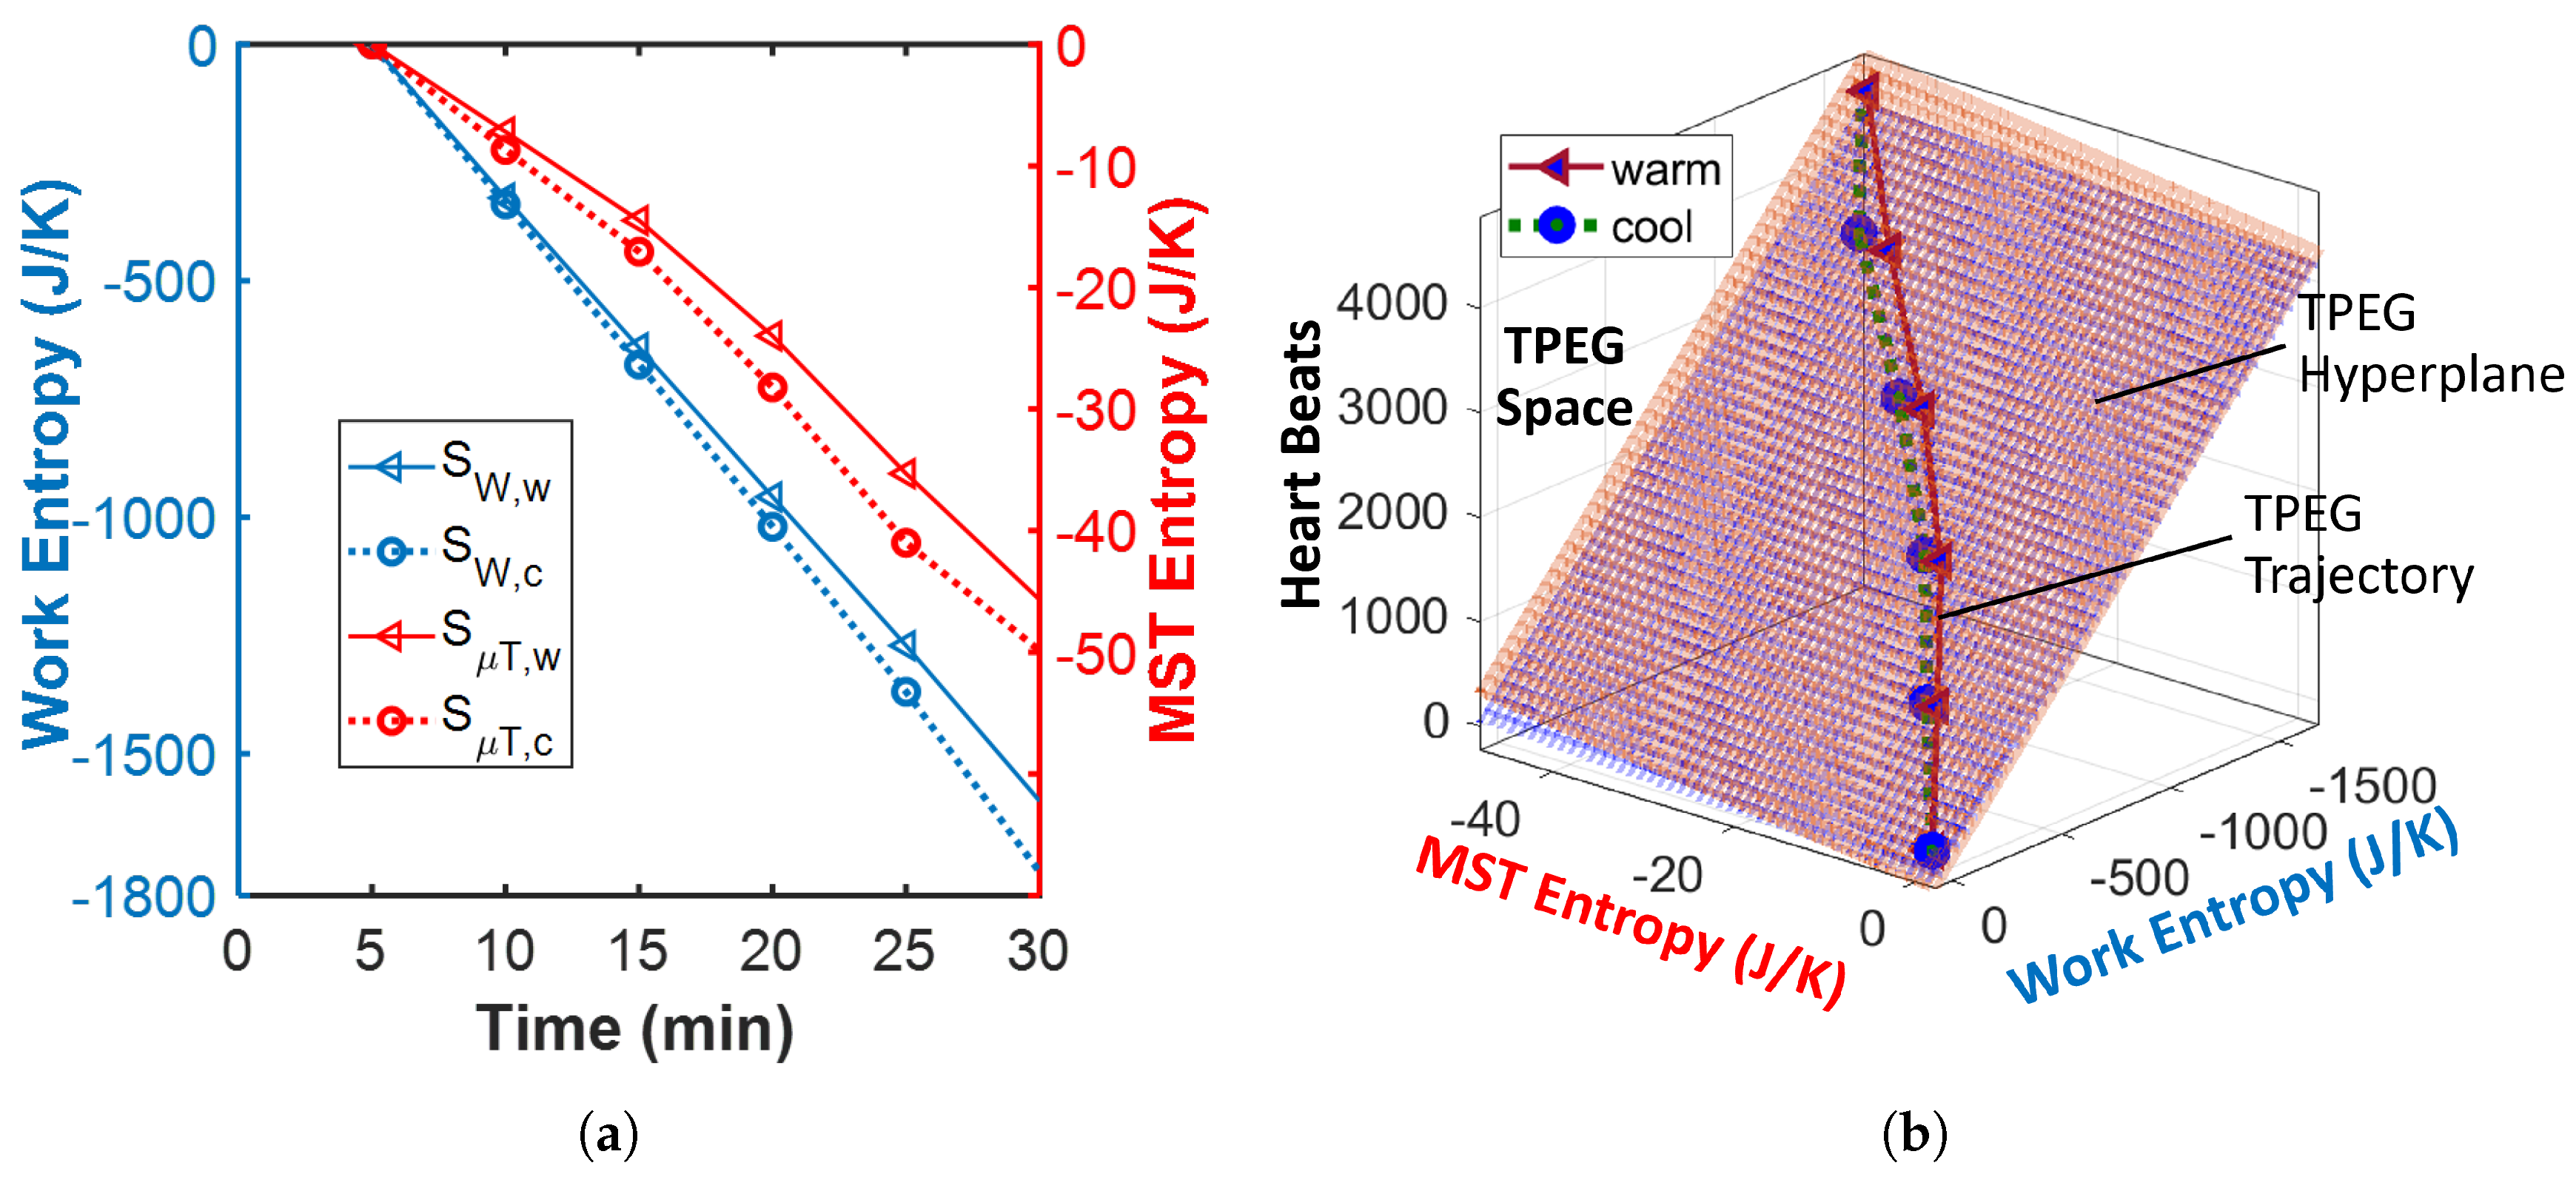
Figure 4a plots the average entropies pertaining to the professional road cyclists studied in reference [9] for the test duration of 30 min. The blue plot is the work entropy and the red plot is the MST entropy. The continuous lines and triangle markers represent entropies in warm ambient temperature (32 °C). The dotted lines and circular markers represent entropies in cool ambient temperature (23 °C). Here, the MST entropy (with axis labels on the right) is much less than the work entropy. Due to the similar core temperature profiles (Figure 3b), the MST entropies in both warm and cool weathers are similar with the slight difference attributed to the different skin temperatures.
Figure 4b visualizes the transformation (TPEG) model and yields the transformation coefficients. These values, presented in Table 3, are obtained as the orthogonal slopes of the TPEG hyperplanes. To facilitate visual comparison, both the “cool” and “warm” transformation trajectories and hyperplanes are plotted on the same set of axes. The higher magnitudes of the MST coefficients ( | B μ T | > | B W | ) indicate that the temperature rise mechanism has more influence on the heart rate than the cycling work output (which is the primary interaction). MST-induced heart rate w μ T in the warm weather is 11.1% of total heart rate, and 5.04% when the athletes are cool. These actual contributions are lower because the MST entropies S μ T , w and S μ T , c are much lower than the work entropies S W , w and S W , c .

4.1.2. Degradation: Cardiovascular Strain Increase

The degradation analysis procedure is as follows:
  • Given heart rate increase is one of the mechanisms of cardiovascular strain, a lower heart rate with the same power output is assumed healthier. Hence, the minimum heart rate recorded at the cool ambient temperature (23 °C) is selected as the constant non-dissipative (reversible) transformation indicator of cardiovascular strain w ˙ r e v . Via the first equality of Equation (14), subtracting the “warm” or “cool” heart rate w ˙ p h e n from the assumed ideal heart rate w ˙ r e v gives the heart rate increase as the degradation measure w ˙ . These practical assumptions accord with the propositions in Section 3.3.3; see the last paragraph in that section.
  • Using similar consideration, the maximum power output recorded is selected as the reversible power W ˙ r e v , the non-dissipative theoretical maximum. This was measured at the 30th minute in cool ambient temperature. Evaluate the reversible work entropy S r e v = t ( W ˙ r e v / T 0 ) d t as the time integration of the peak “cool” power output (the blue circular markers in Figure 3a’s top plot), divided by rectal temperature (Figure 3b’s bottom plot). Subtract from S W evaluated in Section 4.1.1 to obtain S W , d i s s .
  • Plot the entropies against the increase in heart beats—the time-integrated heart rate increase—and fit a surface/hyperplane to the trajectory.
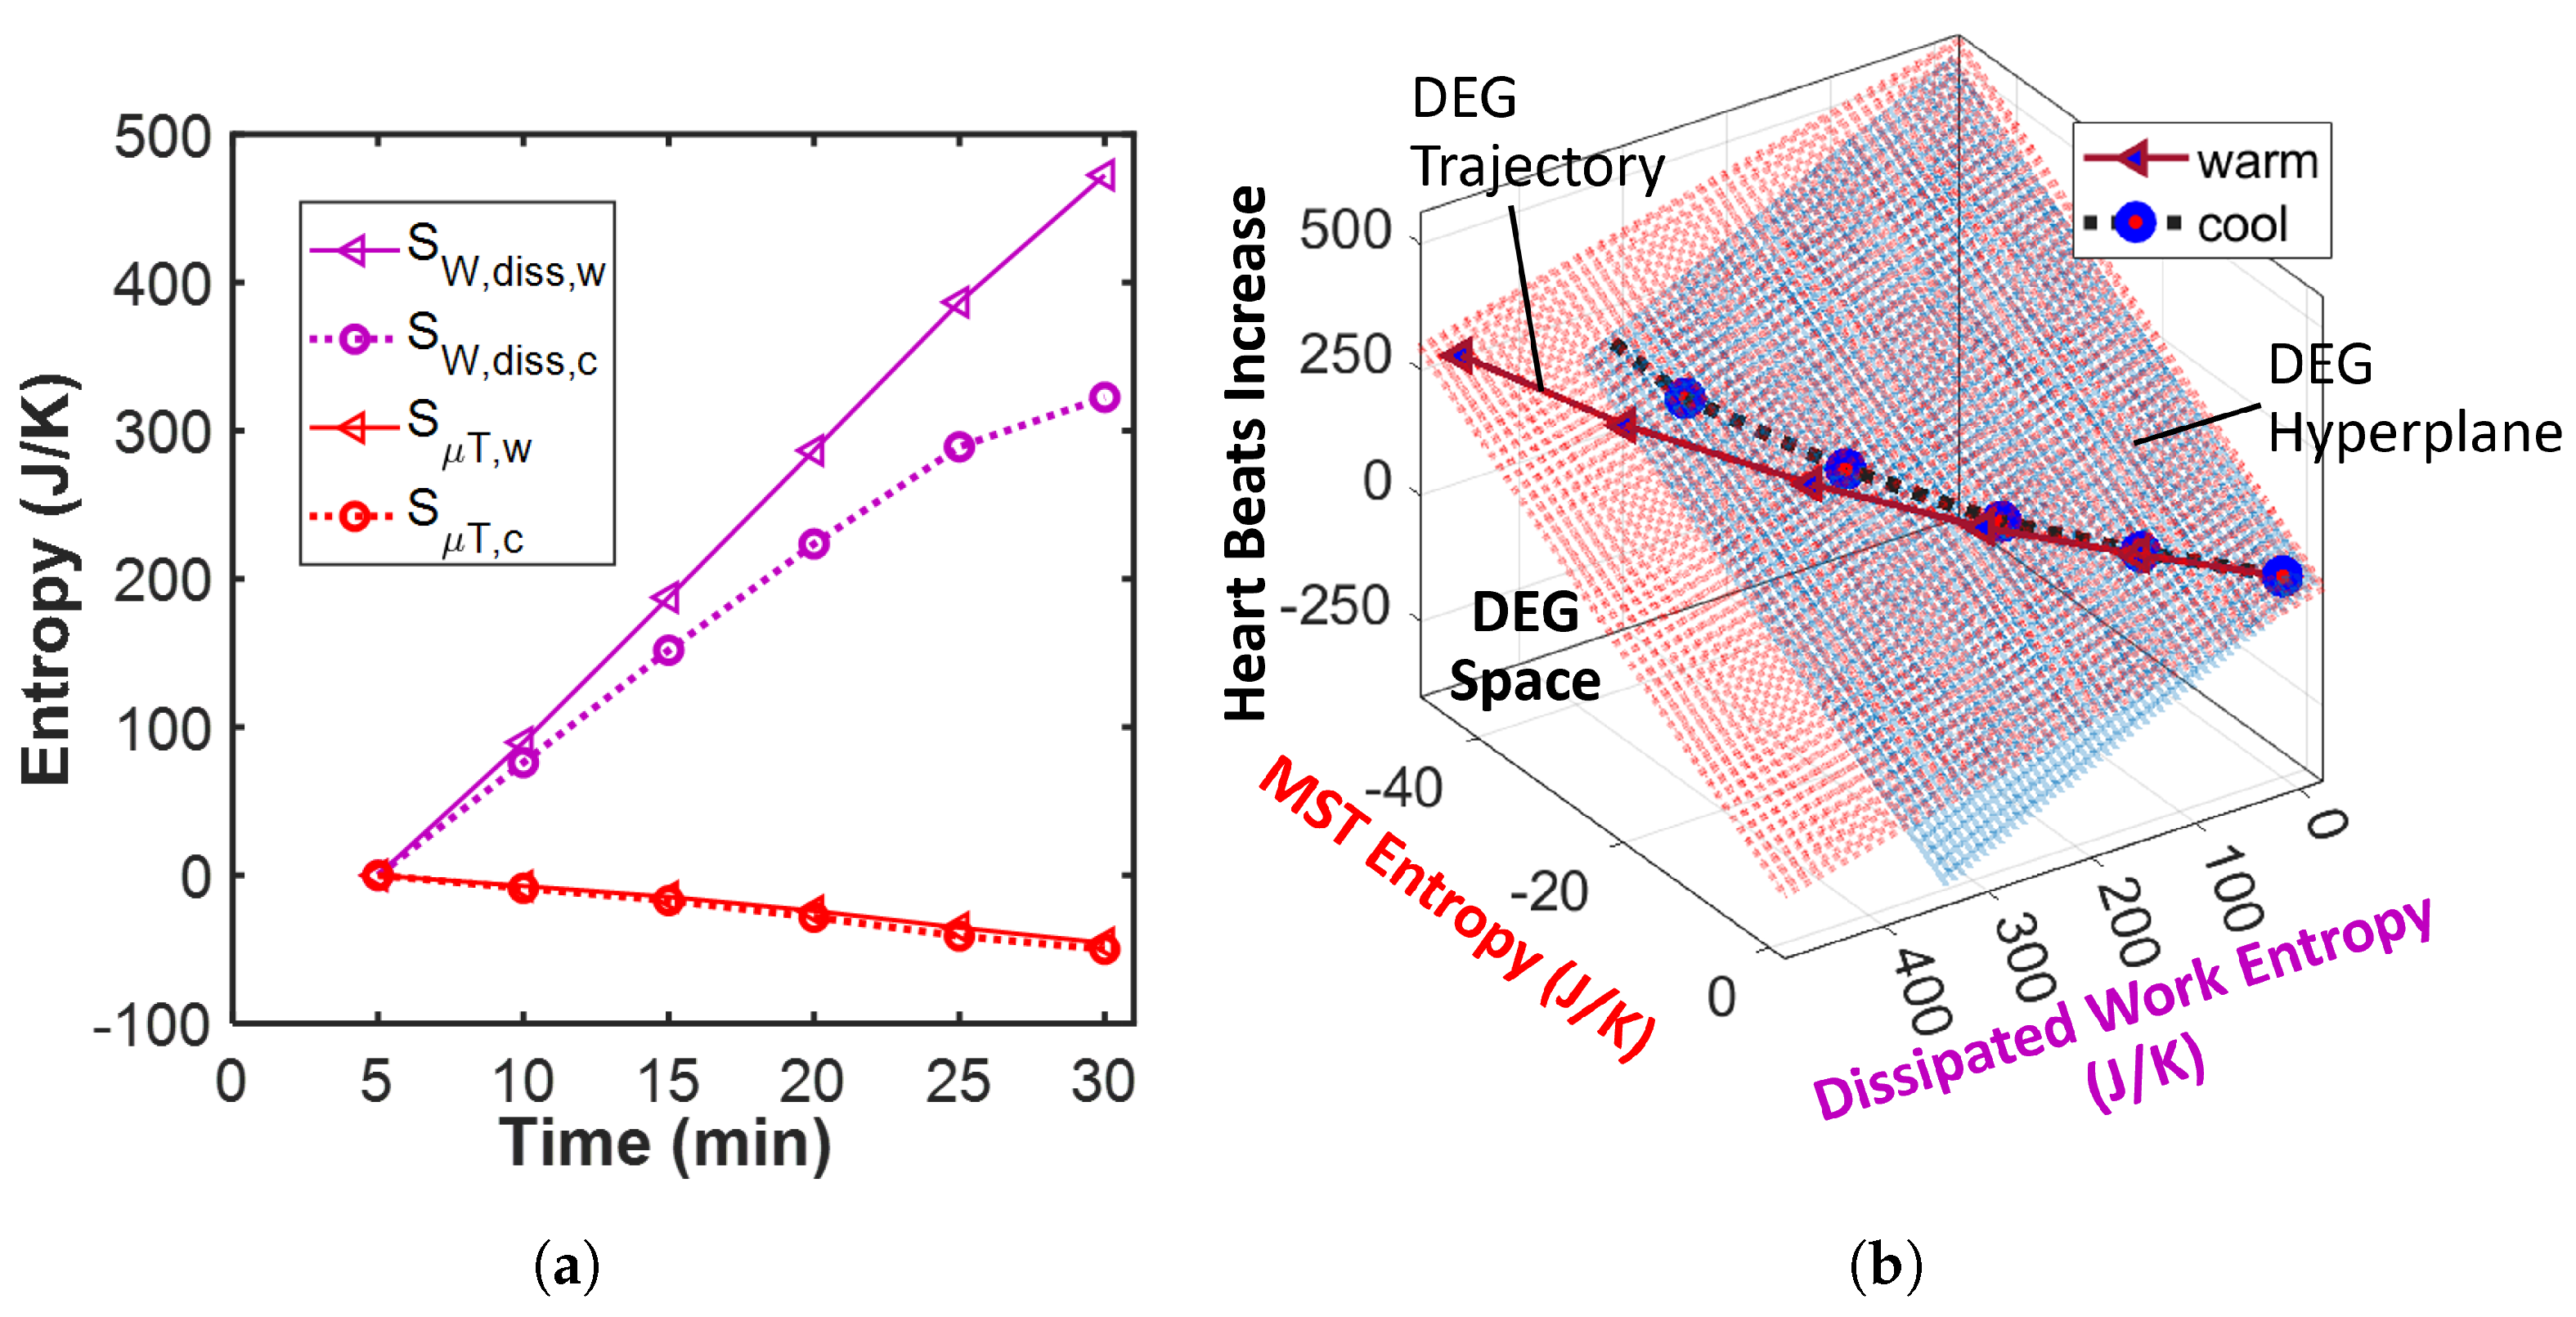
Figure 5a plots both entropies over time, with dissipated work entropies S W , d i s s (pink plots) higher than MST entropies S μ T (red plots). The continuous lines and triangle markers represent the entropies in warm ambient temperature. The dotted lines and circular markers are the entropies in cool ambient temperature.
Figure 5b constructs the degradation (DEG) model of the cyclists in a three-dimensional space, yielding the degradation coefficients. These coefficient values, all negative like the transformation coefficients (see Table 3), indicate that the cycling work dissipation (that is, the dissipation of the energy associated with the primary interaction) has a restorative/favorable impact—via the negative B W , d i s s , with S W , d i s s and w positive—on the increase in cardiovascular strain. Conversely, increase in body temperature has an adverse impact—via the negative B μ T , d i s s and S μ T . Recall Section 3.3.4 discussions summarized in Table 1: for a work-performing system with an increasing degradation measure, a positive B W , d i s s indicates degradation influence and a negative B W , d i s s indicates restoration/healing influence.
Each mechanism’s contribution is quantified in Table 3. As in the transformation analysis, the magnitudes of the MST coefficients here are higher than the work dissipation coefficients, again indicating that temperature rise has a stronger influence on cardiovascular strain as measured by heart rate. Here, for the increase in cardiovascular strain experienced by the athletes, the effect of temperature rise is −221% that of the restorative physiological work in the warm ambient temperature, and −161% in the cool ambient temperature. These numbers and their signs suggest that the physiological activity lowered the heart rate by an amount less than that by which temperature rise increased the heart rate. These findings corroborate the known effects of heat stress and the conclusions by Tatterson et al. [9], Periad et al. [10] and others that cardiovascular strain increase and power output loss depend primarily on thermoregulation. The lower the skin temperature, the lower the heart rate increase; the lower the heart rate increase, the higher the power output.
To further emphasize the difference between transformation and degradation, Figure 3a shows that in these 30 min measurements, as a transformation measure, heart rate increase with time has both positive and negative correlations with power output and hence is non-monotonic. Note the positive power output gradient at cool ambient temperature and the negative power output gradient at warm ambient temperature. As a degradation measure, heart rate increase due to increase in ambient temperature has a consistently negative correlation with power output, hence is monotonic.

4.2. Quantifying the Effect of Cooling

Figure 3a shows that human power output increases with cooling. Humans cannot survive outside a given ambient temperature window. Heat stroke treatment typically involves active cooling [10]. Cooling-induced average drop in heart rate of 4 beats per minute was estimated from the data in Figure 4. To quantify the effect of cooling in minimizing the adverse active mechanisms and maximizing the favorable mechanisms, separate analyses were conducted for the cooled cycling activity (at 23 °C ambient temperature) and the warm cycling activity (at 32 °C ambient temperature). Using the results reported in Table 3, with subscripts w for warm and c for cool, the following are observed:

4.2.1. Transformation/Reliability

  • The entropy associated with the warm power output—via the lower power and higher skin temperature ( S ˙ W = W ˙ / T s )—is less than that associated with the cool power output (i.e., S W , w < S W , c ). Hence, with the similar work transformation coefficient values (i.e., B W , w B W , c ), the total contribution via the cycling work to the athletes’ average reliability/utility is higher when cool (i.e., B W , w S W , w < B W , c S W , c ). In plain language, performance is better at the cool ambient temperature.
  • Given the similar core temperature profiles, the entropy associated with the warm MST mechanism S μ T , w is approximately (albeit slightly less than) that associated with the cool MST mechanism S μ T , c . A lower cool MST coefficient value ( | B μ T , w | > | B μ T , c | ) then reduces the thermal contribution to reliability/utility when the athletes are cooled (i.e., B μ T , w S μ T , w > B μ T , c S μ T , c ). In plain language, at the cool ambient temperature, heat contributes less to the athletes’ average reliability, notwithstanding the similar body core temperature profiles under both conditions.
The total drop in the thermal mechanism’s contribution to the cyclists’ average reliability due to cooling is computed using Table 3 values as
Δ T R C p h e n = T R C p h e n , w T R C p h e n , c T R C p h e n , w × 100 % = 54.59 %

4.2.2. Degradation/Durability

  • Contrary to the trend observed in the work entropy S W used in the transformation analysis above, the entropy associated with the warm energy/work dissipation S W , d i s s , w is greater than that associated with the cool energy dissipation S W , d i s s , c . This implies higher free energy dissipation at the higher ambient temperature. With a higher cool work dissipation coefficient value ( | B W , d i s s , w | | 0.5 B W , d i s s , c | ), the restorative contribution by the cycling work to the athletes’ degradation (loss of durability) is higher with cooling.
  • With S μ T , w S μ T , c , similar MST coefficient values ( B μ T , d i s s , w B μ T , d i s s , c ) yield relatively similar thermal contributions to average degradation.
Hence, by increasing the restorative impact of the cycling work (thereby maximizing a favorable mechanism), cooling reduced overall degradation. The percentage drop in the thermal mechanism’s contribution to the cyclists’ degradation as a result of cooling is computed using values from Table 3 as
Δ T R C = T R C w T R C c T R C w × 100 % = 27.15 %
In addition to improving the overall observed reliability (phenomenological transformation) while reducing the overall degradation, cooling also reduces the relative temperature rise contributions.

4.3. Batteries

Energy storage systems—including batteries and other electrochemical systems—receive, store and release energy carriers (or charges) which perform useful work external to the system. During active discharge and (re)charge, heat is generated at a rate proportional to the discharge/recharge rate. Degradation reduces the energy/charge storage capacity of the system. High energy dissipation rate can lead to sudden instability via temperature-induced acceleration of higher-order mechanisms such as solid electrolyte interface (SEI) growth, gas evolution, and phase transitions in electrode materials. Due to the temperature sensitivity of batteries, a battery thermal management system is an essential component of an electric vehicle’s battery pack [8]. Photovoltaic cells are reported to perform better in cooler environments [43,44].
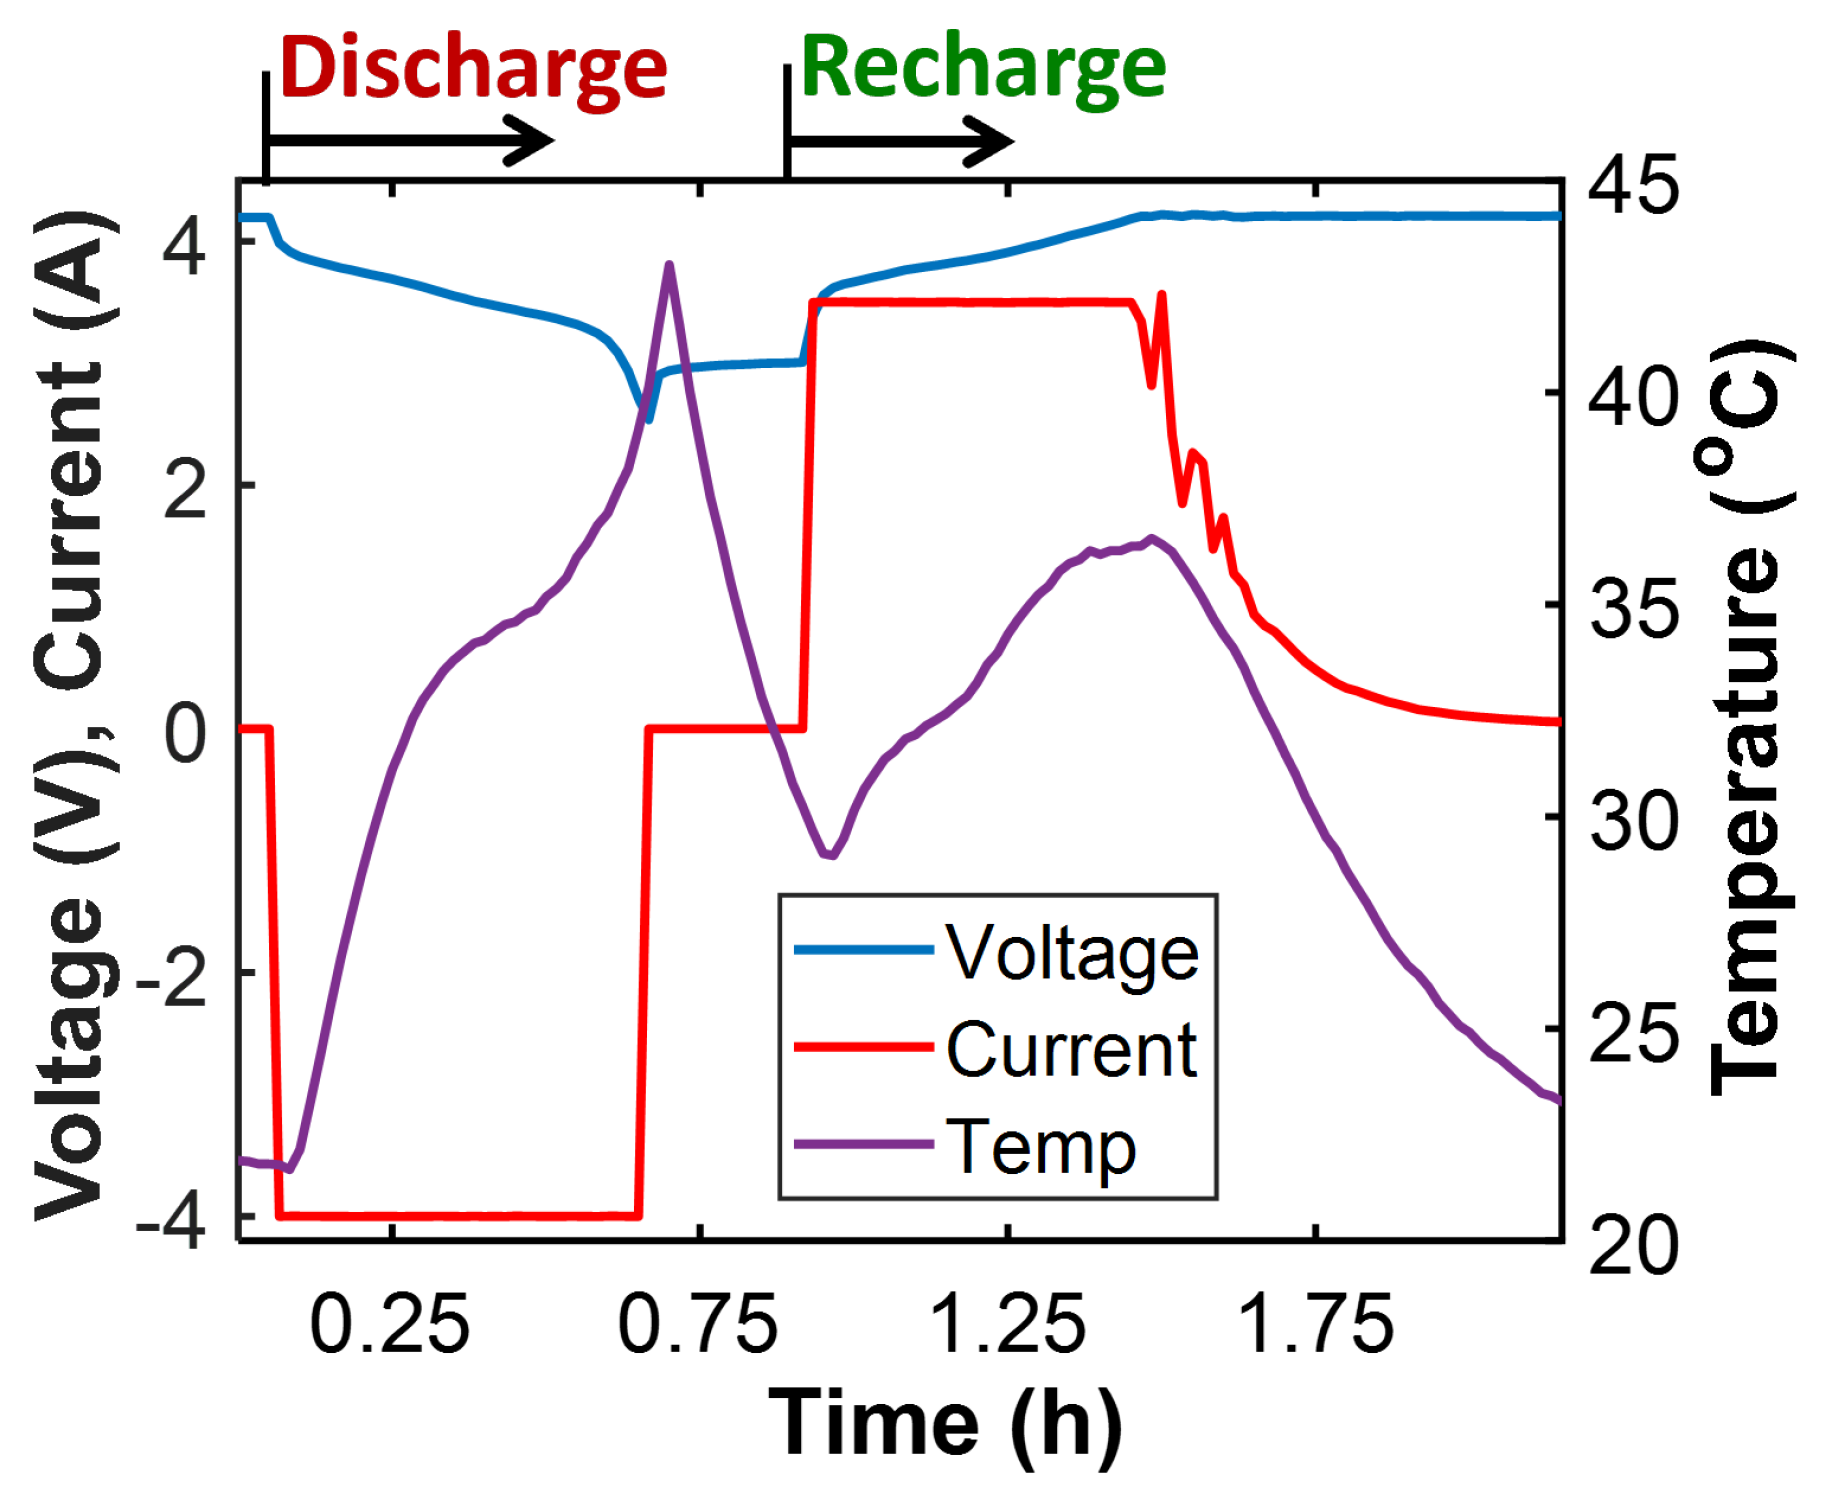
Osara et al. [45] presented measurements of the instantaneous voltage, current and temperature of a Samsung 3.6 V 2.5 Ah lithium-ion battery as it repeatedly discharged at 1.6 C-rate and recharged at 1.4 C-rate for 72 consistent cycles. Figure 6 plots the monitored parameters during the 70th cycle. The measurements and transformation and degradation analyses are detailed in reference [45]. Here, I analyze one cycle, with emphasis on the thermal aspects. In this cycle, the discharge step yielded capacity fade while the recharge step yielded capacity restoration. Note that in secondary cells, cyclic charge capacity fluctuates, particularly for the recharge steps some of which induce capacity fade [45]. Similar characterizations have been performed for lead-acid batteries [26], nickel-metalhydride batteries, super-capacitors, and fuel cells [37]. In electrochemical systems, the work entropy was specifically re-named Ohmic entropy  S W and the MST entropy re-named electrochemicothermal (ECT) entropy S μ T . To facilitate generalizations and be consistent with other systems analyzed here, I will continue to use work S W and MST S μ T entropies. The discharge and the recharge steps are analyzed separately (i.e., each has a transformation analysis and a degradation analysis). This enables the demonstration of a healing analysis using the recharge step. Furthermore, this battery analysis exemplifies, separately, both positive and negative transformations, that is, energy addition and extraction, respectively.

4.3.1. Transformation: Charge Content

Using the voltage, current and temperature data presented in Figure 6,
  • Select the available charge content C in the battery—estimated by Coulomb counting: C = C 0 ± t I d t —as the performance indicator (or transformation measure). Voltage change rate is also a useful measure [46,47]. Current I is negative during discharge and positive during recharge. C 0 is the battery’s full-charge capacity prior to the discharge step. Prior to the recharge step, after a full discharge, C 0 0 .
  • Compute the work entropy S W = t ( ± Y X ˙ / T ) d t = t ( ± v I / T ) d t as the numerical time integration of the Ohmic power output (the product of terminal voltage v and current I) divided by battery temperature T. Here, the plus sign (+) is for the recharge step and the minus sign (-) is for the discharge step.
  • Compute the MST entropy S μ T = t ( S T ˙ / T ) d t = t ( C v ˙ / T ) d t using the battery’s charge content C , the voltage change rate v ˙ , and temperature T during the time interval t. This form of the MST energy was derived in reference [26] via a combination of the Gibbs–Duhem formulation and Faraday’s law. It uses current and voltage which are more readily measurable than the material properties of a battery—a composite system—which determine its entropy content S.
  • Plot the entropies against the charge content and fit a plane to the trajectory.
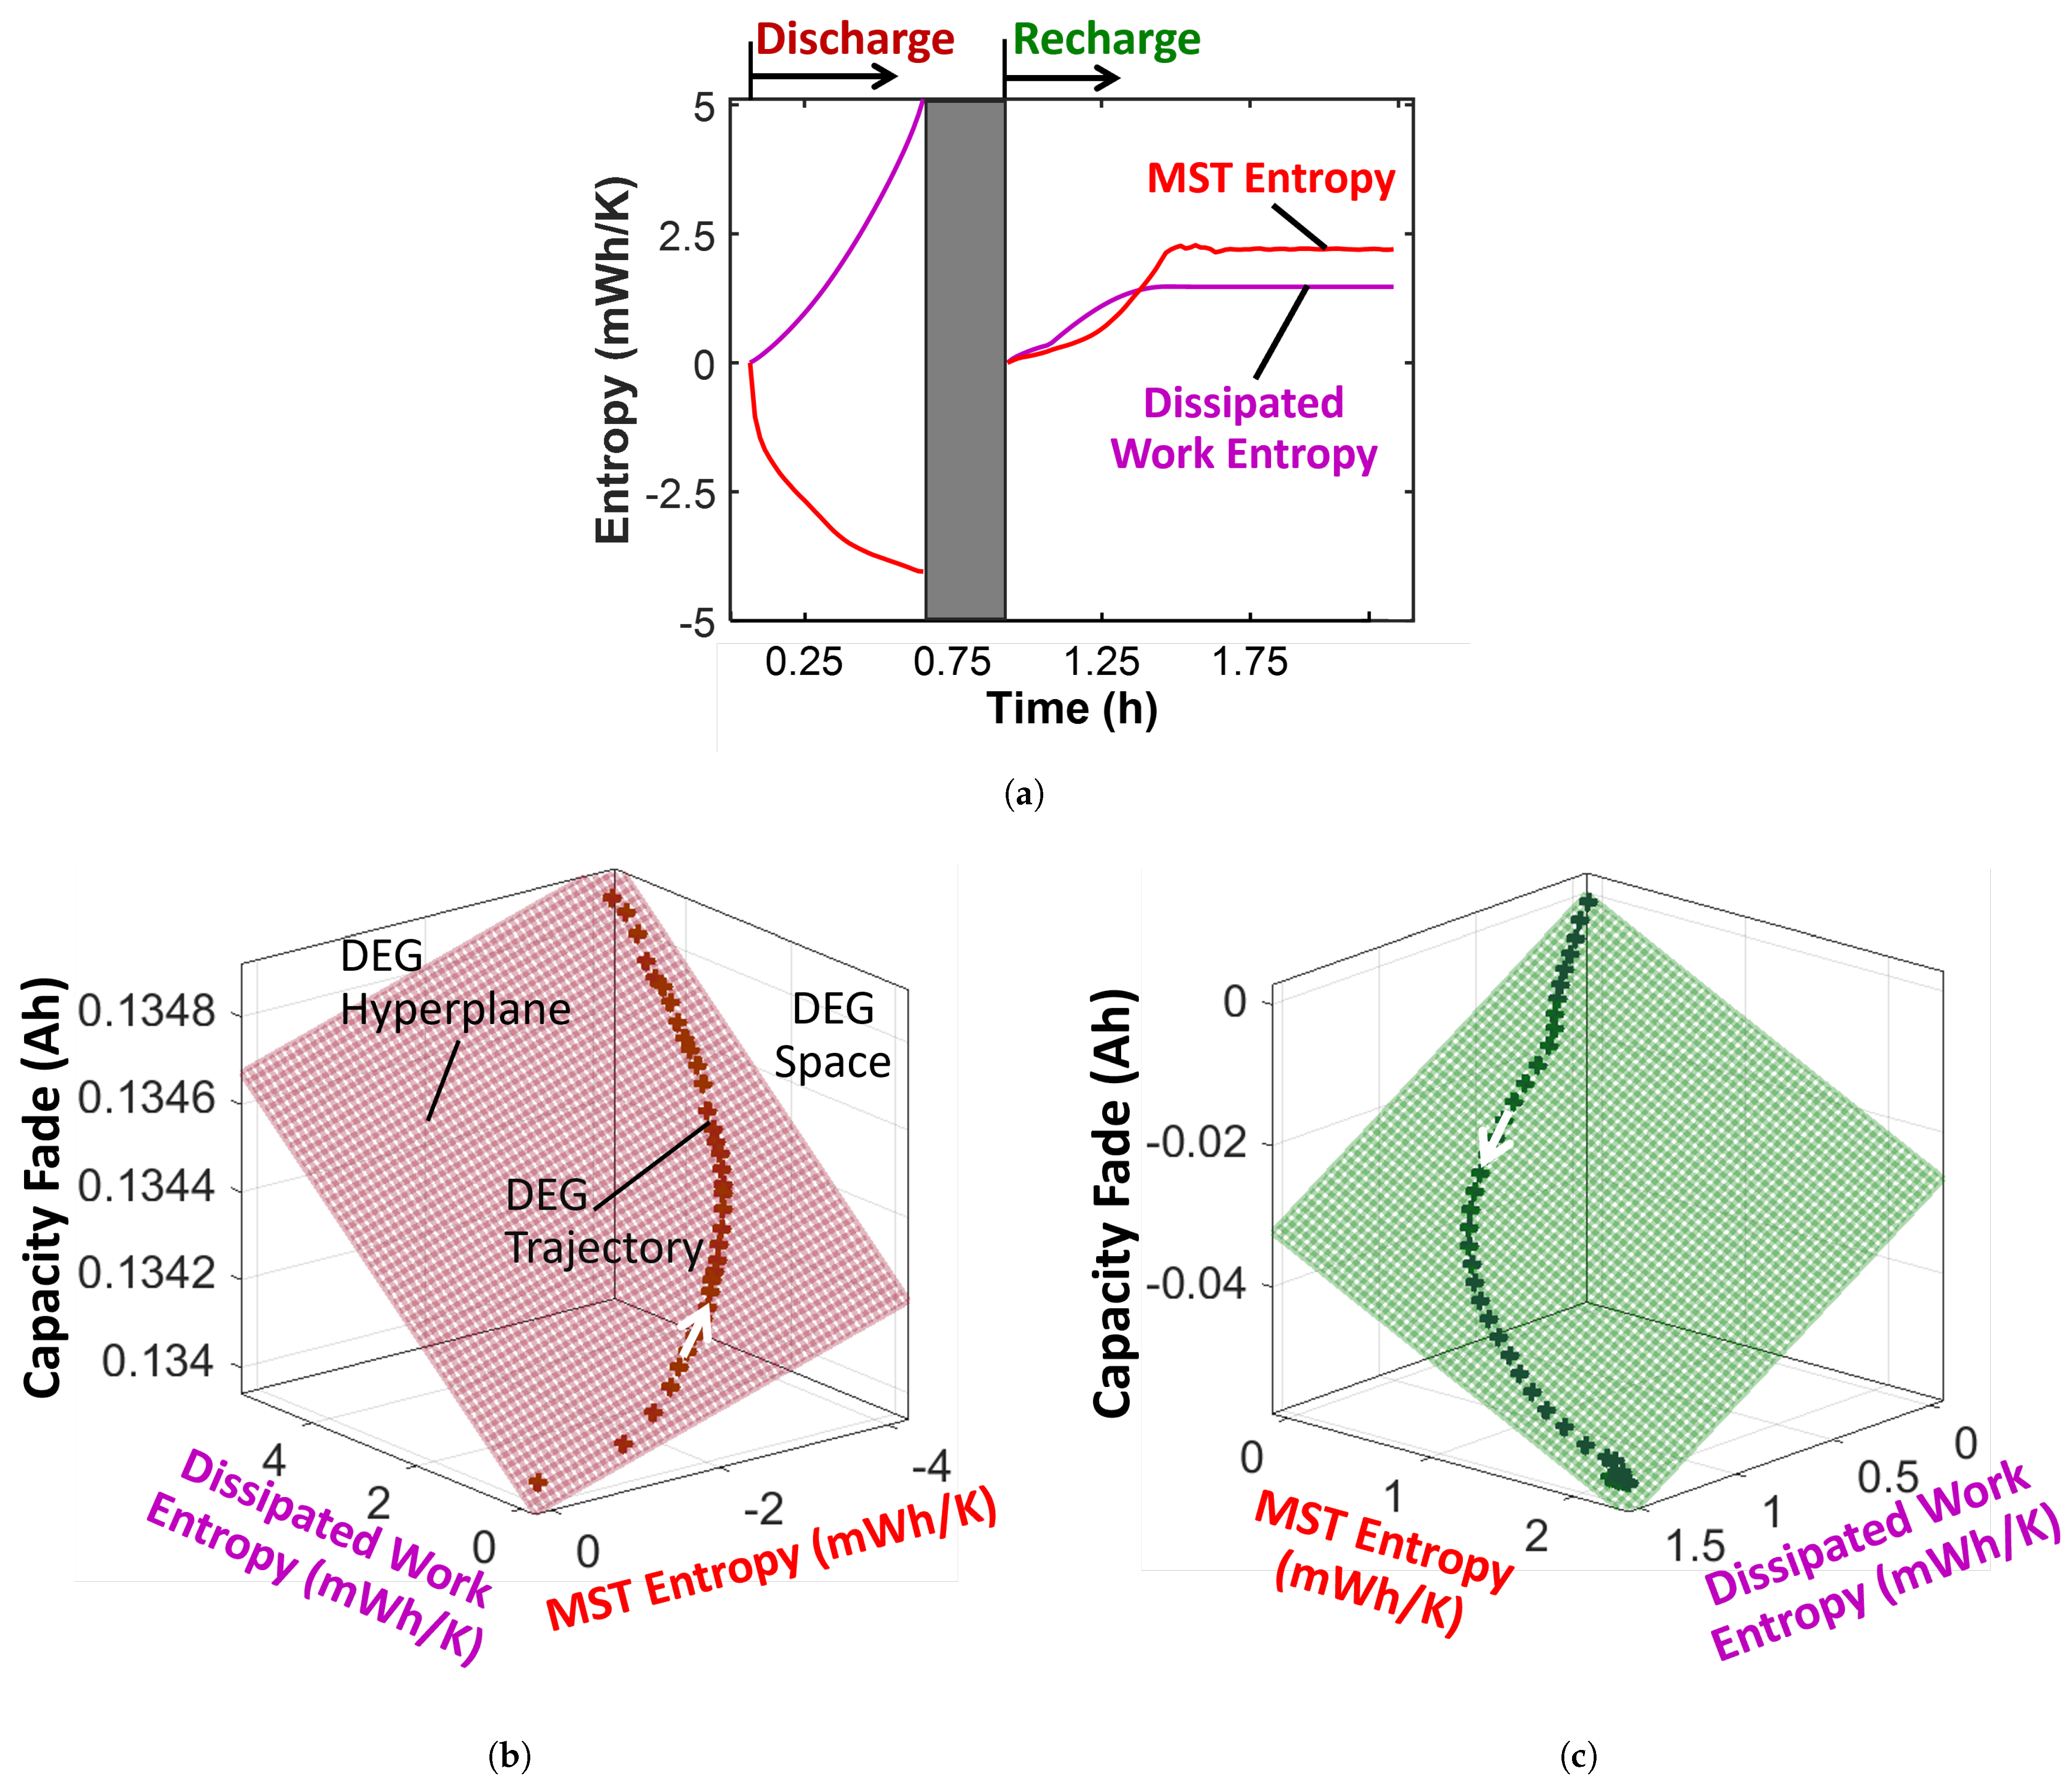
Using the cycle data in Figure 6, Figure 7a plots both entropies versus time. See the steps’ end states data in Table 3. Here, subscript D stands for the discharge step and C for the (re)charge step. Even though total charge is about the same and the C-rates are comparable, recharge MST entropy is less than discharge MST entropy: S μ T , C < S μ T , D . This verifies that the charge step is more Coulombically efficient than the discharge step, an empirically known phenomenon. In both steps, | S W |   >   | S μ T | . In Figure 7a, the right axis labels apply to the recharge step.
Figure 7b’s three-dimensional representation of the battery’s TPEG model yields—via the orthogonal slopes of the hyperplane— B W , D = 90.90 Ah K/Wh and B μ T , D = 25.80 Ah K/Wh for discharge. Figure 7c yields B W , C = 82.35 Ah K/Wh and B μ T , C = 63.32 Ah K/Wh for recharge. The red plane (Figure 7b) characterizes the discharge step and the green plane (Figure 7c) the recharge step. Note the signs of the axes of both the discharge and recharge transformation spaces. As anticipated by the convention in Section 3.3.4, all the transformation coefficients here are positive. At the ends of both steps, each mechanism’s contributions to total charge capacity/content/transfer are presented in Table 3. Here, MST-induced charge transfer C μ T is 4.2% of total battery charge transfer during discharge and 5.5% during recharge.

4.3.2. Degradation: Charge Capacity Fade

Using the data presented in Figure 6, perform battery degradation analysis according to the following:
  • Select the battery’s initial/reference/nominal charge capacity C 1 as the non-dissipative (reversible) performance indicator C r e v . This assumes a battery is healthiest when new, but note that capacity tends to rise and drop in the first few cycles as a new battery “exercises”. Subtracting a subsequent cycle’s measured charge capacity or content C from the reference cycle’s capacity C r e v gives the battery’s capacity fade Δ C as the degradation measure, first equality of Equation (14).
  • Evaluate the non-dissipative (reversible) work entropy S r e v = ± t ( v O C I / T ) d t [26] as the time integration of the product of open-circuit voltage v O C and current I, divided by battery temperature T. Loading a battery drops its voltage, thus, v O C is the theoretical maximum voltage a loaded battery can attain. Here, the battery’s rated voltage of 4.2 V is used. Then, S W , d i s s is the difference between S r e v and S W (obtained in Section 4.3.1).
  • Plot the entropies against the capacity fade and fit a hyperplane to the trajectory.
Reversible entropy S r e v is plotted in Figure 7a alongside the work entropy S W and MST entropy S μ T . As anticipated by the formulations, in both discharge and recharge, S r e v > S W to yield the universally non-negative work dissipation or dissipated work entropy S W , d i s s > 0 .
In Figure 8a, time series profiles of the entropy generation terms during the discharge and recharge steps are plotted. Dissipated work entropy S W , d i s s (pink plots) is positive for both discharge and recharge, while the accompanying MST entropy S μ T (red plots) is directional—negative during discharge as voltage drops and charge leaves the battery, and positive during recharge as voltage increases and charge re-enters the battery. Both entropies are higher in magnitude during the discharge step than the recharge step notwithstanding the comparable process rates. For discharge, dissipated work entropy S W , d i s s is higher in magnitude than the MST entropy S μ T . During recharge, S W , d i s s starts off higher, but quickly stabilizes as the battery enters the constant-voltage recharge phase. This phase is a pseudo-reversible phase, characterized by near-zero heat generation evidenced by the accompanying drop in temperature in Figure 6 as heat and entropy are spontaneously transferred out of the battery. This observation suggests that the constant-voltage recharge phase is primarily responsible for the healing experienced by the battery during recharge.
The battery’s discharge and recharge degradation models are plotted in Figure 8b,c, giving B W , d i s s , D = 0.130 Ah K/Wh, B μ T , d i s s , D = 0.060 Ah K/Wh, and B W , d i s s , C = 46.10 Ah K/Wh, B μ T , d i s s , C = 21.01 Ah K/Wh, respectively. The coefficient values and the orientations of the DEG hyperplanes indicate that the influence on degradation of the MST entropy is comparable to that of the dissipated work entropy. Contrast these with Figure 7b,c where the hyperplanes appear almost horizontal along the MST entropy axis, further reinforcing the difference between transformation and degradation analyses.
The mechanisms’ contributions to total capacity fade, the product of the end-state value of the each entropy term and the respective coefficient, are in Table 3. In the degradation analysis, MST-induced capacity fade Δ C μ T , D is 36.9% of the total battery capacity fade Δ C W , D induced by Ohmic dissipation during the 1.6 C-rate discharge, and Δ C μ T , C = 66.8% of the total capacity restoration Δ C W , C during the 1.4 C-rate recharge. The negative capacity fade values during recharge indicate restoration according to the convention in Section 3.3.4. At higher cycling rates, higher relative contributions of the MST mechanism are anticipated. Note that at high rates, the recharge step will experience degradation exacerbated by temperature rise, a major issue in rechargeable battery-powered systems. This mechanism is further explained in Section 5.1.
In batteries, similar to the humans in Section 4.1, the temperature rise effect is significant, particularly with respect to degradation.
The remaining examples are monotonically transforming and degrading systems that perform work (output energy) until failure. In these cases, there is no energy addition, and self-reorganization/regulation is negligible. Therefore, both transformation and degradation measures trend similarly, given degradation is determined using a constant initial/reference state. Hence, for brevity, only degradation analyses are performed.

4.4. Journal Bearings

Friction is one of nature’s most dissipative mechanisms. In the field of tribology, interfacial damage/wear often accompanies friction, resulting in a myriad of issues. Hence, characterizing frictional damage is of utmost importance. Bearings are some of the most common machine elements, transferring motion and supporting shafts while reducing friction and wear. In these mechanical systems, the bearing and the lubricant are the sacrificial components. When load conditions are dynamic, including frequent starts and stops, journal or plain bearings are often used. Journal bearings support heavy radial loads and degrade via non-uniform interfacial wear. The non-uniform increase in radial clearance can cause vibrations, increase in shaft whirl, seizures, and ultimately, machinery failure.
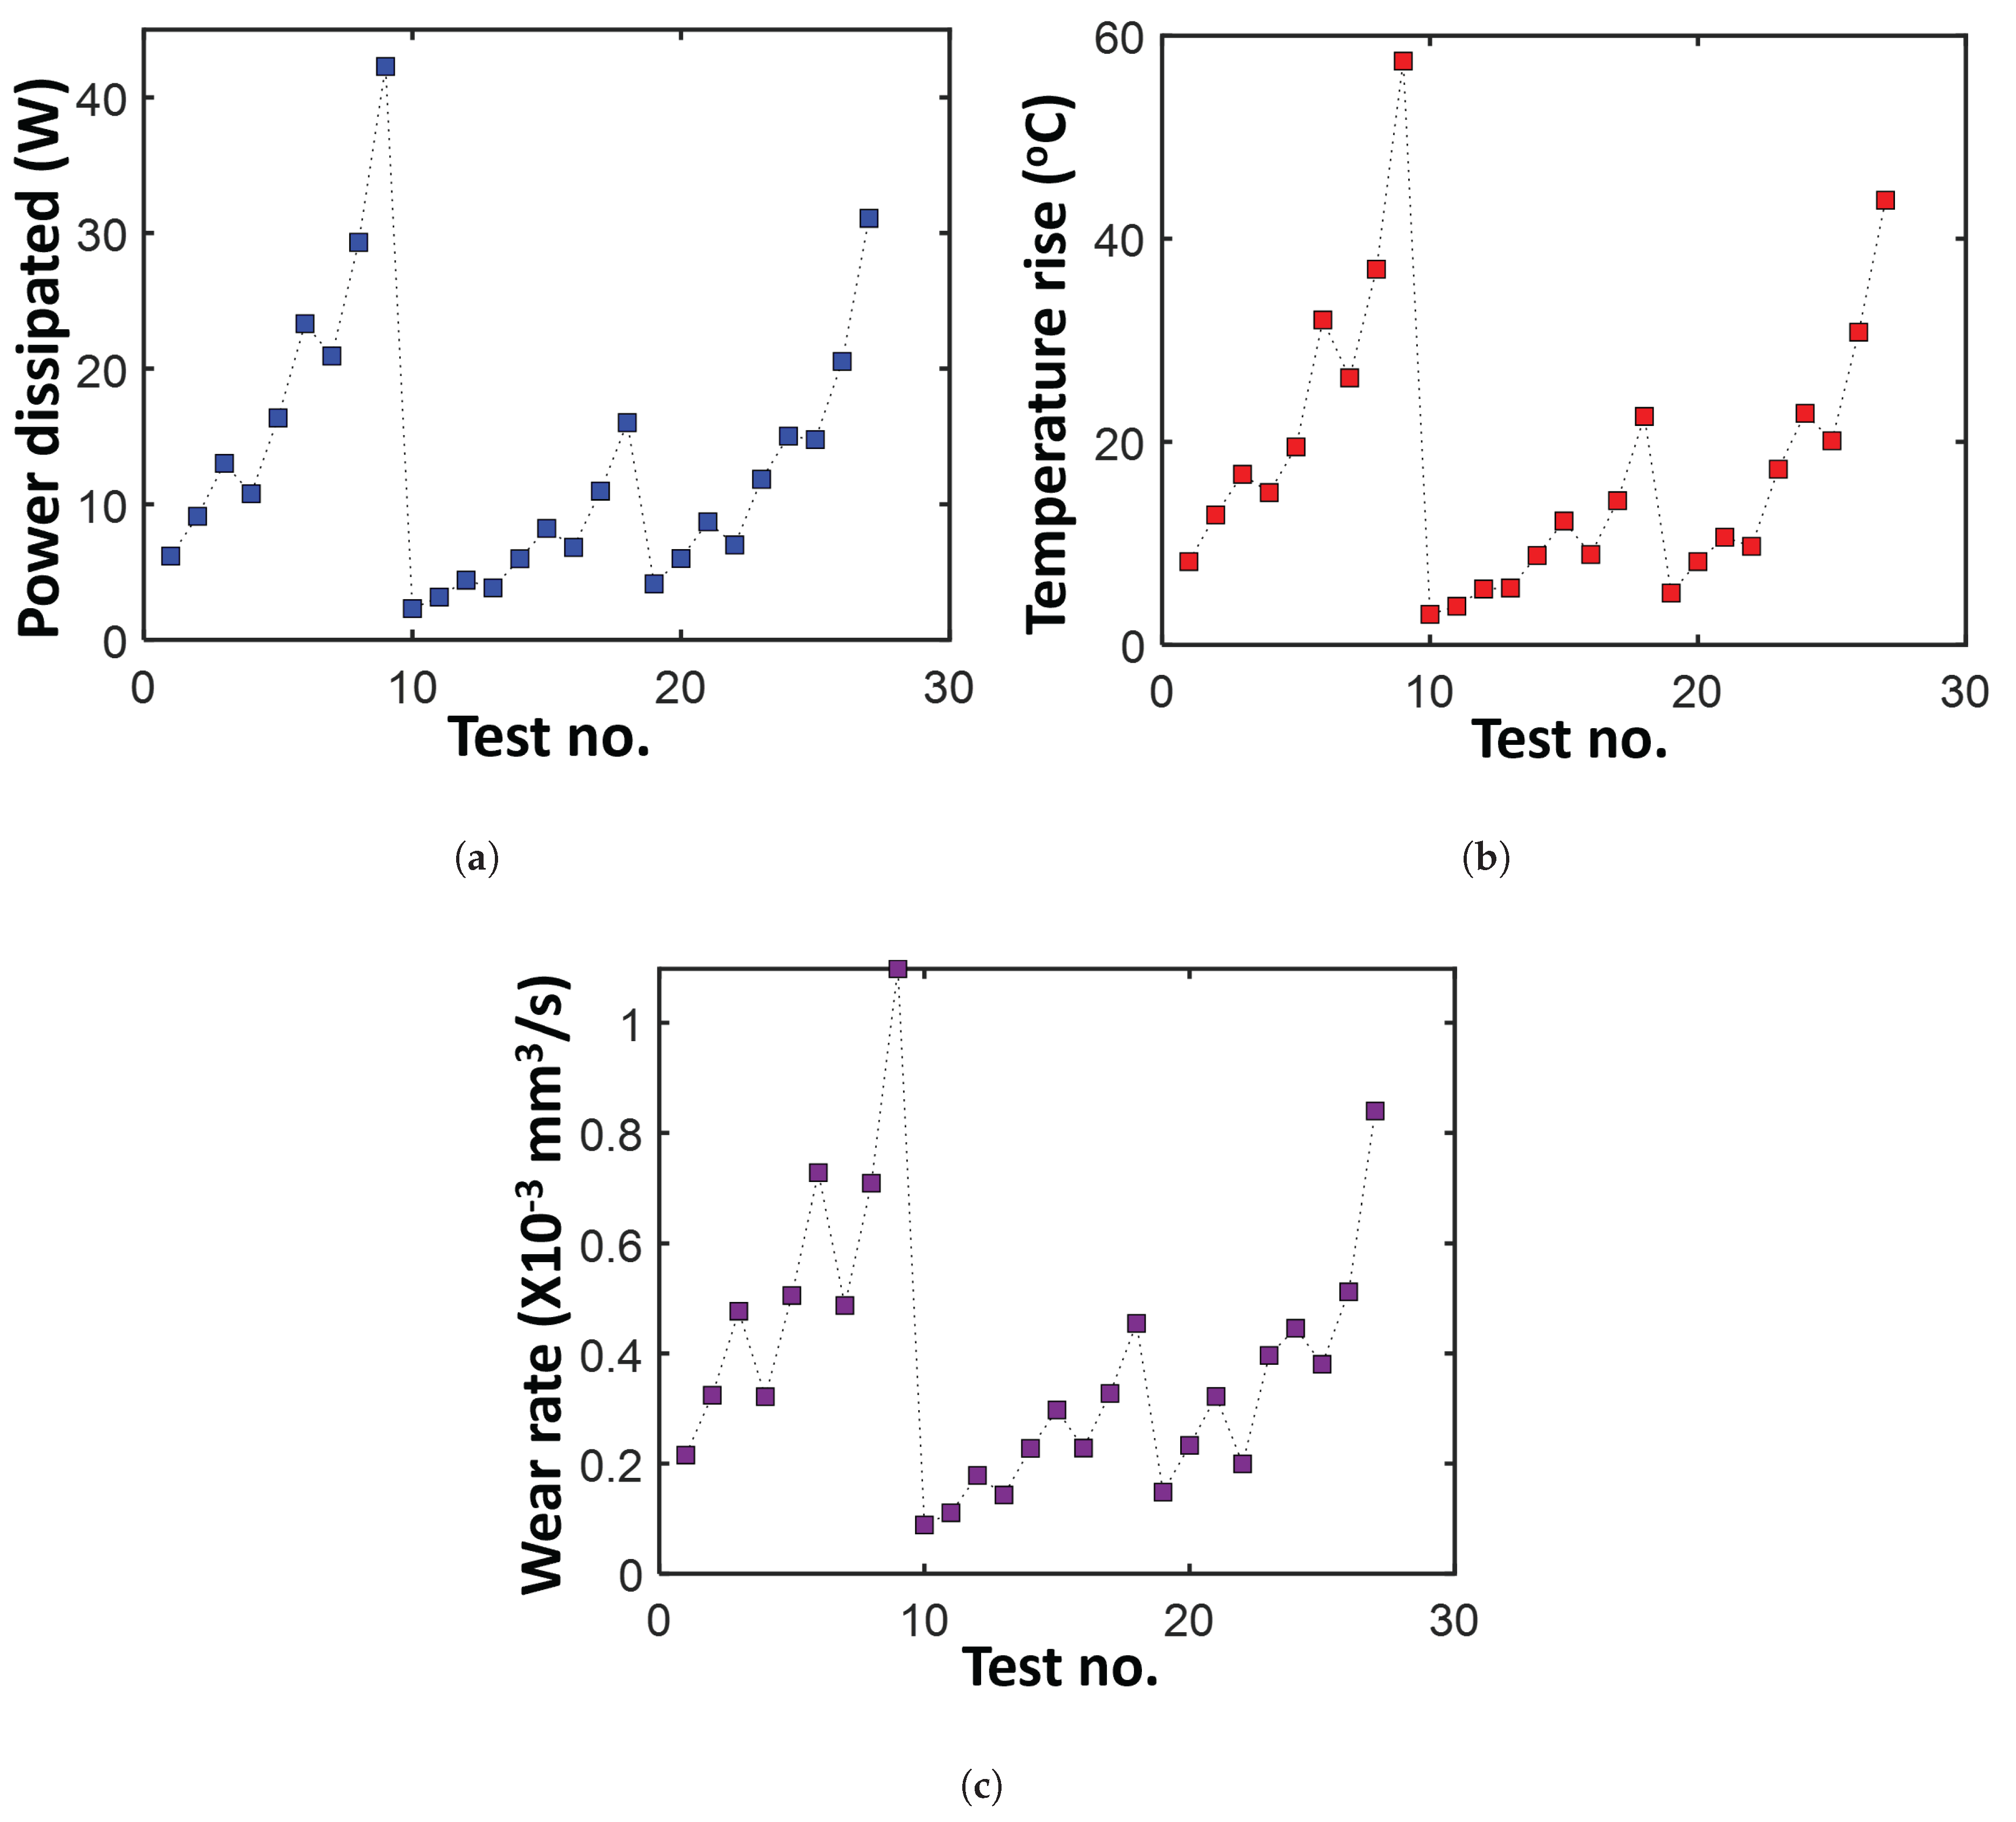
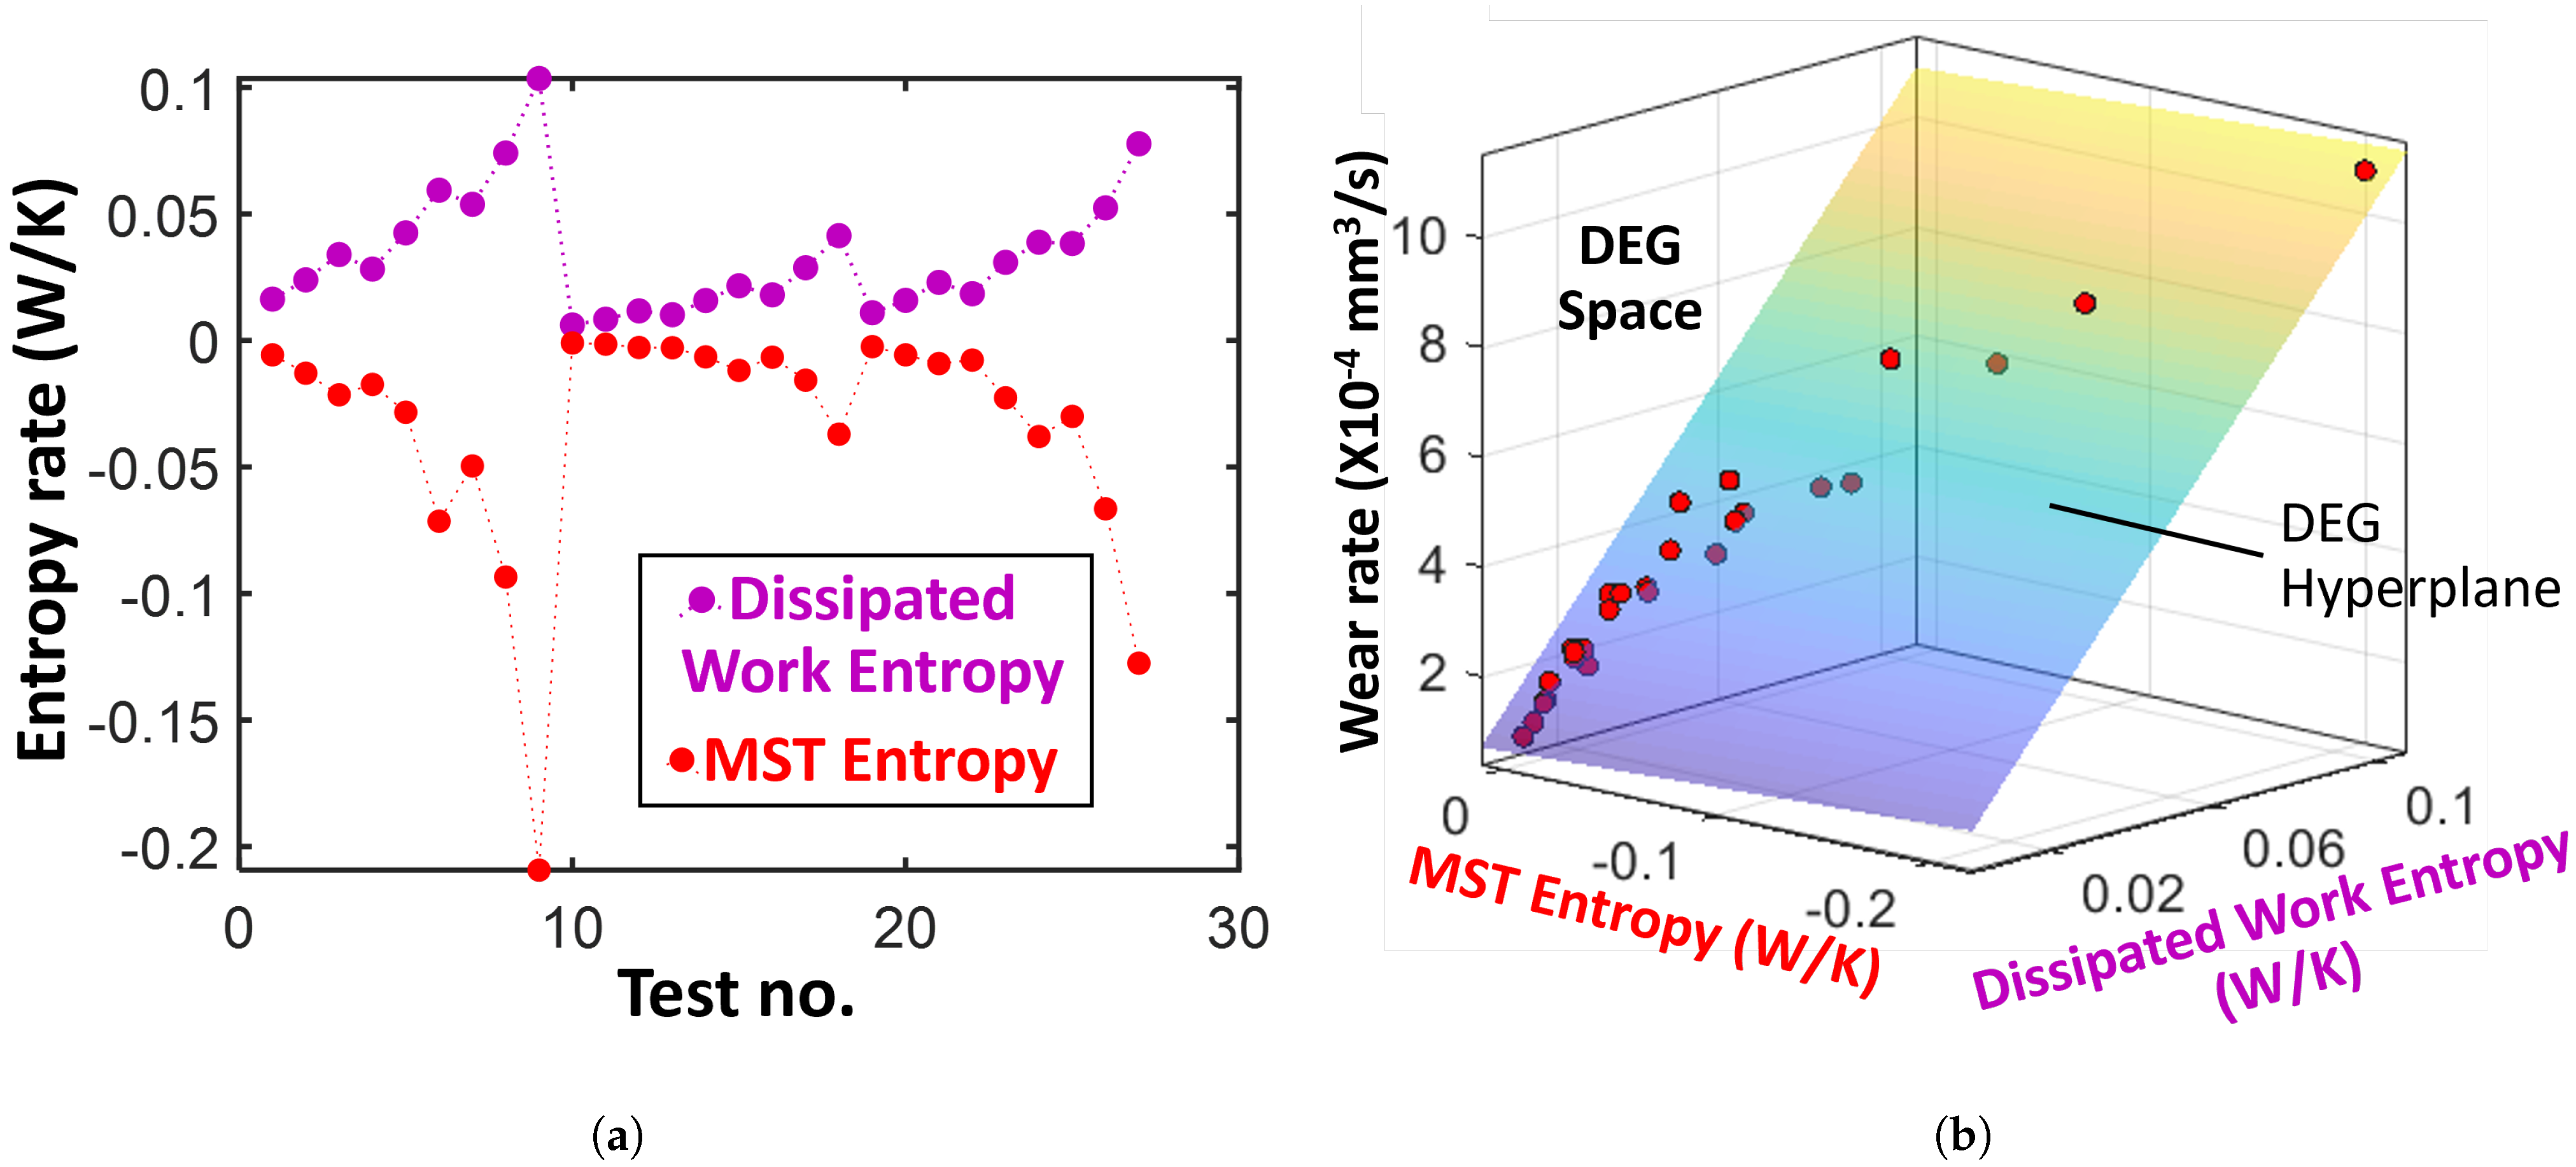
In reference [48], Aghdam and Khonsari reported measurements of temperature rise, power dissipation, and wear rate obtained on an oscillating, boundary- and mixed-lubricated journal bearing. Their measurements are presented in Figure 9. This journal bearing analysis involves discrete data points each measured under a different operating condition. The lines in the plots indicate sequence, not continuity. A total of 27 tests were performed, with each 150 min test having a different combination of amplitude, frequency, load, and lubrication mode. Visual inspection of the plots in Figure 9 identifies a correlation between wear rate V ˙ , power dissipation W ˙ d i s s and temperature rise Δ T . According to the thermal energy balance, Equation (12), frictional heat generation in the absence of active cooling will result in temperature rise; hence, the correlation between mechanical power dissipation (or frictional power) and temperature increase is anticipated. With power dissipation, the product of frictional force and sliding velocity ( W ˙ d i s s = F f x ˙ ), substituting the normal force F n defined by Coulomb’s friction law ( F n = F f / η ) into Archard’s wear law ( V ˙ = k F n x ˙ ) yields V ˙ = k W ˙ d i s s / η which directly relates volumetric wear rate to power dissipation under conditions for which k / η is not changing significantly from test to test. Here, k is the specific wear rate and η is the coefficient of friction. Furthermore, experimental studies [14,49] have observed a linear relationship between interfacial wear and energy dissipation or entropy generation.
The 9th test involved the largest values of amplitude, frequency, and load, yielding the highest wear rate, power dissipation, and temperature rise in the bearing. Using linear fits, the authors [48] obtained a wear-power dissipation coefficient and a power dissipation-temperature rise coefficient.

Degradation: Surface Wear

Using the data presented in Figure 9, perform the bearing degradation analysis according to the following:
  • Select volumetric wear rate (Figure 9c) of the journal bearing as the degradation measure. This is often directly measured in tribological experiments. Here, as mentioned previously, there is no need to estimate a reversible transformation.
  • With mechanical power dissipation W ˙ f directly available (Figure 9a), compute work dissipation entropy rate as S ˙ W , d i s s = ϕ W ˙ f / T , where ϕ = 0.8 [48] is the heat partitioning factor, the fraction of the interfacially generated heat that goes into the bearing.
  • With temperature rise Δ T directly available (Figure 9b, compute MST entropy rate S ˙ μ T = ( S Δ T ) / ( T Δ t ) , where Δ t is the time duration of the test given as 150 min. Evaluate entropy content S = V ρ c log T T 0 + α H using the brass bearing material properties (density ρ , specific heat capacity c, thermal expansion coefficient α , and hardness H), volume V, and temperature T.
  • Plot the entropy rates against the wear rates and fit a hyperplane to the trajectory. Here, since only values of average power dissipation and overall temperature rise are available per test, rates and accumulations yield the same results.
Figure 10a plots the entropies. Anticipated by formulations, the work dissipation entropy (pink plot) is always positive while the MST entropy (red plot) is negative. Unlike prior examples, the MST entropies here are similar in magnitudes to the dissipated work entropies. In five of the tests, in which temperature rise exceeded 30 °C and wear rate exceeded 500 mm3/s, MST entropy is higher than dissipated work entropy. The 9th test, most severely loaded, correspondingly has the highest entropies. The DEG model plotted in Figure 10b yields one pair of degradation coefficients for all 27 test conditions: B W , d i s s = 0.0093 mm3 K/Ws, B μ T , d i s s = 0.00027 mm3 K/Ws. Here, | B μ T , d i s s |   <   | B W , d i s s | , indicating the dominance of the mechanical power dissipation via friction over the MST mechanism with respect to wear rate. This is intuitive given that at these temperatures (<100 °C), metals are very stable; hence, the primary mechanism for material removal involves plasticity and fracture, both of which are mechanical.
Combining the coefficients with each test’s values of the entropy terms gives the mechanisms’ contributions to the wear rate. The relative/fractional contribution of temperature rise via the MST term (TRC) is plotted in Figure 11. The maximum TRC of 5.7% was observed in the 9th test which had the highest wear rate and temperature rise. With the 9th test as the worst-case scenario, only the results of this test are included in Table 3. Confirming the theoretical anticipation, the evident direct correlation between TRC (Figure 11) and power dissipation (Figure 9a) demonstrates that the contribution of the MST mechanism varies significantly with process rate. For highly dissipative processes, the MST entropy is crucial.

4.5. Lubricating Grease

Recall earlier discussion on the highly dissipative effect of friction. Lubrication is one of the primary methods of reducing friction. Lubricants reduce friction and wear in solid interfaces in relative motion. In these tribological systems, the lubricant is sacrificed to preserve the relative-motion interface. In bearings and gears, grease, a semi-solid lubricant, is often used in semi-permanent and sealed-for-life applications [5]. Hence, the life of the grease often determines the maintenance interval and the end of useful life of the greased components. Grease, like most solid and semi-solid materials, degrades mechanically, thermally and chemically.
In reference [38], the authors measured the temperatures T and shear stresses τ of lubricating greases mechanically sheared at a constant shear rate γ ˙ = 28.8 s−1. Two greases were sheared, one with high consistency, a helicopter grease of NLGI (National Lubricating Grease Institute) grade 4, subsequently named ‘#4’ grease, and another with low consistency, a multipurpose automotive grease of NLGI grade 2, subsequently named ‘#2’ grease. Figure 12 plots the recorded data during the shearing experiments for both greases. The #4 grease experienced high shear stress and generated more heat as observed in the initially high temperature increase, relative to the #2 grease which experienced low shear stress and was nearly isothermal. The initial high rate of temperature rise is due to grease churning: the high resistance of the near-solid grease against the stirrer moving through it, inducing high frictional heat generation. With continuous shearing, the grease eventually softens, reducing heat generation—via lower friction torque—which balances convective heat transfer to the environment to render a steady or dropping temperature. Details of the measurements and degradation analyses are in reference [38]. Here, degradation is considered thermo-mechanical (primarily mechanical given the overall low temperatures and short durations of the tests).

Degradation: Loss of Shear Strength

Using the data presented in Figure 12, the grease degradation analysis procedure is as follows:
  • Select shear stress τ as grease degradation measure. Grease shearing is dissipative, breaking down the grease microstructure. Here, there is no need to estimate a reversible transformation.
  • Compute the (shear) work dissipation entropy density S W , d i s s = t ( τ γ ˙ / T ) d t as the time integration of the product of the controlled shear rate γ ˙ (of 28.8 s−1) and the shear stress τ response divided by the grease temperature T.
  • Compute the MST entropy density S μ T = t ( S T ˙ / T ) d t with the entropy content density S = ρ c log T ( t ) T 0 + α G obtained using known grease material properties and monitored temperature during the test time interval. Values of grease material properties [38]: density ρ = 950 kg/m3, specific heat capacity c = 2300 J/kg K and thermal stress coefficient β = α G = 1300 Pa/K.
  • Plot the entropies against the time-accumulated shear stress and fit a hyperplane to the trajectory.
This analysis is volume-normalized (on a unit volume basis)—convenient in stress–strain interactions—resulting in entropy densities. Figure 13a plots the entropies for both greases. The dotted lines are the #4 grease entropy profiles and the continuous lines represent the #2 grease. Recall that the #4 grease is a high-consistency grease used in helicopter rotor applications. The #4 grease generated more heat than the #2 grease, rendering the former’s MST entropy of a similar order of magnitude as its dissipated mechanical work (or shear) entropy. In such applications, cooling is needed to slow down grease degradation. The positive end-state MST entropy of the #2 grease is a result of the temperature fluctuations in Figure 12 yielding an overall slightly upward trend in MST entropy in Figure 13a.
Figure 13b plots the DEG models for the greases [38], giving B W , d i s s , 4 = 10.36 s K, B μ T , d i s s , 4 = 0.504 s K, B W , d i s s , 2 = 10.38 s K and B μ T , d i s s , 2 = 0.031 s K. These values ( | B μ T , d i s s | < < | B W , d i s s | ) indicate the dominance of the shear work (primary interaction) dissipation entropy over the MST entropy with respect to shear stress-measured degradation. Both greases were sheared at the same rate, hence the similar work dissipation coefficient B W , d i s s values.
From Table 3, for #4 grease, the percentage of MST-induced stress TRC is 1.7% of total loss of shear strength, which is low. For the #2 grease, with near-zero overall temperature rise and apparent thermo-elasticity, the MST entropy makes a near-zero contribution of −0.002%, indicating minimal energy dissipation via a minimized MST entropy. The negative sign of τ t μ T , 2 emanates from the positive MST entropy during most of the test duration (see Figure 13a and Table 3). Maximum temperatures in both greases were below 45 °C and total test durations were less than 3 h. In industrial machinery, the low temperature performance limit is approximately 40 °C, the test temperature used in many standardized tests that measure grease properties. Hence, the temperature rise experienced by these greases is relatively minimal. Furthermore, thermal degradation of grease (in the absence of oxidation) has been shown to be a slow process, and thermal aging studies on grease are typically performed at temperatures >100 °C [50,51]. Dokter and Osara [50] thermally aged three greases for 30 days at 130 °C in nitrogen—to prevent oxidation—and concluded that temperature-only degradation of grease well below its dropping point is minimal, relative to mechanical and chemical degradation. The much higher TRC of the #4 grease than the #2 grease verifies that thermally induced degradation increases with heat generation. The much higher MST coefficient ( | B μ T , d i s s , 4 | > | B μ T , d i s s , 2 | ) indicates that compositional differences in greases will yield different responses to temperature increase. These differences between both greases are visually evident in the dimensions of the DEG hyperplanes in Figure 13b.
Table 3 summarizes the main findings from the above example demonstrations.

5. Discussion

5.1. Healing

As stated in Equation (6), the difference between the ideal (or reversible) and actual energy is the energy dissipated or exergy destroyed. All the examples in this article reinforced that energy dissipation—via the dissipated work entropy—is always non-negative and monotonic for all continuous processes, including energy extraction and addition. During energy addition processes, the ideal amount of energy that needs to be transferred from the external reservoir (or energy source) is less than the actual amount of energy transferred. This is in accordance with natural experience and governed by the second law which prescribes a monotonically non-negative entropy generation.
In the battery analysis, Section 4.3, the recharge step yielded negative capacity fade. Via the discussions in Section 3.3.4, negative degradation implies formation, growth or healing. Figure 8a shows that while work dissipation entropy increases throughout the discharge step, it becomes constant during the constant-voltage phase of the recharge sequence. This phase is longer than the preceding constant-current phase of recharge during which energy dissipation increased. Recall earlier discussion that a reversible (no-degradation) process has zero energy dissipation. In Figure 6, the battery’s temperature drops in this region as the rate of spontaneous heat/entropy transfer out exceeds the near-zero entropy generation rate. This temperature drop is comparable to the drop during the battery settling step (the step between the discharge and recharge steps when current is set to zero and the battery allowed to equilibrate). Thus, the battery’s entropy reduces. However, unlike the settling step which does not transfer charge, the continuous transfer of charge/energy into the battery in the constant-voltage phase—see the exponentially decaying current profile in Figure 6—potentially results in healing (health restoration or negative degradation).
Note that, as discussed in Section 3.3.4, some energy addition processes may not heal the system. Fast charging and overcharging of batteries result in significant instabilities that can cause catastrophic failures. Hence, energy addition alone does not heal. The condition of zero (or near-zero) energy dissipation constrains the energy addition process that leads to healing. In the rare phenomenon where healing occurs during energy extraction, as found in dissipative structures, the same constraint applies.

5.2. Measuring Degradation

In the grease analysis, Section 4.5, choosing as degradation indicator w the shear stress which was also the generalized dissipation force Y r e v Y in the work/shear entropy appears to have contributed to the low impact of temperature rise evaluated. However, Dokter and Osara [52], using five different grease properties to measure degradation, showed that even though each property yielded different degradation coefficient B i value, the relative influences by the three active mechanisms studied were similar for four of the five properties. In a few cases, a degradation measure more thermally responsive at low temperatures may show slightly higher temperature rise effect. Hence, an understanding of the selected measure is essential to avoid misinterpretation of the computed values. When available, a rheometer, capable of measuring viscosity and other grease properties while shearing the grease, could be used, noting that this primarily tests shear degradation.
The low temperature impact in the grease study in Section 4.5 is primarily due to the relatively low temperatures, far below the greases’ dropping points, minimally influencing the shear stresses in the greases. One of the greases was nearly isothermal. Therefore, the degradation experienced by the greases in that study is predominantly mechanical. In such situations, work dissipation mechanisms such as friction, irreversible chemical reactions, and plasticity dominate, due to the low to medium temperatures. Tribological systems, such as the journal bearing in Section 4.4, where temperatures are far from the critical (e.g., melting) points of the interface materials, are also good examples. In tribological interfaces in high-temperature environments such as in combustion engines, high levels of thermally induced wear have been reported.
For comparative analysis of two or more similar materials or systems [38], the choice of degradation measure has been shown less critical [52].

5.3. Complexities in Mechanism Interactions

In the professional athletes example in Section 4.1 and Section 4.2, degradation was quantified using heart rate increase as a measure of cardiovascular strain. In reality, other factors such as stroke volume (ml/heart beat) influence this strain. Furthermore, performance decline and degradation in humans are influenced by a combination of interacting factors such as perception, physiology and metabolism [10]. The details of these active mechanisms and their interactions are outside the scope of the present framework which required a measurable cardiovascular strain parameter—heart rate in this case—to quantify degradation tendencies. In batteries, some studies use capacity fade as a degradation measure [53] while others use internal resistance [54], both of which are inter-related. Some lubricating grease studies use bleed capacity [55] while others use viscosity [56]. As discussed in Section 3.3.3, quantitative analysis is constrained to a single metric per evaluation. Multiple evaluations are recommended when more system response parameters are observable.
Notwithstanding the limited information often in a selected transformation/degradation measure, the unique and characteristic results of the herein proposed methodology are predicated on the entropies, not the transformation measures. By systematically combining observable system properties (that respond to active mechanisms) and process variables, the entropies incorporate in a naturally efficient manner the simultaneously occurring, inter-dependent mechanisms. Then, via the TPEG and DEG theorems correlating the transformation and degradation measures with the entropies, we obtain transformation and degradation coefficients that “re-configure” or decompose the measures into contributions from the active mechanisms, and are characteristic of the complex interactions.
The real-world demonstrations in this treatise involved singular, albeit complex, systems. For large-scale systems that are typically scaled up or agglomerated from these single systems, such as battery packs, the analysis herein applies similarly, provided the system boundary or control volume is appropriately defined. Availability of data and data measurement points (in time and space) will impact parameter values, hence, results should be interpreted accordingly. For example, if the temperature of each cell in a battery pack is monitored, the model will be more precise in the cell-to-cell characterization than if one overall pack temperature is used.

5.4. Cool It: Minimizing Microstructurothermal Degradation

The microstructurothermal (MST) mechanism observed via temperature increase is a consequence of the heat generated when energy is dissipated. In all real-world interactions, an amount of energy is always dissipated, a fraction of which degrades while the other fraction raises the temperature of the system as its microstructure disorganizes. Biological systems continuously self-reorganize internally in response to external loads/conditions. The internal compositions of batteries and other energy storage systems continuously change in response to external loads/conditions. In humans and batteries, the results of Section 4.1, Section 4.2 and Section 4.3 show that thermally induced (or MST) degradation is critical. In bearings and greases, results show that degradation correlates directly with power dissipation and temperature rise. Hence, increase in temperature is adverse as experience and numerous studies show, and this article demonstrated. The MST entropy is a measure of the system’s internal response to external work or internal reactions and, as such, is needed to fully characterize transient and nonlinear system behavior. In physical systems undergoing a non-thermal primary transformation—such as mechanical loading—below their critical temperatures, the temperature rise effect can be low at low-to-medium process rates, but increases as process/dissipation rate increases. These trends and behaviors are consistently depicted by the transformation and degradation hyperplanes in the respective multi-dimensional domains, Figure 4b, Figure 5b, Figure 7b,c, Figure 8b,c, Figure 10b and Figure 13b.
In Section 4.2, the effect of cooling an active system was further quantified. With the adverse effect of temperature rise (above nominal operating range) verified, it is important to minimize degradation and maximize system performance/reliability, thereby preventing catastrophic failures, saving lives and reducing maintenance costs via prolonged remaining useful life. Medical doctors and device manufacturers often specify nominal operating temperature range for optimal human and device performances, respectively.
MST (or thermally induced) degradation is the product of the system’s MST coefficient  B μ T , d i s s and the process’s MST entropy  S μ T , both of which can be reduced to minimize thermal degradation and, hence, overall degradation. This suggests the MST coefficient as a design/manufacturing parameter with which a material/system can be optimized. This also suggests the MST entropy as a process parameter which can be controlled by an operator or algorithm to minimize degradation. Recall that very slow or low-load processes dissipate minimal energy and generate minimal heat. These include dynamic processes in which resistance or friction is minimal. However, fast processes and high power are often required in real-world situations such as industrial applications. Equation (6) directly implies that minimizing the MST energy minimizes the free energy dissipation. Therefore, in high-power processes, the MST degradation is minimized by keeping the system’s entropy content low and temperature steady in its optimal operating range. In addition to the demonstrated favorable impact of external cooling on exercise performance, sweating regulates the human body temperature, keeping athletes cool to allow longer, faster and higher-power activities [10]. Forced cooling is commonly used in industrial machinery, equipment, vehicles, computers, etc., to promote long-term optimal performance. In tribological systems, lubrication and surface engineering are often used to lower interface heat generation and temperature rise.
Bejan et al. [57] analyzed thermal and fluid systems, proposing entropy generation minimization methods via a reduction in thermal entropy. As needed, these and other available system optimization strategies should be employed to minimize temperature rise-induced degradation. Recall that the favorable effects of cooling do not consistently apply to sub-optimal operational temperatures. If the system is “too cold”, its performance and durability will be adversely impacted.

5.5. Other Aspects

In the last paragraph of Section 3.3.3, three approaches for evaluating the reversible parameters (specifically w r e v and S r e v ) were recommended. In Section 4.1.2 involving human athletes, these reversible parameters were estimated using the extremums of heart rate and power output, the third suggested approach. This yielded a TRC of 221% for the warm environment (32 °C). Alternatively, if the data at the cool ambient temperature (23 °C) is assumed the “healthiest” possible, it could be directly used to estimate the reversible parameters, the first suggested approach. Applying this assumption to the athletes data yields a TRC of 203% for the warm environment. These values verify that both assumptions rely on similar framework. The choice of approach can depend on convenience or characterization goal, but must be consistent throughout the entire characterization. To enable direct quantification of the effect of cooling via separate analyses of the “cool” and “warm” datasets, the third approach was selected in Section 4.1 analysis.
The dissipation factors J, Equation (22), computed for the athletes and battery, using Table 3 data, are 0.0285 (both warm and cool), 0.148 (discharge) and 0.071 (recharge), respectively. This further suggests that the discharge step is more dissipative than the recharge step at similar process rates under typical operational conditions. Values for the journal bearing and the greases can be estimated by replacing the work entropy with the dissipated work entropy.

6. Conclusions

Energy transformation and dissipation in various classes of systems were quantified, with emphasis on the degradation impact of the work-accompanying thermal mechanisms of heat generation and accumulation. Temperature rise as a spontaneous consequent phenomenon of active dissipative processes was demystified. Models and procedures to quantify the direct contribution of temperature rise on energy conversion, dissipation and system degradation were presented. The models describe hyperplanes in a multi-dimensional space with the entropies associated with the active mechanisms as the coordinates of the trajectories along the hyperplanes. Real-world data from diverse multi-physics and multi-disciplinary systems in the literature—including biological (humans), electrochemical (batteries) and mechanical (journal bearing and lubricant grease) systems—verified the theoretical formulations. Via a direct correlation, the framework of the proposed methodologies inherits the assertions and consequences of the first and second laws of thermodynamics. This article showed the following:
  • Dissipation of free energy by mechanisms such as friction and plasticity occurs via the simultaneous processes of energy degradation and temperature rise (or microstructurothermal energy accumulation/storage).
  • In dissipative processes, the temperature rise-manifested microstructurothermal (MST) entropy is often less in magnitude than the primary non-thermal interaction (or work) entropy.
  • Via correlations with transformation and degradation indicators, results show that the MST mechanism is significant in system transformation and degradation, contributing about 37% of total degradation in a discharged battery. In professional, high-performance athletes, the impacts of temperature rise on cardiovascular strain increase during self-paced exercise in warm and cool weathers were 221% and 161%, respectively, with the physiological power output having a restorative effect on heart rate increase.
  • Cooling improves performance and minimizes (energy and material) degradation in active systems. In addition, a 27% drop in relative thermal contribution to degradation due to cooling was observed in the athletes studied.
  • A healing process is characterized by negative degradation, as demonstrated by the recharge step of a lithium-ion battery which had negative capacity fade. Here, MST contributed 67%.
  • During design and manufacture, MST transformation and degradation coefficients B μ T and B μ T , d i s s should be minimized as material properties to improve reliability and durability, respectively. During operation or use, the MST entropy S μ T should be minimized for optimum performance, reliability and durability.
The robust analysis framework detailed in this rigorous treatise has parameters universally consistent in meanings and capable of characterizing all active mechanisms in any system. While trends are typical, the specific values reported for the demonstrated examples reflect the measurements used in the evaluations.

Funding

This research received no external funding.

Institutional Review Board Statement

Not applicable.

Informed Consent Statement

Not applicable.

Data Availability Statement

Data used in this research was culled from the literature.

Conflicts of Interest

The author declares no conflicts of interest.

Nomenclature

Latin
AJHelmholtz free energy
B Degradation coefficient
cJ · kg−1 · K−1Specific heat capacity
C A h Charge content/capacity/transfer
GJGibbs free energy
GPaShear modulus
HPaHardness
IACurrent
mkgmass
NmolNumber of moles of active species
QJHeat
SJ/K, J/m3 KEntropy or entropy content (density)
S J/K, J/m3 KEntropy generation (density)
tsTime
TKTemperature
T 0 KStandard temperature, e.g., 298 K
UJInternal energy
vVVoltage
Vm3Volume
WJWork
Greek
α K−1Thermal strain/expansion coefficient
β Pa · K−1Thermal stress coefficient
γ -Shear strain
λ J · mol−1 · K−1Thermo-chemical decay coefficient
μ J · mol−1Chemical potential
ρ kg · m−3Density
τ PaShear stress
Subscripts and acronyms
C(Re)Charge step
DDischarge step
D E G Degradation-Entropy Generation
W , d i s s Work dissipation or dissipated work
d i s s Dissipation
T P E G Transformation-Phenomenological Entropy Generation
T R C Temperature Rise Contribution
μ T , M S T Microstructurothermal
p h e n Phenomenological
r e v Reversible
wWarm
cCool

References

  1. UNEP. Cooling and Climate Change. In United Nations Environment Programme Fact Sheet. 2021. Available online: https://wedocs.unep.org/xmlui/bitstream/handle/20.500.11822/35357/CoolCC.pdf?sequence=1&isAllowed=y (accessed on 10 May 2025).
  2. Huggins, R. Energy Storage; Springer: New York, NY, USA, 2010. [Google Scholar]
  3. Rahn, C.; Wang, C. Battery Systems Engineering; Wiley: Hoboken, NJ, USA, 2013. [Google Scholar]
  4. Mullett, G. Grease lubrication of rolling bearings. Tribology 1973, 6, 21–28. [Google Scholar] [CrossRef]
  5. Lugt, P.M. Grease Lubrication in Rolling Bearings; John Wiley & Sons: West Sussex, UK, 2013. [Google Scholar]
  6. Gałko, G.; Sajdak, M. Trends for the Thermal Degradation of Polymeric Materials: Analysis of Available Techniques, Issues, and Opportunities. Appl. Sci. 2022, 12, 9138. [Google Scholar] [CrossRef]
  7. Bandhauer, T.M.; Garimella, S.; Fuller, T.F. A Critical Review of Thermal Issues in Lithium-Ion Batteries. J. Electrochem. Soc. 2011, 158, R1. [Google Scholar] [CrossRef]
  8. Jiang, Z.; Xuan, W.; Ma, R.; Xu, C.; Yu, B.; Wang, D.; Shi, J.; Chen, J. A high-efficiency immersion cooling system with integrated flow distribution plates for vehicle-scale high-energy-density battery modules. Energy 2025, 330, 136885. [Google Scholar] [CrossRef]
  9. Tatterson, A.J.; Hahn, A.G.; Martini, D.T.; Febbraio, M.A. Effects of heat stress on physiological responses and exercise performance in elite cyclists. J. Sci. Med. Sport 2000, 3, 186–193. [Google Scholar] [CrossRef]
  10. Périard, J.D.; Eijsvogels, T.M.H.; Daanen, H.A.M. Exercise under heat stress: Thermoregulation, hydration, performance implications, and mitigation strategies. Physiol. Rev. 2021, 101, 1873–1979. [Google Scholar] [CrossRef] [PubMed]
  11. Liu, Y.; Chen, W.; Jiang, D. Review on Heat Generation of Rubber Composites. Polymers 2023, 15, 2. [Google Scholar] [CrossRef]
  12. Amiri, M.; Khonsari, M. Life prediction of metals undergoing fatigue load based on temperature evolution. Mater. Sci. Eng. A 2010, 527, 1555–1559. [Google Scholar] [CrossRef]
  13. Fouvry, S.; Kapsa, P.; Zahouani, H.; Vincent, L. Wear analysis in fretting of hard coatings through a dissipated energy concept. Wear 1997, 203–204, 393–403. [Google Scholar] [CrossRef]
  14. Doelling, K.L.; Ling, F.F.; Bryant, M.D.; Heilman, B.P. An experimental study of the correlation between wear and entropy flow in machinery components. Am. Inst. Phys. 2000, 88, 2999–3003. [Google Scholar] [CrossRef]
  15. Sathwik Chatra, K.; Osara, J.A.; Lugt, P.M. Thermo-mechanical aging during churning in grease lubricated bearings and its impact on grease life. Tribol. Int. 2023, 181, 108248. [Google Scholar] [CrossRef]
  16. Lugt, P.M. On the use of the Arrhenius equation to describe the impact of temperature on grease life. Tribol. Int. 2023, 179, 108142. [Google Scholar] [CrossRef]
  17. Osara, J.A.; Bryant, M.D. A temperature-only system degradation analysis based on thermal entropy and the degradation-entropy generation methodology. Int. J. Heat Mass Transf. 2020, 158, 120051. [Google Scholar] [CrossRef]
  18. Osara, J.A.; Bryant, M.D. Methods to Calculate Entropy Generation. Entropy 2024, 26, 237. [Google Scholar] [CrossRef] [PubMed]
  19. Osara, J.A.; Bryant, M.D. Systems and Methods for Transformation and Degradation Analysis. Entropy 2024, 26, 454. [Google Scholar] [CrossRef]
  20. Callen, H. Thermodynamics and an Introduction to Thermostatistics, 2nd ed.; John Wiley and Sons: Now York, NY, USA, 1985. [Google Scholar]
  21. Burghardt, M.D.; Harbach, J.A. Engineering Thermodynamics; HarperCollins College Publishers: London, UK, 1993. [Google Scholar]
  22. Bejan, A. Advanced Engineering Thermodynamics; John Wiley & Sons: Hoboken, NJ, USA, 2016. [Google Scholar]
  23. Moran, M.; Shapiro, H.; Boettner, D.; Bailey, M. Fundamentals of Engineering Thermodynamics, 9th Edition EPUB Reg Card Loose-Leaf Print Companion Set; Wiley: Hoboken, NJ, USA, 2018. [Google Scholar]
  24. Pal, R. Demystification of the Gouy-Stodola theorem of thermodynamics for closed systems. Int. J. Mech. Eng. Educ. 2017, 45, 142–153. [Google Scholar] [CrossRef]
  25. Osara, J.A. Thermodynamics of Manufacturing Processes—The Workpiece and the Machinery. Inventions 2019, 4, 28. [Google Scholar] [CrossRef]
  26. Osara, J.A.; Bryant, M.D. Thermodynamics of Lead-Acid Battery Degradation: Application of the Degradation-Entropy Generation Methodology. J. Electrochem. Soc. 2019, 166, A4188. [Google Scholar] [CrossRef]
  27. Prigogine, I. Introduction to Thermodynamics of Irreversible Processes; John Wiley & Sons: Now York, NY, USA, 1968. [Google Scholar]
  28. Wang, Q.; Mao, B.; Stoliarov, S.I.; Sun, J. A review of lithium ion battery failure mechanisms and fire prevention strategies. Prog. Energy Combust. Sci. 2019, 73, 95–131. [Google Scholar]
  29. Lim, C.L. Fundamental Concepts of Human Thermoregulation and Adaptation to Heat: A Review in the Context of Global Warming. Int. J. Environ. Res. Public Health 2020, 17, 7795. [Google Scholar] [CrossRef] [PubMed]
  30. Naderi, M.; Khonsari, M. An experimental approach to low-cycle fatigue damage based on thermodynamic entropy. Int. J. Solids Struct. 2010, 47, 875–880. [Google Scholar] [CrossRef]
  31. Ouyang, M.; Ren, D.; Lu, L.; Li, J.; Feng, X.; Han, X.; Liu, G. Overcharge-induced capacity fading analysis for large format lithium-ion batteries with LiyNi1/3Co1/3Mn1/3O2+LiyMn2O4 composite cathode. J. Power Sources 2015, 279, 626–635. [Google Scholar] [CrossRef]
  32. Onsager, L. Reciprocal Relations in Irreversible Processes. I. Phys. Rev. 1931, 37, 405–426. [Google Scholar] [CrossRef]
  33. Pauli, W. Thermodynamics and the Kinetic Theory of Gases; DOVER PUBLICATIONS, INC.: Mineola, NY, USA, 2000; Volume 3. [Google Scholar]
  34. Bryant, M.D.; Khonsari, M.M.; Ling, F.F. On the thermodynamics of degradation. Proc. R. Soc. A 2008, 464, 2001–2014. [Google Scholar] [CrossRef]
  35. Boles, M.; Yunus, A.; Cengel, D. Thermodynamics: An Engineering Approach; McGraw-Hill Education: Columbus, OH, USA, 2014. [Google Scholar]
  36. Borgnakke, C.; Sonntag, R. Fundamentals of Thermodynamics; John Wiley & Sons: Hoboken, NJ, USA, 2020. [Google Scholar]
  37. Osara, J.A.; Bryant, M.D. Performance and degradation characterization of electrochemical power sources using thermodynamics. Electrochim. Acta 2021, 365, 137337. [Google Scholar] [CrossRef]
  38. Osara, J.A.; Bryant, M.D. Thermodynamics of grease degradation. Tribol. Int. 2019, 137, 433–445. [Google Scholar] [CrossRef]
  39. Nielsen, B.; Hales, J.R.; Strange, S.; Christensen, N.J.; Warberg, J.; Saltin, B. Human circulatory and thermoregulatory adaptations with heat acclimation and exercise in a hot, dry environment. J. Physiol. 1993, 460, 467–485. [Google Scholar] [CrossRef] [PubMed]
  40. Rohatgi, A. WebPlotDigitizer: Version 4.8. Available online: https://apps.automeris.io/wpd4/ (accessed on 18 May 2024).
  41. Xiaojiang Xu, T.P.R.; Castellani, M.P. The specific heat of the human body is lower than previously believed: The journal Temperature toolbox. Temperature 2023, 10, 235–239. [Google Scholar] [CrossRef]
  42. Stular, L. Body Size of Professional Cyclists (Weight, Height, BMI). Available online: https://cyclingbeginner.com/body-size-of-professional-cyclists-weight-height-bmi/ (accessed on 20 May 2024).
  43. Ike, C.U. The Effect of Temperature on the Performance of A Photovoltaic Solar System In Eastern Nigeria. Int. J. Eng. Sci. 2013, 3, 10–14. [Google Scholar]
  44. Abdelmohsen, H.S.; Alrashedy, A.; Abdelhady, S.; Rekaby, A. Enhancing PV performance using a novel water jacket and humidified air-cooling systems in arid climates. Appl. Therm. Eng. 2025, 278, 127259. [Google Scholar] [CrossRef]
  45. Osara, J.A.; Ezekoye, O.A.; Marr, K.C.; Bryant, M.D. A methodology for analyzing aging and performance of lithium-ion batteries: Consistent cycling application. J. Energy Storage 2021, 42, 103119. [Google Scholar] [CrossRef]
  46. Alvarez-Monteserin, J.; Sanz-Bobi, M. An Online Fade Capacity Estimation of Lithium-Ion Battery Using a New Health Indicator Based Only on a Short Period of the Charging Voltage Profile. IEEE Access 2022, 10, 11138–11146. [Google Scholar] [CrossRef]
  47. Lijesh, K.; Khonsari, M. A thermodynamic approach for characterizing the degradation of Li-ion batteries. J. Energy Storage 2024, 82, 110565. [Google Scholar] [CrossRef]
  48. Aghdam, A.; Khonsari, M. Prediction of wear in grease-lubricated oscillatory journal bearings via energy-based approach. Wear 2014, 318, 188–201. [Google Scholar] [CrossRef]
  49. Amiri, M.; Khonsari, M.M. On the Thermodynamics of Friction and Wear—A Review. Entropy 2010, 12, 1021–1049. [Google Scholar] [CrossRef]
  50. Dokter, J.; Osara, J.A. On the Thermal Degradation of Lubricant Grease: Experiments. J. Tribol. 2025, 147, 091119. [Google Scholar] [CrossRef]
  51. Cen, H.; Laurentis, N.D.; Bader, N.; Lugt, P.M. Effect of thermal aging on the grease film thickness in ball bearings. Tribol. Int. 2025, 204, 110511. [Google Scholar] [CrossRef]
  52. Dokter, J.; Osara, J.A. On the Thermal Degradation of Lubricant Grease: Degradation Analysis. ASME J. Tribol. 2025; in print. [Google Scholar]
  53. Zhang, Y.; Xu, J.; Yang, S.; Deng, C.; Chen, F.; Lei, F. Battery module capacity fade model based on cell voltage inconsistency and probability distribution. Adv. Mech. Eng. 2017, 9, 1687814017730757. [Google Scholar] [CrossRef]
  54. Grandjean, T.R.B.; Groenewald, J.; McGordon, A.; Widanage, W.D.; Marco, J. Accelerated Internal Resistance Measurements of Lithium-Ion Cells to Support Future End-of-Life Strategies for Electric Vehicles. Batteries 2018, 4, 49. [Google Scholar] [CrossRef]
  55. Akchurin, A.; van den Ende, D.; Lugt, P.M. Modeling impact of grease mechanical ageing on bleed and permeability in rolling bearings. Tribol. Int. 2022, 170, 107507. [Google Scholar] [CrossRef]
  56. Meijer, R.J.; Lugt, P.M. The Grease Worker and Its Applicability to Study Mechanical Aging of Lubricating Greases for Rolling Bearings. Tribol. Trans. 2022, 65, 32–45. [Google Scholar] [CrossRef]
  57. Bejan, A.; Tsatsaronis, G.; Moran, M.J. Thermal Design and Optimization; John Wiley and Sons: Hoboken, NJ, USA, 1995. [Google Scholar]
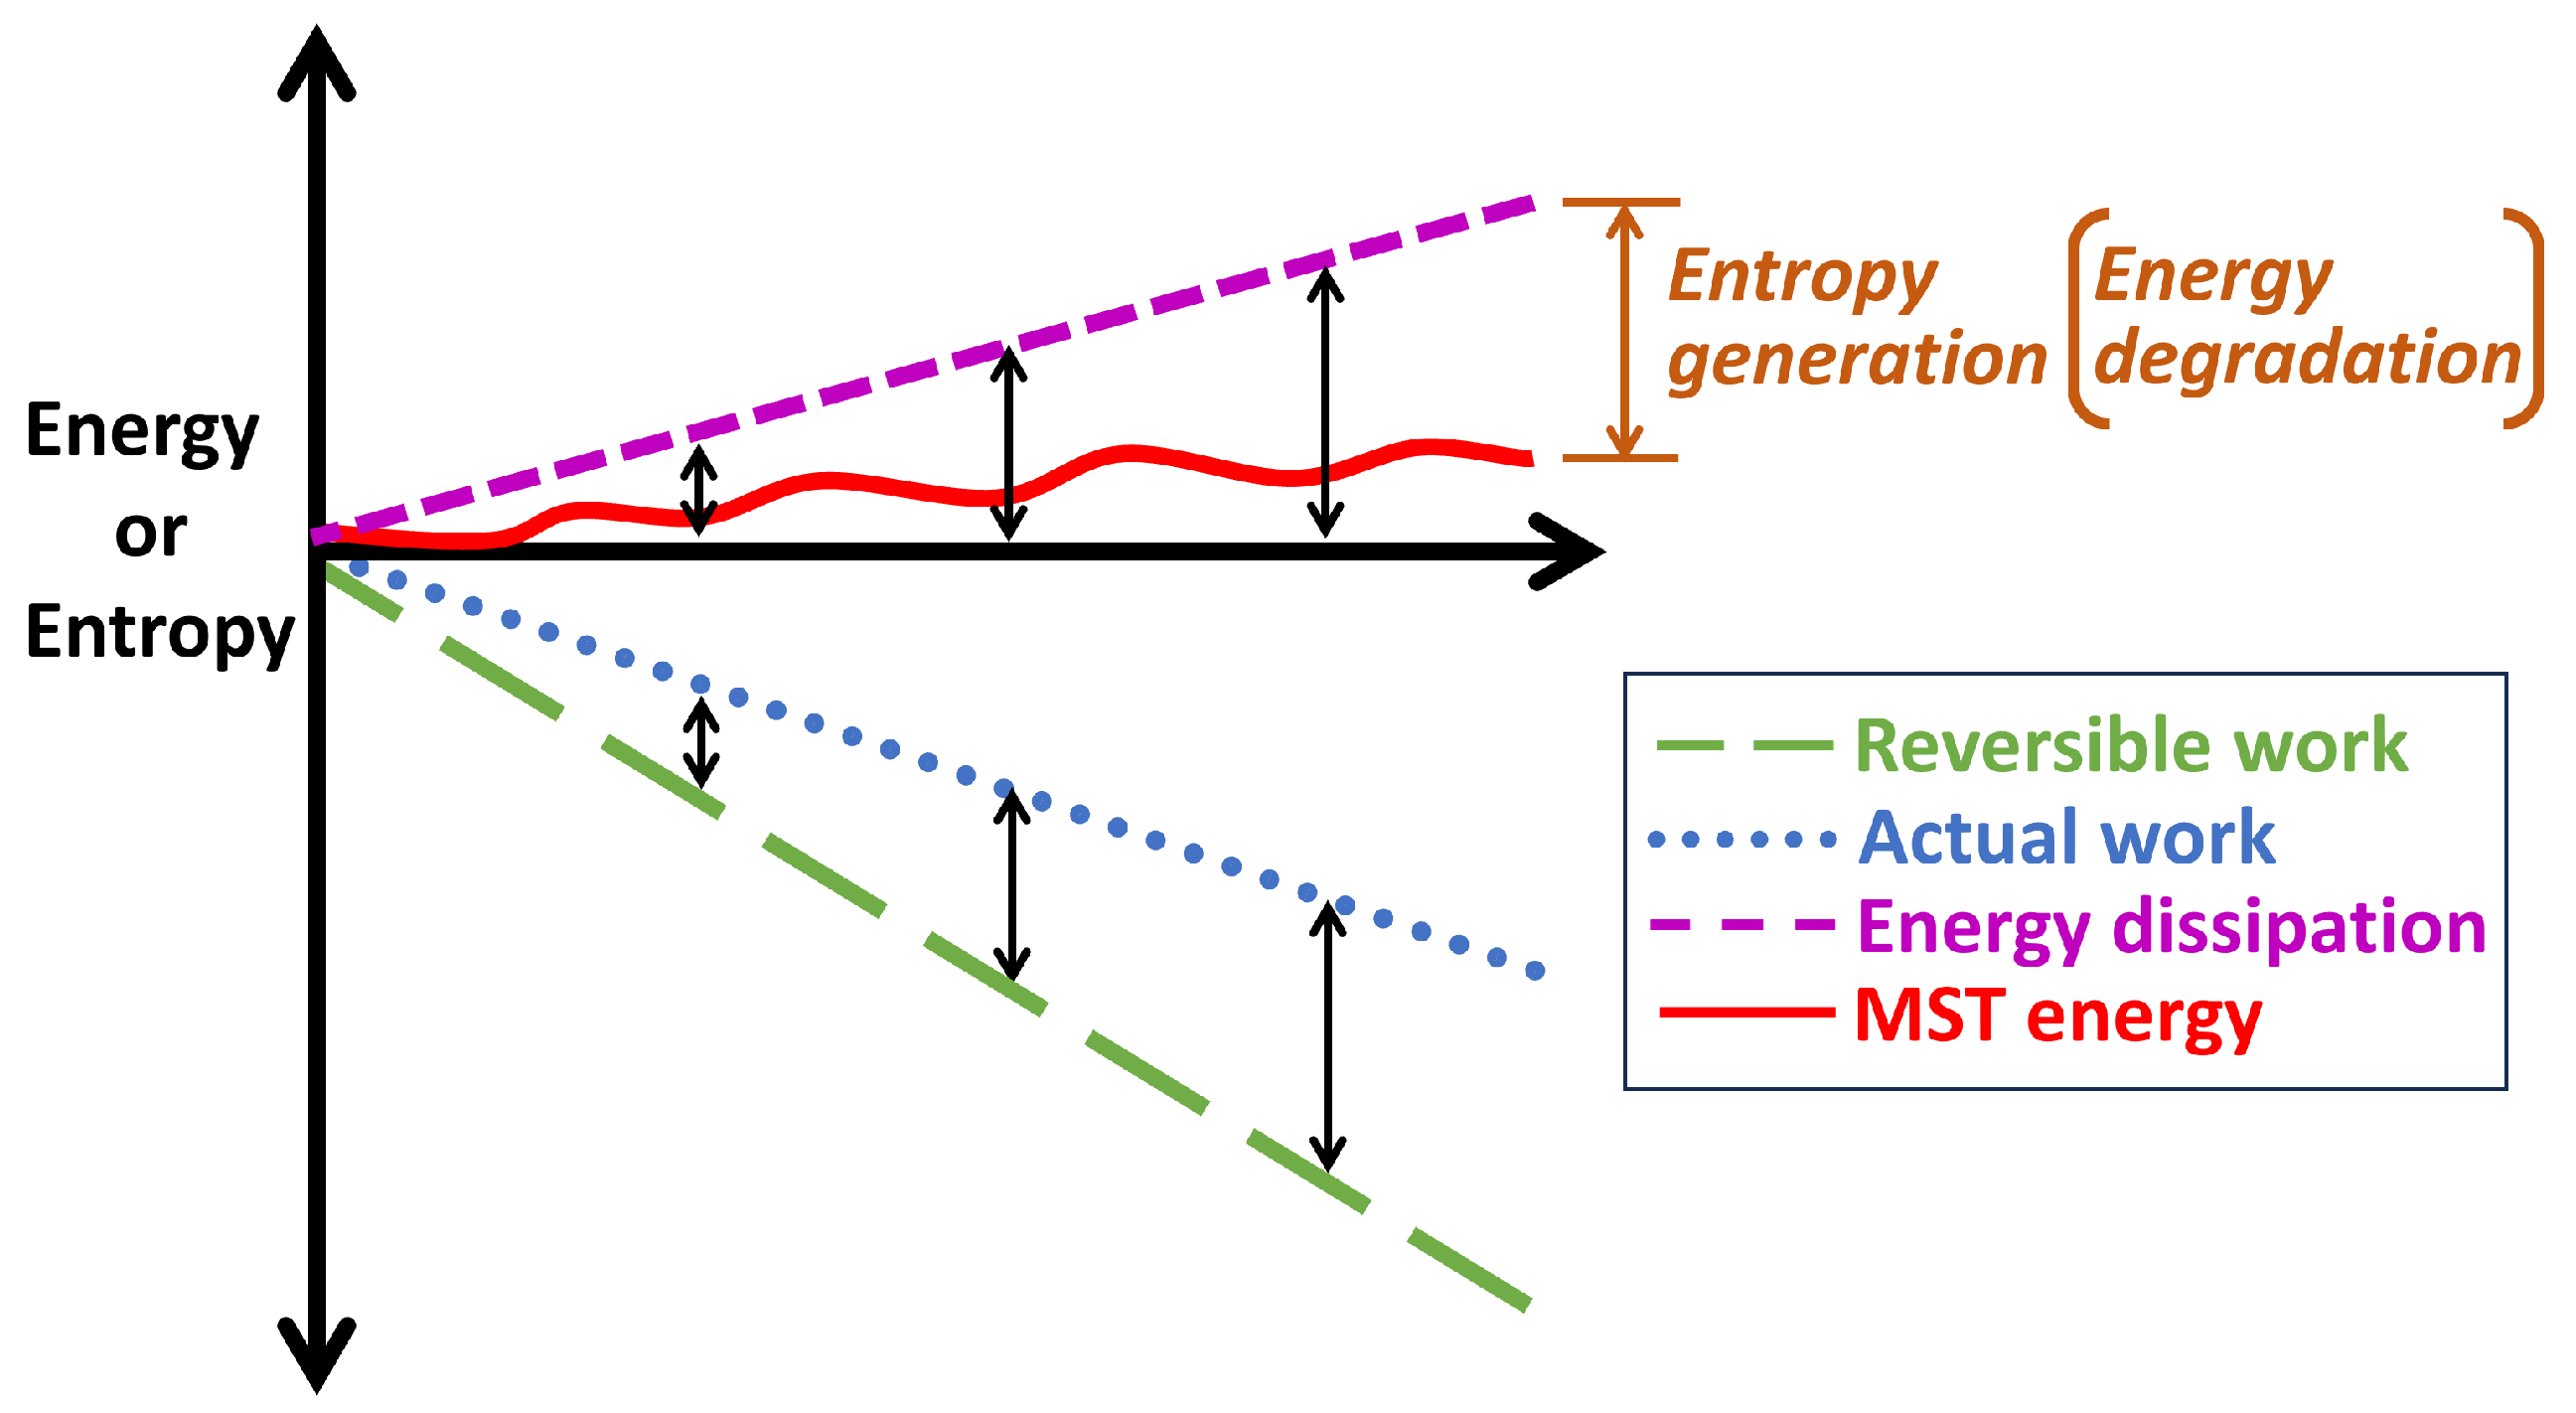
Figure 1. Illustrations of Equations (6)–(10) for a loaded/in-use system, depicting reversible/maximum work (long green dashes) and actual work (blue dots), the difference—shown by the black arrows—of which yields energy dissipation (or exergy destruction) (short pink dashes). Then, energy degradation is the difference between energy dissipation and MST energy storage (red line).
Applmech 06 00062 g001
Figure 4. (a) Phenomenological entropy generation (PEG) terms (Work S W and MST S μ T entropies) during 30 min cycling by elite athletes in warm w (32 °C) and cool c (23 °C) environments. (b) Transformation-Phenomenological Entropy Generation (TPEG) space traversed by the cyclists’ hearts during the self-paced cycling activities.
Applmech 06 00062 g004
Figure 5. (a) Entropy generation (EG) terms (dissipated work S W , d i s s and MST S μ T entropies) during 30 min self-paced cycling by elite athletes in warm w and cool c environments. (b) Degradation-Entropy Generation (DEG) space traversed by the cyclists’ hearts during the exercises in both environments.
Applmech 06 00062 g005
Figure 6. Instantaneously monitored battery parameters during discharge and recharge of a Samsung 3.6 V 2.5 Ah lithium-ion battery. Reproduced with permission from [45].
Applmech 06 00062 g006
Figure 7. (a) Phenomenological entropy terms ( S W and S μ T ) during one cycle’s discharge and recharge of a 3.6 V 2.5 Ah lithium-ion battery, (b) TPEG space traversed by the discharge and (c) recharge trajectories and their transformation hyperplanes. The arrows show process directions. The shaded region in the (a) plot is the “battery settling” step between discharge and recharge.
Applmech 06 00062 g007
Figure 8. (a) Entropy generation terms ( S W , d i s s and S μ T ) versus time during one selected discharge and recharge cycle of a 3.6 V 2.5 Ah lithium-ion battery. DEG space traversed by the (b) discharge and (c) recharge trajectories and their degradation hyperplanes. The arrows show process directions.
Applmech 06 00062 g008
Figure 9. (a) Power dissipated, (b) temperature, and (c) wear rate recorded for 27 separate boundary- and mixed-lubricated oscillating journal bearing tests. Reproduced with permission from [48]. The lines are visual aids to indicate sequence, not continuity.
Applmech 06 00062 g009
Figure 10. (a) Entropy generation terms ( S W , d i s s and S μ T ) evaluated for the journal bearing wear tests. (b) Degradation-Entropy Generation model fitted with the data from all 27 discrete tests.
Applmech 06 00062 g010
Figure 11. Percentage contribution of the temperature rise mechanism TRC in the journal bearing wear tests.
Applmech 06 00062 g011
Figure 12. Measured parameters during shearing of two lubricant greases, #4 (NLGI 4)—dotted lines—and #2 (NLGI 2)—continuous lines. Reproduced with permission from reference [38].
Applmech 06 00062 g012
Figure 13. Entropy generation density terms ( S W , d i s s and S μ T ) during mechanical shearing of lubricating greases (a) #4 (NLGI 4 helicopter grease) and #2 (NLGI 2 automotive grease). (b) DEG space traversed by both greases and their respective hyperplanes, slopes of which give the degradation coefficients. The higher-consistency and higher-viscosity #4 grease is more dissipative and has higher thermally induced stress response than the #2 grease.
Applmech 06 00062 g013
Table 1. Process categories, transformation and degradation directions, theoretical coefficient signs, and typical examples.
ProcessTransformationDegradationExamples
w phen sgn ( B W ) sgn ( B μ T ) w sgn ( B W , diss ) sgn ( B μ T , diss )
System useDecreasing+1+1Increasing+1−1Discharging battery
( { S W , S μ T } < 0 ) Decreasing−1+1Dissipative structure
System formationIncreasing+1+1Decreasing−1−1Growth, healing
( { S W , S μ T } > 0 ) Increasing+1+1Fast charging battery
Disclaimer/Publisher’s Note: The statements, opinions and data contained in all publications are solely those of the individual author(s) and contributor(s) and not of MDPI and/or the editor(s). MDPI and/or the editor(s) disclaim responsibility for any injury to people or property resulting from any ideas, methods, instructions or products referred to in the content.