Article

The Influence of Sheet Layer Combination Modes on Mechanical Property of Self-Piercing Riveting Joint in Three-Layer Sheets

1
State Key Laboratory of Advanced Design and Manufacturing for Vehicle Body, Hunan University, Changsha 410082, China
2
State Key Laboratory of Featured Metal Materials and Life-Cycle Safety for Composite Structures, Guangxi University, Nanning 530004, China
*
Author to whom correspondence should be addressed.
Appl. Mech. 2025, 6(3), 51; https://doi.org/10.3390/applmech6030051
Submission received: 8 April 2025 / Revised: 11 June 2025 / Accepted: 28 June 2025 / Published: 3 July 2025

Abstract

Unlike previous studies focusing on two-layer structures or single-parameter effects, this work systematically investigates the influence of sheet layer combination modes on the mechanical properties of three-layer AA6063-T6 self-piercing riveting (SPR) joints through a combination of experimental testing and numerical simulation. Shear and cross-tensile tests were conducted on three-layer AA6063-T6 SPR joints with three distinct sheet layer combinations: T1 (top/middle: 100 × 40 mm2, bottom: 40 × 40 mm2), T2 (top/bottom: 100 × 40 mm2, middle: 40 × 40 mm2), and T3 (middle/bottom: 100 × 40 mm2, top: 40 × 40 mm2). Experimental results reveal significant differences in joint strength and failure modes across the three combinations. T3 joints exhibited the highest shear strength (9.16 kN) but the lowest cross-tensile strength (3.56 kN), whereas T1 joints showed the highest cross-tensile strength (4.97 kN) but moderate shear strength (8.76 kN). A high-fidelity finite element model was developed to simulate the SPR joint under varying sheet layer combinations, incorporating precise geometric details (0.25 mm mesh at critical zones) and advanced contact algorithms (friction coefficient μ = 0.2). Numerical simulations revealed the stress distribution and failure mechanisms under shear and cross-tensile loading, aligning well with experimental observations. Analysis highlights that the mechanical performance of the joint is governed by two key factors: (1) the stress redistribution in sheet layers due to combination mode variations, and (2) the interlocking strength between the rivet and sheets. These findings provide practical guidelines for optimizing sheet layer combinations in lightweight automotive structures subjected to mixed loading conditions.

1. Introduction

According to the International Energy Agency (IEA), the global vehicle population reached 1.4 billion in 2023, with China accounting for over 300 million vehicles The rapid growth of motor vehicles has exacerbated energy consumption and environmental pollution. Automotive lightweight design, which reduces vehicle mass by 10–20% (F. Del Pero et al., 2020 [1]), is a critical strategy by which to enhance fuel efficiency and reduce CO2 emissions. In view of the low density and high specific strength of aluminum alloy, its application in vehicle bodies has become an effective solution for achieving lightweight vehicle structures. However, aluminum’s low melting point (660 °C) and high thermal conductivity (237 W/mK) make it prone to welding defects such as porosity and lack of fusion. These defects reduce the fatigue strength of welded joints by up to 30%, limiting their reliability in safety-critical vehicle components [2]. Self-piercing riveting (SPR), a cold-forming process without heat input, avoids thermal-induced defects like porosity and distortion. This makes SPR a preferred joining method for aluminum alloys in automotive applications, particularly for multi-layered structures where welding is challenging [3].
In recent years, researchers have conducted extensive studies on the self-piercing riveting (SPR) process, focusing on several key areas, including process parameter optimization, the effects of material compatibility and surface treatment, joint performance testing and evaluation. Porcaro et al. [4] conducted numerical simulations and experimental studies on the self-piercing riveting forming process of different aluminum alloy riveted combinations. Amro et al. [5] investigated the damage mechanisms of polymer–metal joints during SPR and explored the effects of riveting velocity on composite layer damage. However, most investigations focus on two-layer joints or single-parameter effects, leaving the influence of sheet layer combination modes in three-layer systems understudied [6,7,8]. Mucha et al. [9] conducted shear and peel tests to determine the effect of different rivet types on the mechanical properties of single-lap riveted joints. Lamba et al. [10] compared the resistance spot welding (RSW) performance of AA5754-O and AA6022-T4 aluminum alloys welded to interstitial-free low carbon steel (LCS), highlighting that AA6022-T4 exhibited superior mechanical properties due to lower contact resistance compared with AA5754-O, which experienced degraded weld quality and weaker joint performance. Han et al. [11] performed shear and peel tests on self-piercing riveted joints of multilayer aluminum sheets with different test specimen structures, confirming the influence of the test specimen structure on joint mechanical properties. Other research also showed that, while existing models (e.g., self-piercing rivet and spot weld models) provide acceptable results, further calibration is needed for three-layered connections and shear-dominated loading cases. In summary, for self-piercing riveted joints, process parameters affect joint forming quality and, consequently, joint mechanical properties [12,13,14]. Additionally, test specimen structure and overlap configuration also influence joint mechanical properties [15,16].
This study addresses this gap by systematically analyzing the mechanical properties of three-layer SPR joints under varying sheet-layer configurations. It combines finite element simulation (Hyper Works/LS-DYNA) and experimental testing (ASTM E8/E8M standards [17]) to investigate the mechanical behavior of three-layer SPR joints under shear and cross-tensile loading. By analyzing stress distribution and failure mechanisms, the work provides guidelines for optimizing sheet layer combinations in automotive lightweight structures.

2. Materials and Methods

2.1. Materials

This study uses aluminum alloy AA6063-T6 with a thickness of 2 mm as the three-layer sheet material for riveting. A rivet made of 4130 alloy steel, with a shank diameter of 5.3 mm and a length of 9 mm, is employed for the riveting process. The mechanical properties of both the aluminum alloy sheets and the rivet are presented in Table 1. The mechanical properties of the aluminum alloy 6063-T6 used in this paper are evaluated in accordance with the ASTM B221 standard [18], while the properties of the steel rivets are determined according to the ASTM A519 standard [19].

2.2. Methods

This study used a combination of experimental testing and numerical simulation to systematically investigate the effects of different plate layer combinations on the mechanical properties of three-layer aluminum alloy 6063-T6 self-piercing riveting joints. The experimental methods mainly include specimen preparation, shear and cross-tensile tests, and result analysis. Numerical simulation is used to supplement the experimental results and deeply analyze the stress distribution and failure process inside the joint. Through these experiments, we can obtain the strength, load displacement curve, and failure mode of the joint under different working conditions.
When conducting mechanical performance testing, we used two main working conditions: shear and cross stretching. As a widely used and standardized testing method, the testing process and device configuration of the shear working conditions are relatively conventional, so this article will not elaborate on the specific testing method. For the cross- stretching condition, the universal testing machine CMT4304 (MTS Systems Corporation, Edina, MN, USA) is used to apply tensile load to the joint specimen. The specimen is clamped at both ends in a specialized fixture of the testing machine, ensuring that the force line passes through the central axis of the specimen to reduce additional stress concentration caused by eccentricity. The fixture design considers avoiding unnecessary constraints or damage to key parts of the joint (such as around rivets), thereby ensuring the effectiveness and accuracy of the test.

2.2.1. Specimen Preparation

The 2 mm thick aluminum alloy sheets are cut into two sizes: 100 mm × 40 mm and 40 mm × 40 mm. Based on the sheet dimensions, three types of sheet layer combination modes are defined for the three-layer sheet self-piercing riveting joint:
T1: The top and middle sheets are 100 mm × 40 mm, and the bottom sheet is 40 mm × 40 mm.
T2: Both the top and bottom sheets are 100 mm × 40 mm, and the middle sheet is 40 mm × 40 mm.
T3: Both the middle and bottom sheets are 100 mm × 40 mm, and the top sheet is 40 mm × 40 mm.
For each combination of layers, we prepared at least five specimens to ensure the reliability of the data, and the schematic diagrams of force distribution for these configurations under shear and cross-tensile conditions are shown in Figure 1. Specifically, we find the following:
T1: The middle sheet is clamped, and the top sheet is stretched.
T2: The bottom sheet is clamped, and the top sheet is stretched.
T3: The bottom sheet is clamped, and the middle sheet is stretched.
Taking the T1 joint specimen as an example, its geometric dimensions are illustrated in Figure 2. All joint specimens with different sheet layer combination modes are prepared using the EPRESS hydraulic-driven riveting machine (Cypress Systems, Madera, CA, USA), model VTF-75.

2.2.2. Shear and Cross-Tensile Test Results Analysis

The shear and cross-tensile tests in this study were conducted in accordance with ASTM E8/E8M standards. All joint specimens were tested on a universal testing machine (CMT4304) at a tensile speed of 10 mm/min. The strength of joints under shear and cross-tensile conditions for different sheet layer combinations is shown in Figure 3. As can be seen from the figure, under shear conditions, the strength of T3 joints was the highest, reaching 9.16 kN; T1 joints had the next highest strength at 8.76 kN; and T2 joints had the lowest strength at 4.62 kN. Under cross-tensile conditions, T2 joints had the lowest strength at 3.19 kN; T1 joints had the highest strength at 4.97 kN; and T3 joints had an intermediate strength at 3.56 kN.
Figure 4 shows the load–displacement curves of joints under the two working conditions for different sheet layer combinations. By comparing the trends of the curves, it can be observed that, under shear conditions, the load for both T1 and T3 joints increased rapidly in the initial stage, reaching the maximum load with gradually decreasing increments. After reaching the maximum load, T1 and T3 joints continued to bear the shear force, with the load gradually decreasing until the joint ultimately failed. The failure displacement for these joints was relatively large. In contrast, T2 joints exhibited lower stiffness, with significantly different behavior compared with T1 and T3 joints. The load increase was relatively small in the initial stage, and, after reaching the maximum load, the load decreased rapidly, leading to quicker joint failure with a smaller failure displacement. Under cross-tensile conditions, the load increments for all three sheet layer combinations in the initial stage were similar. However, all joints failed immediately after reaching the maximum load. Among these, T1 joints had the largest failure displacement, while T3 joints had the smallest failure displacement. Therefore, considering the results from both shear and cross-tensile tests, joints with different sheet layer combinations exhibit varying strength and failure displacement under the two working conditions.

2.2.3. Failure Modes of Joints Under Shear and Cross-Tensile Conditions

Figure 5 illustrates the failure modes of joints with different sheet layer combinations under shear conditions. For the T1 joint, the failure mode involves the upper sheet being pulled out from the rivet, while the rivet maintains the connection between the middle and lower sheets, as shown in Figure 5a. For the T2 joint, the failure mode is characterized by the rivet being pulled out from the lower sheet, as shown in Figure 5b. Additionally, there are scratches at the riveting location on the lower plate due to the pulling-out action, while the rivet does not fully detach from the upper and middle sheets. The failure mode of the T3 joint is identical to that of the T2 joint, as shown in Figure 5c, with more pronounced scratches at the riveting location on the lower plate.
Figure 6 shows the failure modes of joints under cross-tensile conditions. Consistent with the observations from shear tests, the failure modes of all joints remain the same. For the T1 joint, the failure mode involves the upper sheet being pulled out from the rivet, with the rivet maintaining the connection between the middle and lower sheets, as shown in Figure 6a. For the T2 and T3 joints, the failure mode is characterized by the rivet being pulled out from the lower sheet, as shown in Figure 6b and Figure 6c, respectively. Therefore, based on the failure modes observed under both shear and cross-tensile conditions, it is evident that joints with different sheet layer combinations exhibit distinct failure modes under the same working conditions.

3. Establishment of Joint Fine Finite Element Model

3.1. Establishment of Model

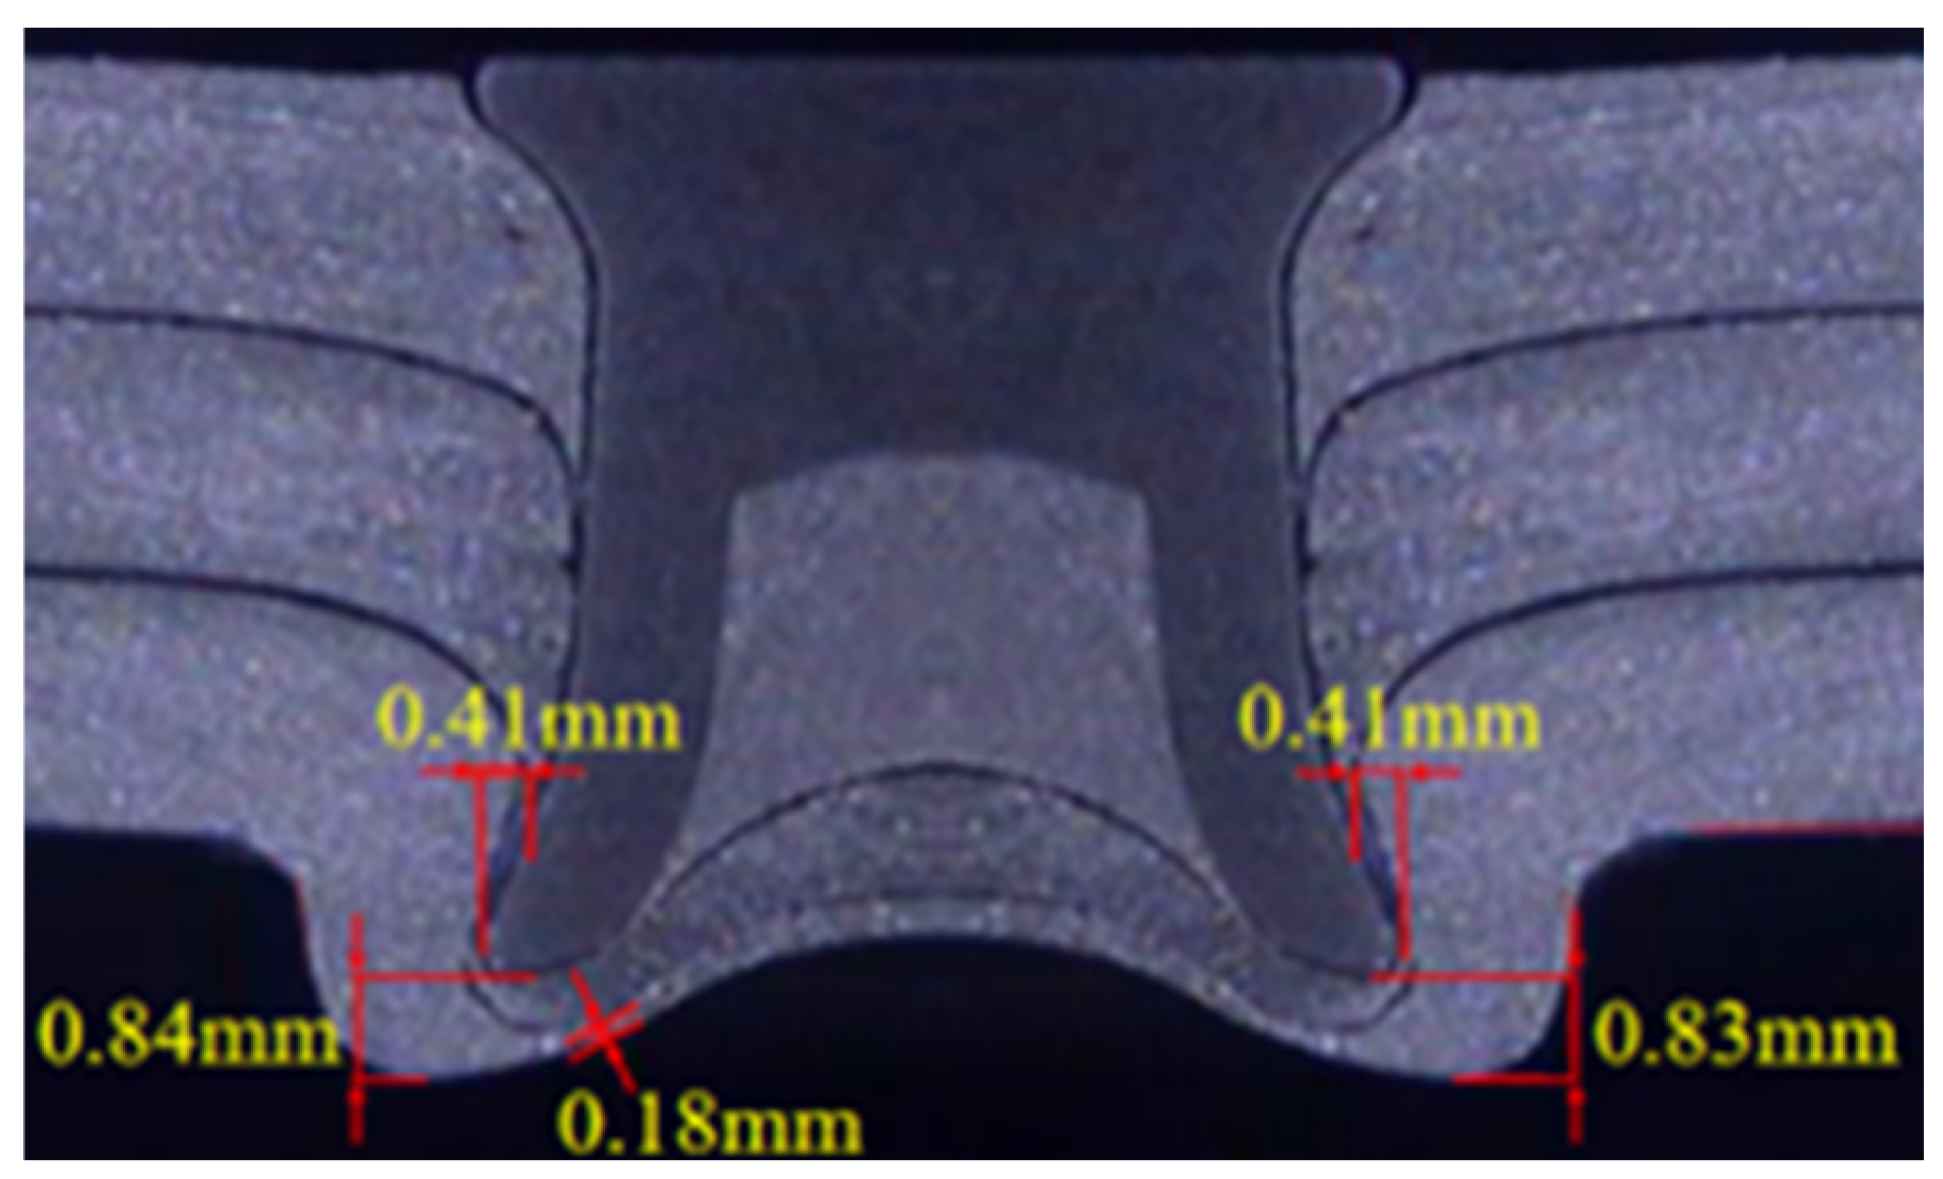
To better understand how different sheet layer combinations affect joint mechanical properties and to analyze the differences among these joints, this study uses the finite element software Hyper Mesh/LS-DYNA (R14.1). Detailed finite element models for various sheet layer combinations are created. Numerical simulations are then conducted to examine the failure processes of joints under both shear and cross-tensile conditions. These analyses help clarify the impact of different sheet layer combinations on joint performance. First, based on the dimensions of the joint forming results, as shown in 
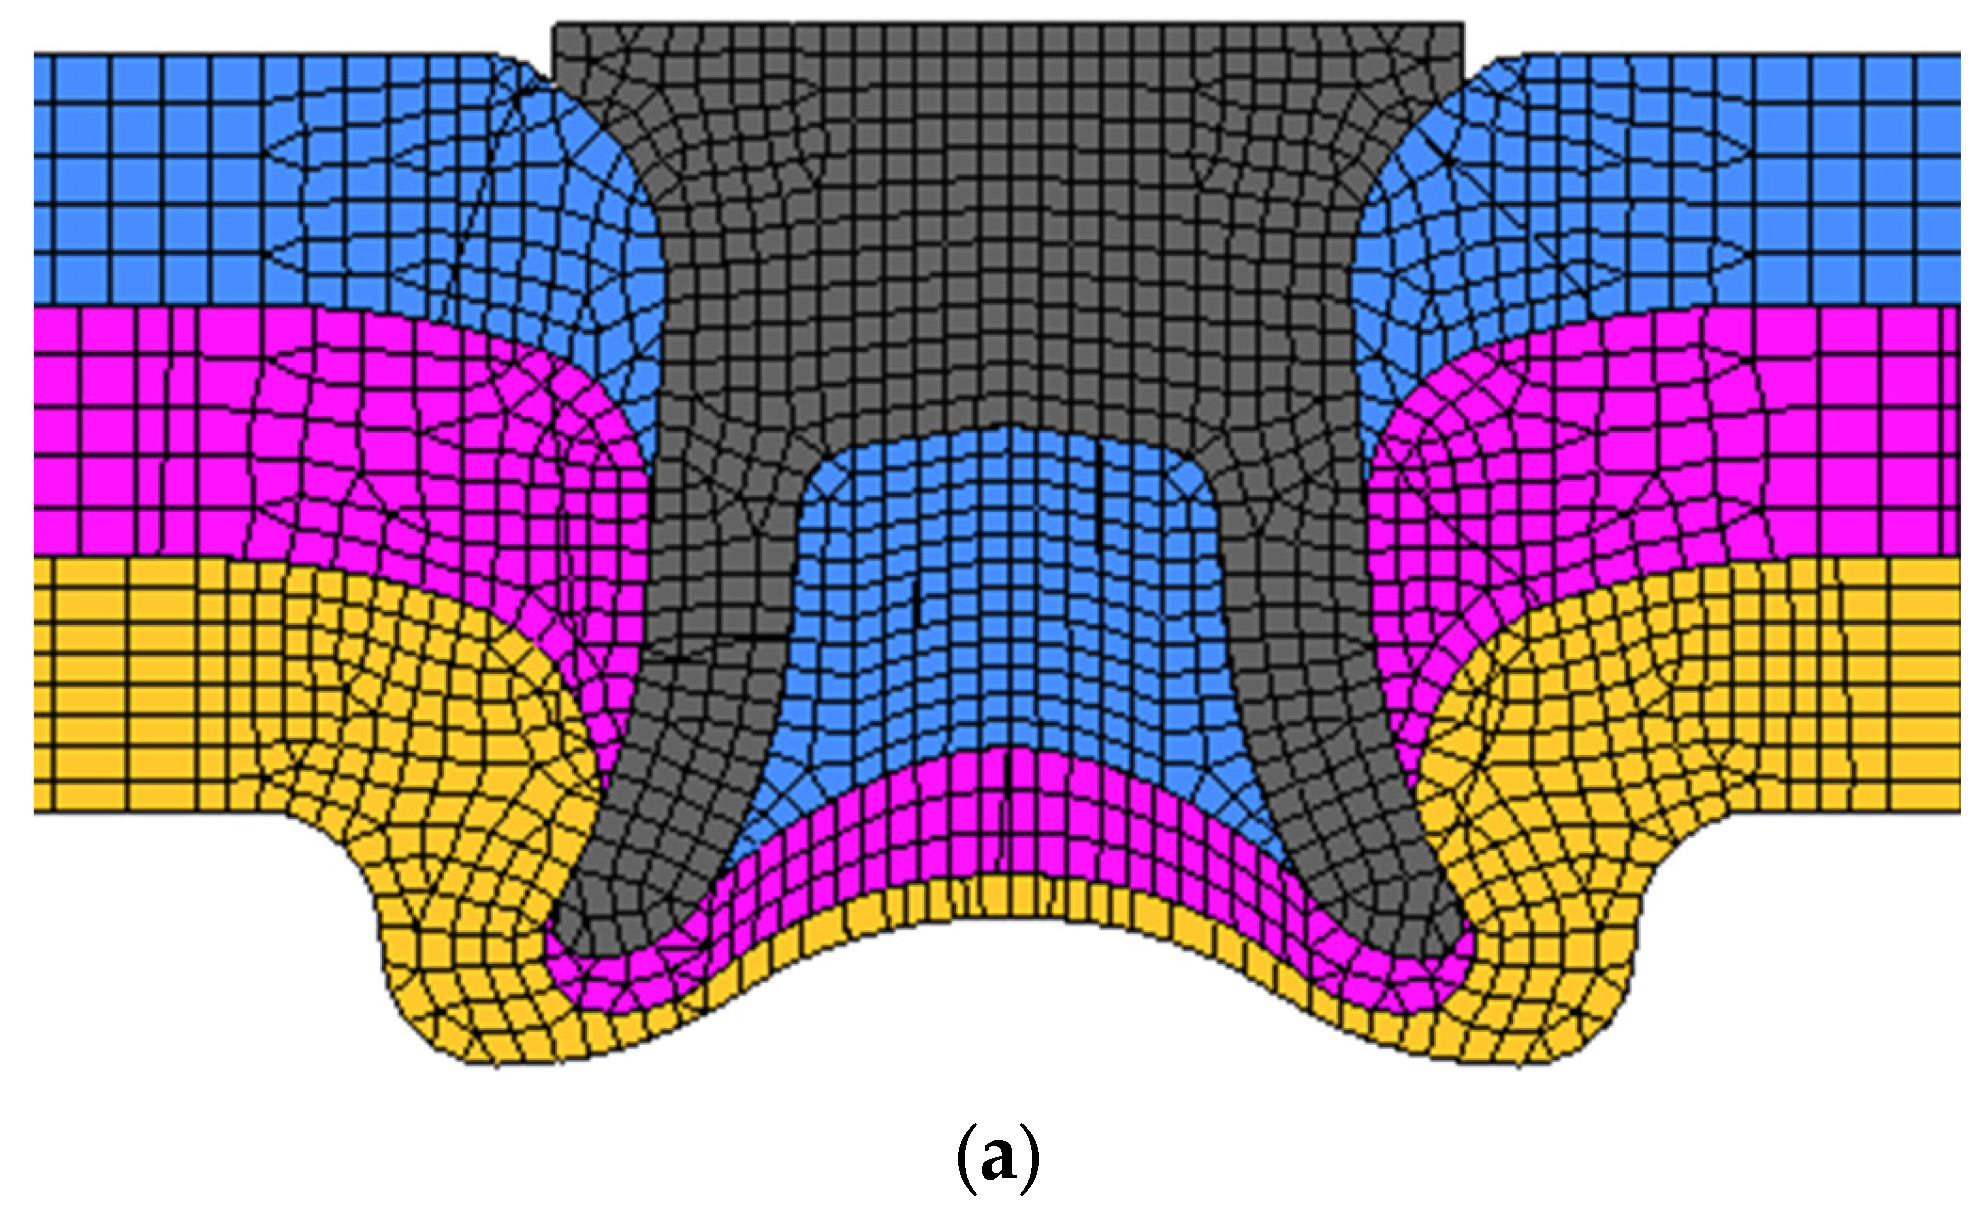
Figure 7, the rivet and sheets are subjected to rotation treatment to generate the three-dimensional solid model of the joint. A geometric model of the test specimen is also established, comprising four components: the rivet, the upper sheet, the middle sheet, and the lower sheet. Next, a meshing process is performed on the model components. The areas where the rivet and sheets are joined are refined with a solid mesh of 0.25 mm, while the remaining parts of the sheets are coarsely meshed with a solid mesh of 1 mm. Material properties are assigned, and a multilinear elastic–plastic material model is employed. The detailed finite element model of the joint is shown in Figure 8. Subsequently, model parameters are set, defining automatic face-to-face contact between model components with a friction coefficient of 0.2. Additional controls, such as solid element control, contact control, hourglass control, and Arbitrary Lagrangian-Eulerian (ALE)control, are implemented. Finally, loading and boundary conditions are defined. The LS-DYNA solver (ANSYS, San Jose, CA, USA) is used to analyze and obtain the failure processes of joints with different sheet layer combinations under the two working conditions.

3.2. Loading and Boundary Conditions

To accurately simulate the loading and constraint situations in actual experimental environments, corresponding boundary conditions and loading methods were set in the finite element model. Specifically, as follows:
Under shear conditions, the bottom of the model (the lowest plate) is completely fixed, limiting its displacement in all directions (UX, UY, UZ = 0) to simulate the actual situation where the lower plate is firmly fixed by the fixture during the experimental process. Apply a uniformly distributed vertical downward force at the center of the top of the upper plate to simulate the effect of shear loads. The magnitude of the force is set according to the actual load in the experiment, and the actual loading process is simulated by gradually increasing it.
For the cross-stretching condition, one end of the model (such as the left end) is fixed, limiting its displacement in the X-axis direction (UX = 0), while allowing free deformation in the Y-axis and Z-axis directions to simulate the situation where one end of the specimen is clamped while the other end is subjected to tension in actual testing. At the other end of the model (such as the right end), a uniformly distributed tensile load is applied along the Y-axis direction, which is also set according to the parameters in the actual experiment and gradually loaded until the specimen fails.
In addition, in order to more accurately reflect the actual working state of the self-piercing riveting joint, the friction coefficient between the contact surfaces was set to 0.2, and physical element control, contact control, hourglass control, and ALE control were set to ensure the effectiveness and accuracy of the simulation results.

3.3. Analysis of Numerical Simulation Results

In all figures showing the results of numerical simulations, the stress values represent true stresses rather than nominal stresses. This is based on the consideration of large deformation behavior in the material model. True stress values are derived from experimental stress–strain curves and are adjusted according to large deformation theory.
The analysis follows the large deformation hypothesis, which accounts for significant geometric changes during loading. To verify the model’s accuracy under practical conditions, preliminary validations were also conducted using small deformation assumptions. A comparison between simulated true stress values and experimental measurements was performed, showing good agreement and confirming the reliability of the simulation approach.

3.3.1. T1 Plate Layer Combination Method for Clamping the Middle Plate and Stretching the Upper Plate

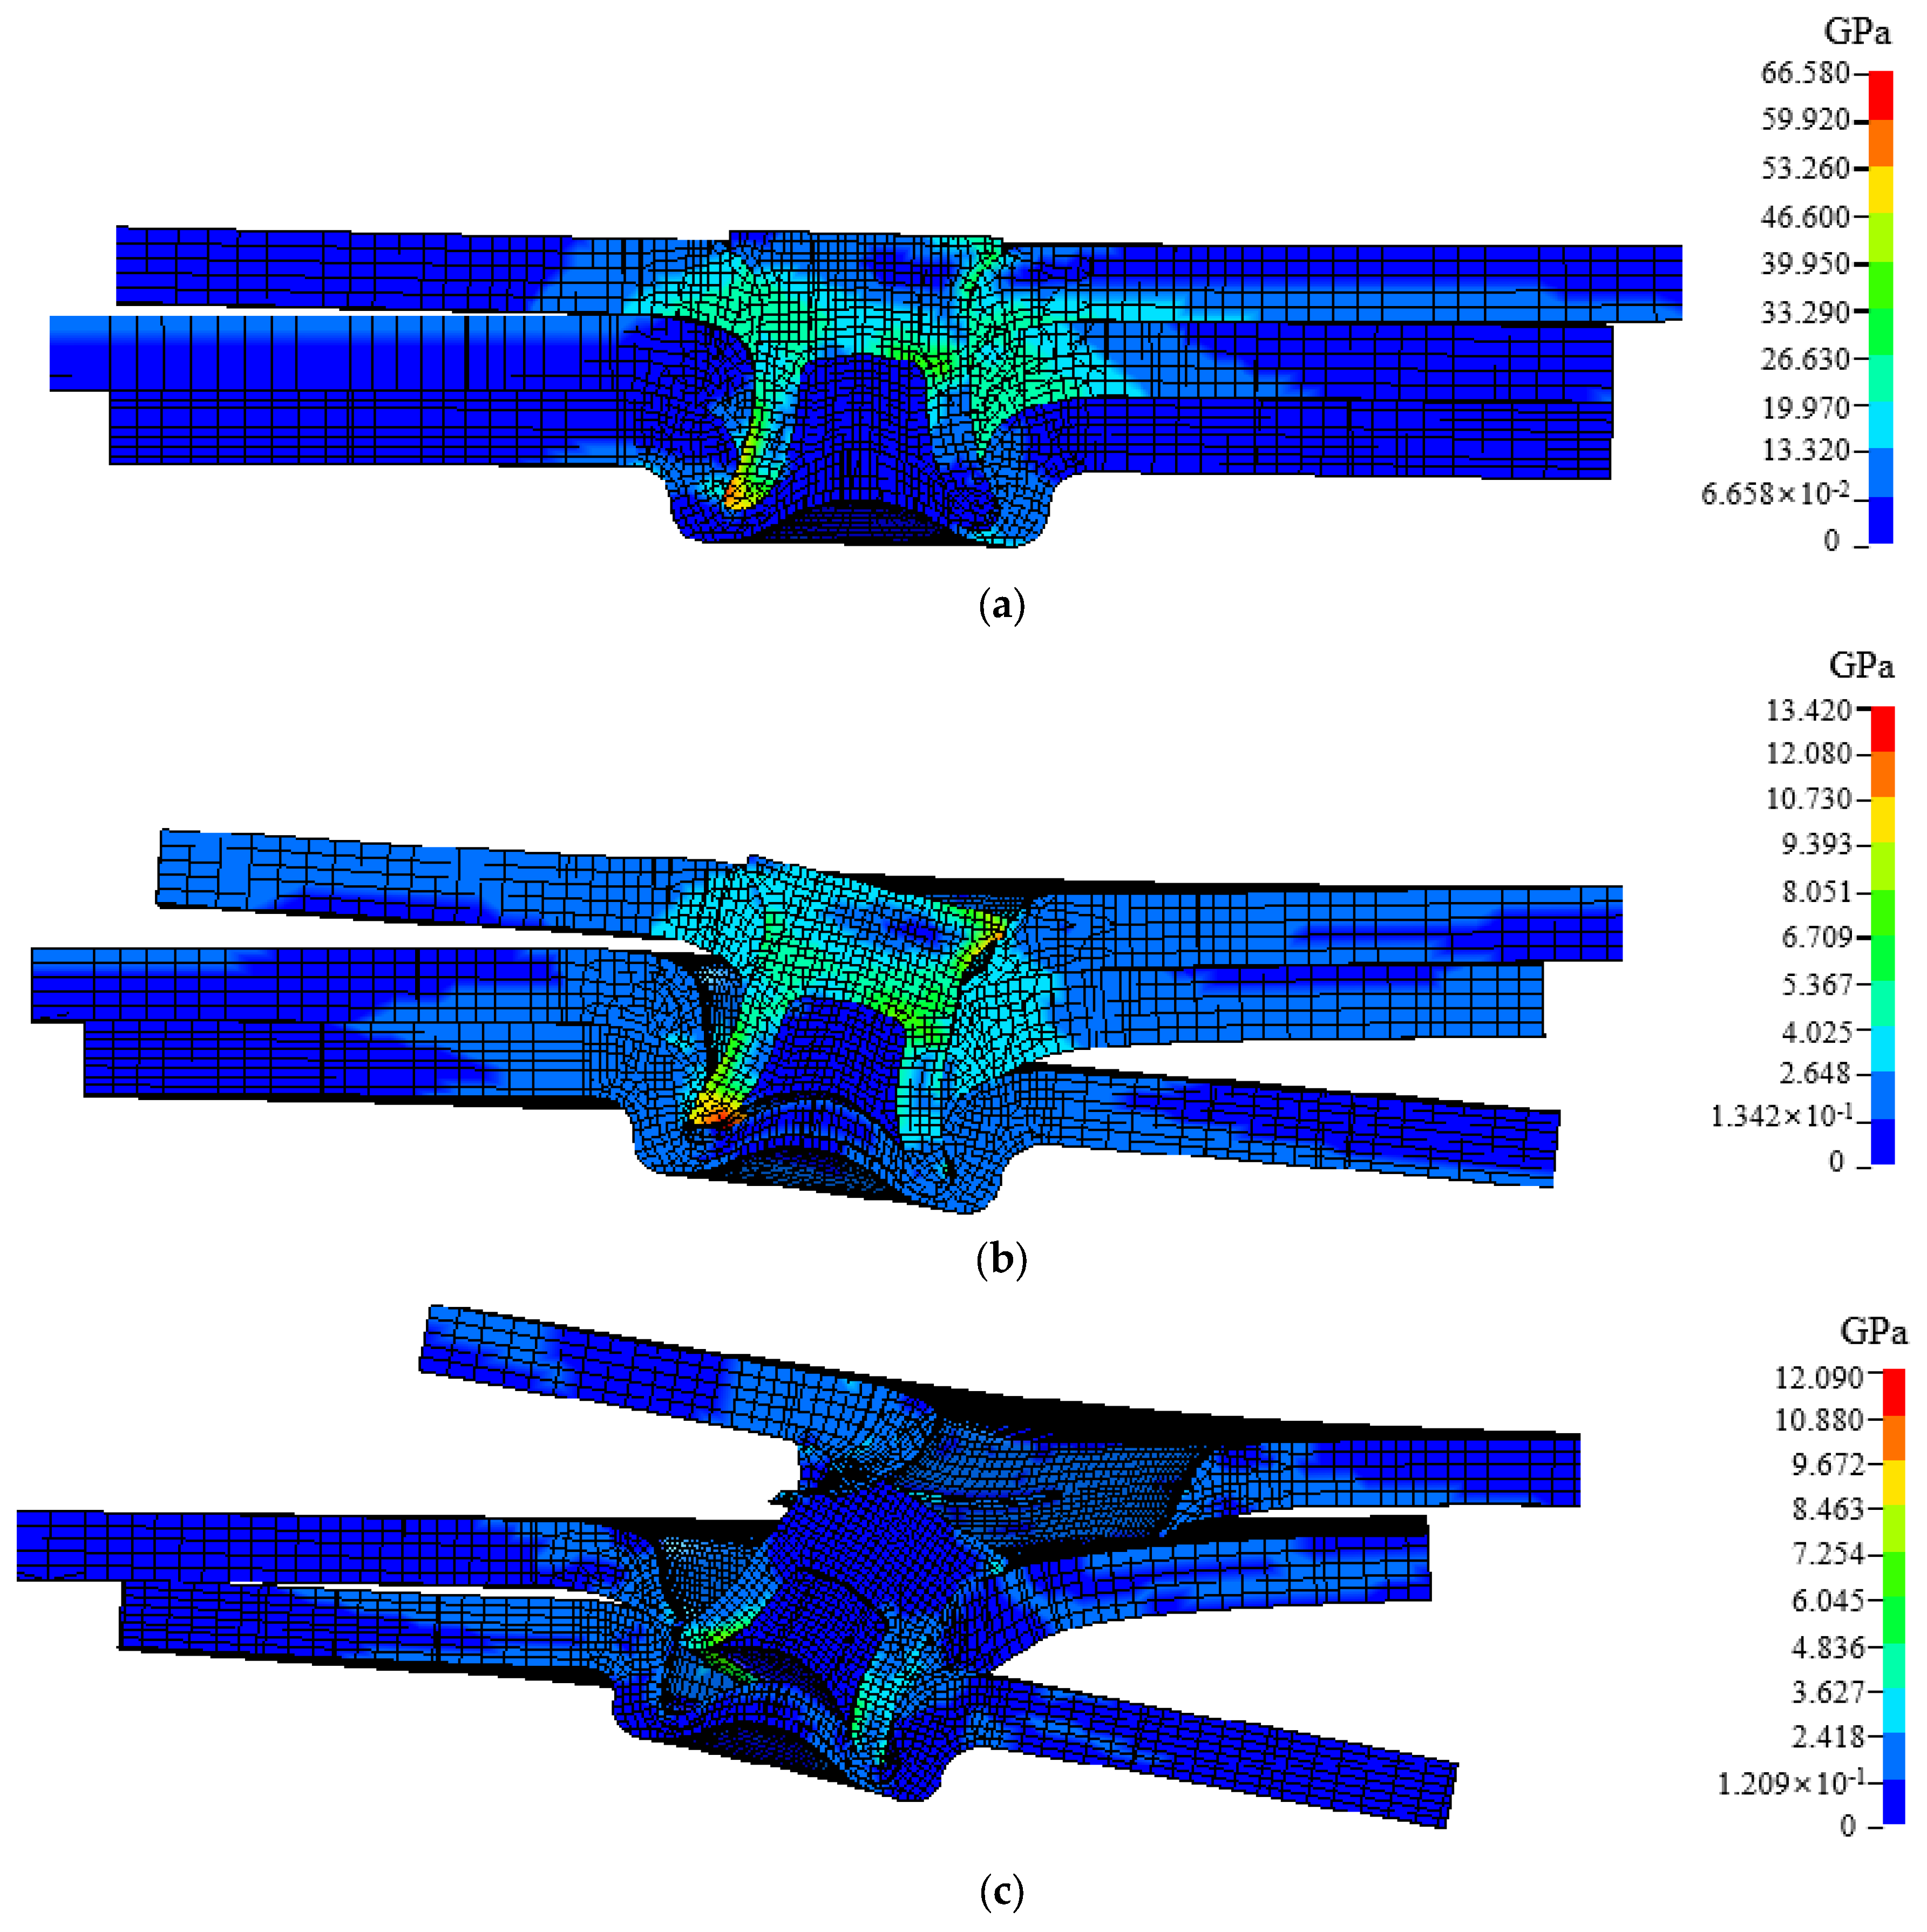
Figure 9 shows the failure process of the T1 plate layer combination joint under shearing conditions. When the stretching begins, the upper plate and the middle plate are stress concentrated on the left and right sides of the rivets respectively. Under the action of the shear force of the upper plate and the middle plate, the rivets are slightly inclined and form maximum stress on the tip of the left leg. During stretching, as the shear force of the upper plate increases, the rivets are clearly tilted, and the left leg tends to be pulled up, and the stress increases further under the action of self-locking restrictions. At the same time, the middle plate undergoes plastic deformation, resulting in an increase in contact area with the right side of the rivet, while the upper plate and the lower plate undergoes bending deformation. Under the combined action of the continuous increase in the contact area between the rivet and the middle plate and the increasing shear force, the rivet Is further Inclined. As the strength of the rivet is greater than the strength of the upper plate, the interaction between the rivet and the upper plate causes the deformation and expansion of the punching hole of the upper plate, resulting in the pulling of the upper plate from the rivet and causing the joint failure.
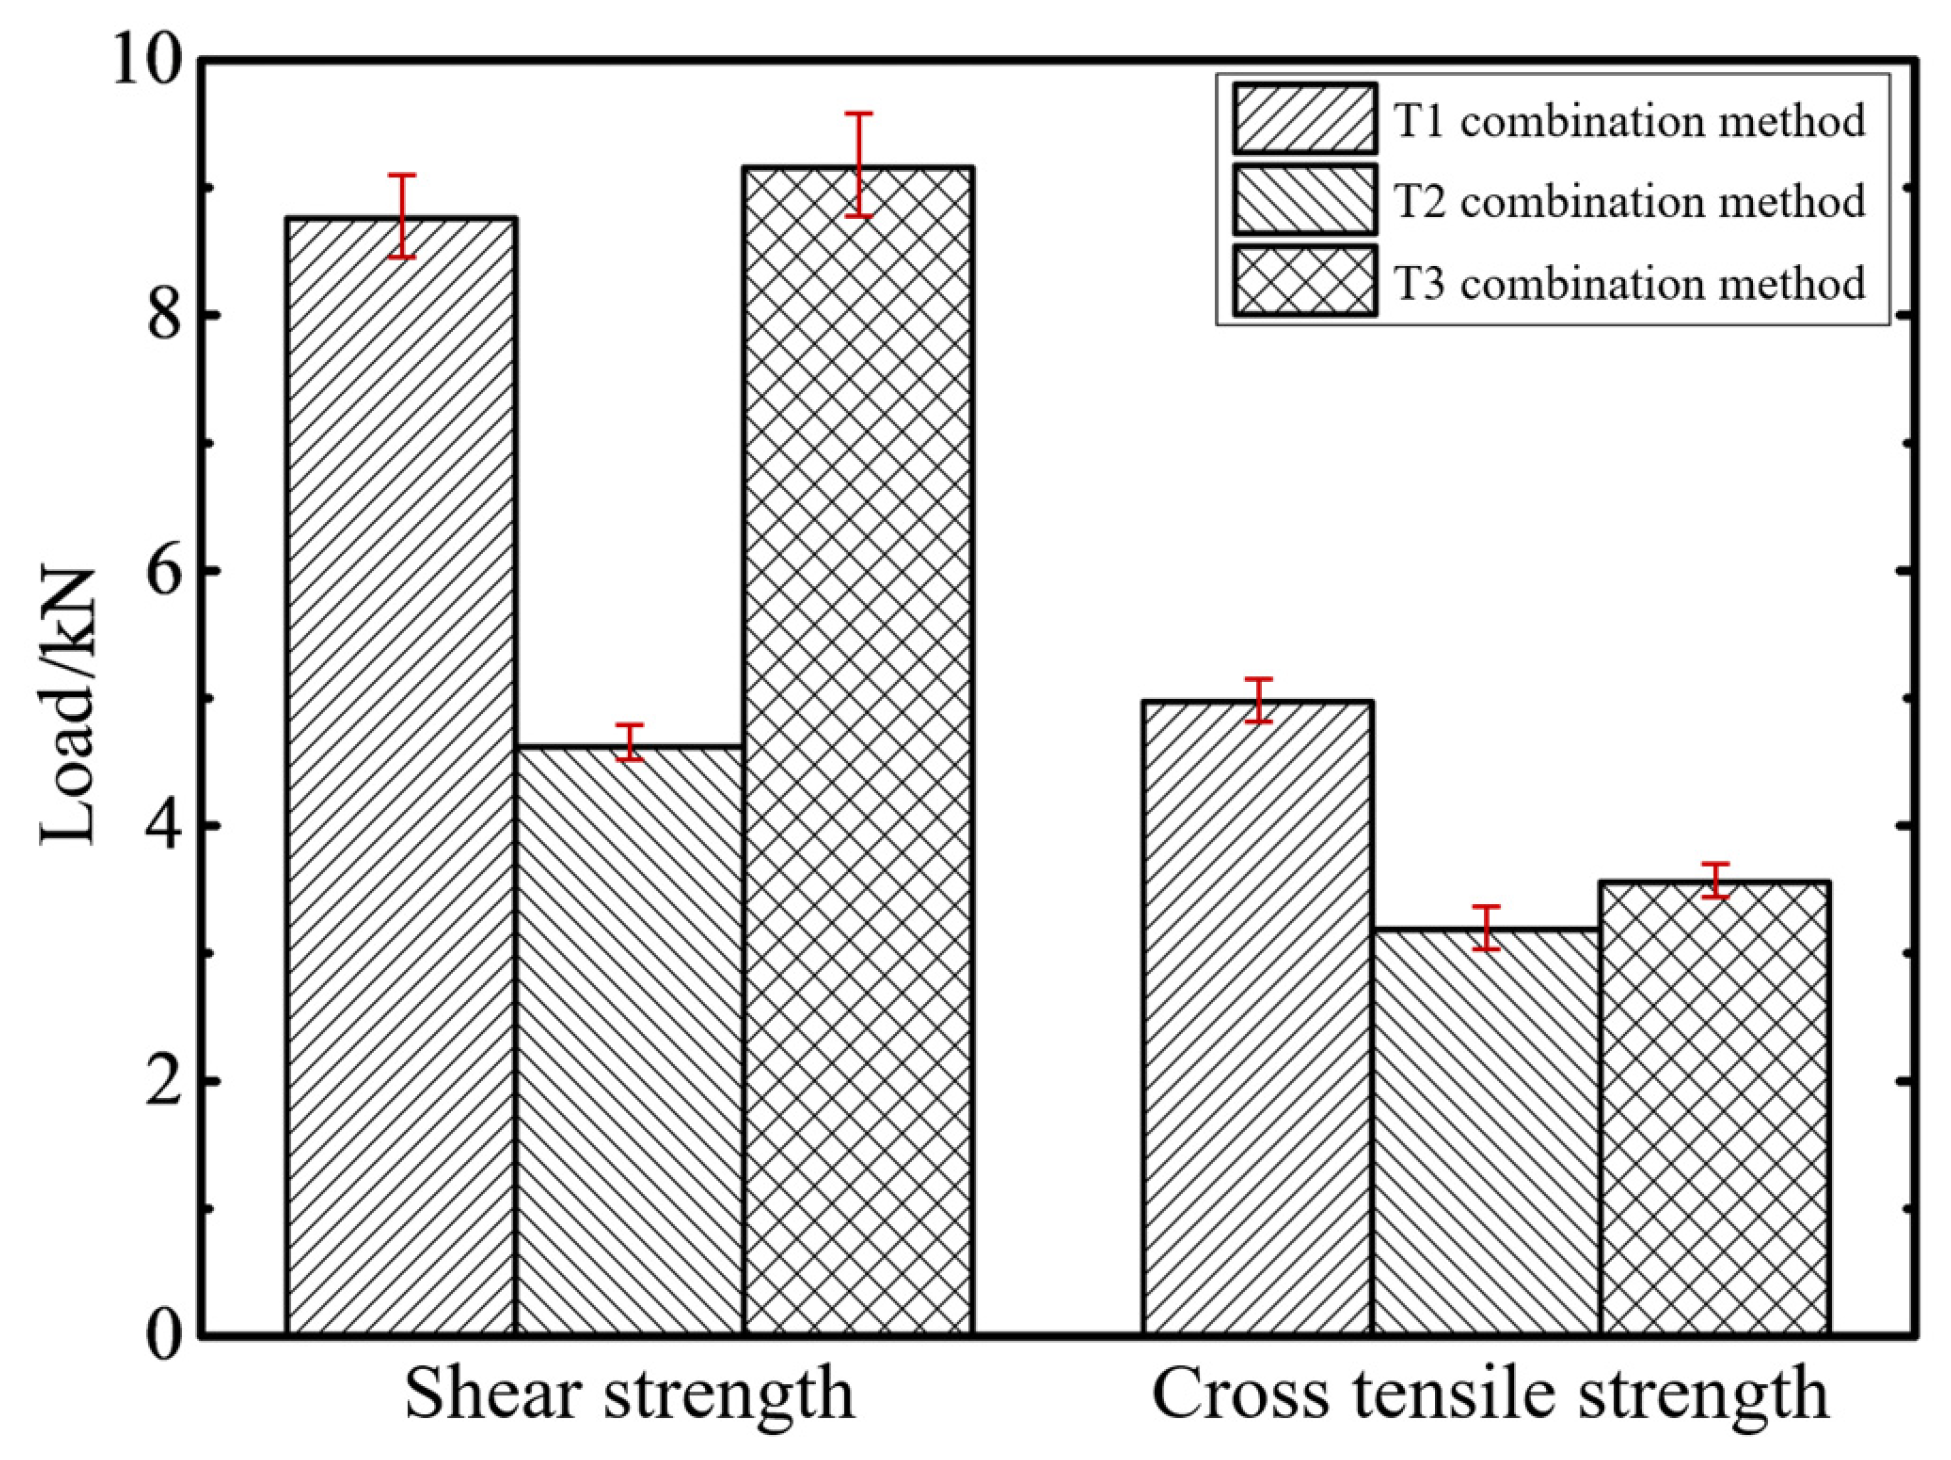
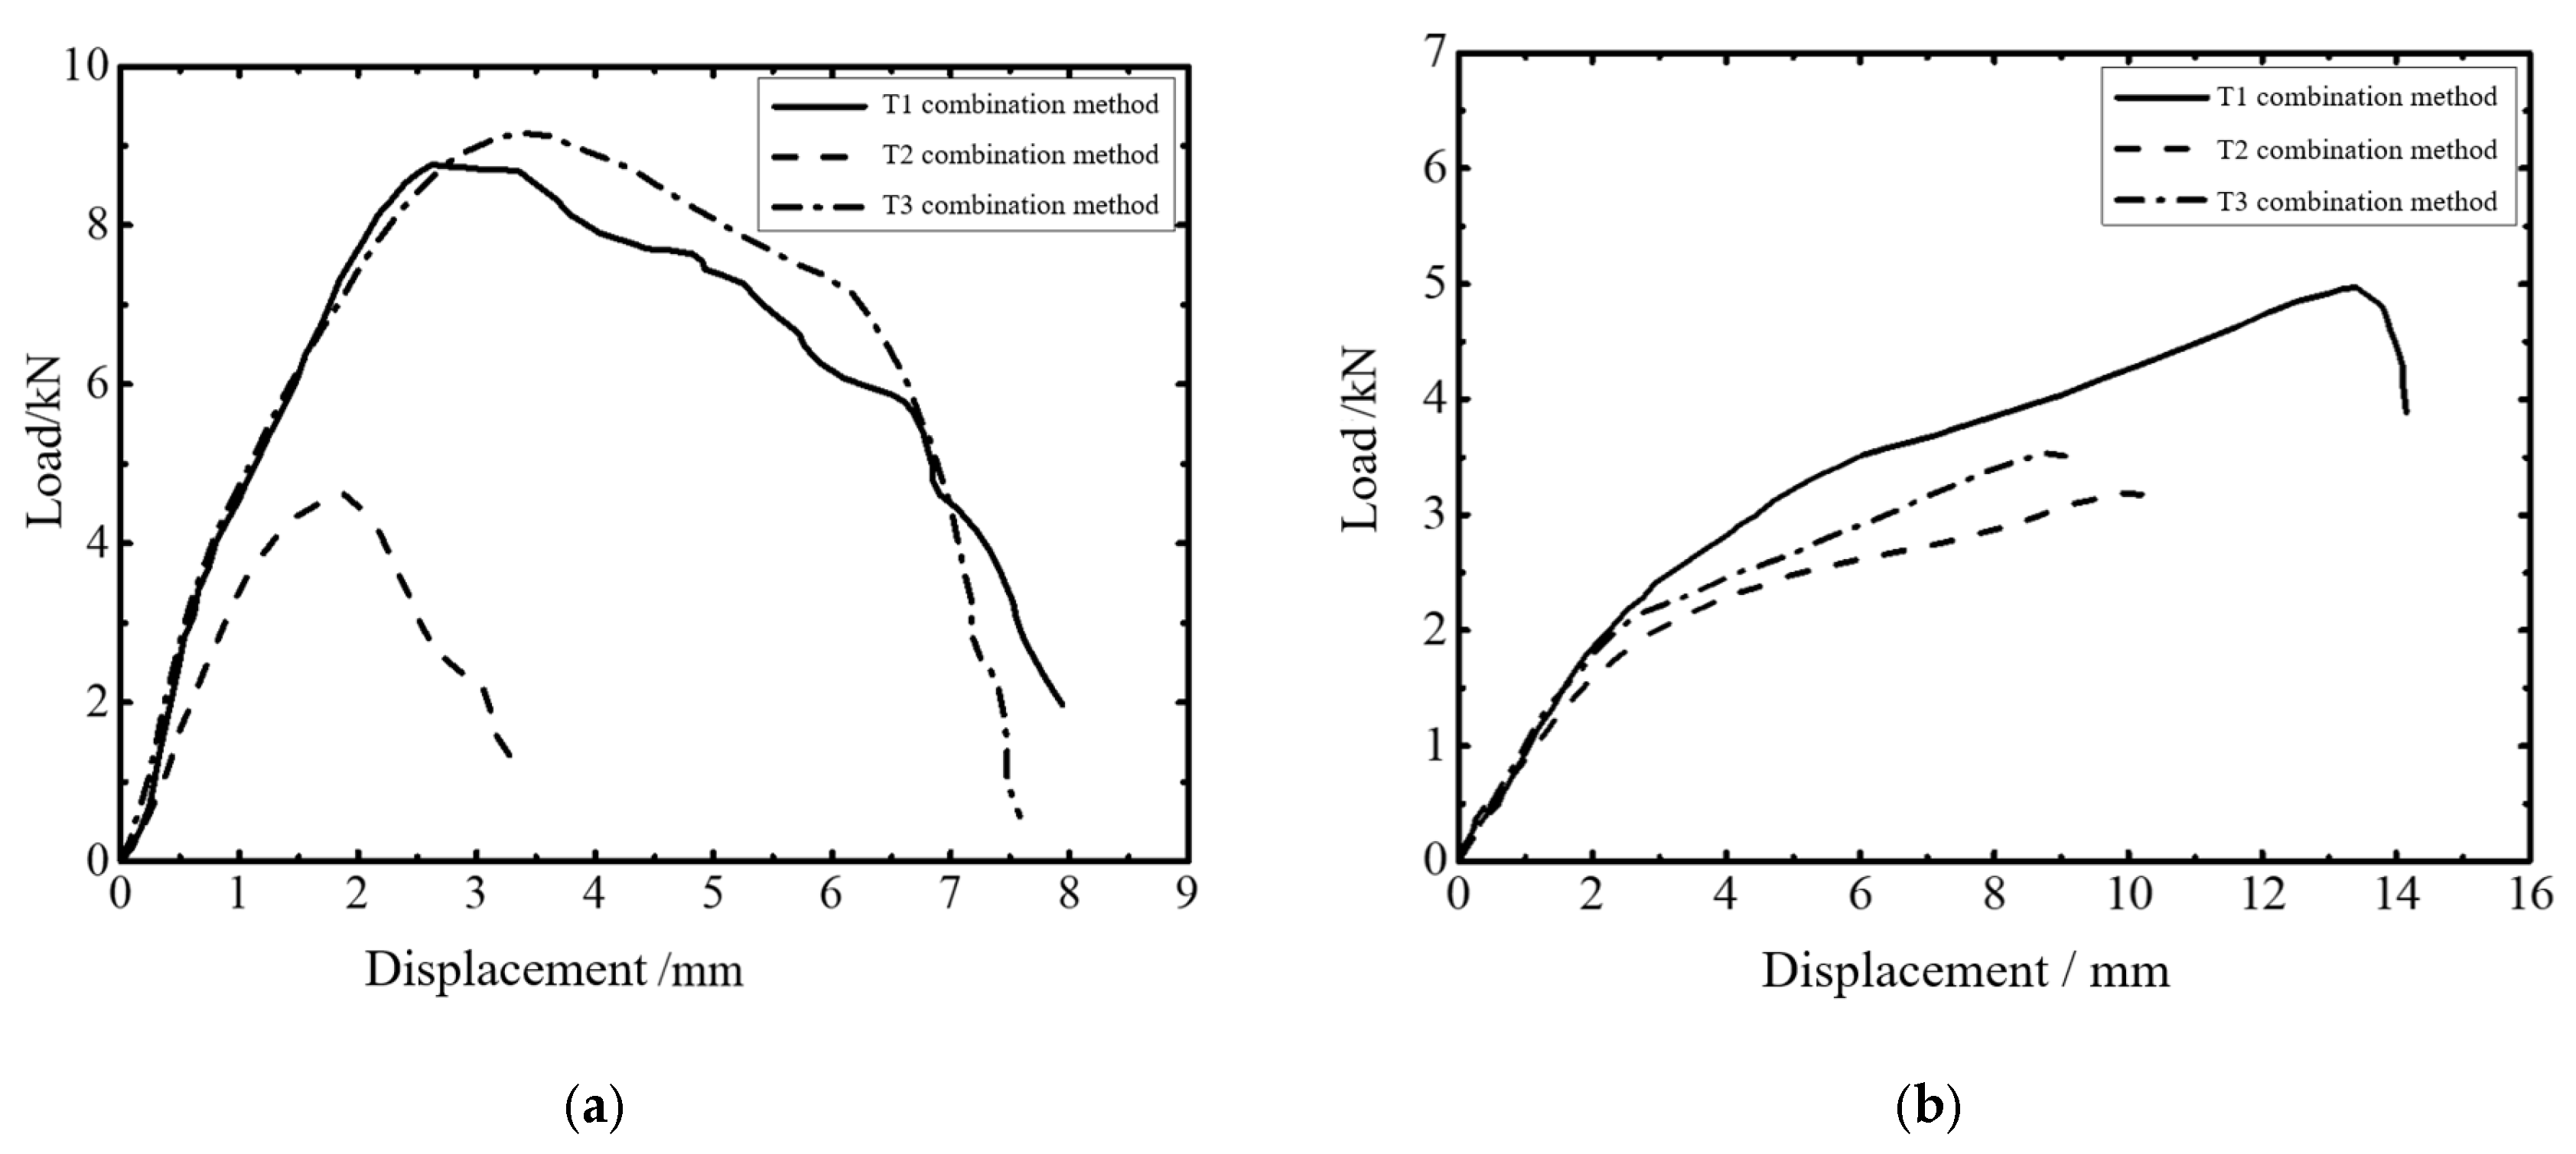
During the shear failure process of the T1 joint, the rivet remains connected to the middle and lower plates and is self-locking; the upper plate is less strong; and the punching hole is deformed and expanded, which leads to it being pulled out of the rivet. Therefore, in this plate layer combination, the shear strength of the joint is affected by the strength of the upper plate and of the self-locking strength of the rivet and the middle and lower plates. When the strength of the upper plate is smaller than the self-locking strength of the rivet and the middle and lower plates, the upper plate undergoes plastic deformation, causing the punching to expand, in turn causing the upper plate to be easily pulled out of the rivet. At the same time, compared with the T2 joint, as the self-locking of the T1 rivet and the middle and lower plates is greater than that of the T2 rivet and the lower plate, the shear strength of the T1 joint is greater than that of the T2 joint with the same strength as the upper plate.
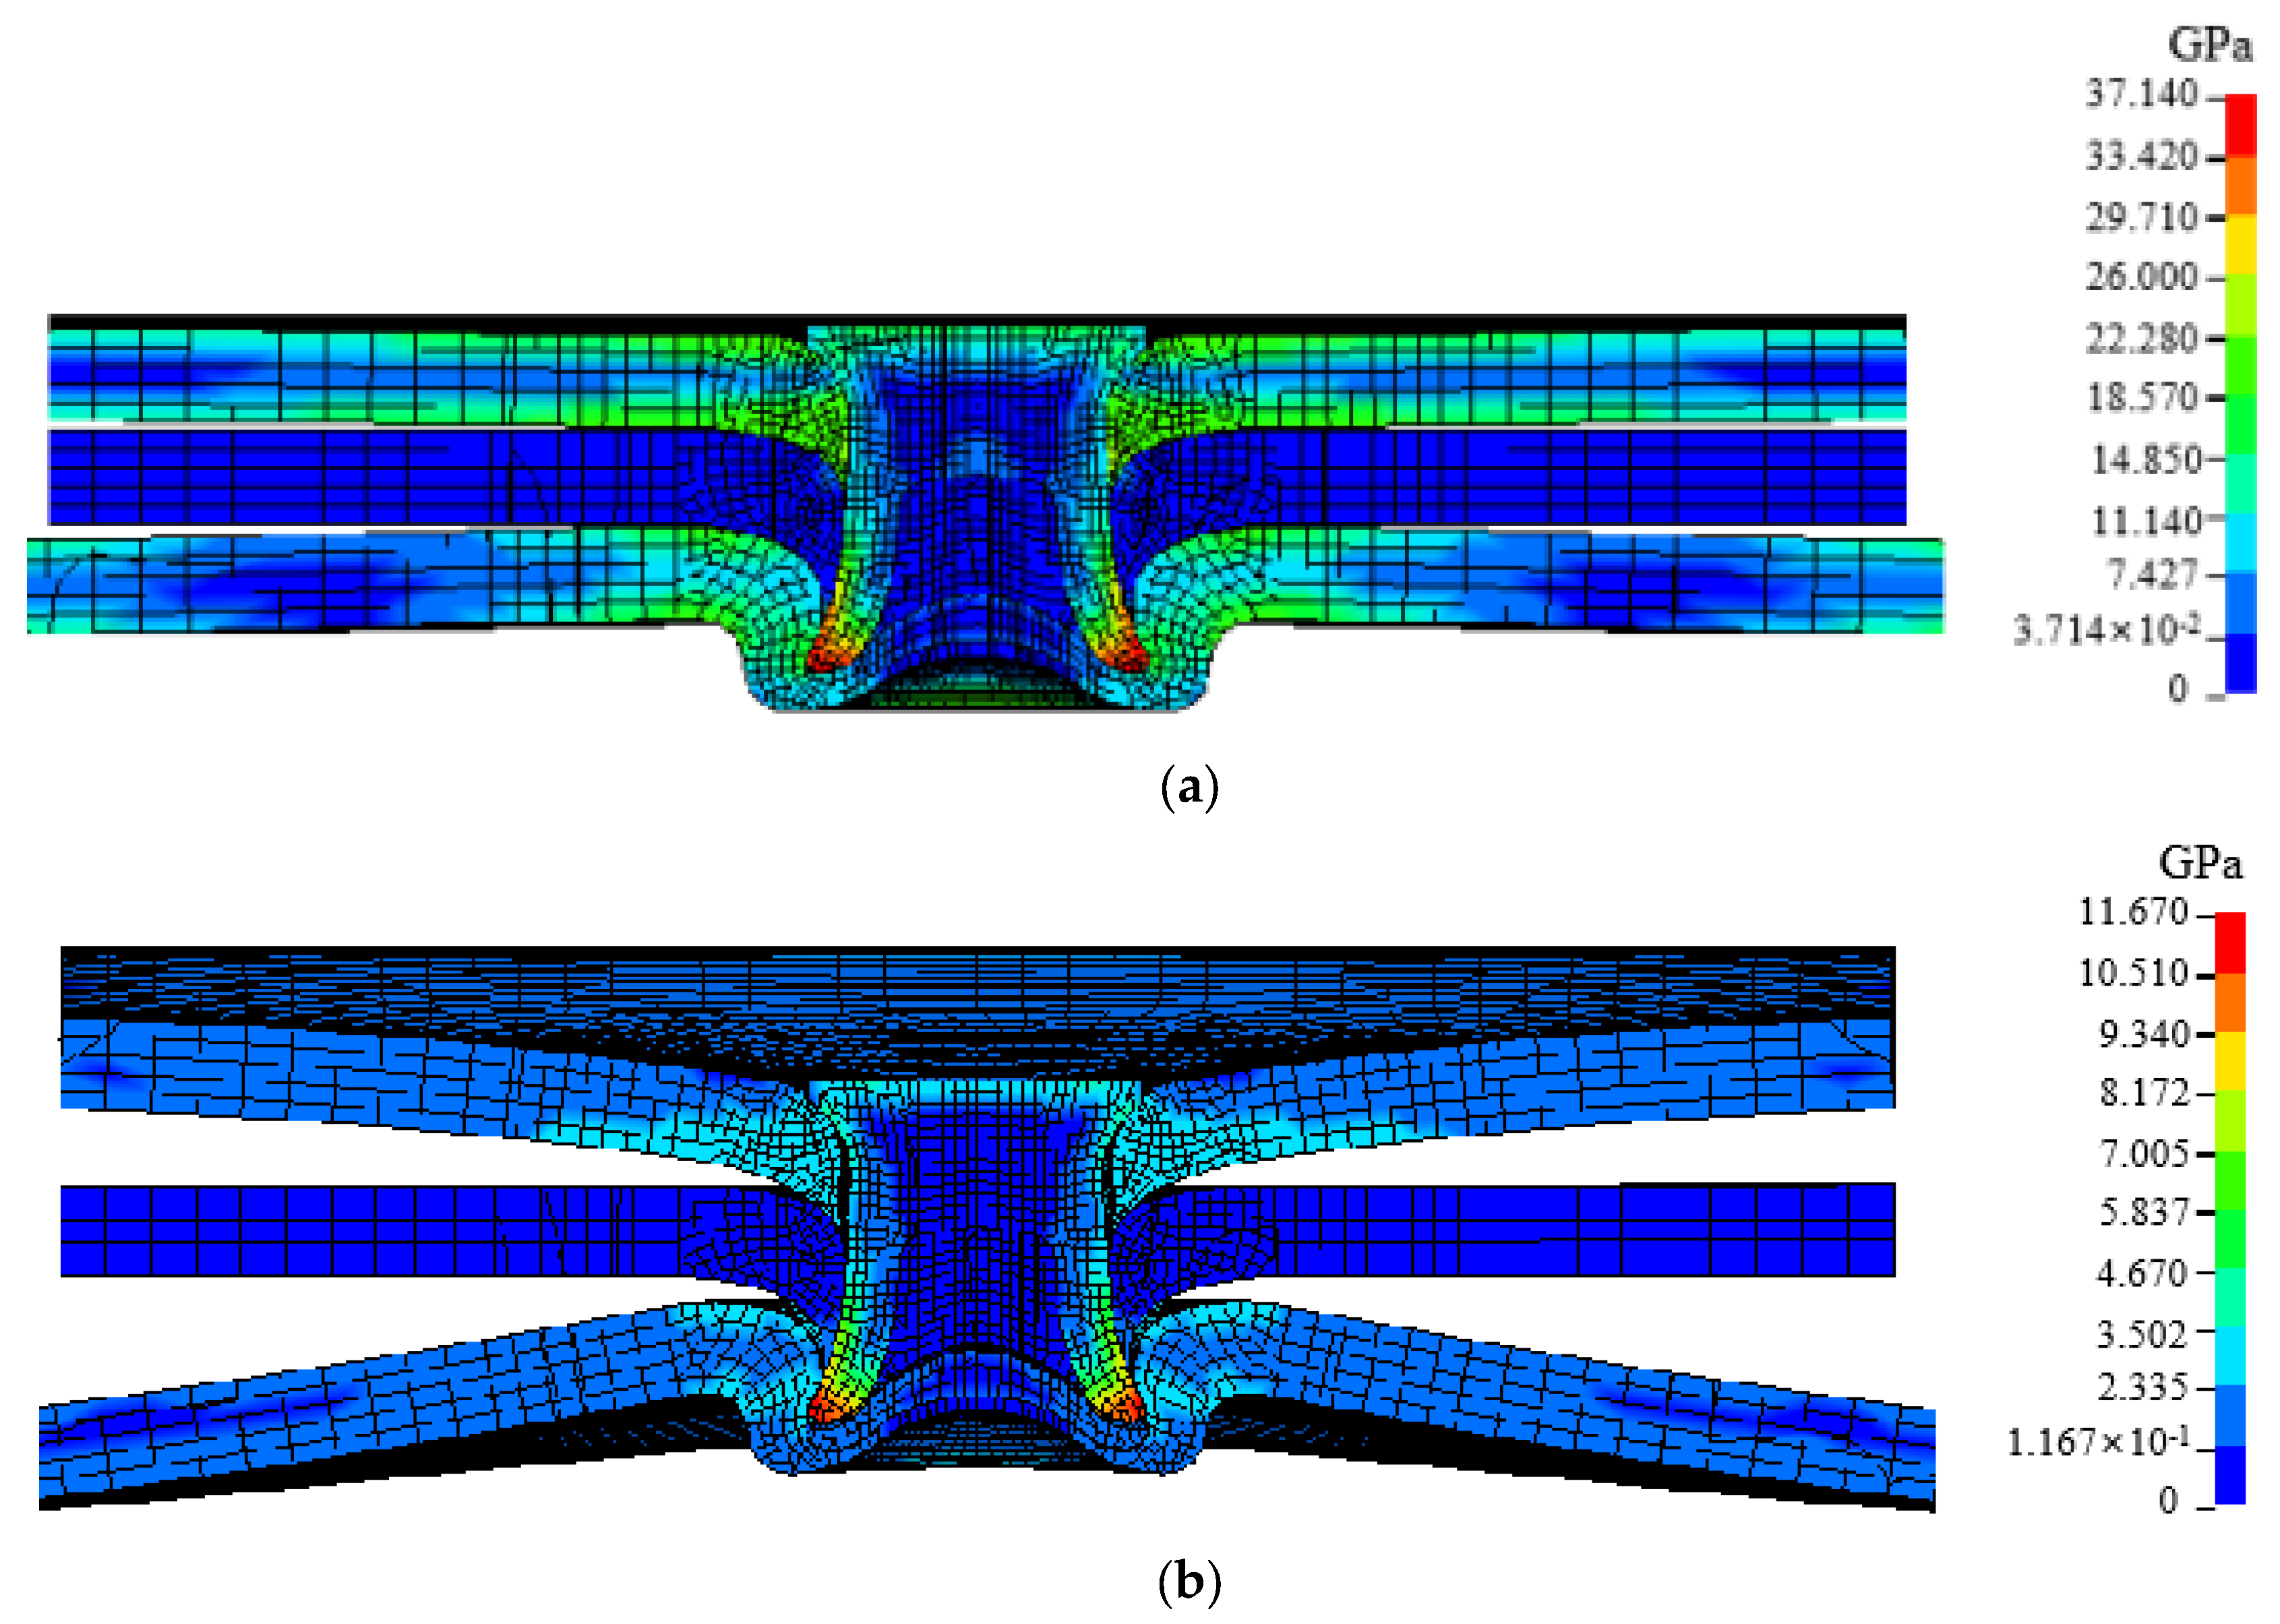
The cross-tensile strength of the T1 plate layer combination joint is the largest, and its failure process under cross-tensile conditions is shown in 
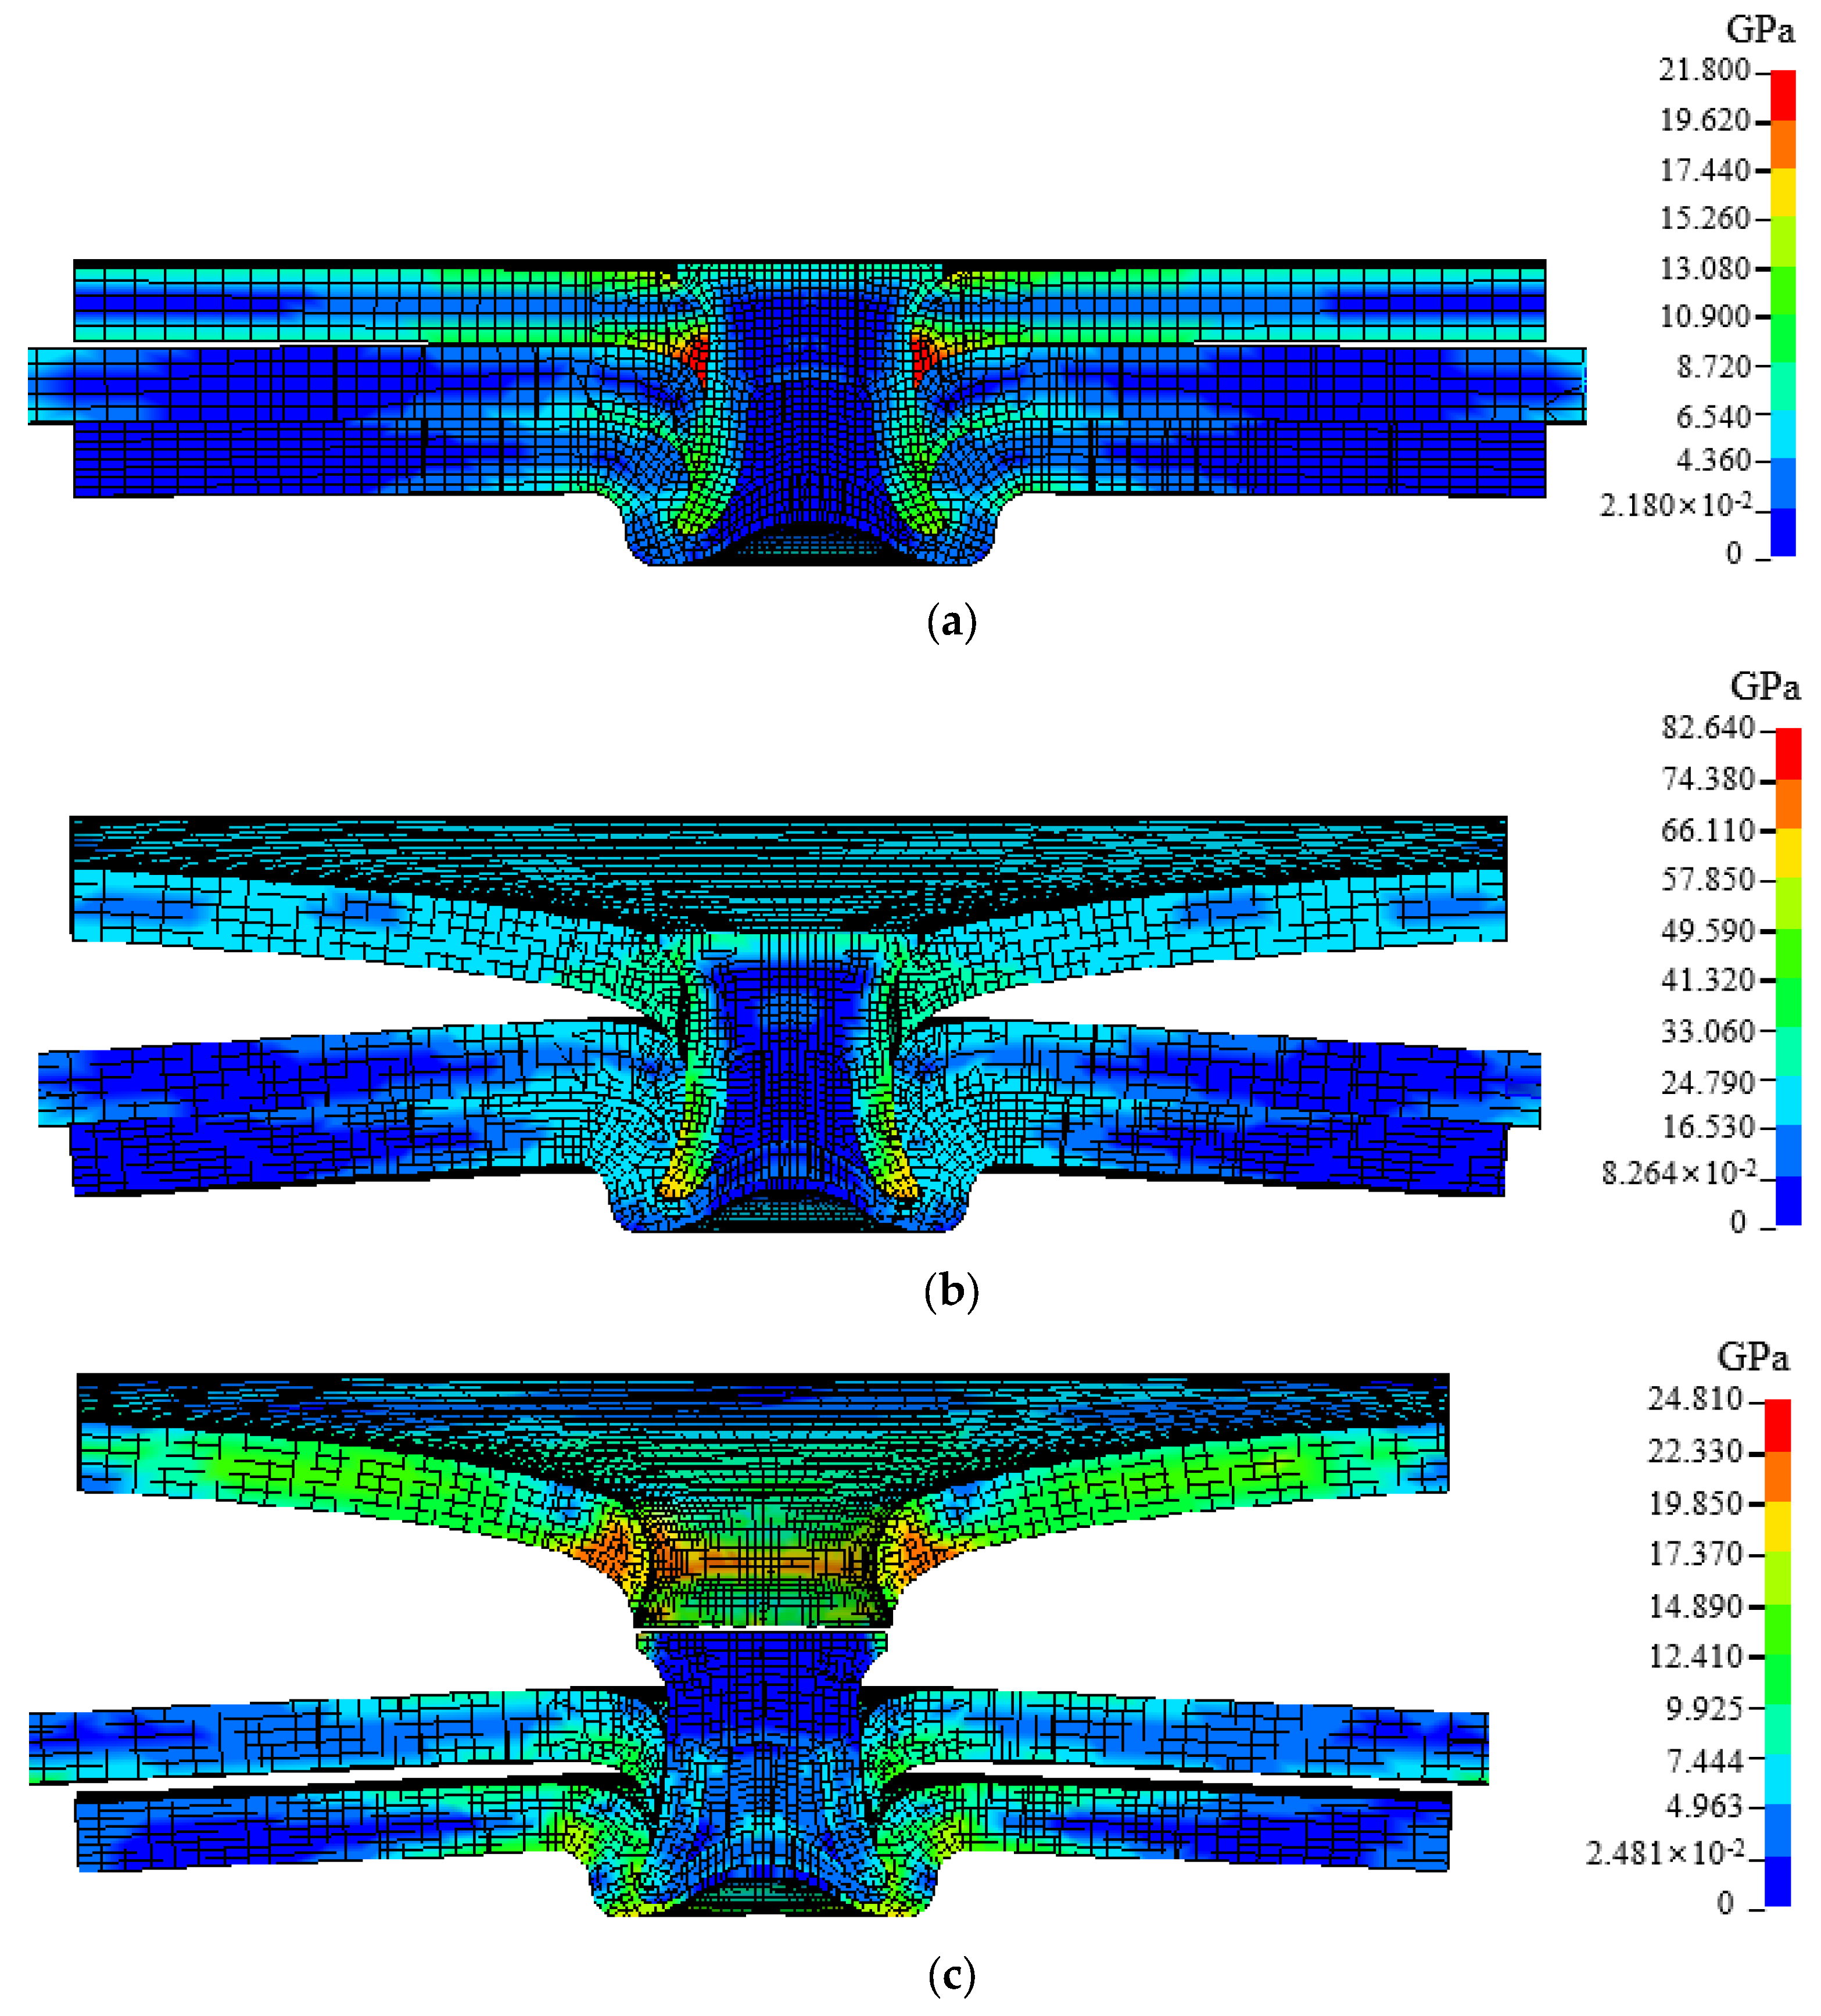
Figure 10. At the beginning, the self-locking part of the upper plate and the rivet forms maximum stress under the squeeze of the rivet and the middle plate, and the stress concentration of the rivet occurs due to the self-locking of the rivet. As the tensile force increases, the upper plate undergoes plastic deformation, the stress disperses around the punching hole of the sheet, and there is a tendency to expand at the punching hole. Under the combined action of mid-plate stretching and self-locking restrictions, the middle and lower plates are stress concentrated on the contact part of the rivet’s legs, while the rivets form the maximum stress at the tip of the leg. Under the continuous action of tensile force, the plastic deformation at the punching hole of the upper plate continues to increase. When the punching hole expands to greater than the diameter of the rivet head, the upper plate is instantly pulled out of the rivet, causing the joint failure.
During the cross-stretch failure process of the T1 joint, the stretched middle plate is equivalent to the stretched middle and lower layers of plates with a total thickness of 4 mm. Compared with the stretched upper plate layer with a thickness of only 2 mm, it can withstand greater tensile force. Therefore, the upper plate is deformed and expanded due to its smaller strength. At the same time, the rivets have significant self-locking with the middle and lower plates, making it difficult to pull out from the middle and lower plates. Then, under the action of expanding at the punching hole of the upper plate, the upper plate is pulled out from the rivet. Therefore, in this plate layer combination method, the tensile strength of the joint cross is affected by the strength of the upper plate. As the upper plate strength of the three types of joints is the same, the self-locking of the T1 joint rivet and the middle and lower plates is greater than that of the T2 and T3 joint rivet and the lower plates, and the rivets are more difficult to pull out. Therefore, the cross-tensile strength of the T1 joint is the largest, and the failure mode is also different from them.

3.3.2. T2 Plate Layer Combination Method for Clamping the Lower Plate and Stretching the Upper Plate

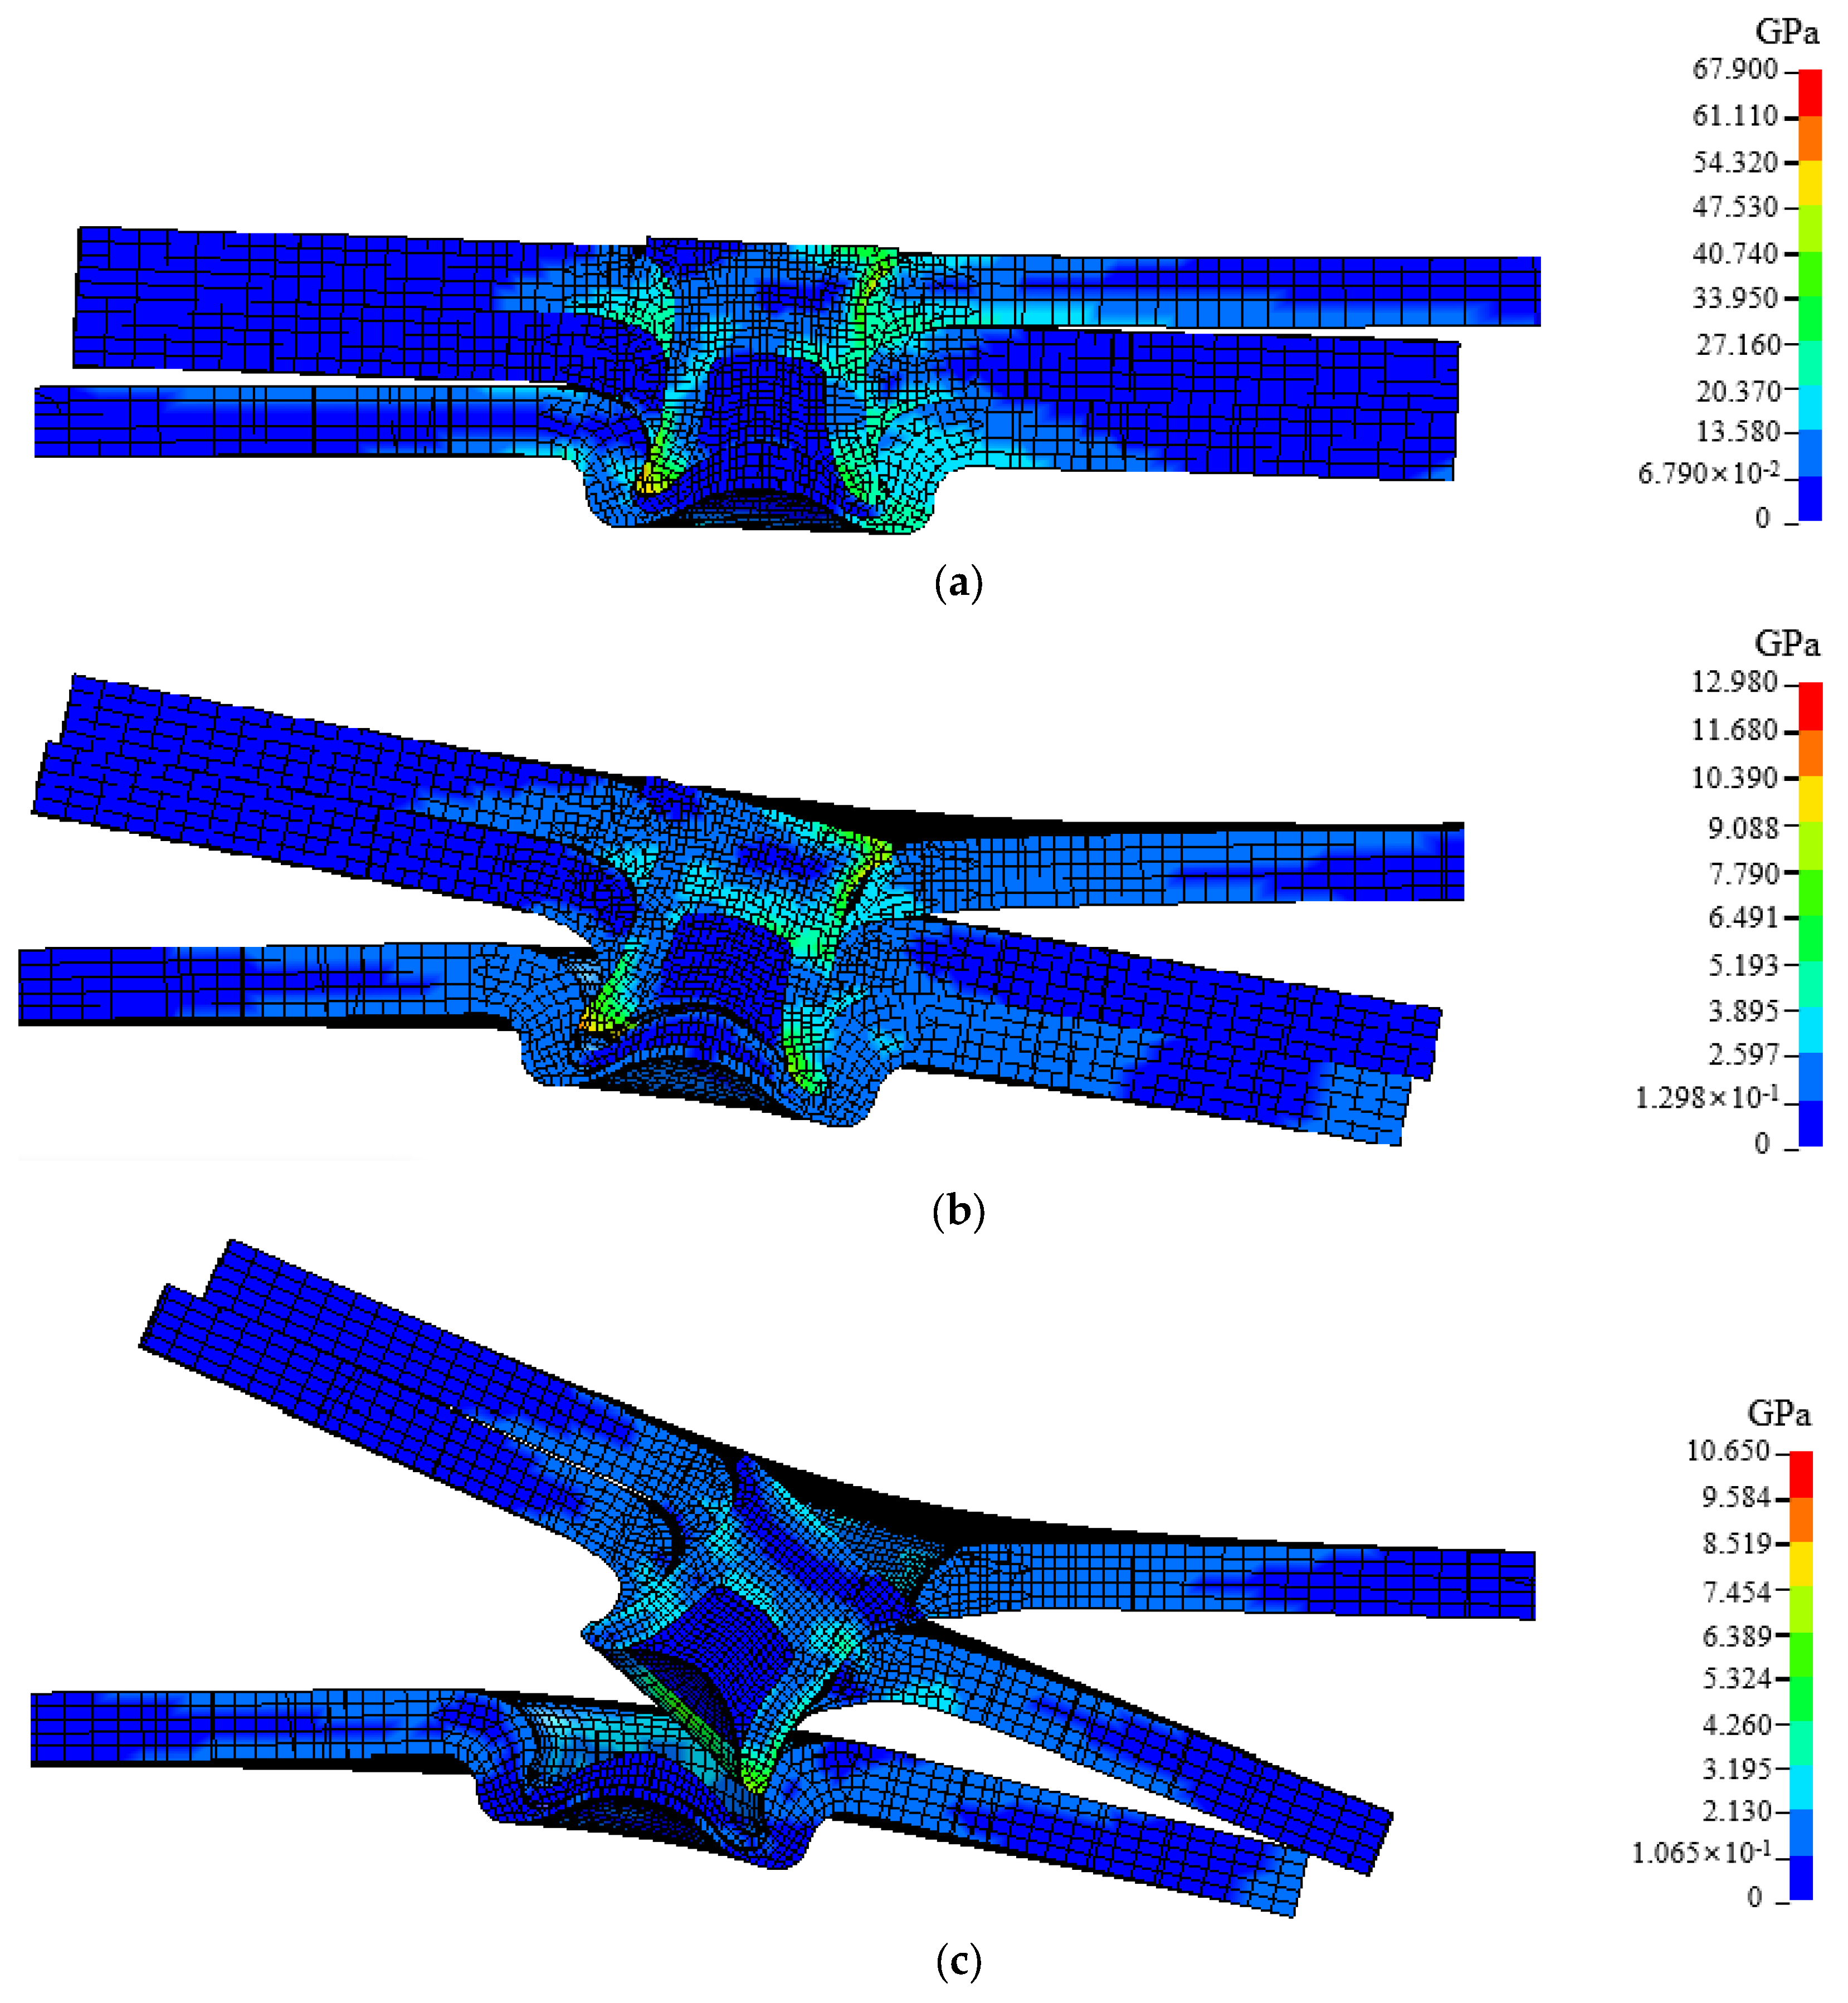
The shear strength of the joints in the T2 plate layer combination method is the smallest among the three plate layer combination methods, and the failure process under shearing conditions is shown in Figure 11. In the beginning, the tendency of the rivets to be pulled up creates maximum stress at the tip of the left leg and creates stress concentration on the head of the self-locking part of the upper plate on the right. The lower plate is subjected to the rivet inclination and the middle plate, and a local stress concentration is formed on the right side of the rivet legs. During the stretching process, although the mid plate is not directly stretched, it tilts with the rivet under the action of self-locking. The left side of the upper plate and the right side of the lower plate are bent and deformation occurs due to the combined action of the inclination of the middle plate and tensile force. The part of the rivet on the right side of the upper plate tends to be pulled out. The riveted part of the lower plate expands due to plastic deformation, and the tendency of the rivet being pulled up is clear. When the shear force increases, the lower plate riveting is further expanded. When the rivet inclination becomes larger, the rivet is pulled out of the lower plate and the T2 joint fails to lock.
During the shear failure of the T2 joint, the deformation and expansion of the lower plate riveting and the rivet tilt work together to make the rivet easy to pull out of the lower plate, resulting in the joint self-locking failure. Therefore, in this plate layer combination, the shear strength of the joint is affected by the lower plate strength and the rivet and lower plate self-locking strength. At the same time, during the stress process of the T2 joint plate layer, a bending moment with the rivet as the axis is formed, which is larger than the bending moment with the rivet head to the middle of the T1 joint formed by the middle and upper and middle plates of the T1 joint. Therefore, the T2 joint rivet is more likely to tilt than the T1 joint rivet, making it easier to overcome the self-locking between the rivet and the lower plate. Therefore, the T2 shear strength is less than the shear strength of the T1 joint.
Figure 12 shows the failure process of the T2 plate combination joint under cross-tensile conditions. When stretching begins, the rivet forms the maximum stress on the tips of the left and right legs due to the self-locking effect, while the upper and lower plates form stress concentration on the self-locking part of the rivet due to the tensile force. When stretching continuously, the stress on the tips of the legs on both sides of the rivet increases, the upper and lower plates undergo plastic deformation, and the stress is distributed around the plate. As the strength of the rivet is greater than that of the lower plate, the lower plate rivet joint expands under the combined action of the upward stretching and plastic deformation of the rivet, which causes the rivet to be pulled out of the lower plate, in turn causing the joint to fail.
During the cross-stretch failure process of the T2 joint, as the self-locking of the rivet and the upper plate is greater than that of the rivet and the lower plate, when the upper plate and the lower plate are the same deformation, the self-locking of the lower plate and the rivet is more likely to fail. Therefore, in this plate layer combination, the tensile strength of the joint is affected by the lower plate strength and the self-locking strength of the rivet and the lower plate. When the tensile load causes plastic deformation of the lower plate and is greater than the self-locking strength between the rivet and the lower plate, the rivet is pulled out of the lower plate, causing the joint to fail.

3.3.3. T3 Plate Layer Combination Method for Clamping the Lower Plate and Stretching the Upper Plate

The shear strength of the T3 plate combination joint is the largest, which is related to the stress of the T3 joint plate layer under shearing conditions. Figure 13 shows the failure process of the T3 plate combination joint in shearing conditions. As can be seen from the figure, when the shearing condition begins, the stress is concentrated on the right side of the rivet, the rivet is inclined, and the maximum stress is formed on the tip of the leg on the right side of the rivet. Due to the shear force, the middle plate forms a stress concentration in the contact part with the rivet. As the shear force increases, the rivet becomes more inclined and constantly squeezes the self-locking part on the right side of the upper plate. Plastic deformation occurs on the right side of the upper plate and the load is transferred to the right side of the middle plate. On the right side of the middle plate, under the combined action of shear force and transfer load, plastic deformation occurs and tends to be pulled out. At the same time, the upper plate is located between the rivet head and the middle plate, and under the action of the bending deformation of the middle plate and the self-locking limit of the rivet, it also undergoes a certain degree of bending deformation. The lower plate deforms and expands under shear and self-locking effects. The left leg of the rivet tends to be pulled up, and the right leg of the rivet remains in the lower plate. When the shear force increases, the rivet inclination becomes larger, and the right side of its legs can be pulled out from the lower plate, at which point the T3 joint fails.
During the shear failure of the T3 joint, the middle plate first undergoes plastic deformation, while the upper plate undergoes plastic deformation under the joint action of the middle plate and the rivet. As the upper middle plate is kept connected to the rivet through self-locking, it is equivalent to stretching the upper middle two layers of sheets when stretching the middle plate, and their contact surface with the rivet is relatively large. The lower plate and the rivet have contact only with the self-locking part, and the area that can withstand the load is smaller than the area that can withstand the load when the upper middle plate and the rivet are in contact. Therefore, in the process of increasing shear force, compared with the upper middle plate with high load-bearing capacity, the lower plate is more likely to undergo plastic deformation, resulting in deformation and expansion of the riveting, which in turn causes the self-locking to fail and the rivets to be pulled out of the lower plate. In this plate layer combination, the plastic deformation at the lower plate rivet makes the inclined rivet easy to pull out, so the shear strength of the joint is affected by the lower plate strength and the self-locking strength of the rivet and the lower plate. At the same time, compared with T1 and T2 joints, the T3 joints are combined to stretch the middle plate. On the one hand, the shear force needs to plastically deform the upper middle plates, so that the rivets tilt under the shear force of the two plates; on the other hand, the shear force also needs to plastically deform the lower plate, and the rivets are deformed and expanded, so that the rivets are easily pulled out. Therefore, the combination of the plate layer requires a large shear force to deform and expand the riveted rivets at the inclined and lower plate, thereby causing the joint to fail. Therefore, the shear strength of the M3 joint is the largest among the three.
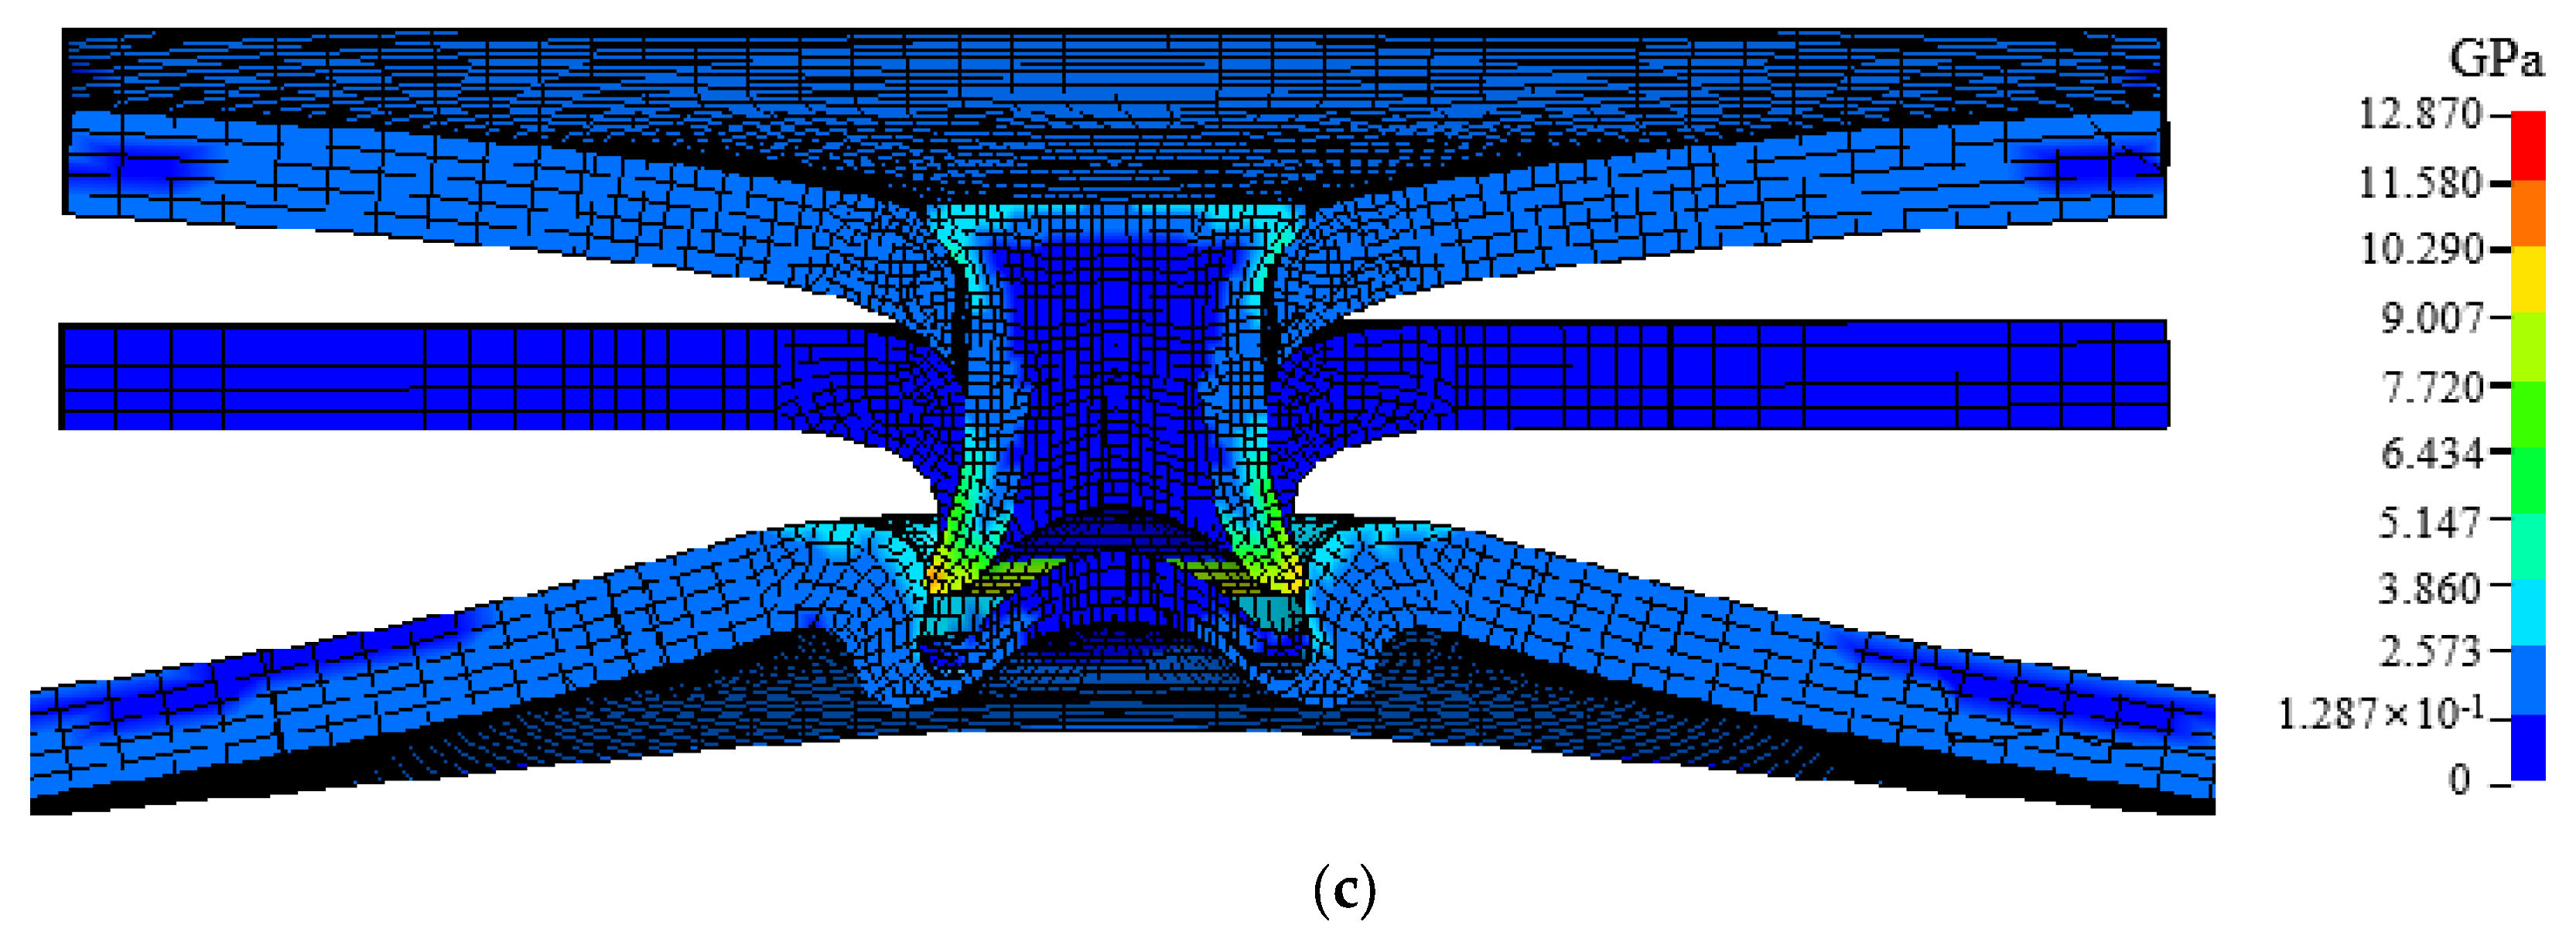
Figure 14 shows the failure process of the T3 plate combination joint under cross-tensile conditions. When the stretching begins, stress concentration occurs on the outer periphery of the rivet, and under the action of self-locking, the maximum stress is formed at the tips of the left and right legs, while each plate layer forms stress concentration in the self-locking part under the action of self-locking. Among these, although the upper plate is not stretched, it also undergoes stress changes under the action of middle plate load and self-locking. During the stretching process, the lower plate undergoes obvious plastic deformation due to large stress, resulting in a tendency to expand at the riveting point. Under the action of tensile force, the rivets form the maximum stress on the tip of the leg due to the self-locking restriction. When the tensile force increases, the plastic deformation at the lower plate riveting increases and expands enough to pull out the rivet legs, at which point the rivet is instantly pulled out from the lower plate and the joint fails.
During the cross-stretch failure process of the T3 joint, the stretched middle plate is equivalent to stretching the upper and middle layers of the upper and middle layers of the plate layer, while the stretched lower plate is only stretched with a thickness of 2 mm. It is easier to produce deformation through the yield deformation of the lower plate with a thickness of 2 mm, while the same is true of the upper and middle layers of 4 mm. Therefore, when the tensile force is the same, the lower plate is more likely to produce deformation, causing deformation and expansion at the riveting, thereby pulling out the rivet. Therefore, the tensile strength of the joint cross is affected by the lower plate strength and the self-locking strength of the rivet and the lower plate. At the same time, by comparing the cross-tensile strength of the T2 joint, we can see that the tensile strength of the two joints is related to the lower plate strength and to the self-locking strength of the rivet and the lower plate. Meanwhile, for the lower plate strength of the T2 and T3 joints, the self-locking strength of the rivet and the lower plate are the same and only the plate layer combination method is different. This means that the cross-tensile strength of the two joints is similar.

4. Conclusions

(1) The mechanical performance of identical joints, including shear strength and cross-tensile strength, as well as corresponding failure modes, varies significantly with different lamina stacking configurations. Among the tested configurations, the T1 joint demonstrates the superior overall mechanical properties, followed by the T3 joint, while the T2 joint exhibits the weakest performance. In practical engineering applications, the T3 stacking configuration is recommended for joints primarily subjected to shear loading conditions, whereas the T1 configuration should be prioritized for joints experiencing dominant tensile forces.
(2) In the T1 plate layer combination method, the shear strength of the joint is affected by the upper plate strength and the self-locking strength of the rivet and of the middle and lower plates, while the cross-tensile strength of the joint is affected by the upper plate strength. It is possible to consider replacing the upper plate with a higher strength sheet to improve the mechanical properties of the joint.
(3) In the T2 plate layer combination method, the shear strength and cross-tensile strength of the joint are affected by the lower plate strength and the rivet and the lower plate self-locking strength. It is possible to consider replacing the lower plate with a higher strength plate to improve the mechanical properties of the joint.
(4) In the T3 plate layer combination method, the shear strength and cross-tensile strength of the joint are affected by the lower plate strength and the rivet and the lower plate self-locking strength. It is possible to consider replacing the lower plate with a higher strength plate to improve the mechanical properties of the joint.

Author Contributions

Conceptualization, Z.H. and S.M.; methodology, Z.H.; validation, Z.H., S.M. and Y.W.; formal analysis, Z.H. and S.M.; investigation, Z.H.; resources, S.M.; data curation, Z.H.; writing—original draft preparation, Z.H.; writing—review and editing, Z.H., S.M. and Y.W.; visualization, Z.H. and S.M.; supervision, Z.H.; project administration, Z.H. and S.M.; funding acquisition, S.M. All authors have read and agreed to the published version of the manuscript.

Funding

The authors of this study are thankful for the support of Guangxi major science and technology project (AB23026104), Liuzhou science and technology project (2023PRJ0102) the open subject project of the State Key Laboratory of Featured Metal Materials and Life-cycle Safety for Composite Structures (MMCS20230F08).

Institutional Review Board Statement

Not applicable.

Informed Consent Statement

Not applicable.

Data Availability Statement

The original contributions presented in this study are included in the article. Further inquiries can be directed to the corresponding author.

Conflicts of Interest

The authors declare no conflicts of interest.

References

  1. Del Pero, F.; Berzi, L.; Antonacci, A.; Delogu, M. Automotive Lightweight Design: Simulation Modeling of Mass-Related Consumption for Electric Vehicles. Machines 2020, 8, 51. [Google Scholar] [CrossRef]
  2. Xie, X.P.; Chai, T.; Sun, Q. Simulation and Optimization of Nonlinear Structures on Low Frequency Vibration and Noise of Lightweight Car Body. Int. J. Comput. Methods 2020, 18, 2140005. [Google Scholar] [CrossRef]
  3. Camberg, A.A.; Stratmann, I.; Tröster, T. Tailored Stacked Hybrids—An Optimization-Based Approach in Material Design for Further Improvement in Lightweight Car Body Structures. Technol. Econ. Funct. Lightweight Des. 2019, 2018, 119–131. [Google Scholar]
  4. Porcaro, R.; Hanssen, A.; Langseth, M.; Aalberg, A. Self-piercing riveting process: An experimental and numerical investigation. J. Mater. Process. Technol. 2006, 171, 10–20. [Google Scholar] [CrossRef]
  5. Amro, E.-K.; Afia, K.H. Experimental Investigation of Damage and Failure Mechanisms of Polymer-Metal Joints assembled by Self-Piercing Riveting. In Proceedings of the 24th International Conference on Material Forming ESAFORM, Liège, Belgium, 14–16 April 2021. [Google Scholar]
  6. Uhe, B.; Kuball, C.M.; Merklein, M.; Meschut, G. Influence of Rivet Coating on Friction during Self-Piercing Riveting. Key Eng. Mater. 2021, 883, 11–18. [Google Scholar] [CrossRef]
  7. Mori, K.; Abe, Y.; Kato, T. Self-pierce riveting of multiple steel and aluminum alloy sheets. J. Mater. Process. Technol. 2014, 214, 2002–2008. [Google Scholar] [CrossRef]
  8. Rusia, A.; Beck, M.; Weihe, S. Simulation of Self-Piercing Riveting Process and Joint Failure with focus on Material Damage and Failure modelling. In Proceedings of the 12th European LS-DYNA Conference, Koblenz, Germany, 14–16 May 2019. [Google Scholar]
  9. Mucha, J.; Witkowski, W. Mechanical Behavior and Failure of Riveting Joints in Tensile and Shear Tests. Strength Mater. 2015, 47, 755–769. [Google Scholar] [CrossRef]
  10. Lamba, E.P.; Cox, H.S. Welding Research; NASA Technical Reports Server: Washington, DC, USA, 2013.
  11. Han, L.; Chrysanthou, A.; Young, K. Mechanical behavior of self-piercing riveted multi-layer joints under different specimen configurations. Mater. Des. 2007, 28, 2024–2033. [Google Scholar] [CrossRef]
  12. Amundsen, D.H.; Gustad, J.U. Behavior and Modelling of Flow-Drilling Screw Connections. Ph.D. Thesis, Norwegian University of Science and Technology, Trondheim, Norway, June 2014. [Google Scholar]
  13. Schromm, T.; Ag, B.; Diewald, F.; Grosse, C.U. Technical University of Munich (TUM) An attempt to detect anomalies in CT-data of car body parts using machine learning algorithms. e-J. Nondestruct. Test. 2019, 24. [Google Scholar] [CrossRef]
  14. Lee, H.-J.; Nellikode, S.; Kang, T.-Y.; Park, Y.-D. Comparative Analysis of SPR and SPR-Bonded Joints of Hot Press Forming Steel and AA5052 under Corrosive Conditions. J. Weld. Join. 2023, 41, 486–499. [Google Scholar] [CrossRef]
  15. Zixin, G.; Zhao, L.; Abbas, Z.; Yuanyuan, G.; Xiaole, H.; Sen, L.; Haibo, W.; Islam, M.S. The Effects of Three Profiles on the Mechanical Properties and Grain Size of Self-Piercing Riveting Joints Using Ultrasonic Welding. Int. J. Adv. Manuf. Technol. 2023, 129, 4869–4882. [Google Scholar] [CrossRef]
  16. Di Franco, G.; Zuccarello, B. Performance of SPR/Bonded Hybrid Single Lap Joints CFRP/Aluminum. Int. J. Adhes. Adhes. 2011, 41, 24–32. [Google Scholar] [CrossRef]
  17. ASTM E8/E8M-24; Standard Test Methods for Tension Testing of Metallic Materials. ASTM International: West Conshohocken, PA, USA, 2024.
  18. ASTM B221-24; Standard Specification for Aluminum and Aluminum-Alloy Extruded Bars, Rods, Wire, Profiles, and Tubes. ASTM International: West Conshohocken, PA, USA, 2024.
  19. ASTM A519-24; Standard Specification for Seamless Carbon and Alloy Steel Mechanical Tubing. ASTM International: West Conshohocken, PA, USA, 2024.
Figure 1. Illustration of different sheet layer combinations. (a) Shearing conditions and (b) cross-stretching conditions.
Applmech 06 00051 g001
Figure 2. Geometry of the specimen. (a) Shear specimen dimensions and (b) cross-stretching specimen dimensions.
Applmech 06 00051 g002
Figure 3. Joint strength of different sheet layer combination modes.
Applmech 06 00051 g003
Figure 4. Load–displacement curves of joints with different sheet layer combination modes. (a) Shearing conditions and (b) cross-stretching conditions.
Applmech 06 00051 g004
Figure 5. Failure mode of joints with different sheet layer combination modes under shear conditions. (a) T1 combination method (b) T2 combination method (c) T3 combination method.
Applmech 06 00051 g005
Figure 6. Failure mode of joints with different sheet layer combination modes under cross condition. (a) T1 combination method (b) T2 combination method (c) T3 combination method.
Applmech 06 00051 g006
Figure 7. Forming result of three-layers AA6063-T6 joint.
Applmech 06 00051 g007
Figure 8. Detail finite element model of joint. (a) Joint cross section, (b) shearing, and (c) cross stretching.
Applmech 06 00051 g008aApplmech 06 00051 g008b
Figure 9. Failure process of T1 joint under shear condition. (a) At the beginning, (b) stretching, and (c) after failure.
Applmech 06 00051 g009
Figure 10. Failure process of T1 joint under cross condition. (a) At the beginning, (b) stretching, and (c) after failure.
Applmech 06 00051 g010
Figure 11. Failure process of T2 joint under shear condition. (a) At the beginning, (b) stretching, and (c) after failure.
Applmech 06 00051 g011
Figure 12. Failure process of T2 joint under cross condition. (a) At the beginning, (b) stretching, (c) after failure.
Applmech 06 00051 g012aApplmech 06 00051 g012b
Figure 13. Failure process of T3 joint under shear condition. (a) At the beginning, (b) stretching, (c) after failure.
Applmech 06 00051 g013
Figure 14. Failure process of T3 joint under cross condition. (a) At the beginning, (b) stretching, (c) after failure.
Applmech 06 00051 g014
Table 1. Material properties.
MaterialDensity
g/cm3
Elastic Modulus
GPa
Poisson’s RatioYield Strength
MPa
AA6063-T62.7730.3214
rivet7.85178.50.291515
Disclaimer/Publisher’s Note: The statements, opinions and data contained in all publications are solely those of the individual author(s) and contributor(s) and not of MDPI and/or the editor(s). MDPI and/or the editor(s) disclaim responsibility for any injury to people or property resulting from any ideas, methods, instructions or products referred to in the content.

