Article

Investigation on Residual Compressive Distribution of High-Strength Steel for Bridges by Base Metal Hammer Impact Peening

1
Civil & Infrastructure Engineering Research Department, Steel Research Laboratory, JFE Steel Corporation, Kawasaki 210-0855, Japan
2
Department of Architecture, Faculty of Engineering, Kinki University, Higashi-Hiroshima 739-2116, Japan
*
Author to whom correspondence should be addressed.
Appl. Mech. 2021, 2(4), 932-941; https://doi.org/10.3390/applmech2040054
Submission received: 8 September 2021 / Revised: 29 October 2021 / Accepted: 3 November 2021 / Published: 8 November 2021
(This article belongs to the Special Issue Mechanics Applied in Construction Engineering)

Abstract

:
Various peening techniques have been used to improve the fatigue strength of steel structures. Among them, base metal impact hammer peening shows significant improvement in fatigue strength in ordinary steel, but the effect on high-strength steel has not been sufficiently studied. Accordingly, this study applied base material hammer impact peening to test specimens of 780 MPa grade high-strength steel (HT780) and 490 MPa grade ordinary steel (SM490), and the residual stress was measured and simulated. The experimental results clarified that a large compressive residual stress was introduced into the inner part of the plate thickness near the indentation in the high-strength steel, although the range of introduction of residual stress was equivalent in both the ordinary steel and high-strength steel.

1. Introduction

Steel structures support industries and infrastructures such as bridges, buildings, power plants, industrial plants, energy storage, and transportation, and thus are important social capital in Japan. These steel structures must be able to be used safely in normal service conditions, and must not collapse in abnormal situations such as disasters, at which times fatigue becomes a problem. Efforts are being made to increase the fatigue strength of the weld zone, such as by improving the weld toe shape, gliding of the weld toe, and various types of peening [1,2,3,4].
In this study, we focused on hammer peening, which is a method for converting tensile residual stress at the weld toe to compressive residual stress, to improve the fatigue strength of the weld zone. Hammer peening increases the fatigue strength and suppresses the generation of fatigue cracks by applying a compressive residual stress in the vicinity of the weld zone. In this study, we used a technique for improving fatigue strength by base metal hammer impact peening (BMHIP). A previous study [5] clarified the relationship between the surface residual stress due to BMHIP, the number of impacts, and the effect of improving fatigue strength for ordinary steel (490 MPa grade steel).
Studies [6,7] have induced compressive residual stress by BMHIP to high strength steels, but verification by analysis has not been conducted. In another study [8], residual stress has been measured for the effect of BMHIP on 490 MPa grade ordinary steel and 570 MPa grade high strength steel. The results showed that the maximum value of residual stress introduced in ordinary steel and high strength steel was almost the same.
In this paper, we focus on the residual stress distribution inside the plate near the impact zone, and present the results of measuring the residual stress by the BMHIP on the test specimens of high strength steel (HT 780: steel with tensile strength of 780 MPa class) and ordinary steel (SM 490: steel with tensile strength of 490 MPa class), and also report the results of comparing the properties of the residual stress introduced into high strength steel and ordinary steel by experiment and analysis by simulating peening by three-dimensional elasto-plastic analysis.

2. Measurement of Residual Stress

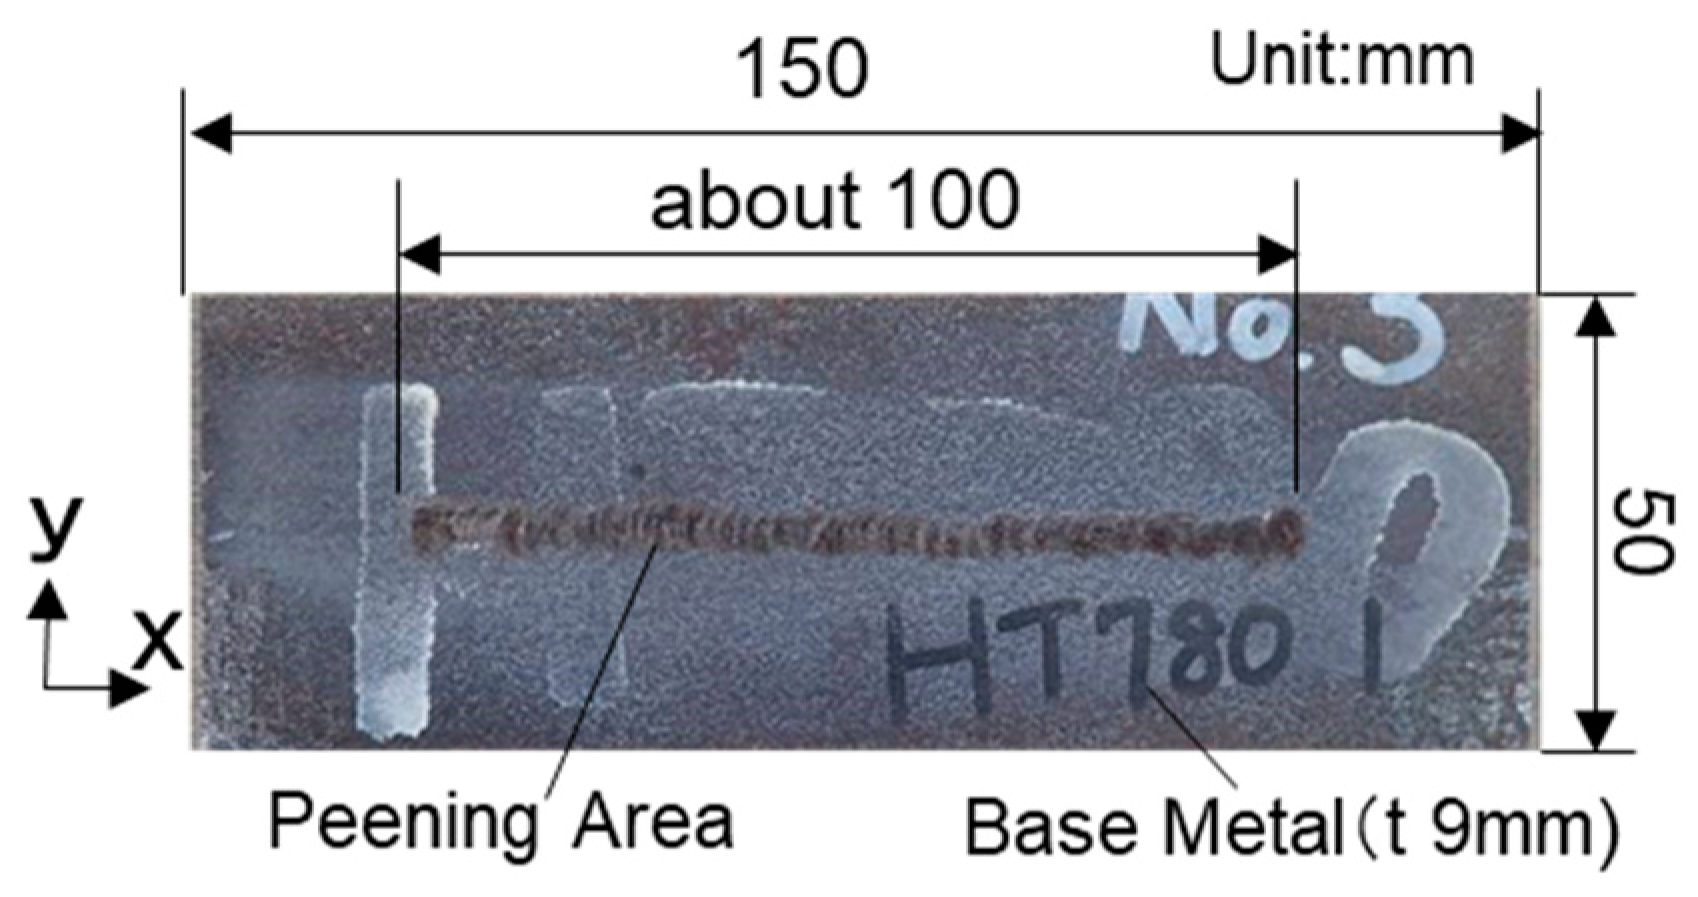
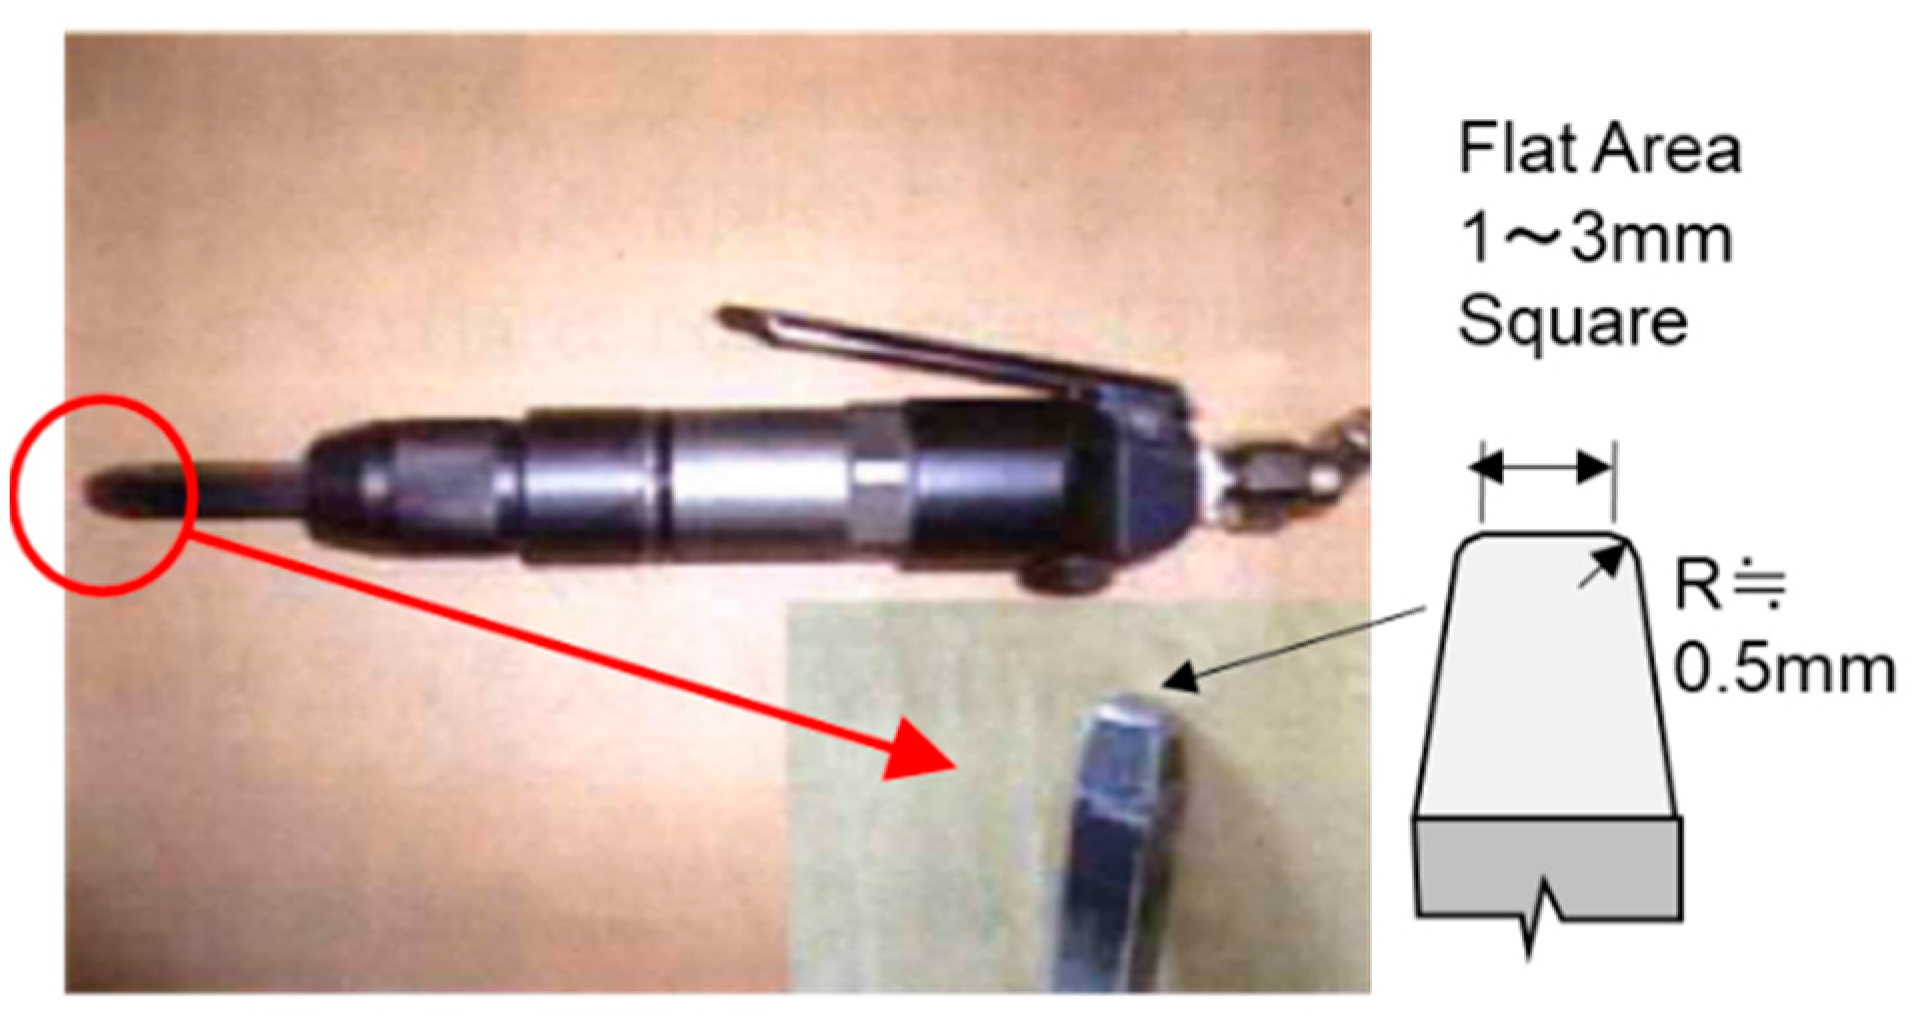
2.1. Specimens and Test Conditions

All steel materials used in this study are in the Japanese Industrial Standards (JIS [9]). We selected 490 MPa grade standard steel (SM490) and 780 MPa grade high-tensile steel (HT780). The test specimens were steel plates of 150 mm in length, 50 mm in width and 9 mm in thickness. Eight specimens were used: four specimens each of SM490 and HT780. BMHIP treatment was applied at a length of about 100 mm in the longitudinal direction of the center of the specimen. Figure 1 shows a photograph of the test specimen (after one BMHIP execution).
According to [5], the BMHIP air tool, which is machined so that the flat part of the tool tip has a roundness (R) value of 1–3 mm square and the edge becomes 0.5 mm, as shown in Figure 2, is hit while being pressed perpendicularly to the test body base material. The speed of the BMHIP treatment is about 5 cm/min, the air pressure of the air tool is 0.63 MPa, and the frequency at which the air tool is applied to the object is about 90 Hz. In this study, continuous impact given to one line is defined as one execution frequency, and four types of test specimens were prepared with an execution frequency of one to four times. Table 1 shows the results of measuring the difference in the depth of the depression according to the number of execution times using a 3D shape measuring machine. The values are the average of the maximum depression depth measured in nine sections with a spacing of 2 mm. For all execution times, the indentation was shallower for HT780, and in the case of four execution times, SM490 was 0.201 mm, and HT780 was 0.093 mm, which is half the depth. This is likely the case because the high yield stress of high-tensile-strength steel requires substantial energy for plastic deformation by BMHIP.

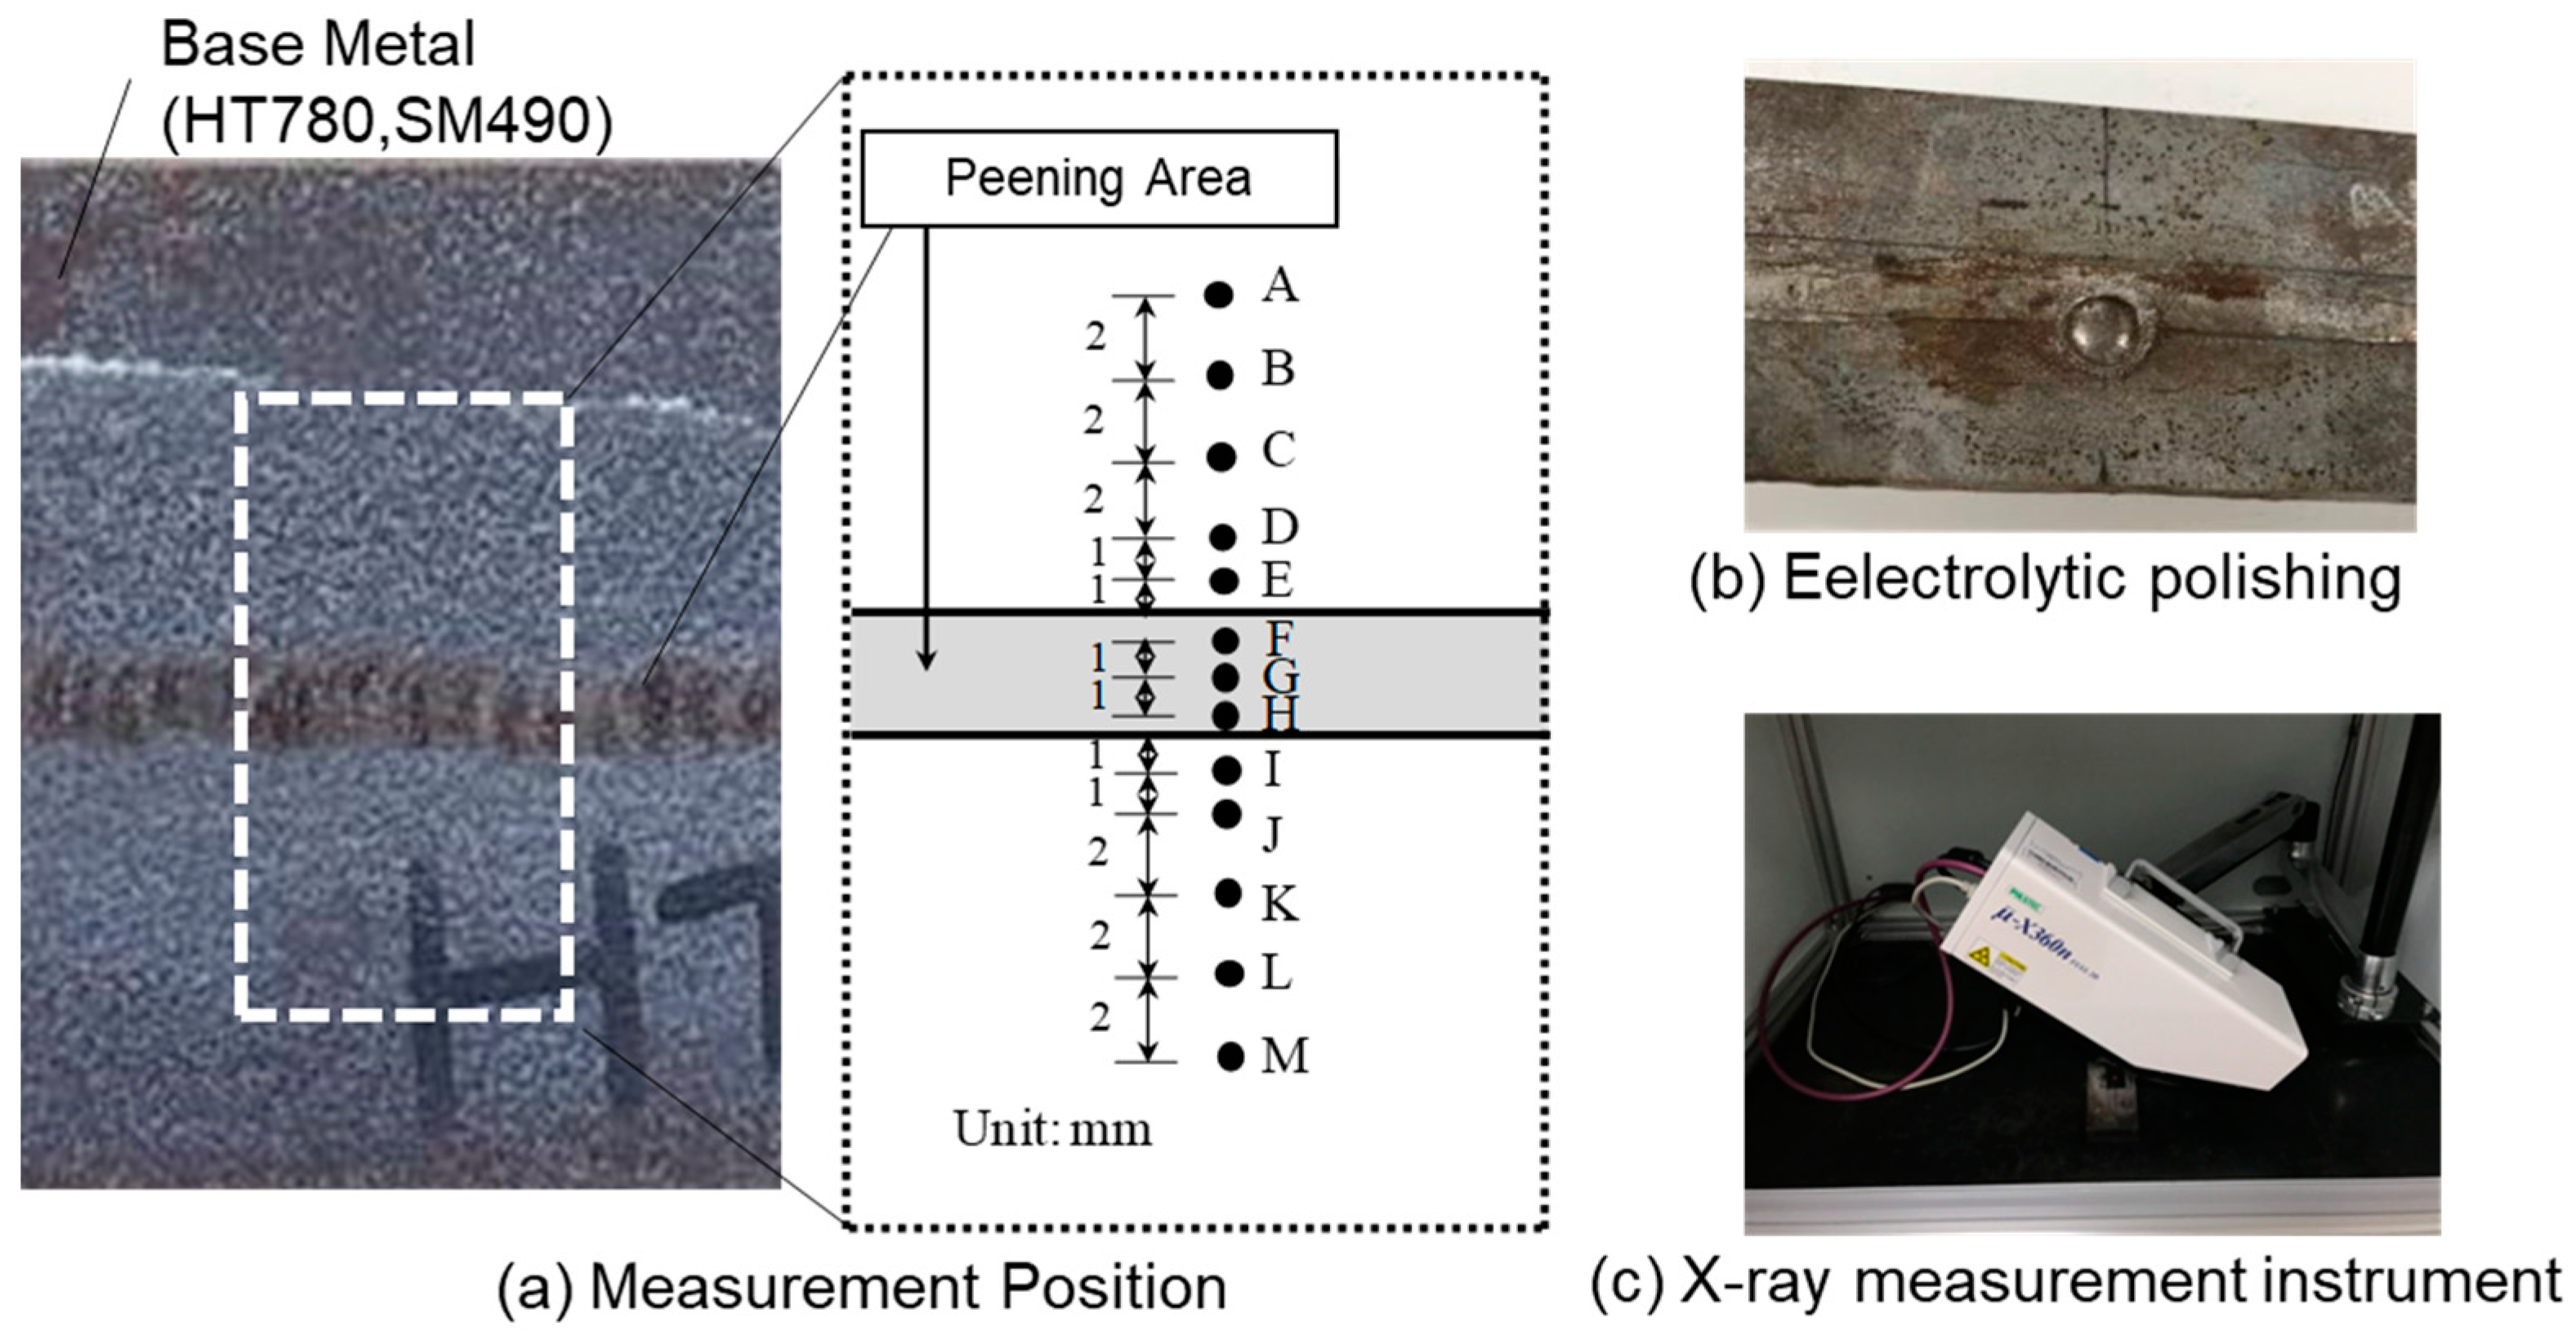
2.2. Method for Measuring Residual Stress

Figure 3 shows a schematic diagram of the measurement points of the surface residual stress after enlarging the area outlined by dots in Figure 1. The y-direction components of the residual stress were measured at 10 points, namely, the center position point G and points F and H at 1 mm from the plate width direction within the BMHIP treatment range, and the distance shown in Figure 3 from points E and I at 1 mm from the boundary outside the BMHIP treatment range. The surface residual stress was measured by the X-ray diffraction method (Cosα method: Collimator diameter 1 mm, measuring range diameter 2 mm) using Cr-K.ALPHA (μ-X360, Pulstec Industrial Co., Ltd., Shizuoka, Japan) (17 kV, 2.0 mA) as the X-ray source.
In addition, the distribution of residual stress in the depth direction was measured at the point located at 1 mm from the boundary (point E or I) and corresponding to the toe position, and at the farthest point (point A) when the BMHIP treatment was applied to the weld. The depth profile of the residual stress was estimated by X-ray diffraction and electrolytic polishing. In this estimation method, the stress is measured at the concave bottom surface after local electrolytic polishing (about Φ8 mm) and is regarded as the approximate stress at the depth position in the unpolished state. The exact residual stress distribution is not obtained because the residual stress is redistributed by the polishing. However, when the electrolytic polishing is shallow, the error from polishing is small, and it is shown by a comparison with the residual stress measured nondestructively by synchrotron radiation [10].

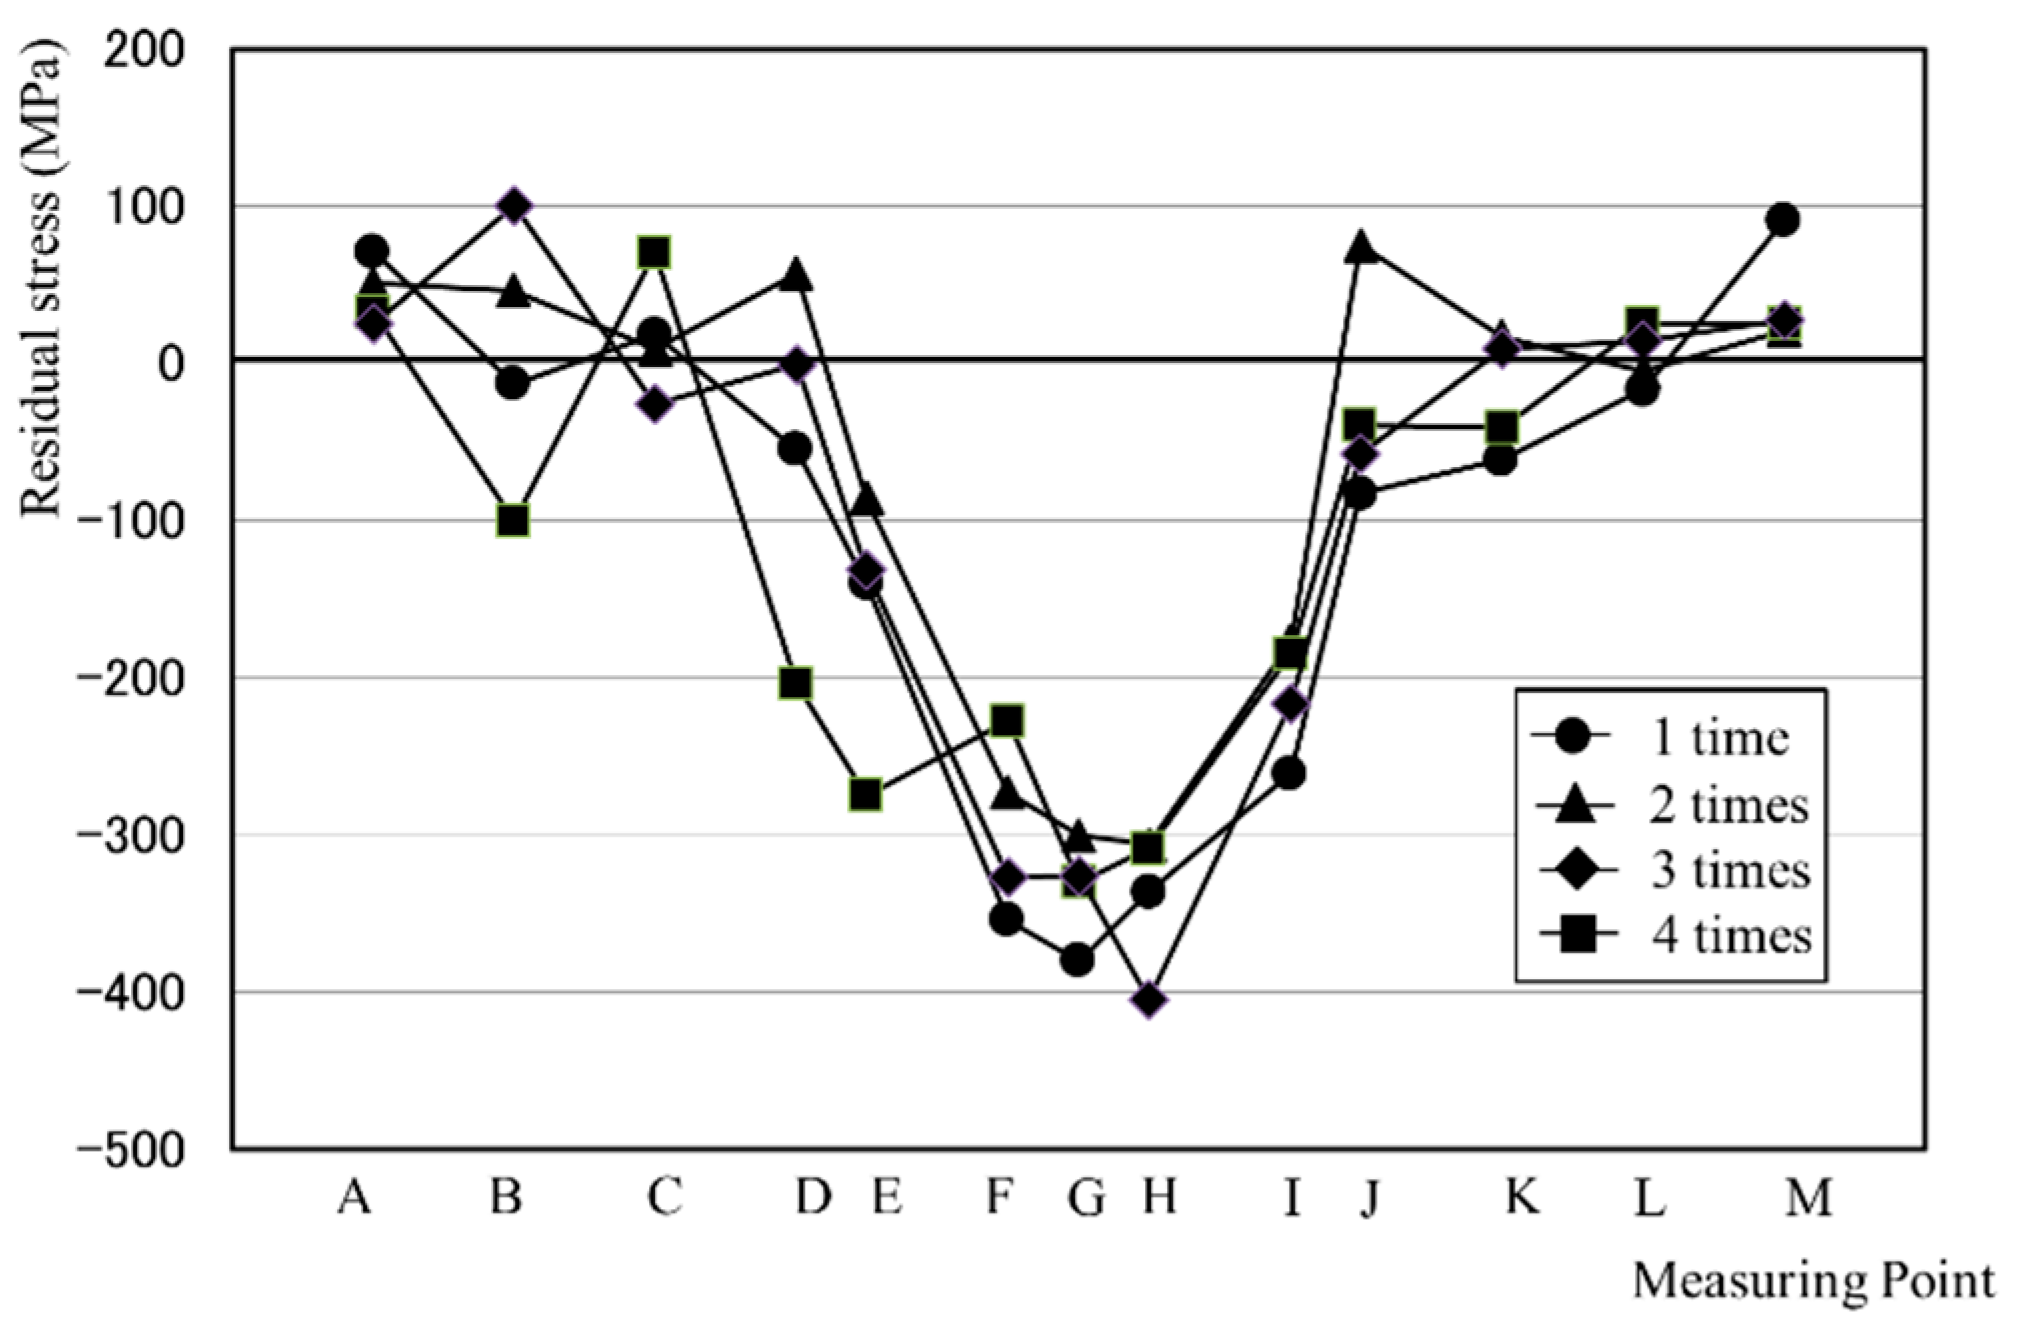
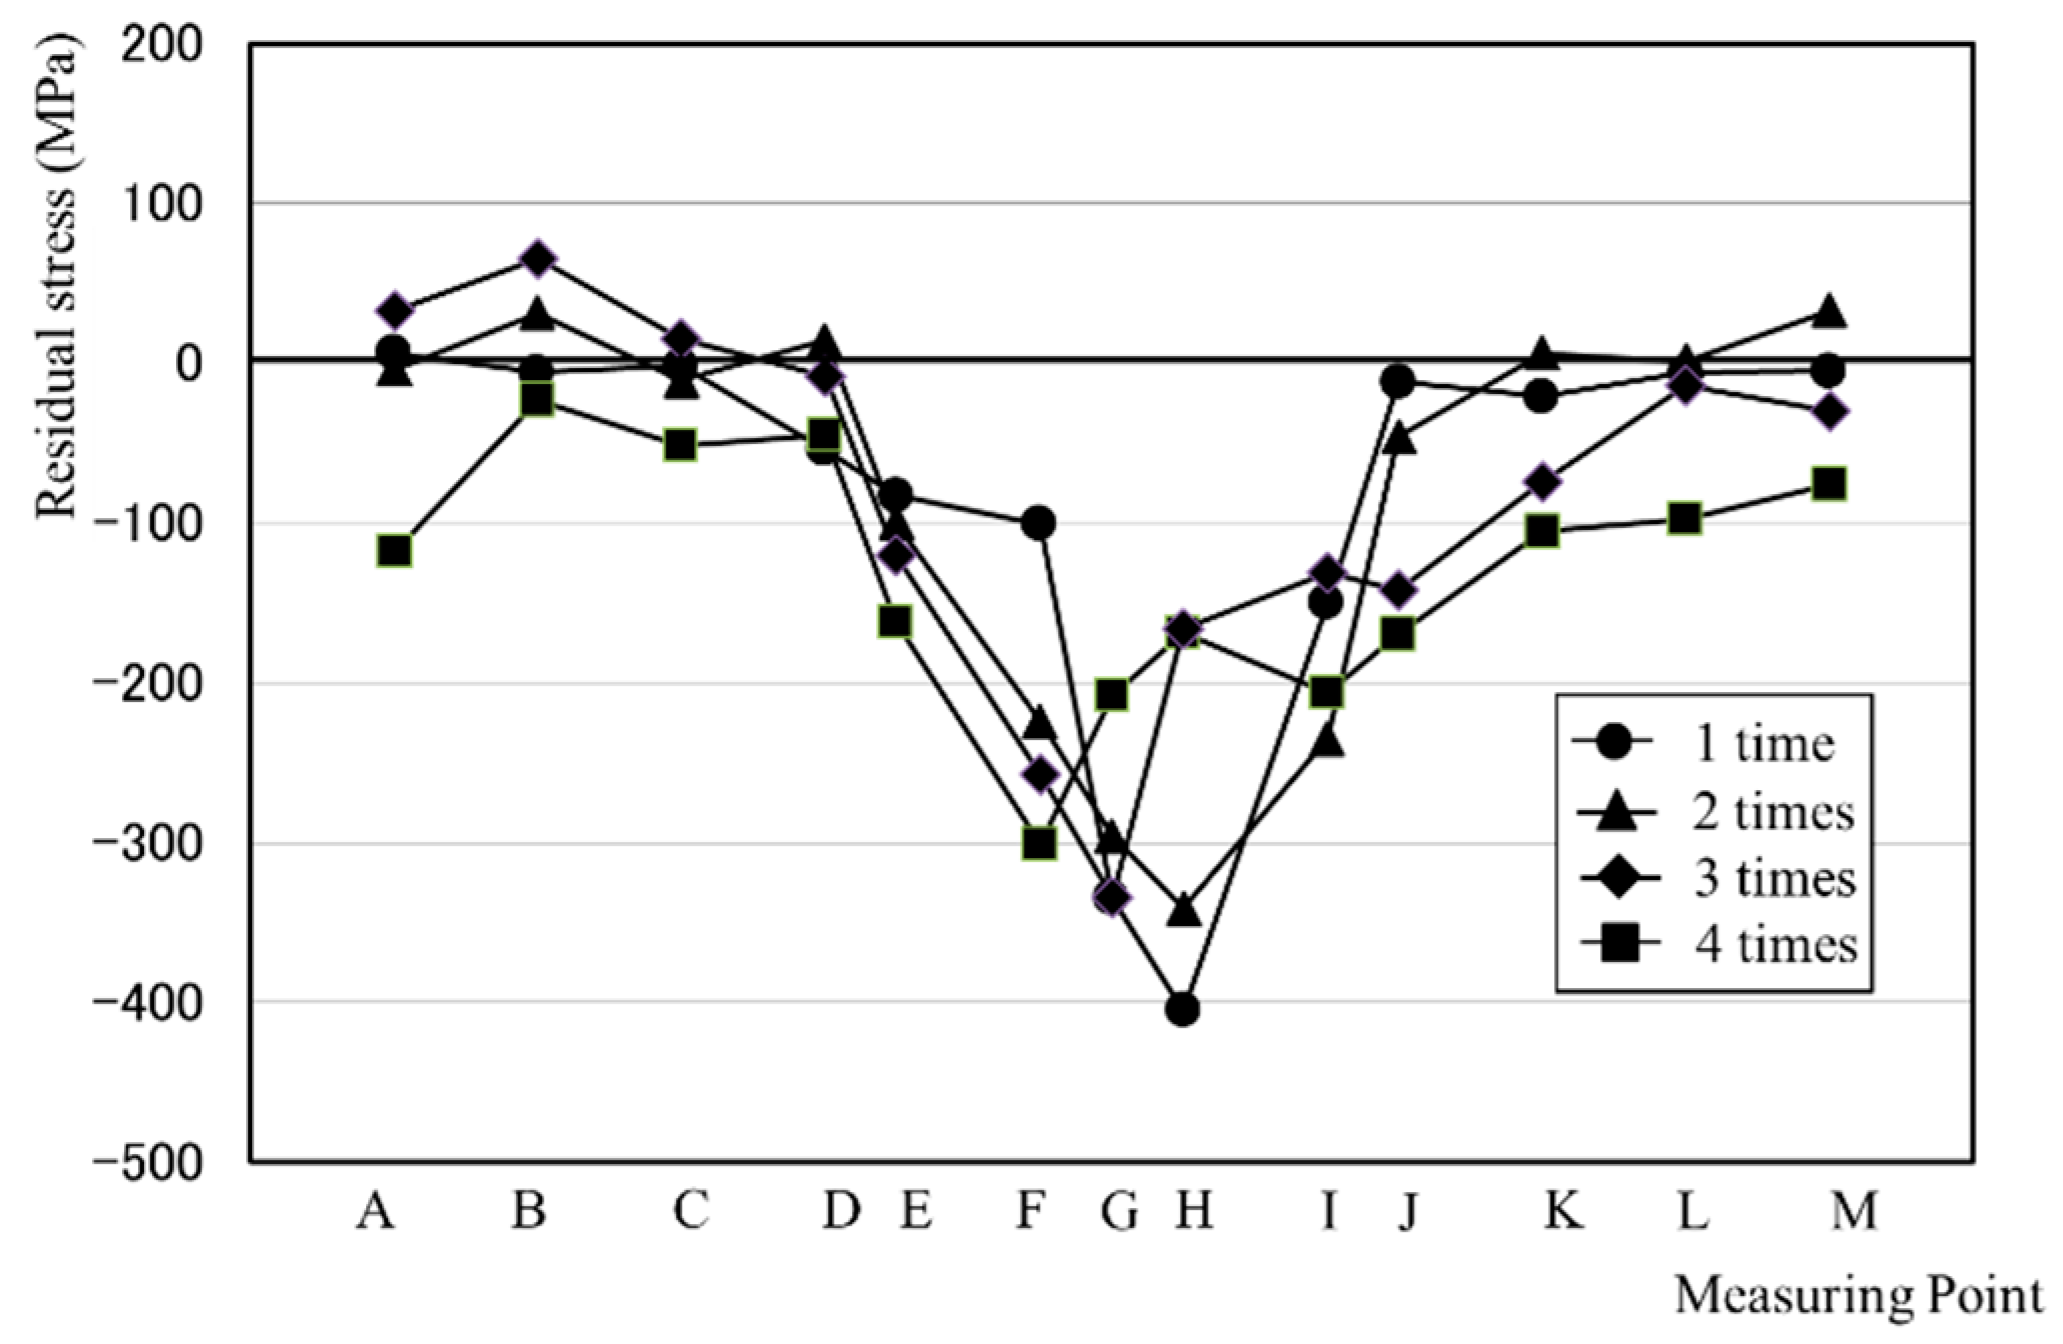
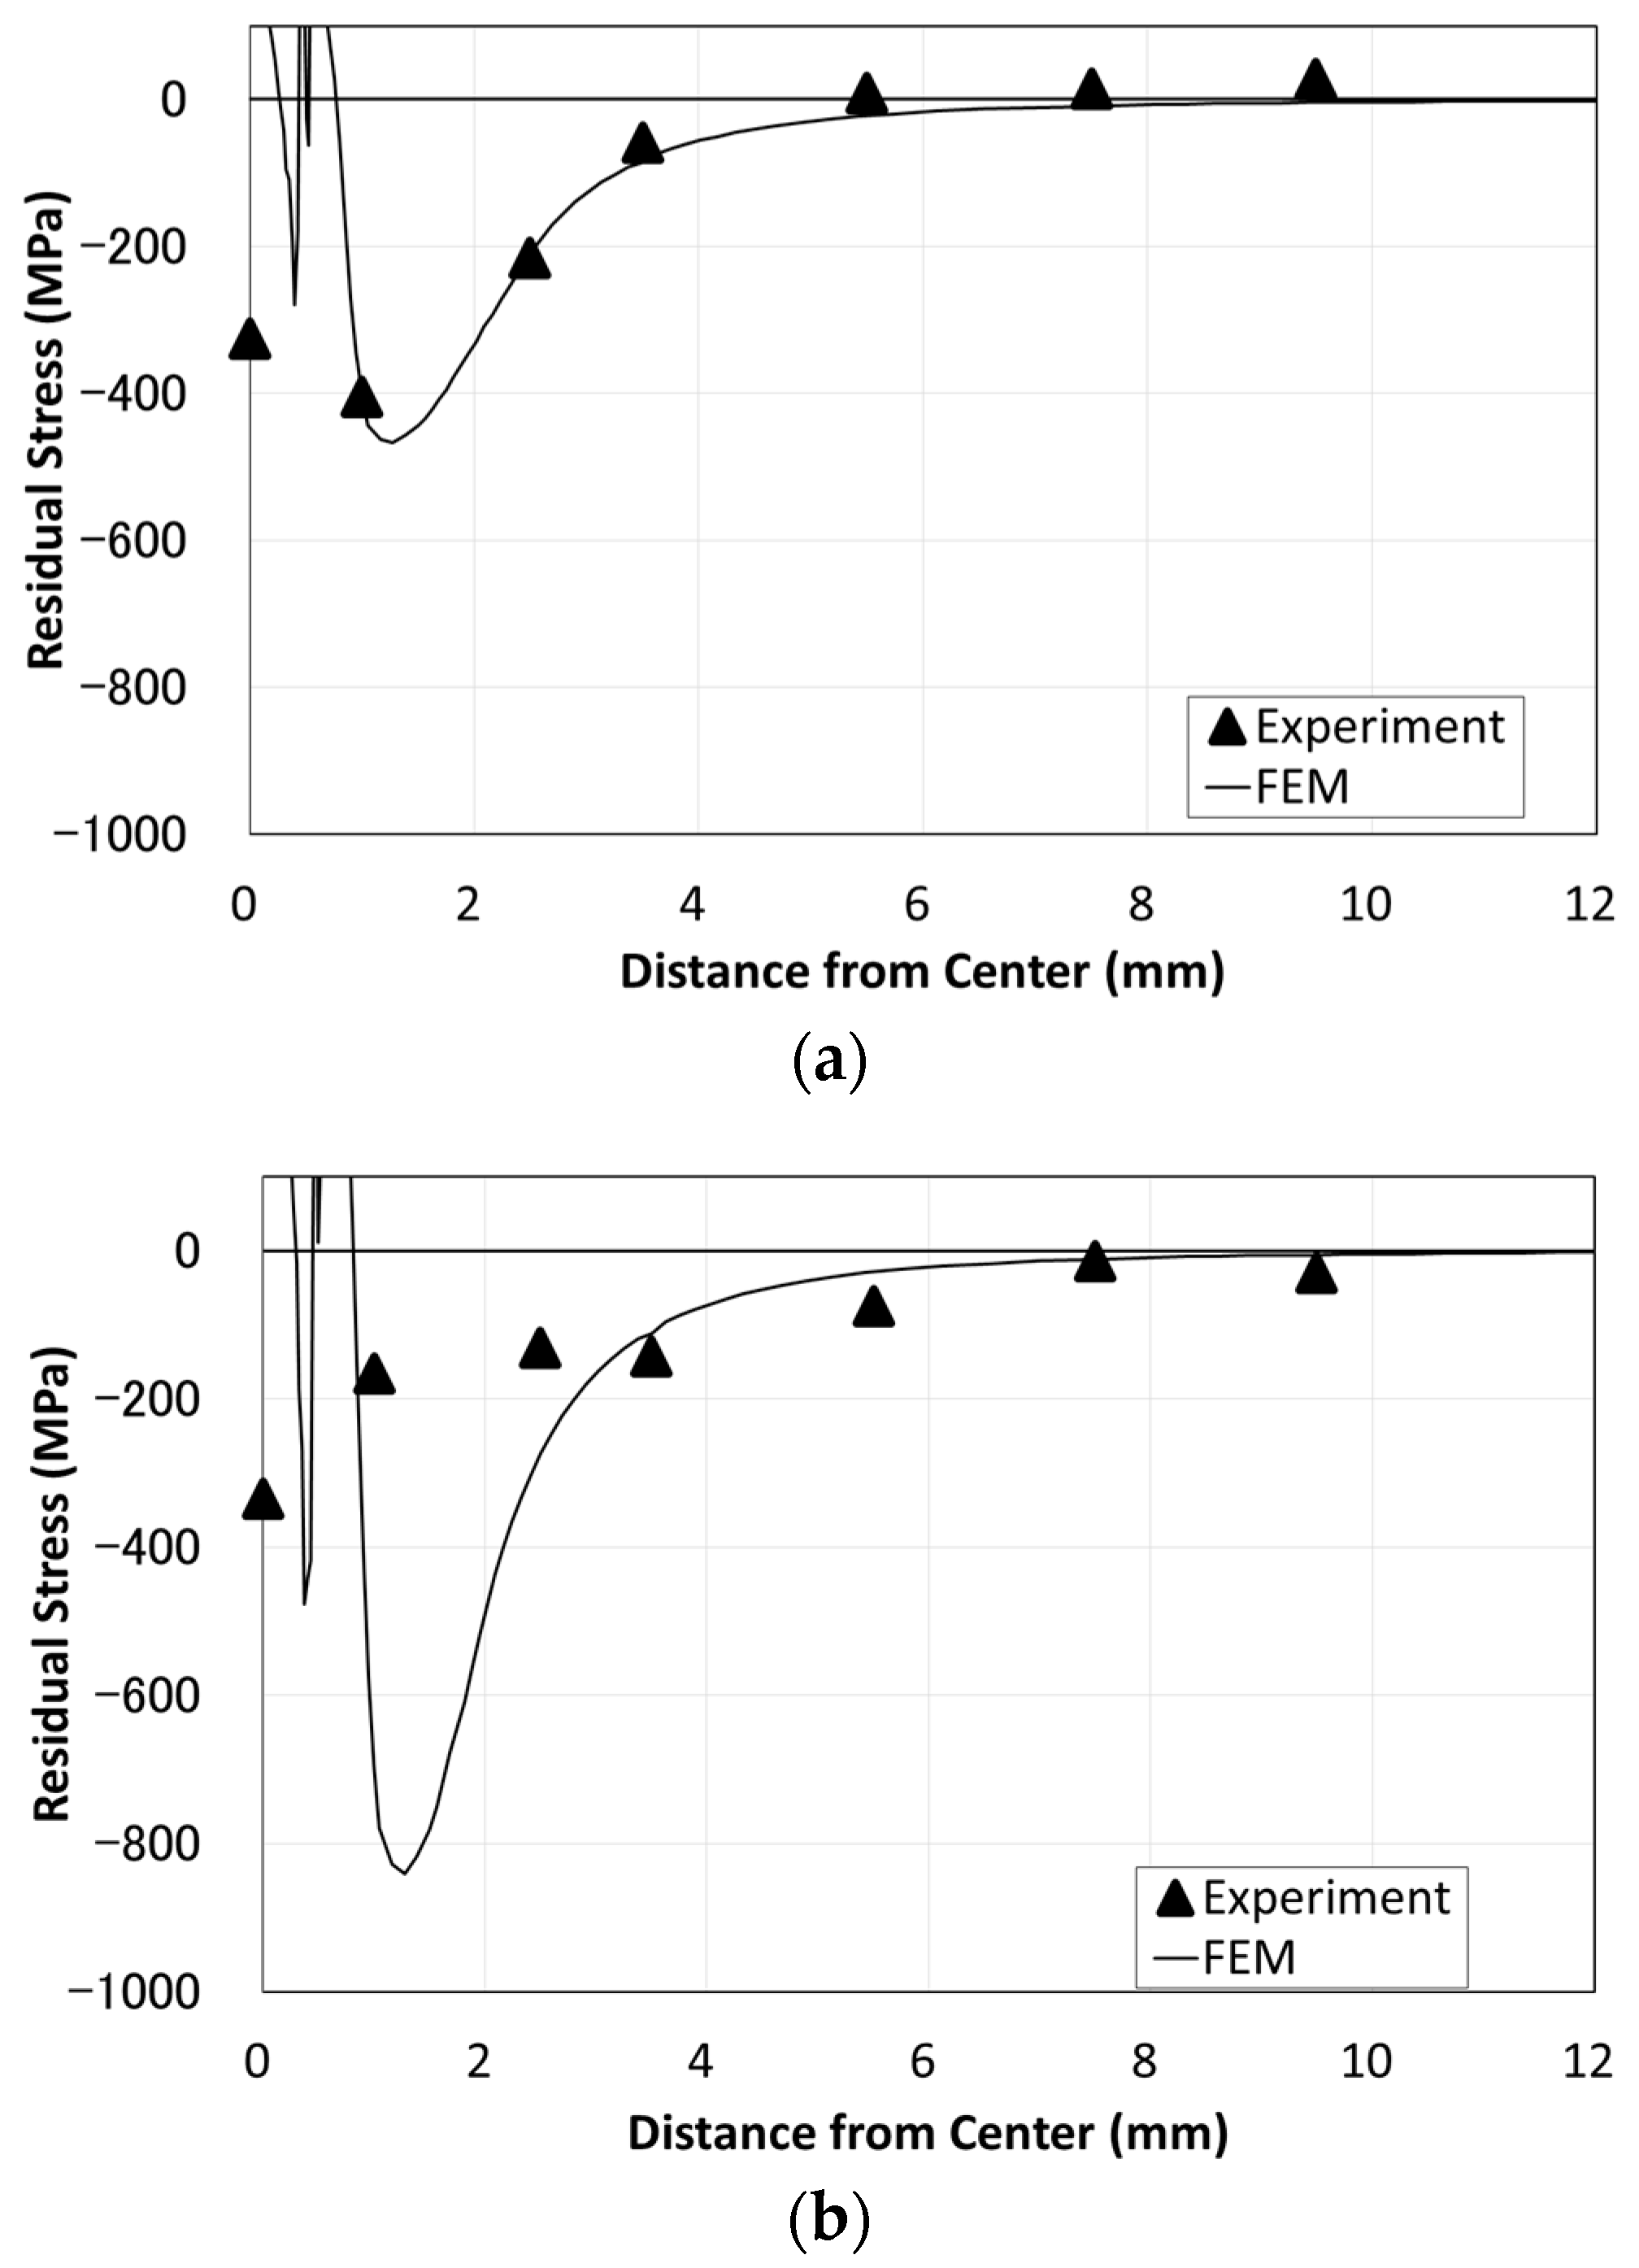
2.3. Surface Residual Stress Distribution

The measurement results for the surface residual stress of SM490 and HT780 are shown in Figure 4 and Figure 5, respectively. For both SM490 and HT780, points F, G, and H of the BMHIP application range are about −200 to −400 MPa for SM490 and about −100 to −400 MPa for HT780. Points E and I at 1 mm from the BMHIP treatment boundary also showed a compressive residual stress of about −100 to −300 MPa. However, little compressive residual stress was generated at points A–C and K–M at more than 4 mm from the boundary. On the other hand, for both SM490 and HT780, the number of times of BMHIP was not significantly changed from the first to the fourth in SM490, and the magnitude and the range of compressive residual stress caused by the increase in the number of times were not significantly different. For HT780, in the impact area (F to H), the first blow is the largest residual stress, which tends to decrease as the number of impacts increases. On the other hand, the compressive residual stress near the impact area (D to E and I to J) tends to increase as the number of impacts increases.
When the surface residual stress distribution is compared between the SM 490 and the HT780, the depth of the HT780 is about 1/2 of that of the SM490 as shown in Table 1, but as shown in Figure 4 and Figure 5, the maximum value and the range of the compressive residual stress distribution are similar. However, in the case of HT 780, the residual stress inside the impact area (F to H) tends to decrease as the number of impacts increases.

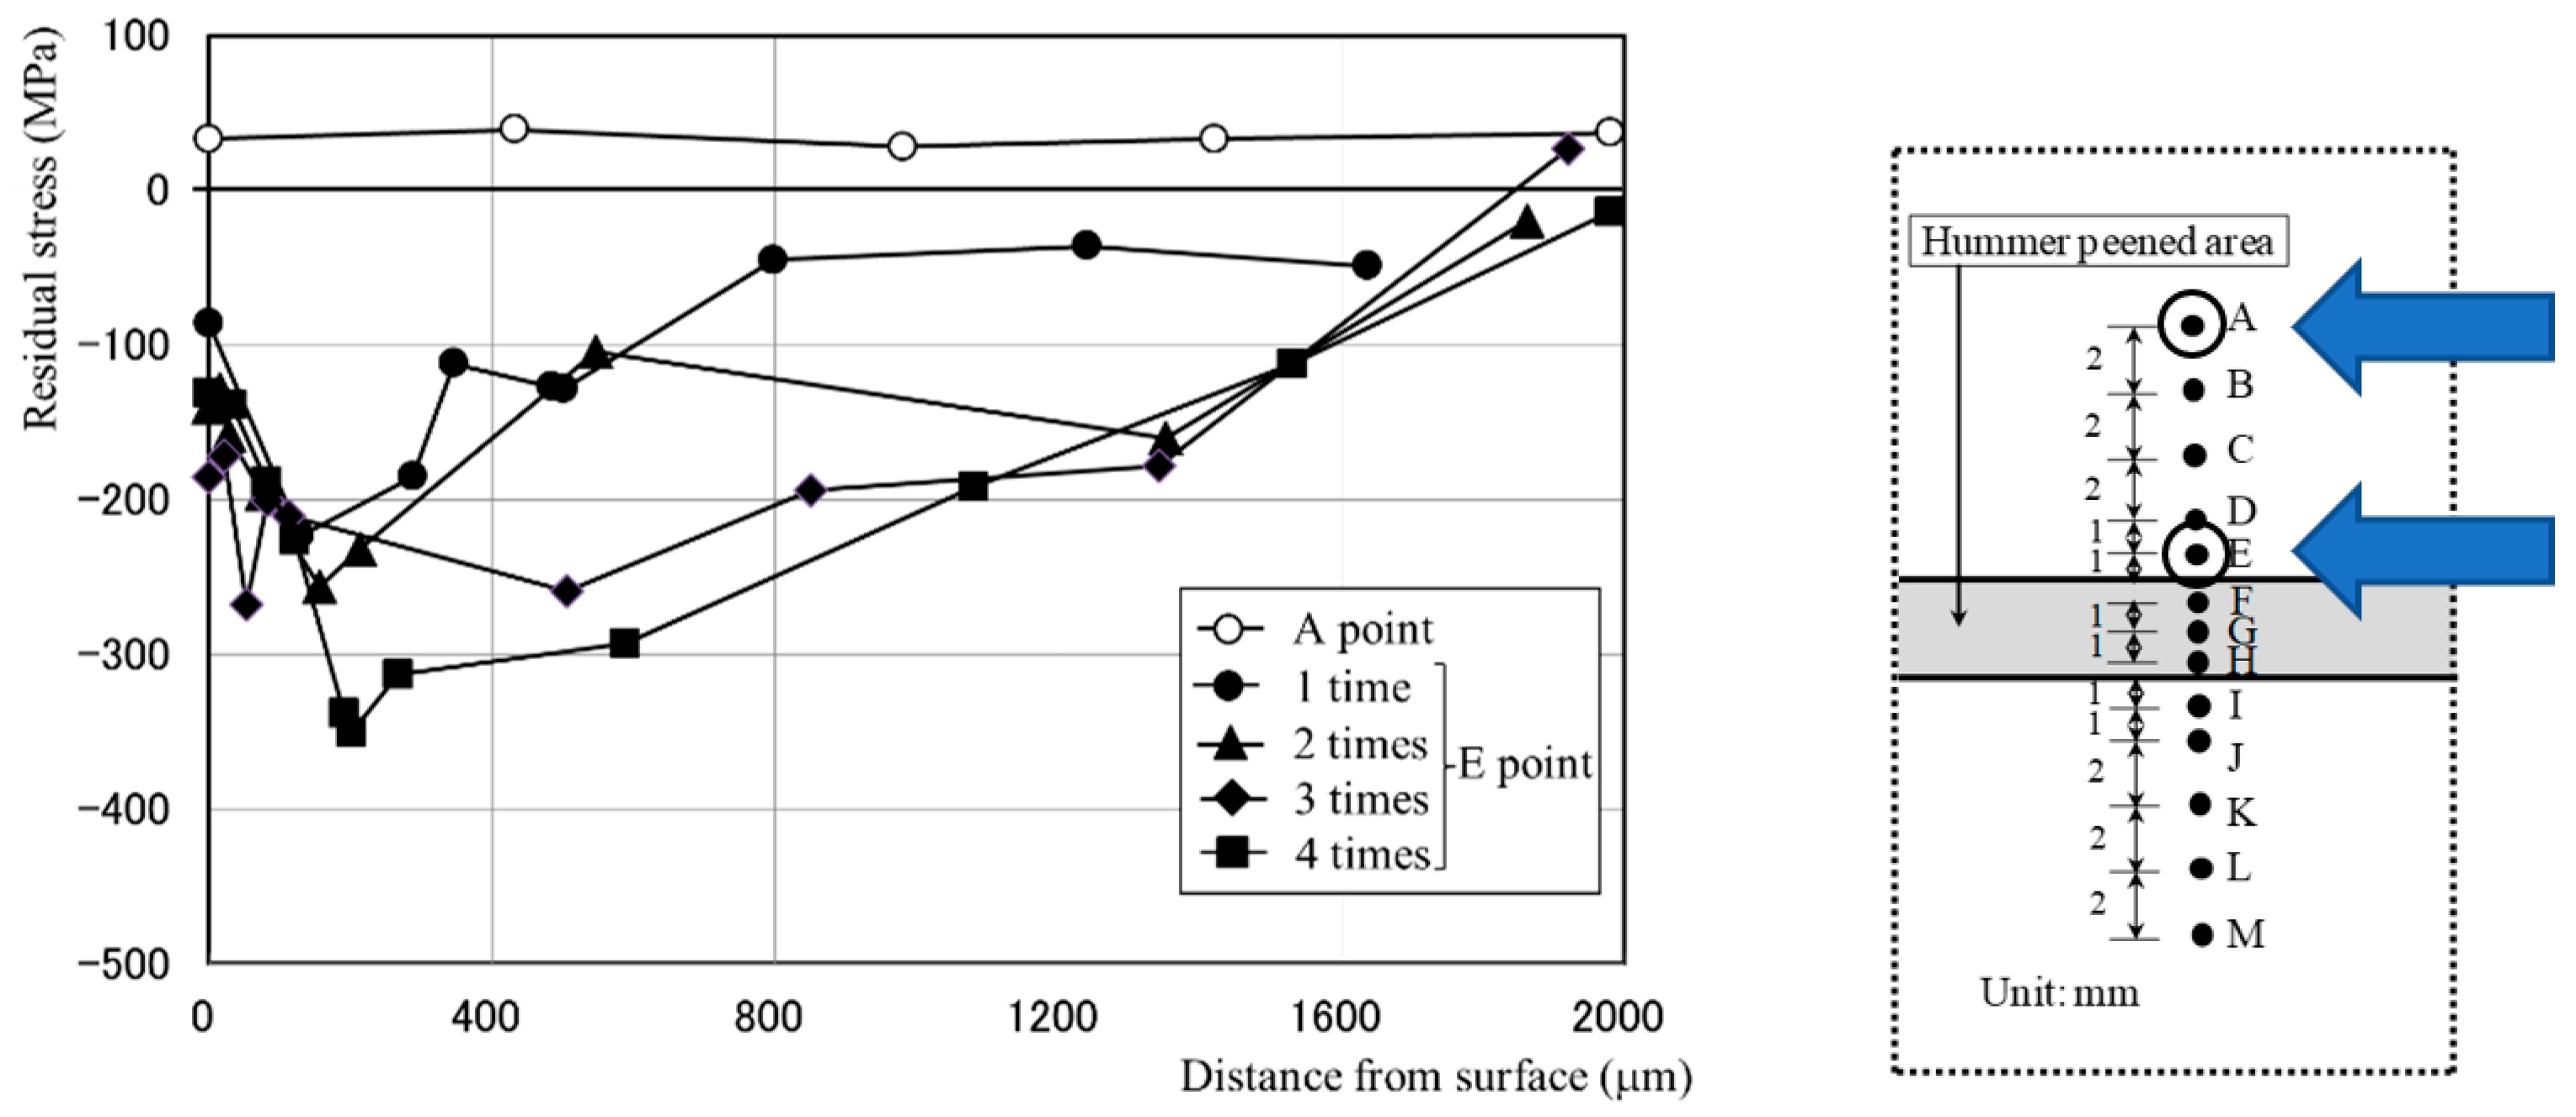
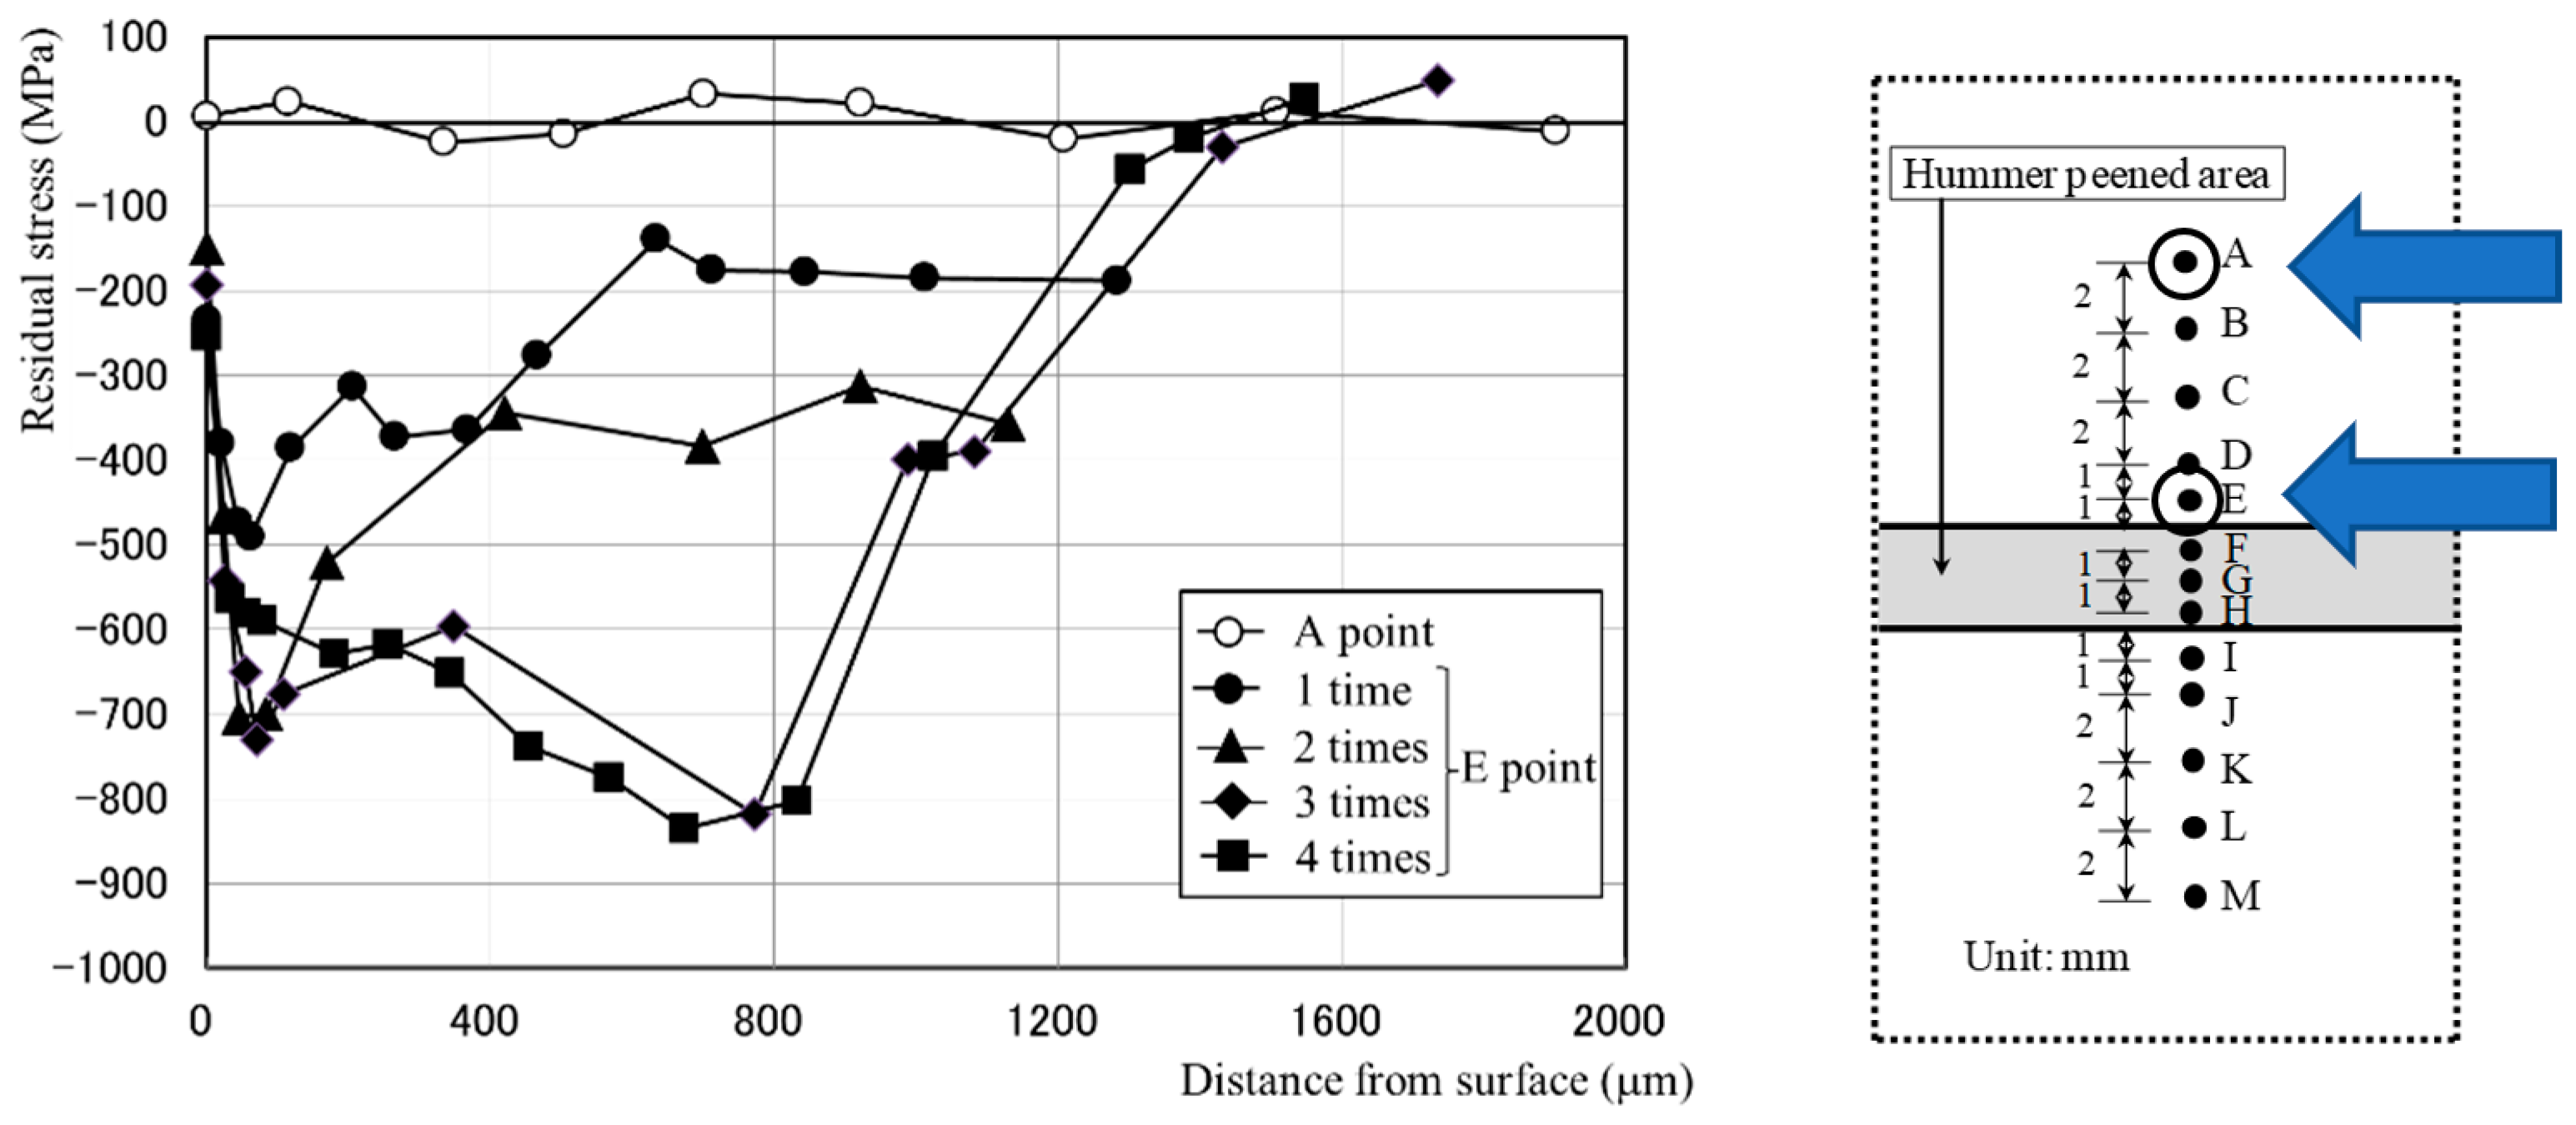
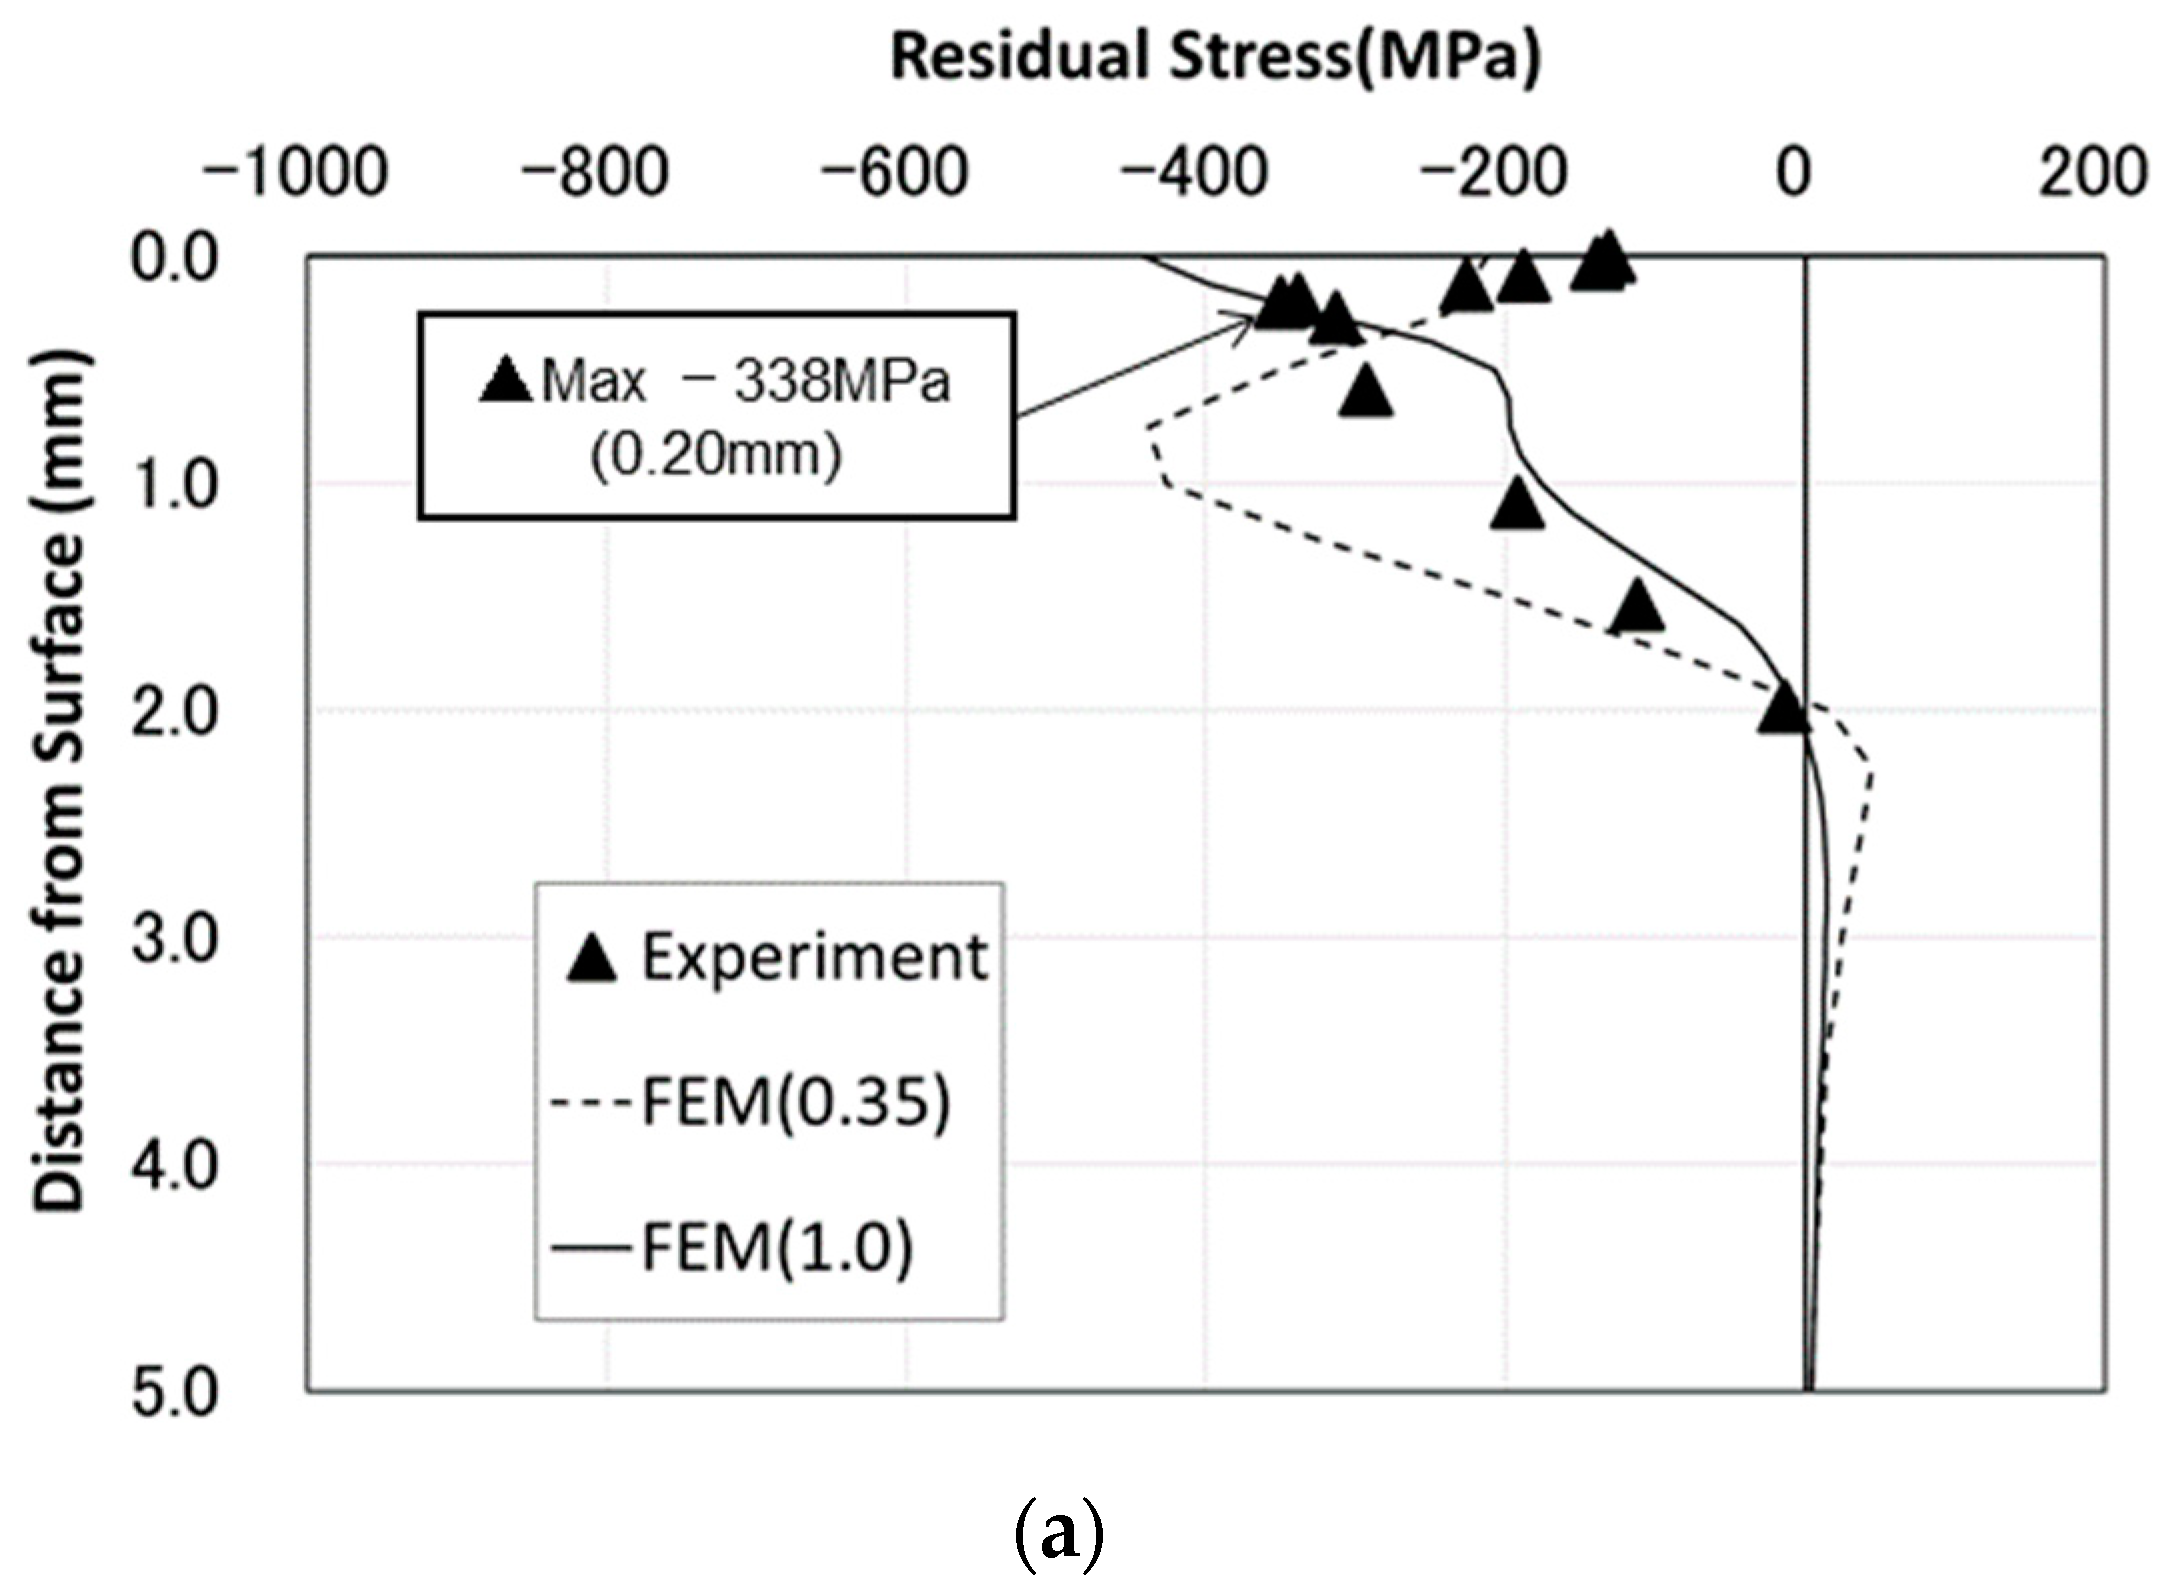
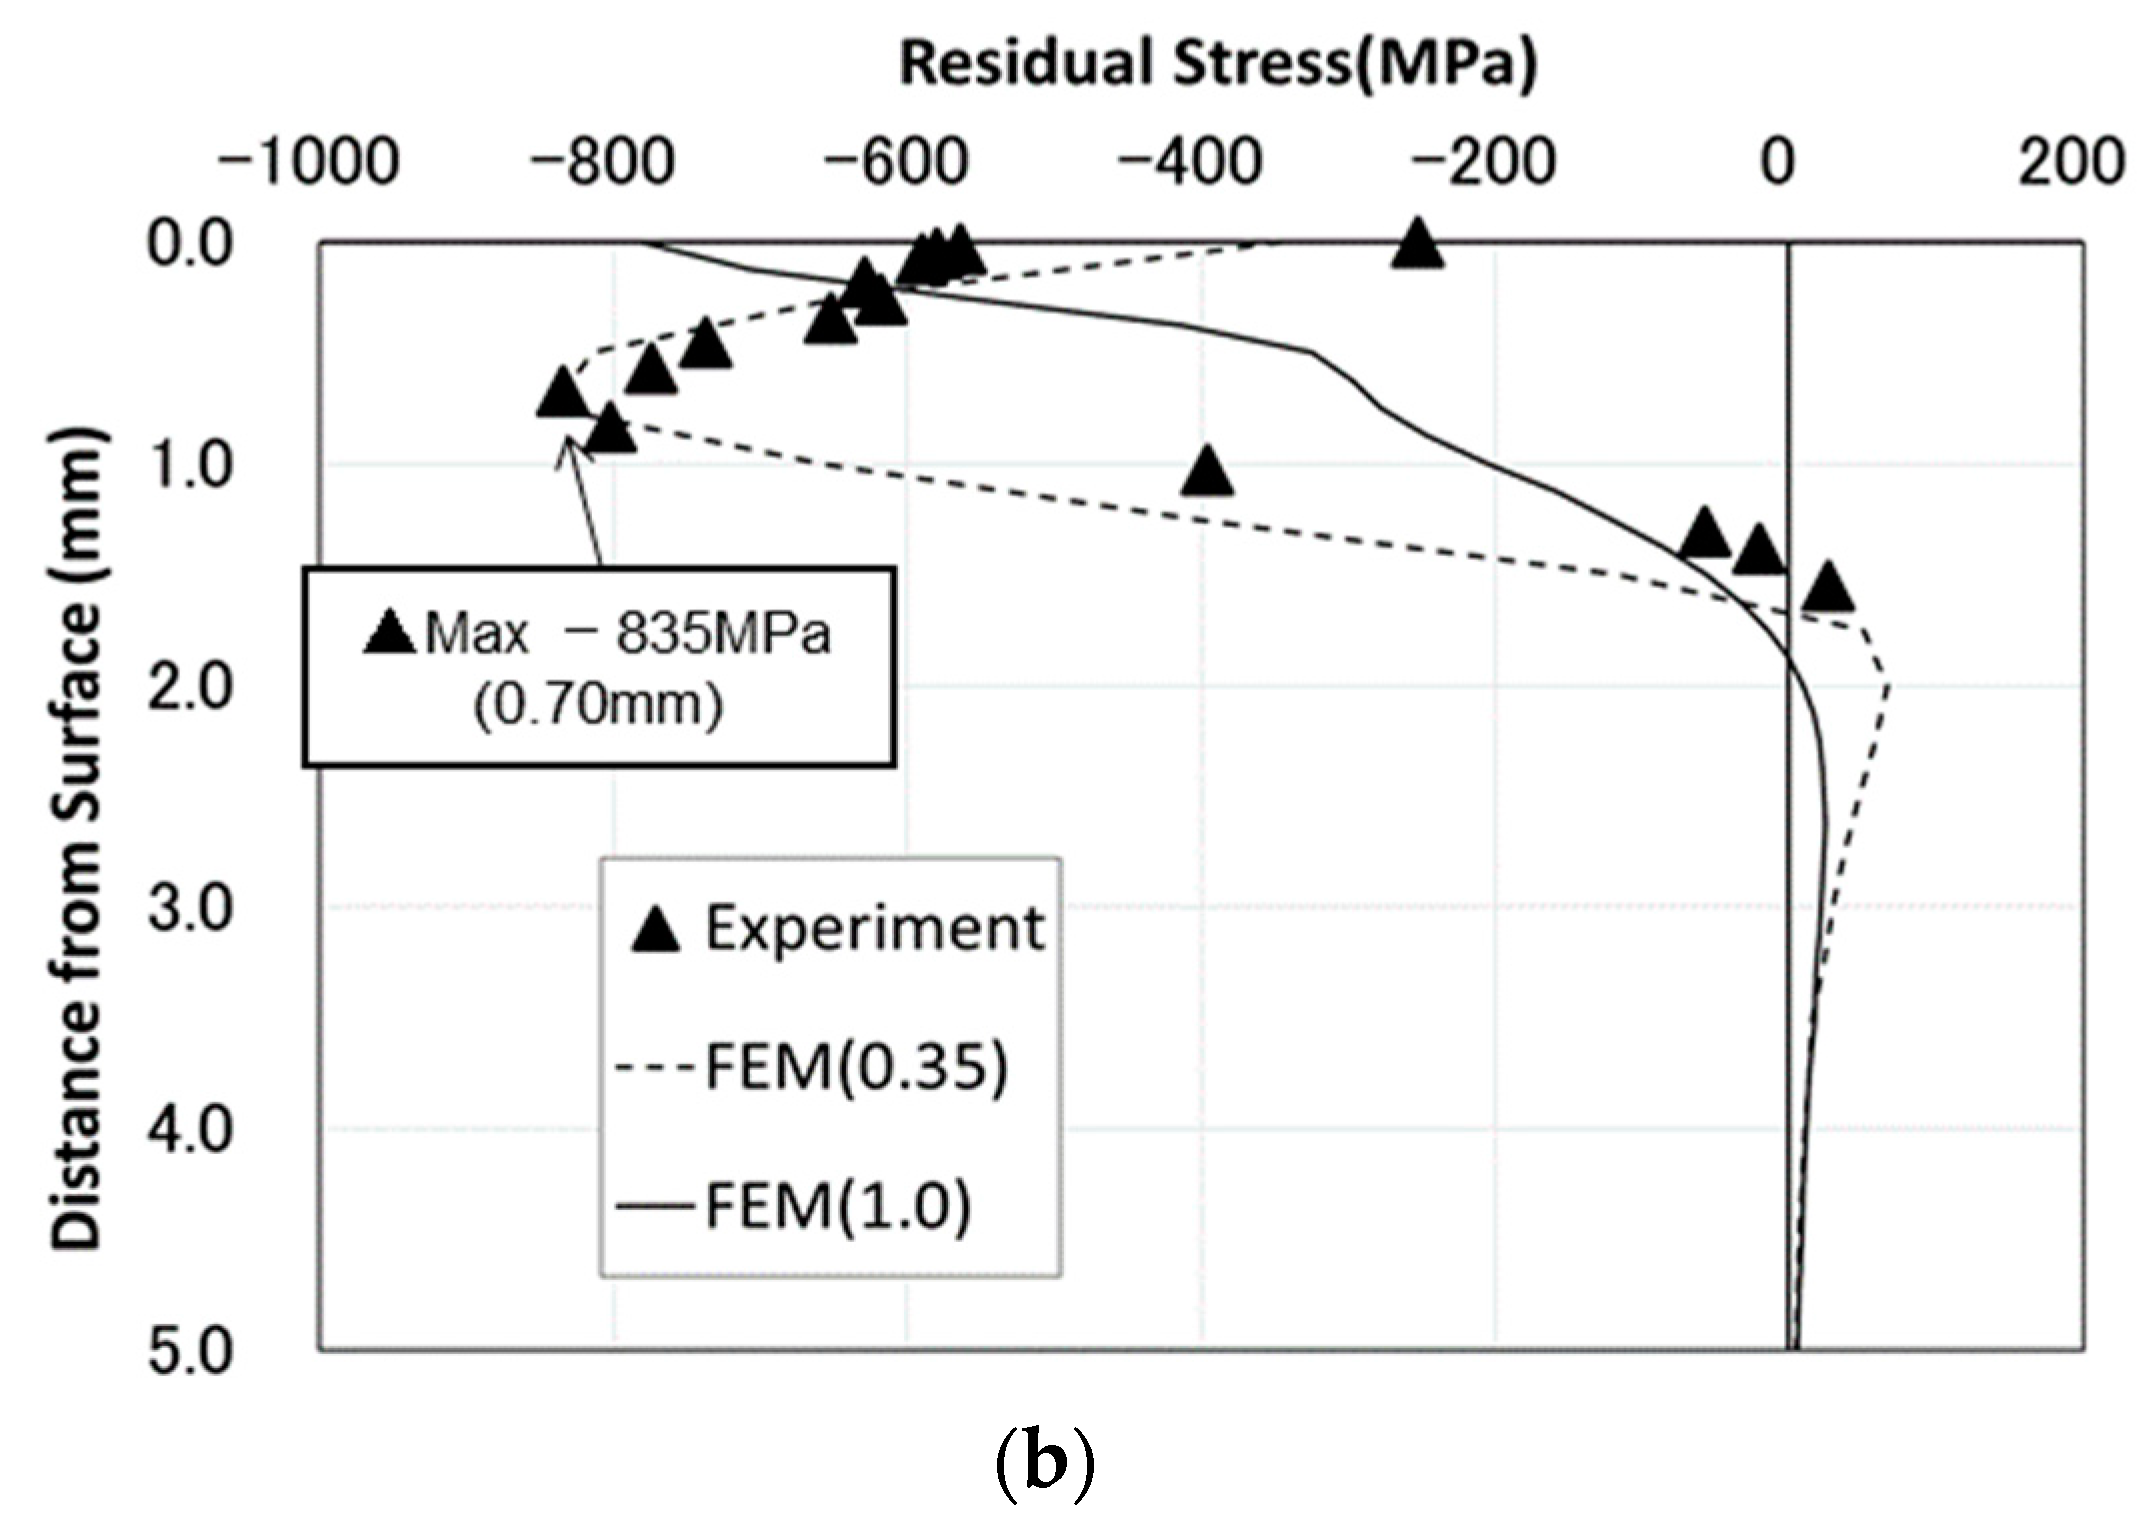
2.4. Distribution of Residual Stress in Depth

The measurement results for the depth distribution of the residual stress in SM490 and HT780 are shown in Figure 6 and Figure 7, respectively.
In the case of SM490, small tensile stresses of +30 MPa were measured at point A at all depths up to 2 mm. On the other hand, in the vicinity of the BMHIP treatment boundary (1 mm from the edge: point E or point I), the compressive residual stress increased as the depth increased. The maximum value appeared at a depth of 120–200 μm and tended to decrease as the depth further increased. The maximum value at each treatment frequency was −223 MPa for one time, −256 MPa for two times, and −350 MPa for four times; although the maximum value was not obtained for three times, the values tended to increase as the treatment frequency increased. In addition, the compressive residual stress decreased to about −100 MPa immediately after the maximum value was reached for one and two times, while for three and four times, a compressive residual stress of about −200 MPa was generated up to about 1000 μm.
In the case of HT780, point A was approximately 0 MPa at all depths. In the vicinity of the BMHIP treatment, the compressive residual stress increased with the depth, reached a maximum value at a depth of about 120 μm for a frequency of one or two times, and then decreased to −400 MPa or less. On the other hand, a maximum value was reached at a depth of 600–800 μm for a frequency of three or four times, with a large compressive residual stress of over −600 MPa generated at about 800 μm. The maximum value at each treatment frequency was −491 MPa for one time, −704 MPa for two times, −818 MPa for three times, and −835 MPa for four times.
The previous study [5] showed that a fatigue strength of over two grades could be obtained at a BMHIP treatment frequency of over four times in SM490Y material. It was also confirmed that the compressive residual stress value of the ordinary SM490 material in this study was almost the maximum at a treatment frequency of three times; the value levelled off at a frequency of four times. When BMHIP was applied to HT780, the depth of the indentation was about half that of SM490, but a larger compressive residual stress was introduced, and similar to SM490, the indentation tended to plateau at a frequency of three times. That is to say, it was proven that stable residual stress was obtained by performing the base metal striking work more than three times for both SM490 and HT780.

3. Elucidation of the Mechanism of Residual Stress Introduction by Analysis

The mechanism of the introduction of compressive stress by peening was examined by analysis. In the literature [8], the residual stress was simulated by BMHIP assuming a thermal expansion strain, but the physical meaning of thermal expansion strain is not clear and the relationship between a concave shape and residual stress is not known. Therefore, in this study, it was simulated by deformation by the indentation of a rigid pin, and the generation of residual stress was examined.

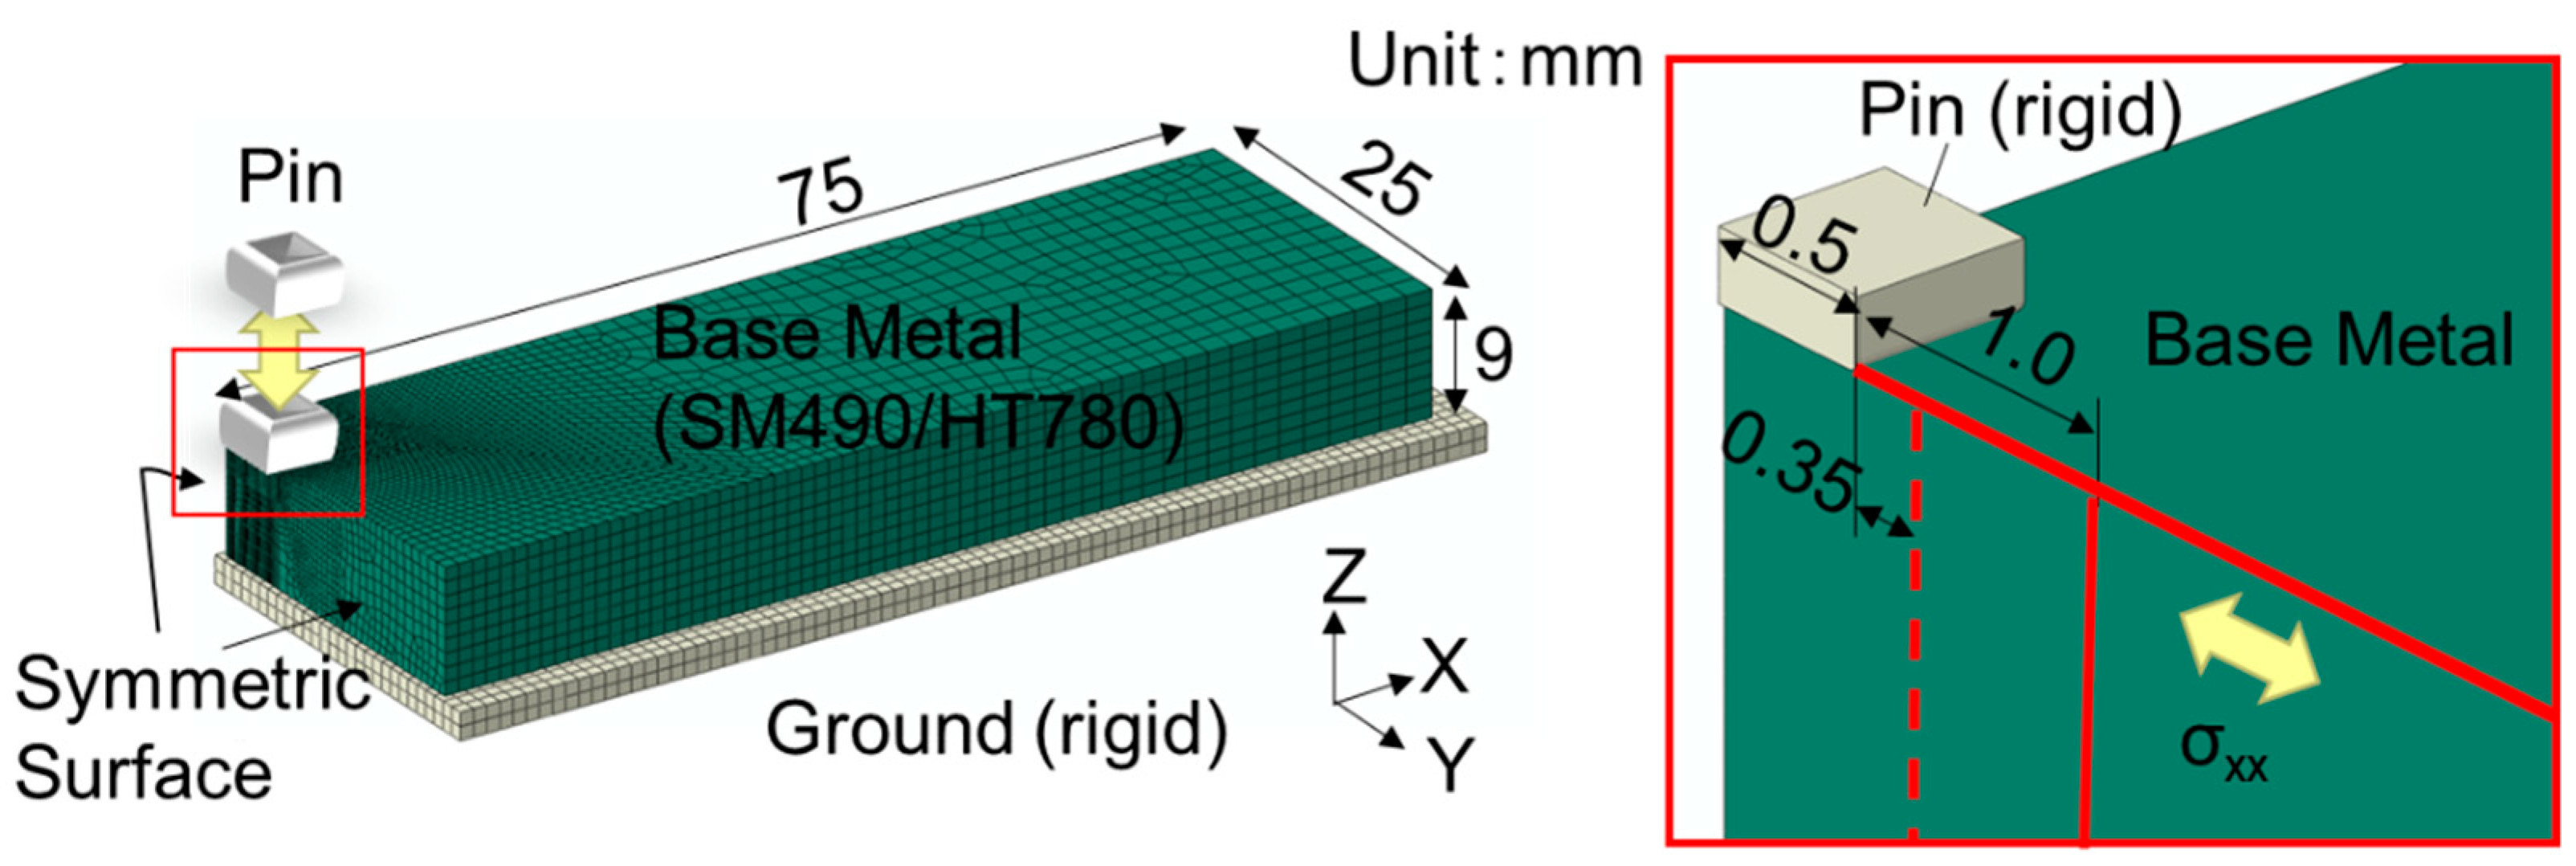
3.1. Analysis Conditions

On the assumption that the central part of the test specimen shown in Figure 1 was hit by a pin, the analysis was carried out using a one-quarter symmetric model, as shown in Figure 8. The flat portion of the pin was assumed to be a rigid body of 1 mm2. The pin was pushed so that the indentation was about 0.1 mm, and it was moved up and down until it completely separated from the base material. As shown in Table 2, the two cases of SM490 and HT780 were analyzed.
Elastoplastic analysis was carried out using the general-purpose program ABAQUS (Version 2016, Dassault Systemes) and a multilinear moving hardening rule for the material constitutive law. The analytical model was modeled with hexahedral isoparametric solid elements with a detailed mesh near the contacts. A rigid pin was pushed in, and when a prescribed deformation quantity was obtained, the pin was raised until the contact separated. A contact condition was given to the pin and base metal, and the friction coefficient was set at 0.4. The bottom surface was rigid, and the contact condition was the same as the base material bottom surface and the pin.

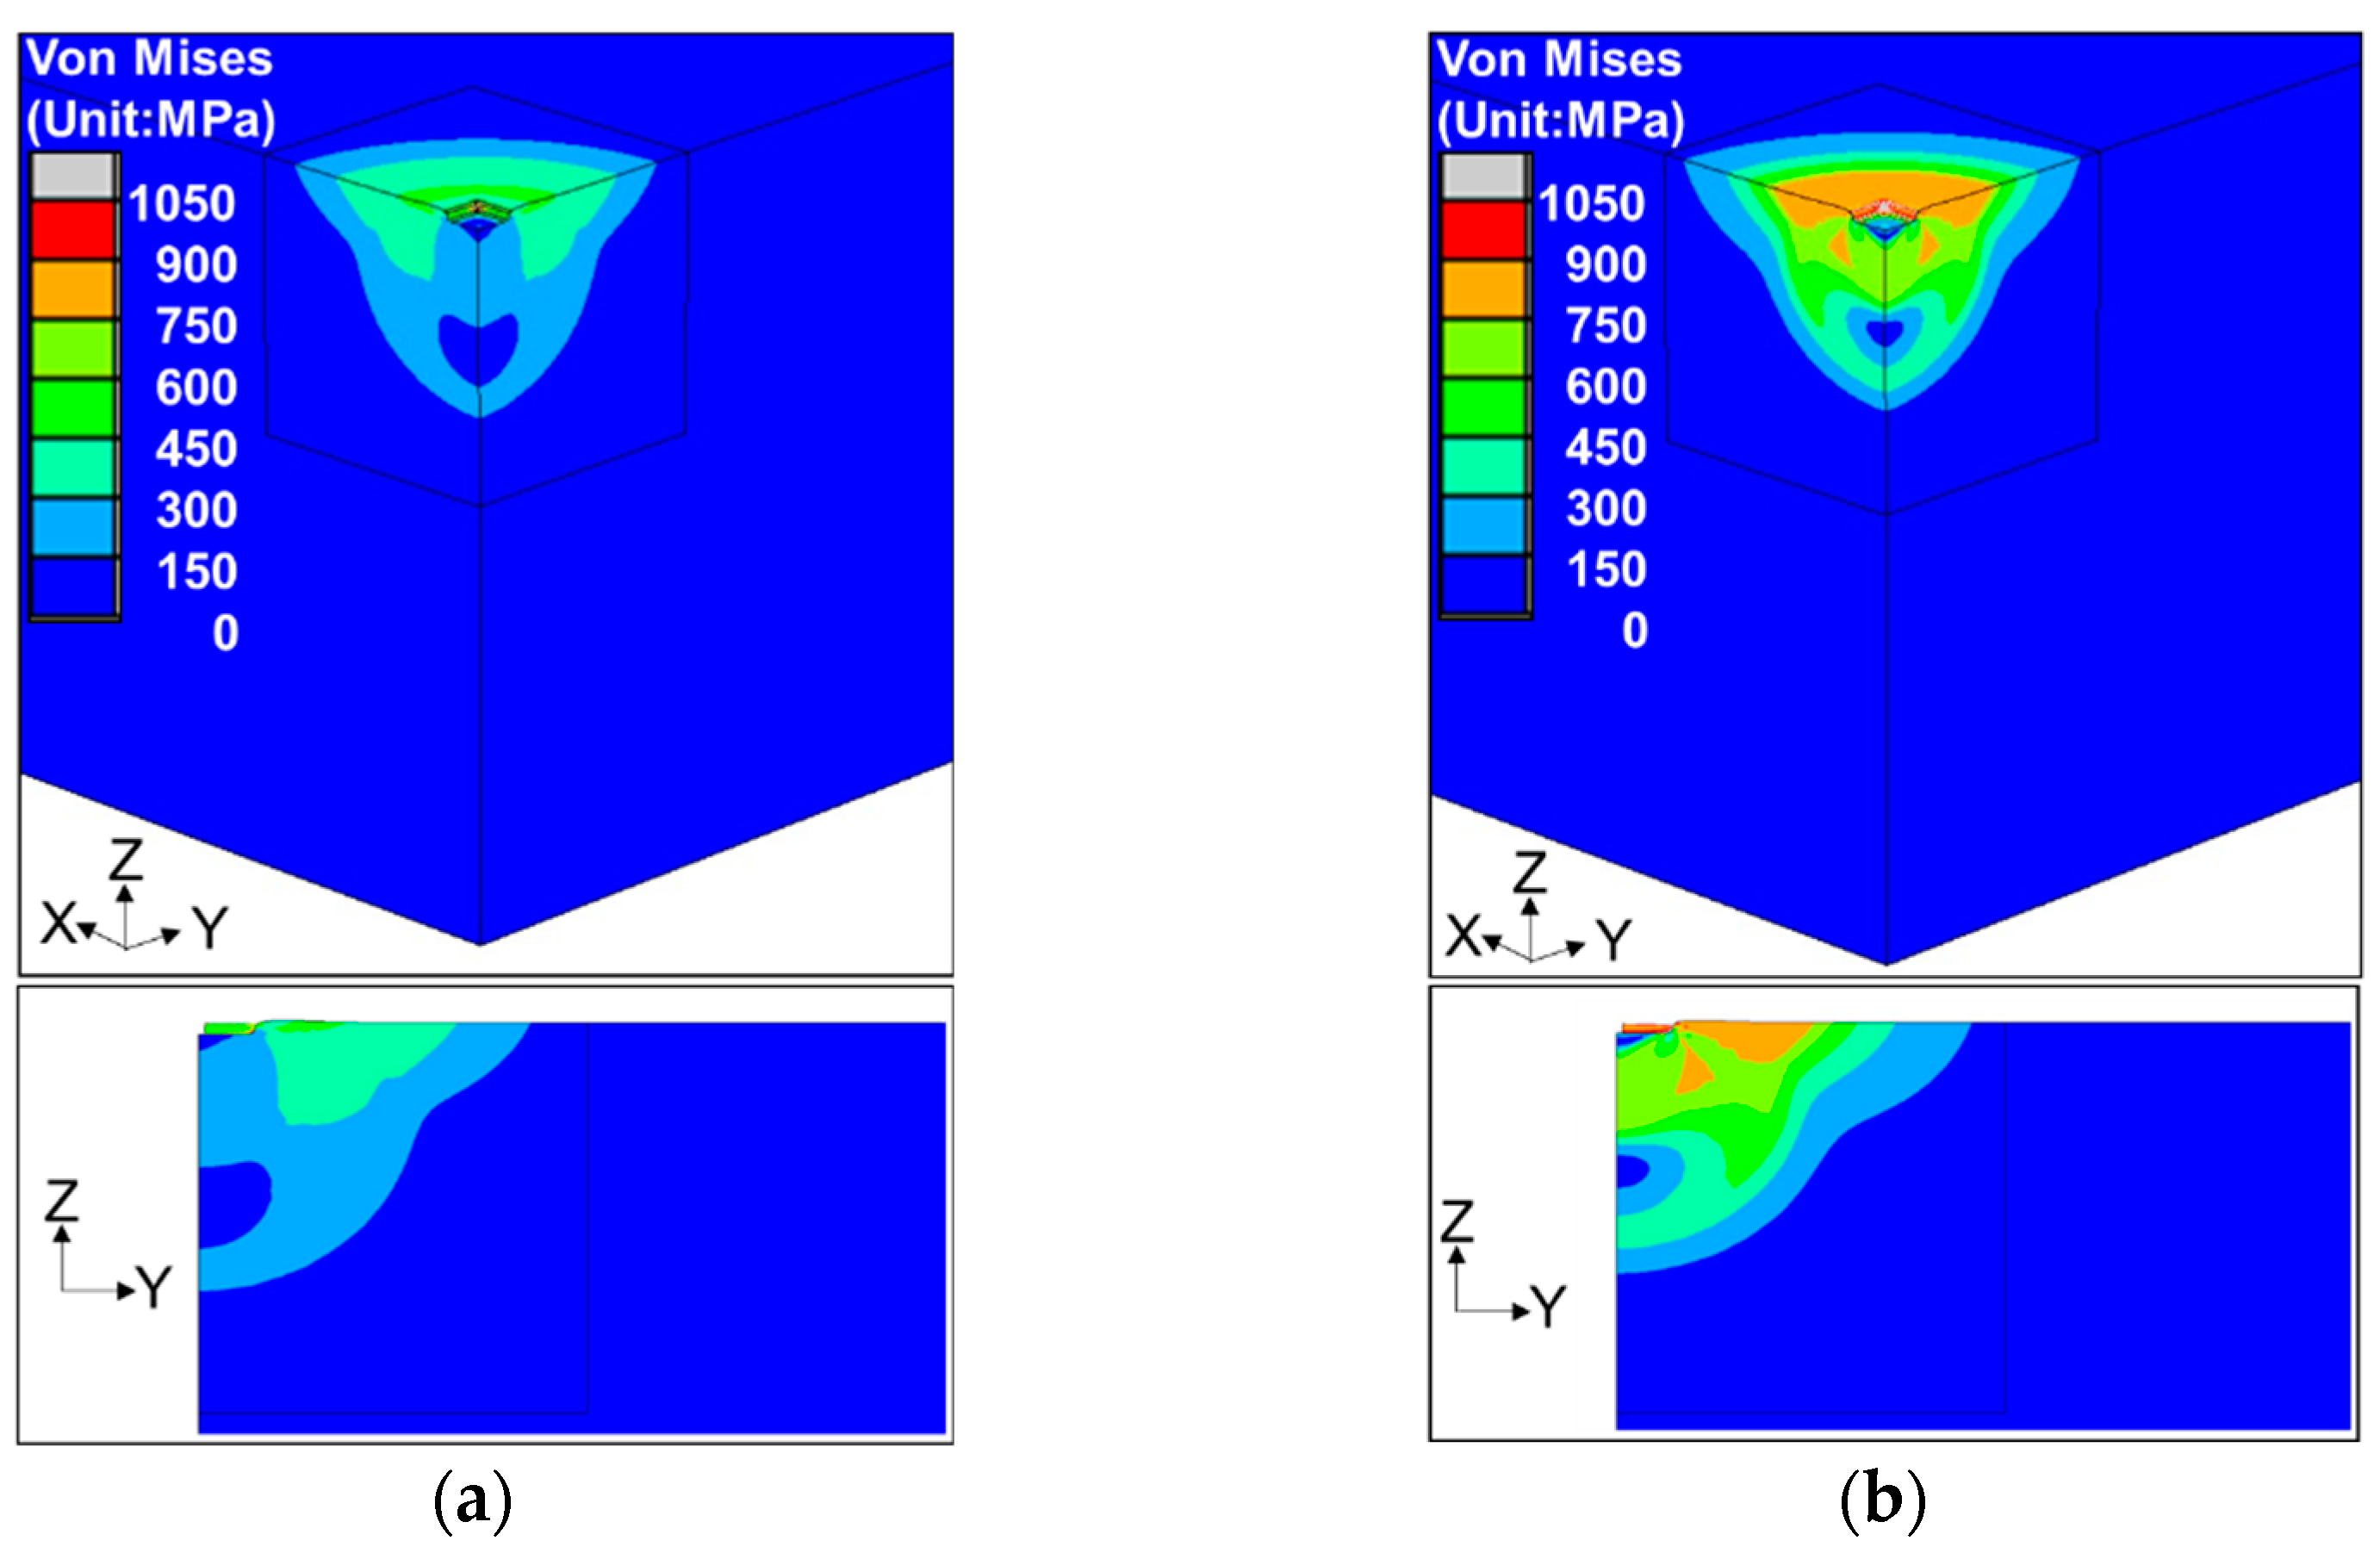
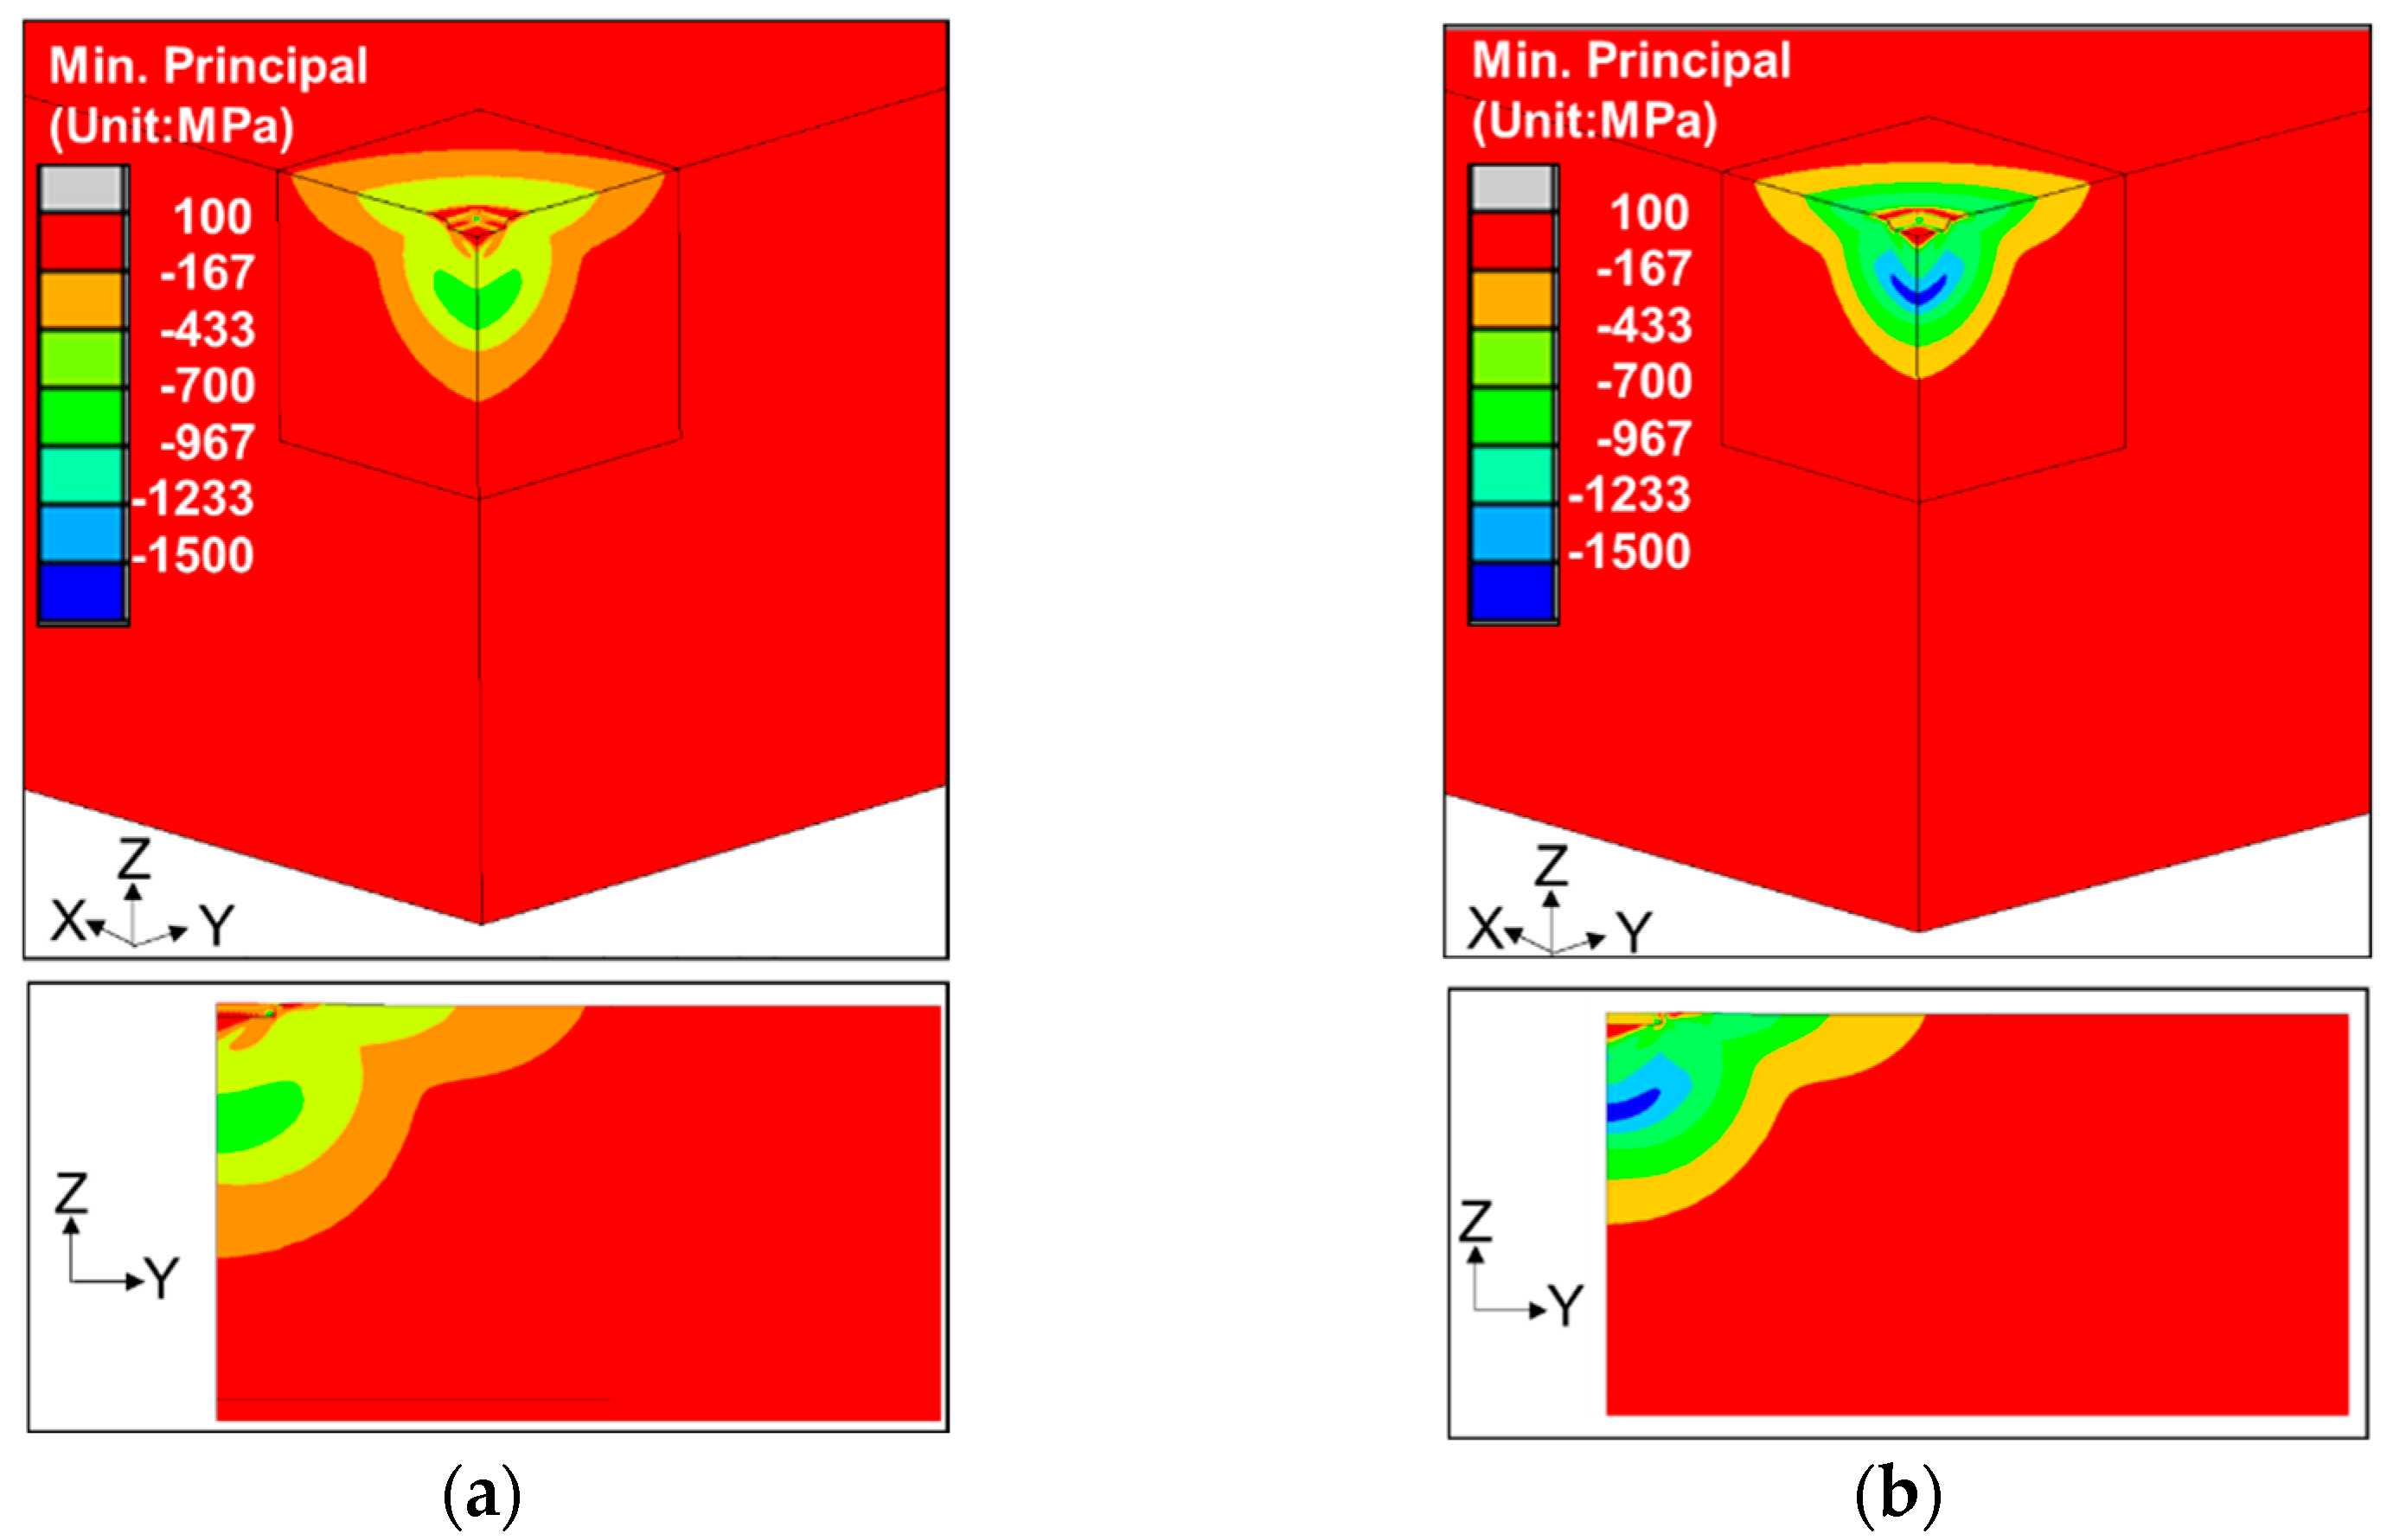
3.2. Analysis Results

Figure 9 shows the relationship between the indentation depth δ due to the pin and the load P. From this graph, it can be seen that the plastic deformation starts at an applied load of ~0.91 kN for SM490 and ~1.7 kN for HT780, and the maximum load leaves indentations of ~0.1 mm at 2.3 kN for SM490 and at 3.7 kN for HT780.
However, in the experiment, the predetermined indentation was generated in both HT780 and SM490 by repeating the impact force. If the pin was continuously struck at a moving speed of 90 Hz of 5 cm/min with a pin area of 1 mm2, the number of cycles was estimated to be about 100 per time of one line as one execution. To obtain an indentation of ~0.1 mm in HT780, an impact of about 400 times is considered to be repeated, and in SM490, an impact of about 200 times is considered to be repeated.
Figure 10 shows the Von Mises contour plot and Figure 11 shows the minimum principal stress contour plot of the base metal with the pins completely separated from the base metal. The stress ranges of the contour plots are the same for SM 490 and HT 780 for comparison. From these figures, it can be seen that the range in which the residual stress occurs shows the same tendency regardless of the material, but the absolute value of the residual stress is proportional to the yield strength of the base metal. The contour diagram of the minimum principal stress in Figure 11 is similar to the distribution of Von Mises, indicating that the compressive stress is dominant. And, there is the distribution of strong compressive residual stress right under the pin.
Figure 12 graphically shows the measured and analyzed residual stress distributions in the plate thickness (Z direction in Figure 8) (0.35 mm and 1 mm from the pin contact end). In the case of SM490, the maximum residual stress value of −338 MPa (−86 MPa in the surface layer) was measured at a depth of about 0.2 mm. In the analysis (at the pin end distance of 0.35 mm), the maximum value was −438 MPa (−212 MPa in the surface layer) at a depth of 0.75 mm, and the residual stress tended to be slightly deeper than the experimental value. In the case of HT780, the measured value showed a maximum residual stress of −835 MPa (−253 MPa in the surface layer) at a depth of 0.7 mm, and the analyzed value showed a maximum value of −841 MPa (−345 MPa in the surface layer) at a depth of 0.75 mm, confirming good agreement between the measured value and the analyzed value. On the other hand, in the analysis (1.0 mm pin end distance position), the maximum residual stress was largest in the surface layer.
Figure 13 shows the surface residual stress distribution of σxx in the direction away from the pin end. In the analysis, the maximum residual stress appeared at about 0.8 mm from the pin edge in both SM490 and HT780. Experimentally, this tendency is observed in SM490. The surface residual stress distribution of the analysis shows that the peak value of both members becomes the maximum residual stress at about 1.5 mm from the center, and the maximum surface residual stress of HT780 is about two times greater than that of SM490, but the tendency of the compressive residual stress to become 0 at about 8 mm from the center is the same for both members.

4. Conclusions

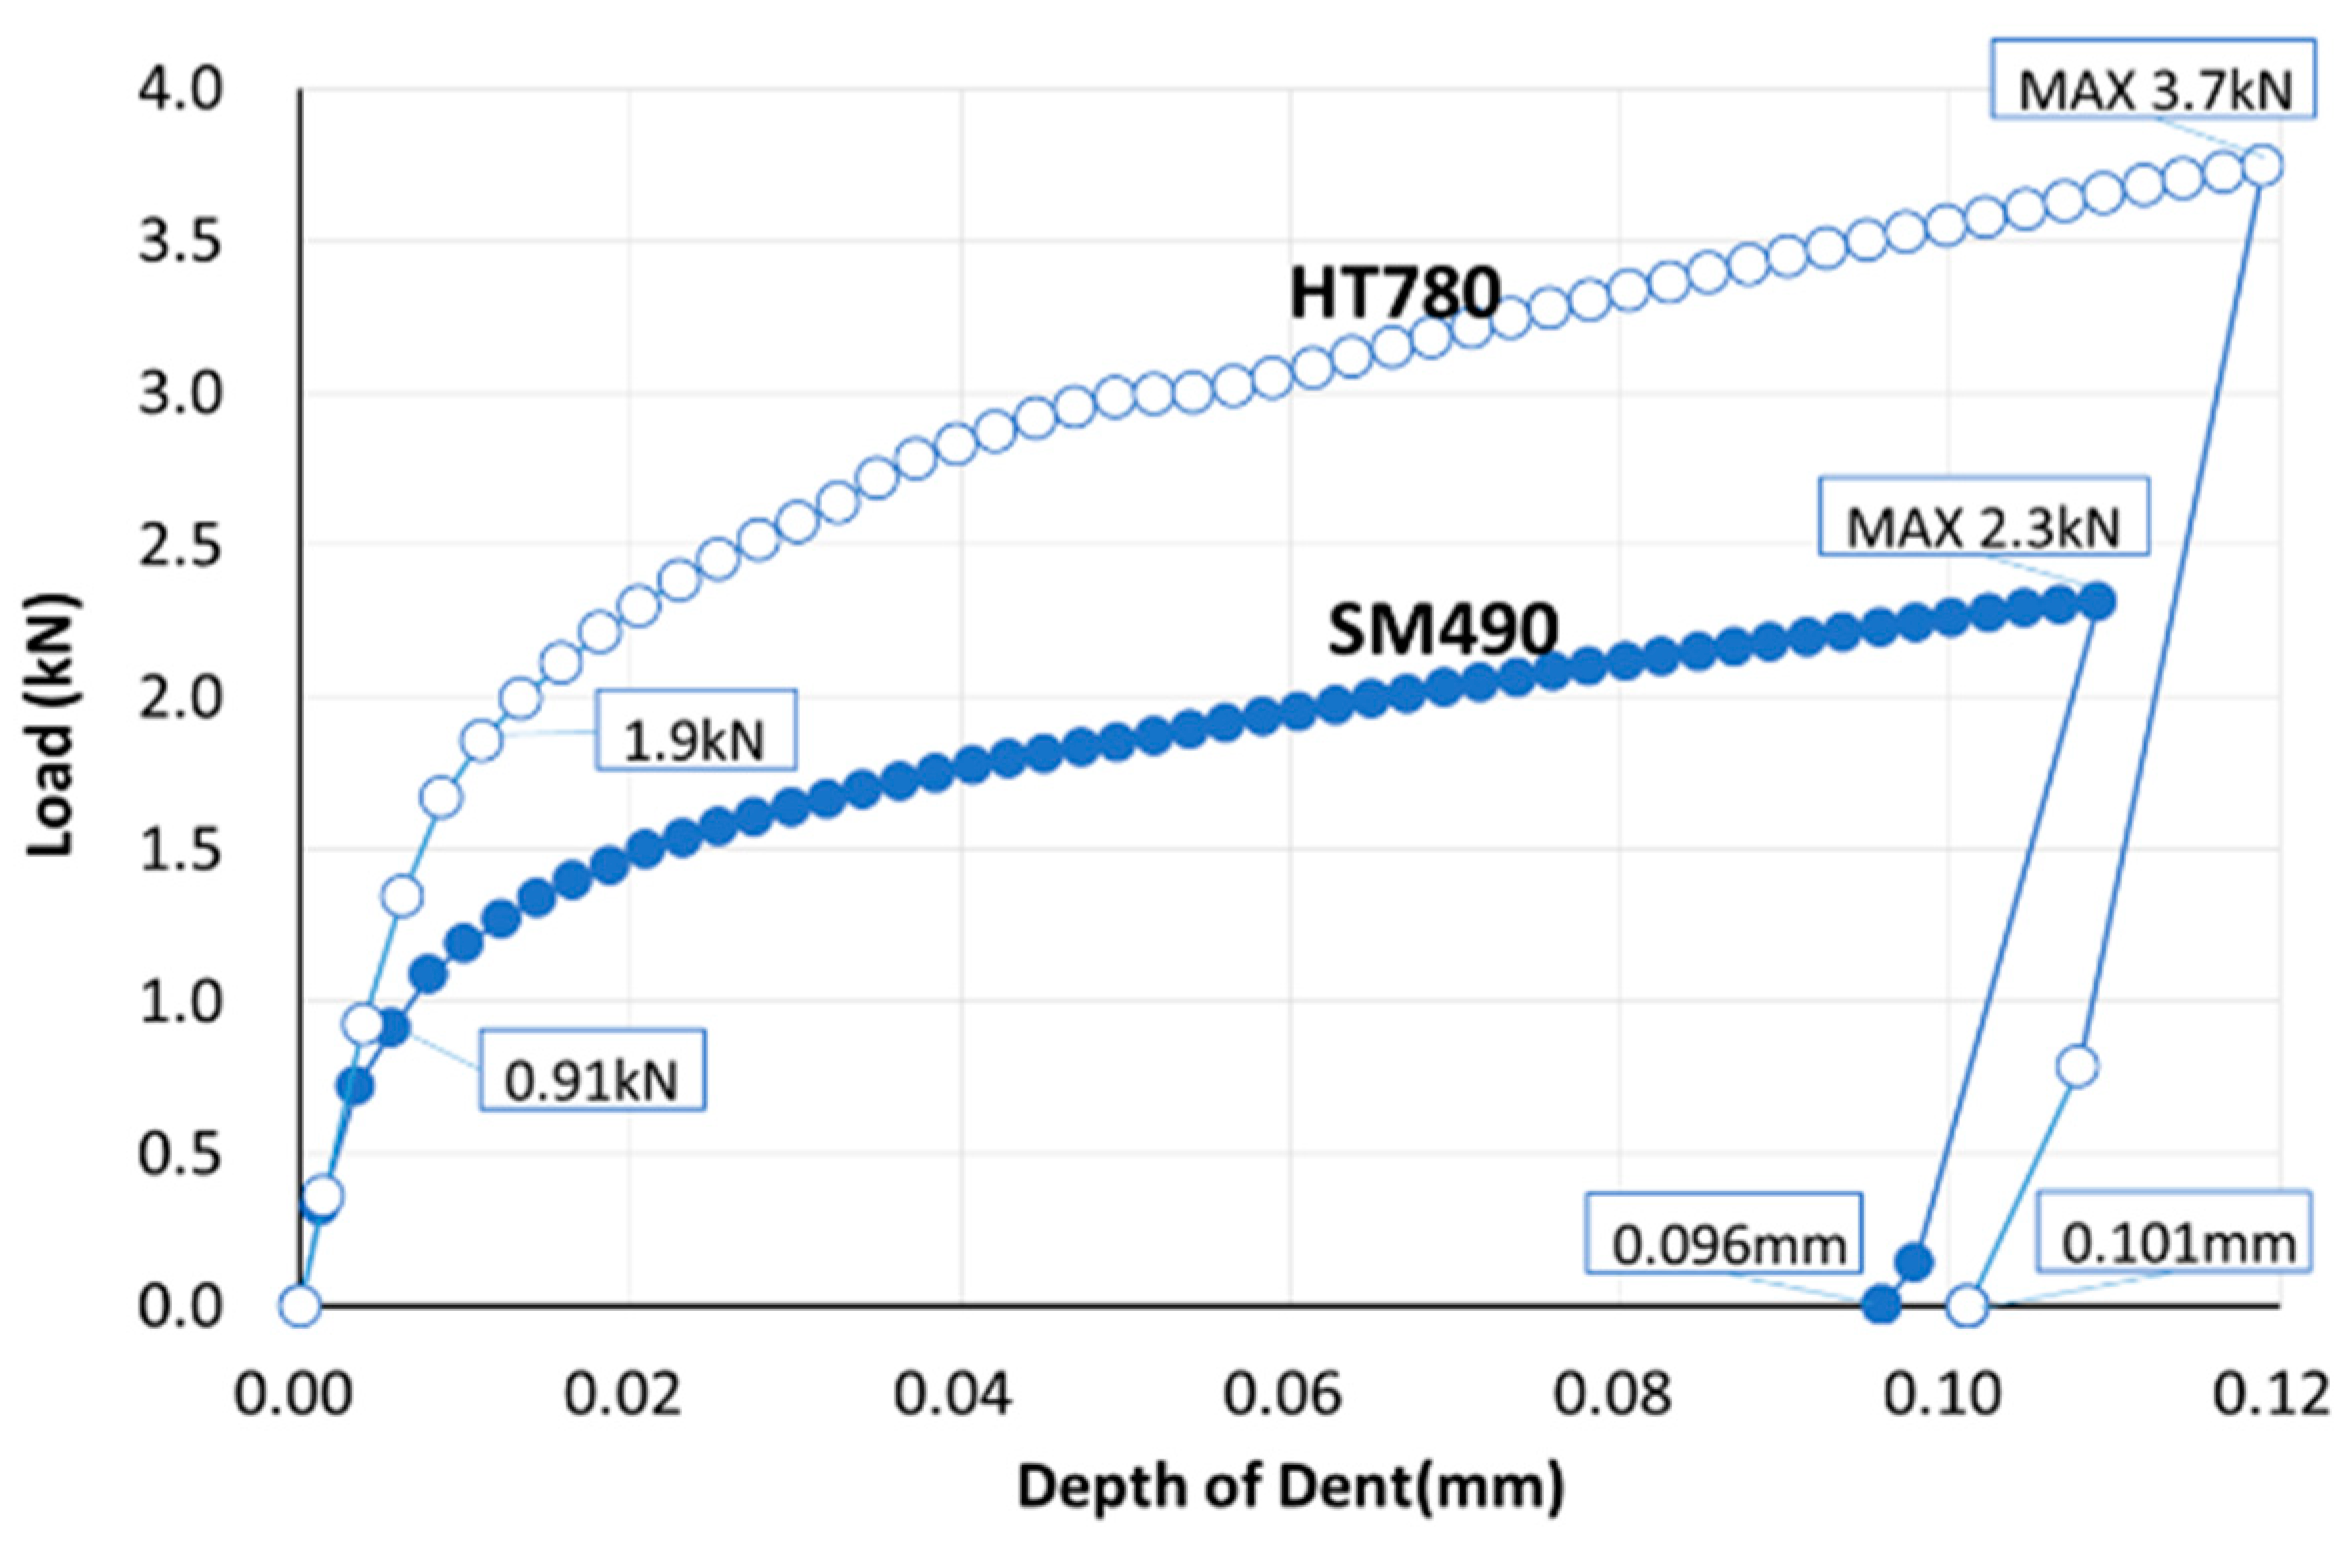
  • The surface depression of high-strength steel (HT780) caused by base metal hammer impact peening (BMHIP) was about half that of ordinary steel (SM490), but the maximum value of the residual stress distribution in the surface layer was about −400 MPa for both the high-strength steel and ordinary steel, and the distribution was similar. However, in the depth direction, the maximum value of −350 MPa was generated in the vicinity of 150 μm depth in the ordinary steel, and the maximum value of −835 MPa was generated in the vicinity of 800 μm depth in the high-tensile steel, and it was proven that the residual stress in proportion to the steel strength appeared inside.
  • The number of times of BMHIP treatment greatly affected the distribution of residual stress generated by BMHIP in the depth direction, and as the number of times increased, the magnitude of the maximum compressive stress increased, and a large compressive residual stress was generated deep inside, but it reached the limit at about four times.
  • It was shown that the residual stress condition after the BMHIP was carried out could be simulated by the elasto-plastic analysis in which the pin was pushed in.
  • The peak value of the residual stress was proportional to the yield stress of the material. In addition, it was proven that in the vicinity of the impact by BMHIP, the value reached the maximum inside the plate thickness, and the maximum value tended to approach the surface as it separated from the impact part.
In conclusion, the difference in the property of residual stress induced by constructing BMHIP on the base material surface of normal steel (SM490) and high strength steel (HT780) was clarified by measurement through the experiment and elasto-plastic finite element analysis. In the future, the verification of fatigue durability by fatigue tests could advance this work.

Author Contributions

Conceptualization, Y.K. and Y.S.; data curation, Y.K. and Y.S.; formal analysis, Y.K.; funding acquisition, Y.S.; investigation, Y.K. and Y.S.; methodology, Y.K. and Y.S.; project administration, Y.K. and Y.S.; resources, Y.K. and Y.S.; supervision, Y.S. and T.K.; validation, Y.K. and Y.S.; visualization, Y.K. and T.K.; writing-original draft, Y.K.; writing-review & editing, Y.K., Y.S. and T.K. All authors have read and agreed to the published version of the manuscript.

Funding

Part of this research was supported by a Grant-in-Aid for Scientific Research (C) (project number: 29420468).

Data Availability Statement

Not applicable.

Conflicts of Interest

The authors declare no conflict of interest.

References

  1. Tateishi, K. Countermeasure Technologies for Fatigue in Steel Bridges. Steel Struct. Ser. 2013, 22, 87–128. (In Japanese) [Google Scholar]
  2. Hensel, J.; Eslami, H.; Nitschke-Pagel, T.; Thomas, D.; Dilger, K. Fatigue Strength Enhancement of Butt Welds by. Metals 2019, 9, 744. [Google Scholar] [CrossRef] [Green Version]
  3. Lago, J.; Trsko, L.; Jambor, M.; Novy, F.; Bokuvka, O.; Mician, M.; Pastorek, F. Fatigue Life Improvement of the High Strength Steel. Metals 2019, 9, 619. [Google Scholar] [CrossRef] [Green Version]
  4. Anami, K.; Miki, C.; Tani, H.; Yamamoto, H. Improving Fatigue Strength of Welded Joints by Hammer Peening and Tig-Dressing. J. Struct. Eng. Earthq. Eng. JSCE 2000, 17, 67–78. [Google Scholar] [CrossRef] [Green Version]
  5. Nakanishi, K.; Morikaga, Y.; Kawabata, A.; Tomo, H. Study on Improvement Method of Fatigue Strength of Weld Joints by Hammer Peening on Base Metal. J. Jpn Soc. Civil Eng. 2017, 73, 10–19. (In Japanese) [Google Scholar]
  6. Sakino, Y.; Kurihara, Y.; Tsutsumi, S. Application of hummer peening on base metal to high-strength steel. J. Jpn Weld. Soc. 2018, 36, 206–211. (In Japanese) [Google Scholar] [CrossRef]
  7. Sakino, Y.; Kurihara, Y.; Manabe, M.; Nakada, R. Application of hummer peening to box-welded joint of high-strength steel. Welded Structure Symposium. Jpn Weld. Soc. 2017, 36, 415–418. (In Japanese) [Google Scholar]
  8. Matsumoto, R.; Ishikawa, T.; Tsutsumi, S.; Kawano, H.; Yamada, K. Analytical vertification of residual stress distribution in steel plate after hammer peening. J. Struct. Eng. 2016, 62, 685–692. (In Japanese) [Google Scholar]
  9. Japanese Standards Association. JIS G3106 Rolled Steels for Weided Structure, G3128 High Yield Strength Steel Plates for Welded Structure; JIS: Tokyo, Japan, 2009. [Google Scholar]
  10. Akiniwa, Y.; Kojima, Y.; Kimura, H.; Maruko, K. Prediction of Residual Stress Distribution in Severe Surface Deformed Steel by Constant Penetration Depth Method. J. Soc. Mater. Sci. Jpn 2008, 57, 660–666. (In Japanese) [Google Scholar] [CrossRef] [Green Version]
Figure 1. Specimen (HT780, 1 time).
Applmech 02 00054 g001
Figure 2. Photograph of flux chipper.
Applmech 02 00054 g002
Figure 3. Measurement of residual stress.
Applmech 02 00054 g003
Figure 4. Residual stress at surface (SM490).
Applmech 02 00054 g004
Figure 5. Residual stress at surface (HT780).
Applmech 02 00054 g005
Figure 6. Residual stress distribution over thickness (SM490).
Applmech 02 00054 g006
Figure 7. Residual stress distribution over thickness (HT780).
Applmech 02 00054 g007
Figure 8. Measurement position.
Applmech 02 00054 g008
Figure 9. P-δ graph.
Applmech 02 00054 g009
Figure 10. Contour diagram (Von Mises stress). (a) SM490, (b) HT780.
Applmech 02 00054 g010
Figure 11. Contour diagram (Minimum Principal stress). (a) SM490, (b) HT780.
Applmech 02 00054 g011
Figure 12. Residual stress distribution in plate thickness. (a) SM490, (b) HT780.
Applmech 02 00054 g012aApplmech 02 00054 g012b
Figure 13. Surface residual stress distribution chart. (a) SM490, (b) HT780.
Applmech 02 00054 g013
Table 1. Depth of indentation due to BMHIP (Unit: mm).
Base Material1 Time2 Times3 Times4 Times
SM4900.0700.0550.1410.201
HT7800.0170.0420.0630.093
Table 2. Analysis cases and mechanical properties of base material.
CaseBase MetalYoung’s Modulus
(MPa)
Yield Stress
(MPa)
Tension Stress
(MPa)
Case 1SM490205,000371533
Case 2HT780205,000824840
Publisher’s Note: MDPI stays neutral with regard to jurisdictional claims in published maps and institutional affiliations.

