Abstract
Background: Accuracy of optical impressions—defined by the intraoral scanner (IOS)’s trueness and precision per International Organization for Standardization (ISO) standards—is influenced by both operator- and patient-related factors. Thus, this in vitro study aimed to (1) evaluate how scanning distance affects the accuracy of three different intraoral scanners (IOSs), and (2) identify the optimal scanning distance for each scanner. Methods: A maxillary arch model was obtained using polyvinyl siloxane impression material and poured with Type IV stone (Octa-rock royal®, Kulzer, Germany). Using three different types of IOSs—the trios 3 shape (TRIOS ® cart, 3Shape, Copenhagen, Denmark); the Helios 500 (Eighteeth ®, Changzhou, China); and the Heron (3Disc ®, Herndon, VA 20170, USA)—ten scans were performed with each of the IOSs with five predetermined distances: 0 mm, 2.5 mm, 5 mm, 7.5 mm, and 10 mm. Spacers of varying heights were designed using Meshmixer version 3.5 (Autodesk, Inc., Mill Valley, CA, USA) and three-dimensional printed with the Form 2 printer (Formlabs, Somerville, MA, USA). The scanned data was processed using Geomagic Control X (Version 16.0.2.16496, 3D Systems, Wilsonville, OR, USA). Statistical analyses were performed using R Statistical Software (version 4.2.2), with significance set at α = 0.05. Results: Scanning distance significantly influenced scan accuracy for all three scanners. The 3Disc scanner (3Disc, Herndon, VA, USA) demonstrated the highest accuracy at a 7.5 mm distance, while both the Helios 500 (Eighteeth, Changzhou, China) and Trios 3 (3Shape, Copenhagen, Denmark) scanners achieved their best accuracy at a 5 mm distance, as indicated by the lowest root mean square (RMS) values (p < 0.05). Conclusions: To conclude, each IOS has an optimal scanning distance for best accuracy. Trios 3 (3Shape, Copenhagen, Denmark) outperformed the others in both trueness and precision. Future studies should examine these effects under full-arch and clinical conditions.
1. Introduction
Scanning distances that are too short (i.e., close to the surface) or too long (i.e., far from the surface) have been shown to negatively affect the accuracy of intraoral scans, potentially leading to compromised clinical outcomes. In light of this, understanding how scanning distance influences digital impression accuracy has become a critical area of focus in digital dentistry. Progress in the dental field has emphasized the importance of a complete digital workflow in simplifying complex procedures [1,2]. With the use of computer-aided design/computer-aided manufacturing (CAD/CAM) systems, the margin for error has been significantly reduced. For instance, variations caused by impression materials with different shrinkage or expansion properties are avoided. Moreover, these systems simplify procedures for less experienced practitioners, reduce patient discomfort, enhance communication with both dental technicians and patients, and save time [2,3]. On the other hand, several challenges remain, such as difficulties in capturing subgingival margins, the clinician’s learning curve, challenges in isolating the preparation from saliva, and lighting conditions that affect the quality of captured data [4,5,6].
The CAD/CAM workflow comprises three main steps: first, data acquisition through detailed scanning of the object; second, three-dimensional (3D) design of the restoration using CAD technology; and third, manufacturing the product through the CAM process. The system consists of three essential components: an optical scanner for data collection, softwares for design, and manufacturing tools using either subtractive (milling machines) or additive technologies (3D printers) [7].
3D scanning is a non-contact technology that captures the precise geometry and surface details of objects by collecting spatial data using methods such as laser triangulation, structured light, or photogrammetry. Beyond dentistry, 3D scanning has been widely adopted in diverse fields. In aerospace engineering, it enables structural and geometric assessment of complex components for quality control and maintenance [1]. In cultural heritage preservation, it supports accurate documentation, restoration, and digital archiving of artifacts. Furthermore, within the framework of Industry 4.0, 3D scanning is integral to advanced manufacturing processes, facilitating rapid prototyping, reverse engineering, and optimized production workflows. These broad applications highlight the versatility and growing importance of 3D scanning technologies, underscoring their critical role in modern scientific and industrial domains [8].
The accuracy of intraoral scanners (IOSs) is a critical factor to ensure a passive fit of the fabricated prosthesis. Accuracy is defined by two components: trueness and precision [6]. Trueness refers to the scanner’s ability to replicate the actual shape of the dental arch without deformation or distortion, while precision describes the consistency of repeated scans under identical conditions [6].
Most in vitro studies evaluate the trueness of IOSs on plaster models [9,10]. This requires a reference model obtained using coordinate measuring machines (CMMs), articulating arms, or optical desktop scanners. In contrast, precision can be more readily assessed in vivo by scanning the same arch multiple times and superimposing the scans using specific reverse engineering software (Geomagic Control X, Version 16.0.2.16496, 3D Systems, Wilsonville, OR, USA) [11].
Numerous factors reported in the literature may affect the accuracy of IOSs, including those related to the patient and others to the operator. Operator-related factors include the choice of IOS system, scanning tip size, scanning distance, temperature variations, calibration, experience level, lighting conditions, humidity, scanning pattern and coverage, trimming, and the degree of scan overlap or rescanning. Patient-related factors include saliva, tooth morphology, interdental spacing, arch width, palatal anatomy, surface characteristics, existing restorations, edentulous regions, and the presence of scan bodies for implants [7,8].
Additionally, several studies have demonstrated that proper software updates can significantly enhance the accuracy and precision of IOSs. Updated software versions can enable older models to achieve performance levels comparable to newer equipment [12].
Marginal and internal adaptation of prosthetic restorations are critical for long-term clinical success. According to the literature, acceptable accuracy should range between 50 µm and 120 µm or less [12,13].
Although digital intraoral scanning has become increasingly prevalent in dental practice, there remains limited understanding of how scanning distance—the physical gap between the scanner tip and the tooth surface—affects the accuracy of the resulting digital impression [14]. Previous studies [14,15], have begun to explore this factor, but their investigations were limited either to a narrow range of scanning distances or to specific intraoral scanner (IOS) models, leaving important questions unanswered.
Specifically, these prior works have not systematically evaluated multiple commonly used IOS devices under standardized conditions to determine an optimal scanning distance that maximizes accuracy across devices [14,15]. Moreover, the influence of scanning distance on both trueness and precision has not been comprehensively analyzed [15], nor has the interaction between scanning distance and device-specific performance been fully characterized [14,15].
To address these gaps, the present study employed three commercially available IOSs with different acquisition technologies: First, the Trios 3 (3Shape, Copenhagen, Denmark), a high-end confocal laser scanner recognized for its accuracy and image quality, utilizes advanced confocal microscopy technology to capture detailed 3D intraoral images with precise depth and color information. This technology enables highly accurate digital impressions, making it ideal for complex restorative, orthodontic, and implant cases where precise marginal fit and occlusion are critical. The scanner’s fast acquisition speed and intuitive workflow improve clinical efficiency and patient comfort, although its higher cost and larger scanner head may be limiting factors in some practices [16]. Second, the Helios 500 (Eighteeth, Changzhou, China), is a cost-effective, artificial intelligence (AI)-assisted video scanner designed for fast, user-friendly performance. The AI integration assists with stitching images and optimizing scan data quality. Additionally, the Helios 500 (Eighteeth, Changzhou, China) has been reported to be useful in complex clinical situations such as complete arch scanning and gingival excess removal due to its real-time feedback and ease of use, making it a versatile option for both general and advanced dental procedures [17]. Further, there is limited published technical data on long-term performance and reliability. Third, the Heron IOS (3Disc, Herndon, VA, USA), a mid-range scanner based on stereo imaging, offers streamlined scanning with limited published technical detail. Although the Heron IOS (3Disc, Herndon, VA, USA) is marketed as a user-friendly, stereo imaging scanner, peer-reviewed studies evaluating its precision and trueness are currently limited [18]. These devices were selected to represent a spectrum of scanning technologies and price points, allowing for a broader comparative evaluation under identical in vitro conditions.
Accordingly, the objective of the present study was to investigate how the distance between the tip of the IOS and the scanned surface influences the accuracy of various IOS types. Additionally, it aimed to determine the optimal scanning distance for each IOS to maximize both accuracy and precision. The null hypotheses were that (1) the scanning distance would not influence impression accuracy regardless of the IOS used, and (2) there would be no statistically significant differences in accuracy among the three IOS systems tested.
2. Materials and Methods
2.1. Study Design
An impression on an upper jaw of an adult patient was taken using a polyvinyl siloxane material and poured under vacuum using type IV plaster (Octa-rock royal® from Kulzer, Hanau, Germany) (Figure 1).
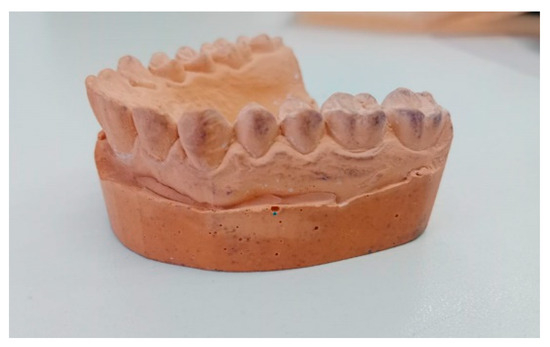
Figure 1.
Plaster model used in the study.
Using three different types of IOSs—the trios 3 shape (TRIOS ® cart, 3Shape, Copenhagen, Denmark version 17.82.5), the Helios 500 (Eighteeth ®, Changzhou, China version EM 1.1.4.4), and the Heron (3Disc ®, Herndon, VA 20170, USA version 3.2.2.16)—ten scans were performed using each of the IOS with five predetermined distances: 0 mm, 2.5 mm, 5 mm, 7.5 mm, and 10 mm.
To determine the sample size, a power analysis for 3 × 4 analysis of variance (ANOVA) (fixed effects, special, main effects, and interactions) was conducted using G*Power software 3.1.9.7 for Windows (Heinrich Heine, Universitat Düsseldorf, Düsseldorf, Germany). A power of 0.9, an alpha level of 0.05, 12 groups, a numerator degree of freedom of 6, and a large conventional effect size of 0.4 were considered. The minimum sample size required is 10 scans for each scanner and distance (150 scans in total).
Spacers with different heights were manufactured using a CAD software Meshmixer version 3.5 (Autodesk; Inc., San Rafael, CA, USA) in order to standardize the desired distance between the IOS head and the scanned teeth. Spacers were fabricated at different heights of the plaster model (2.5 mm, 5 mm, 7.5 mm, and 10 mm) and 3D-printed using a Form 2 printer (Formlabs, Somerville, MA, USA) (Figure 2). The spacers were not physically attached to the IOS, but were independently positioned and stabilized directly on the plaster model. Their base was designed to provide passive and reproducible positioning, ensuring a consistent vertical distance between the scanner tip and the target area during each scanning procedure.
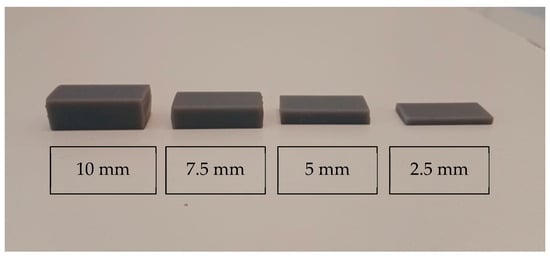
Figure 2.
Three-dimensional-printed spacers of varying heights arranged from left to right: 10 mm, 7.5 mm, 5 mm, and 2.5 mm. The image demonstrates the progressive reduction in thickness from left to right.
Measurements of the distance were checked before each scan using a digital caliper (CD-6BS; Mitutoyo, Tokyo, Japan). The IOS was always maintained parallel to the occlusal plane after each scan. Calibration was performed when needed, according to the manufacturer’s instructions. The same scanning direction was adopted for each scan with an average of 30 s per scan.
The scanner was moved in a linear direction starting from the occlusal surface of the right canine, proceeding to the occlusal surfaces of the first molar and second molar, and returning to the initial starting point. This movement was performed parallel to the occlusal plane on a flat surface, and then from the buccal and palatal sides (Figure 3). Only five teeth were scanned to be able to maintain the same distance with the spacer, due to the curvature of the arch in the lateral-canine region.
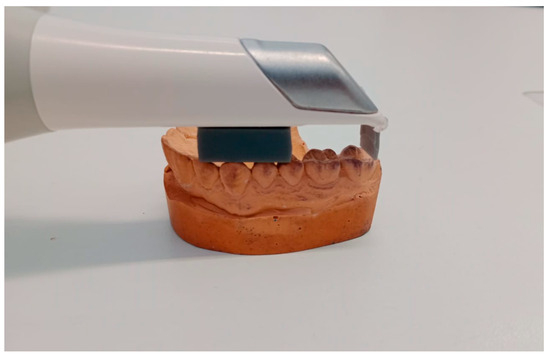
Figure 3.
Visualization of the scanning process using spacers of 10 mm.
In order to obtain the reference digital model, a desktop dental scanner was used (Ceramill Map 600; Amann Girrbach AG) and all digital scans were saved in the form of stereolithography (STL) files. Geomagic Control X (Version: 16.0.2.16496, 3D systems, Wilsonville, OR, USA) was used to process the scanned data.
The reference data was uploaded into the Geomagic Control X (Version: 16.0.2.16496, 3D systems, Wilsonville, OR, USA) software. The area between the upper right canine and the second molar was considered as an area of interest by the process of segmentation. For consistency the area of interest remained unchanged for all the following comparisons, and only the measured data was switched. The IOS mesh was uploaded into the software as measured data to be compared with the reference data. (IOS mesh refers to the 3D surface geometry generated by IOSs in STL format. These meshes are composed of numerous interconnected polygons (typically triangles) that represent the scanned dental structures. The accuracy of the IOS was assessed by comparing the deviations between these mesh models and the reference model.) The isolated area of interest was the only area analyzed between meshes, excluding the remaining occlusal areas from the molars and premolars with the process of segmentation.
The trueness data was obtained by executing the “initial alignment” function to superimpose the IOS mesh over the reference mesh. (Initial alignment refers to the preliminary, rough positioning of the IOS mesh relative to the reference model. This is typically achieved using predefined landmarks or manual alignment steps that bring the two models into approximate spatial correspondence). Initial alignment was followed by the “best-fit alignment”, an automated process that mathematically minimizes the overall distance between corresponding points on the two surfaces. (This is usually performed through an algorithm such as the Iterative Closest Point (ICP) method. It optimizes the superimposition of the models based on surface geometry rather than anatomical landmarks). To evaluate the deviation between the reference and measured data, the “3D compare” function was used by projecting all paired points onto the reference data (Figure 4 and Figure 5).
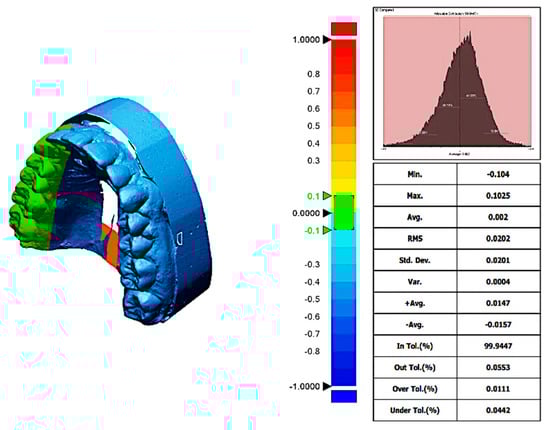
Figure 4.
Trueness report from trios 3 scanner at a distance of 5 mm. The deviation map compares the scanned digital model to the reference model, illustrating spatial differences in micrometers (µm). Color coding indicates the magnitude and direction of deviations: green represents areas within the clinically acceptable tolerance range (minimal deviation), red indicates positive deviations where the scan surface exceeds the reference (overestimation), and blue shows negative deviations where the scan surface is smaller than the reference (underestimation). Axes on the deviation map correspond to spatial dimensions of the scanned area, measured in millimeters (mm).
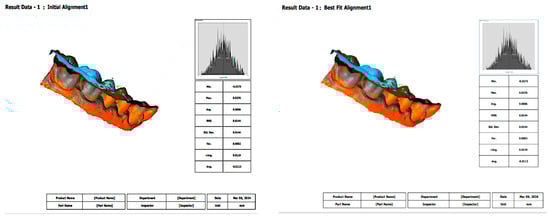
Figure 5.
Initial alignment and best-fit alignment functions. Initial alignment represents the preliminary superimposition of the intraoral scanner mesh with the reference model based on approximate positioning or landmarks. Best-fit alignment is a refined, algorithm-driven process that minimizes the overall surface deviation between the intraoral scanner mesh and the reference, allowing for accurate three-dimensional comparison. In this measurement, the results were the same between initial alignment and best-fit alignment.
The color-coded map was done to visualize deviations between the reference data. In order to obtain the precision values, each IOS mesh was compared with all the other meshes within its group following the same steps.
The precision data was gained after the superposition of every two scans of each group by pairwise matching on the Geomagic software following the same steps mentioned above.
The operator’s factors were minimized since all the scans were performed by the same operator with a predetermined time of 30 s per scan under the same conditions (light conditions, same room, same day). Prior to the main scanning procedures, the operator underwent a calibration phase that included five preliminary scans per scanner type to ensure familiarity with each device’s acquisition protocol. These scans were conducted under supervision to ensure consistency in handling, positioning, and scanning speed. Only after achieving consistent scan times (30 ± 2 s) and acceptable trueness values in all preliminary scans did the operator proceed with the experimental phase.
2.2. Statistical Analysis
All statistical analyses were performed using R Statistical Software (version 4.2.2). The differences in root mean square (RMS) values of precision among the three scanners were evaluated using the Friedman test, a non-parametric alternative to ANOVA. Similarly, the differences in RMS values of trueness were assessed using the Friedman test. Subsequent pairwise comparisons were conducted using the Mann–Whitney U test to determine which scanner had the lowest RMS value. The level of significance was set at α = 0.05.
3. Results
3.1. 3Disc Scanner
The summary statistics of precision RMS values for the Heron (3Disc ®, Herndon, VA 20170, USA version 3.2.2.16) scanner across five scanning distances are presented in Table 1. The corresponding boxplots are illustrated in Figure 6.

Table 1.
Summary statistics of the RMS values of precision at five scanning distances for the 3Disc Scanner in micrometers (μm).
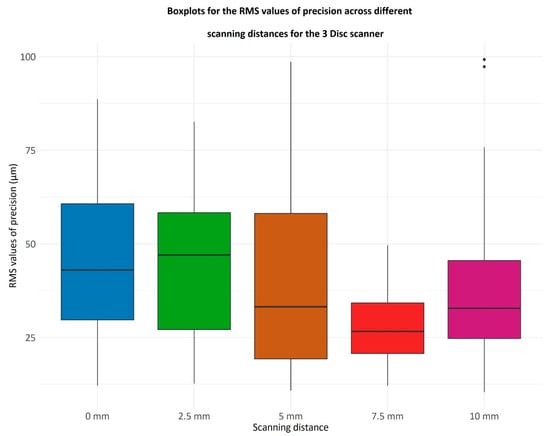
Figure 6.
Boxplots representing the RMS values of precision for the 3 Disc scanner across different scanning distances (0 mm, 2.5 mm, 5 mm, 7.5 mm, and 10 mm). The RMS (root mean square) value quantifies the consistency of repeated scans under the same conditions, with lower RMS values indicating higher precision. Each boxplot displays the distribution of RMS values from multiple scans at each distance: the central line represents the median precision, the box shows the interquartile range (25th to 75th percentile), the whiskers indicate variability outside the interquartile range, and individual dots represent outliers.
The x-axis lists the scanning distances in millimeters (mm), while the y-axis shows RMS values in micrometers (µm), reflecting the degree of deviation among repeated scans.
The differences in RMS values of precision were evaluated using the Friedman test, a non-parametric alternative to ANOVA. This test revealed significant variations among the values, yielding a p-value of 0.0011.
As evidenced by Figure 6, it appears that the Heron (3Disc ®, Herndon, VA 20170, USA version 3.2.2.16) scanner records the lowest RMS values at a 7.5 mm distance. To evaluate this hypothesis, a comparison of the RMS values at 7.5 mm against those at all other scanning distances was conducted. The normality of the data sets corresponding to each distance was assessed using the Kolmogorov-Smirnov and Shapiro-Wilk tests. Given that most data sets deviated from a normal distribution, a multiple comparison using Mann–Whitney U test with Bonferroni correction was performed. The p-values are the following:
- 7.5 mm vs. 0 mm, p = 0.00003;
- 7.5 mm vs. 2.5 mm, p = 0.00008;
- 7.5 mm vs. 5 mm, p = 0.05;
- 7.5 mm vs. 10 mm, p = 0.008.
Thus, for the Heron (3Disc ®, Herndon, VA 20170, USA version 3.2.2.16) scanner, the distance of 7.5 mm achieves the smallest RMS values for precision.
3.2. Helios Scanner
The summary statistics of the RMS values of precision for the Helios 500 (Eighteeth ®, Changzhou, China version EM 1.1.4.4) scanner are summarized in Table 2.
Table 2.
Summary statistics of the RMS values of precision at five scanning distances for the Helios scanner in micrometers (μm).
The boxplots of the RMS values for each scanning distance are illustrated in Figure 7.

Figure 7.
Boxplots illustrating the RMS values of precision for the Helios scanner at varying scanning distances (0 mm, 2.5 mm, 5 mm, 7.5 mm, and 10 mm). RMS (root mean square) values represent the repeatability of scans, with lower values indicating higher precision. The boxplots show the distribution of RMS values for repeated scans at each distance: the central line marks the median, the box covers the interquartile range (25th to 75th percentile), whiskers extend to the range of variability excluding outliers, and individual points indicate outliers. The x-axis indicates the scanning distance in millimeters (mm), and the y-axis shows RMS values in micrometers (µm), quantifying the variability between repeated scans.
The variations in RMS precision values were assessed using the Friedman test, a non-parametric substitute for ANOVA. The test showed significant differences between the values, producing a p-value of 0.0004, which is less than the threshold of 0.05. The RMS values of precision at a 5 mm scanning distance were checked to determine if they are smaller than those at all other distances.
The p-values obtained from these comparisons are as follows:
- 5 mm vs. 0 mm, p = 0.32;
- 5 mm vs. 2.5 mm, p = 0.0007;
- 5 mm vs. 7.5 mm, p = 0.54;
- 5 mm vs. 10 mm, p = 0.032.
The same was also done for the RMS values at 7.5 mm:
- 7.5 mm vs. 0 mm, p ≈ 1;
- 7.5 mm vs. 2.5 mm, p = 0.006;
- 7.5 mm vs. 10 mm, p = 0.16.
Therefore, for the Helios 500 (Eighteeth ®, Changzhou, China version EM 1.1.4.4) scanner, the 5 mm scanning distance yields smaller RMS values compared to the distances of 2.5 mm and 10 mm. Additionally, the 7.5 mm distance achieves smaller RMS values compared to the 2.5 mm distance.
3.3. Trios Scanner
Table 3 and Figure 8 summarize the statistical measures for the RMS values of precision for the Trios scanner over the five scanning distances.
Table 3.
Summary statistics of the RMS values of precision at five scanning distances for the Trios scanner in micrometers (μm).
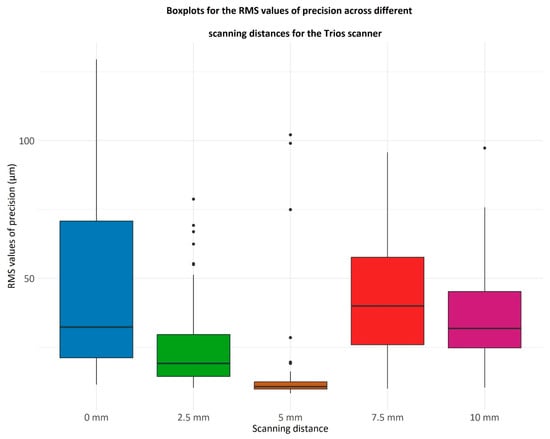
Figure 8.
Boxplots displaying the RMS values of precision for the Trios scanner at different scanning distances (0 mm, 2.5 mm, 5 mm, 7.5 mm, and 10 mm). The RMS (root mean square) values indicate the consistency of repeated scans, with lower values reflecting higher precision. Each boxplot represents the distribution of RMS values at each scanning distance, where the central line denotes the median, the box spans the interquartile range (25th to 75th percentile), whiskers show the range excluding outliers, and dots represent outliers. The x-axis represents scanning distances in millimeters (mm), and the y-axis quantifies RMS values in micrometers (µm), measuring scan-to-scan variability.
The Friedman test indicates a significant difference among the RMS values of precision (p = 2.36 × 10⁻¹⁴). Notably, the scanning distance of 5 mm results in the lowest RMS values. The RMS values were compared at 5 mm to those at every other scanning distance, obtaining the following p-values:
- 5 mm vs. 0 mm, p = 5.55 × 10⁻¹¹;
- 5 mm vs. 2.5 mm, p = 1.02 × 10⁻⁷;
- 5 mm vs. 7.5 mm, p = 8.58 × 10⁻¹¹;
- 5 mm vs. 10 mm, p = 5.39 × 10⁻¹¹.
The notation “×10−11” indicates scientific notation, meaning multiplied by 10 to the power of −11.
Consequently, for the Trios scanner (3Shape, Copenhagen, Denmark), the 5 mm scanning distance is associated with the lowest RMS values.
3.4. Comparison of the Trueness for the Three Scanners
The RMS values of the trueness for the three scanners are reported in Table 4, and the boxplots are showed on Figure 9.
Table 4.
Summary statistics of the RMS values of trueness for the three scanners in micrometers (μm).
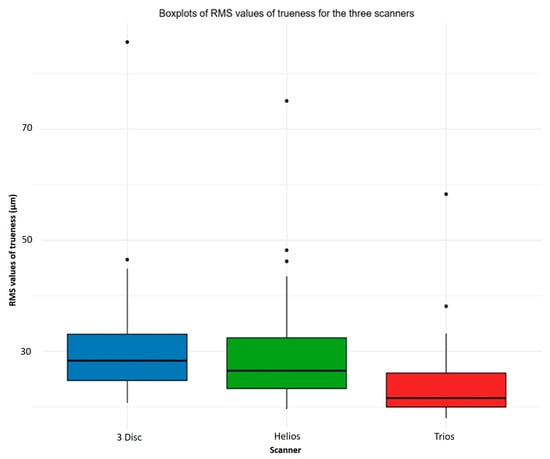
Figure 9.
Boxplots presenting the RMS values of trueness for the three intraoral scanners (3 Disc, Helios, and Trios) across all scanning distances tested. Trueness reflects how closely the scanned data matches the true geometry of the object, with lower RMS values indicating higher accuracy. Each boxplot shows the distribution of RMS values for each scanner, with the central line representing the median, the box indicating the interquartile range (25th to 75th percentile), whiskers showing the range excluding outliers, and dots marking any outliers. The x-axis lists the three scanner types, while the y-axis shows RMS values in micrometers (µm), which quantify deviations from the reference model.
The differences in RMS values of trueness were evaluated using the Friedman test, a non-parametric alternative to ANOVA. This test revealed significant variations among the values, yielding a p-value of 3.56 × 10⁻⁹, which is below the significance threshold of 0.05. Subsequent comparisons with the Mann–Whitney U test showed that the lowest RMS values of trueness were observed for the Trios scanner (3Shape, Copenhagen, Denmark). Specifically, the RMS values for the Trios scanner (3Shape, Copenhagen, Denmark) were lower than those for the 3-Disc scanner (p-value = 1.90 × 10⁻⁷) and also, lower than those for the Helios scanner (Eighteeth, Changzhou, China) (p-value = 1.83 × 10⁻⁵). Meanwhile, the 3-Disc scanner (3Disc, Herndon, VA, USA) and the Helios scanner (Eighteeth, Changzhou, China) showed similar results, with a p-value of approximately 1.
4. Discussion
Accuracy of the optical impression is an essential factor to guarantee a durable restoration and to ensure a successful treatment outcome. Moreover, when used properly, IOS provides countless information concerning the condition of the digital impression and details about the shape of the preparation and the restoration to be manufactured [19].
The present study aimed to compare the accuracy of five different distances (0 mm, 2.5 mm, 5 mm, 7.5 mm, and 10 mm) from the head of three different IOSs to the occlusal surface of five teeth in the upper jaw (right canine to the right second molar) using four printed resin frames, and to find out which type of IOS is more accurate for an impression-taking and which distance gives a more accurate scanning result for each scan.
Significant differences were observed among groups with respect to trueness and precision measurements, thereby leading to the rejection of the null hypotheses that the distance from the tip of the IOS to the maxillary right quadrant will not influence the accuracy of the impression independently from the type of IOS that will be used.
It is worth mentioning that there is no clear consensus on which parameter is more important, trueness or precision, for determining the accuracy of IOSs. To the best of the researcher’s understanding, it appears that trueness carries greater significance than precision since it indicates how closely the scanned data align with reality, whereas precision relies more on the operator’s proficiency and device handling [20]. Furthermore, the overall RMS values for both trueness and precision were below 50 μm, which is within the clinically acceptable range. Therefore, it can be concluded that all IOSs, regardless of distance, have high clinical accuracy [21].
The results of this study showed that for the 3 Disc scanner, the best precision was at a distance of 7.5 mm. The distance of 2.5 mm yielded the lowest precision values; this could be attributed to the intensity of the light emitted by the scan and the proximity of the recorded area, meaning that some points may become oversaturated, causing alterations of the digital model. At 0 and 10 mm, high RMS values can be explained by the failure of the IOS sensors to catch the reflected light from the scanned surfaces; this will prompt the operator to correct areas with lower accuracy by making secondary passes following the scanning patterns [14].
For the Helios 500 (Eighteeth, Changzhou, China) and Trios 3 scanners (3Shape, Copenhagen, Denmark), 5 mm distance was estimated as the greatest scanning distance for both scanners. In addition, for the trueness assessment, Trios 3 scanner (3Shape, Copenhagen, Denmark) exhibited better results compared to the two others. These variations in the RMS values may be related to the acquisition method of the IOS, which can be categorized into image-acquisition and video-acquisition based on the image recombination of the IOS. Trios 3 (3Shape, Copenhagen, Denmark) and Helios 500 (Eighteeth, Changzhou, China) acquisition method is based on the video recording method compared to the image acquisition for the 3 Disc.
According to Kim et al., the median trueness for the video-based acquisition method was 56.45 μm, while it was 70.55 μm for the photo-based acquisition method [22]. However, Park’s study did not show any significant difference in the accuracy of IOSs based on whether the acquisition method was video-based or photo-based [23].
As mentioned above, in the trueness evaluation, Trios 3 (3Shape, Copenhagen, Denmark) exhibited the greatest accuracy results followed by the Helios 500 (Eighteeth, Changzhou, China) and then the 3 Disc. One reason could be that Trios 3 (3Shape, Copenhagen, Denmark) is based on confocal laser scanning microscopy technology. This method stands out for its ability to adjust the focal plane without moving the scanner concerning the object being scanned. Confocal imaging works by projecting laser light onto a target object through a filtering pinhole, which enhances scan accuracy by excluding out-of-focus reflected light (erroneous data). Nevertheless, when the target is out of the depth of field (DOF) range, the out-of-focus signal weakens, and the noise rises, resulting in a blurry image. The Trios 3 scanner (3Shape, Copenhagen, Denmark) can scan a wider range than the defined DOF range because it adjusts the focus position [14]. However, the 3D surface acquisition time needs to be kept short to minimize bias caused by unintentional movements between the tip and the teeth [24]. Furthermore, the Heron 3 Disc (3Disc, Herndon, VA, USA) and the Helios 500 IOSs (Eighteeth, Changzhou, China) utilize stereo-imaging scanning technology, but there is limited information available about this technology [23].
Another potential factor affecting the accuracy of the tested IOSs could be differences in their scanning strategies. Using the IOS with precise movements according to a specific scan path can enhance the model’s accuracy. Müller and Stephanelli et al. stated in their study that the scanning path of occlusal-palatal followed by buccal surface (OBP) was the most accurate scanning strategy because it allowed a continuous scanning procedure without interruption, engendering fewer distortions [24]. Moreover, in the study of Richard et al., it has been advocated that the OBP scanning path limited deformations because of the digitization process that ended on the starting point [25]. Nevertheless, Oh et al. stated that the precision of IOS was not influenced by the scanning strategy adopted [26].
While statistically significant differences in accuracy were observed among the scanning distances and between IOS devices, it is essential to consider the clinical relevance of these findings. The accepted threshold for clinically acceptable accuracy in digital impressions generally falls within the range of 50 μm or less. In this study, all IOS devices and scanning distances yielded RMS values below this threshold, indicating that despite measurable statistical differences, all tested conditions are likely sufficient for producing restorations with a passive fit. This implies that minor variations in scanning distance, particularly between 5 mm and 7.5 mm for certain IOSs, may not significantly affect the final clinical outcome. Therefore, clinicians can be reassured that a small deviation from the optimal scanning distance may not compromise impression quality or restoration fit. However, optimal distances should still be targeted to reduce scanning time, operator fatigue, and the potential for rescans, which may indirectly impact treatment efficiency and patient experience. Future clinical studies are needed to evaluate how these differences manifest in vivo, especially considering patient-specific factors and the complexity of full-arch scans, which may amplify the effect of scanning parameters on overall accuracy.
Many factors can influence the accuracy of the digital scan. In this study, only the scanning distance was analyzed as an isolated factor, while other variables—such as humidity, lighting conditions, and scanning strategy—were not included. This highlights several limitations inherent to the in vitro design. Clinical conditions such as the presence of blood, saliva, patient movements, and soft tissue interference were not simulated, which may limit the applicability of the results to real-life scenarios. For example, saliva and blood can cause artifacts or incomplete scans, patient movement can introduce motion errors, and variable intraoral lighting and soft tissue can further challenge scan accuracy. These clinical factors may affect the scanner’s performance and precision in ways not captured in this controlled in vitro setup. Furthermore, the use of fixed-height spacers restricted the ability to scan a full arch at a consistent scanner-to-tooth distance. Customized spacers designed for each intraoral scanner would allow full-arch scanning under standardized conditions and should be considered in future studies. Another limitation lies in the sample design, as the study was conducted on only five teeth, which may not accurately reflect clinical variability across full-arch or quadrant-level scans. Additionally, the influence of computer processing speed—such as mesh generation time and data alignment capacity—was not evaluated, although it may also impact overall accuracy outcomes. The use of an in vitro model, while limiting clinical translation, was necessary due to the technical challenges of accuracy assessment in vivo. Specifically, the generation of a virtual reference model—required for reverse engineering and deviation analysis—can currently only be achieved using extraoral high-precision devices, which are not feasible intraorally due to anatomical obstructions. This limitation underscores the importance of controlled experimental conditions. To mitigate human operational error, all scans were performed by a single operator who underwent calibration through a preliminary training phase consisting of repeated scan trials under supervision to ensure consistency and proficiency. This operator followed a predefined scanning protocol using a fixed scanning time (30 s per scan), conducted under standardized environmental and lighting conditions. These measures were implemented to reduce intra-operator variability and enhance the reproducibility of the data collected. In conclusion, while this study provides valuable insights into the influence of scanning distance on digital impression accuracy, future research should address additional clinical variables and include a broader range of scanning scenarios, including full-arch and in vivo settings. These efforts will be essential to validate and extend the applicability of the current findings.
5. Conclusions
Scanning distance significantly affects the accuracy of digital intraoral scans.
Optimal scanning distances for highest accuracy are the following:
- 7.5 mm for the 3 Disc scanner (3Disc, Herndon, VA, USA);
- 5 mm for both the Helios 500 scanner (Eighteeth, Changzhou, China) and Trios 3 scannerr (3Shape, Copenhagen, Denmark).
Among the tested devices, the Trios 3 scanner (3Shape, Copenhagen, Denmark) demonstrated the highest trueness and precision, followed by the Helios 500 (Eighteeth, Changzhou, China) and then the 3 Disc (3Disc, Herndon, VA, USA).
Further research is needed to evaluate the effect of scanning distance on accuracy during full-arch digital impressions.
Author Contributions
Conceptualization, R.B., P.H., H.T. and L.H.; methodology, H.T., P.H., A.S., R.B., C.E.C.-S. and N.N.; software, R.B., C.E.C.-S. and M.Á.F.-B.; validation, N.N., M.Á.F.-B., M.L.-S. and R.B.; formal analysis, L.H., R.B., M.L.-S. and H.T.; investigation, R.B., J.E.Z.-C., A.S. and M.L.-S.; resources, R.B., J.E.Z.-C., L.H., R.B., M.L.-S. and H.T.; data curation, R.B., J.E.Z.-C. and N.N.; writing—original draft preparation, P.H., R.B., J.E.Z.-C., L.H., R.B., M.L.-S. and H.T.; writing—review and editing, R.B., C.E.C.-S., L.H., R.B., M.L.-S., P.H. and H.T.; visualization, R.B., C.E.C.-S. and J.E.Z.-C.; supervision, L.H.; project administration, C.E.C.-S.; funding acquisition, L.H. All authors have read and agreed to the published version of the manuscript.
Funding
This research received no external funding.
Institutional Review Board Statement
Not applicable.
Informed Consent Statement
Not applicable.
Data Availability Statement
Data sharing is not applicable. No new data were created or analyzed in this study.
Conflicts of Interest
The authors declare no conflicts of interest.
References
- González de Villaumbrosia, P.; Martínez-Rus, F.; García-Orejas, A.; Salido, M.P.; Pradíes, G. In Vitro Comparison of the Accuracy (Trueness and Precision) of Six Extraoral Dental Scanners with Different Scanning Technologies. J. Prosthet. Dent. 2016, 116, 543–550.e1. [Google Scholar] [CrossRef] [PubMed]
- Button, H.; Kois, J.C.; Barmak, A.B.; Zeitler, J.M.; Rutkunas, V.; Revilla-León, M. Scanning Accuracy and Scanning Area Discrepancies of Intraoral Digital Scans Acquired at Varying Scanning Distances and Angulations among Four Different Intraoral Scanners. J. Prosthet. Dent. 2024, 132, 1044–1060. [Google Scholar] [CrossRef] [PubMed]
- Zimmermann, M.; Mehl, A.; Mörmann, W.H.; Reich, S. Intraoral Scanning Systems—A Current Overview. Int. J. Comput. Dent. 2015, 18, 101–129. [Google Scholar] [PubMed]
- Martin, C.B.; Chalmers, E.V.; McIntyre, G.T.; Cochrane, H.; Mossey, P.A. Orthodontic Scanners: What’s Available? J. Orthod. 2015, 42, 136–143. [Google Scholar] [CrossRef] [PubMed]
- Imburgia, M.; Logozzo, S.; Hauschild, U.; Veronesi, G.; Mangano, C.; Mangano, F.G. Accuracy of Four Intraoral Scanners in Oral Implantology: A Comparative In Vitro Study. BMC Oral Health 2017, 17, 92. [Google Scholar] [CrossRef] [PubMed]
- Hardan, L.; Bourgi, R.; Lukomska-Szymanska, M.; Hernández-Cabanillas, J.C.; Zamarripa-Calderón, J.E.; Jorquera, G.; Ghishan, S.; Cuevas-Suárez, C.E. Effect of Scanning Strategies on the Accuracy of Digital Intraoral Scanners: A Meta-Analysis of In Vitro Studies. J. Adv. Prosthodont. 2023, 15, 315–332. [Google Scholar] [CrossRef] [PubMed]
- Polatoglu, S.; Bahadir, H.S. Digital Dentistry. Curr. Res. Health Sci. 2023, March, 56–65. [Google Scholar]
- Kantaros, A.; Ganetsos, T.; Petrescu, F.I.T. Three-Dimensional Printing and 3D Scanning: Emerging Technologies Exhibiting High Potential in the Field of Cultural Heritage. Appl. Sci. 2023, 13, 4777. [Google Scholar] [CrossRef]
- Mangano, F.G.; Admakin, O.; Bonacina, M.; Lerner, H.; Rutkunas, V.; Mangano, C. Trueness of 12 Intraoral Scanners in the Full-Arch Implant Impression: A Comparative In Vitro Study. BMC Oral Health 2020, 20, 263. [Google Scholar] [CrossRef] [PubMed]
- Di Fiore, A.; Meneghello, R.; Graiff, L.; Savio, G.; Vigolo, P.; Monaco, C.; Stellini, E. Full Arch Digital Scanning Systems Performances for Implant-Supported Fixed Dental Prostheses: A Comparative Study of Eight Intraoral Scanners. J. Prosthodont. Res. 2019, 63, 396–403. [Google Scholar] [CrossRef] [PubMed]
- Benic, G.I.; Sailer, I.; Zeltner, M.; Gütermann, J.N.; Özcan, M.; Mühlemann, S. Randomized Controlled Clinical Trial of Digital and Conventional Workflows for the Fabrication of Zirconia-Ceramic Fixed Partial Dentures. Part III: Marginal and Internal Fit. J. Prosthet. Dent. 2019, 121, 426–431. [Google Scholar] [CrossRef] [PubMed]
- Schmalzl, J.; Róth, I.; Borbély, J.; Hermann, P.; Vecsei, B. The Impact of Software Updates on Accuracy of Intraoral Scanners. BMC Oral Health 2023, 23, 219. [Google Scholar] [CrossRef] [PubMed]
- Vitai, V.; Németh, A.; Sólyom, E.; Czumbel, L.M.; Szabó, B.; Fazekas, R.; Gerber, G.; Hegyi, P.; Hermann, P.; Borbély, J. Evaluation of the Accuracy of Intraoral Scanners for Complete-Arch Scanning: A Systematic Review and Network Meta-Analysis. J. Dent. 2023, 137, 104636. [Google Scholar] [CrossRef] [PubMed]
- Rotar, R.N.; Faur, A.B.; Pop, D.; Jivanescu, A. Scanning Distance Influence on the Intraoral Scanning Accuracy—An In Vitro Study. Materials 2022, 15, 3061. [Google Scholar] [CrossRef] [PubMed]
- Kim, M.K.; Kim, J.M.; Lee, Y.M.; Lim, Y.J.; Lee, S.P. The Effect of Scanning Distance on the Accuracy of Intraoral Scanners Used in Dentistry. Clin. Anat. 2019, 32, 430–438. [Google Scholar] [CrossRef] [PubMed]
- Amornvit, P.; Rokaya, D.; Sanohkan, S. Comparison of Accuracy of Current Ten Intraoral Scanners. Biomed. Res. Int. 2021, 2021, 2673040. [Google Scholar] [CrossRef] [PubMed]
- Bourgi, R.; Qaddomi, M.; Hardan, L.; Tohme, H.; Corbani, K.; Abou Isber, S.; Daher, E.A.; Nassar, N.; Kharouf, N.; Haikel, Y. Gingival Contouring and Smile Makeover through Digital Planning and 3D Guidance. J. Clin. Med. Res. 2025, 6, 6208. [Google Scholar] [CrossRef]
- Falih, M.Y.; Majeed, M.A. Trueness and Precision of Eight Intraoral Scanners with Different Finishing Line Designs: A Comparative In Vitro Study. Eur. J. Dent. 2023, 17, 1056–1064. [Google Scholar] [CrossRef] [PubMed]
- Robles-Medina, M.; Rubio, M.R.; Salido, M.P.; Pradíes, G. Digital Intraoral Impression Methods: An Update on Accuracy. Curr. Oral Health Rep. 2020, 7, 361–375. [Google Scholar] [CrossRef]
- Ender, A.; Mehl, A. In-Vitro Evaluation of the Accuracy of Conventional and Digital Methods of Obtaining Full-Arch Dental Impressions. Quintessence Int. 2015, 46, 9–17. [Google Scholar] [PubMed]
- Amornvit, P.; Sanohkan, S.; Peampring, C. Studying the Optical 3D Accuracy of Intraoral Scans: An In Vitro Study. J. Healthc. Eng. 2020, 2020, 5739312. [Google Scholar] [CrossRef] [PubMed]
- Kim, R.J.Y.; Park, J.M.; Shim, J.S. Accuracy of 9 Intraoral Scanners for Complete-Arch Image Acquisition: A Qualitative and Quantitative Evaluation. J. Prosthet. Dent. 2018, 120, 895–903.e1. [Google Scholar] [CrossRef] [PubMed]
- Park, J.M. Comparative Analysis on Reproducibility among 5 Intraoral Scanners: Sectional Analysis According to Restoration Type and Preparation Outline Form. J. Adv. Prosthodont. 2016, 8, 354–362. [Google Scholar] [CrossRef] [PubMed]
- Müller, P.; Ender, A.; Joda, T.; Katsoulis, J. Impact of Digital Intraoral Scan Strategies on the Impression Accuracy Using the TRIOS Pod Scanner. Quintessence Int. 2016, 47, 343–349. [Google Scholar] [PubMed]
- Richert, R.; Goujat, A.; Venet, L.; Viguie, G.; Viennot, S.; Robinson, P.; Farges, J.-C.; Fages, M.; Ducret, M. Intraoral Scanner Technologies: A Review to Make a Successful Impression. J. Healthc. Eng. 2017, 2017, 8427595. [Google Scholar] [CrossRef] [PubMed]
- Oh, K.C.; Park, J.M.; Moon, H.S. Effects of Scanning Strategy and Scanner Type on the Accuracy of Intraoral Scans: A New Approach for Assessing the Accuracy of Scanned Data. J. Prosthodont. 2020, 29, 518–523. [Google Scholar] [CrossRef] [PubMed]
Disclaimer/Publisher’s Note: The statements, opinions and data contained in all publications are solely those of the individual author(s) and contributor(s) and not of MDPI and/or the editor(s). MDPI and/or the editor(s) disclaim responsibility for any injury to people or property resulting from any ideas, methods, instructions or products referred to in the content. |
© 2025 by the authors. Licensee MDPI, Basel, Switzerland. This article is an open access article distributed under the terms and conditions of the Creative Commons Attribution (CC BY) license (https://creativecommons.org/licenses/by/4.0/).