1. Introduction
Severely compromised endodontically treated teeth are at risk of fractures and mechanical failure due to massive coronal tooth structure loss [
1]. To address this issue and prepare for crown placement, a post is often required to retain and support the core [
1]. These posts, when inserted into the root canals, provide stability to the cores of structurally compromised teeth [
2] and are considered optimal solutions to ensure durability and prevent leakage [
3,
4]. Ideally, the length of the post should match or exceed the height of the tooth crown, with an apical seal of 4–5 mm to ensure secure retention [
5].
The posts used in dental procedures are categorized into two types: custom-made and prefabricated. Custom-made posts are considered anatomically designed and the gold standard as they enhance adhesion, increase resistance to fracture, and minimize stress from polymerization contraction [
6]. Posts are especially effective in managing significant tooth loss and are advantageous when there is an inadequate ferrule [
1]. One of their main advantages is their ability to capture canal irregularities, resulting in a better fit within the root canals [
1,
4]. However, custom-made posts may require multiple visits and extended chair time, and their greater modulus of elasticity than dentin can increase the risk of root fractures and compromise esthetics by staining delicate gingival and bone tissues [
7].
In contrast, prefabricated posts, made of metal or fiber-reinforced resin, [
7] provide a supportive core for moderately damaged coronal parts [
5]. Their primary advantage is their ability to be completed in a single visit, which reduces the chair time. However, a common issue associated with prefabricated posts is the potential mismatch between the premade post and space within the tooth, leading to an irregular cement layer and an increased risk of structural inconsistencies. Additionally, increased polymerization shrinkage can induce internal stress, further complicating the situation [
8].
With the advancements in dentistry, various techniques have emerged beyond conventional custom posts, such as the computer-aided design/computer-aided manufacturing (CAD/CAM) of posts and cores that employ both direct and indirect methods [
7]. These approaches utilize digital dentistry tools that have evolved significantly, with the potential of enhanced treatment outcomes, patient compliance, efficiency for dentists, and higher predictability and accuracy [
9,
10]. Attempts have been made to use digital techniques, particularly intraoral scanners, to fabricate custom posts after measuring post space dimensions and designing custom posts and cores to provide accurate results. Posts fabricated this way are effective and realistic and fulfill the clinical requirements [
7].
Intraoral scanners offer several advantages, including reduced treatment time, repeatability, the elimination of polymerization issues associated with conventional impression materials, data archiving capabilities, and compatibility with patients with a gag reflex. Additionally, they facilitate communication with technicians through the transfer of digital data via the internet [
11,
12]. Despite their benefits, intraoral scanners have drawbacks, such as a high cost, susceptibility to saliva interference during data capture, and challenges in detecting deep margins. Recent advancements in intraoral scanner technology have addressed these limitations, enabling the direct scanning of intra-canal post space preparations and improving depth detection in narrow canals [
13]. Recent efforts have explored the use of digital tools to create custom posts with precise measurements to minimize errors [
11,
12,
13,
14,
15,
16].
An in vitro study that evaluated the accuracy of intraoral scanners (3shape TRIOS, Denmark) in measuring the post space depth showed that digital scans had a mean depth discrepancy of 19.58% compared with traditional impressions [
6]. The data also indicated variations in depth measurements between the two techniques. The study found that the intraoral scanners used in the experiment had limitations in accurately measuring the depth of post spaces, particularly in narrow root channels. There were also inconsistencies in the depth measurements between the digital scans obtained with the intraoral scanner and the traditional silicon impressions.
In 2020, Libonati et al. demonstrated the potential of digital dentistry for improving the precision and efficiency of dental procedures [
3]. Unlike traditional methods involving plaster models, this study introduces the use of intraoral scans to directly mill customized glass fiber posts and cores. Through in vitro experiments, the study evaluated the accuracy of the 3shape Trios scanner in assessing post space dimensions, confirming its effectiveness in capturing depths of up to 9 mm. Utilizing a digital workflow, the study transformed the concave root canal shape into a convex surface for customized post and core restorations, enhancing the biomechanics of treated teeth and reducing the risk of root fractures. Additionally, the study highlighted the benefits of using a thin layer of cementing resin with customized posts to minimize polymerization stress and prevent gaps in the adhesive interface [
3].
In 2022, Hegazi et al. focused on assessing the precision of post space scans in dentistry, utilizing 14 human mandibular premolar teeth with similar root and canal characteristics [
8]. After endodontic treatment, the teeth underwent coronal sectioning and post space preparation and were divided into groups based on the post space depth. Using the inEos X5 intraoral scanner, the study assessed scan accuracy, revealing significant differences in the root mean square (RMS) values of the samples with 10 and 7 mm post space depths. This highlights the impact of post space depth on scan accuracy, emphasizing its importance in dental scanning procedures to enhance restoration quality. However, the limitations of the study, including sample size constraints, specificity to premolar teeth, and scanner selection, underscore the need for comprehensive research into the clinical implications and long-term outcomes [
8].
In 2022, Leven et al. assessed the accuracy of the digital scans and utilized different intraoral scanner methods, including Primescan (PRI), Trios4 without scanpost (TRI), and Trios4 with scanpost (TRI + SP). Trios4 exhibited a higher precision than Primescan. Additionally, the study explored the CAD/CAM milling accuracy of two distinct materials: zirconium dioxide (ZIR) and resin composite (COM). The results demonstrated a superior fit accuracy for the posts and cores manufactured with zirconium dioxide (ZIR) over those made of resin composites (COM) [
17].
In 2023, Emam et al. compared the trueness of digital scans of post spaces with depths of 8 mm and 10 mm using three intraoral scanners: Primescan AC, Medit i500, and CS 3600 [
13]. The digital scans were compared with traditional impressions obtained using an InEos X5 desktop scanner using reverse engineering software. The Medit i500 scanner demonstrated the highest trueness in capturing post space digital scans. Furthermore, within the digital scans captured with CS 3600, the 10 mm post space depth showed higher trueness than the 8 mm depth. CS 3600 also exhibited limitations in capturing the full length at both 8 and 10 mm post space depths compared with Primescan AC and Medit i500 [
13].
In 2023, Almalki et al. examined the precision of direct intraoral scanner impressions of digital posts and core restorations in dentistry [
18]. This study was conducted in vitro using 45 typical teeth to simulate maxillary central incisors. The teeth were divided into three subgroups based on the desired post space length: 6, 8, and 10 mm. Intraoral scans of the specimens were obtained with CEREC Primescan intraoral scanners, and these digital scans were compared with conventional impressions made with polyvinyl siloxane (PVS). The accuracy of the digital scans was assessed in the coronal, middle, and apical thirds using the Geomagic Design X software 2024.3.2. While there were no significant differences in accuracy among the different post space length subgroups in the coronal and middle thirds, the subgroup with a post length of 10 mm showed a lower accuracy than those with lengths of 6 and 8 mm in the apical third. The accuracy of intraoral scans reduces with increasing post space lengths, particularly in the apical third.
Several studies have assessed the accuracy of digital scans and compared it with that of conventional impressions, but only a few have specifically investigated the accuracy of intraoral scanners in measuring post spaces with varied lengths. Therefore, this study aimed to address this gap. The null hypothesis was that the accuracies of the techniques for capturing the post space are not different regardless of post space length.
2. Materials and Methods
Ethical approval for this experimental study was obtained from the Research Ethics Committee of the Faculty of Dentistry, King Abdulaziz University (162-11-23). The inclusion criteria were anterior plastic teeth, single-rooted teeth, and wide straight canals. The exclusion criteria were natural teeth, multi-rooted teeth, and severely complex narrow canals. The collected samples were randomly assigned to eight groups based on the four techniques for impressions and the two space depths using the randomization algorithm using
https://www.randomizer.org (accessed on 15 April 2024).
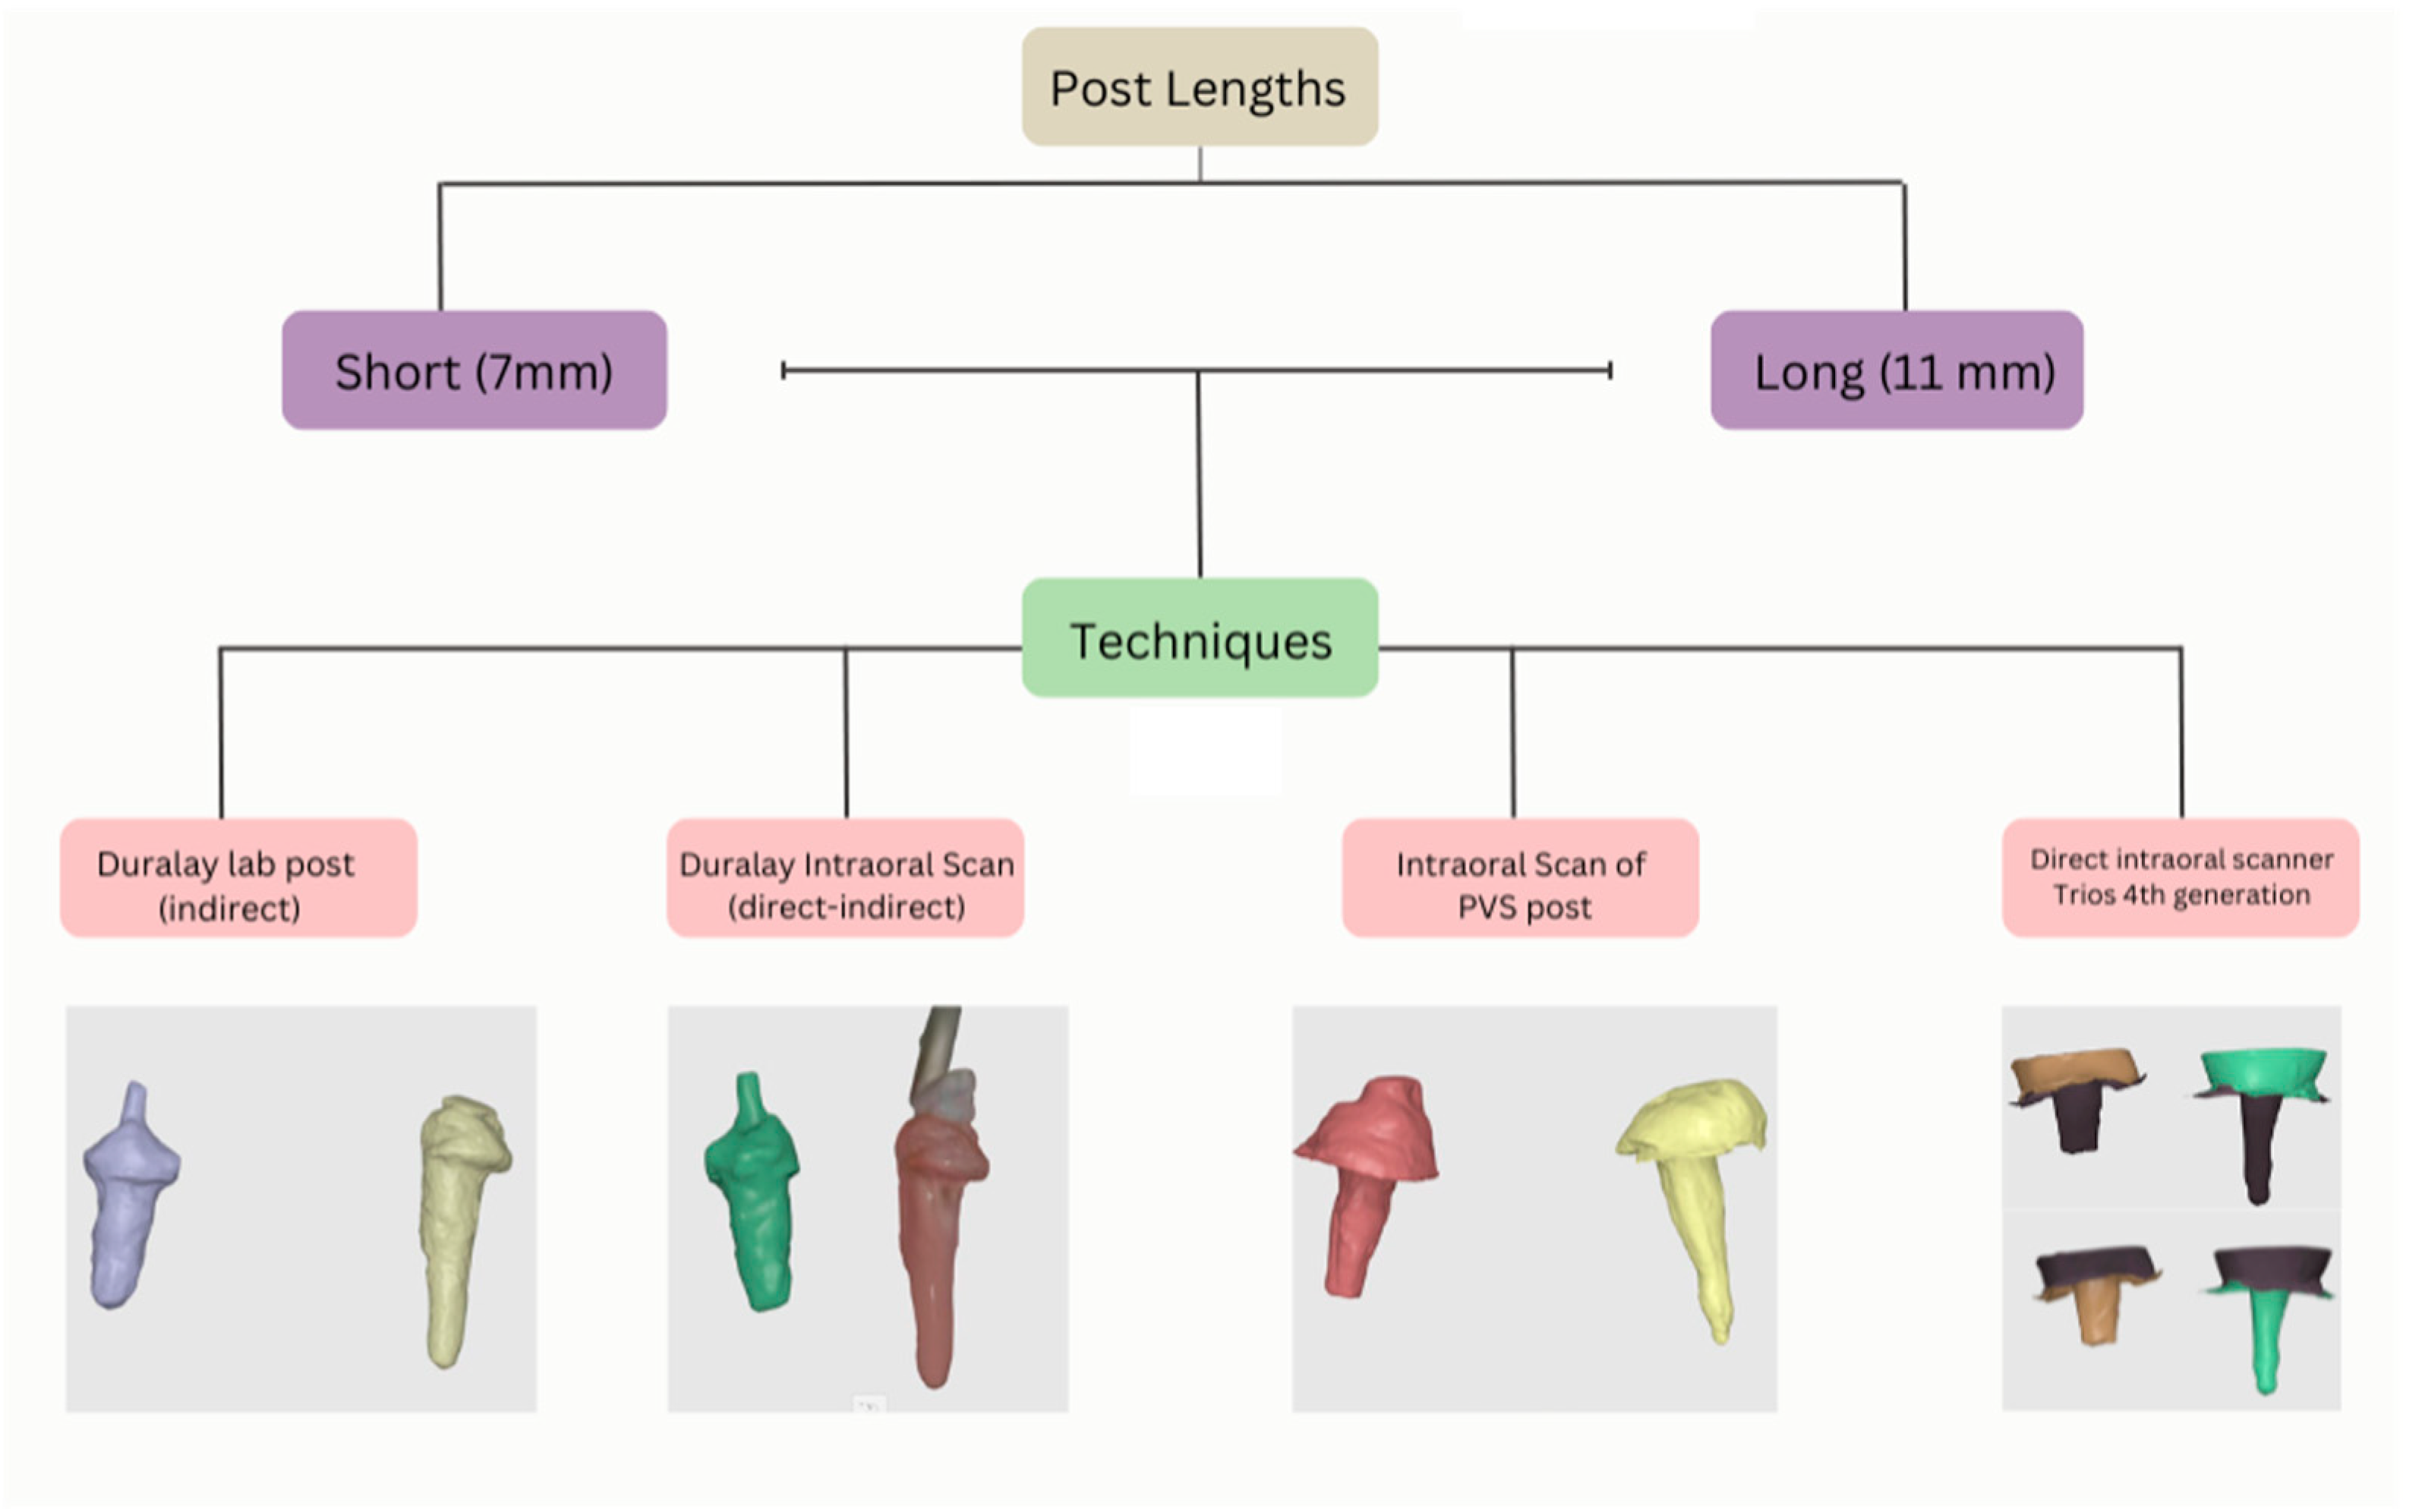
Two central maxillary plastic incisors were used in this study. After the initial tooth preparations were performed, the anatomical crowns of the sample were trimmed by 2 mm above the cemento–enamel junction (CEJ). Sectioning was performed using a diamond bur (blue). The two plastic teeth underwent routine root canal treatment by an endodontist (S.B). The working lengths were set to 17 and 18 mm. Both teeth were thoroughly cleaned and canal-shaped using the ProTaper Next system. A standardized obturation technique was performed using the thermal compaction of gutta-percha to ensure the optimal sealing of the canal space. This was followed by post space preparations at a short depth of 7 mm and a long depth of 11 mm. Gates Glidden drills in sizes 2, 3, and 4 and the RelyX fiber post universal drill were used for the preparations. Each depth was measured from the CEJ to the coronal part of the apical seal. Both teeth were mounted in small containers with a putty index material to simulate the clinical scenario. The techniques used were Duralay lab post, Duralay intraoral post (direct–indirect), PVS intraoral post, direct intraoral scanner Trios fourth generation, and PVS lab post (for the control).
The techniques were performed as follows (
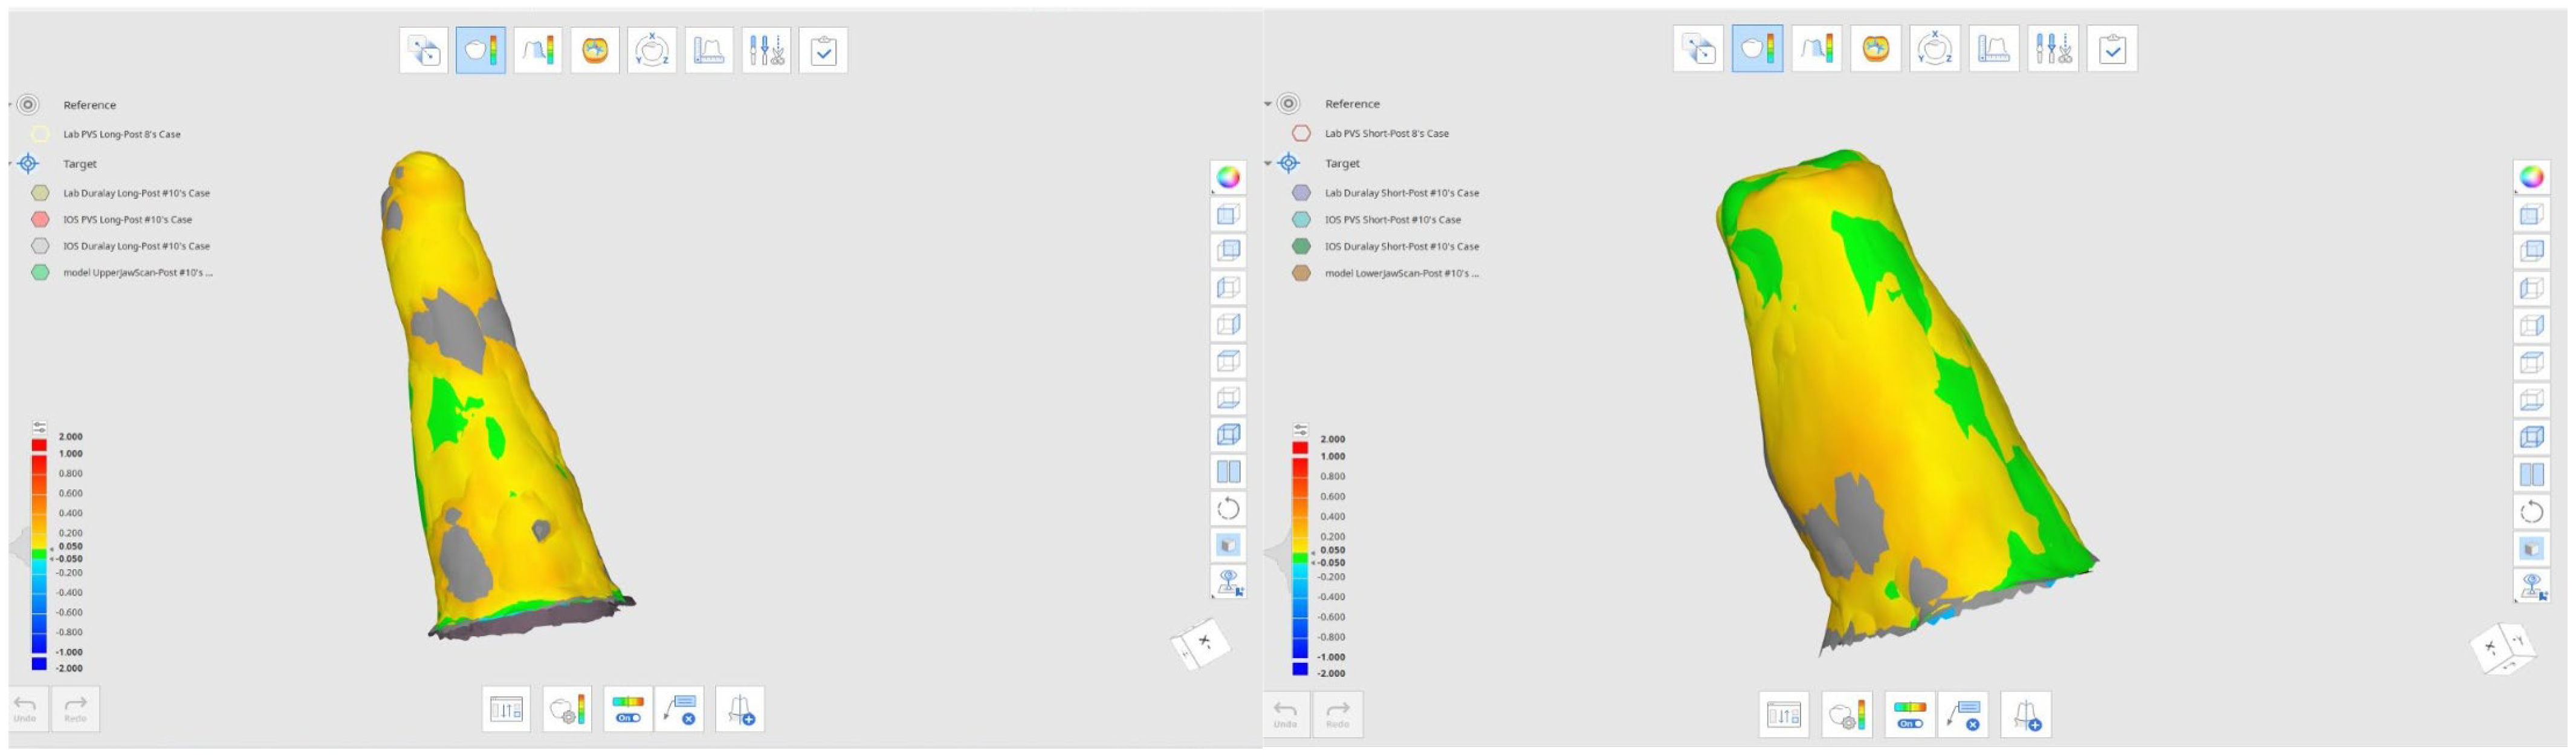
Figure 1): Firstly, the conventional Duralay technique uses dental material to directly obtain an impression of the canal space. We applied the Duralay inside that space to capture its exact shape and length. Subsequently, the Duralay impression was sent to a laboratory for scanning, where the Duralay restoration was converted into digital data. For the remaining techniques, a CAD-CAM impression was obtained using the Trios fourth generation intraoral scanner, with ten repetitions for every individual technique at different post space depths. The depths included were short (7 mm) and long (11 mm). The second technique involved an additional step beyond the first, where a CAD-CAM impression was obtained from the molded material (Duralay post). This approach is categorized as a scanned (direct or indirect) Duralay post. The third technique involved the use of elastomeric material (PVS post). The light body material was injected into the post space, with a prefabricated fiber post serving as a supplementary tool to retain the material until the PVS was completely set. The last technique involved the direct insertion of the Trios fourth generation intraoral scanner into the canal to capture comprehensive post space details, followed by a CAD-CAM impression. The captured images were exported into two file formats after the repetition was completed. Subsequently, all collected information was collated into a single digital system (Medit link) to facilitate further measurements (
Figure 2). Additionally, four different techniques, along with two different depths, were superimposed, and the results were compared.
A power analysis (G-Power v3.1.9.5) was used to determine the sample size that corresponded to the number of repetitions of each technique required for this study. The sample size (n = 10) was calculated as the appropriate sample size per group (power = 95%, α= 0.05). All analyses were conducted using SPSS version 29, with the significance level set at α= 0.05. The dependent variable was determined using (Medit link) to indicate the differences between the aligned virtual models. The independent variables included the technique and depth of the post space. Subsequently, the Kruskal–Wallis test, which served as a non-parametric alternative to two-way ANOVA, was used to determine the differences between the groups. Following this, the Mann–Whitney U test (post hoc) was used to determine the significant differences in trueness and precision between the groups.
3. Results
The descriptive statistics are presented in
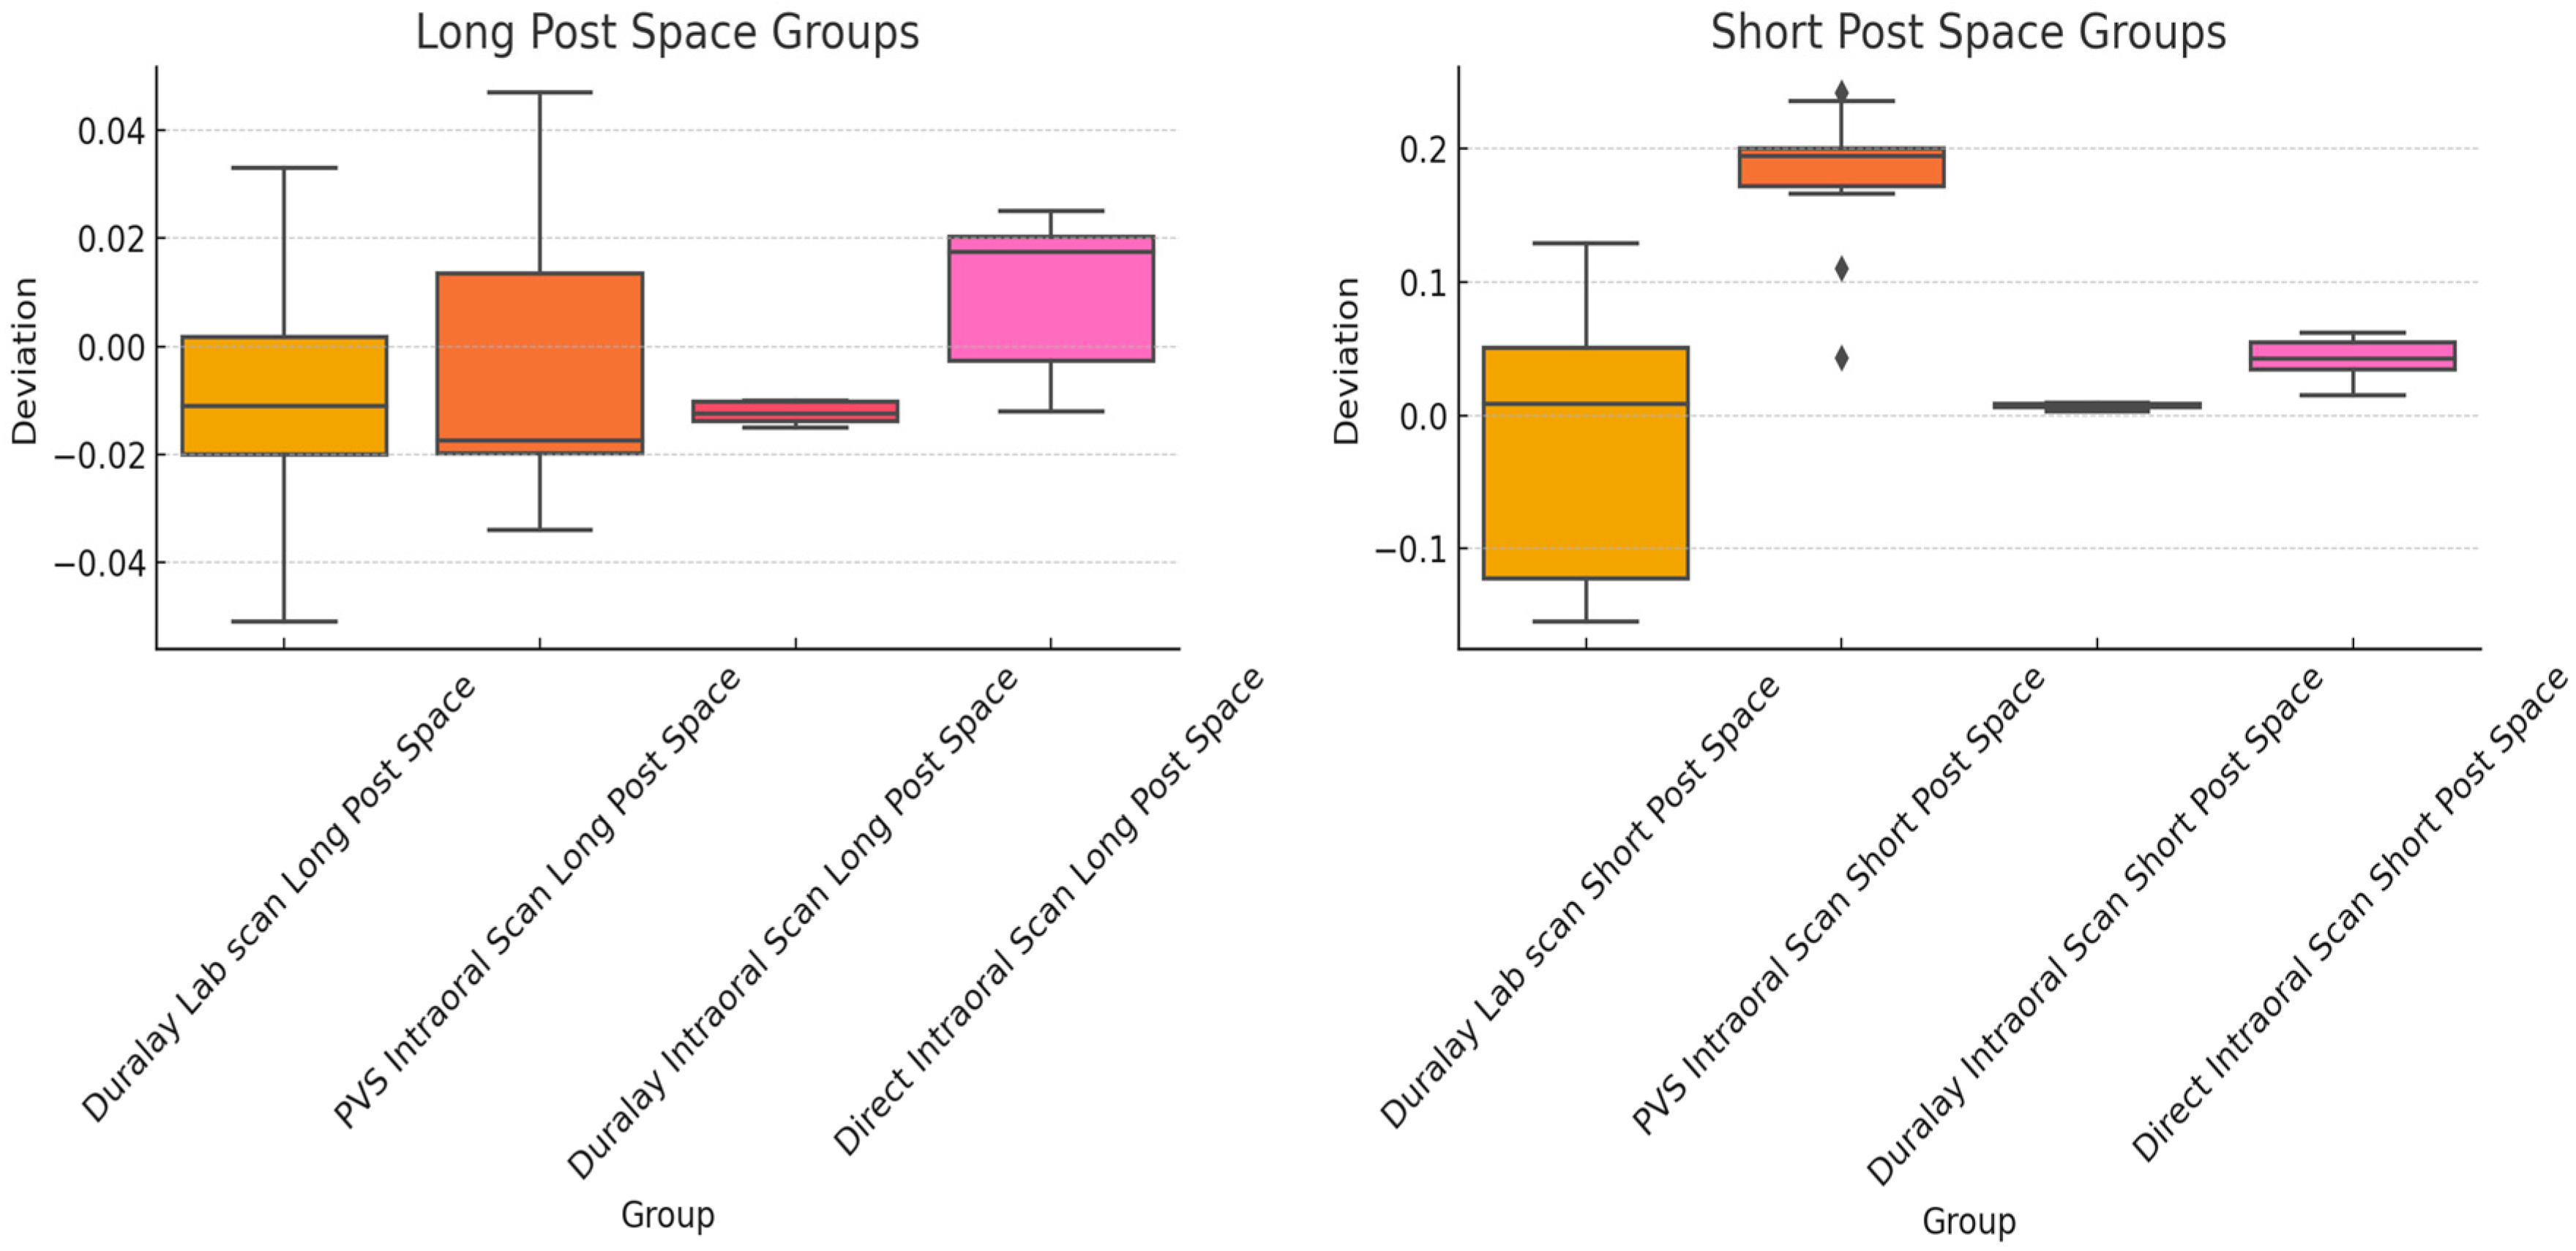
Table 1. The mean RMS values were −0.0122–0.0098 (standard deviations of 0.0018–0.0243) for the long post space group and −0.0241–0.1773 (standard deviations of 0.0018–0.1017) for the short space group (
Figure 3). The means and standard deviations of the groups were different, reflecting the differences in trueness and precision. The “Duralay Intraoral Scan” groups (both long and short) demonstrated the least variability, indicating a high consistency in their measurements. The Shapiro–Wilk test results suggested that the data of most of the groups were normally distributed (
p > 0.05). The data of the PVS Intraoral Scan Short Post Space and Duralay Intraoral Scan Short Post Space groups demonstrated deviations from normality. Levene’s test indicated that the variances were not homogeneous across the groups (
p < 0.05). Given these findings, a nonparametric method was used to compare the groups because of the lack of homogeneity of variance and normality concerns.
This section presents a detailed analysis of the RMS deviations for both long and short post space groups using different capturing techniques. The Welch ANOVA test, a nonparametric alternative to the two-way ANOVA, indicated significant differences (
p < 0.05) between the long (F [3, 46] = 15.02,
p < 0.0001) and short (F [3, 46] = 26.72,
p < 0.0001) post space groups. The RMS values significantly differed for the different capturing techniques for the long and short post space groups.
Table 2 shows the results of the pairwise comparisons of the groups with adjusted
p-values after Bonferroni’s correction. The pairwise comparisons indicated significant differences between certain pairs, especially between long and short post spaces and between laboratory and intraoral scans for both long and short space categories.
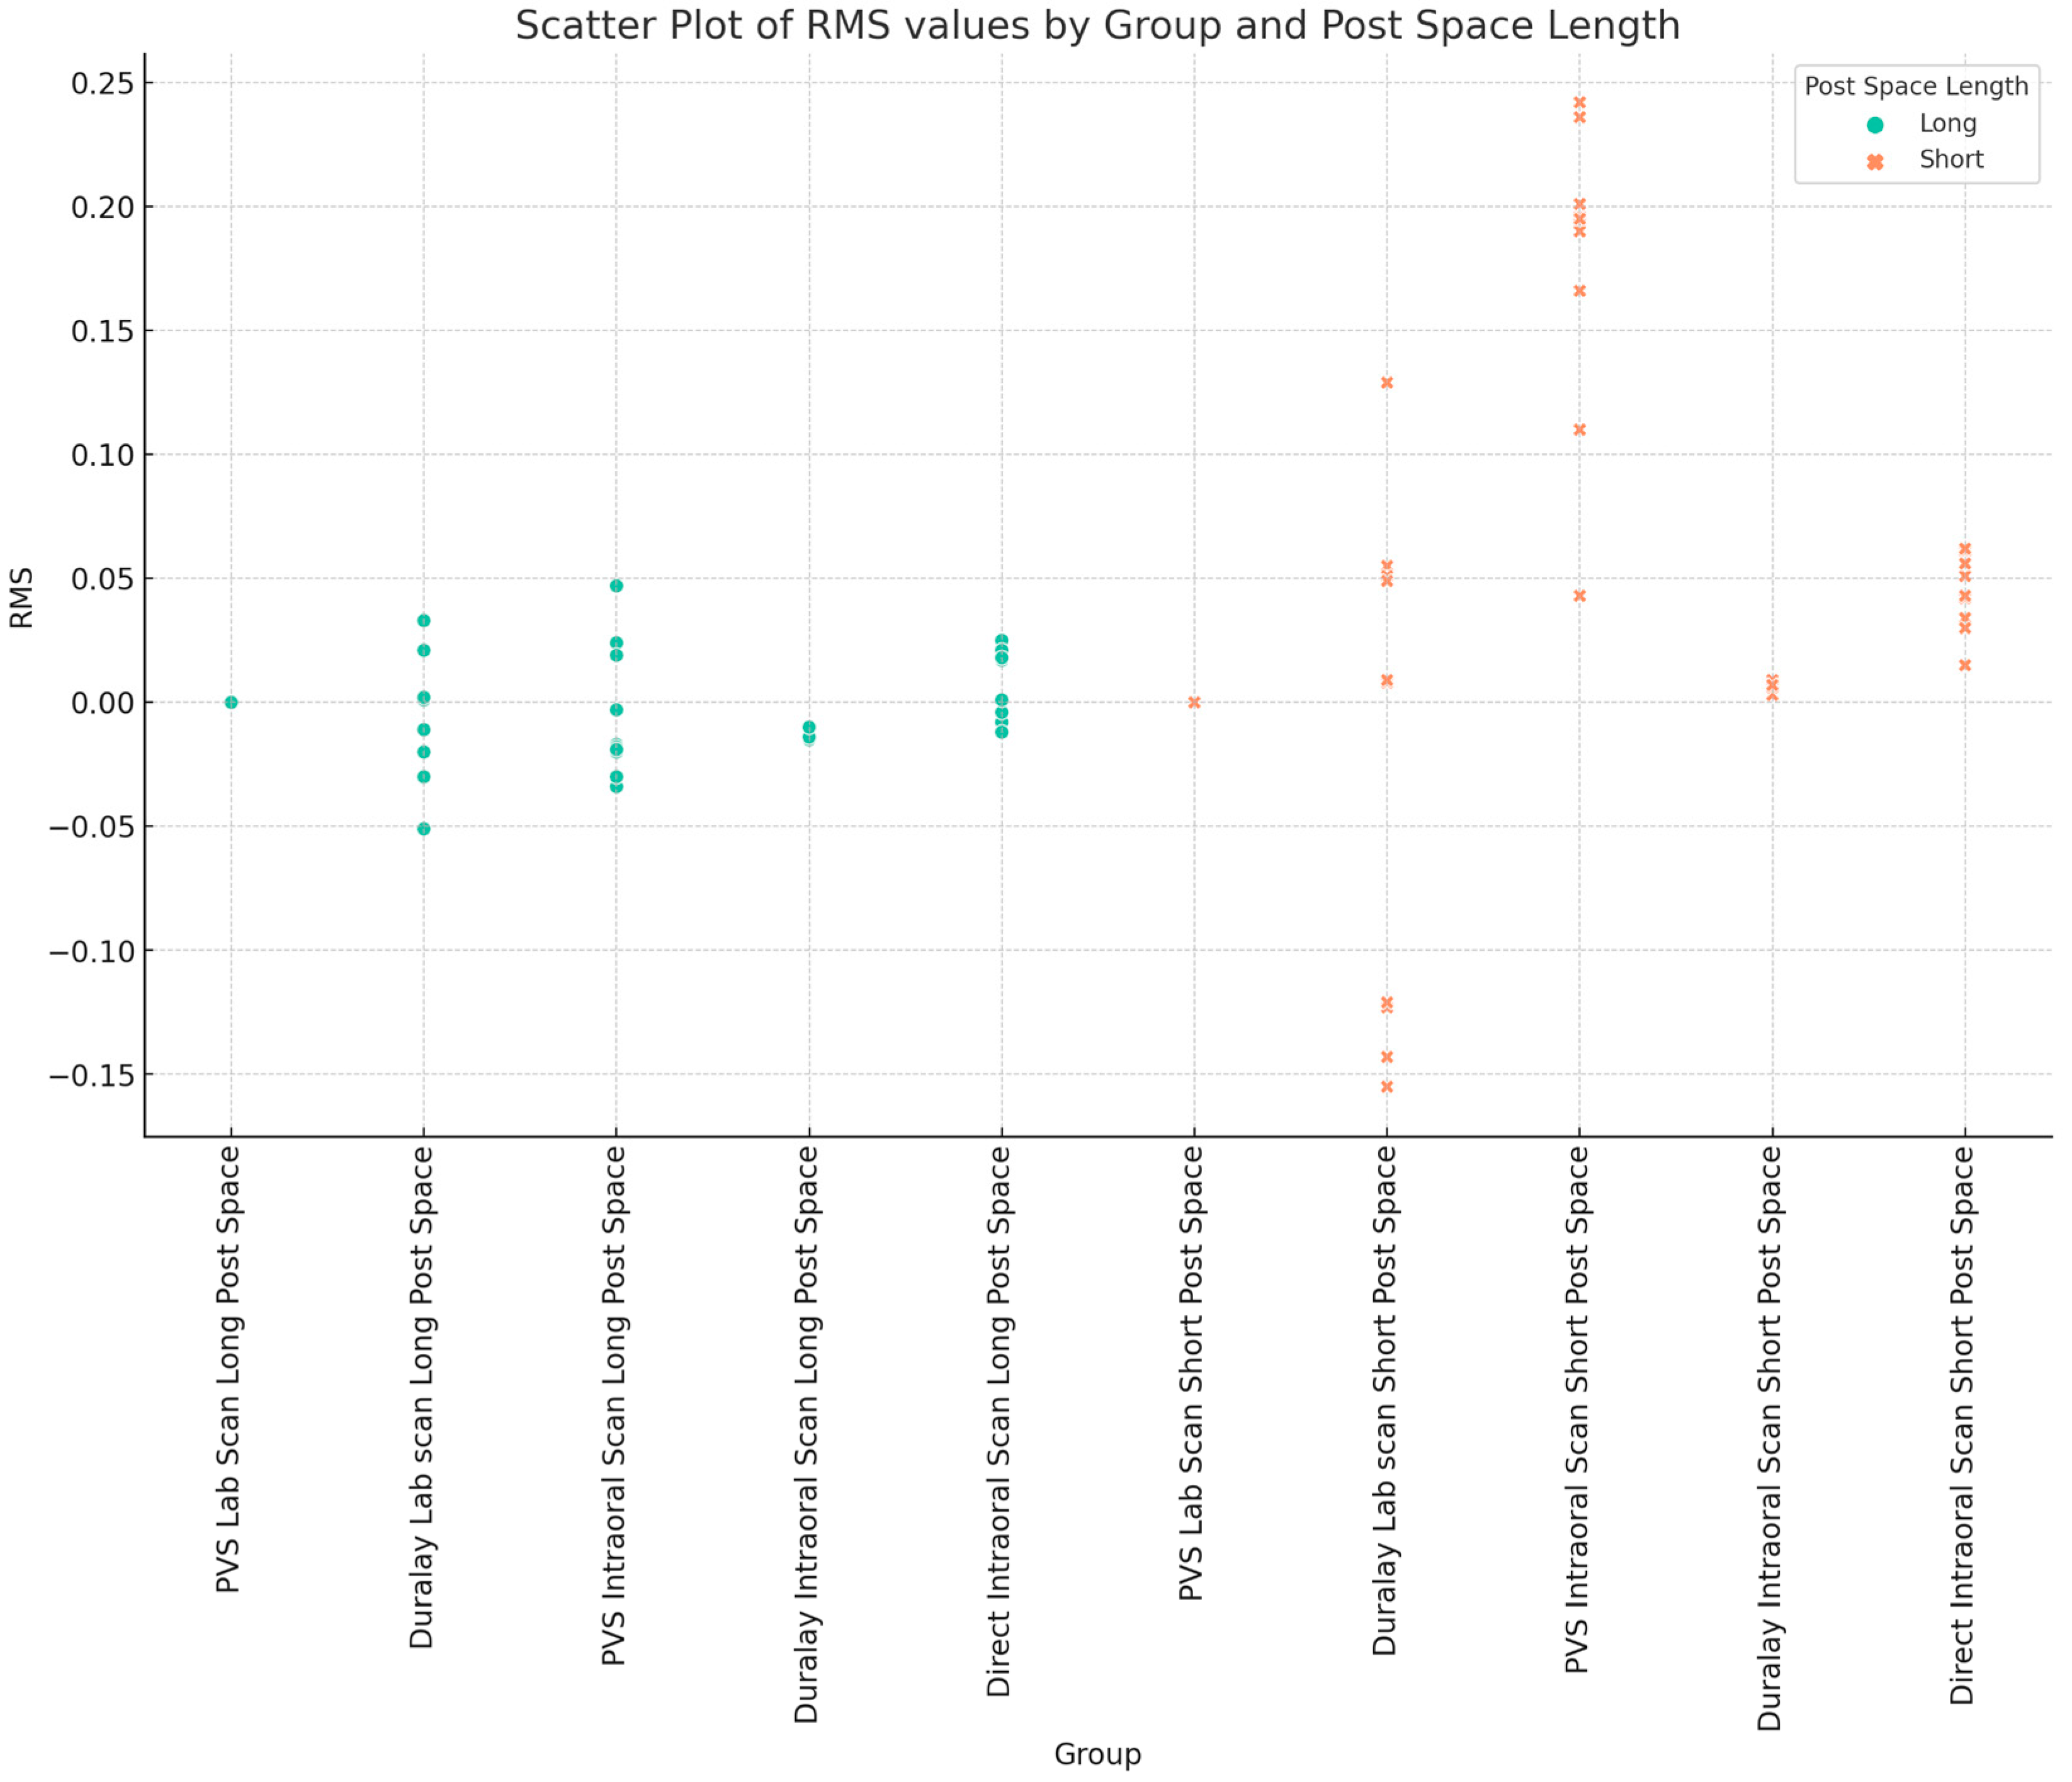
Figure 4 shows a scatter plot highlighting the spread and clustering of RMS values for each group and the differences in the capturing technique and post space length.
The Kruskal–Wallis test indicated significant differences among the long post space groups (F statistic = 7.95, p = 0.0471). The post hoc analysis using pairwise Mann–Whitney U tests with Bonferroni’s correction showed a significant difference only between the Duralay Intraoral Long and Direct Intraoral Long groups (p = 0.0039). This suggests that the technical differences between the two groups were pronounced. This finding indicated a significant difference in the deviations between these two techniques in capturing long post spaces.
The Kruskal–Wallis test demonstrated significant differences between the short post space groups among the four post space capturing techniques (F statistic = 25.64,
p = 1.13 × 10
−5). The post hoc comparisons (
Table 3 and
Table 4) highlighted significant differences between the groups, with
p-values less than 0.05. These results indicate a clear distinction between how these techniques capture short post spaces.
A precision analysis was performed by examining the variability within each group.
Table 5 shows the variability within each group and highlights the groups with consistent or varied measurements. The Duralay Intraoral Scan Long Post Space and Duralay Intraoral Scan Short Post Space groups demonstrated the highest consistency with the lowest standard deviation (0.0019). This indicated a very low variability of the measurements for these groups. The Direct Intraoral Scan Long Post Space and Direct Intraoral Scan Short Post Space groups showed moderate consistency with standard deviations of 0.0140 and 0.0150, respectively. The Duralay Lab Scan Short Post Space group had the highest variability, with a standard deviation of 0.1018, suggesting significant inconsistency in the measurements for this group. The PVS Intraoral Scan Short Post Space also showed relatively high variability with a standard deviation of 0.0596 (
Table 5).
4. Discussion
The null hypothesis was rejected because significant differences in trueness and precision were observed with varying capturing techniques and post space lengths.
In our study, the precisions of the capture techniques were significantly different. The independent variables were four techniques and two post space depths. Using the Kruskal–Wallis test, significant differences across the groups were found (p < 0.05), and the Mann–Whitney U test (post hoc) was used to assess trueness and precision variations between groups.
CAD/CAM effectiveness and ability to meet clinical requirements have been widely reported [
7]. A previous study used CAD-CAM to customize a ceramic or fiberglass post and core by scanning and milling a resin post pattern [
14,
15,
19]. This technique can facilitate a precise post and core fit into the prepared canal and provide better retention [
14,
15,
19]. As with the traditional approach, CAD/CAM post and core fabrication can be achieved through either an indirect or a direct approach.
The Duralay Intraoral Scan groups (both long and short) showed the least variability in this study, indicating a high consistency in their measurements. Almalki et al. emphasized a decrease in intraoral scanner accuracy with increasing post space length, particularly in the apical third [
18]. This observation underscores the limitations of the current digital impression technology in accurately capturing deep post spaces. Pinto found a notable 19.58% mean reading depth discrepancy between digital and traditional silicone impressions [
6]. The standard deviation reported by Pinto further suggested the inconsistency of the values obtained from digital impressions. This was attributed to the limitations of the light beam of intraoral scanners in reaching the deepest areas of the post space, especially in narrow root channels. This finding is consistent with the finding of increased variability in this study and significant deviations from the normality for the PVS Intraoral Scan Short Post Space, Duralay Lab Scan Short Post Space, and Direct Intraoral Short Post Space groups (
Table 5).
Libonati demonstrated the potential of digital scanning technology to accurately measure post space depths of up to 9 mm. The study had limitations, including the reliance on a single clinical case and a lack of long-term data on the durability of customized glass fiber posts and core restorations. Moreover, it did not extensively explore or compare CAD/CAM technology and digital intraoral impressions with alternative methods, and the absence of a control group limited direct comparisons with other restorative techniques or materials. Our findings are in accordance with the findings from Emam et al., who revealed notable differences in the root mean square (RMS) values for various scanners, with implications for selecting the most suitable scanning system based on the performance characteristics. Additionally, they found that the depth of the post space significantly influenced the trueness values of the scans, which is consistent with our observations. This understanding of the influence of the post space depth is further reinforced by the study by Hegazi, which highlighted the influence of post space depth on scan accuracy. Samples with post space depths of 10 mm showed lower trueness values than those with depths of 7 mm, underscoring the need for clinicians to exercise caution and carefully consider the limitations of intraoral scanning technology for deeper post space preparations [
8].
Intraoral scanning techniques face several limitations when capturing post space. In curved and narrow canals, scanners struggle to accurately capture the full length, leading to incomplete or distorted digital impressions. Posterior teeth also face challenges due to reduced visibility, complex anatomical features, and limited light. Mouth opening and patient cooperation can also complicate the scanning process. Cost implications include high initial investment, maintenance costs, software updates, and potential training requirements. Material reflection and artifacts can cause scanning artifacts or incomplete data capture. Software limitations may result in stitching errors or a failure to accurately merge data from the deeper parts of the canal. All of these limitations can affect the accuracy of the captured scan.
This study provides further insights into the differences in the precision and trueness of different intraoral scanning techniques, highlighting Duralay Intraoral and Direct Intraoral methods for capturing long post spaces. The potential of digital scanning technology was investigated to accurately measure post space depths extending up to 11 mm. Conversely, our study showed a wider spread and variability for the short post space groups than for the long ones (
Table 2,
Table 3 and
Table 4), indicating that the post space length significantly affects measurements.
Based on precision analysis (
Table 5), variability was observed within each group, indicating differing levels of consistency in the measurements. The Duralay Intraoral Scan Long Post Space and Duralay Intraoral Scan Short Post Space groups demonstrated a high consistency, as evidenced by the lowest standard deviations (0.0019), and minimal variability. The Direct Intraoral Scan Long Post Space and Direct Intraoral Scan Short Post Space groups demonstrated moderate consistency, with standard deviations of 0.0140 and 0.0150, respectively. The Duralay Lab Scan Short Post Space group demonstrated the highest variability, with a standard deviation of 0.1018. This indicated significant inconsistencies in the measurements. Similarly, the PVS Intraoral Scan Short Post Space group demonstrated a relatively higher variability with a standard deviation of 0.0596.
This study had limitations. It was limited to a set of intraoral scanning techniques and post space lengths. A limited number of single-rooted plastic teeth were also used in vitro, which may not accurately represent real clinical settings. This study also focused on specific intraoral scanner models; therefore, the results may not apply to other scanner brands. Future research should expand this investigation to include a broader range of scanning technologies, post space configurations, and clinical scenarios. Additionally, studies evaluating the clinical outcomes and patient-reported experiences associated with these scanning techniques would provide valuable insights for informed decision making.


 ,
, 
