Article

Experimental and Numerical Investigation of Door-Closure Ear Pressure with Improved Leakage Modeling

National Key Laboratory of Automotive Chassis Integration and Bionics, Jilin University, Changchun 130025, China
*
Author to whom correspondence should be addressed.
Vehicles 2026, 8(9), 211; https://doi.org/10.3390/vehicles8090211
Submission received: 19 July 2026 / Revised: 21 August 2026 / Accepted: 31 August 2026 / Published: 7 September 2026
(This article belongs to the Special Issue Advanced Research on Vehicle Noise and Vibration)

Abstract

The transient pressure rise in occupants’ ears during vehicle door closure remains a key challenge for cabin comfort, but existing simulation methods often lack accuracy or efficiency. This study develops an integrated experimental–CFD–theoretical framework. A high-fidelity vehicle model was constructed from point cloud data and validated against airtightness and door-closure tests. A theoretical model was derived and calibrated using flow hysteresis and fluctuation attenuation coefficients from CFD results. Uncontrolled leakage was represented by distributed circular holes, and the one-way flow through the pressure relief valve was implemented numerically. The refined CFD model reduced the peak-pressure and amplitude errors from 6.33% and 17.62% to 1.75% and 2.66%, respectively. The calibrated theoretical model achieved 93.94% accuracy in pressure amplitude relative to the CFD results, with much lower computational cost. An optimization strategy combining early valve opening with an auxiliary fan at the relief valve reduced peak pressure, amplitude, and pressure change rate by 25.88%, 22.83%, and 41.23%, respectively. By deeply integrating experiments, simulation, and theory with refined modeling of key physical features, this research overcomes the accuracy and efficiency limitations of traditional methods, offering a systematic solution for cabin comfort optimization and advancing forward-development capabilities in vehicle NVH.

1. Introduction

With the steady improvement of living standards, vehicle ownership has continued to grow [1] and the demand for ride comfort has risen accordingly [2]. Meanwhile, the advancement of manufacturing processes has gradually enhanced the overall sealing performance of vehicle bodies. Consequently, the pressure in the passenger compartment rises during door closure, causing significant ear discomfort for occupants [3,4].
During door closure, the movement of the door entrains surrounding air into the passenger compartment, so that the air mass inside increases rapidly within a short period and the interior pressure rises accordingly. The entrapped air can escape through two pathways: the body pressure relief valve, and structures such as wiring harness holes and component mounting gaps [5]. When the whole-vehicle airtightness is high, the pressure relief effect of these gaps and holes weakens, exacerbating the pressure rise. From the perspective of human ear physiology, when the external pressure increases, the tympanic membrane is pushed inward, causing discomfort such as ear fullness and tinnitus; in severe cases, it may even lead to middle ear barotrauma [6,7,8].
In the field of high-speed trains, ear pressure comfort has been studied more extensively. After the opening of Japan’s Tokaido Shinkansen in 1964, passengers were found to experience eardrum pain when trains passed through tunnels or passed each other [9]. Studies have confirmed that the transient ambient pressure changes generated in these events cause passenger ear discomfort. Since then, Japan, Germany, the United Kingdom, and other countries have conducted extensive research on the effect of interior pressure fluctuations on passengers’ ear comfort in high-speed trains [10,11,12,13,14].
For aircraft cabins, the cabin pressure control system has long been an important part of aircraft environmental control. Early research focused primarily on protecting occupants from the hazards of high-altitude hypoxia, whereas recent research has shifted toward improving comfort at high altitudes [15,16,17,18].
Compared with high-speed trains and aircraft, automobile door closure may not generate pressure changes sufficient to injure the human ear, yet ear discomfort does exist. Subjective evaluations of 30 vehicle models on the market showed that only 2 were free of ear pressure discomfort [19,20], indicating that ear pressure discomfort can substantially affect occupants’ riding experience.
With regard to CFD simulation methodology, Tooya et al. [21] were the first to combine CFD simulation with dynamic mesh deformation to analyze the airflow inside the passenger compartment. Y. L. Lee [4] conducted a statistical analysis of the body leakage of 43 vehicle models and applied these data in CFD simulations to study the effects of door-closing speed and body leakage area on the pressure in the passenger compartment.
R. Zhang [22] used the MIRA model, which is more consistent with the structure of actual passenger vehicles, to analyze the door-closure process. Li et al. [23] established a commercial vehicle simulation model using Fluent and validated the CFD results experimentally, thereby verifying the feasibility of CFD simulation for studying this problem.
To improve the simulation methods, Cousin et al. of Ford Motor Company [24] simulated seal compression using the zero-gap feature of overset mesh in STAR-CCM+, making the simulation more realistic. Su [19] further improved the accuracy of the CFD model through detailed modeling of the pressure relief passage and the cavity volume.
Regarding theoretical models, Jun et al. of Geely [20] derived the relationships between the pressure fluctuation and parameters such as the door-closing speed and the ratio of door area to passenger compartment volume through a simplified mathematical model. As for optimization strategies, Pang [25] designed a real-time feedback control system based on CFD simulation to control the opening and closing of the pressure relief vent. Geng et al. of China Automotive Technology and Research Center Co., Ltd. [26] optimized the rear panel vent hole, and Unadkat et al. [27] optimized the pressure relief passage, effectively controlling the pressure rise.
In recent years, several new studies have emerged in this field. Yang et al. [28] of the Hunan Institute of Engineering proposed a porous medium model to characterize the dynamic airflow resistance of the pressure relief valve, with model parameters calibrated through experiments, and further combined this approach with an optimization scheme involving the removal of the sound insulation cover. Ren [29] of the China Automotive Engineering Research Institute employed overset mesh technology to perform transient CFD simulations of the passenger compartment ear pressure during door closure of an SUV. Su et al. [30] of CATARC (Tianjin) Automotive Engineering Research Institute Co., Ltd. used the design of experiments (DOE) method to quantify and rank the effects of the door-closing speed, vehicle airtightness, and pressure relief valve opening on ear pressure. Jagtap et al. [31] integrated empirical formulas with CFD simulations to systematically investigate and rank the influence of the door-closing speed, the effective area of the pressure relief valve, and the overall vehicle airtightness on ear pressure.
Although the aforementioned recent studies have advanced the modeling accuracy and engineering applicability of door-closure ear pressure from different perspectives, several limitations remain. First, in terms of leakage modeling, existing studies treat the controllable leakage (through the pressure relief valve) and the uncontrolled leakage (through body gaps, holes, and other structures) in a combined manner, failing to reflect the fundamental difference in flow hysteresis between the two leakage paths. Second, these studies rely solely on numerical simulation or empirical formulas and lack theoretical modeling and mechanism analysis of the door-closure process. Third, regarding pressure relief valve modeling, the porous medium model adopted in existing studies is a static simplification that cannot capture the dynamic opening and closing behavior of the valve flap in response to pressure changes during door closure. Fourth, in terms of optimization strategies, Yang et al. [28] adopted a passive approach of removing the sound insulation cover, which is effective but may introduce noise issues; other studies mainly focus on the passive adjustment of structural parameters and lack active control concepts.
To address these limitations, this study presents an integrated experimental–CFD–theoretical framework grounded in real-vehicle testing and high-fidelity point-cloud-based geometric modeling. A physically interpretable theoretical model is derived and calibrated against CFD predictions, achieving a good balance between accuracy and computational efficiency. Moreover, a refined leakage modeling strategy is proposed—featuring a distributed circular-hole representation of the uncontrolled leakage and a numerical implementation of the one-way flow behavior of the pressure relief valve—to overcome the limitations of conventional simulation approaches. Building on this enhanced modeling foundation, a comprehensive parametric investigation is conducted to quantify the effects of door geometry and cabin volume on ear pressure, followed by the exploration of two optimization measures: early opening of the pressure relief valve and the addition of an auxiliary fan.
The main contributions of this study are fourfold:
(1)
An integrated experimental-CFD-theoretical framework for door-closure ear pressure analysis, enabling robust cross-validation;
(2)
A refined leakage modeling scheme that separately captures the uncontrolled leakage and the one-way flow of the pressure relief valve, overcoming a long-standing oversimplification in conventional CFD;
(3)
A rapid-response theoretical model calibrated with flow hysteresis and fluctuation attenuation coefficients, achieving 93.94% accuracy in pressure amplitude relative to the CFD results while substantially reducing computation time;
(4)
A combined optimization strategy—early valve opening plus an auxiliary fan—that reduces the peak pressure, amplitude, and pressure change rate by 25.88%, 22.83%, and 41.23%, respectively, providing a practical pathway for NVH engineering applications.
Collectively, these efforts not only address the knowledge gaps but also provide actionable insights for next-generation cabin comfort design, positioning the proposed framework as a valuable tool for both academic research and industrial practice.
The remainder of this paper is organized as follows: Section 2 introduces the test methods and the basic theory of CFD simulation. Section 3 describes in detail the establishment, validation, and refinement of the CFD simulation model and the theoretical model, as well as the analysis of the influencing factors and the investigation of optimization schemes. Section 4 summarizes the main conclusions and highlights the main contributions. Section 5 provides an outlook on future research directions.

2. Materials and Methods

2.1. Experimental Design

Three tests related to door-closure ear pressure were conducted on a production passenger vehicle: a pressure relief valve flow test, a whole-vehicle airtightness test, and a door-closure passenger compartment pressure test [5].
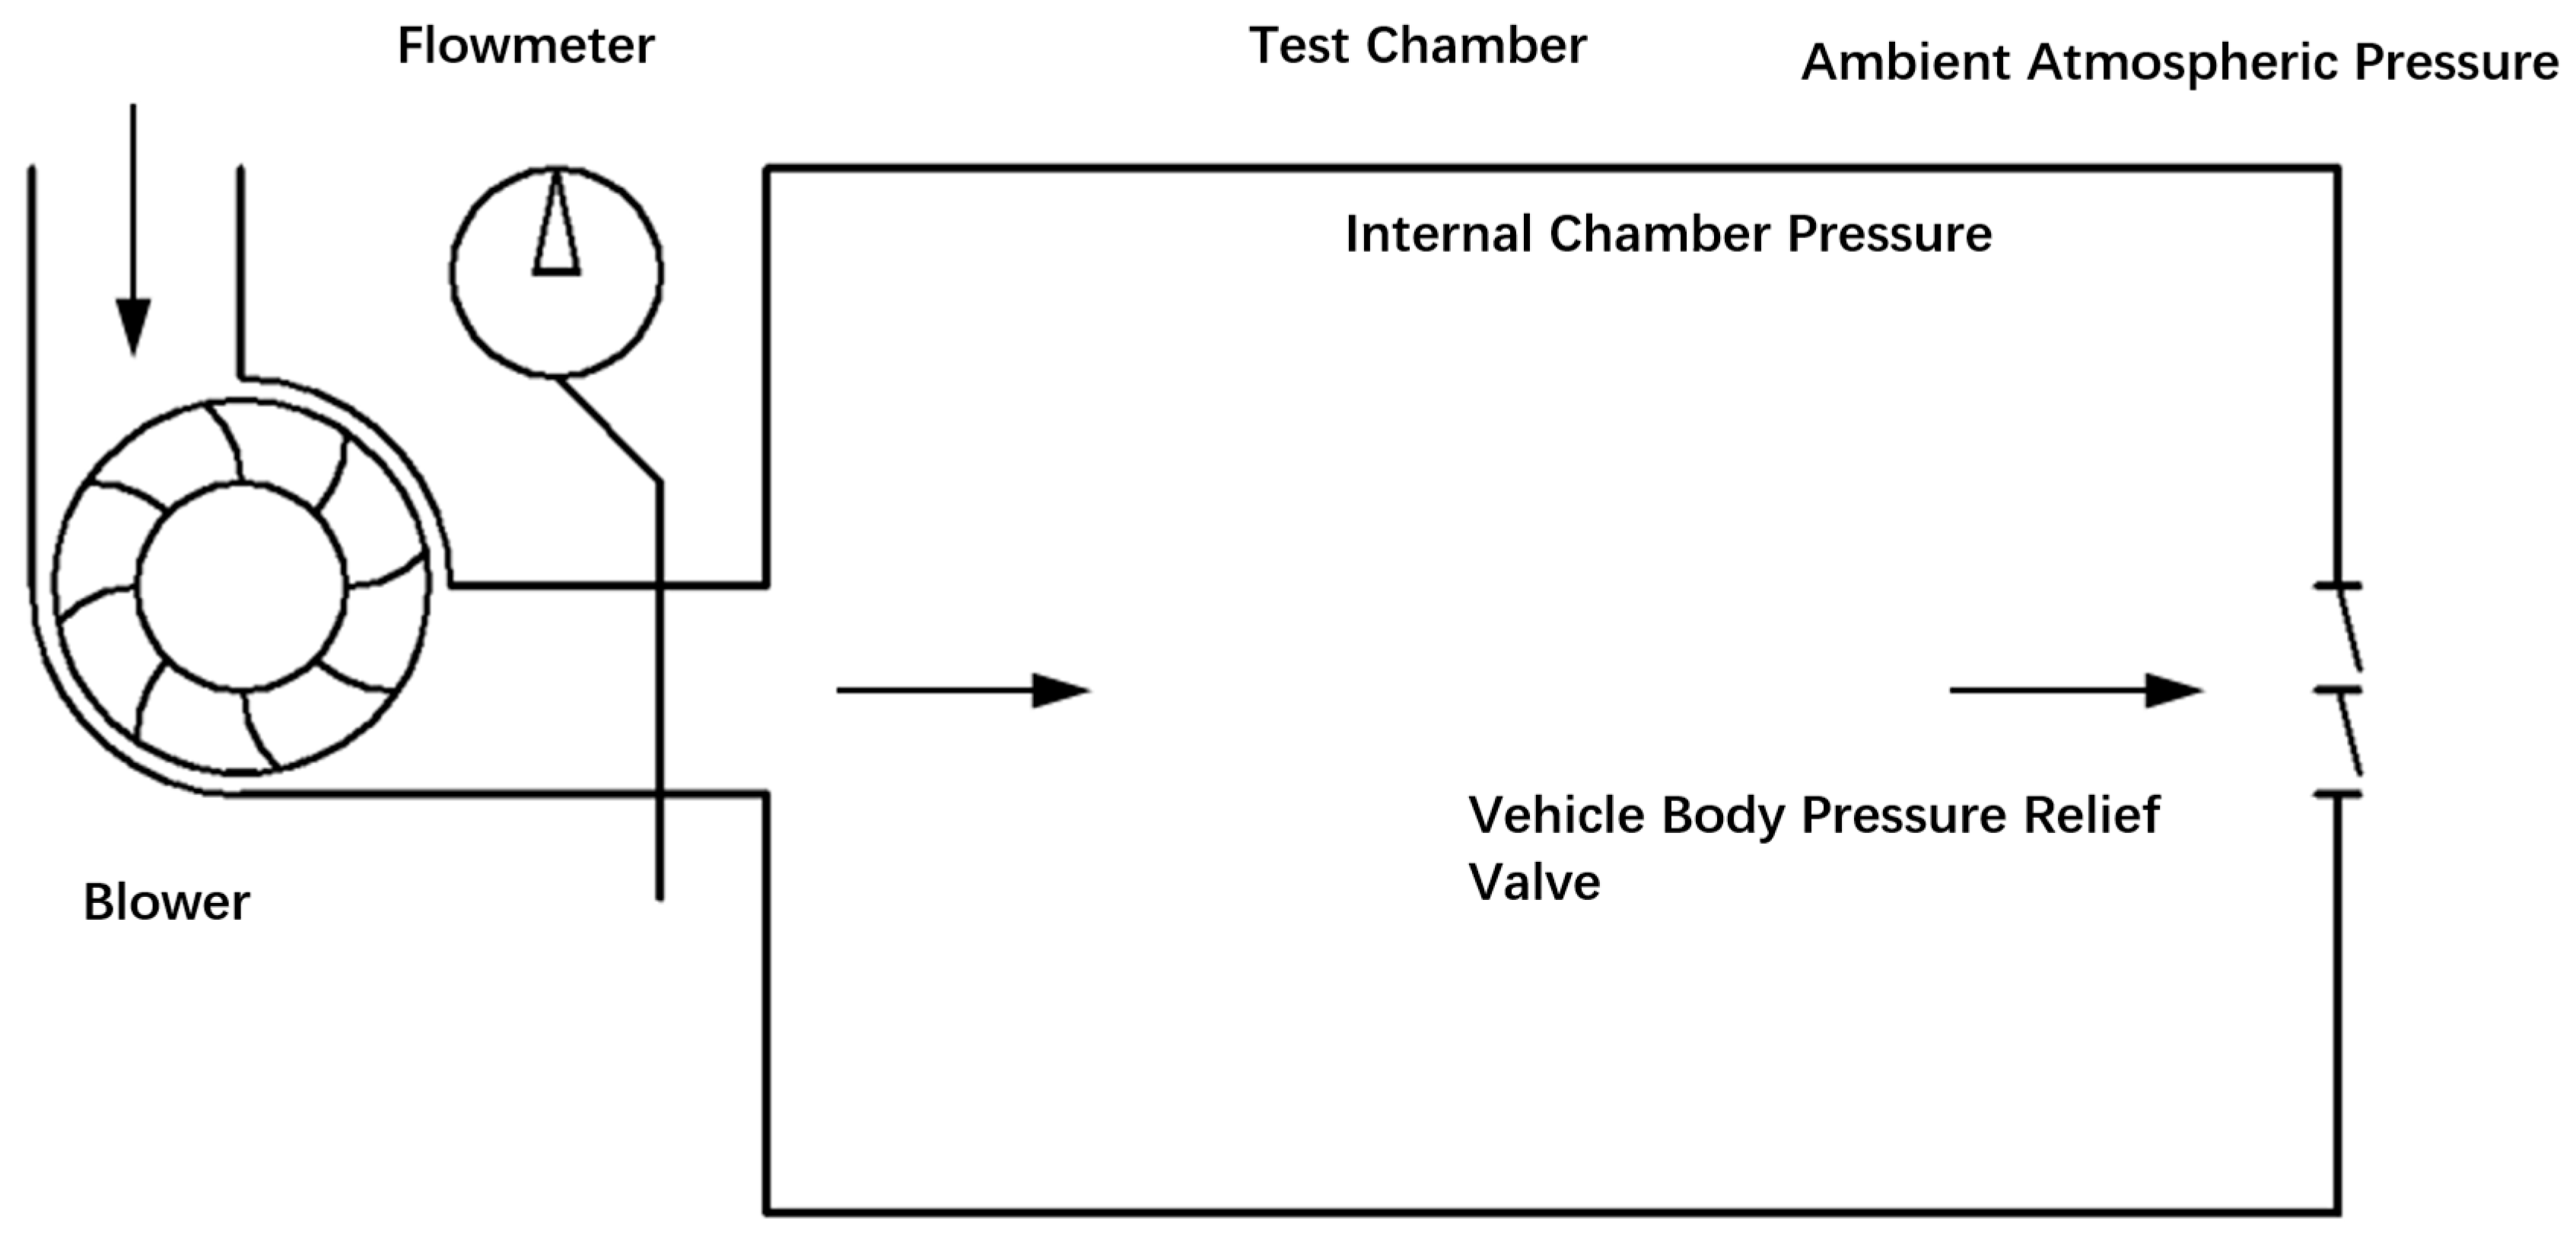
The body pressure relief valve is a key component of the vehicle ventilation system, and its flow characteristics are a critical indicator that significantly affects the door-closure process. A schematic diagram of the pressure relief valve flow test is shown in Figure 1. The test equipment includes a blower, a flow meter, a pressure sensor, and a flow test chamber. The pressure relief valve is mounted on the flow test chamber, the other side of which is connected to the blower. The chamber is sealed so that all the airflow passes through the valve. The flow meter is installed downstream of the blower, and the pressure sensor measures the pressure inside the chamber. During the test, the blower speed is adjusted to vary the pressure difference between the inside and outside of the chamber, and the corresponding flow rate through the pressure relief valve is measured. The flow characteristics of the body pressure relief valve primarily represent the controllable leakage of vehicles equipped with this type of valve.
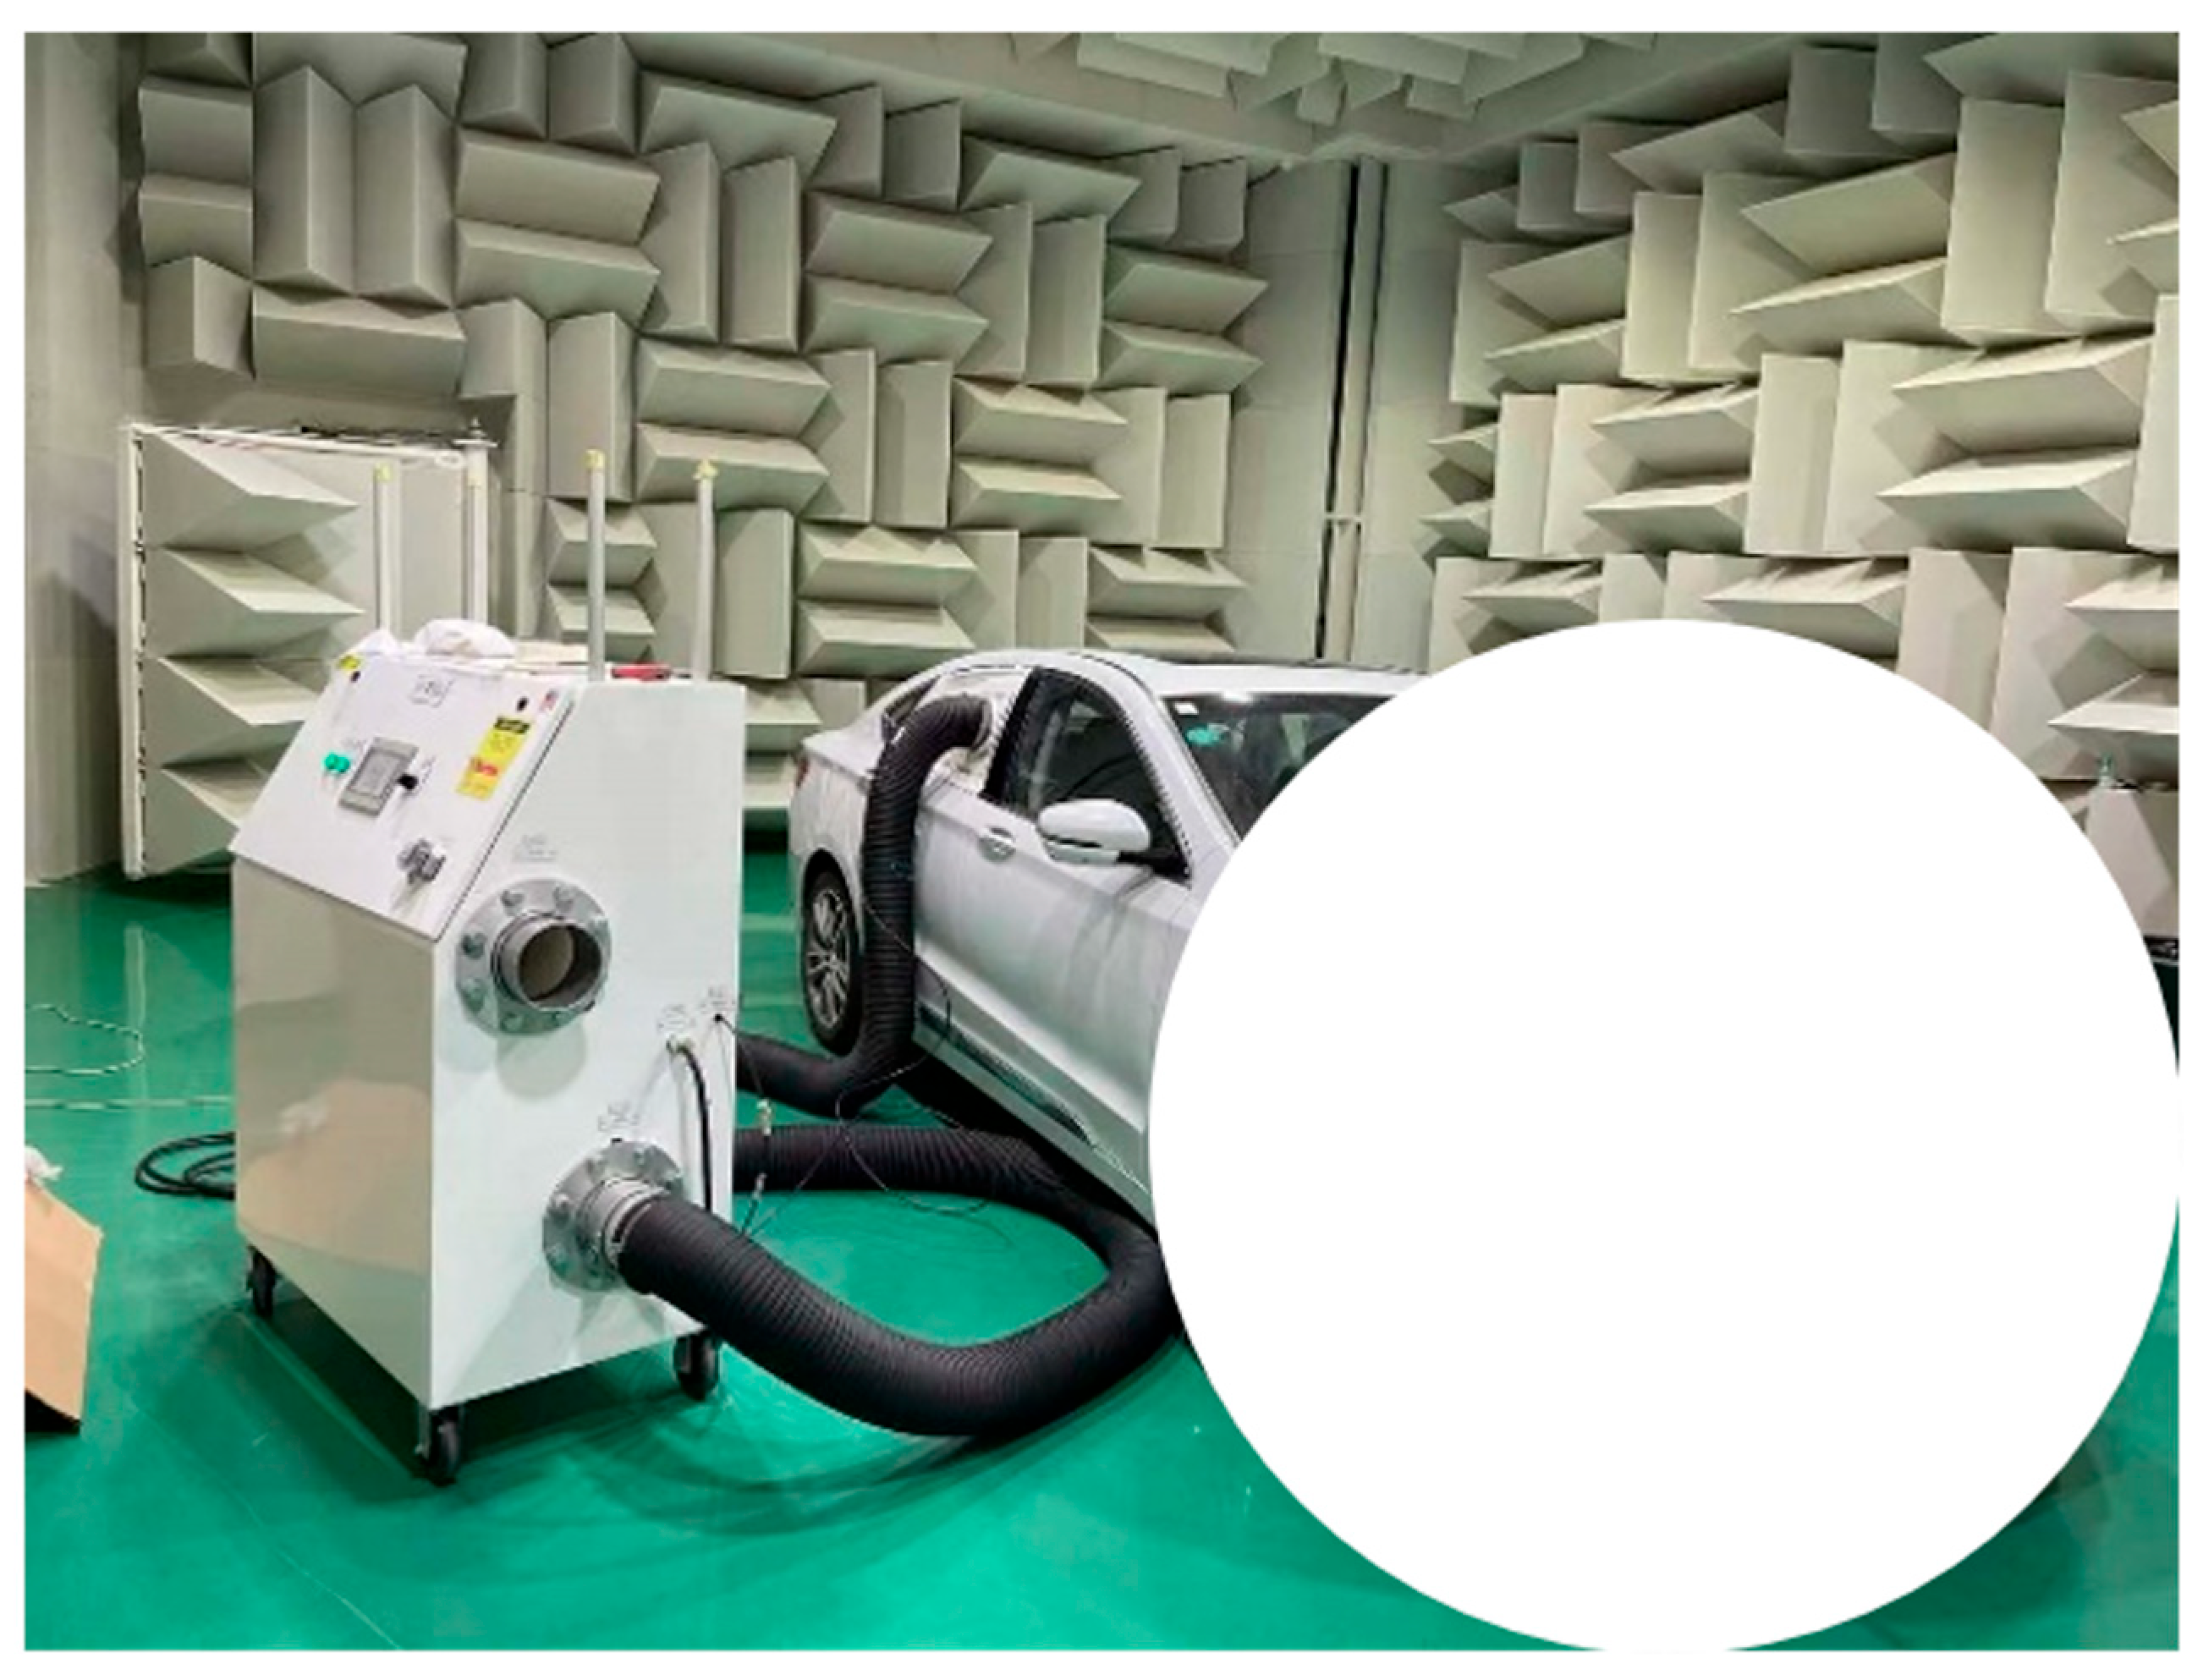
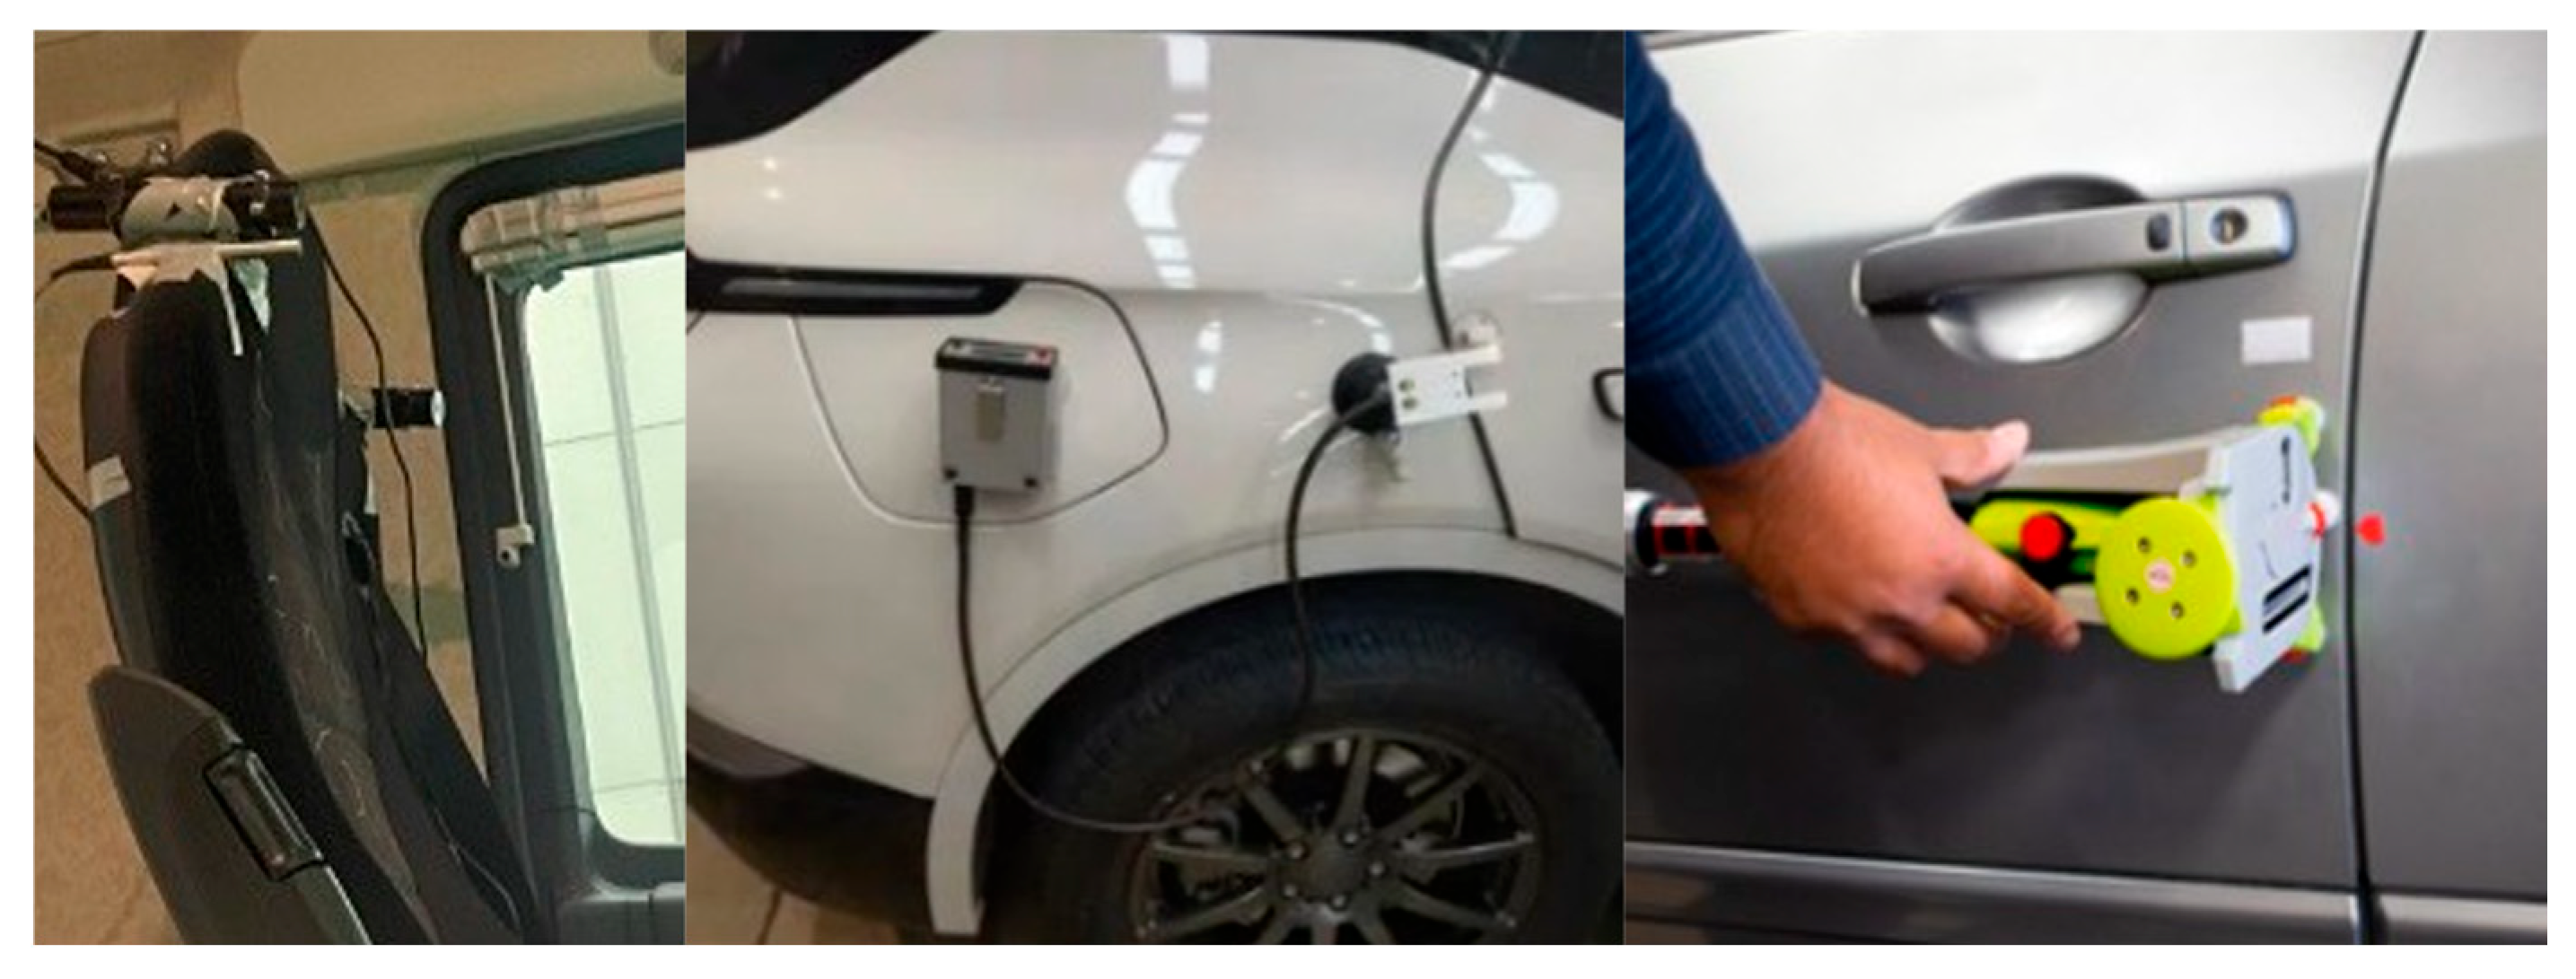
Whole-vehicle airtightness is a key performance indicator in NVH, wind noise, door closure, and other areas, and can be effectively characterized by the air leakage rate. The test equipment includes an airtightness testing device integrating a blower, a pressure-balance rod, and a flow meter, as well as a smoke generator, a plastic sheet, and adhesive tape. During the test, the duct of the airtightness testing device is placed at the window and sealed with adhesive tape. The test method is divided into the positive-pressure method and the negative-pressure method. In the positive-pressure method, the blower blows air inward so that the interior pressure of the passenger compartment is higher than the external atmospheric pressure, and the whole-vehicle leakage rate is then recorded at different pressure levels. If the body pressure relief valve is sealed, the measured leakage rate represents the uncontrolled leakage; otherwise, it represents the whole-vehicle leakage, i.e., the sum of the controllable and uncontrolled leakage. In the negative-pressure method, the opposite applies: the blower blows air outward, and all other aspects are the same as in the positive-pressure method. Figure 2 shows the whole-vehicle airtightness test of the vehicle studied in this paper.
The equipment for the door-closure passenger compartment pressure test includes pressure sensors, a door-closing device, and a door velocity meter. The door-closing device is used to close the door at a specified speed, and the pressure variation at the occupant’s ear position is measured by the pressure sensors. To achieve the target door-closing speed accurately, the following types of door-closing devices can be used (Figure 3). The first is the elastic cord method: an elastic cord is fixed inside the door, the door is opened to a certain angle, and different closing speeds are achieved by adjusting the door-closing position. Once the door opening angle corresponding to the target closing speed is determined, the required closing speed condition can be achieved. In addition, other door-closing devices are available, such as the EZSlam (version v3.0.1.41) [32]. The EZSlam, a comprehensive measurement and testing system for door opening and closing feel developed by EZ Metrology, is specifically designed to measure all static and dynamic characteristics of swing doors. The EZSlam is installed on the test door, with the test unit placed inside the vehicle, and the door is closed with different forces. After the number of door-closing cycles required by the EZSlam is reached, all door-closing data, including different closing speed conditions, can be obtained through a unique CIM algorithm. The door velocity meter is used to record the door speed during the closing process. It is generally positioned at the height of the door lock and hinge, with the detection point located at the outer edge of the door. Some high-end door-closing devices are equipped with an integrated measurement module for recording the door speed. When the target door-closing speed is achieved by the elastic cord method, an independent door velocity meter should be used. Furthermore, some door velocity meters can only record the door speed near the moment of door closure, while others can record the speed over the entire door-closure process.

2.2. High-Precision CFD Modeling

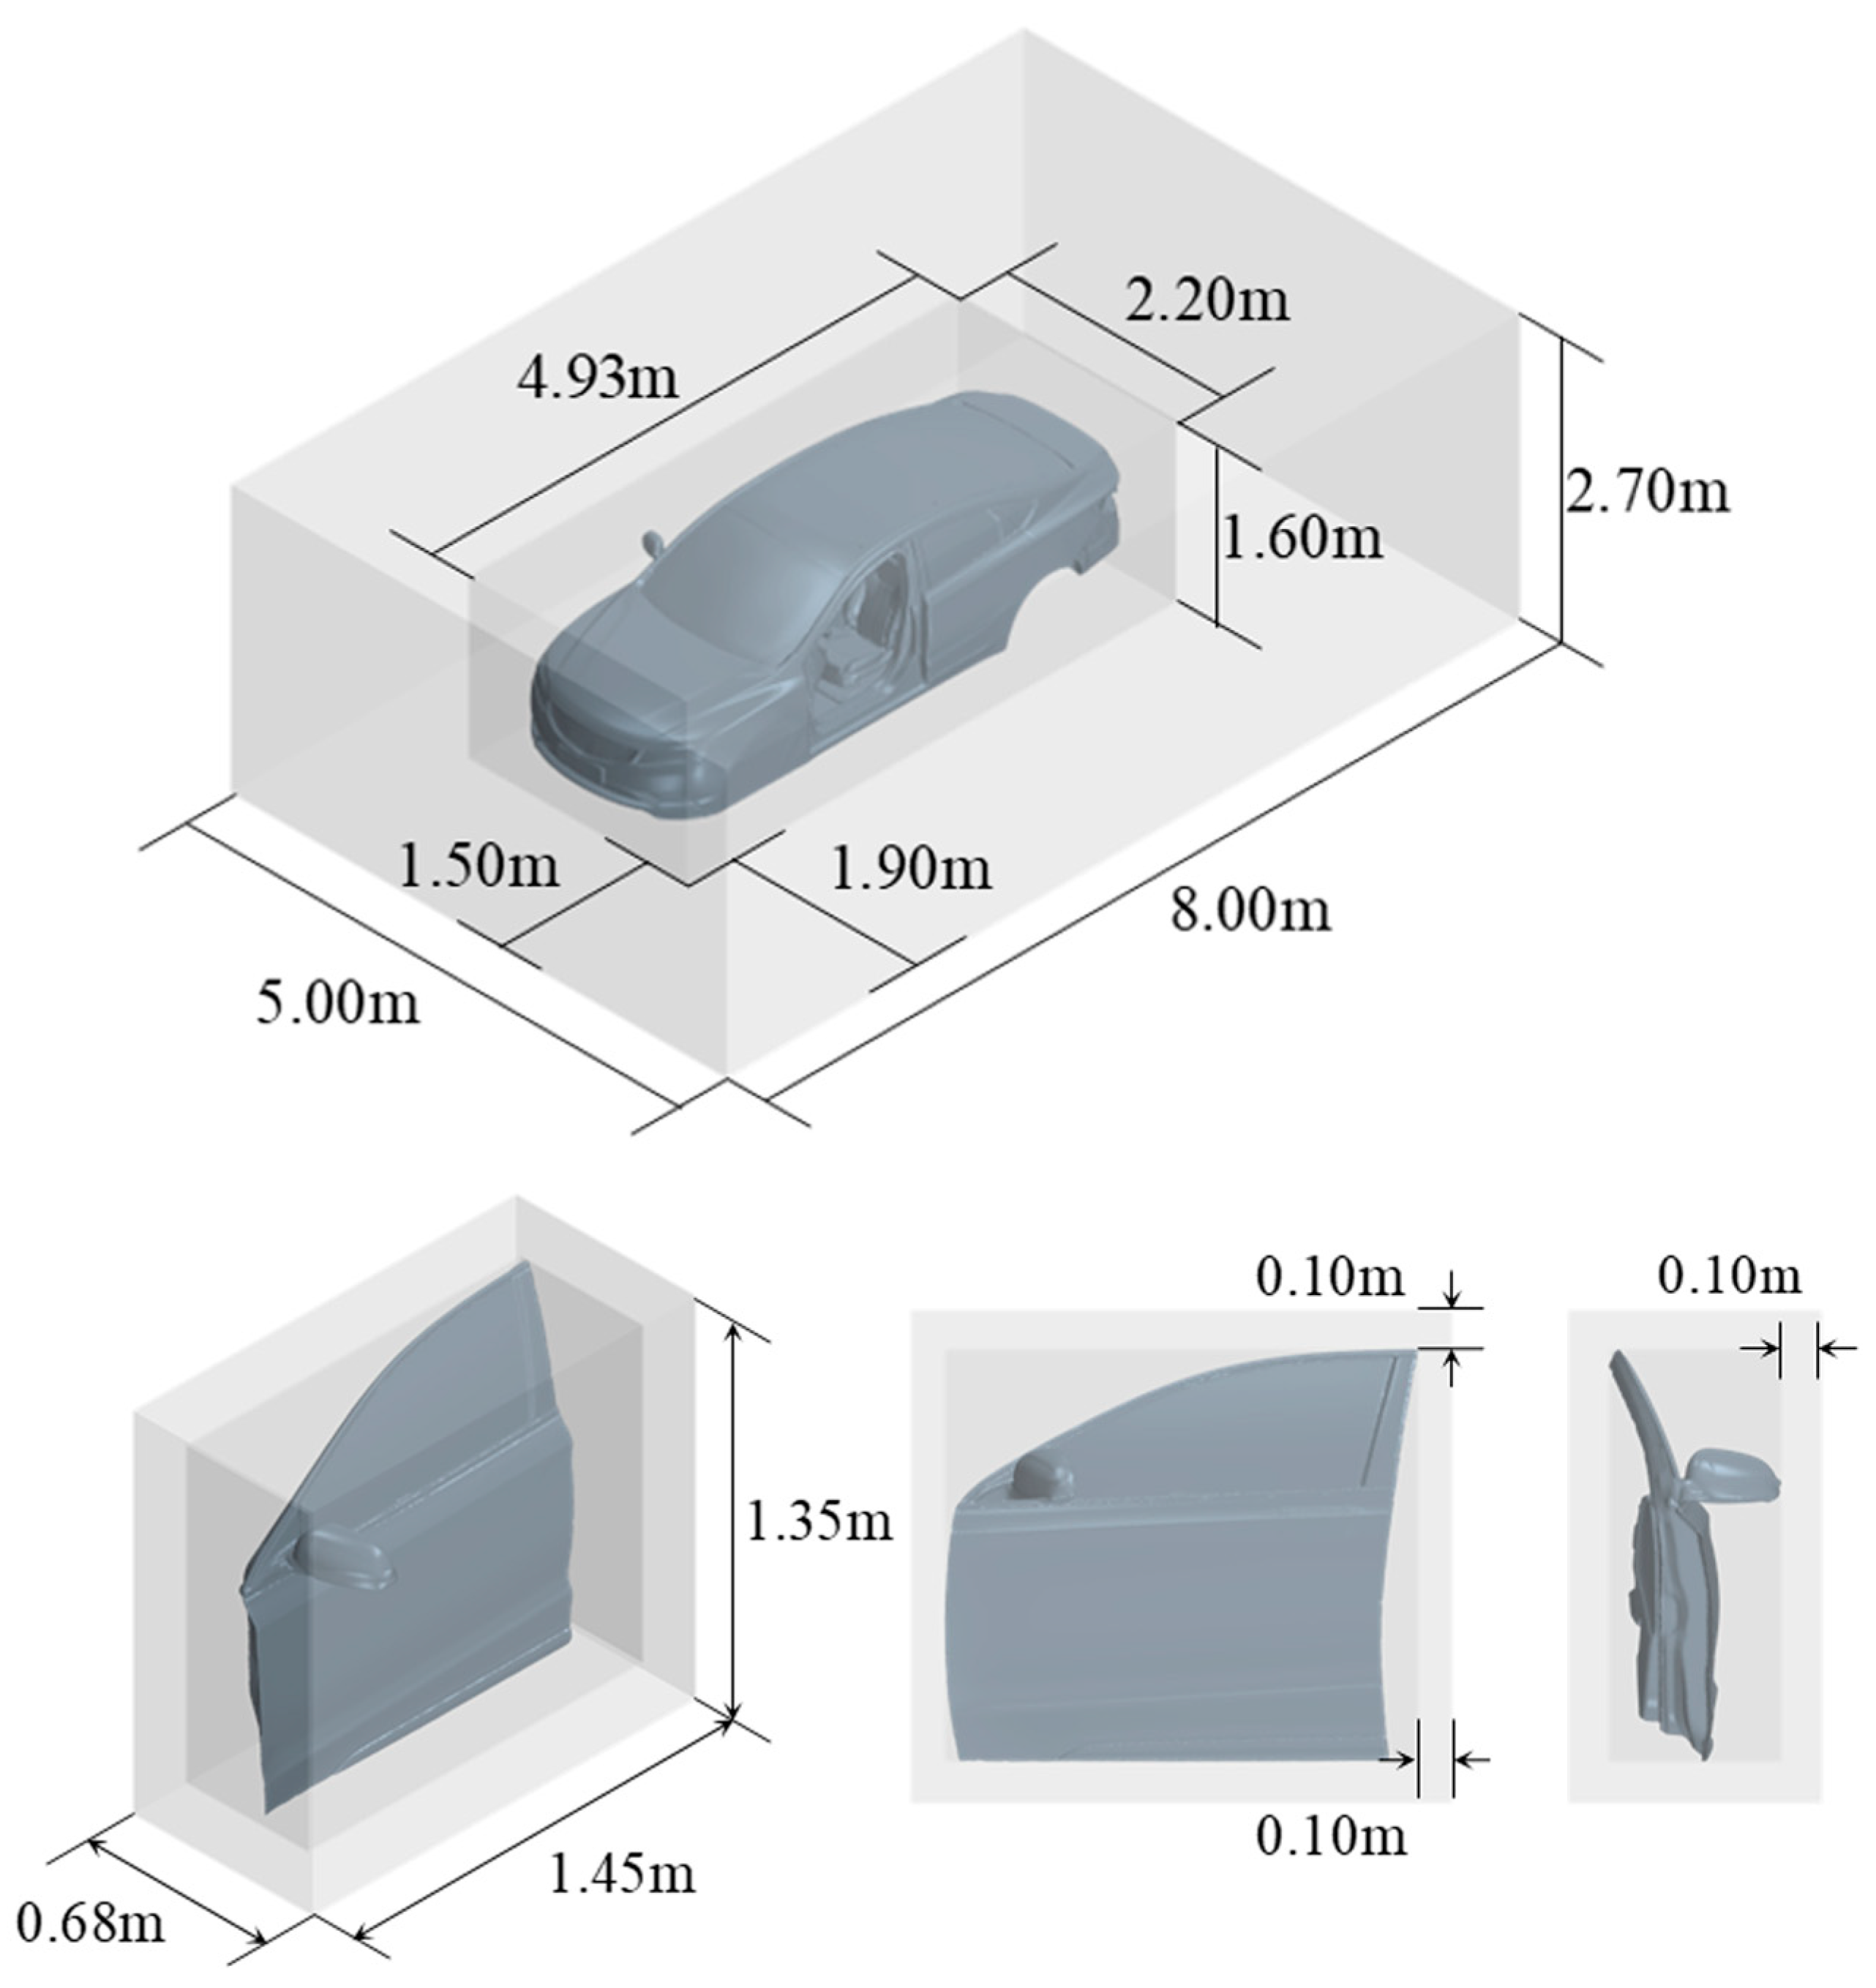
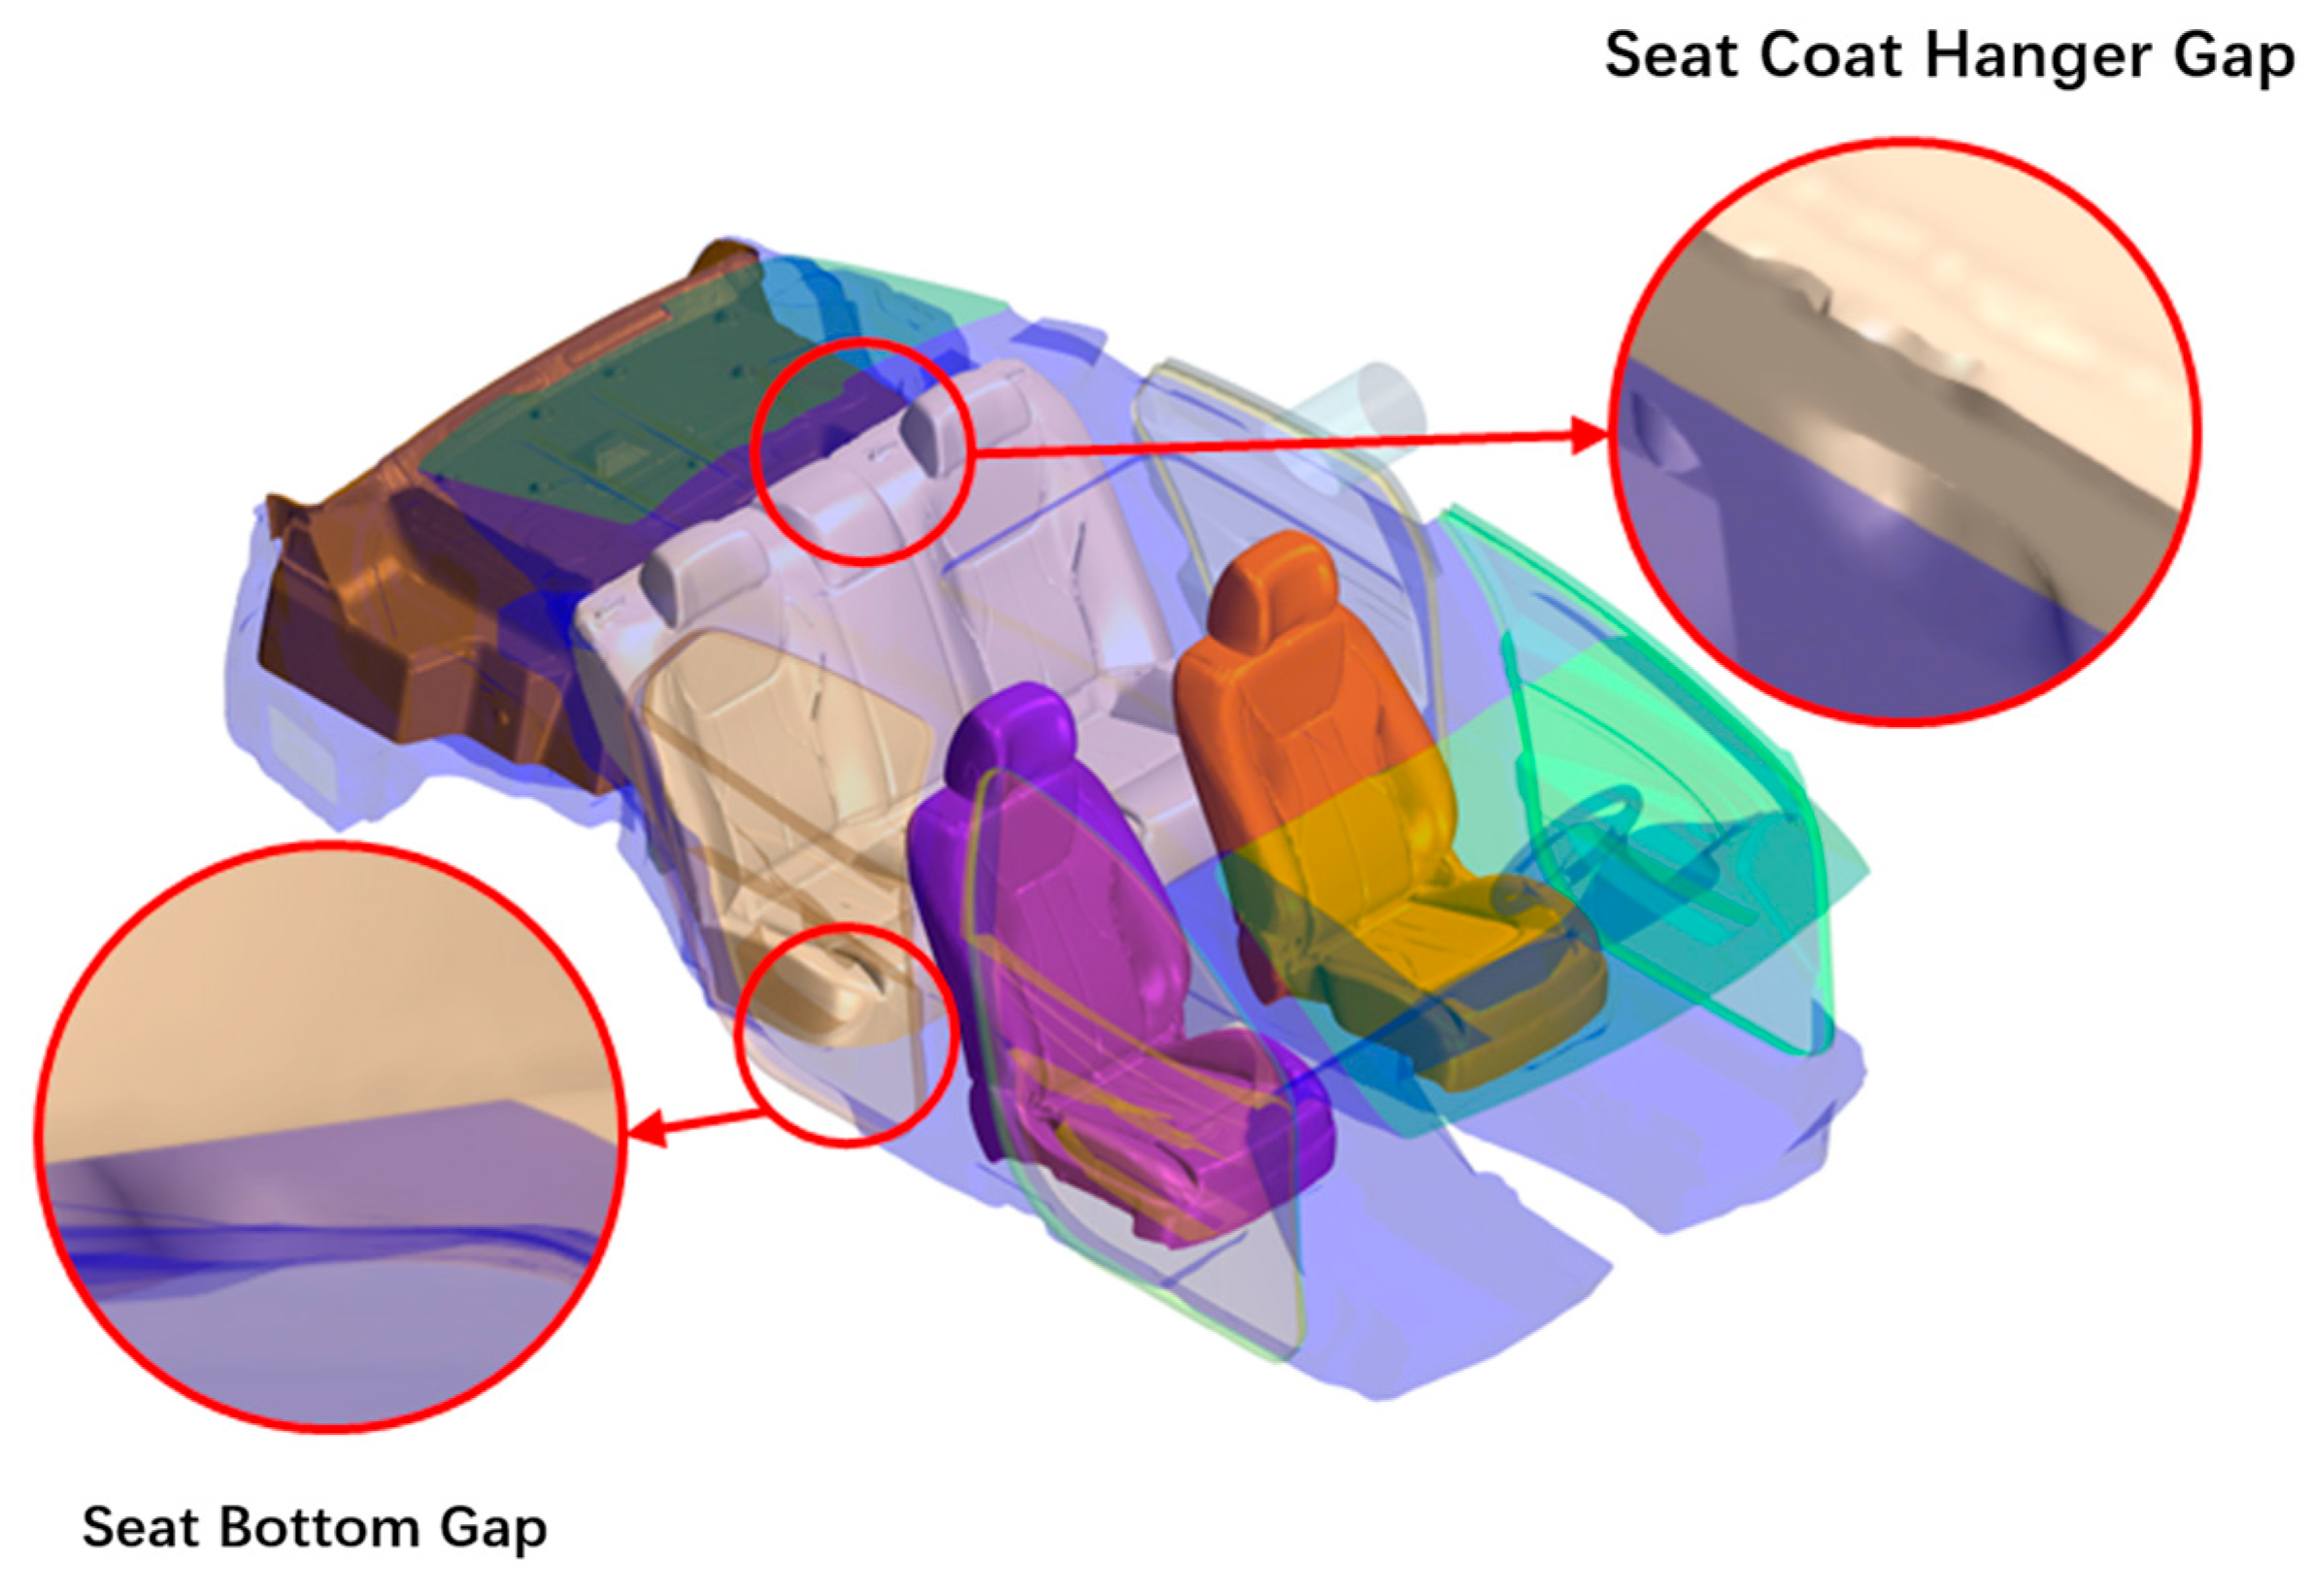
CFD simulations were performed using Simcenter STAR-CCM+ (version 15.02.007-R8). Polyhedral volume meshes were used throughout this study because of their stable and reliable results and relatively high accuracy, despite their higher memory consumption and slower computation compared with other mesh types. A high-precision geometric model was established based on point cloud data, fully retaining the airflow path consisting of the passenger compartment, rear body cavity, and trunk, as shown in Figure 4. The gap under the seats was 0.0123 m2, and the gap between the seats and the parcel shelf was 0.0130 m2, resulting in a total flow area of approximately 0.0253 m2.
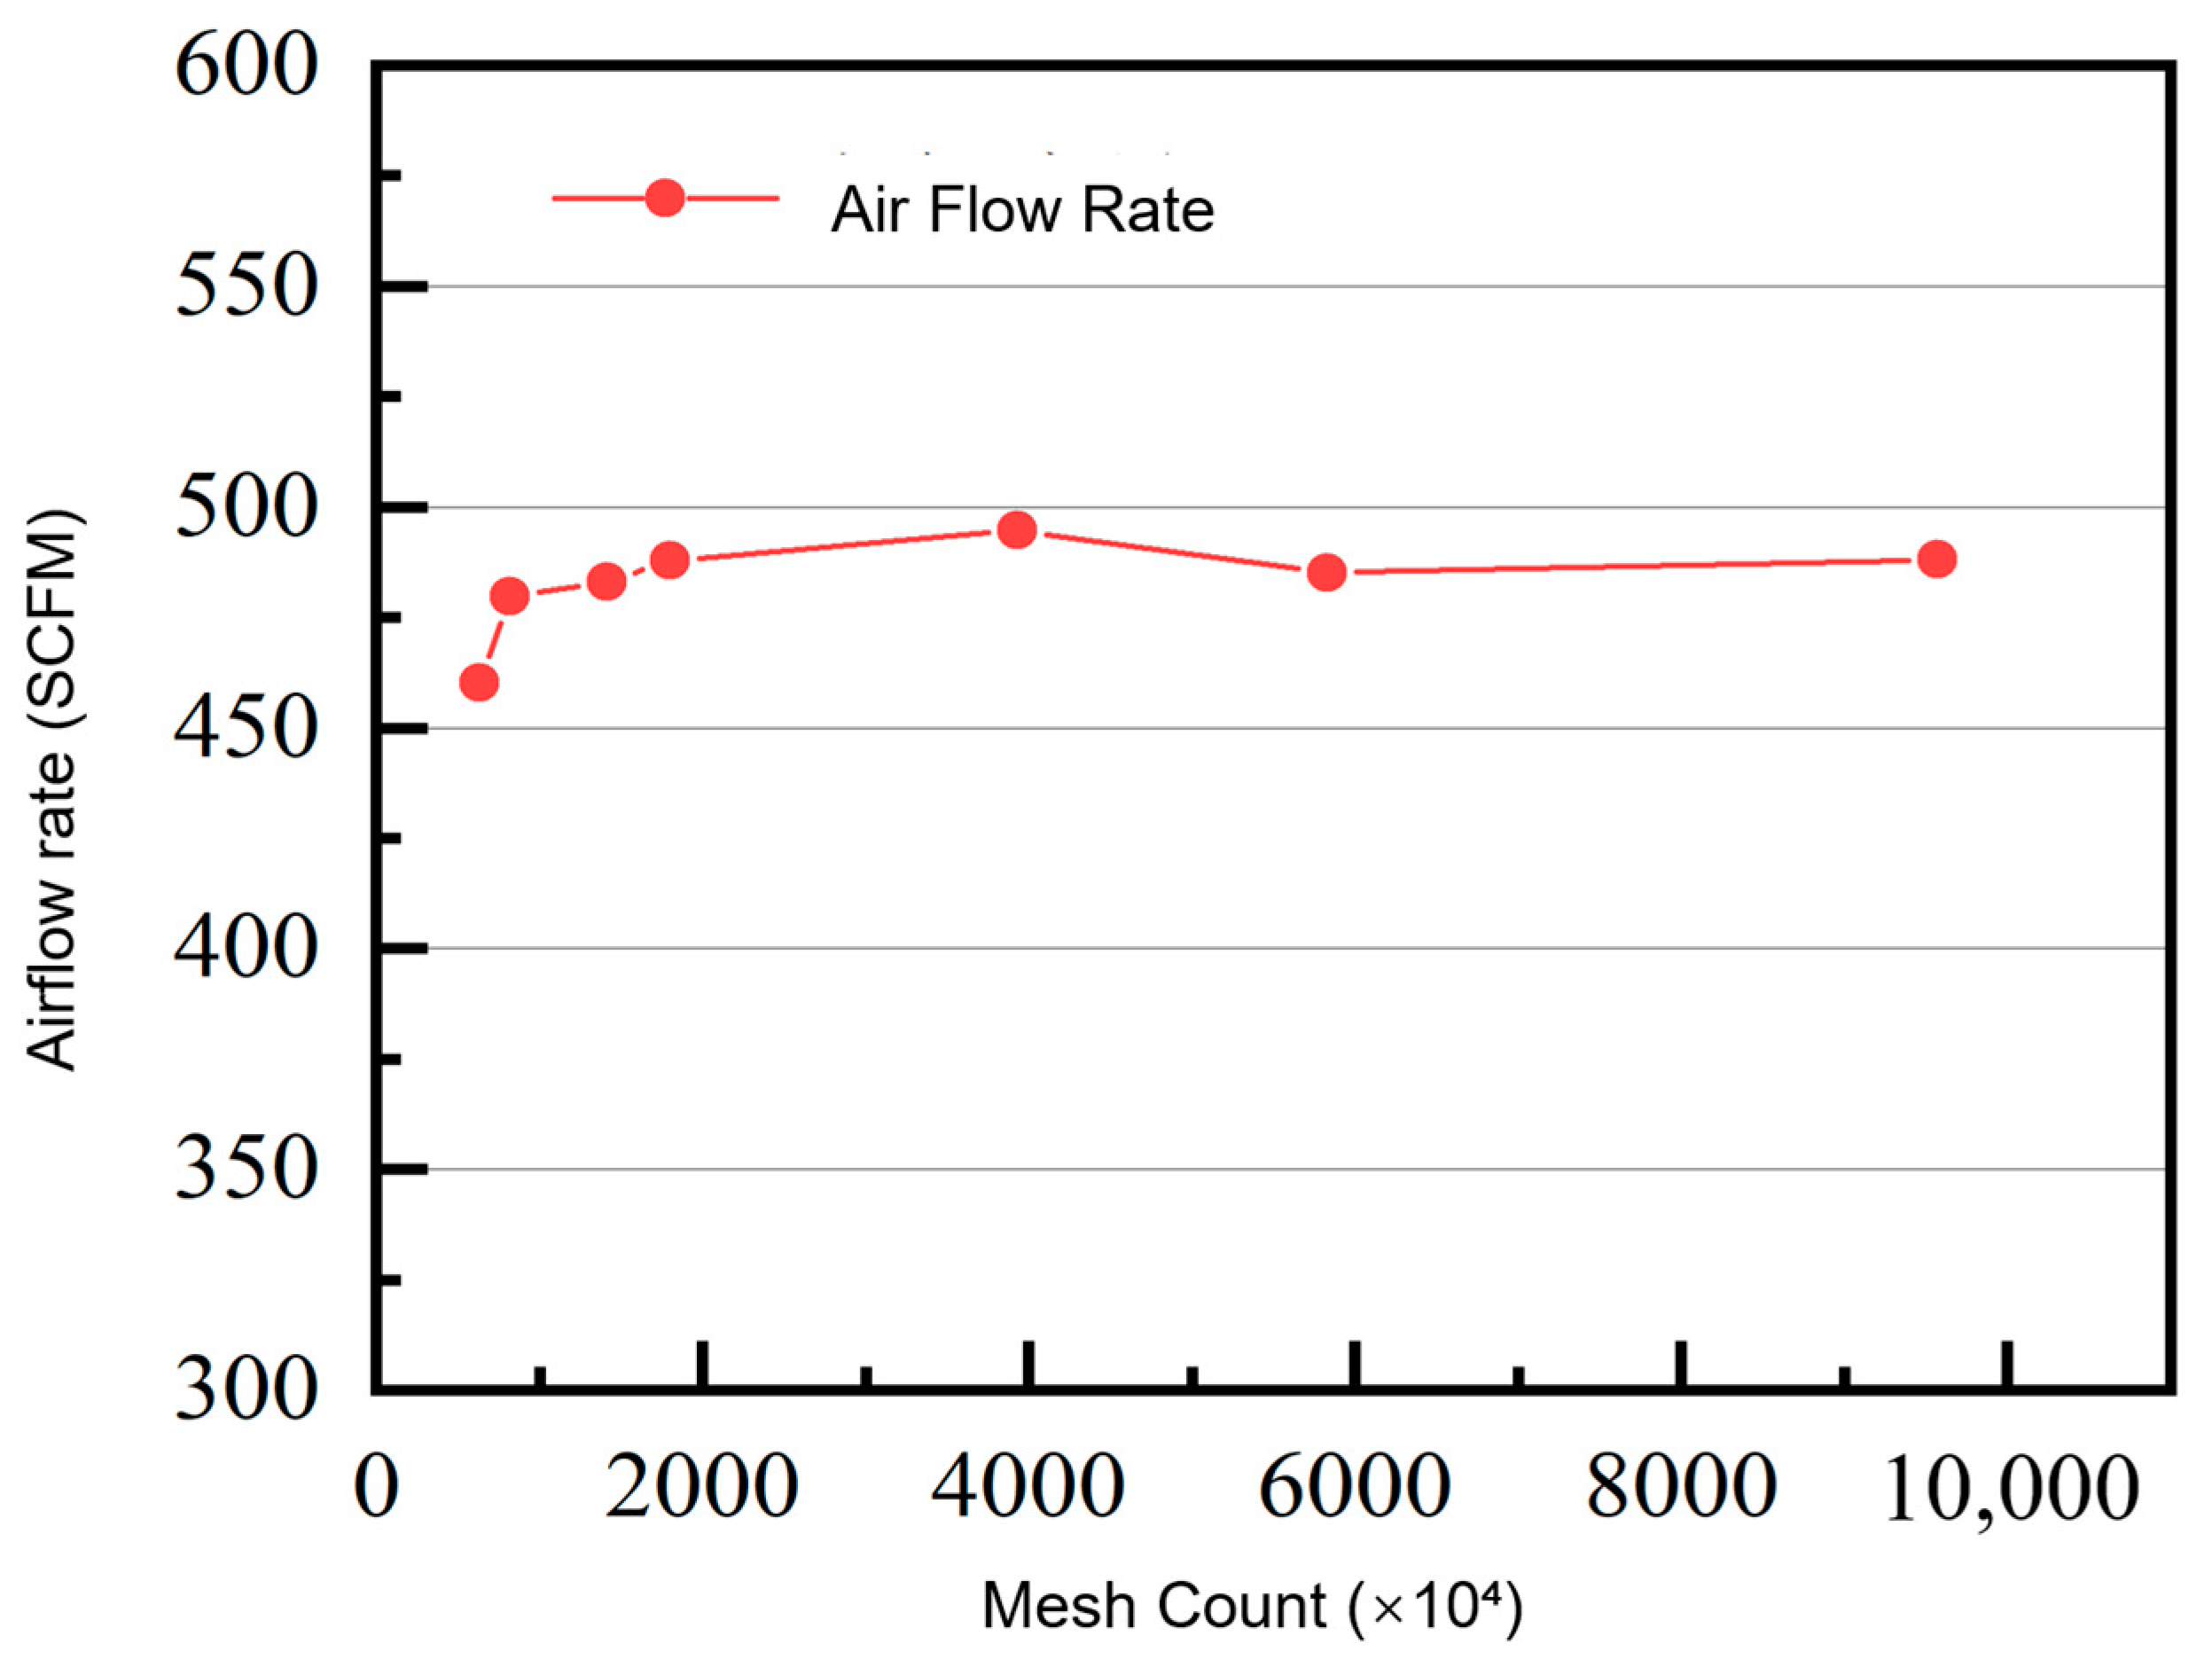
Prior to the simulation, a mesh independence study was conducted to eliminate the influence of the mesh strategy on the results. Since the whole-vehicle airtightness simulation aims to predict the leakage flow rate, the mass flow rate at the pressure outlet outside the pressure relief valve region, which governs the leakage prediction, was adopted as the criterion of mesh independence. Volume meshes were generated with different cell sizes between 1 mm and 16 mm under a stagnation inlet condition of 125 Pa, and the mass flow rate at this outlet was monitored after the solution reached a stable state. The corresponding mesh counts were approximately 6.31, 8.15, 14.12, 18.01, 39.24, 58.26, and 95.70 million. As shown in Figure 5, the monitored mass flow rate tended to stabilize once the mesh count reached 14.12 million, and further refinement produced no significant changes. To ensure mesh independence with an adequate safety margin while maintaining acceptable computational cost, a cell size of 4 mm (18.01 million cells), one level finer than the stabilization threshold, was therefore selected for the whole-vehicle airtightness simulation model.
Polyhedral volume meshes were used. For the door-closure simulation model, the base cell size was 8 mm, with first- and second-level refinement regions of 64 mm and 16 mm, an 8 mm refinement zone at the pressure relief valve, and two prism layers with a total thickness of 2 mm, resulting in approximately 10.61 million cells.
The door-closure process was simulated using the overset mesh technique, with the zero-gap feature of the overset mesh achieving closure between the door and the seal [24]. As shown in Figure 6, the computational domain was divided into a background region and an overset region: the background region represents the air domain surrounding the vehicle, while the overset region contains the vehicle door and its surrounding air [25]. Local mesh refinement was applied to the door movement path and the pressure relief valve region. The realizable k-ε turbulence model was adopted, and the working medium was set as an isothermal ideal gas. Based on the CFL criterion, the time step was set to 0.001 s, corresponding to a Courant number below 0.45. The experimentally measured door velocity, after smoothing, was imposed as a boundary condition, and the pressure monitoring point was located near the driver’s left ear. The pressure relief valve region was simplified using a porous-medium model. Based on the geometric dimensions of the valve, the porosity was calculated as 0.29 and the tortuosity as 1. The Forchheimer equation, dp/dx = bv2 + av, was used to describe the pressure drop characteristics, where a is the viscous resistance coefficient and b is the inertial resistance coefficient. Based on simulation and experimental data, the inertial resistance coefficient b was fitted as 295.86 kg/m4, and the viscous resistance coefficient a as 261.47 kg/(m3·s). At an inlet pressure of 125 Pa, the simulated airflow was 308.35 SCFM versus the experimental value of 320.75 SCFM, giving an error of 6.82%, which met the accuracy requirement.

2.3. Theoretical Model for Door-Closure Ear Pressure

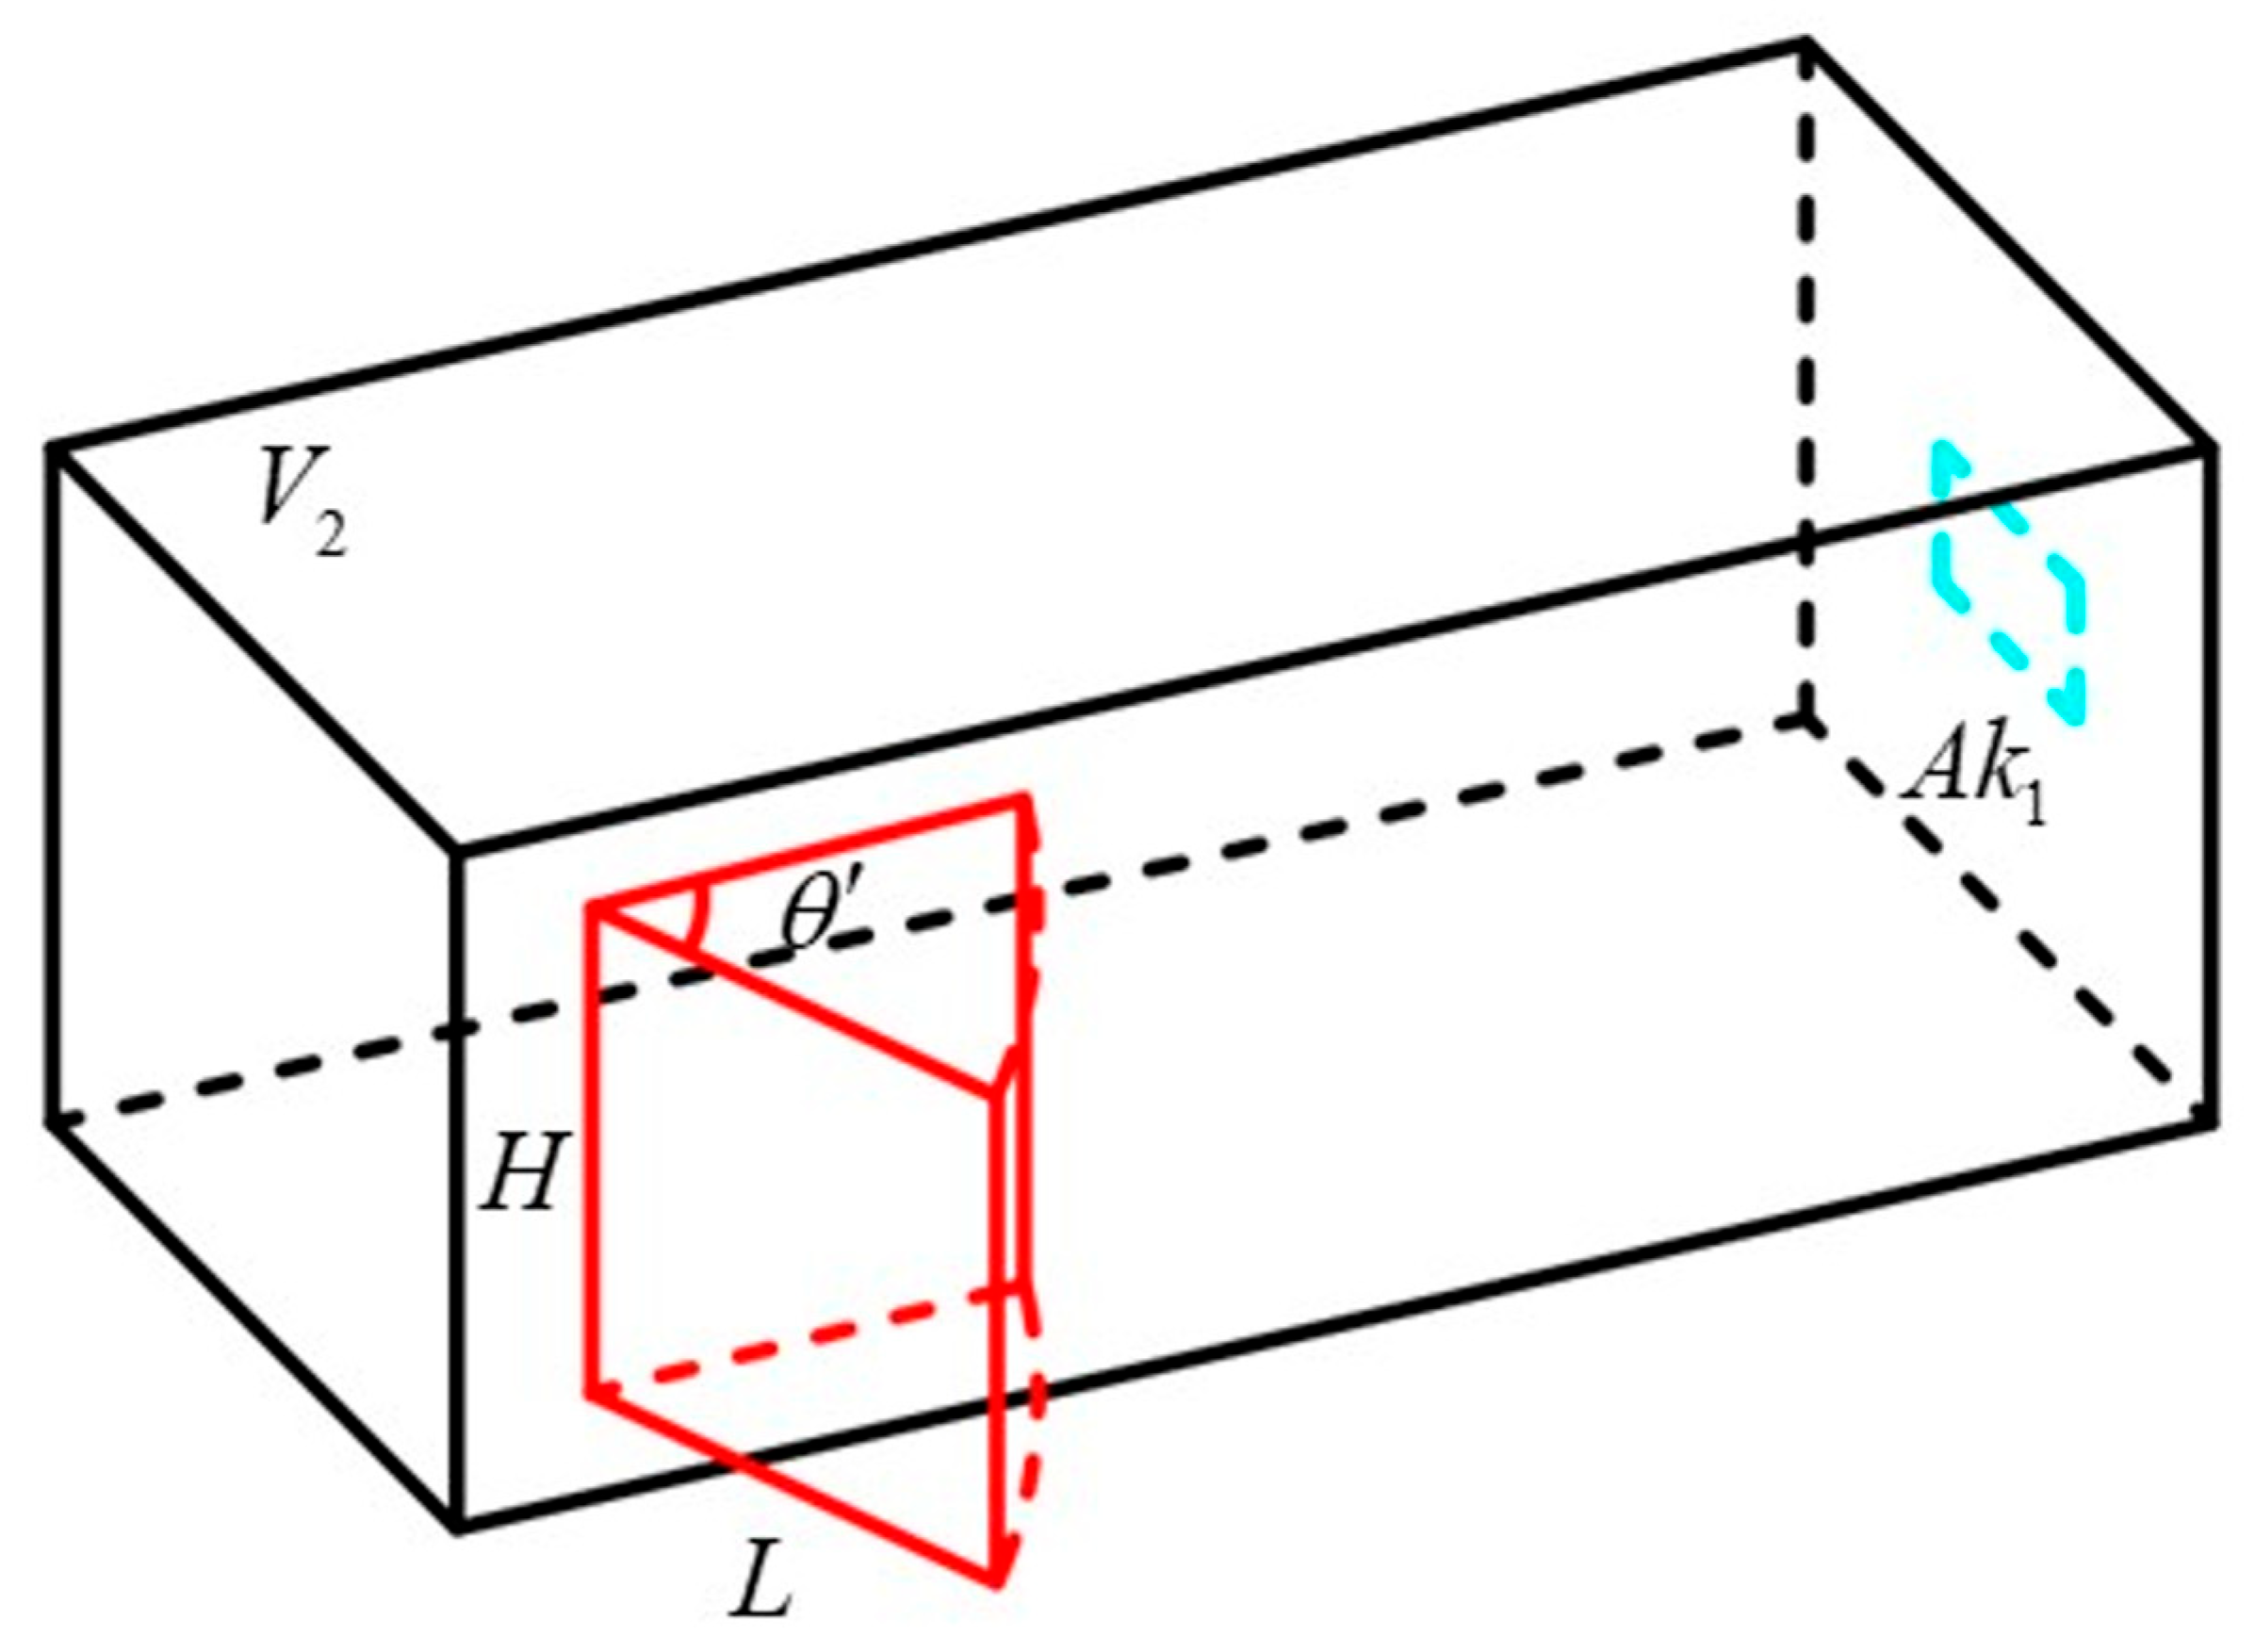
To elucidate the transient pressure variation in the passenger compartment during door closure and to enable rapid prediction, a theoretical model was developed. The door is simplified as a rectangular plate, the passenger compartment interior as a rectangular enclosed cavity, and the body leakage as equivalent rectangular openings [20]. The computational domain is divided into two regions: Region 1, the door sweep region, and Region 2, the passenger compartment interior [20], as shown in Figure 7. The volume of Region 1 depends on the door opening angle θ:
V 1 = 1 2 L 2 H θ
where L and H are the door length and height, respectively. The areas of the air exchange interfaces are defined as follows: the door frame ( A k 2 = H L ), the interface between Region 1 and the atmosphere ( A k 1 = θ L ( H + L ) ), and the interface between Region 2 and the atmosphere ( A k 3 ), whose area is determined from airtightness test data at 125 Pa. Applying the Bernoulli equation, the velocities at these interfaces are given by [30]:
v 1 = 2 p 1 p 0 ρ 1 ,   v 2 = 2 p 1 p 2 ρ 2 ,   v 3 = 2 p 2 p 0 ρ 0
where p 0 , p 1 , and p 2 are the atmospheric, Region 1, and Region 2 pressures, respectively, and ρ 0 , ρ 1 , and ρ 2 are the corresponding air densities. Applying mass conservation [30], the governing equations for Regions 1 and 2 are as follows:
V 1 ρ 1 A k 1 v 1 ρ 0 Δ t A k 2 v 2 ρ 2 Δ t = V 1 ρ 1
V 2 ρ 2 + A k 2 v 2 ρ 2 Δ t A k 3 v 3 ρ 0 Δ t = V 2 ρ 2
where the primed variables denote the previous time step. The system is solved numerically using MATLAB (version R2023a) with a time step of 0.01 s. Initial results deviated from the CFD simulation, showing a peak error of 18.44%, which indicated the need for refinement. To account for the hysteresis of actual flow and the gradual attenuation of pressure fluctuations, two modifications were introduced: flow hysteresis in the outlet mass calculation, and a fluctuation attenuation coefficient defined as follows:
k 1 = P t 2 P t 1
where P t 1 is the first negative pressure peak of the model with flow hysteresis and P t 2 is the target first negative peak. After refinement, the theoretical model accurately captures both the pressure rise and the subsequent decay, reducing the peak error to 3.11% and achieving a pressure amplitude accuracy of 93.94% relative to the CFD results. The solution time is less than one minute, in contrast to approximately 1800 core-hours for the CFD model, making the theoretical model suitable for rapid parametric analysis [20].

2.4. Refinement of Simulation Methods

Initial CFD results showed a maximum pressure peak error of 6.33% and a pressure amplitude error of 17.62%. This was attributed to two main factors: the combined treatment of the controllable and uncontrollable leakage in the simulation, which fails to reflect their differences in flow hysteresis, and the simplified porous-media representation of the pressure relief valve, which lacks one-way flow characteristics. To address these issues, the simulation methods were refined accordingly.
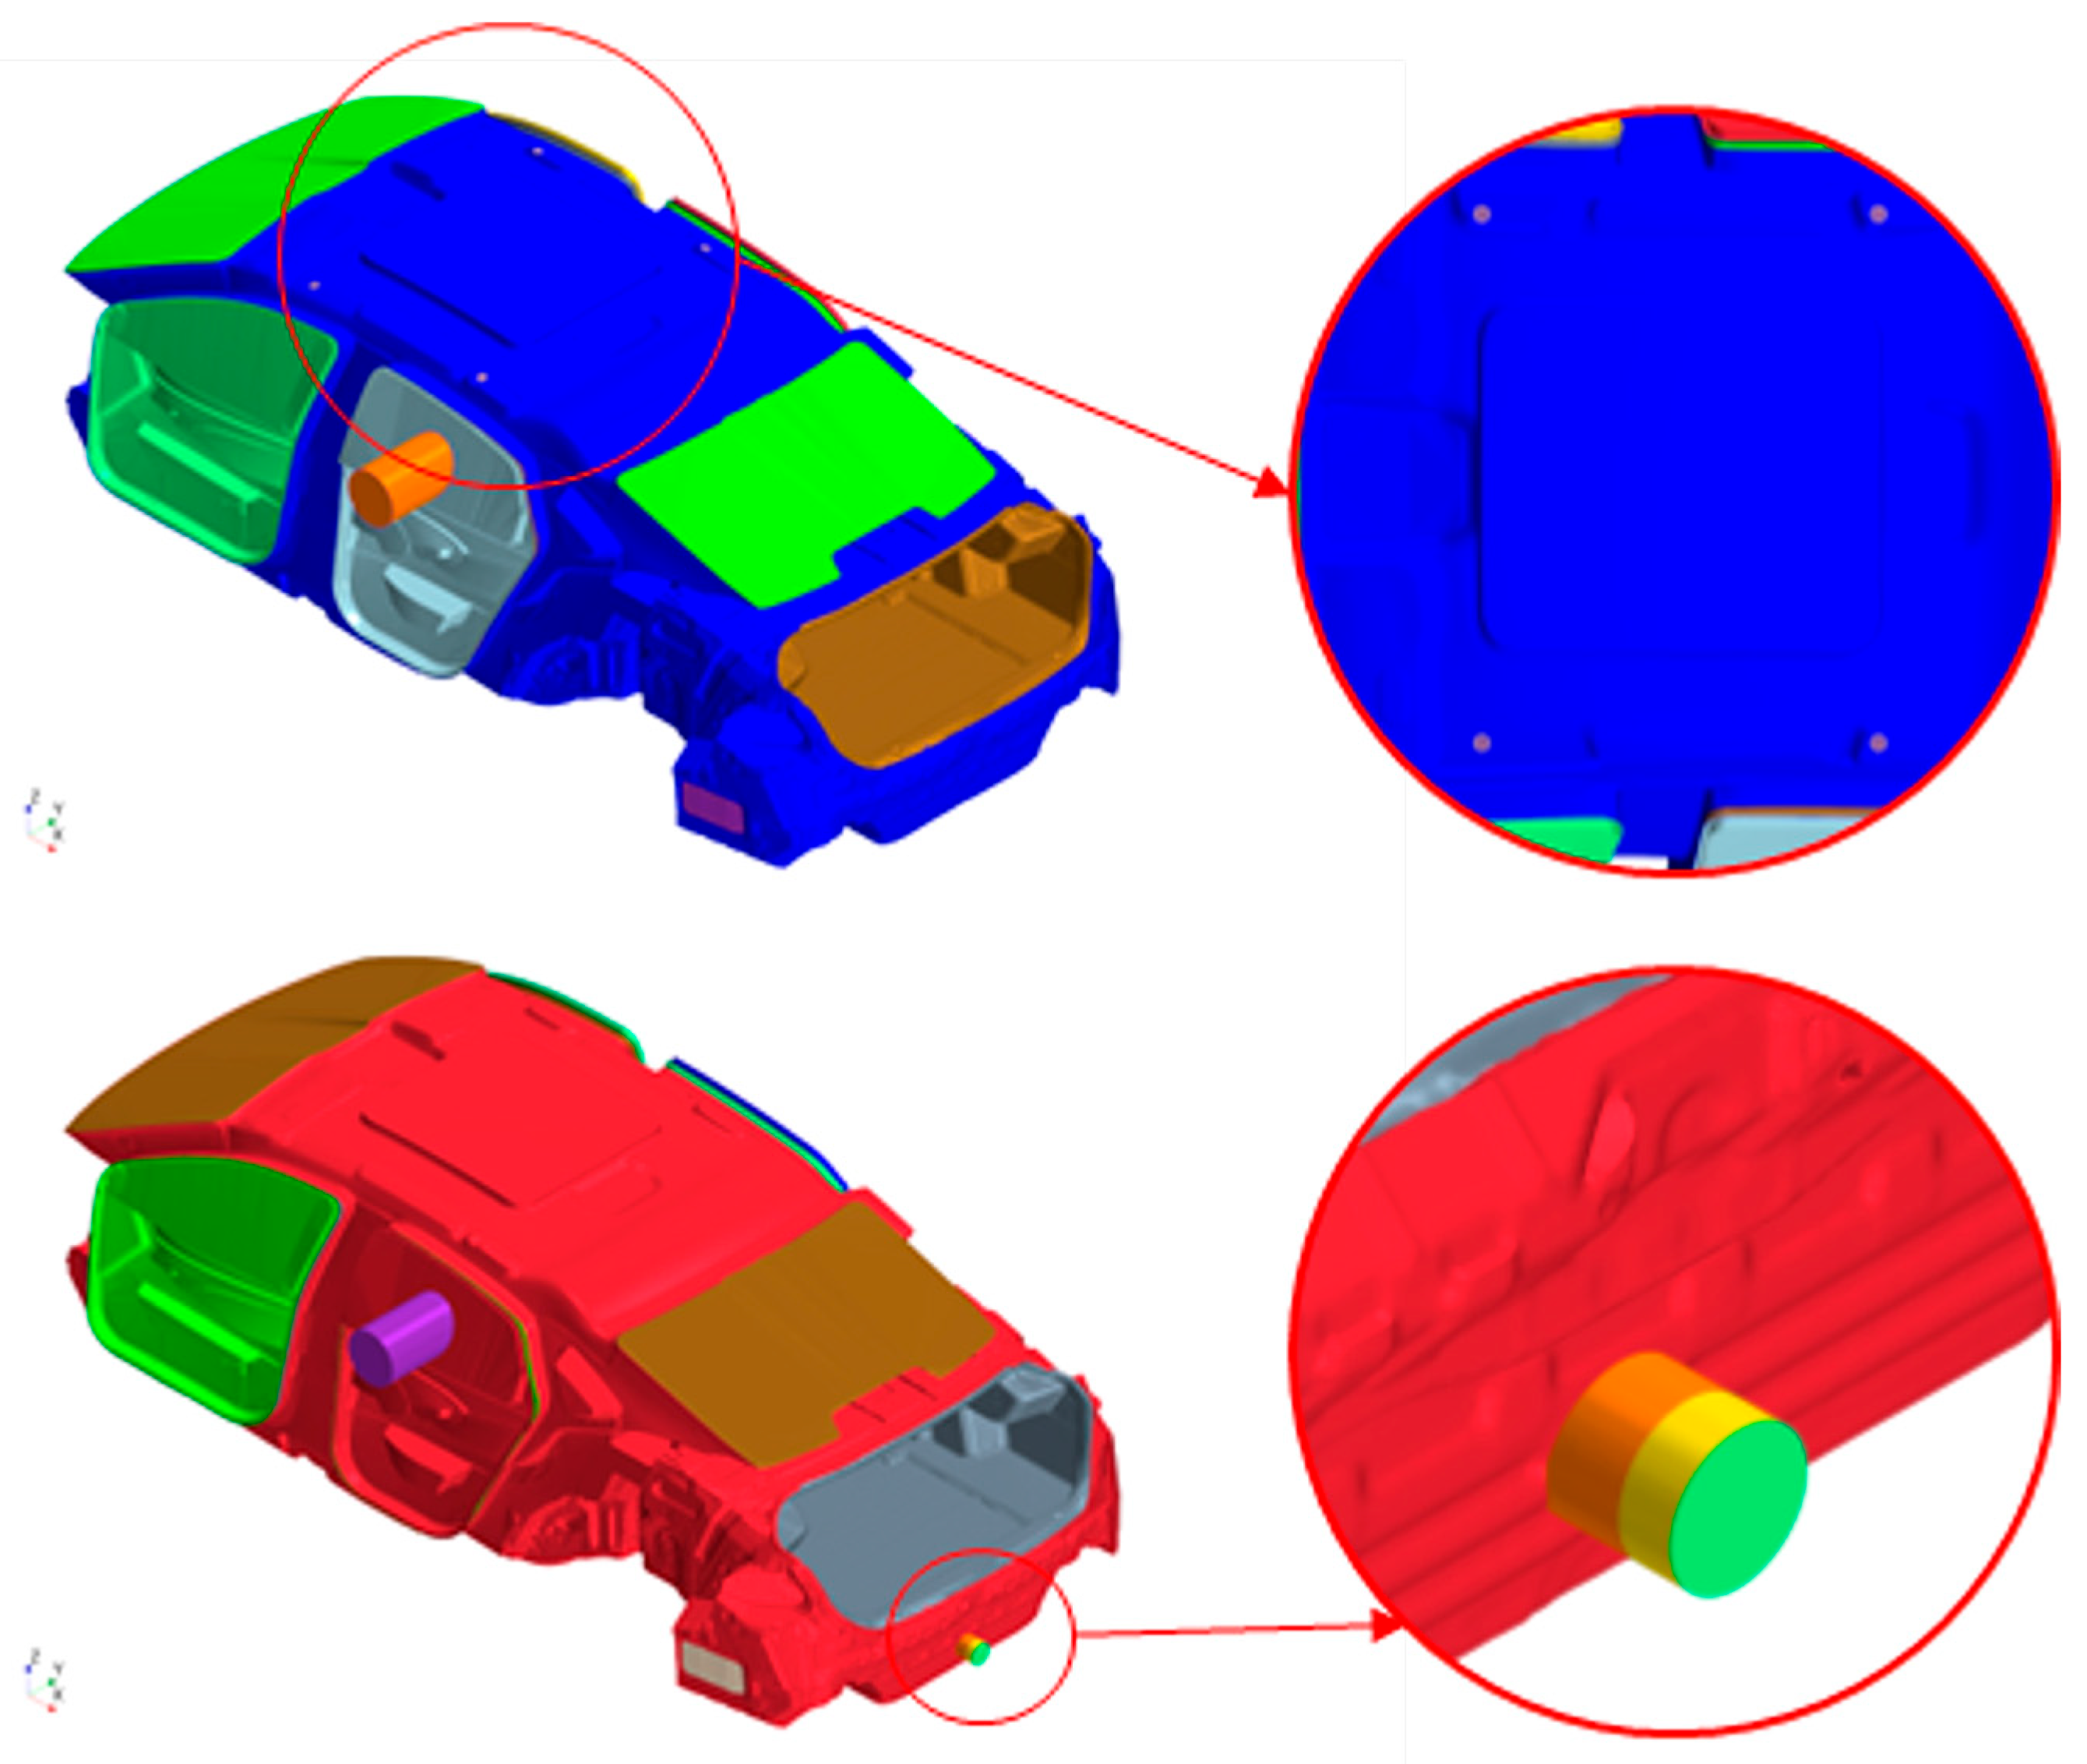
Theoretical analysis indicated that separating the controllable and uncontrollable leakage significantly affected the results. In this study, the uncontrolled leakage was simulated using circular holes. A scheme with eight holes of 15 mm radius was adopted, distributed at the four corners of the passenger compartment’s roof and floor.
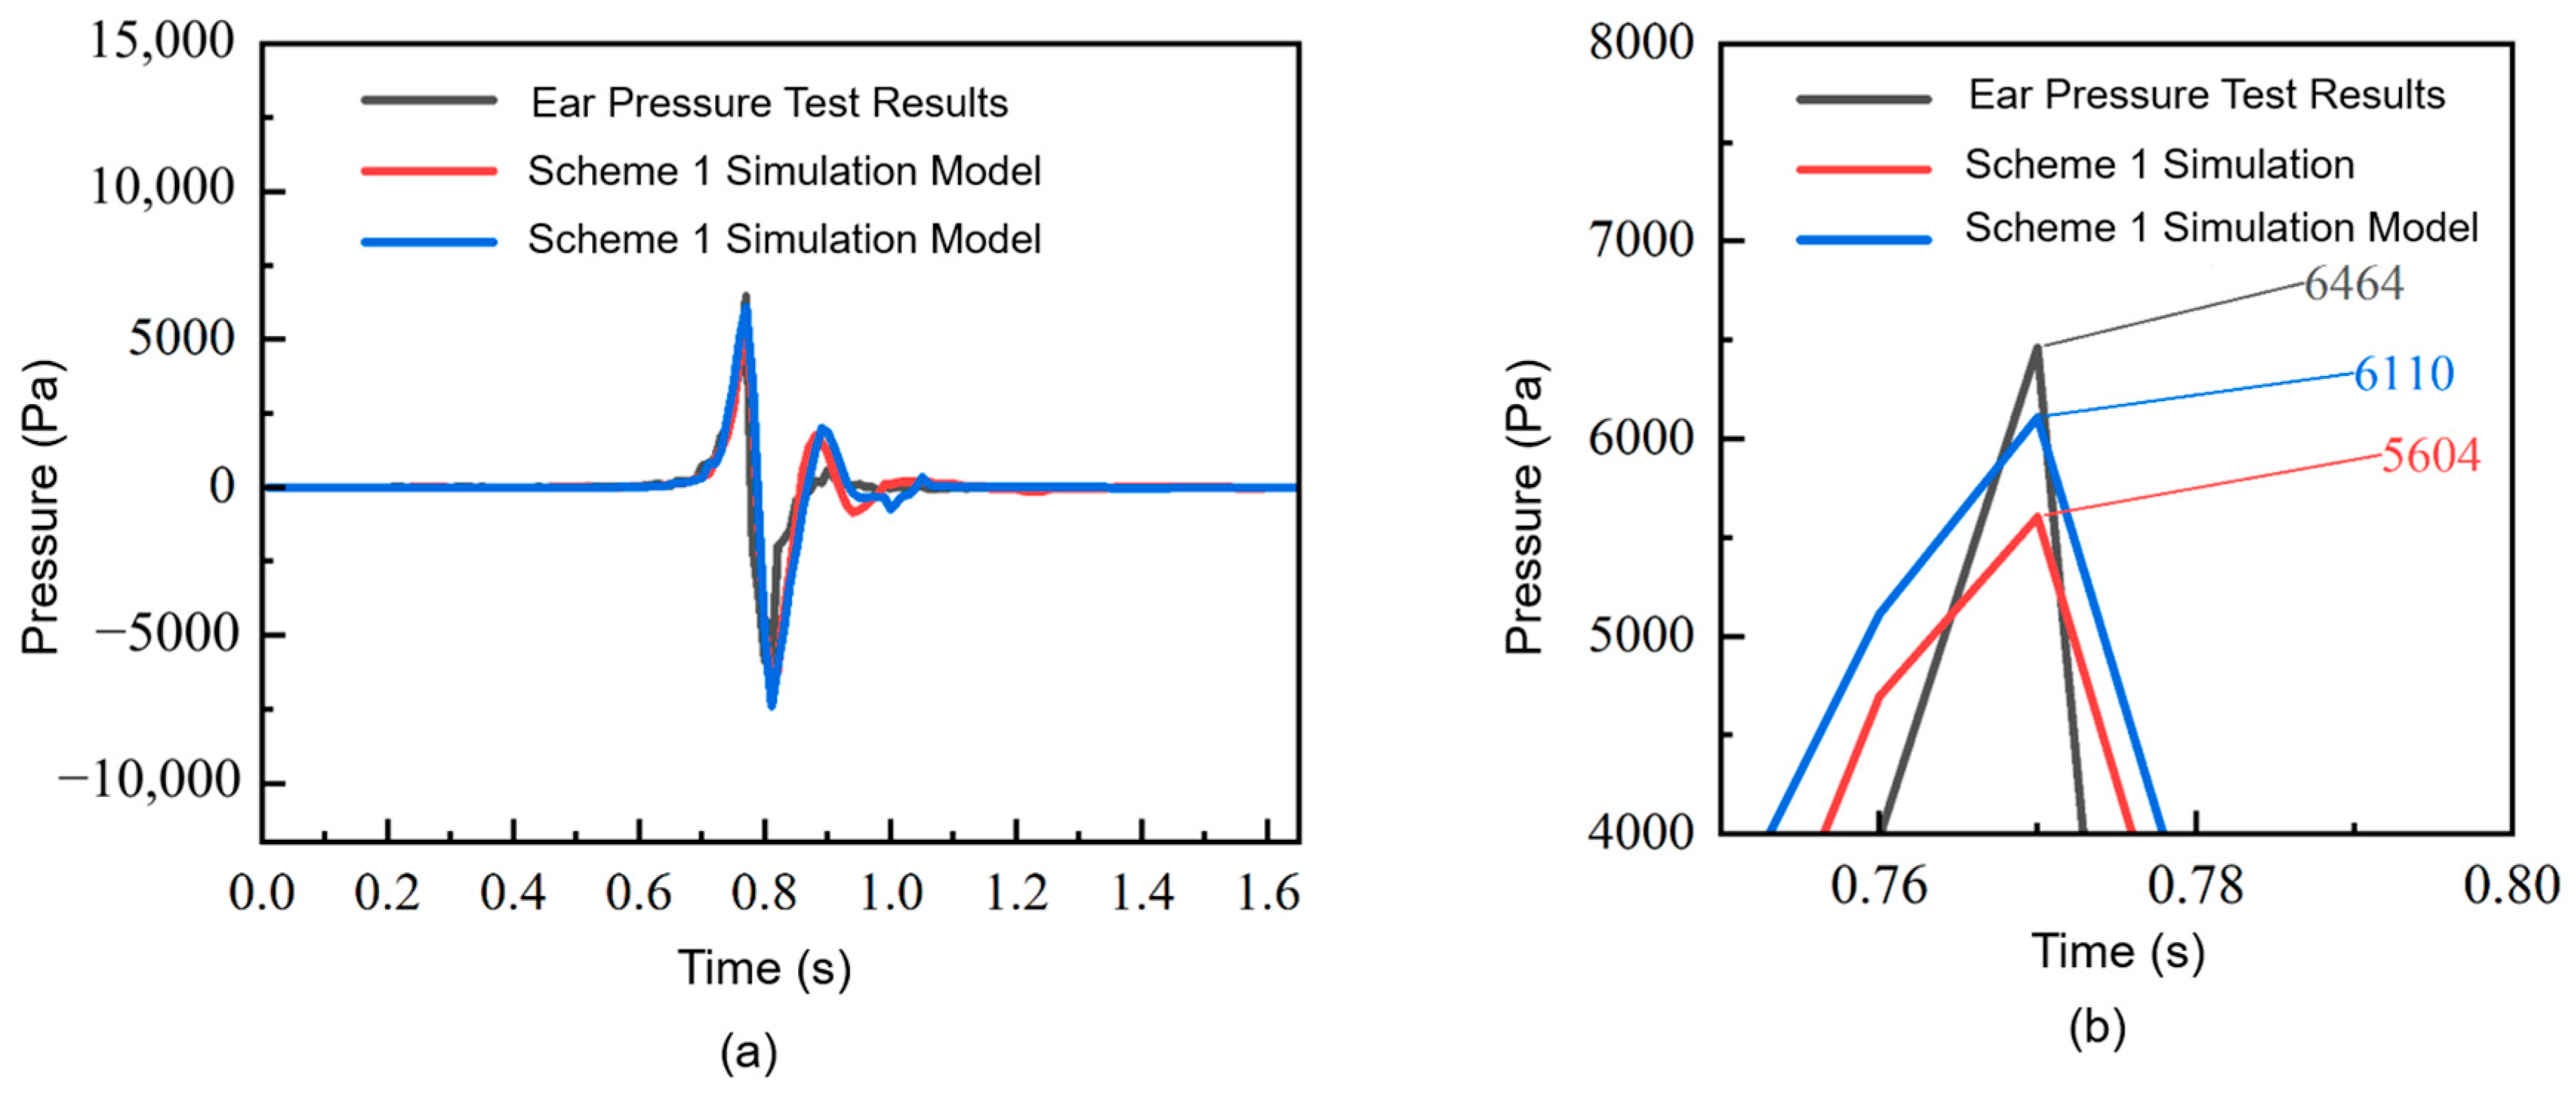
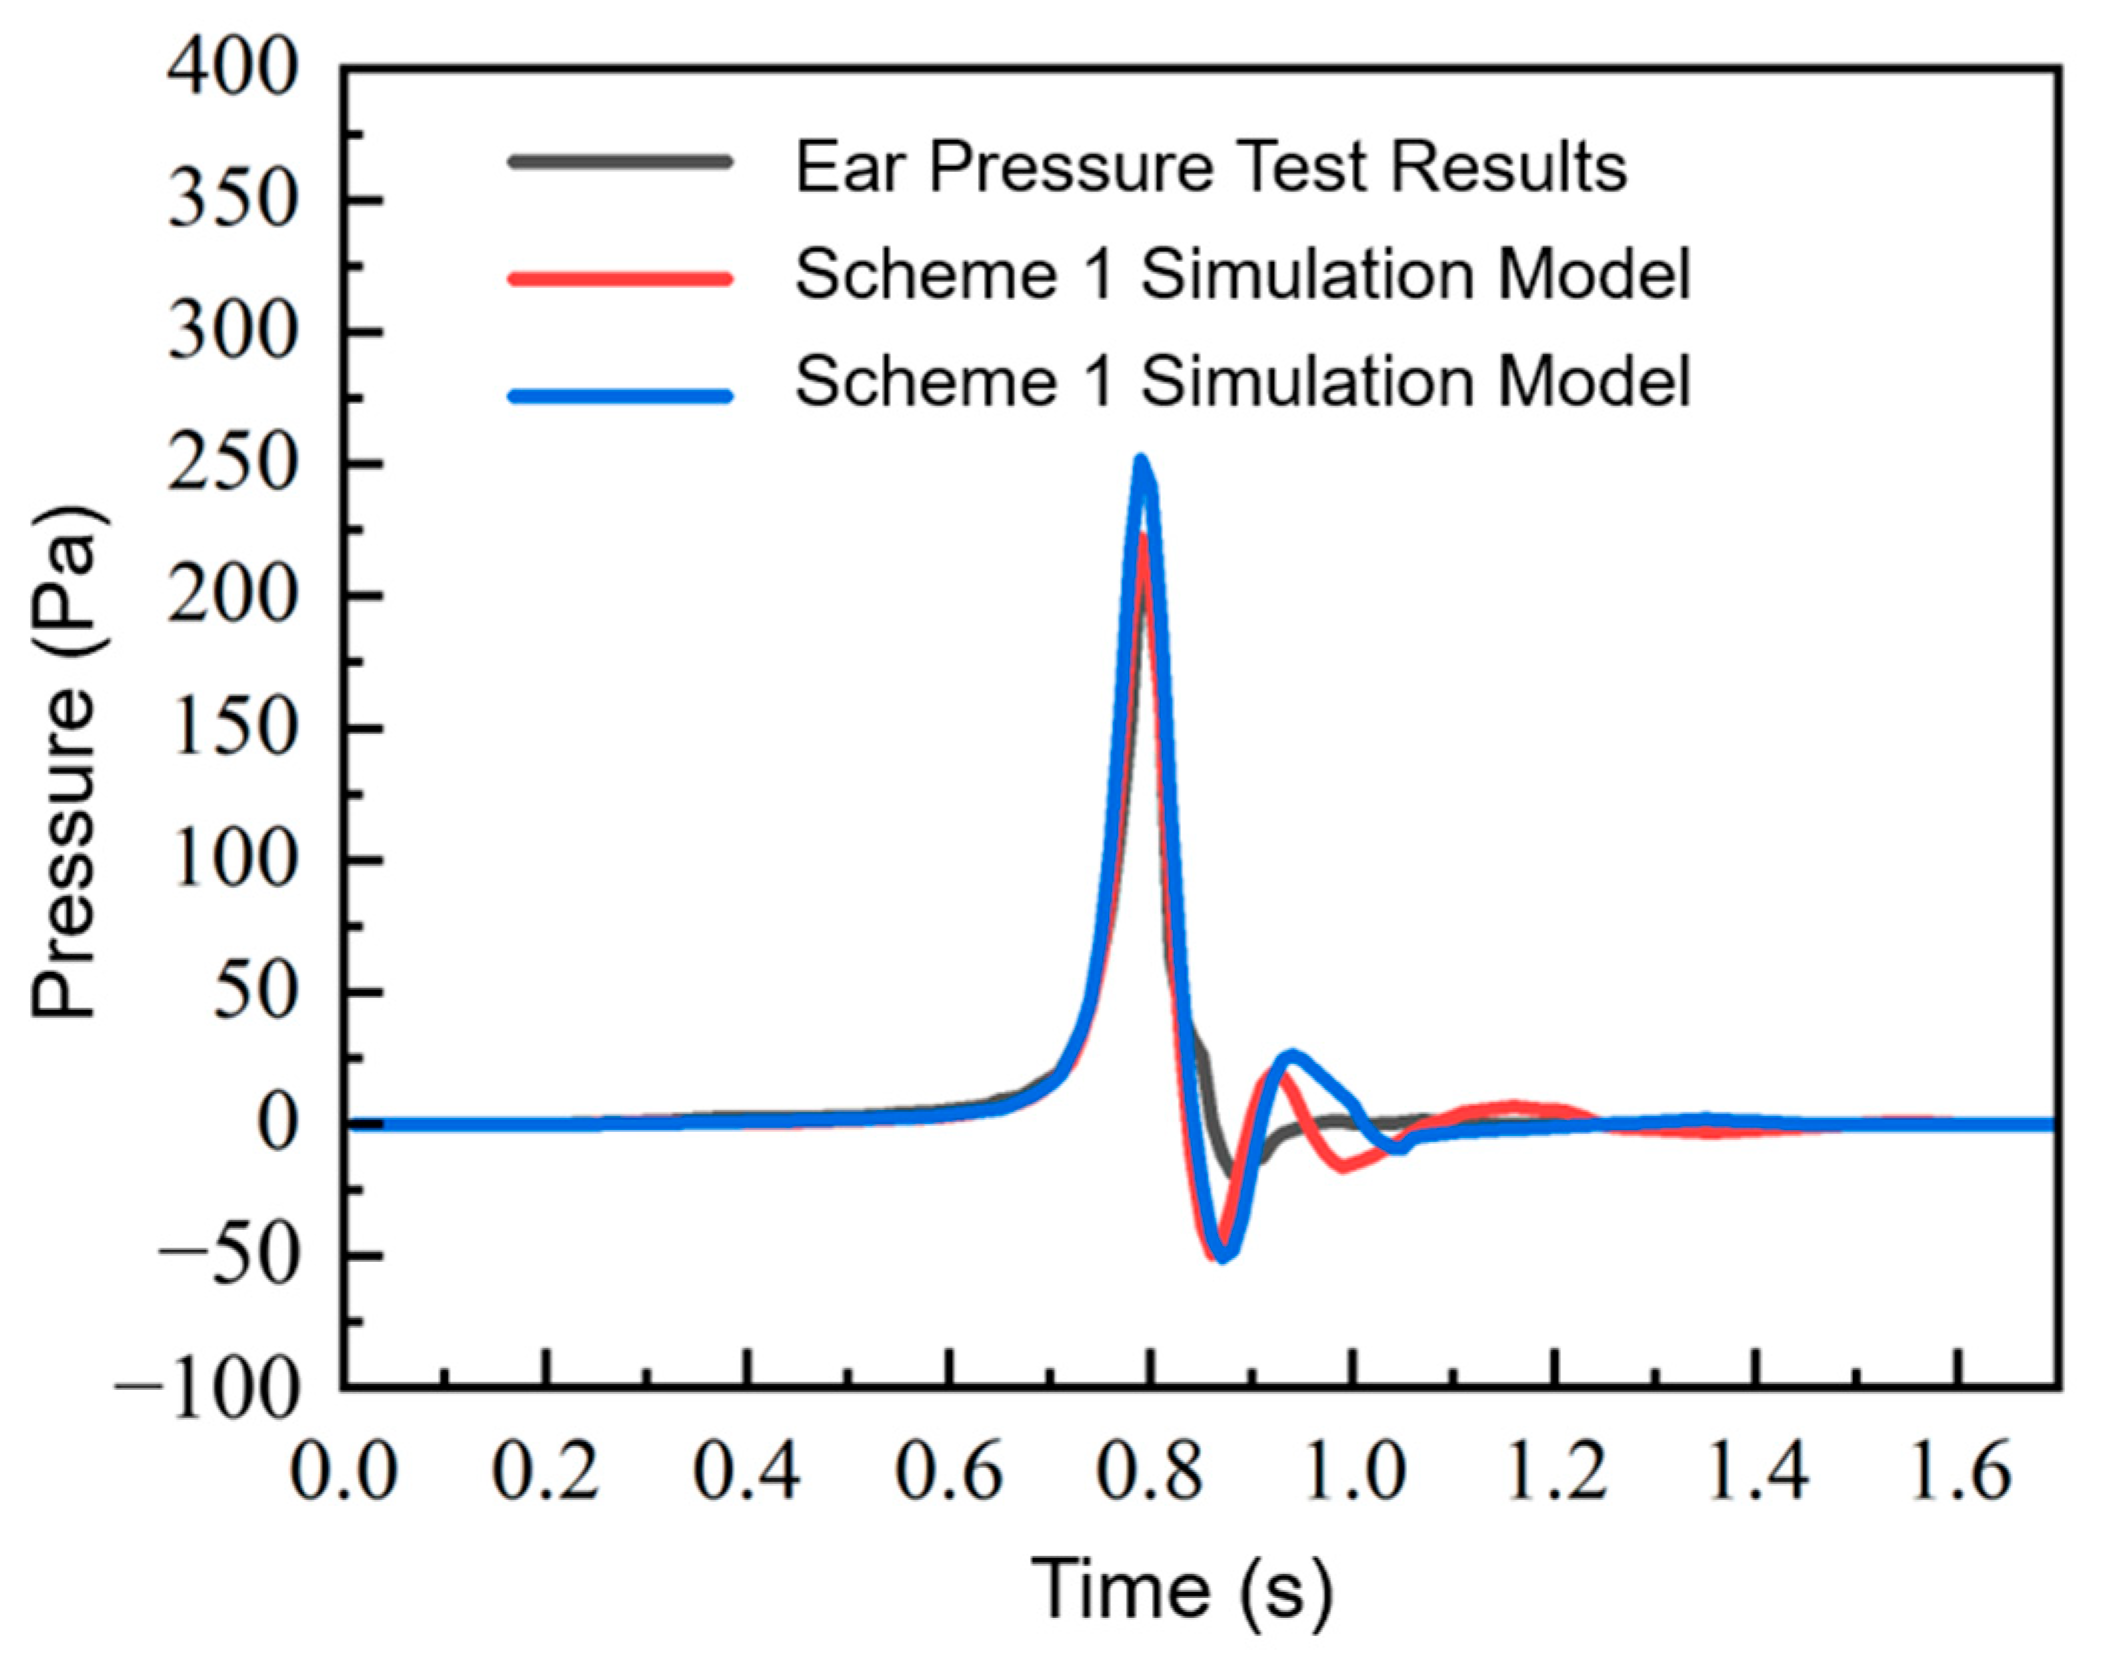
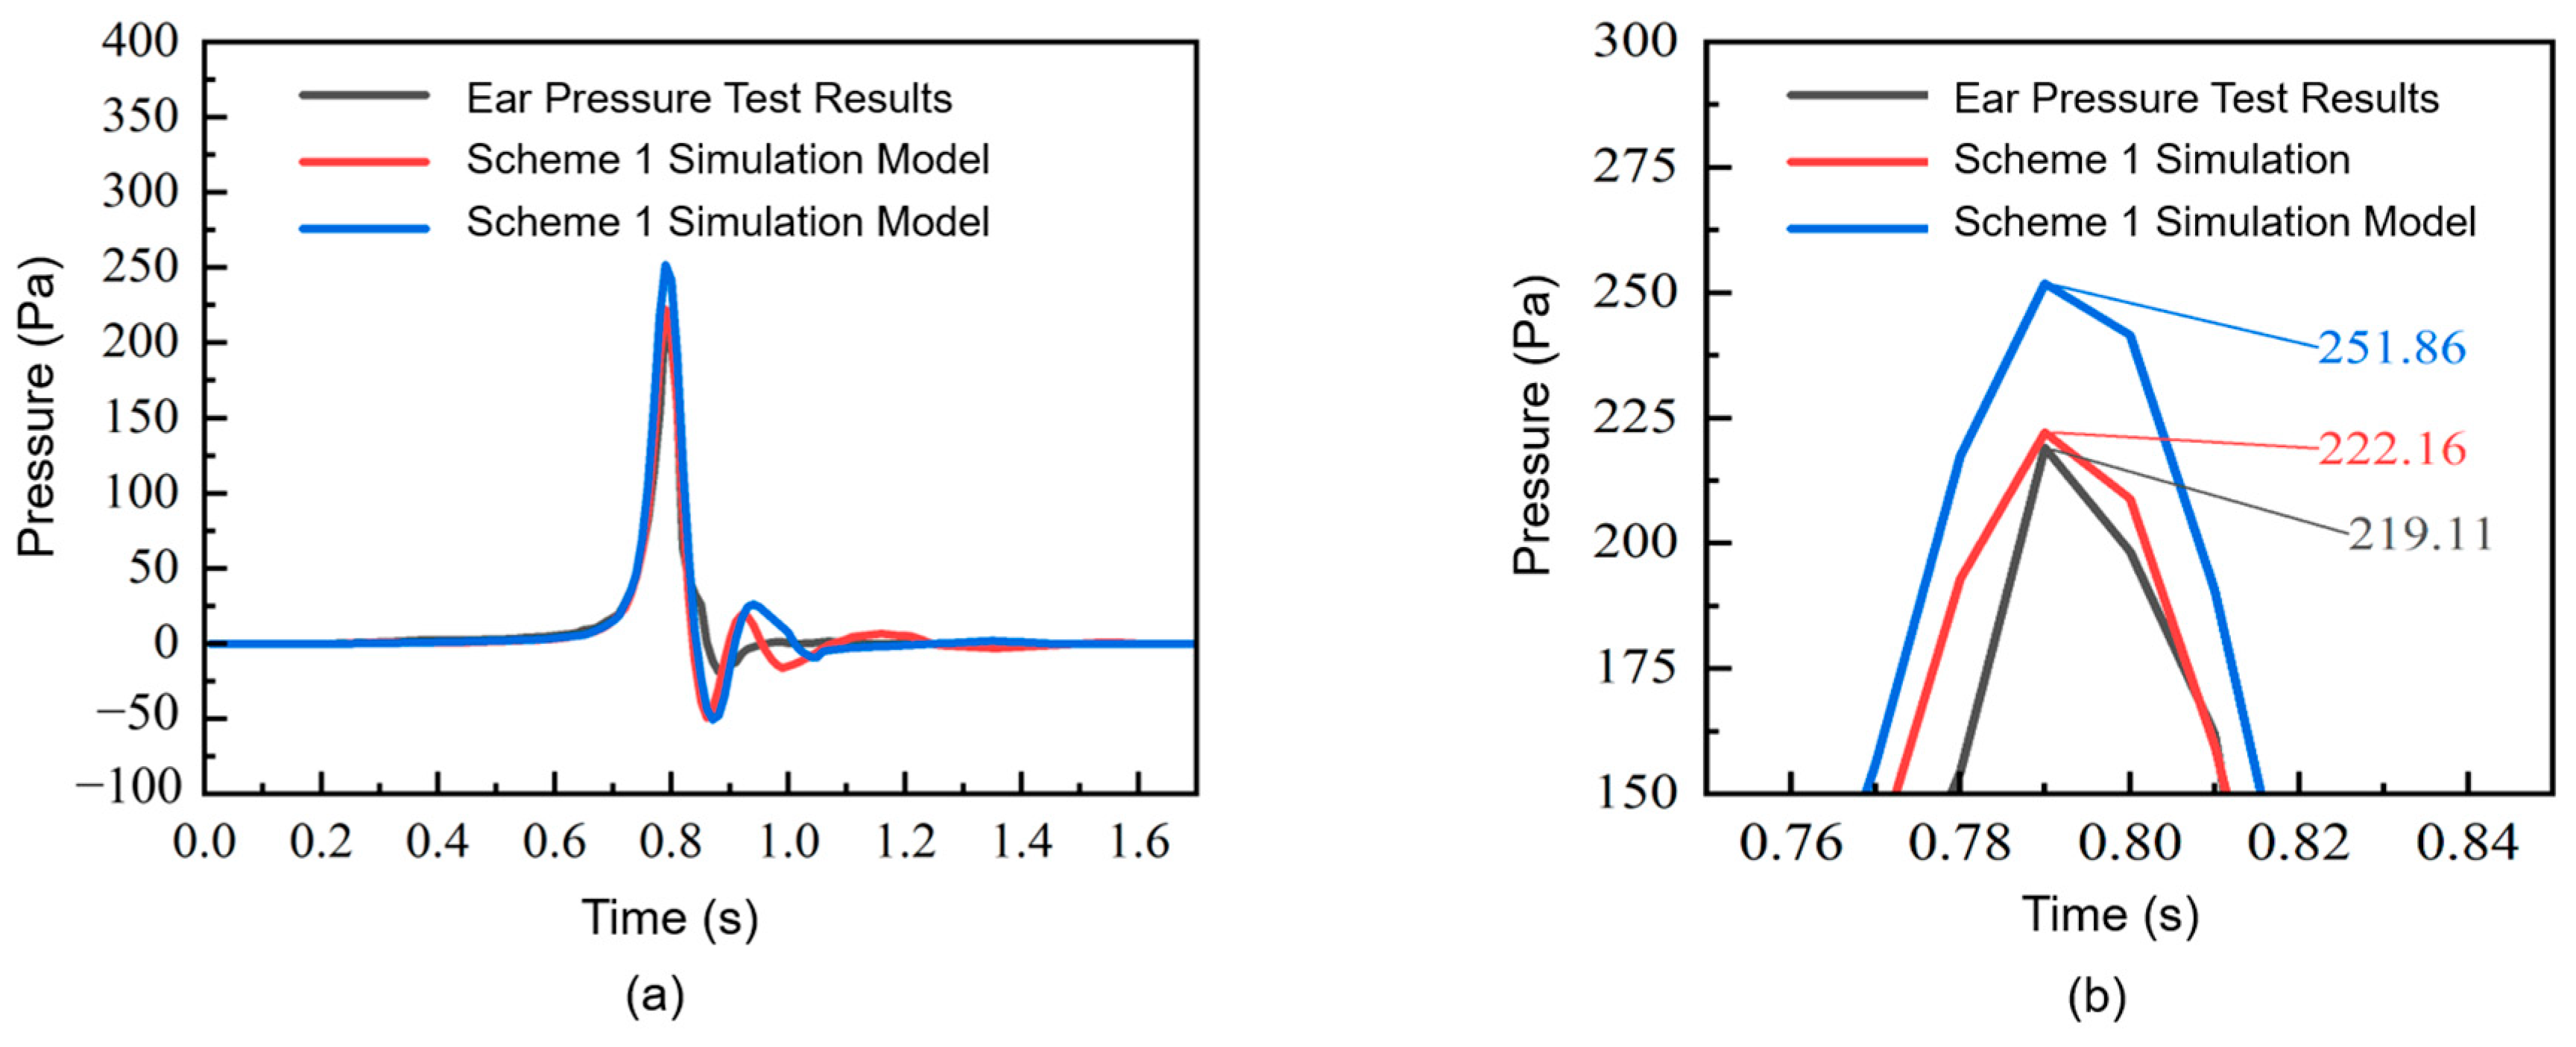
The eight circular holes represent a simplified generalization of the actual vehicle leakage. In a real vehicle, uncontrolled leakage mainly occurs through dispersed tiny passages of varying sizes, such as wiring harness holes and assembly gaps, which are distributed around the entire body. To better reproduce the actual physical conditions, eight circular holes were arranged at the four corners of the passenger compartment roof and the four corners of the floor to represent the air leakage paths of the whole vehicle. This configuration more realistically captures the outward air leakage from the passenger compartment into the surrounding space. The present study also compared the simulation results between a single concentrated opening and the eight distributed openings. Scheme 1 corresponds to the eight-hole arrangement, with the eight holes located at the four corners of the roof and the four corners of the floor. Scheme 2 corresponds to a single opening of a 40 mm radius located at the rear of the vehicle, which was placed there to preserve the completeness of the flow path from the door to the pressure relief valve and to avoid interfering with the flow through the pressure relief passage. The whole-vehicle airtightness simulation models of the two schemes are shown in Figure 8. The total hole areas of the two schemes were 0.0057 m2 and 0.0050 m2, respectively. The simulated pressure and pressure change rate results of the two schemes were compared with the experimental data, as shown in Figure 9 and Figure 10, respectively. The results indicate that the eight-hole configuration yields better agreement with the experimental values in terms of peak pressure accuracy (Figure 9) and pressure change rate (Figure 10) and is more consistent with the actual physical situation. Therefore, the eight-hole representation of the uncontrolled leakage was adopted in this study.
To simulate the one-way flow characteristic of the pressure relief valve, the average pressure on the internal surface of the porous-medium region was monitored during the solution process. When the internal surface average pressure was greater than 0, the porous-medium parameters remained at their fitted values, simulating the open state; when it was less than 0, the resistance coefficients were amplified by a factor of 1000, simulating the closed state with virtually no airflow.
The amplification of the resistance coefficients by a factor of 1000 is a purely numerical parameter used to switch the porous-medium region between the open and closed states, and it does not represent the actual residual leakage of the valve in the closed state. In the closed state, the valve flap blocks reverse flow almost completely, so any multiplier sufficiently large to render the reverse flow through the porous-medium region negligible is adequate for reproducing the closed state; a factor of 1000 was therefore adopted. Although an actual valve may exhibit slight residual leakage in the closed state, this leakage is far smaller than the normal flow and has a negligible effect on the pressure variation in the passenger compartment. The appropriateness of this setting is supported by the validation results: after the one-way flow behavior was implemented, the negative pressure peak decreased from −49.06 Pa to −21.29 Pa and the pressure amplitude error was reduced from 17.62% to 2.66%, indicating that the closed state was well captured.
This method allows the pressure relief valve to automatically switch states according to the pressure change during door closure, thereby more accurately reflecting its physical behavior. After refinement, the negative pressure phase was significantly improved, pressure fluctuations were attenuated, and the simulation accuracy was further enhanced.

3. Methodology

3.1. Subsection

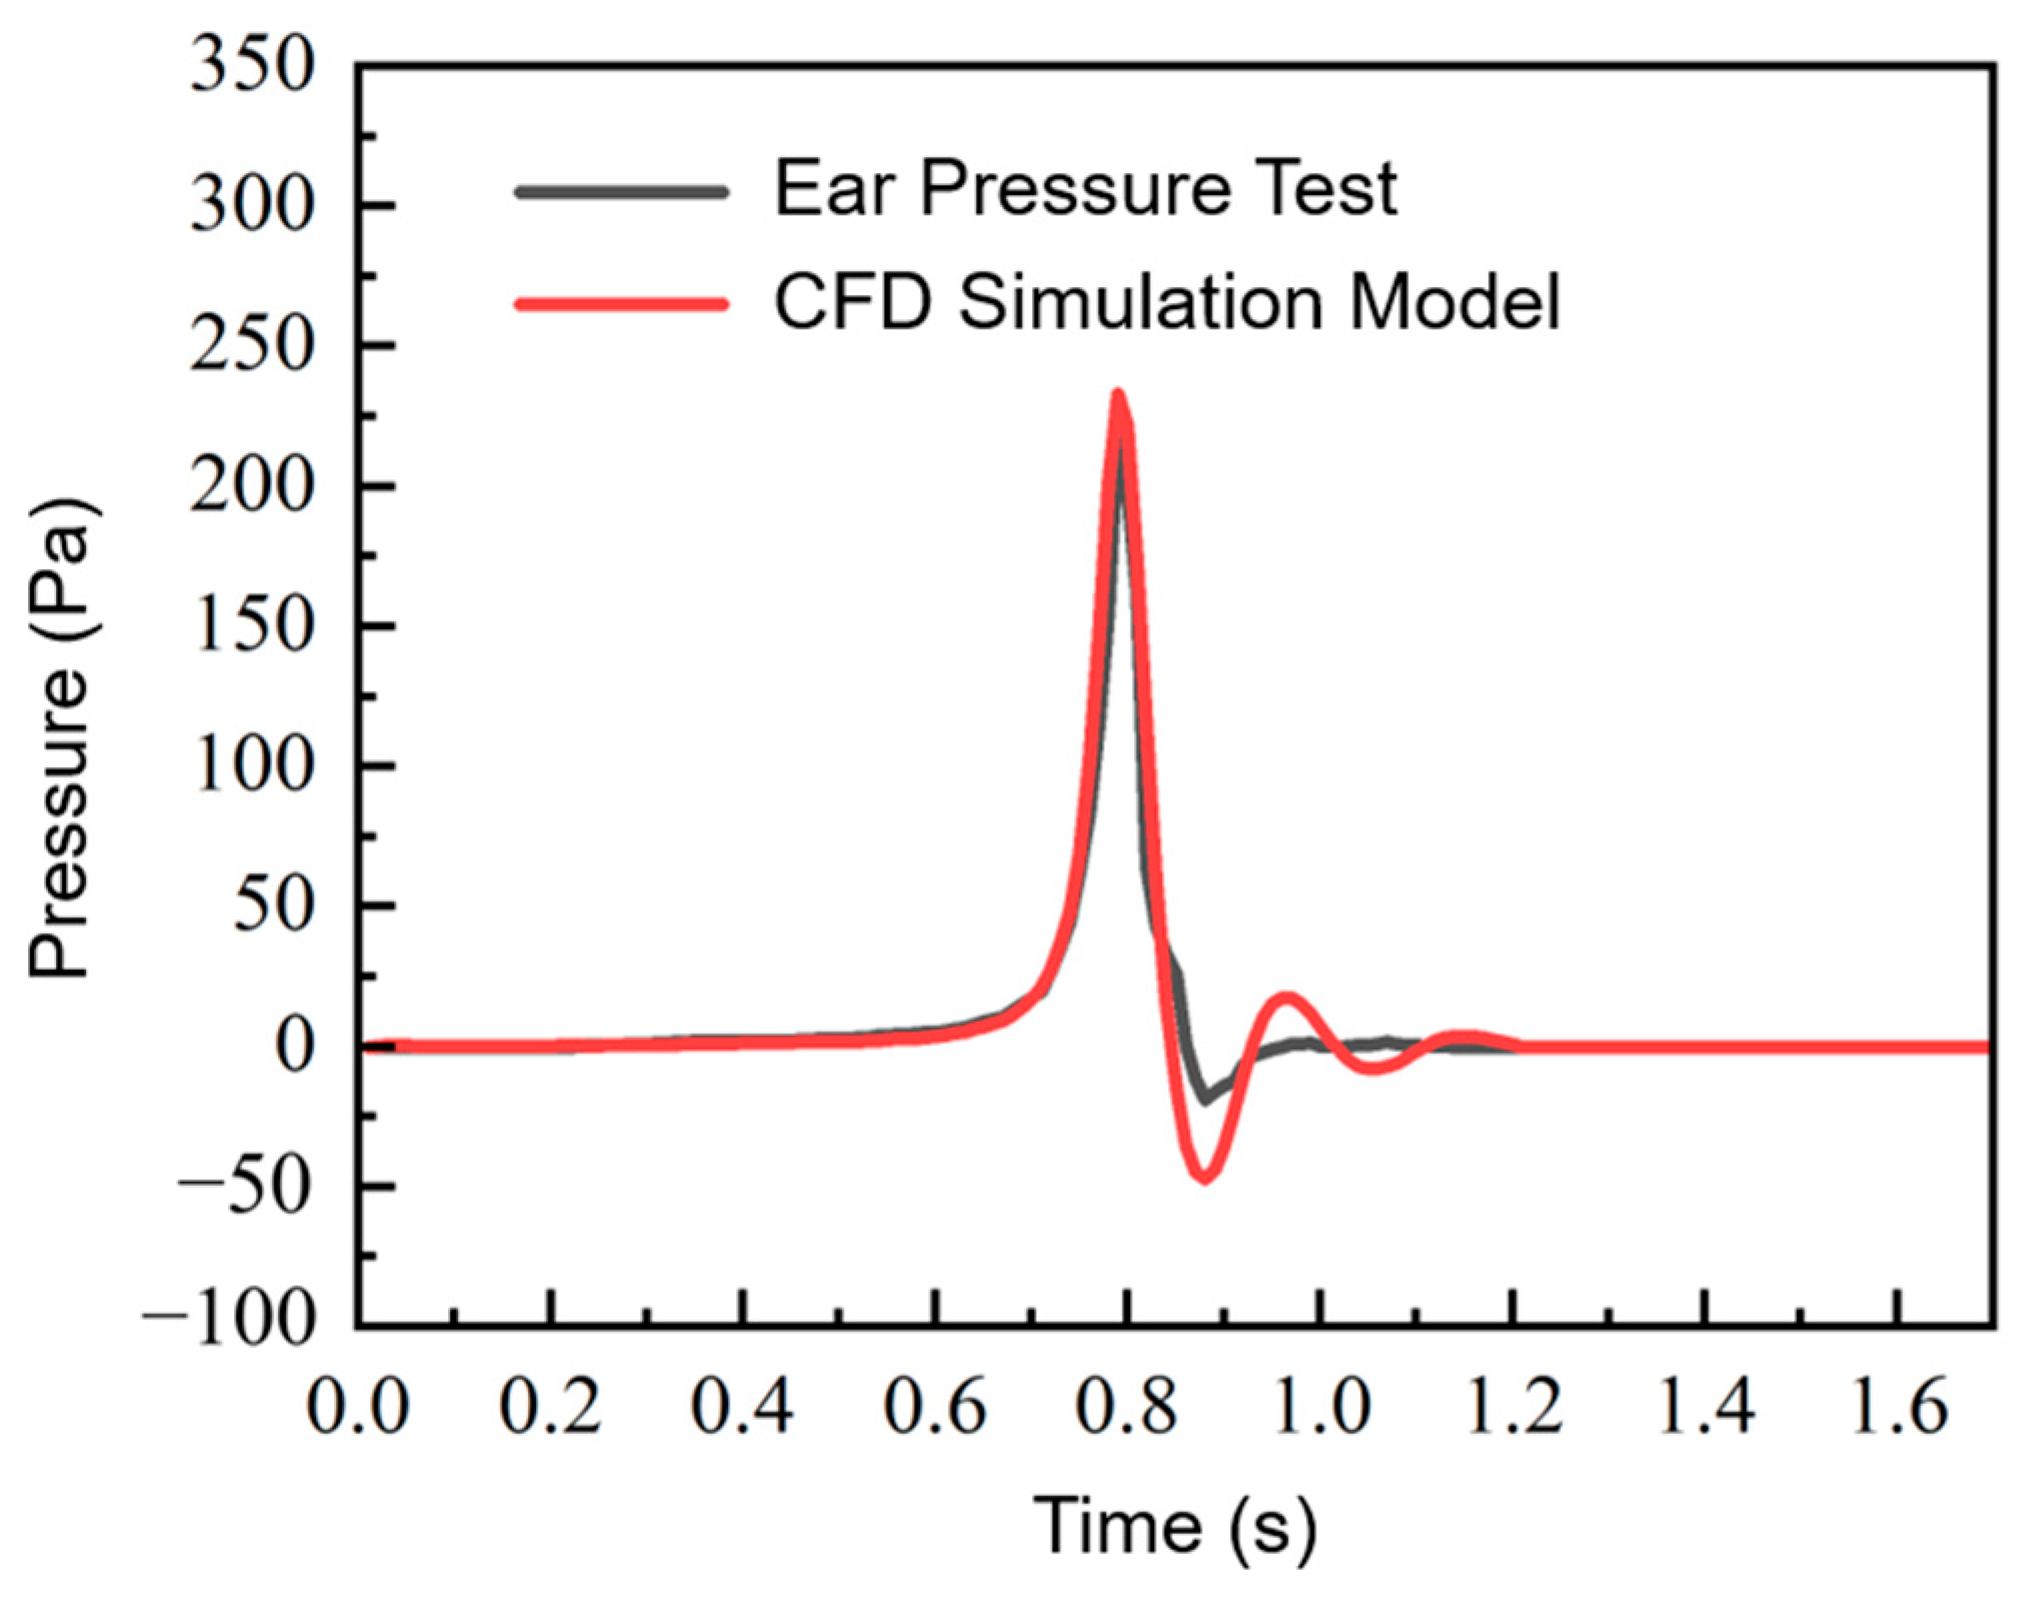
The accuracy of the CFD simulation model was validated against experimental data. At a door-closing speed of 1.2 m/s, the simulated and experimental pressure curves monitored near the driver’s left ear are compared in Figure 11. Both curves exhibit the same typical pattern: the pressure gradually increases to a positive peak at full closure, rapidly decreases to a negative peak, and then fluctuates toward zero, consistent with the literature [19].
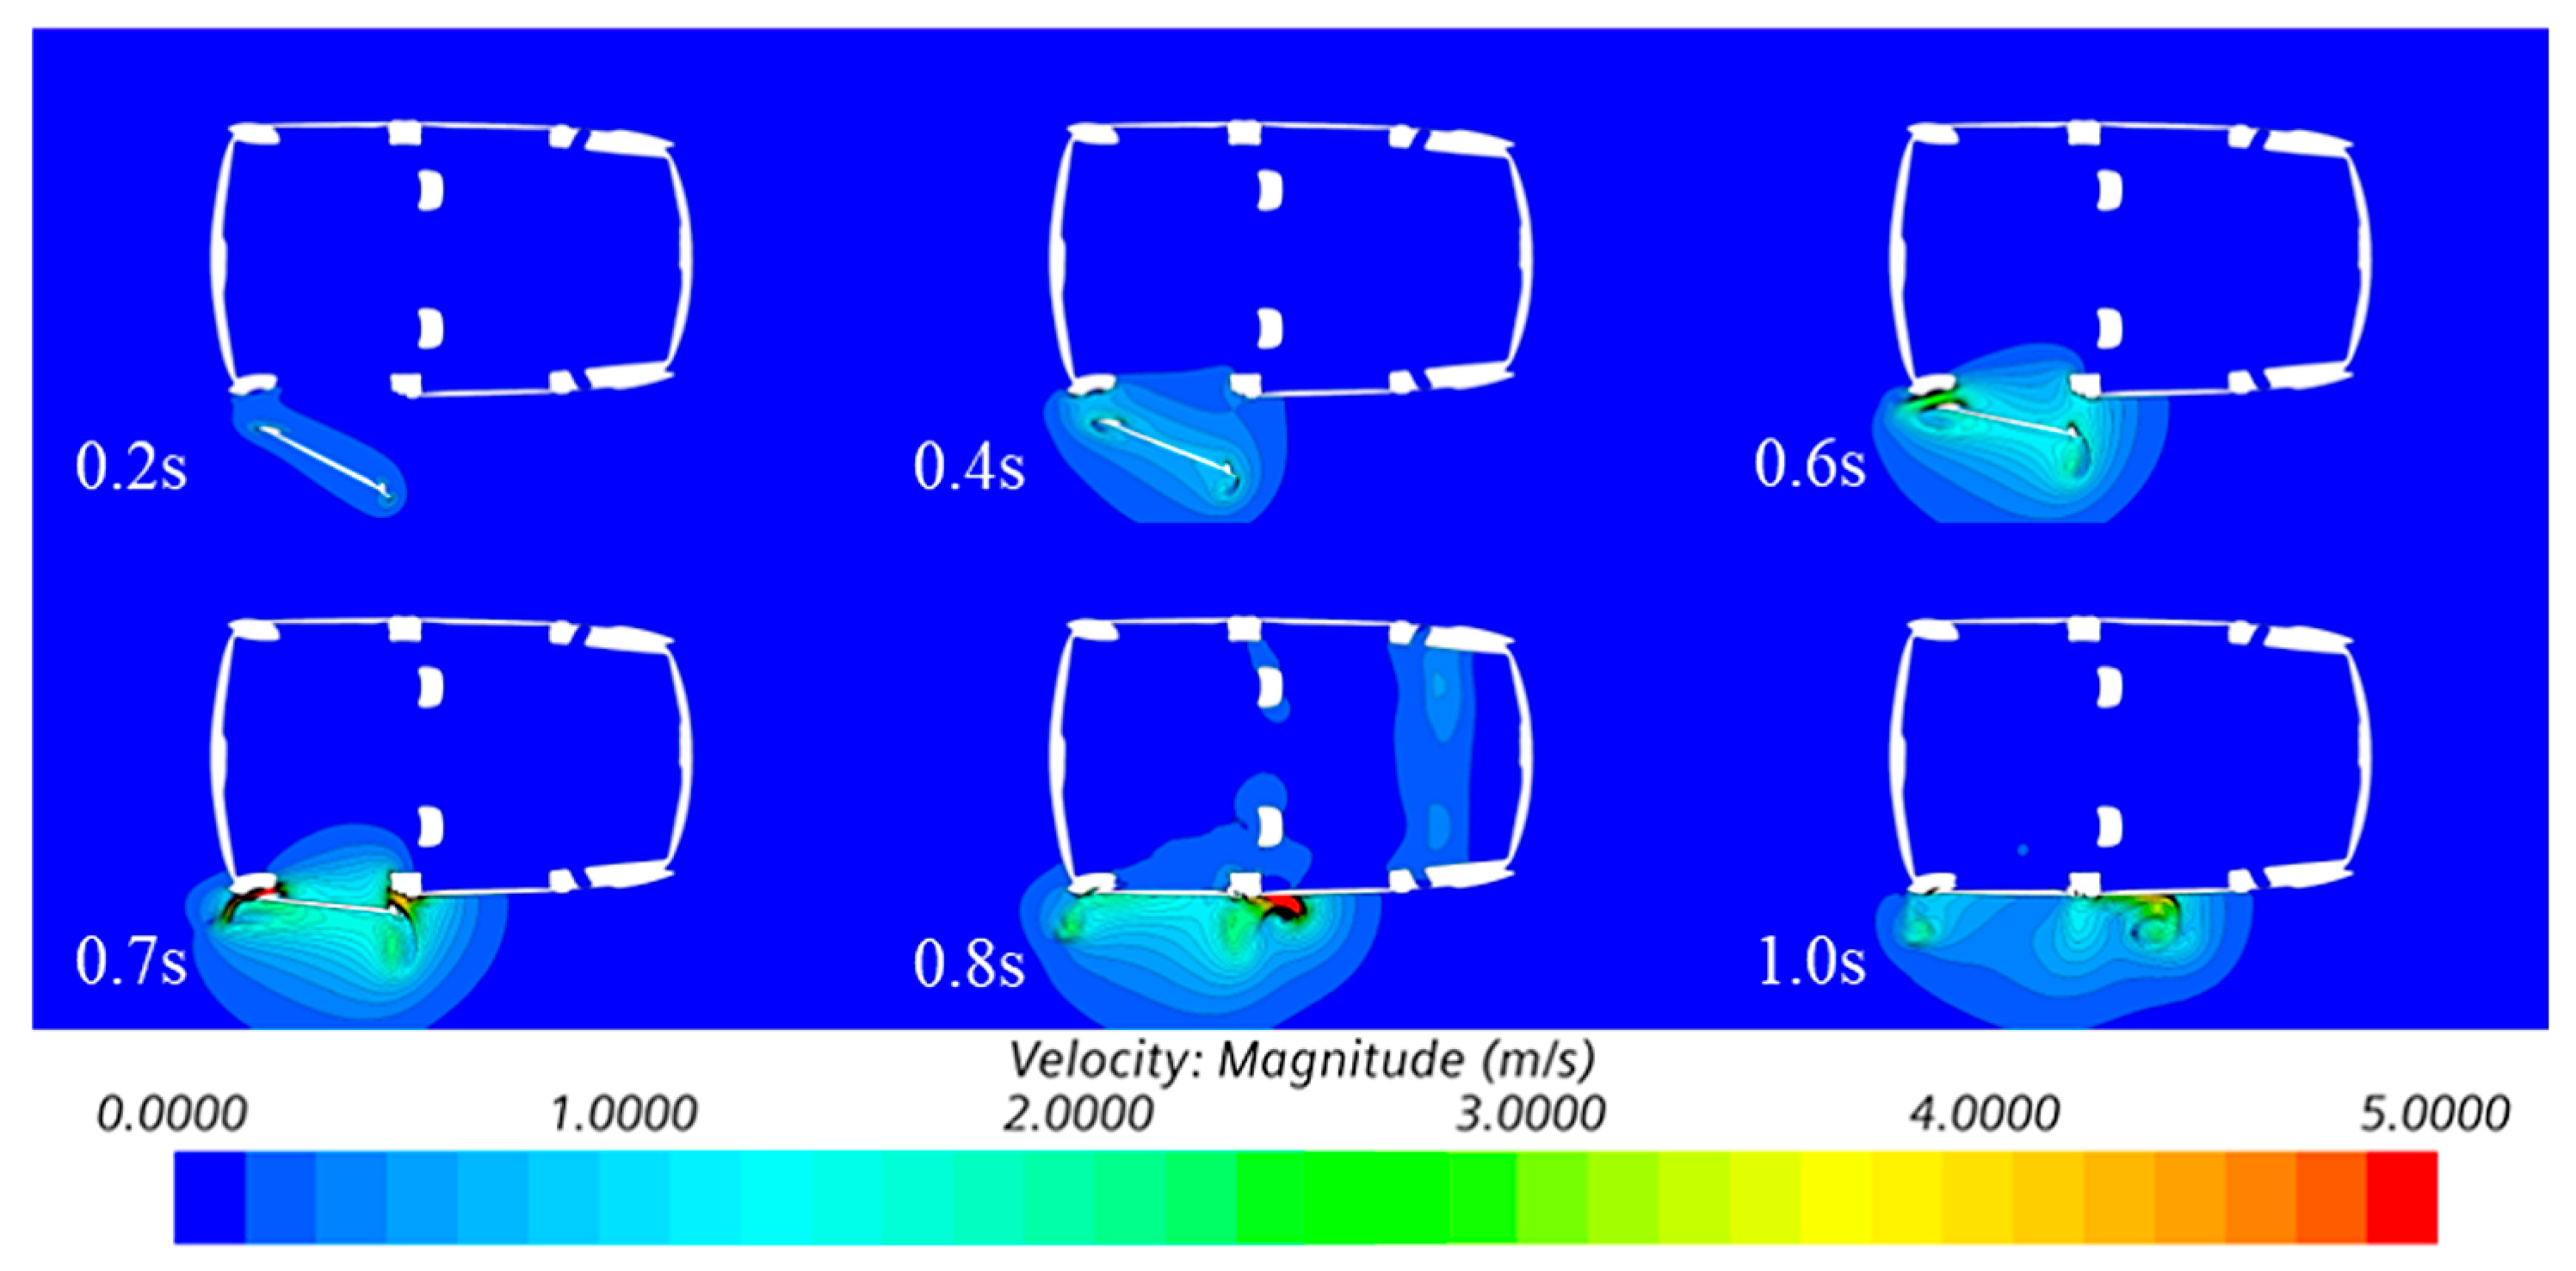
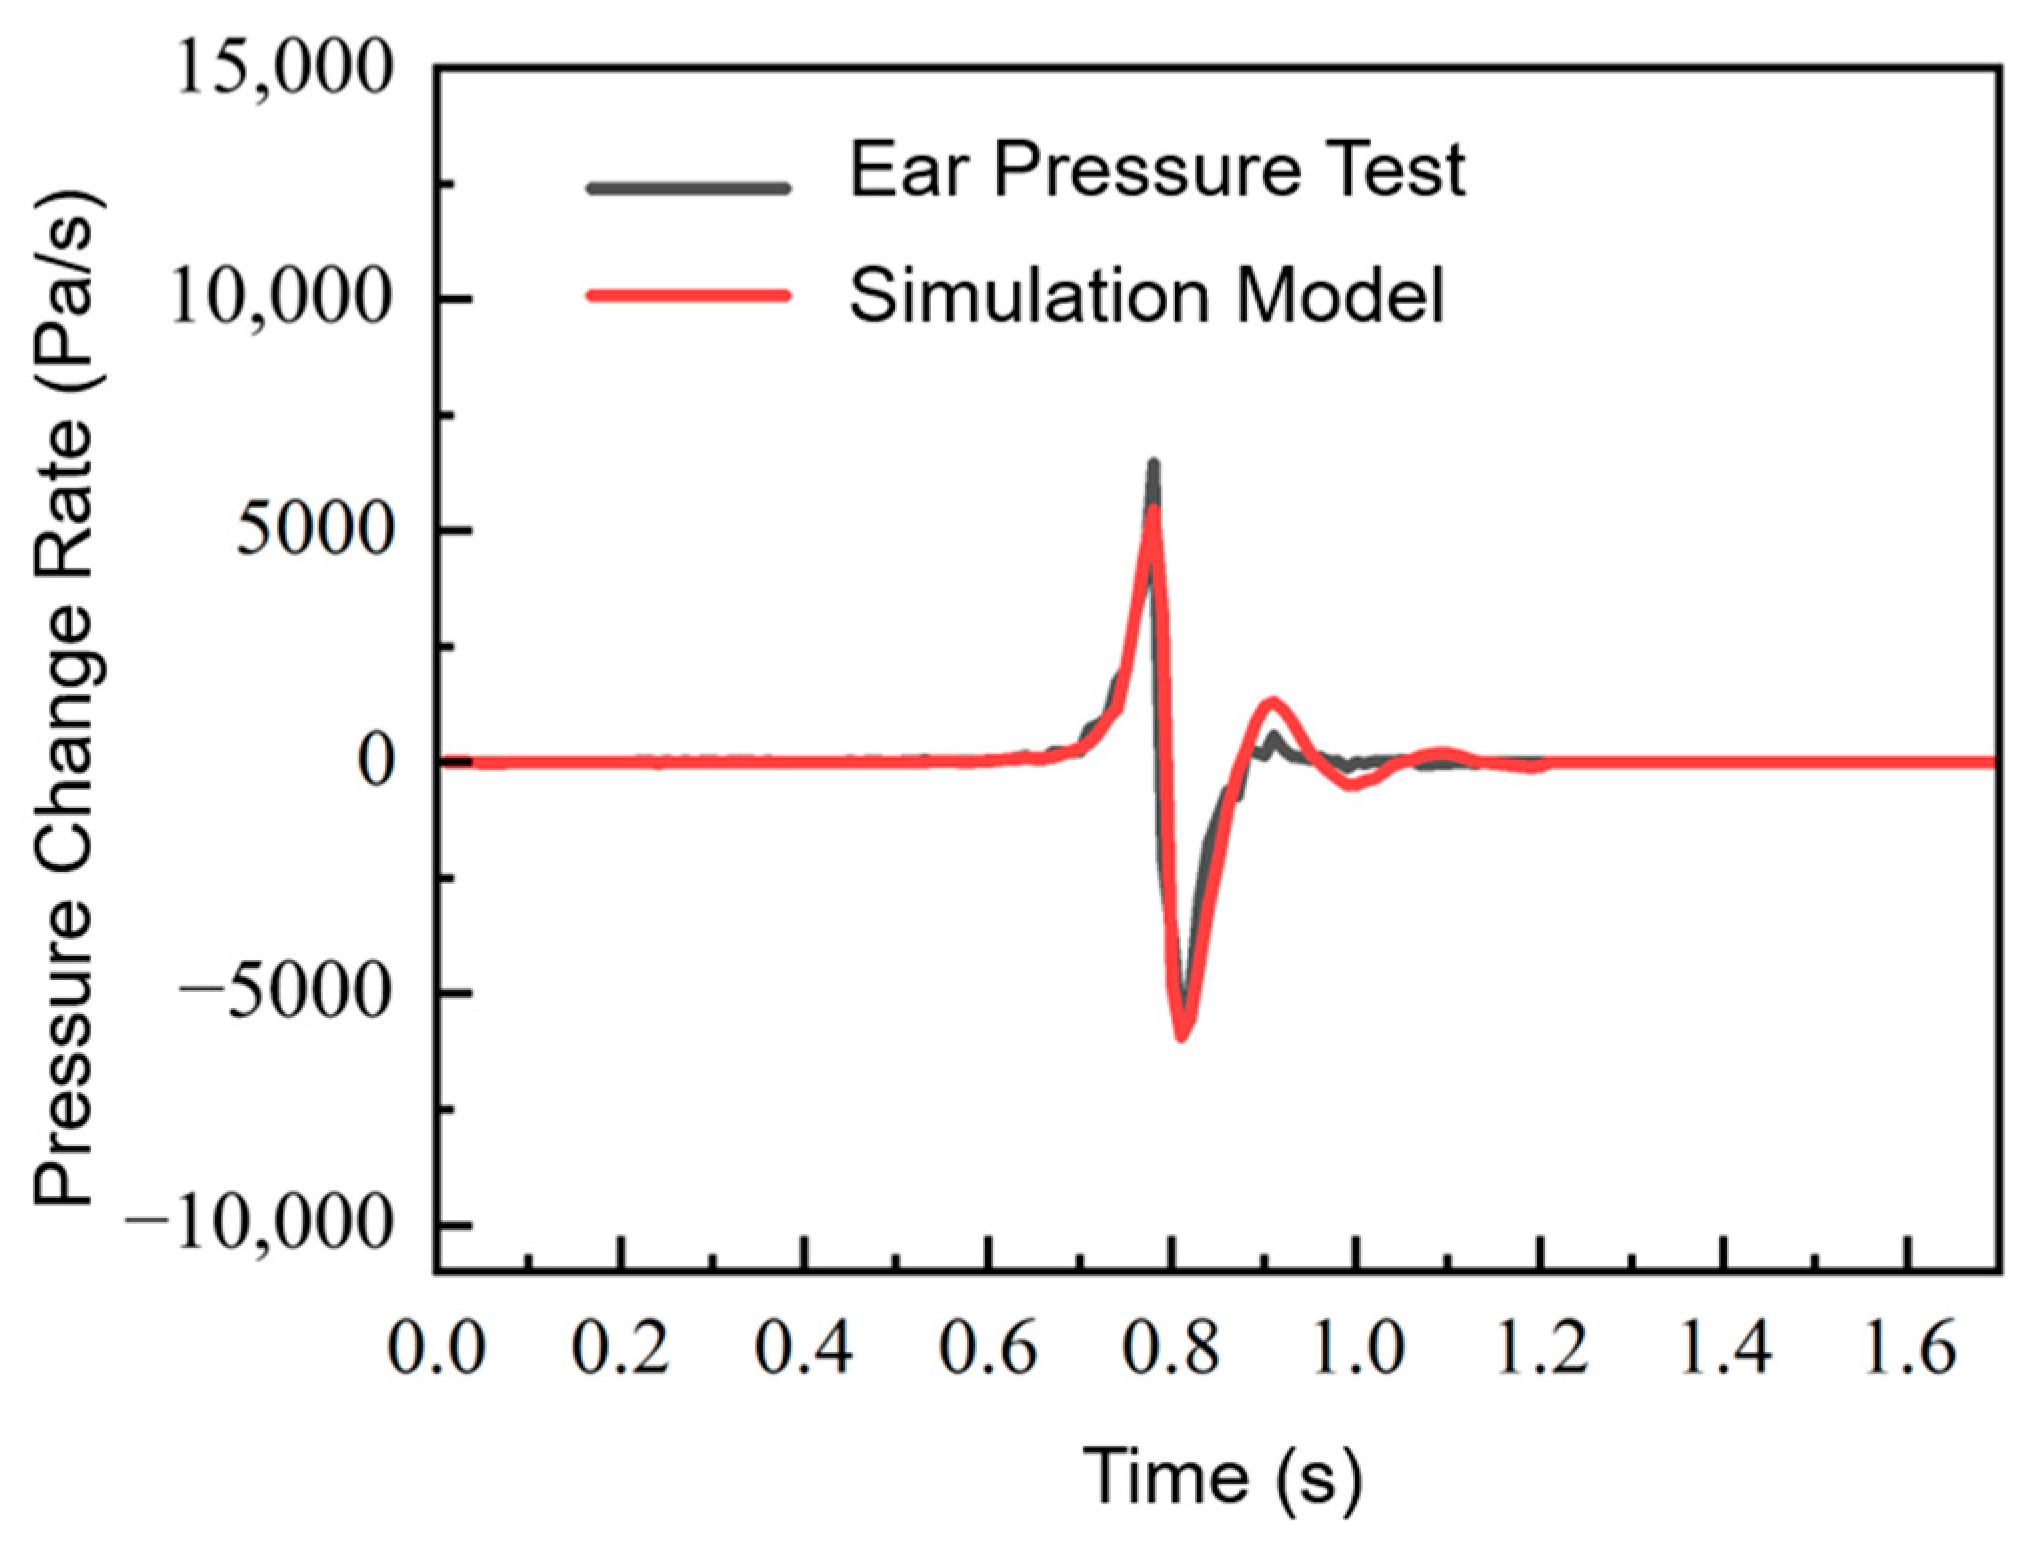
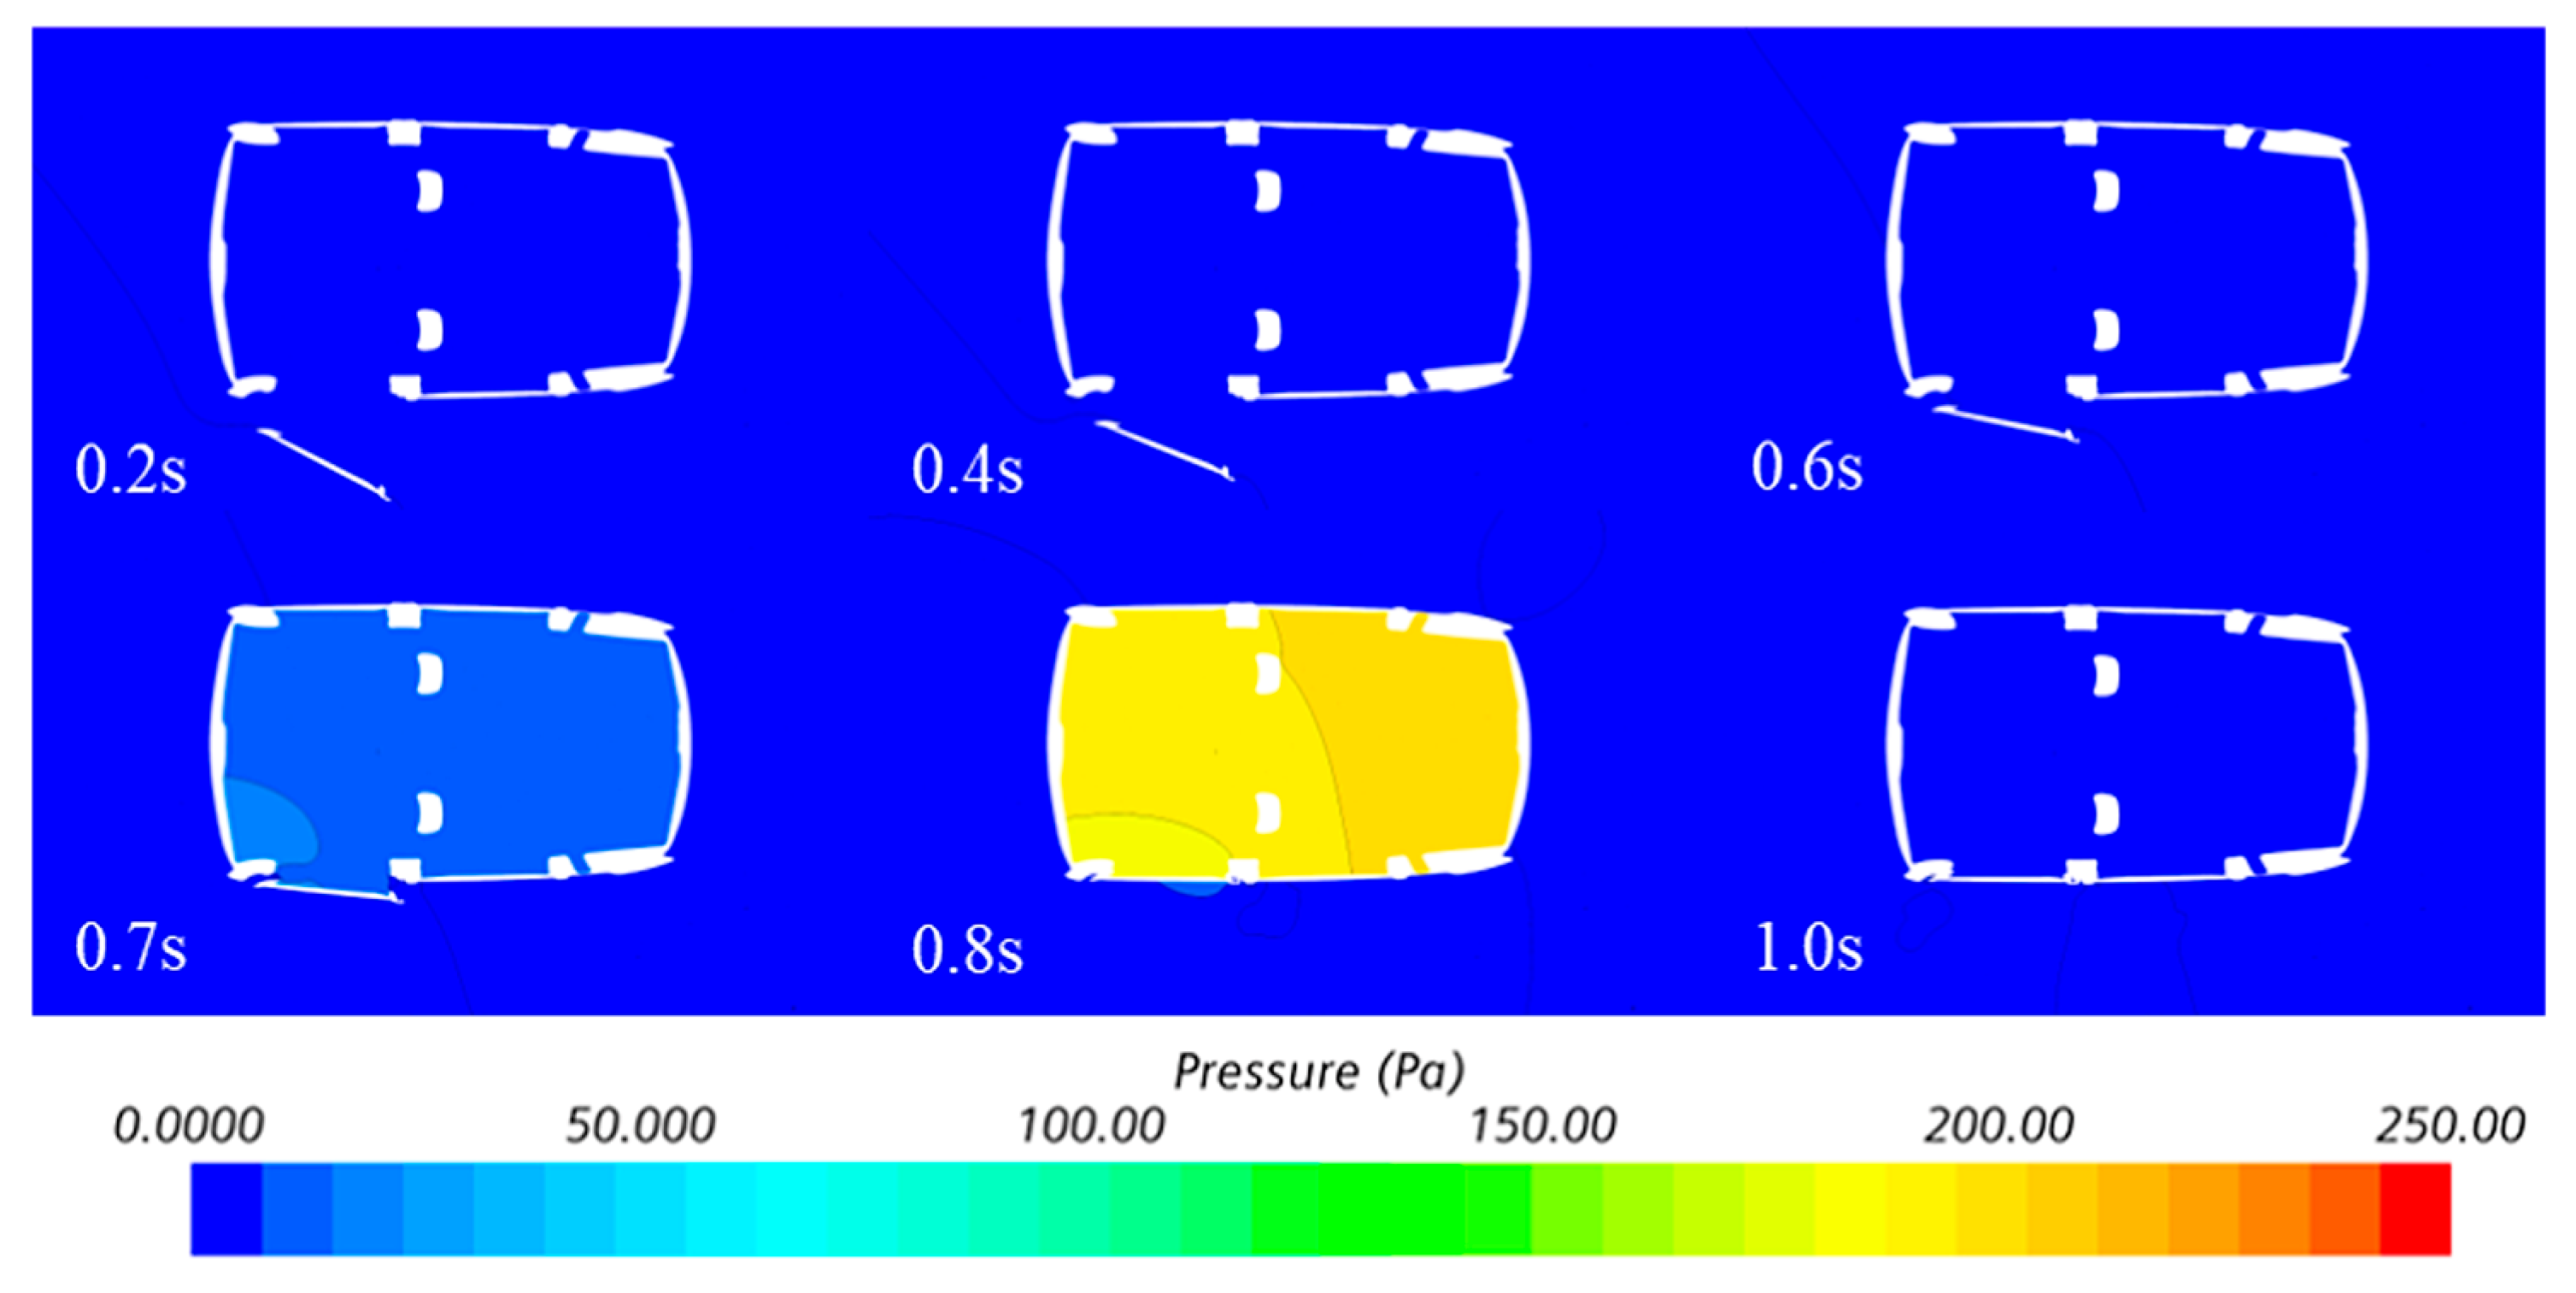
Figure 12 compares the pressure change rates, both of which exhibit positive and negative peaks. Since the human ear is more sensitive to pressure rise [19,20,21], only the positive peak of the pressure change rate is considered in this study. The key indicators: the simulated maximum pressure peak was 232.97 Pa (error 6.33% relative to the experimental value of 219.11 Pa), the pressure amplitude was 279.82 Pa (error 17.62% relative to 237.90 Pa), and the maximum pressure change rate was 5915 Pa/s (error 8.49% relative to 6464 Pa/s). The amplitude error is the largest, mainly due to the deviation in the negative pressure phase. Figure 13 and Figure 14 show the pressure and velocity contours at ear height, respectively. The pressure contours indicate that the pressure distribution in the compartment remains uniform and reaches its maximum near the moment of full closure. The velocity contours show that little air enters the compartment before 0.6 s and that the airflow increases after 0.6 s. After door closure (0.8 s), the wake in the door sweep path is isolated outside the vehicle body, and the interior airflow is completely separated from it, demonstrating that the zero-gap feature of the overset mesh effectively achieves seal closure [24].
In summary, the CFD model captures the overall pressure trend but still shows accuracy deficiencies, mainly due to the combined treatment of the controllable and uncontrolled leakage and the simplified valve modeling, which are addressed subsequently.

3.2. Effectiveness Analysis of Refined Simulation Methods

To address the accuracy deficiencies of the initial CFD simulation model, this study refined the simulation methods by improving the modeling of the uncontrollable leakage and the one-way flow characteristic of the pressure relief valve (detailed in Section 2.4). To evaluate the effectiveness of these refinements, the results from the improved CFD model were compared with experimental data.
Figure 15 compares the pressure curves before and after the separation modeling of the uncontrollable leakage, together with the experimental results. After adopting the dispersed circular-hole scheme, the pressure trend near the positive peak aligns better with the experiment. Before refinement, the maximum pressure peak was 232.97 Pa, with an error of 6.33% relative to the experimental value of 219.11 Pa. After refinement, the peak decreased to 222.16 Pa, reducing the error to 1.39%. The pressure amplitude error was reduced from 17.62% to 14.01%, and the maximum pressure change rate error was reduced from 8.49% to 4.02%. This demonstrates that the separation modeling of uncontrollable leakage effectively enhances simulation accuracy, particularly near the positive pressure peak.
Figure 16 compares the pressure curves before and after the one-way flow modeling of the pressure relief valve, together with the experimental results. The difference in the positive pressure phase between the pre- and post-refinement models is minimal, with the positive peak changing from 222.16 Pa to 222.94 Pa (a change in less than 1 Pa). However, a significant improvement is observed in the negative pressure phase: the negative peak decreased from −49.06 Pa (pre-refinement) to −21.29 Pa (post-refinement). The pressure fluctuations after the negative peak are also notably attenuated, more closely resembling the smooth recovery process seen in the experimental results. Figure 16 shows the comparison of pressure change rates. After 0.85 s, the curve from the refined model deviates clearly from the pre-refinement one, decreasing slowly and matching the experimental trend more closely. Table 1 summarizes the comparison of the CFD simulation results with the experimental data before and after the complete refinement.
The refined CFD model achieved a maximum pressure peak of 222.94 Pa, reducing the error from 6.33% to 1.75%. The pressure amplitude was 244.23 Pa, with the error decreasing from 17.62% to 2.66%. The maximum pressure change rate was 5945 Pa/s, with the error slightly improving from 8.49% to 8.03%. The most significant improvement is in the pressure amplitude accuracy, primarily attributed to the accurate simulation of the negative pressure phase enabled by the one-way pressure relief valve.
Through the separation modeling of the uncontrollable leakage and the one-way flow simulation of the pressure relief valve, the established CFD simulation model achieves high accuracy in key evaluation indicators such as the maximum pressure peak and pressure amplitude, meeting the requirements for subsequent influencing factor analysis and optimization studies.

3.3. Analysis of Influencing Factors on Ear Pressure

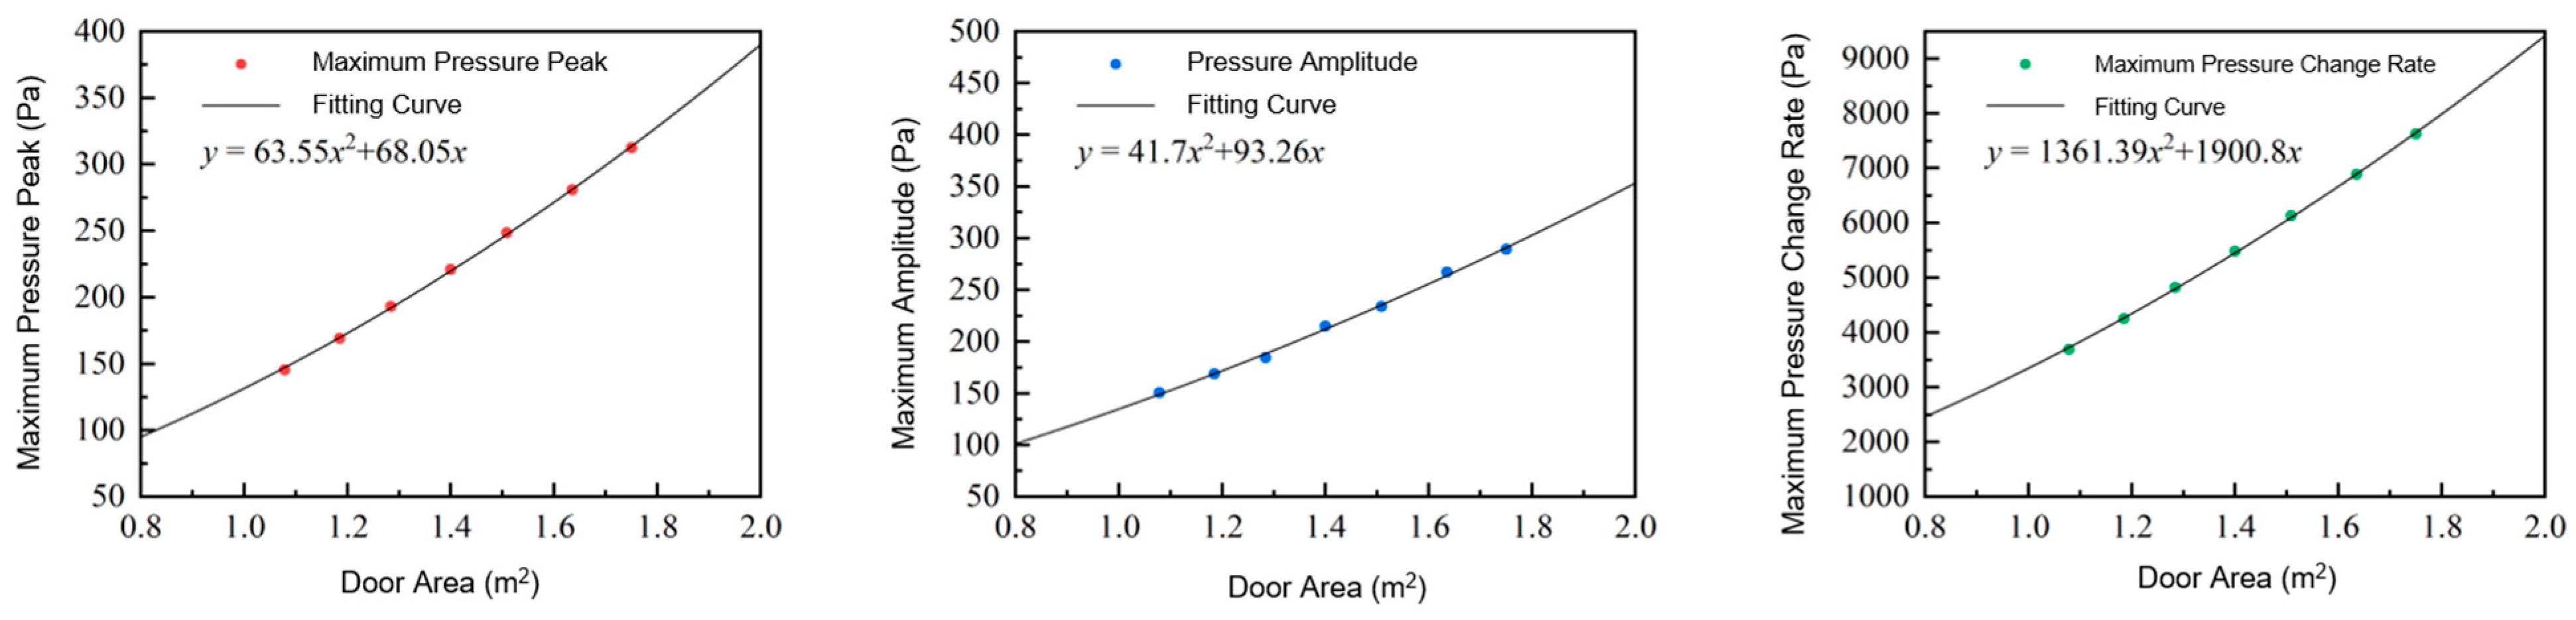
Using the refined CFD and theoretical models, the effects of door dimensions and passenger compartment volume were analyzed. Door size directly influences the pressure response. Maintaining an aspect ratio of 1.12, door lengths of 1.10–1.40 m correspond to areas of 1.078–1.750 m2. Figure 17 shows the fitted relationship curves: increasing the area raises the peak, amplitude, and change rate significantly. From 1.078 to 1.750 m2, the peak rises from 145.34 to 312.43 Pa (an increase of 115%), the amplitude from 178.19 to 345.84 Pa (94.1%), and the change rate from 4300 to 8860 Pa/s (106.0%). Zero-intercept quadratic polynomials were fitted; the peak and change-rate prediction errors were 3.78% and 1.43%, respectively, while the amplitude error was 8.95% (Table 2). With the area fixed at 1.4306 m2, the aspect ratio was varied from 1.0 to 1.2. The aspect ratio shows only a minor influence: from 1.0 to 1.2, the peak rises from 219.18 to 234.86 Pa (7.2%), the amplitude from 253.55 to 267.53 Pa (5.5%), and the change rate from 6322 to 6760 Pa/s (6.9%). The quadratic fits show peak and change-rate errors of 4.67% and 2.21%, respectively, while the amplitude error is 10.54% (Table 2). Therefore, priority should be given to controlling the door area during the design phase.
The passenger compartment volume also varies with the number of occupants. Volumes from empty (0) to full (5) are 3.0735, 3.0156, 2.9570, 2.9070, 2.8569, and 2.8153 m3. Table 3 shows the CFD simulation results: at full load, the volume is reduced by 8.40%; the maximum pressure peak increases from 222.94 to 238.09 Pa (6.8%), the pressure amplitude increases from 244.23 to 270.45 Pa (10.7%), and the maximum pressure change rate increases from 5945 to 6424 Pa/s (8.1%). This indicates that the effect of occupant number on the door-closure ear pressure is limited.
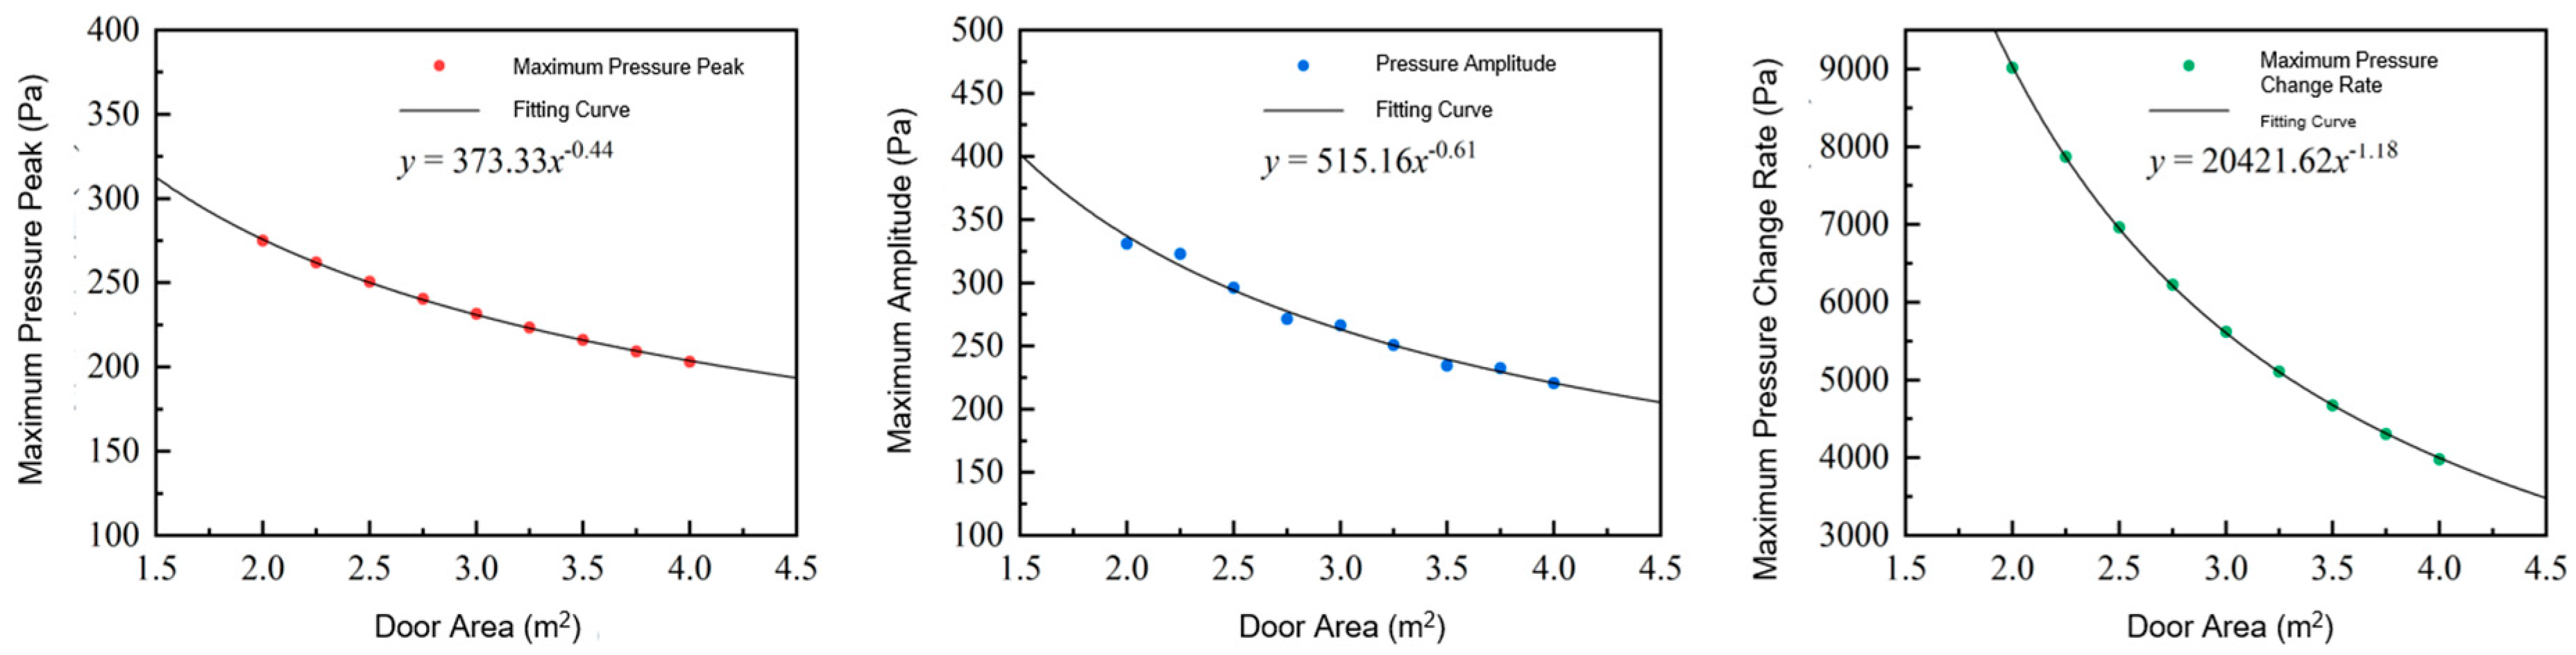
Extending the passenger compartment volume range to 2.0–4.0 m3 at 0.25 m3 intervals, Figure 18 shows that the ear pressure parameters decay inversely with increasing volume: as the volume increases from 2.0 to 4.0 m3, the maximum pressure peak decreases from 275.01 to 203.04 Pa (26.2%), the pressure amplitude decreases from 331.05 to 220.53 (33.4%), and the maximum pressure change rate decreases from 8255 to 5669 Pa/s (31.3%). This indicates that increasing the passenger compartment volume effectively reduces the door-closure ear pressure, providing a useful reference for vehicle design.

3.4. Effectiveness Analysis of Optimization Schemes

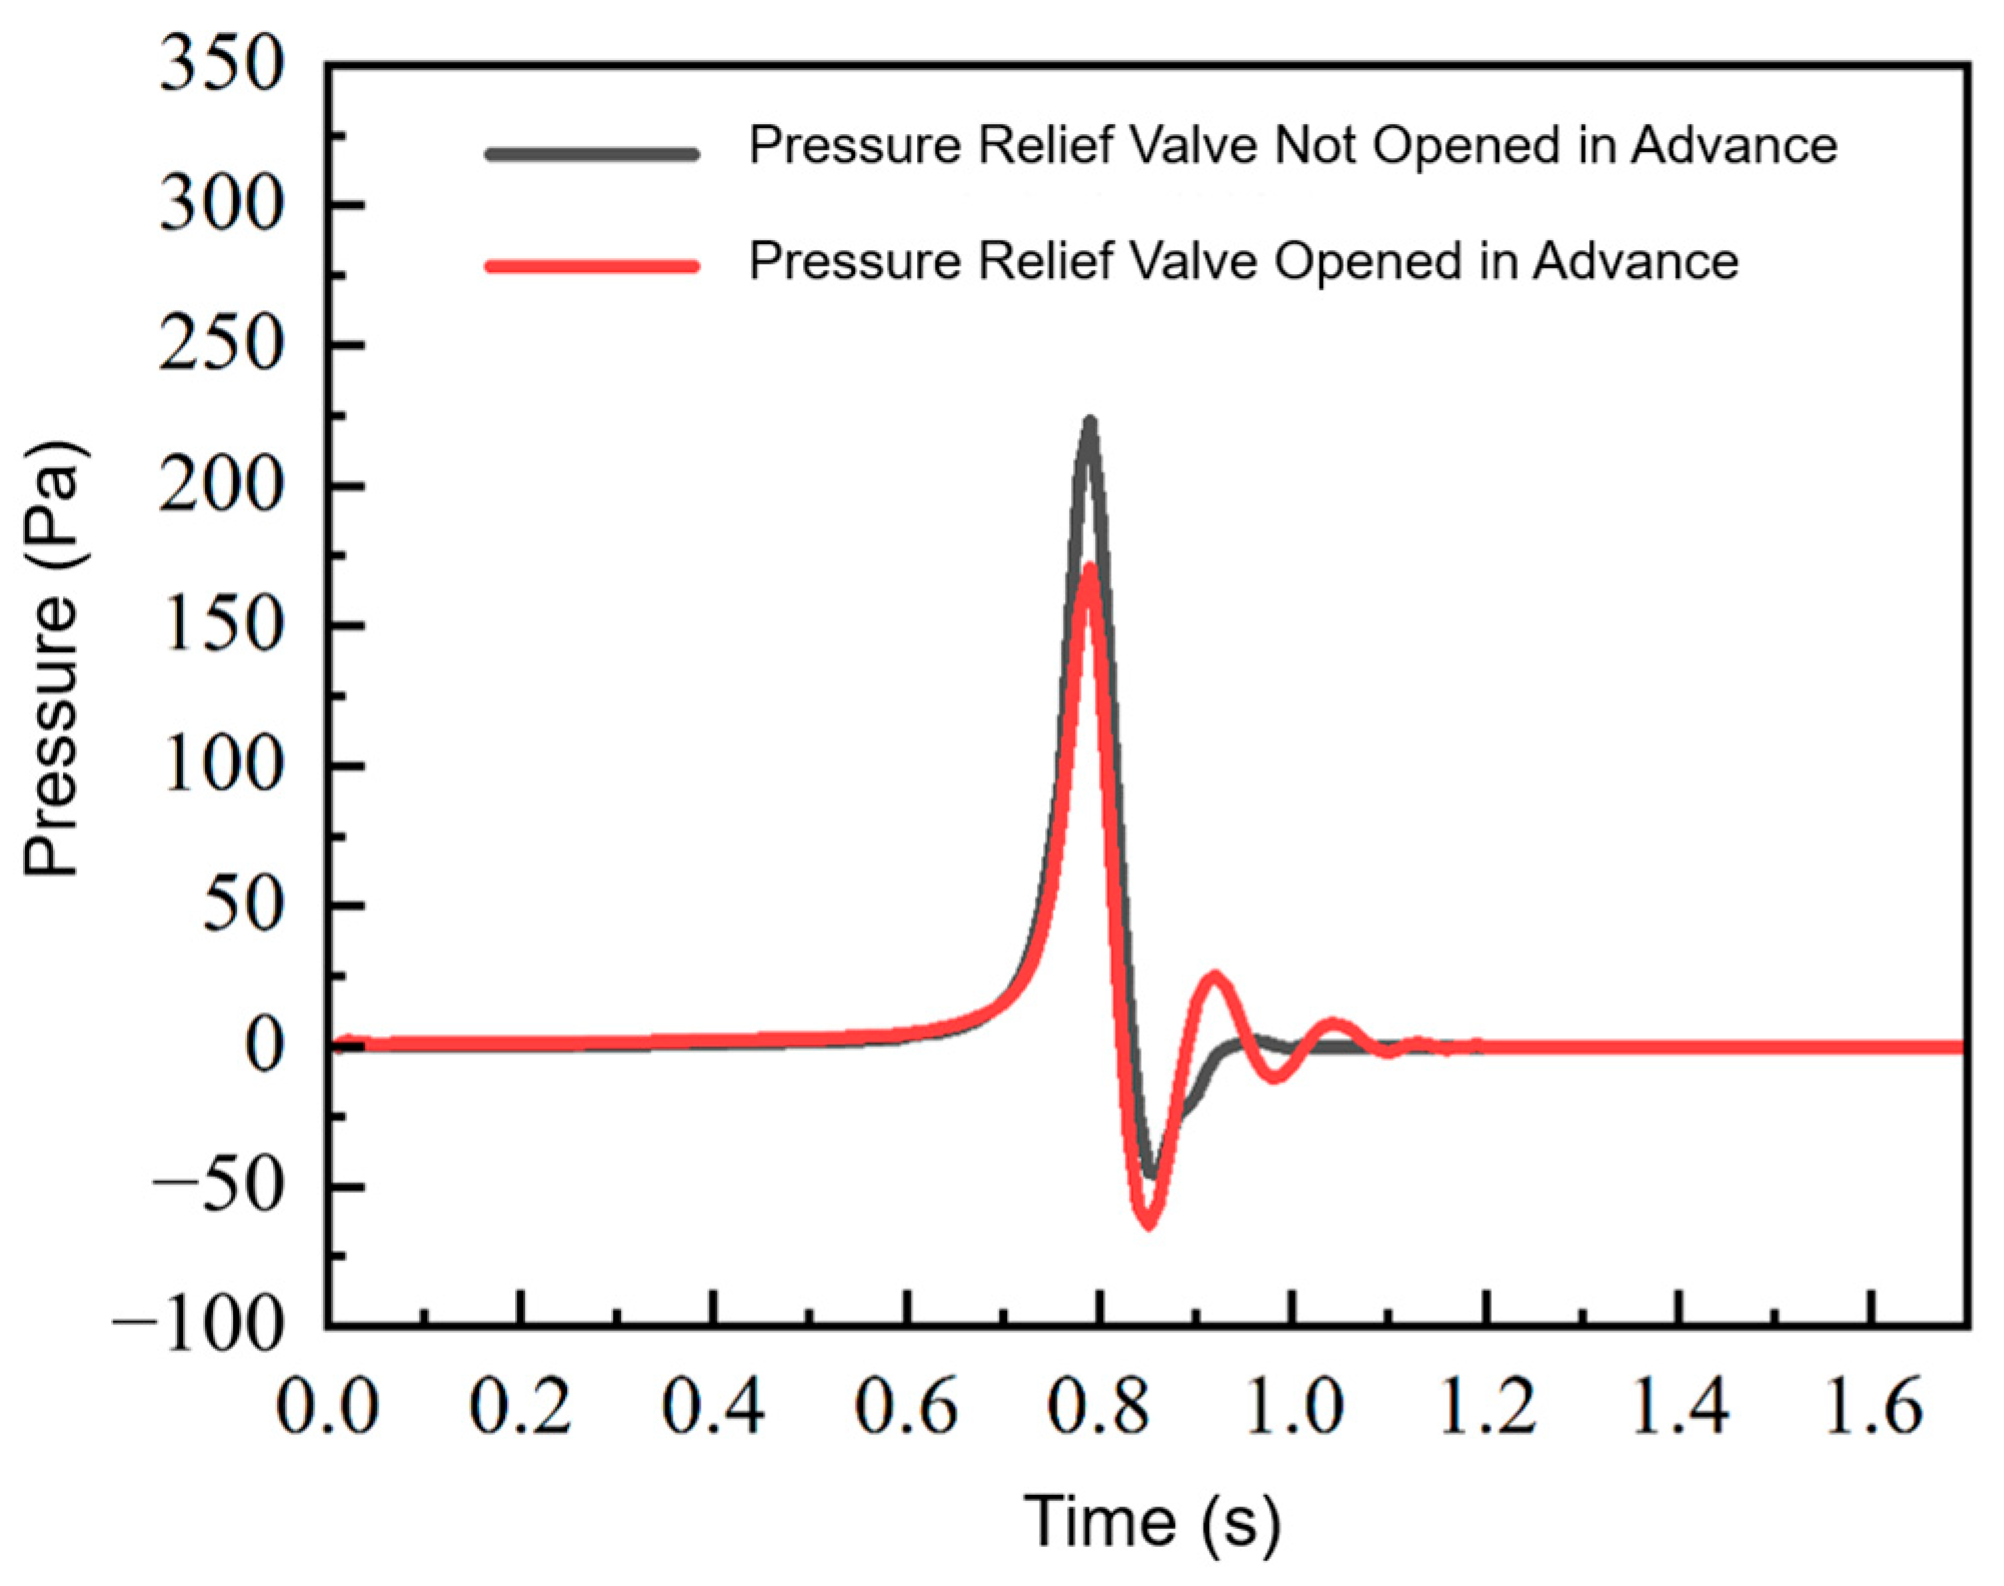
Optimization measures—early valve opening and fan addition—were evaluated. Figure 19 compares the pressure curves before and after early opening. Early opening significantly reduces the positive phase: the maximum pressure peak decreases from 223.29 to 170.96 Pa, a reduction of 23.44%; the pressure amplitude decreases from 268.81 to 234.47 Pa, a reduction of 12.77%; and the maximum pressure change rate decreases from 6182 to 3995 Pa/s, a reduction of 35.38%. However, keeping the valve constantly open exacerbates the negative pressure phase, with the negative peak reaching −63.51 Pa; closing the valve in time improves the negative peak to −32.55 Pa. Table 4 summarizes the optimization effects of the early-opening scheme with timely closure: compared with the experimental result, the maximum pressure peak is reduced by 21.98%, the pressure amplitude by 14.45%, and the maximum pressure change rate by 38.19%.
The fan addition effect reduces the maximum pressure peak from 223.29 to 212.61 Pa, a reduction of 4.78%; the pressure amplitude from 268.81 to 244.23 Pa, a reduction of 9.15%; and the maximum pressure change rate from 6182 to 5186 Pa/s, a reduction of 16.11%. The fan effect is mainly concentrated in the positive pressure phase.
From an engineering perspective, integrating an active fan with a pressure relief valve to mitigate door-closure pressure already has precedents in the patent literature: Ford proposed integrating a small supplemental blower with the body pressure relief valve (air extractor), in which the blower is activated upon detection of door opening and deactivated after a delay or a fixed time interval following door closure, thereby enhancing air extraction and reducing door-closure effort [33]; Deepal Automotive further proposed a scheme that regulates the relief valve opening according to the opening/closing states of components such as the doors and windows [34]. The technical route of state-triggered active ventilation and pressure relief therefore already has an engineering basis, and the active-fan strategy proposed in this study represents a direct extension of this route and is technically feasible. With respect to cost, the addition of an active fan introduces additional components, including the fan motor, control unit, and wiring harness; however, modern production vehicles are already commonly equipped with multiple electric fans and blowers for the air-conditioning and thermal-management systems, which could be integrated with the existing ventilation hardware. With respect to packaging, the pressure relief valve is typically located in the rear quarter-panel cavity, where space is limited; interference checks against the surrounding body structure, wiring harness, and interior trim are required, whereas for newly developed vehicle models, space for the fan and its control unit can be reserved at the design stage, and the additional weight is estimated to be less than 0.5 kg, with a negligible impact on the vehicle mass target. In summary, the active-fan strategy is technically feasible from an engineering standpoint.
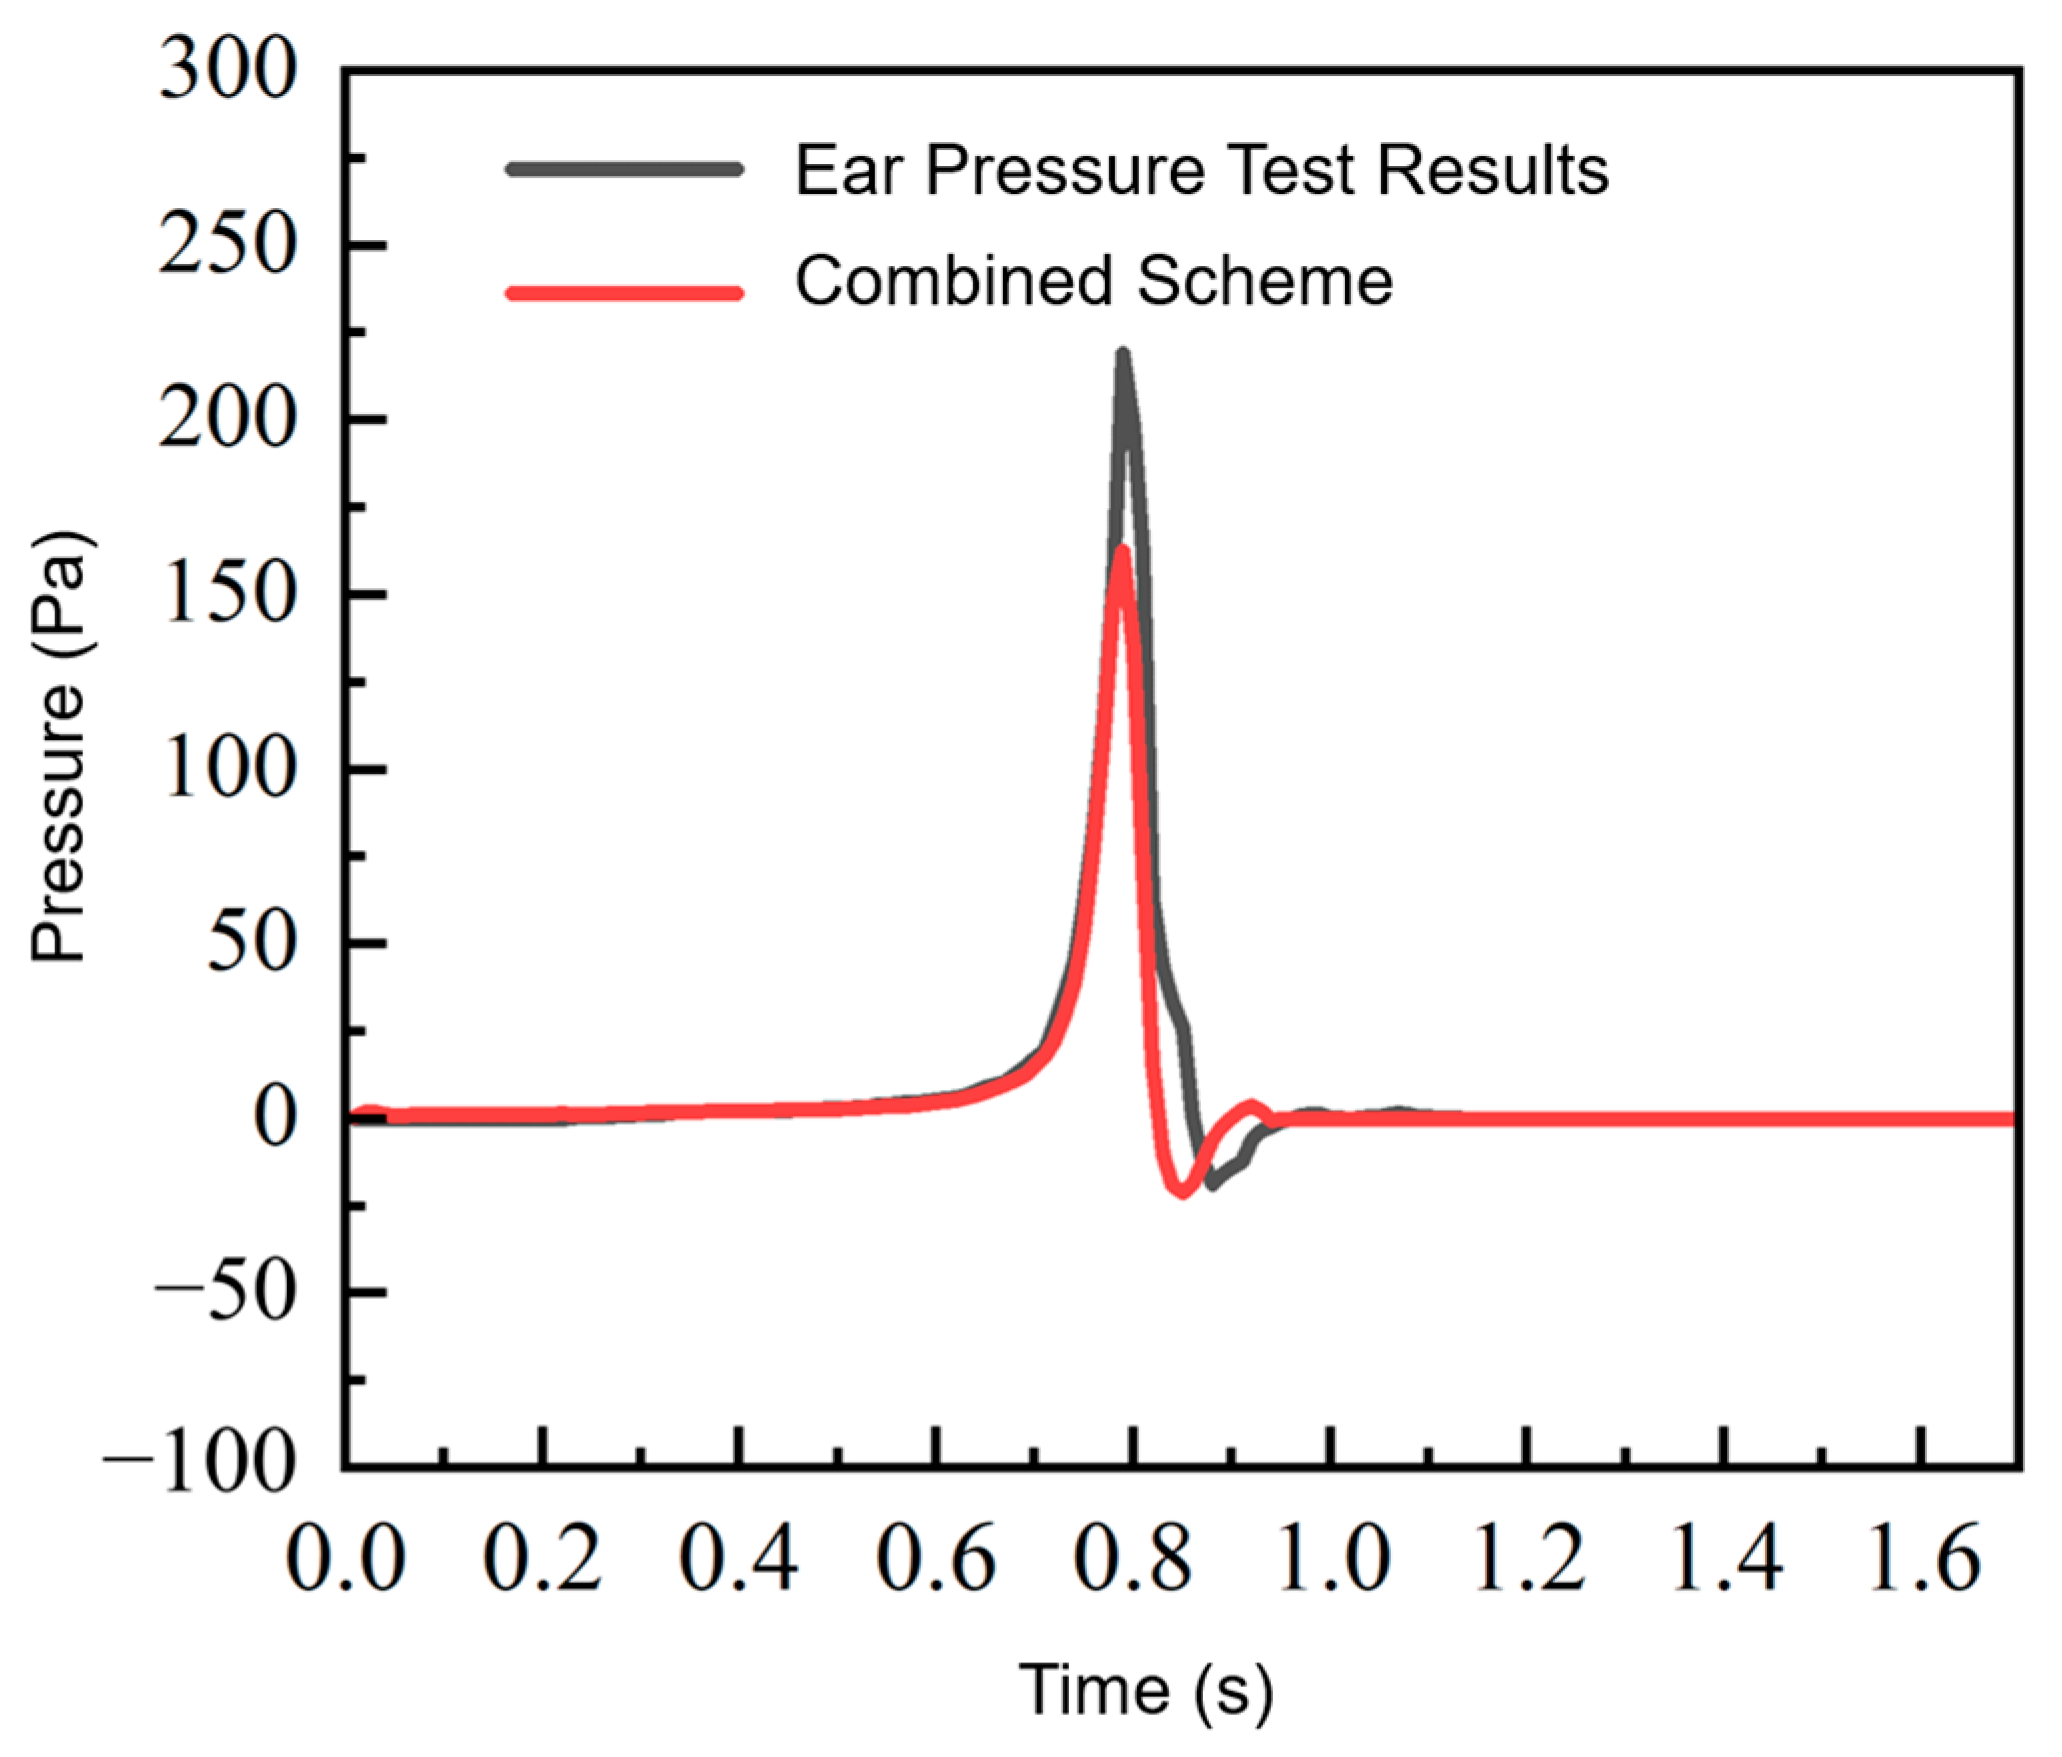
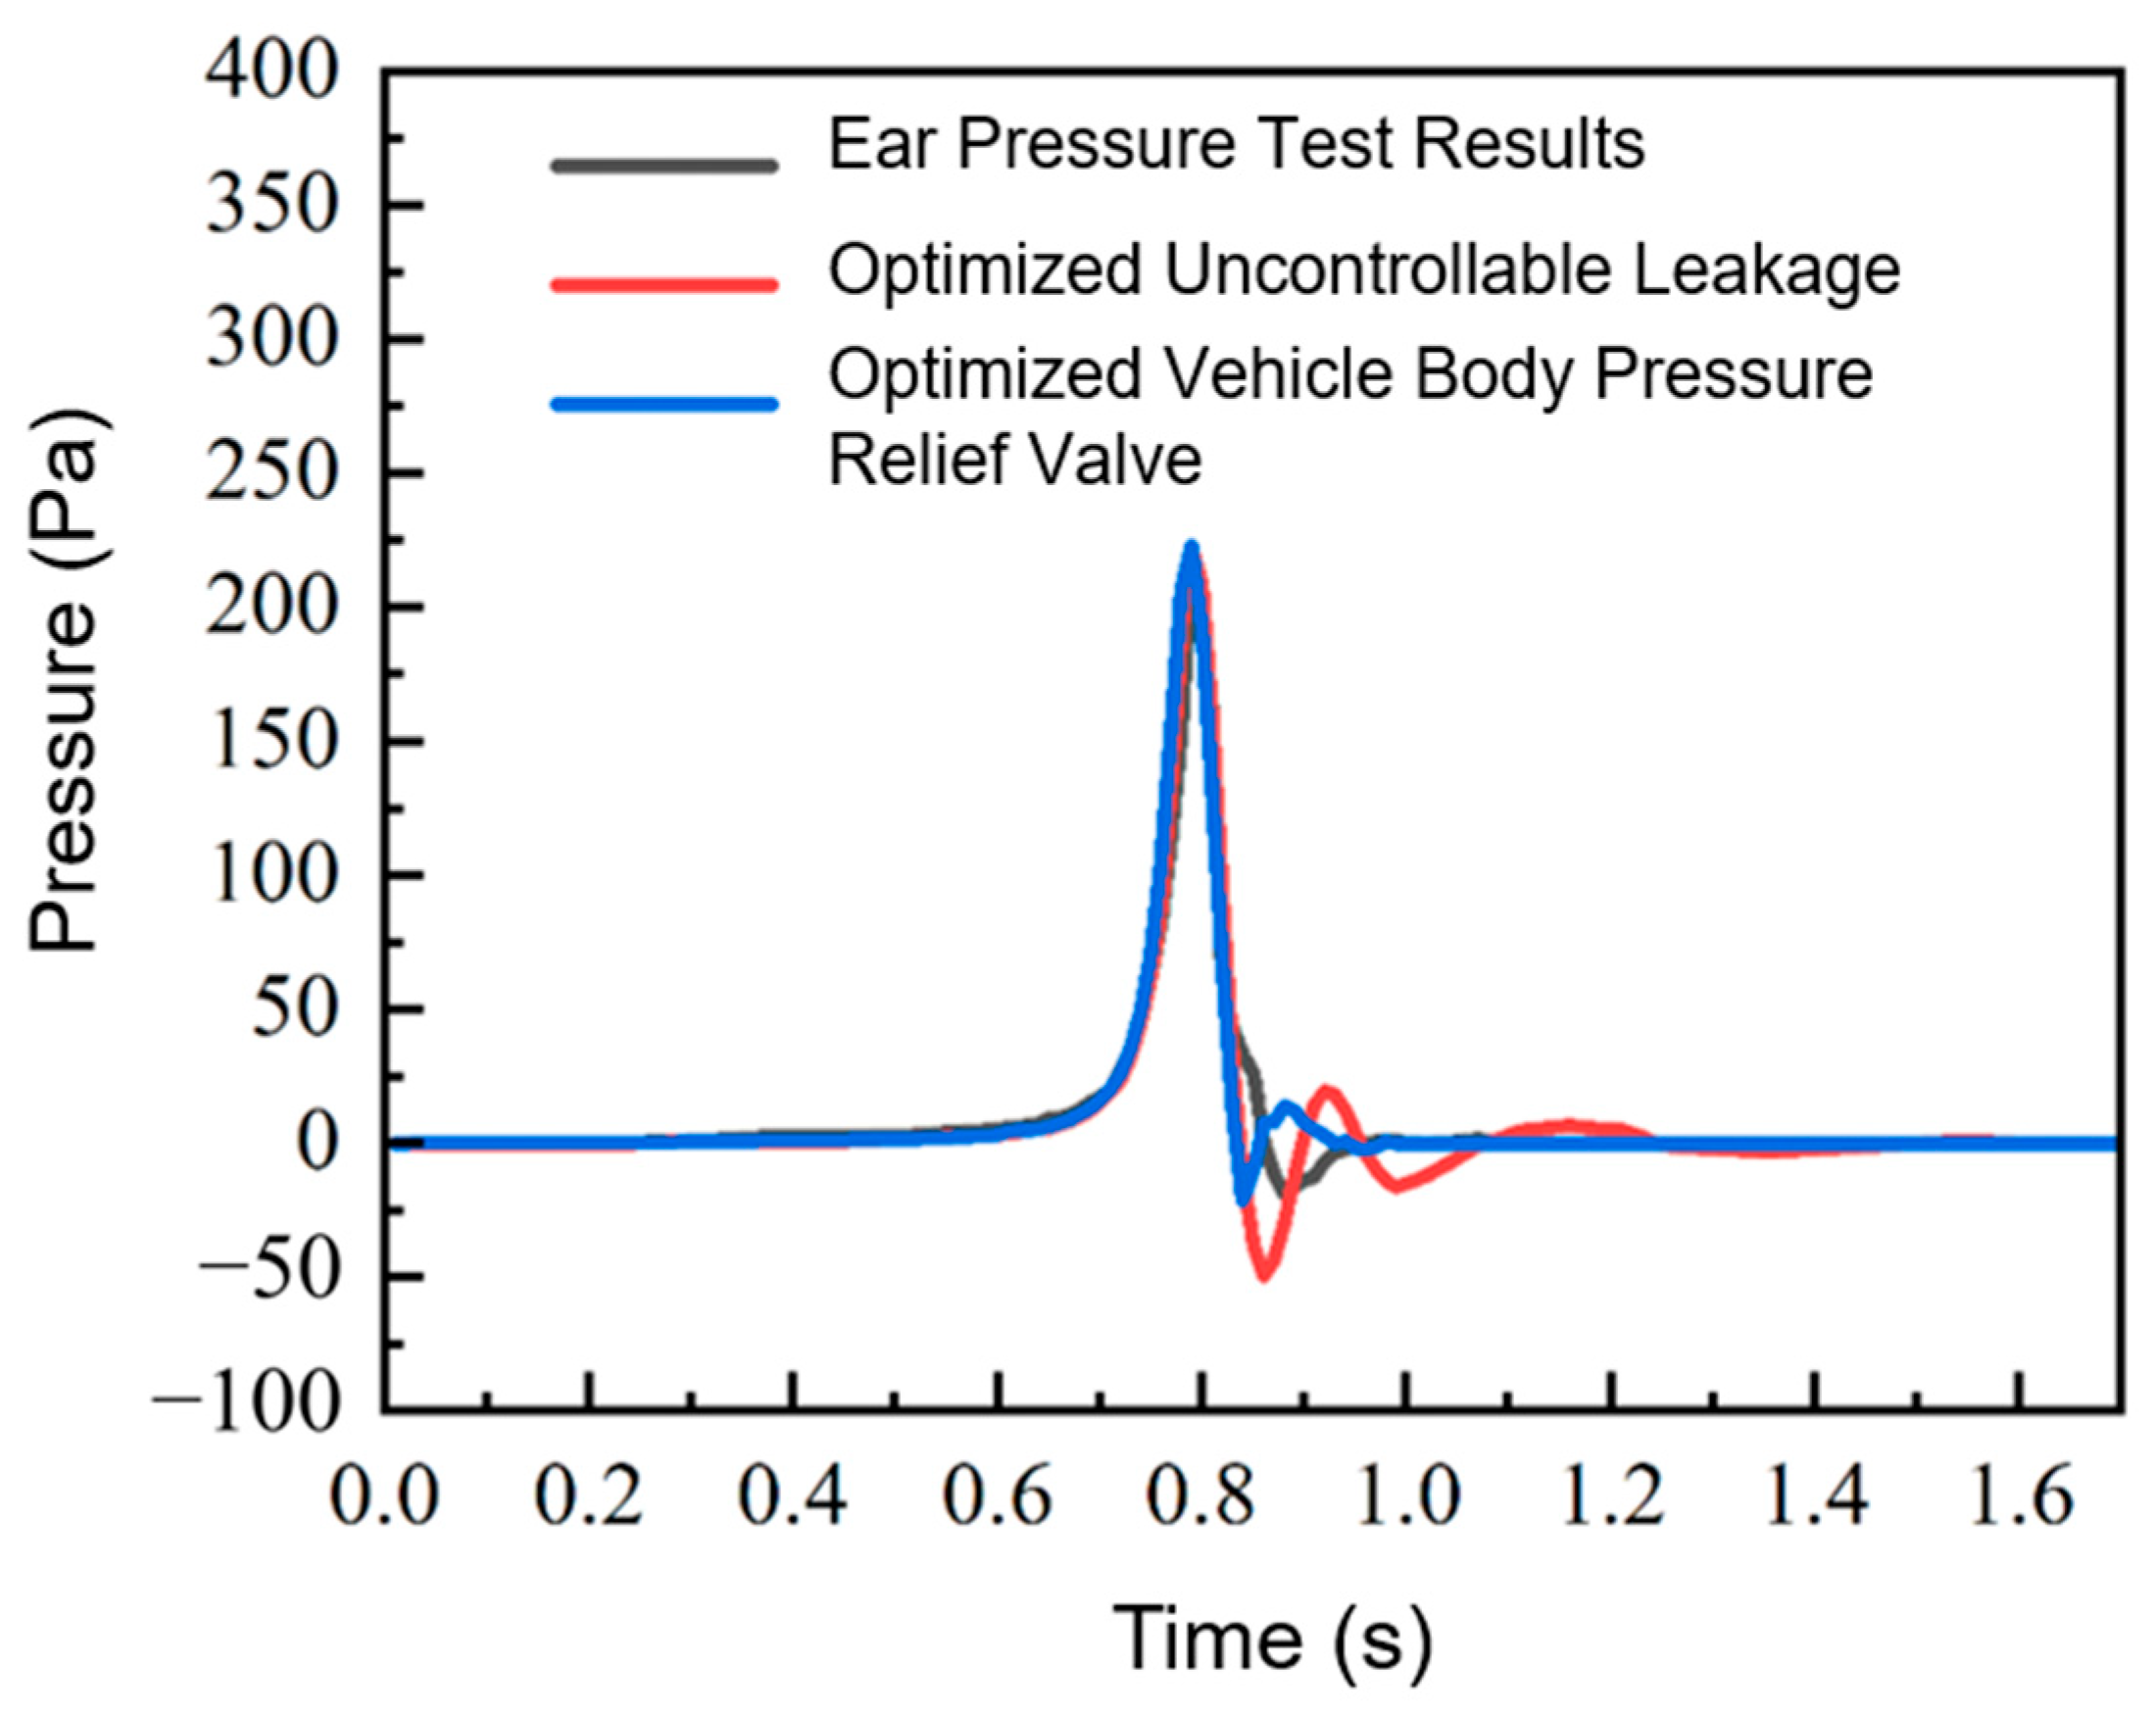
Figure 20 compares the pressure curves of the combined scheme (early opening + fan + timely closure) with the experimental result. The combined scheme performs well in the positive pressure phase: the maximum pressure peak decreases from 219.11 to 162.41 Pa, a reduction of 25.88%; the pressure amplitude decreases from 237.90 to 183.58 Pa, a reduction of 22.83%; and the maximum pressure change rate decreases from 6464 to 3799 Pa/s, a reduction of 41.23%. Moreover, it matches the experimental result well in the negative pressure phase. Table 4 compares the three schemes; the combined scheme achieves the best results among them.
In summary, early opening significantly improves the positive phase but requires timely closure; the fan has a limited effect; and the combined scheme yields substantial improvement across all indicators.

4. Conclusions

This paper addresses the issue of ear discomfort caused by the transient pressure rise in the passenger compartment during vehicle door closure. An integrated methodology combining experiments, high-precision CFD simulations, and theoretical modeling is proposed, with improvements made to leakage modeling. By separating the controllable and uncontrollable leakage and numerically realizing the one-way flow characteristic of the pressure relief valve, the simulation accuracy is significantly enhanced. Based on these improvements, the influence of door dimensions and passenger compartment volume on the ear pressure is revealed, and a combined optimization scheme involving early valve opening and fan addition is proposed, achieving significant optimization effectiveness.
  • A high-precision CFD model was established based on the point cloud data of the actual vehicle, fully retaining the airflow path consisting of the passenger compartment, rear body cavity, and trunk. The zero-gap feature of the overset mesh was used to accurately simulate seal compression. In parallel, a theoretical model for the door closure ear pressure was derived mathematically and refined by introducing flow hysteresis and fluctuation attenuation coefficients. After refinement, the theoretical model achieved a pressure amplitude prediction accuracy of 93.94% relative to the CFD results, with a solution time of less than one minute, making it suitable for rapid parametric analysis.
  • To address the accuracy limitation caused by the combined treatment of the controllable and uncontrollable leakage in existing CFD methods, a dispersed circular-hole scheme using eight holes was proposed to simulate the uncontrollable leakage, and the corresponding porous-media resistance coefficients were calibrated. This arrangement better reflects the distributed nature of the gaps and holes in an actual vehicle. After applying this scheme, the maximum pressure peak error was reduced from 6.33% to 1.39%, and the pressure amplitude error decreased from 17.62% to 14.01%, demonstrating a significant improvement in the simulation accuracy.
  • To overcome the limitation of the simplified porous-media representation in capturing the one-way flow characteristic of the pressure relief valve, the average pressure on the internal surface of the porous-media region was monitored during the solution process. A conditional switching criterion was implemented: the porous-medium parameters retained their fitted values when the pressure was greater than 0, simulating the open state, and were amplified by a factor of 1000 when the pressure was less than 0, simulating the closed state. After refinement, the negative pressure peak decreased from −49.06 Pa to −21.29 Pa, the pressure fluctuations were attenuated, and the final pressure amplitude error was reduced from 17.62% to 2.66%.
  • Using the refined CFD and theoretical models, the effects of door dimensions and passenger compartment volume on the ear pressure were analyzed. The door area showed a dominant influence (when the door area increases from 1.078 m2 to 1.750 m2, the maximum pressure peak rises from 145.34 Pa to 312.43 Pa, an increase of 115%), while the aspect ratio had a minor effect (a 7.2% increase when the aspect ratio rises from 1.0 to 1.2). The passenger compartment volume exhibited an inverse relationship with the ear pressure (a 26.2% reduction in peak when the volume increases from 2.0 to 4.0 m3). Based on these findings, a combined optimization scheme involving early opening of the pressure relief valve and the addition of an auxiliary fan was proposed. This scheme reduced the maximum pressure peak by 25.88%, the pressure amplitude by 22.83%, and the maximum pressure change rate by 41.23%, demonstrating significant optimization effectiveness.
In summary, this study provides effective tools for predicting and optimizing the door-closure ear pressure and offers actionable insights for cabin comfort design in automotive engineering.

5. Future Work

While the present study contributes to the experimental, numerical, and theoretical understanding of door-closure ear pressure, several directions remain open for future investigation.
First, the theoretical model developed herein is currently confined to baseline operating conditions; its applicability could be significantly extended by incorporating more complex real-world scenarios, such as variable closing speeds, simultaneous closure of multiple doors, and diverse window opening configurations, thereby enhancing its practical utility in engineering contexts.
Second, given the substantial influence of the distribution and morphology of the uncontrollable leakage on ear pressure responses, future efforts could focus on integrating more detailed body seal geometry data into the leakage model, enabling a more physically representative leakage model and further refinement of simulation fidelity.
Third, although the combined strategy of early opening of the pressure relief valve and the auxiliary fan has yielded encouraging results, the development of intelligent active-control valve systems equipped with real-time pressure sensing and feedback mechanisms is a promising direction toward adaptive cabin pressure regulation.
Fourth, as the current investigation is based on a single vehicle platform, comparative studies across multiple vehicle types are needed to establish generalized predictive models that account for variations in body style, sealing layouts, and valve configurations, thus facilitating ear pressure comfort assessment during the early design phase.
Fifth, given the intrinsic coupling between door-closure ear pressure and other cabin comfort attributes such as acoustic quality and thermal environment, the methodological framework established here could be extended to multi-physics analyses, thereby offering a more holistic theoretical foundation and computational toolkit for integrated cabin comfort design.
Sixth, the dimensions and position of the pressure relief valve adopted in this study were determined from the point cloud data of the actual vehicle, and the valve was placed at the same fixed location as in the real vehicle. Previous studies have indicated that the area and position of the pressure relief valve can influence occupant ear pressure comfort during door closure [30]. In the present study, however, these parameters were not treated as independent variables, and a sensitivity analysis of their effects was not conducted. In future research, parametric analyses will be performed for different pressure relief valve sizes and installation positions, and a systematic sensitivity analysis of the resistance amplification factor used to switch the valve between the open and closed states will also be carried out, with the aim of establishing more general engineering design guidelines.
Finally, the present study focuses primarily on the time-domain analysis of the door-closure ear pressure, using the maximum pressure peak, pressure amplitude, and pressure change rate as evaluation indicators, which have been shown to correlate well with subjective discomfort. Moreover, door-closure ear pressure is a quasi-static pressure transient whose frequency content is concentrated mainly in the extremely low-frequency range, differing fundamentally from audible sound in terms of physical mechanisms and perception pathways; the analysis is therefore conducted solely from the time-domain perspective. Nevertheless, a frequency-domain analysis, together with decibel-based quantification of the energy content of the pressure signal and its relationship with actual ear discomfort, would provide a more comprehensive evaluation. In future work, frequency-domain analysis of the door-closure ear pressure signal can be carried out under suitable test conditions and combined with subjective evaluation experiments to explore the relationships between frequency-domain characteristics and ear pressure comfort, thereby establishing a more comprehensive ear pressure comfort evaluation system.

Author Contributions

Conceptualization, H.L., W.Z., Z.L. and N.L.; methodology, H.L., W.Z. and Y.Z.; software, N.L.; validation, H.L., Z.L. and N.L.; formal analysis, H.L.; investigation, Z.L.; resources, N.L.; data curation, Z.L. and N.L.; writing—original draft preparation, W.Z. and Z.L.; writing—review and editing, H.L., N.L. and Y.Z.; visualization, W.Z., Z.L. and N.L.; supervision, H.L. and Y.Z.; project administration, Y.Z.; funding acquisition, Y.Z. All authors have read and agreed to the published version of the manuscript.

Funding

Guangxi Science and Technology Major Program (GuikeAA23062067); National Natural Science Foundation of China (Grant No. 52372355).

Data Availability Statement

The original contributions presented in this study are included in the article. Further inquiries can be directed to the corresponding author.

Acknowledgments

During the preparation of this manuscript, the authors used Deepseek V4 for the purposes of translation and English language editing. The authors have reviewed and edited the output and take full responsibility for the content of this publication.

Conflicts of Interest

The authors declare no conflicts of interest.

Abbreviations

The following abbreviations are used in this manuscript:
aViscous resistance coefficient [kg/(m3·s)]
AkFlow area [m2]
Ak1Interface area between Region 1 and atmosphere [m2]
Ak2Door frame interface area [m2]
Ak3Equivalent area of interface between Region 2 and atmosphere [m2]
bInertial resistance coefficient [kg/m4]
HDoor height [m]
k1Fluctuation attenuation coefficient
LDoor length [m]
pPressure [Pa]
p0Atmospheric pressure [Pa]
p1Pressure in Region 1 (door sweep region) [Pa]
p2Pressure in Region 2 (passenger compartment) [Pa]
tTime [s]
ΔtTime step [s]
VVolume [m3]
V1Volume of Region 1 (door sweep region) [m3]
V2Volume of Region 2 (passenger compartment) [m3]
vVelocity [m/s]
v1Velocity at Region 1-atmosphere interface [m/s]
v2Velocity at door frame interface [m/s]
v3Velocity at Region 2-atmosphere interface [m/s]
CFDComputational Fluid Dynamics
CFLCourant-Friedrichs-Lewy condition
MIRAMotor Industry Research Association model
NVHNoise, Vibration, Harshness
SCFMStandard Cubic Feet per Minute

References

  1. Yu, X.H.; Zhang, J.D. Automobile Interior Noise Generation Mechanism and Control Technology. Noise Vib. Control 2008, 5, 122–125. (In Chinese) [Google Scholar]
  2. Zhang, S.W.; Zhang, J.; Zhang, X.X.; Liu, H.Y.; Liu, C.G.; Zhu, G.N. Application of Locally Resonant Phononic Structure in Low-Frequency Sound Insulation of Automobile Carpet. Automot. Eng. 2016, 38, 362–367. [Google Scholar] [CrossRef]
  3. Luo, Z.H.; He, C.C.; Luo, Q.K.; Zhou, X.; Yan, F.; Gou, F. Study on Sound Insulation Performance of Dash Inner Insulator. J. Vib. Shock 2018, 37, 254–258. (In Chinese) [Google Scholar] [CrossRef]
  4. Lee, Y.L.; Hwang, S.H. Flow Characteristics in a Cabin during Door Closure. Proc. Inst. Mech. Eng. Part D J. Automob. Eng. 2011, 225, 318–327. [Google Scholar] [CrossRef] [Scilit]
  5. Chen, F. Analysis of Pressure during Door Closure Considering Vehicle Sealing. Master’s Thesis, Hunan University, Changsha, China, 2018. (In Chinese) [Google Scholar]
  6. Didyk, L.A.; Dirckx, J.J.J.; Bogdanov, V.B.; Lysenko, V.A.; Gorgo, Y.P. The Mechanical Reaction of the Pars Flaccida of the Eardrum to Rapid Air Pressure Oscillations Modeling Different Levels of Atmospheric Disturbances. Hear. Res. 2007, 223, 20–28. [Google Scholar] [CrossRef] [Scilit] [PubMed]
  7. Song, D.D. Analysis of 41 Cases of Repeated Middle Ear Barotrauma in Pilots. Chin. J. Tissue Eng. Res. 2014, z1, 230. (In Chinese) [Google Scholar]
  8. Jiang, D.Q.; Sun, J.J. Research Progress on Aural Barofunction in Fighter Pilots. Med. J. Chin. PLA 2009, 235–236. (In Chinese) [Google Scholar]
  9. Situ, Y.F. Philatelic Talk on Japanese Shinkansen. Philat. Panor. 2017, 8. (In Chinese) [Google Scholar]
  10. Carlotti, P. New Approach to Assess Aural Pressure Comfort in High-Speed Trains Running on German High-Speed Lines with Single-Track Tunnels. In Proceedings of the 17th International Symposium on Aerodynamics, Ventilation and Fire in Tunnels (ISAVFT 2017), Lyon, France, 13–15 September 2017; Available online: https://www.sudoc.fr/236577042 (accessed on 11 August 2026).
  11. Schwanitz, S.; Wittkowski, M.; Rolny, V.; Samel, C.; Basner, M. Continuous Assessments of Pressure Comfort on a Train—A Field-Laboratory Comparison. Appl. Ergon. 2013, 44, 11–17. [Google Scholar] [CrossRef] [Scilit] [PubMed]
  12. Suzuki, H. Factors Affecting Comfort Evaluation in Vehicles. Jpn. Psychol. Rev. 1999, 42, 63–85. (In Japanese) [Google Scholar]
  13. Mei, Y.G.; Zhou, Z.H.; Xu, J.L. Aerodynamics of High-Speed Railway Tunnels; Science Press: Beijing, China, 2009. (In Chinese) [Google Scholar]
  14. Wang, J.Y.; Wan, X.Y.; Wu, J. Transient Pressure Changes and Ride Comfort Criteria in High-Speed Railway Tunnels. Mod. Tunn. Technol. 2008, 319, 1–5. (In Chinese) [Google Scholar]
  15. Zítek, P.; Vyhlídal, T.; Simeunović, G.; Nováková, L.; Čížek, J. Novel Personalized and Humidified Air Supply for Airliner Passengers. Build. Environ. 2010, 45, 2345–2353. [Google Scholar] [CrossRef] [Scilit]
  16. Zheng, X.; Xie, L.; Ren, J. Stability Analysis and Optimization for Pneumatic Cabin Pressure Regulating System. J. Beijing Univ. Aeronaut. Astronaut. 2016, 42, 87–93. (In Chinese) [Google Scholar] [CrossRef]
  17. Zheng, X.; Xie, L.; Liu, L. Stability Analysis of Pneumatic Cabin Pressure Regulating System with Complex Nonlinear Characteristics. J. Control Sci. Eng. 2015, 2015, 705376. [Google Scholar] [CrossRef] [Scilit]
  18. Guan, X.F. Simulation Study on Expert Fuzzy Pre-Control Method for Aircraft Cabin Pressure. Comput. Appl. Softw. 2021, 38, 101–105, 203. (In Chinese) [Google Scholar]
  19. Su, R. Research on Simulation Technology of Ear Pressure During Door Closure for a Certain Vehicle Model. Master’s Thesis, Hebei University of Technology, Tianjin, China, 2020. (In Chinese) [Google Scholar]
  20. Jun, M.G.; Cao, Y.; Zhang, J.; Zhang, K.; Yang, G. The Analysis and Control of Aural Discomfort inside a Car at the Instant of Door Closing. In Proceedings of the WCX SAE World Congress Experience, Detroit, MI, USA, 21 April 2020; SAE Technical Paper; SAE International: Warrendale, PA, USA, 2020. [Google Scholar] [CrossRef] [Scilit]
  21. Tooya, H.; Aoki, K.; Ishida, T. Airflow Simulation Relative to Door-Closing Operability. In Proceedings of the International Body Engineering Conference & Exposition, Tokyo, Japan, 27 October 2003; SAE Technical Paper; SAE International: Warrendale, PA, USA, 2003. [Google Scholar] [CrossRef] [Scilit]
  22. Zhang, R. Study on Human Ear Pressure Comfort During Door Closure. Master’s Thesis, Jilin University, Changchun, China, 2014. (In Chinese) [Google Scholar]
  23. Li, S.; Chen, C.; Hu, X.; Cao, J. Numerical Simulation Research on Pressure during Door Closure of Commercial Vehicle. SAE Int. J. Commer. Veh. 2017, 10, 453–459. [Google Scholar] [CrossRef] [Scilit]
  24. Walzel, B.; Hirz, M.; Brunner, H.; Kreutzer, N. Robot-based fast charging of electric vehicles. In Proceedings of the WCX SAE World Congress Experience, Detroit, MI, United States, 9 April 2019; SAE Technical Paper; SAE International: Warrendale, PA, USA, 2019. [Google Scholar] [CrossRef] [Scilit]
  25. Pang, L.Y. Research and Control of the Influence of Door Closure on Human Ear Comfort. Master’s Thesis, Jilin University, Changchun, China, 2018. (In Chinese) [Google Scholar]
  26. Geng, C.C.; Kang, M.; Xu, Z.M.; Jiang, W.Q.; Su, L.L. Research and Optimization of Influencing Factors on Ear Pressure Sensation during Car Door Closure. J. Chongqing Univ. Technol. (Nat. Sci.) 2021, 35, 67–73. (In Chinese) [Google Scholar]
  27. Unadkat, S.B.; Pandurangan, V.; Selvan, V. Optimization of Air Extraction Path for Superior Customer Comfort While Door Closing Event of a Sports Utility Vehicle (SUV). In Proceedings of the WCX SAE World Congress Experience, Detroit, MI, USA, 18 April 2023; SAE Technical Paper; SAE International: Warrendale, PA, USA, 2003. [Google Scholar] [CrossRef] [Scilit]
  28. Yang, Z.; Li, L.; Li, L.; Niu, Z.; Liu, Z.; Yang, S.; Liao, S.; Wen, Y.; Wang, Z. CFD-Based Optimization of Dynamic Pressure Relief and Associated Simulation Methodology for Vehicle Door Closure. Sci. Rep. 2025, 15, 19758. [Google Scholar] [CrossRef] [Scilit] [PubMed]
  29. Ren, L. Numerical Analysis of the Influence of Air Flow Channel on Ear Pressure during Door Closure. Vibroeng. Procedia 2024, 55, 150–155. [Google Scholar] [CrossRef] [Scilit]
  30. Su, L.; Pan, Z.; Qiu, W.; Li, H.; Peng, T.; Zhang, Z. Study on Empirical Model and CFD about Pressure Rising in Cab during Door Closure. Vibroeng. Procedia 2022, 46, 73–79. [Google Scholar] [CrossRef] [Scilit]
  31. Jagtap, R.; Parida, S.; Pimpalkhare, N.; Khanna, S.; Pasunurthi, S.S. Air Bind Energy Prediction in Door Closing Event through CFD and Its Accuracy Validation with Physical Test. In Proceedings of the WCX SAE World Congress Experience, Detroit, MI, USA, 14 April 2026; SAE Technical Paper; SAE International: Warrendale, PA, USA, 2026. [Google Scholar] [CrossRef] [Scilit]
  32. Anthonysamy, B.; Nandi, A.; Bhowal, P.; Chaudhari, V.V. Passenger Car Door Closing Effort Prediction Using Virtual Simulation and Validation. In Proceedings of the SAE WCX Digital Summit, Virtual, 13 April 2021; SAE Technical Paper; SAE International: Warrendale, PA, USA, 2021. [Google Scholar] [CrossRef] [Scilit]
  33. Marleau, J.A., Jr.; Wade, D.A. Active Pressure Relief Valve for Automotive Air Extractor. U.S. Patent Application US20130072101A1, 21 March 2013. [Google Scholar]
  34. Zheng, J.; Su, Z.; Yan, Q.; Chen, Z. Pressure Relief Valve Control Method, Device, Equipment, Readable Storage Medium and Vehicle. China Patent CN120096283A, 6 June 2025. (In Chinese) [Google Scholar]
Figure 1. Schematic diagram of the body pressure relief valve flow test.
Vehicles 08 00211 g001
Figure 2. Vehicle airtightness test.
Vehicles 08 00211 g002
Figure 3. Cabin pressure measurement during door closure.
Vehicles 08 00211 g003
Figure 4. Structural view of the airflow channel.
Vehicles 08 00211 g004
Figure 5. Mesh independence verification results for the whole-vehicle airtightness simulation.
Vehicles 08 00211 g005
Figure 6. Background and overset regions.
Vehicles 08 00211 g006
Figure 7. Theoretical model for door-closure ear pressure.
Vehicles 08 00211 g007
Figure 8. Whole-vehicle airtightness simulation models for the two schemes.
Vehicles 08 00211 g008
Figure 9. (a) Comparison of the two schemes with the experimental pressure results. (b) Details of the peak pressure results.
Vehicles 08 00211 g009
Figure 10. (a) Comparison of the two schemes with the experimental pressure change rate. (b) Details of the peak pressure results.
Vehicles 08 00211 g010
Figure 11. Pressure variation curves in the passenger compartment during door closure (simulation vs. experiment).
Vehicles 08 00211 g011
Figure 12. Pressure change rate curves (simulation vs. experiment).
Vehicles 08 00211 g012
Figure 13. Pressure contours at ear height cross-section at different time instants during door closure.
Vehicles 08 00211 g013
Figure 14. Velocity contours at ear height cross-section at different time instants during door closure.
Vehicles 08 00211 g014
Figure 15. Comparison of pressure curves before and after uncontrollable leakage separation.
Vehicles 08 00211 g015
Figure 16. Comparison of pressure curves before and after one-way flow modeling of the pressure relief valve.
Vehicles 08 00211 g016
Figure 17. Fitted relationship curves between door area and ear pressure evaluation parameters.
Vehicles 08 00211 g017
Figure 18. Fitted relationship curves between passenger compartment volume and ear pressure evaluation parameters.
Vehicles 08 00211 g018
Figure 19. Comparison of pressure curves before and after early opening of the pressure relief valve.
Vehicles 08 00211 g019
Figure 20. Comparison of pressure curves between the combined optimization scheme and experimental result.
Vehicles 08 00211 g020
Table 1. Comprehensive comparison of CFD model validation and refinement effects.
Model StatusMaximum Pressure Peak (Pa)Peak ErrorPressure Amplitude (Pa)Amplitude ErrorMaximum Pressure Change Rate (Pa/s)Change Rate Error
Experimental result219.11237.906464
Initial model232.976.33%279.8217.62%59158.49%
After leakage separation222.161.39%271.2214.01%62044.02%
After valve refinement222.941.75%244.232.66%59458.03%
Table 2. Comprehensive validation of influencing factor fitting results.
Influencing FactorParameter ValueMaximum Pressure Peak (Pa)Pressure
Amplitude (Pa)
Maximum Pressure Change Rate (Pa/s)Fitting
Error
Door area (Experimental)1.4306 m2219.11237.906464
Door area (Fitted)1.4306 m2227.41259.196556.543.78%a
Door aspect ratio (Experimental)1.12219.11237.906464
Door aspect ratio (Fitted)1.12229.36262.986607.564.67%a
Passenger compartment volume (Experimental)3.0735 m3219.11237.906464
Passenger compartment volume (Fitted)3.0735 m3227.79259.716576.283.96%a
Table 3. CFD simulation results for different numbers of occupants.
Number of
Occupants
Passenger Compartment Volume (m3)Maximum
Pressure Peak (Pa)
Pressure
Amplitude (Pa)
Maximum Pressure Change Rate (Pa/s)
03.0735222.94244.235945
13.0156230.98256.456068.20
22.9570233.00263.626140.75
32.9070234.76264.976204.10
42.8569236.56269.146368.97
52.8153238.09270.456423.93
Table 4. Comprehensive comparison of optimization scheme effectiveness.
Optimization SchemeMaximum Pressure Peak (Pa)Peak
Reduction
Pressure
Amplitude (Pa)
Amplitude ReductionMaximum Pressure Change Rate (Pa/s)Change Rate
Reduction
Experimental result (baseline)219.11237.906464
Early valve opening170.9621.98%203.5114.45%3994.9638.19%
Fan addition212.614.78%244.239.15%518616.11%
Combined scheme162.4125.88%183.5822.83%3799.0541.23%
Disclaimer/Publisher’s Note: The statements, opinions and data contained in all publications are solely those of the individual author(s) and contributor(s) and not of MDPI and/or the editor(s). MDPI and/or the editor(s) disclaim responsibility for any injury to people or property resulting from any ideas, methods, instructions or products referred to in the content.