Article

Electric Vehicles to Support Grid Needs: Evidence from a Medium-Sized City

Department of Enterprise Engineering “Mario Lucertini”, University of Rome Tor Vergata, via del Politecnico 1, 00133 Rome, Italy
*
Author to whom correspondence should be addressed.
Vehicles 2026, 8(2), 30; https://doi.org/10.3390/vehicles8020030
Submission received: 10 October 2025 / Revised: 21 January 2026 / Accepted: 28 January 2026 / Published: 4 February 2026

Abstract

Vehicle-to-grid (V2G) services are gaining attention as a strategy to integrate electric vehicles (EVs) into sustainable energy systems. Although technological aspects have been widely studied, methodologies for identifying optimal V2G hubs and forecasting the energy available for grid transfer remain limited. This study introduces a data-driven approach to (i) identify the optimal V2G region based on the aggregated parking duration using floating car data (FCD; collected from GPS-enabled vehicles); (ii) estimate the surplus battery capacity of electric vehicles in that region; and (iii) forecast the energy transferable to the grid. The methodology applies spatial k-means clustering to define candidate zones, computes aggregated parking durations, and selects the optimal hub. The surplus energy is estimated considering the daily mobility needs of users, 20% reserve, and transfer rates. For forecasting, autoregressive integrated moving average (ARIMA) and long short-term memory (LSTM) models are implemented and compared. The proposed methodology has been applied to a real case study, using 58 days of FCD observations. The empirical findings of this study show the goodness of the proposed methodology, and the opportunity offered V2G technology to support the sustainable use of energy. The ARIMA model demonstrated a superior forecasting performance with an RMSE of 52.424, MAE of 36.05, and MAPE of 12.98%, outperforming LSTM (RMSE of 99.09, MAE of 80.351, and MAPE of 53.20%) under the current data conditions. The results of this study suggest that for supporting grid needs of a medium-sized city, V2G plays a key role, and at the current status of the EV penetration, the use of FCD and predictive approaches is paramount for making an informed decision.

1. Introduction

Globally, the transport sector experienced the most pronounced increase in emissions in 2023, with a surge of almost 240 Mt [1]. Similarly, the transport sector in the European Union (EU) continues to be one of the largest contributors of CO2 emissions and it is the only sector with emissions still above 1990 levels by a wide margin of 26% higher than 1990 as of 2022 [2]. In 2019, the transport sector in Italy accounted for 30.7% of total CO2 emissions, with road transport responsible for 92.6% of these emissions [3].
According to the Paris Agreement, the transport sector is expected to provide the second-largest CO2 savings, accounting for around 20% of the cumulative savings between 2014 and 2050 [4]. Electric vehicles (EVs) are expected to play a key role in reducing transport-related emissions. Recent trends across several countries confirm a growing shift toward electric mobility, driven by strong policy initiatives and incentives. The EU has planned to introduce 30 million zero-emission vehicles by 2030, aiming to reduce transport-related emissions by 55% by 2030 and 90% by 2050 [5]. Furthermore, the EU aims to halve the use of fuel-powered cars in urban transport by 2030 and completely eliminate them in cities by 2050 [6]. As a result of the multiple policy incentives in the EU, the member states alone have registered 2.4 million new electric vehicles in 2023, an increment of 2 million over the total number [7]. According to the Automobile Club of Italy (ACI), Italy recorded a significant increase in new electric vehicle registrations, reaching 65,811 units in 2023, which represents a 34.34% growth compared to 2022 [8,9]. Based on projections from the Italian Integrated National Energy and Climate Plan, by 2030, the country roads are expected to host six million additional electrically powered vehicles, including approximately four million fully electric vehicles [10,11].
However, the introduction of such a large number of electric vehicles into the transportation sector is expected to create an imbalance between demand and supply of electricity [3,12]. For example, according to the global energy review, the sector has seen an increase of more than 8% in electricity consumption in 2024 as a result of the ongoing adoption of electric vehicles [13,14]. The incentives towards decarbonization and, particularly, the policy initiative that favors the transition to electric mobility are among other additional factors that contribute to the boosting demand for electricity [15]. This implies that the electric demand associated with the growing penetration of EVs is likely to present a serious threat to the energy sector, i.e., the power grids. The integration of a high number of EVs technically challenges grid stability due to the uncertainty of time and location charging demand. As Cui et al. [16] indicated, the entry of a large number of EVs is associated with load issues over space and time, which affects the security and economic operation of the grids. The increased charging demand resulting from the rapid growth of electric vehicles is expected to create several challenges for power systems, including voltage fluctuations, higher transmission losses, phase imbalance, peak load issues, and potential overloads on lines and transformers [17,18,19]. On the other hand, the increased number of EVs added with the technological advancements in the area of vehicle-to-grid (V2G) is considered an opportunity for the power system. In essence, V2G is a technology of computer-controlled bidirectional connection between the EV and the power grid to allow the grid to receive power from the vehicle and provide power to the vehicle [20,21].
Several studies have emphasized the importance of integrating V2G technology to leverage the growing penetration of EVs. Reported benefits for the power grid include reducing peak load stress, improving the integration of intermittent renewable sources, providing reactive power compensation, preventing branch congestion, supporting auxiliary frequency regulation, aiding in fault recovery, lowering long-term electricity supply costs, and delivering overall economic gains [22,23,24,25]. EV users can also benefit from economic incentives ranging from a reduced cost of car purchase to lower energy bills [23,26,27]. In aggregated configurations, such as parking lots, parking lot owners can gain an economic advantage from collective decisions made on behalf of aggregated EVs [28,29]. The advantages of V2G are broadly summarized in four perspectives in the review paper by Sovacool et al. [30], who summarize the advantages of V2G across four key dimensions: technical, improving grid efficiency; economic, through increased utility profits; socio-environmental, by reducing greenhouse gas emissions and enabling renewable integration; and behavioral, by lowering costs and promoting environmental benefits. Additionally, the fact that most vehicles remain unused for more than 95% of the time offers a significant opportunity for integrating EVs with power grids [31,32,33].
Despite the advantages that V2G brings to the environmental sustainability of the transportation sector, several challenges remain. Spatial and temporal uncertainty of demand and EV arrivals, high-level investment, battery degradation, and societal issues remain challenges to the success of V2G [10,22,31]. Some studies have noted the energy loss associated with the spatial placement of V2G on the feeder lines [32]. Research also suggests a placement that ensures accessibility for charging and discharging and covers multiple aspects, including the feasibility and efficiency of the system [10]. In that regard, one of the strategies to address the spatial and temporal uncertainty of the demand and arrival times of the EV grid is to identify the spatial and temporal pattern using real-time floating car data (FCD).
Despite significant research on V2G technology, several critical gaps hinder its practical implementation. Methodologies for identifying optimal V2G locations using real-world vehicle movement data remain underexplored, as most studies rely on simulated scenarios or land-use-based assumptions. Similarly, forecasting techniques tailored to V2G surplus energy are limited, particularly those that incorporate vehicle-specific constraints such as daily mobility requirements and battery reserve levels.
With that in mind, this study employs FCD collected from GPS-enabled vehicles to identify regions with aggregated V2G capacity, estimate the excess battery capacity of candidate EVs, and forecast the energy potential available for grid transfer in Viterbo (Italy). The proposed methodology applies spatial clustering of k-means to define candidate V2G regions, which serve as boundaries to calculate the parking duration, energy capacity, and related parameters. Based on these computations, the next-day energy potential is forecasted using autoregressive integrated moving average (ARIMA) and long short-term memory (LSTM) models. This study contributes to the literature by providing empirical evidence on the use of FCD to locate the aggregated V2G potential and by addressing the temporal dimension of V2G availability using real-world data. Overall, the findings offer insights into spatio-temporal uncertainties in V2G parking and strengthen the limited body of research on this topic. The remainder of the paper is structured as follows. Section 2 presents a review of the related literature. Section 3 describes the methodology implemented in this study. Section 4 presents the analysis of the case, the settings and data used, the findings, and the discussion of the results. In Section 5, conclusions and limitations are drawn.

2. Literature Review

Environmental challenges, combined with policy initiatives, have strongly incentivized the transition toward vehicle electrification. As a result, EVs are rapidly gaining market share, and this trend is expected to continue for decades. However, the surge in EV adoption poses significant challenges, including potential power grid instability and the risk of creating a suboptimal cycle in the transport sector if electricity generation remains heavily reliant on fossil fuels. Evidence from previous studies indicates that a 10–20% penetration of EVs can lead to unacceptable voltage deviations and thermal overload, while a 40% penetration, especially with localized single-phase charging, can cause severe voltage imbalance and critical grid conditions [34]. To reduce the situation and turn the surge of EVs into opportunities, V2G technology is highly recommended by academics in the arena [21,22,23,30,35,36,37,38].
The V2G technology was first introduced by Kempton et al. [20] as a strategy to mitigate air pollution, replace fossil-fuel-based peak power plants, and provide storage for intermittent renewable energy sources. Kempton et al. [20] identified three direct benefits of V2G in reducing emissions. Firstly, V2G is a source of value for the owner of an electric vehicle and creates an incentive mechanism to adopt low-polluting vehicles. Secondly, V2G replaces peak and emergency power generated from fossil fuel plants. Third, it responds to the challenge of storing intermittent renewable energy. In addition to the direct benefit of emission reduction, V2G is known to have economic returns for EV owners, power distribution systems, and aggregators [12,26,35,36,37,38]. Its technical feasibility has also been attested in previous works [27,39,40].
Sovacool et al. [30] offer one of the most comprehensive syntheses of V2G benefits, categorizing them in four perspectives. From a technical point of view, V2G improves the efficiency of the grid. Economically, it increases utility revenues. Socio-environmentally, it reduces greenhouse gas emissions and supports the integration of renewable resources. Behaviorally, it helps users save money while contributing to environmental sustainability. An additional advantage lies in the fact that most vehicles remain unused for more than 95% of the time, making them ideal candidates for integration with power grids [31,39,41]. Although the benefits of V2G are well-documented and supported by both theoretical models and pilot-scale demonstrations, most studies remain optimistic and largely descriptive. Few of them address critical trade-offs, such as battery degradation costs under real-world cycling conditions, or consider users’ acceptance rates, which surveys indicate that they can fall below 50%. This optimism introduces a positive bias that underestimates deployment barriers. Furthermore, most benefit analyses rely on simulation studies based on idealized assumptions regarding EV availability and grid conditions. Empirical validation remains limited, particularly in terms of spatial–temporal coordination between actual EV parking patterns and grid demand fluctuations. These gaps underscore the opportunity to use approaches based on FCD to capture real-world vehicle behavior.
In the practical application of V2G, the concept of using an aggregated battery capacity is cherished, as opposed to using a single vehicle. Previous studies highlighted the importance of aggregating vehicles in harnessing the energy obtained from vehicles in the V2G system [28,29,42,43,44]. Other works have also exploited parking lots as aggregation points and revealed the viability of such facilities to ensure the profitability of V2G [25,40,45]. Comi and Elnour [46] suggest that predetermined sites such as campuses/workplaces offer predictable parking behaviors, facilitating V2G service implementation.
As evident by the studies mentioned, effective V2G implementation hinges on understanding where and how long vehicles park, with the ever-increasing demand for parking associated with multiple transportation issues such as congestion and accidents, likely to be triggered as the number of electric vehicles increases in certain land-use classes. The problem worsens when land use is characterized by high parking attraction and the spatio-temporal pattern of energy demand and the accumulation pattern of vehicles match [44]. This signifies the surrogate implication of V2G in future parking plans and the need to understand the spatio-temporal parking choice pattern [47] and associated influence factors including parking generation [48], parking price [49], parking duration [50], and parking accumulation [51] for the effectiveness of V2G implementation.
In addition to that, knowing the available energy capacity of the chosen land use plays a vital role in the implementation of V2G. Thus, awareness of the available energy capacity ahead of time is an important parameter in ensuring a seamless response of the V2G facility in responding to grid demand. In that regard, the implementation of a time-series analysis of available energy as obtained from floating car data can shed light on the overall aspects of V2G implementation and help the V2G service meet the demand of the electric grid. Among the available time-series forecasting models, the Auto Regressive Integrated Moving Average (ARIMA) is widely implemented in grid load forecasting [52,53]. However, ARIMA has a drawback in dealing with non-linear time series, and in such situations, the performance of long short-term memory (LSTM) has been shown to be better [54,55].
To summarize the reviewed literature, Table 1 presents a comparative overview of representative V2G studies, detailing their data sources, methodological approaches, key limitations, and contributions to the field. It also illustrates how the present study addresses these gaps through a fully data-driven framework that takes advantage of large-scale FCD for optimal hub identification, parking duration maximization as a proxy for participation, and empirical benchmarking of ARIMA and LSTM models under realistic medium-sized city scenarios. This analysis highlights the novelty of the proposed methodology, which is elaborated in more detail in Section 3.

3. Materials and Methods

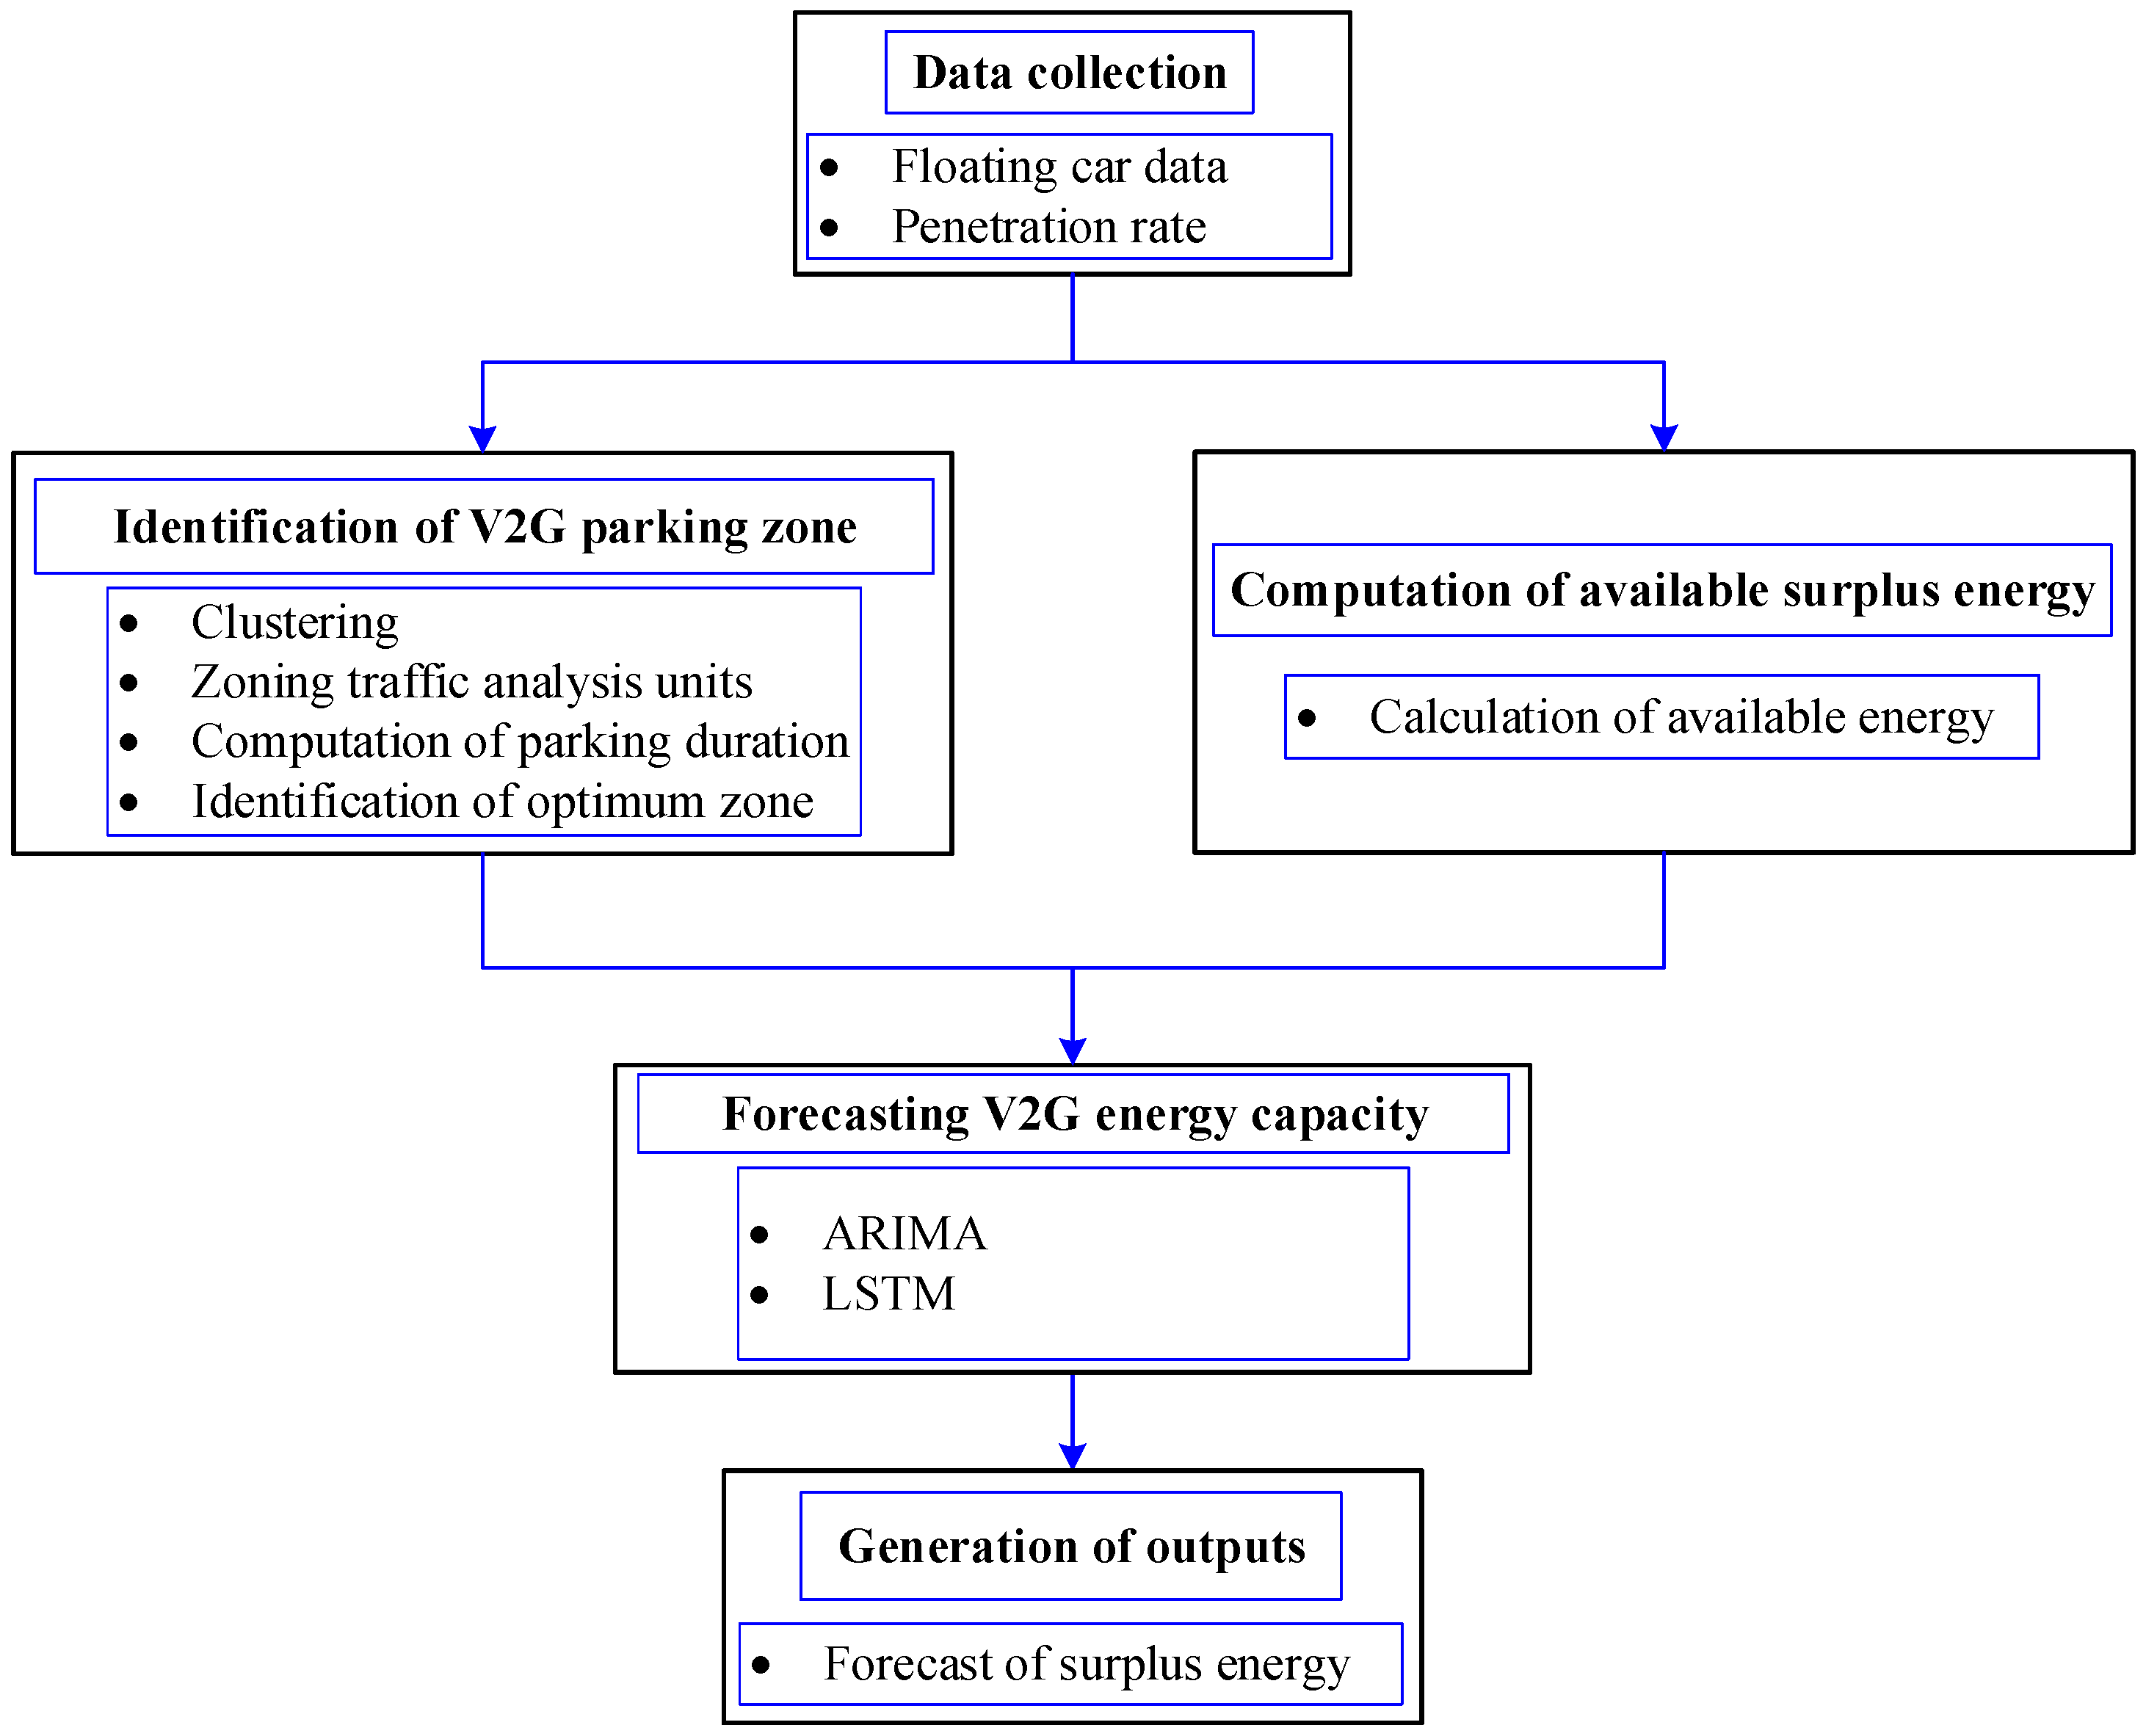
The work presented here gives a method to identify a parking zone with a maximum parking duration and forecasts of the surplus energy available for V2G based on ARIMA and LSTM models. As indicated in the review of [56], the location of parking spaces significantly influences the efficiency of the V2G system. This implies the importance of finding locations of high aggregation of vehicles in the effective deployment of the V2G system. In light of that, this study uses FCD to identify the location of higher aggregation and longer parking duration in Viterbo City. With that in focus, this study proposes the workflow indicated in Figure 1.

3.1. Identification of the Optimal V2G Parking Location

To identify optimal V2G regions, a data-driven approach has been developed by integrating FCD with administrative census boundaries. Following the methodology validated in [57], the study area was segmented to ensure spatial homogeneity. K-means clustering has been applied to group parking events based on spatial proximity, with the number of clusters (k) being determined using the elbow method to balance the within-cluster sum of squares (WCSS) against computational efficiency. This process yielded distinct clusters representing the main parking attractors. These clusters were then spatially joined with ISTAT (Italian National Institute of Statistics) census sections, reducing noise and allowing for correlation between parking behavior and land-use variables (e.g., residential vs. commercial density).
The optimal V2G zone has been selected by evaluating the aggregated parking duration and vehicle density within each cluster. The parking duration of each vehicle parked in the zones is calculated using the FCD data by applying Equation (1), and the duration is aggregated to select the optimal zone.
p d i = d t i + 1 a t i
where
  • p d i is the parking duration of the i-th trip of the vehicle in consideration in the V2G parking zone;
  • d t i + 1 is the departure time of the (i + 1)-th trip from the sequence of trips made by the vehicle on a given day in the V2G parking zone;
  • a t i is the arrival time of the i-th trip from the sequence of trips made by the vehicle on a given day in the V2G parking zone.
Figure 1. Workflow of the study methodology.
Vehicles 08 00030 g001

3.2. Computation of Available Surplus Energy

At this stage, the present study computes the available energy capacity and the surplus energy that would be harnessed from the selected zone for the V2G implementation. The actual surplus energy in this study represents the energy left unused after all the energy required for the daily routine is deducted along with the contingency plan from the battery capacity. The strategy proposed in this study is consistent with the previous work by Comi et al. [58]. Table 2 lists the variables used in the calculation of energy.
Therefore, the actual surplus energy transferred to the grid from a given vehicle (vi), E a s , v i , is calculated as follows:
E a s , v i = min ( E e p d , v i , E t , v i )
where
  • E e p d , v i = Q r , v i p d i is the total energy expected to be transferred to the grid during the entire parking duration;
  • E t , v i is the theoretical energy remaining after all daily travel activities including the consumed energy and the maximum of required or emergency energy.
The total energy expected to be transferred to the grid during the entire parking duration, E e p d , v i , is calculated as follows:
E e p d , v i = Q r , v i p d i
with Q r , v i the energy transfer rate from the vehicle vi to the grid.
The theoretical energy remaining after all daily travel activities, E t , v i , is estimated as follows:
E t , v i =   Q v i E c , v i max ( E r , v i , E c o n t , v i ) E c , v i = L b p , v i E p k m , v i E r , v i = L a p , v i E p k m , v i E c o n t , v i = 0.2 Q v i
where
  • Q v i is the battery capacity of a given vehicle vi;
  • E c , v i is the energy consumed by the vehicle for the entire distance traveled up to parking;
  • L b p , v i is the total distance traveled before parking in the V2G parking zone;
  • E p k m , v i is the rate of energy consumption of the vehicle per kilometer of distance traveled;
  • E r , v i is the energy required for the remaining travel activity after parking, including the trip home;
  • L a p , v i is the total distance traveled after parking;
  • E c o n t , v i is the energy required as a reserve or emergency, taken in the study as 20% of the particular vehicle battery capacity.

3.3. Surplus Energy Forecasts with ARIMA and LSTM

Upon computing the historical time series of surplus available energy using the methodology described in the previous section, the subsequent step involves forecasting future availability to ensure grid stability and inform operational planning. To this end, two distinct modeling paradigms have been implemented: the AutoRegressive Integrated Moving Average (ARIMA) model and the Long Short-Term Memory (LSTM) neural network. The adoption of these paradigms enables a rigorous comparison between classical statistical approaches and contemporary deep learning architectures. ARIMA has been selected for its proven reliability in short-term forecasting and its ability to explicitly capture the linear seasonality patterns inherent in daily charging behaviors [59,60]. Conversely, LSTM has been used to overcome the limitations of linear models; as a recurrent neural network, it is well-suited to learning complex, non-linear temporal dependencies and stochastic fluctuations in energy data that ARIMA may fail to represent adequately [54,61].
The ARIMA model combines autoregressive (AR) and moving average (MA) components with differencing (I) to address non-stationarity in time-series data. The general stationary form of the ARIMA ( p , d , q ) model, as formulated by Hyndman and Athanasopoulos [60], is expressed as follows:
E a s , v i , t d = c + ϕ 1 y t 1 + + ϕ p y t p + θ 1 ε t 1 + + θ q ε t q + ε t
where
  • E a s , v i , t d is the stationary time series of surplus energy at time t;
  • c is the constant or mean of the differenced time series;
  • ϕ 1 ϕ p represent the autoregressive parameters;
  • θ 1 θ q represent the moving average parameters;
  • ε t is the white noise error term at time t;
  •   p , d , q represent the order of the autoregressive part, the degree of differencing, and the order of the moving average, respectively.
However, in order to ensure comparability in terms of parameters and forecasts, the LSTM model is also implemented in this study. The LSTM used here is one of the variants of neural network models with the ability to recall previous values for future use [61]. As Kong et al. [54] indicated, LSTM can establish a temporal correlation between previous information and current circumstances, which makes it ideal for energy forecasting problems. For equating LSTM, this study used the typical formulation of Zhang et al. [62]. Hence, if the three multiplicative gates are defined as a forget gate ( f t ), input gate (it), and output gate ( o t ), with a hidden state ( h t ), and the recurrent unit for maintaining long-term memory is a memory state ( S t ). Then, for the gates activated from a current state ( x t ) and a hidden layer from the previous state, the new memory state ( S t ) at the time t is formed by its self-connected recurrent edge S t 1 and G t with corresponding parameters W and b , as indicated in Equation (6):
f t = σ ( W f [ x t , h t 1 ] + b f ) i t = σ ( W i [ x t , h t 1 ] + b i ) o t = σ ( W o [ x t , h t 1 ] + b o ) G t = σ ( W g [ x t , h t 1 ] + b g ) S t = f t S t 1 + i t G t h t = o t tanh ( S t )
where
  • and denote pointwise and matrix multiplication, respectively;
  • σ is a sigmoid function;
  • W f , W i , W o , W g are weight matrices of f t , i t , o t , G t ;
  • b f , b i , b o , b g are the corresponding bias terms.

4. Case Analysis

The methodology described in Section 3 has been applied to Viterbo, an Italian medium-sized city in the Latium region (Central Italy). Each methodological stage is detailed below, with a critical assessment of its strengths and limitations. This structured evaluation provides transparency on the robustness of the proposed framework and its applicability to real-world urban contexts.

4.1. Settings, Study Area, and Data

During the calculation of the parking duration, the following assumptions are taken into account: (i) a particular vehicle is imposed to participate in the V2G energy transfer when it parks for 30 or more minutes (a threshold of 30 min was used as the minimum viable duration for participation in V2G; parking periods shorter than this were deemed insufficient to offset the overhead associated with plug-in and disconnect operations and to allow a meaningful energy transfer to the grid that justifies potential battery degradation costs); (ii) the maximum parking time is taken when the vehicle parks at multiple points in a zone for more than 30 min in a day. In addition to that, vehicles parked between 8:30 and 14:00 are considered. It ensures the exclusion of prolonged parking during the off-peak night with a drained battery, and it gives enough time for vehicles parking in the afternoon to transfer energy to the grid.
The study area is the city of Viterbo in the Latium region (Central Italy). In this study, anonymized floating car data of trips that ended in the city for 58 survey days in 2023 are used. Later, the data of weekdays is extracted from the original dataset for the prediction of surplus V2G energy. In this selection process, public holidays occurring on weekdays were catalogued as non-working days and excluded from the standard weekday dataset to ensure that the analysis reflects typical commuting behaviors without the distortion of holiday-induced mobility patterns. The penetration rate of electric vehicles at the municipal and provincial levels and the Geographic Information System (GIS) data from the census unit are also used for this study. However, it should be noted that the penetration rate data is employed to find the optimal location and not used for energy computation. The penetration rate data need to be tailored in the energy calculation to avoid the introduction of hypothetically high energy in this study.

4.2. Results and Discussion

The following subsections present a synthesis of the results obtained and critically discuss them in relation to the opportunities and challenges associated with their practical implementation. This discussion aims to contextualize the findings within real-world deployment scenarios, highlighting both the potential benefits and the constraints that can influence scalability and feasibility.

4.2.1. Optimal V2G Parking Location

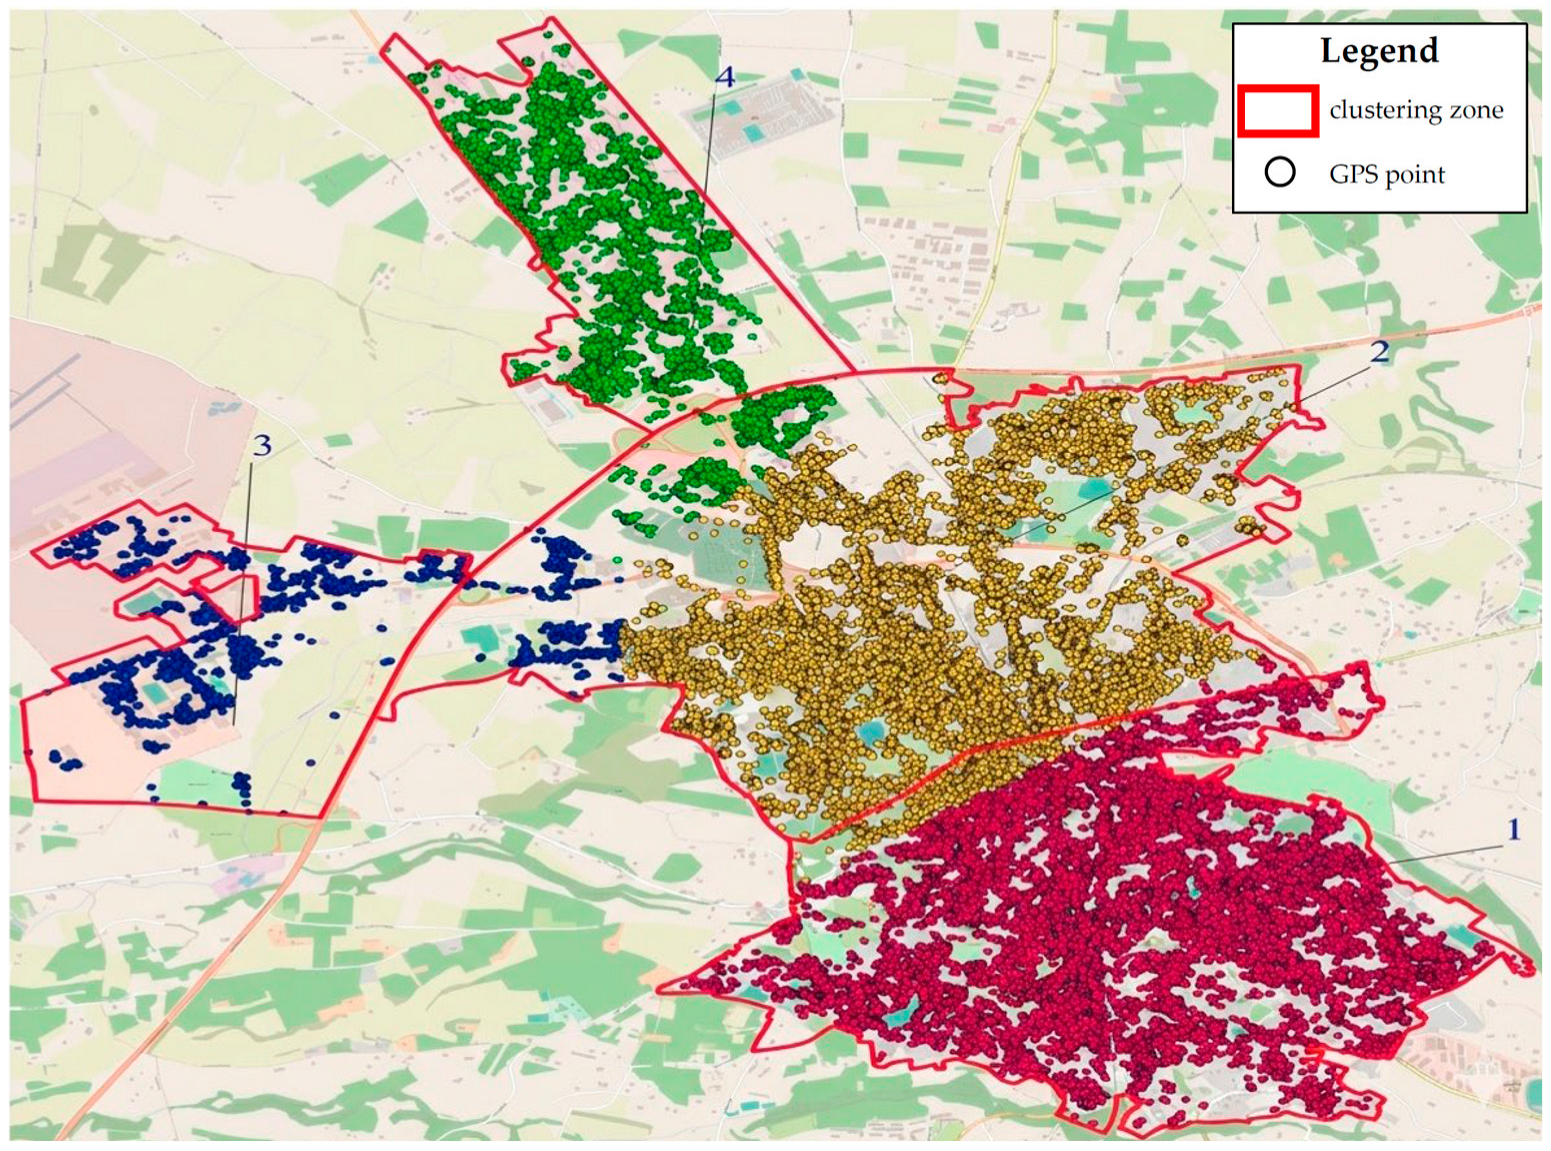
The origin and destination coordinates of the FCD and a boundary map generated from the aggregation of Viterbo census sections are used to identify the trips that started and ended in the city. Consequently, to create clustering zones of analysis with the k-means approach, clustering is performed on 125,436 trip coordinates. Based on a visual inspection of high-resolution satellite imagery and physical characteristics of the transport-oriented urban morphology of the city, the k-value is fixed to be four. Meanwhile, the boundary obtained from the cluster analysis is modified to match a new boundary created by aggregating multiple closest census units (see Figure 2).
In terms of vehicles, this study focuses on trips with private vehicles. Consequently, 63,501 individual trips are identified in zone 1; 70,318 in zone 2; 7799 in zone 3; and 24,300 in zone 4 to end their trips and park in each of the respective zones. Once the trips are identified, Equation (1) is implemented to compute the parking duration of the trips in each zone. The computed parking duration is expanded using the penetration rate to obtain the representative parking duration of the entire vehicle population. Consequently, the expanded average aggregated daily parking duration of the zones in hours is found to be 3970.30, 2983.96, 173.60, and 670.10 for zones 1 to 4, respectively. Based on the resulting parking duration, zone 1 is identified as the optimal zone for the implementation of the aggregated V2G facility in Viterbo City. However, the spatial proximity of zones 1 and 2, the urban setting of the two zones, and the proximity of the resulting parking duration suggest that other factors such as accessibility for more than one zone and land-use factors are taken into account in the microanalysis and location of the V2G facility.

4.2.2. Computation of Surplus Energy

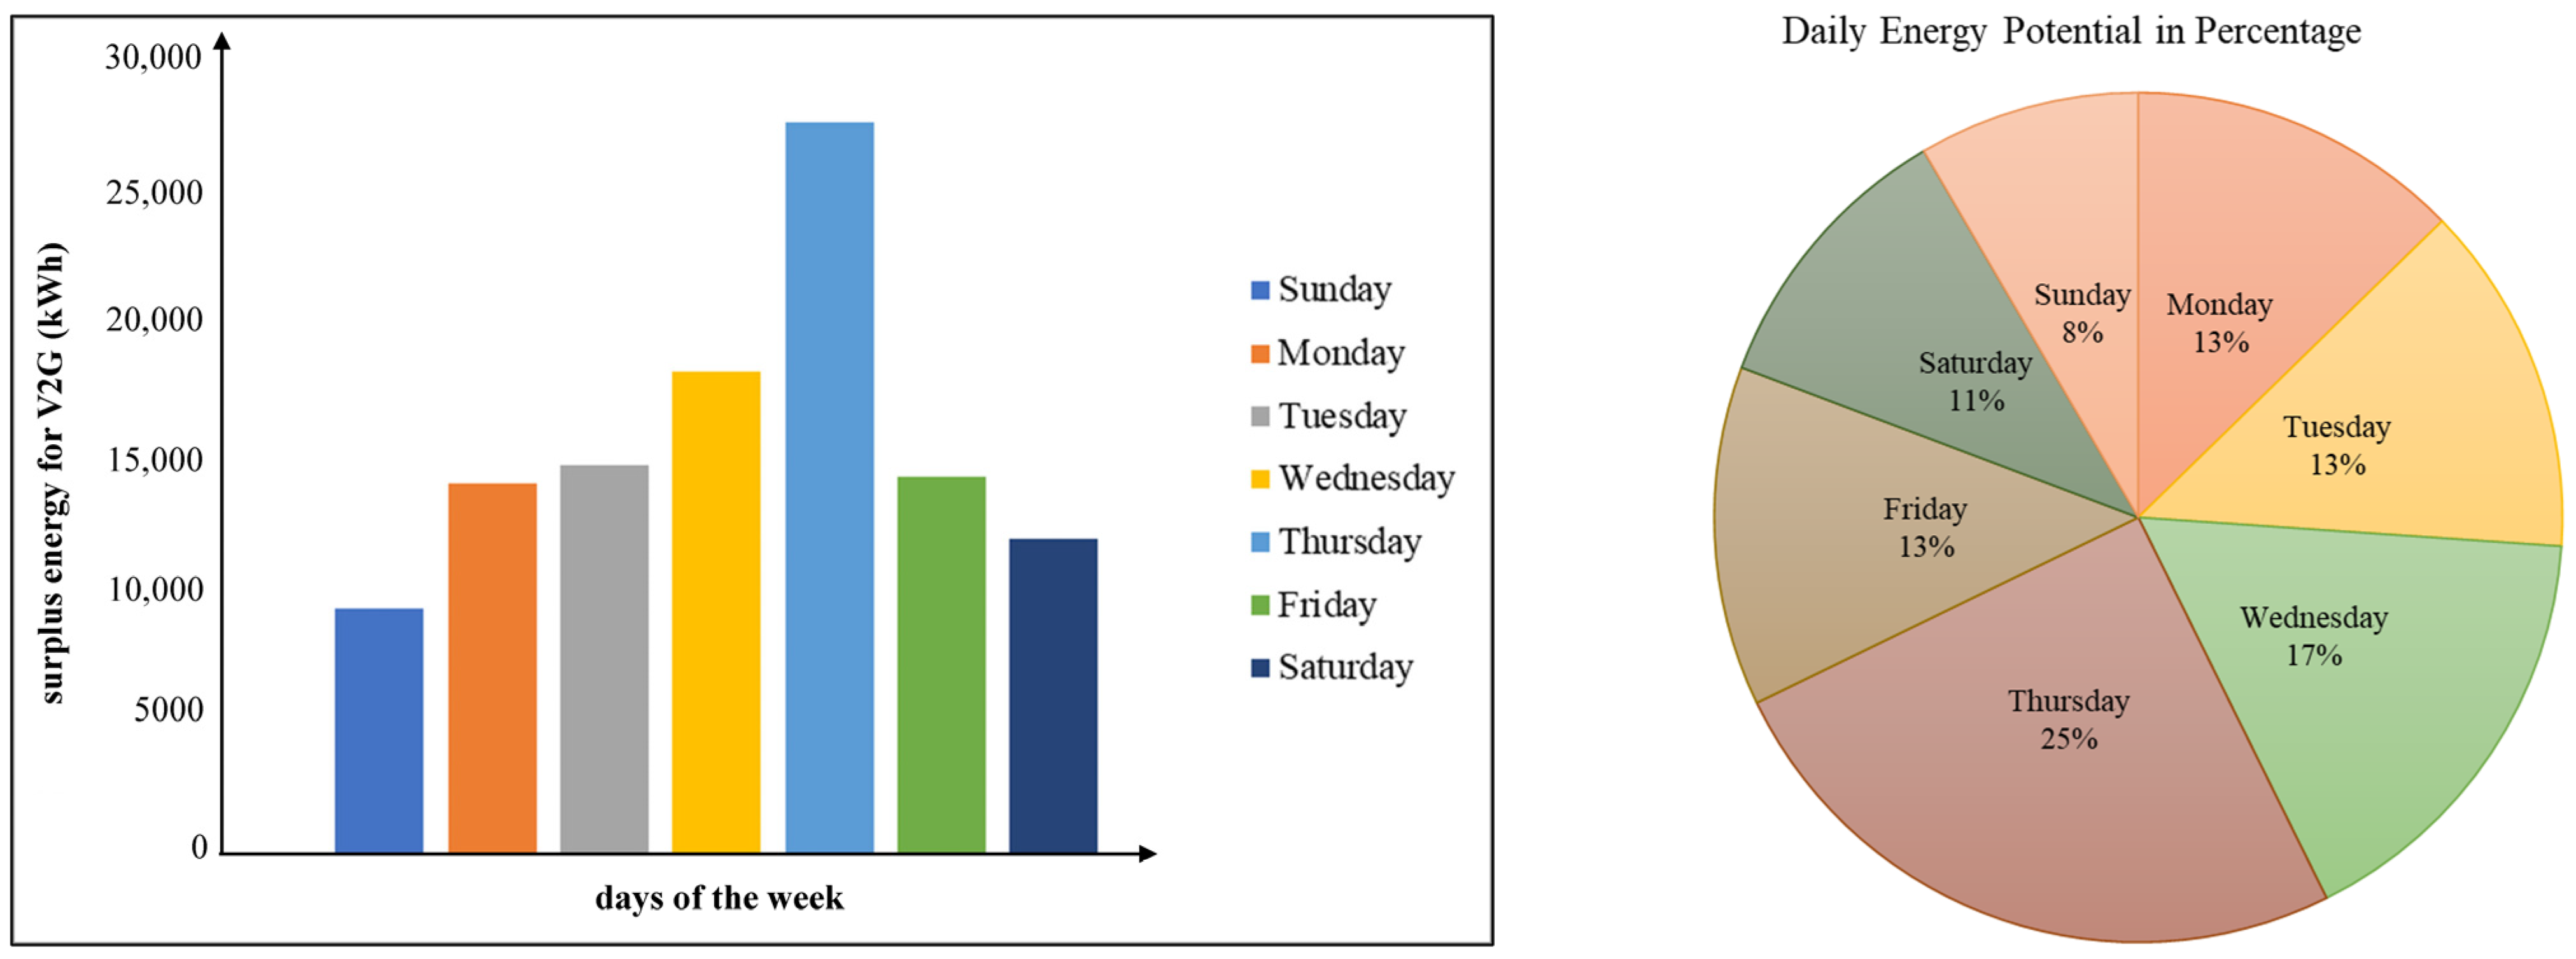
After the zone of interest is identified, the energy left unused, i.e., the residual energy left in the vehicle after all daily energy requirements are reduced from the battery capacity, is calculated using Equation (2) for all vehicles parked in the zone. However, it should be noted that V2G is a bidirectional flow of energy between vehicles and the grid, i.e., it is likely that a vehicle parked at the V2G facility may be charged from the facility in the park. In such a scenario, the resulting energy becomes negative. As the premise of this study is to identify the potential energy that can be harnessed from a V2G facility, vehicles whose surplus energy is found to be negative are excluded. The energy potential of the selected zone surplus for the selected zone for Mondays, Tuesdays, and Fridays is seen to be similar. The surplus energy that can be obtained during Wednesday and Thursday represents an increase relative to other weekdays while showing the peak during Thursdays. The surplus energy output during Saturdays and Sundays seems to follow the commuting pattern on weekends (Figure 3). This pattern likely reflects the specific urban mobility dynamics of Viterbo, where a mid-week day like Thursday often corresponds to increased commercial activity and market days, leading to higher vehicle accumulation and longer dwell times in central zones compared to the beginning or end of the work week.

4.2.3. Surplus Energy Forecasts with the ARIMA Model

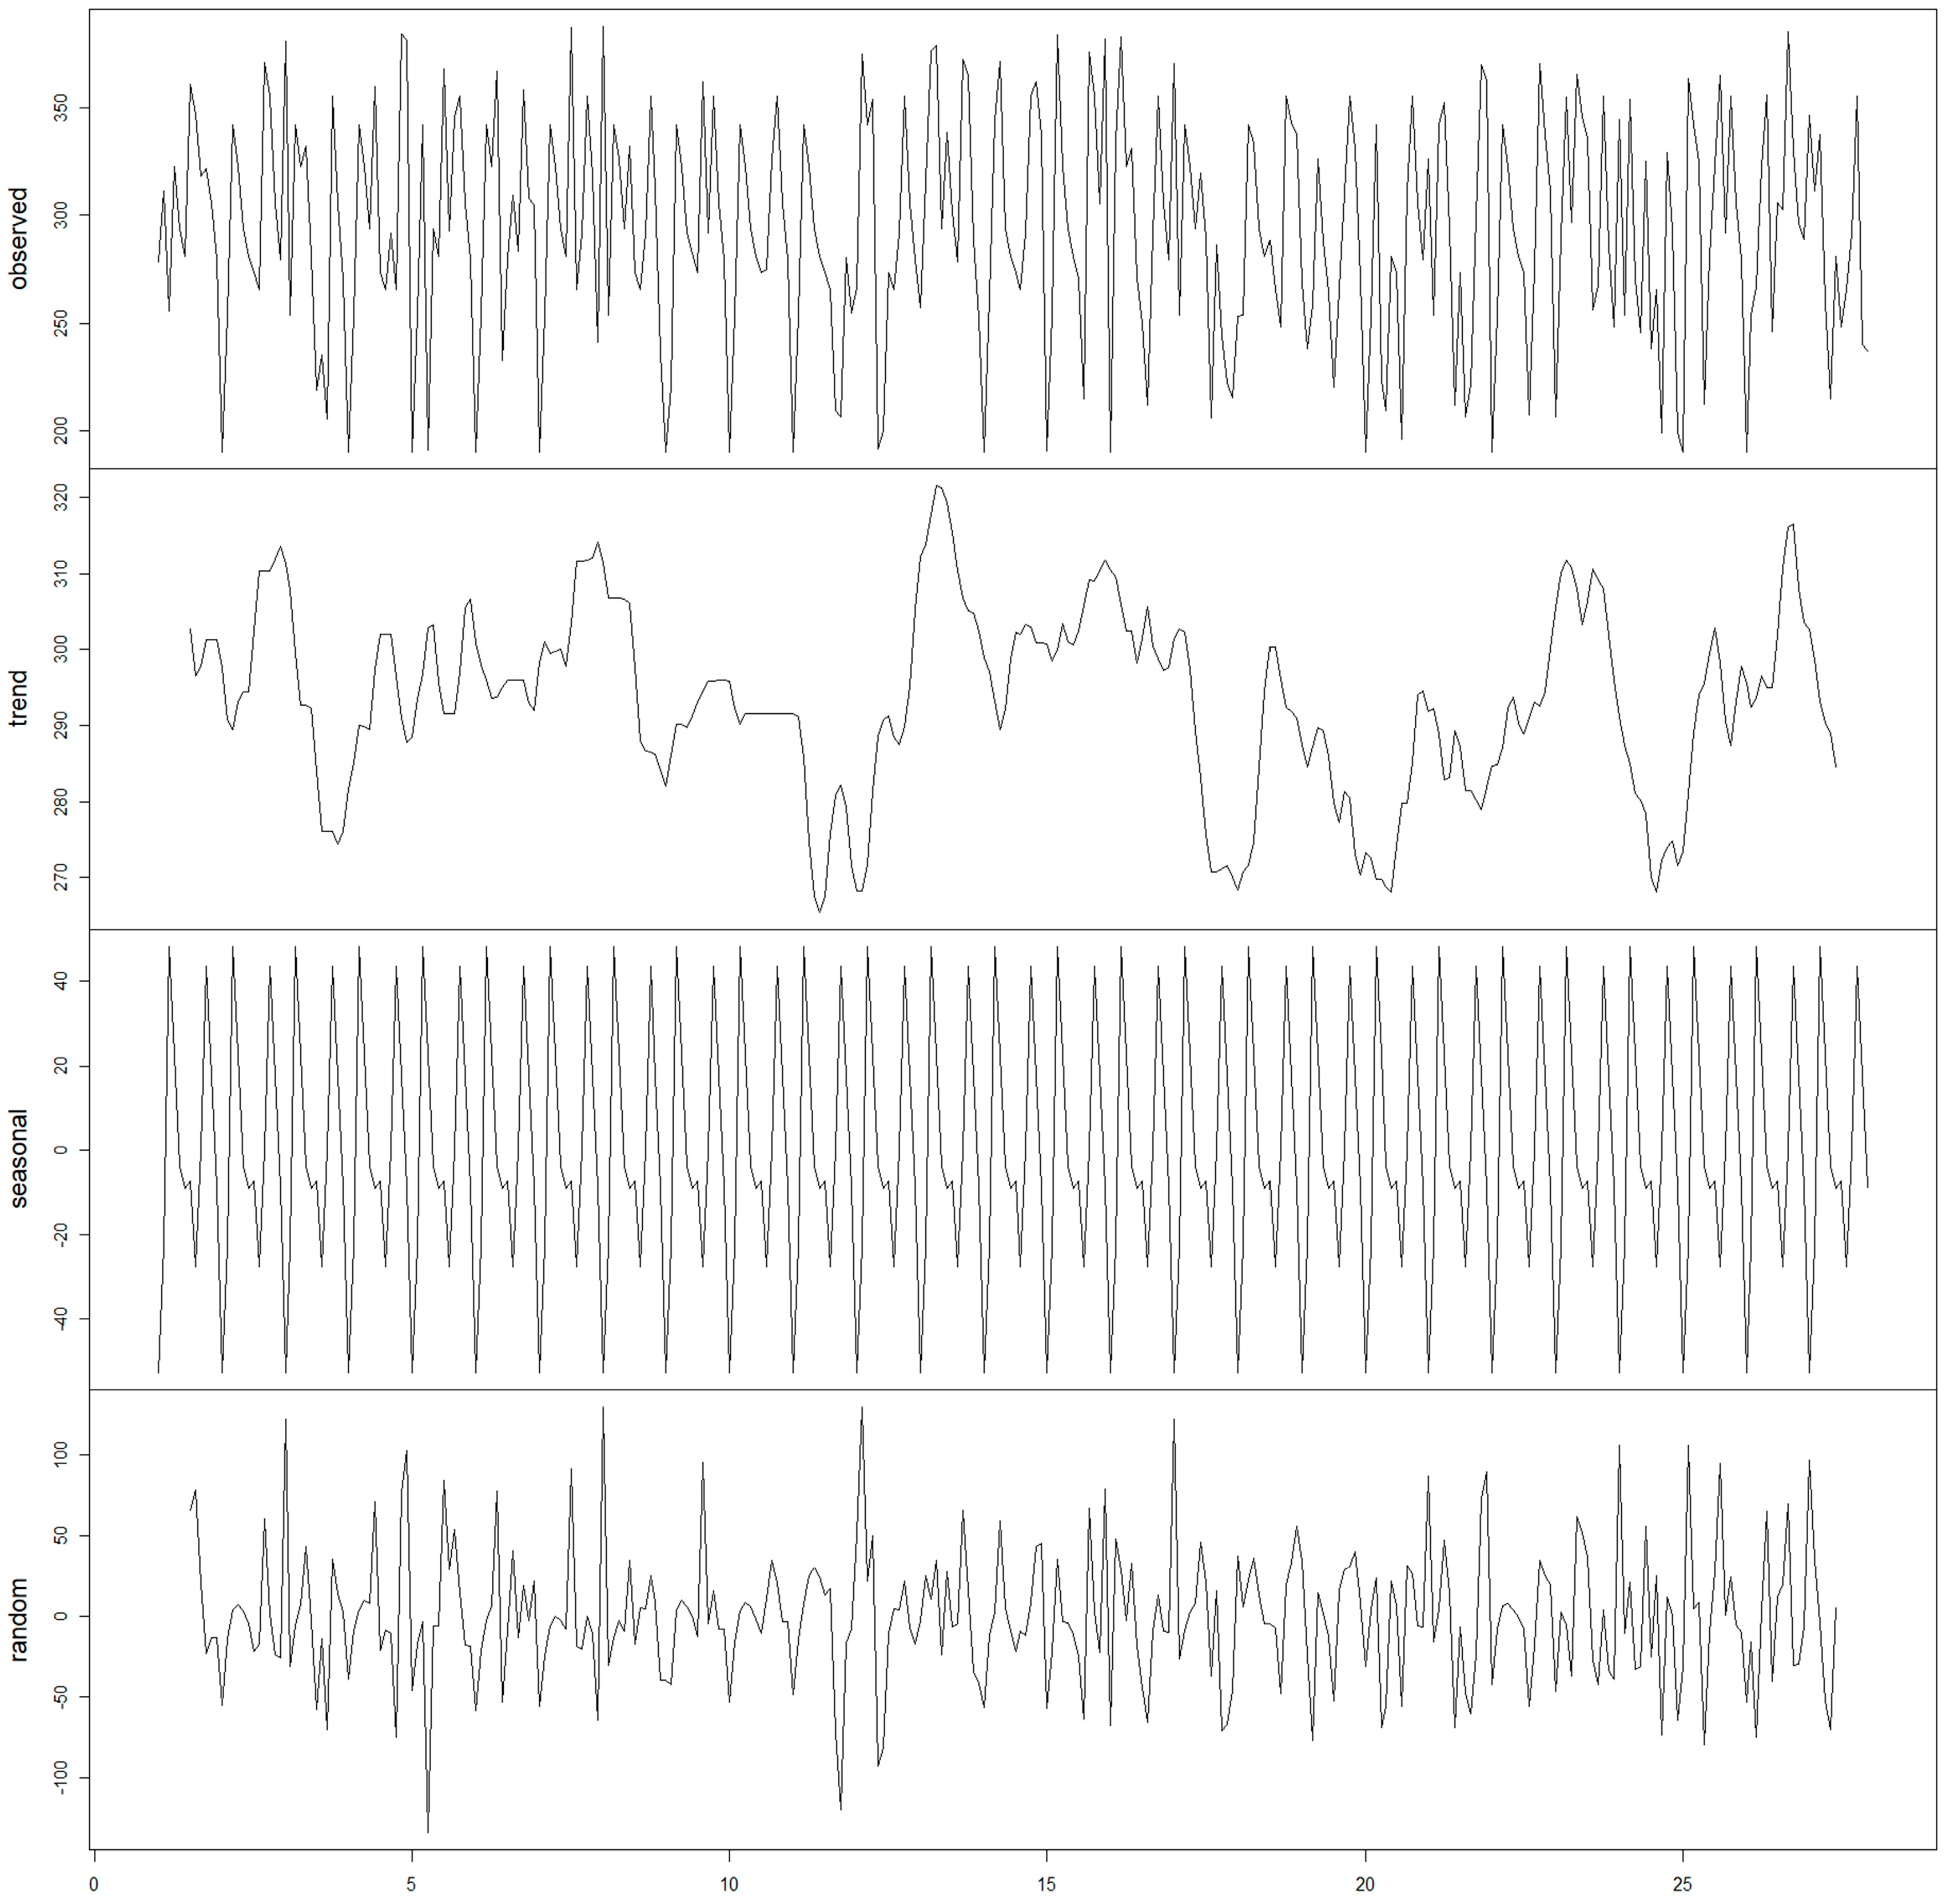
The calculated energy of each vehicle is first shifted to the energy output at the end of every 30 min interval until the energy required for the activity after parking is retained. The number of 30 min intervals depends on the total duration of the parking and the actual surplus energy. The stationarity of the time series is checked with Kwiatkowski–Phillips–Schmidt–Shin (KPSS) and augmented Dickey–Fuller (ADF) tests. The results showed that, in both cases, the time series is in favor of non-stationarity. Then, the ARIMA (p, d, q) model is fitted to forecast surplus energy based on the extracted weekday data, shown in the first panel of Figure 4.
The study used the auto.arima function from the R-project forecast package (vers. 4.3.2). The best model is automatically selected by tuning the values of p, d, and q and the respective corrected Akaike Information Criterion (AICc). Thus, the model with AICc = 2599.95 and BIC = 2620.63 is selected for the training data and resulted in the order of the autoregressive component (p), degree of differencing (d), order of the moving average component (q), and sigma to be 2, 0, 2, and 46.95, respectively. The model is further validated and tested using data reserved for validation and testing from the main dataset, where 70% of the data are reserved for training, and 30% for validation and testing. The coefficients of the model are summarized in Table 3, and the final model becomes
E a s , v i , t d = 285.65 + 0.969 y t 1 0.941 y t 2 0.844 ε t 1 + 0.833 ε t 2 + ε t N ( 0 , σ = 46.95 )
In addition to AICc, the performance of the model is also measured using the root mean square error (RMSE), mean absolute error (MAE), and mean absolute percentage error (MAPE) for both the training and test data. It obtained 46.356 and 52.424 for RMSE, 36.053 and 43.272 for MAE, and 12.982 and 16.028 for MAPE, respectively. The observed performance gap of the model can be partially attributed to the limited number of training data. Hence, customized penetration rate data are required to increase and diversify the training data until the entire vehicle population is electric.
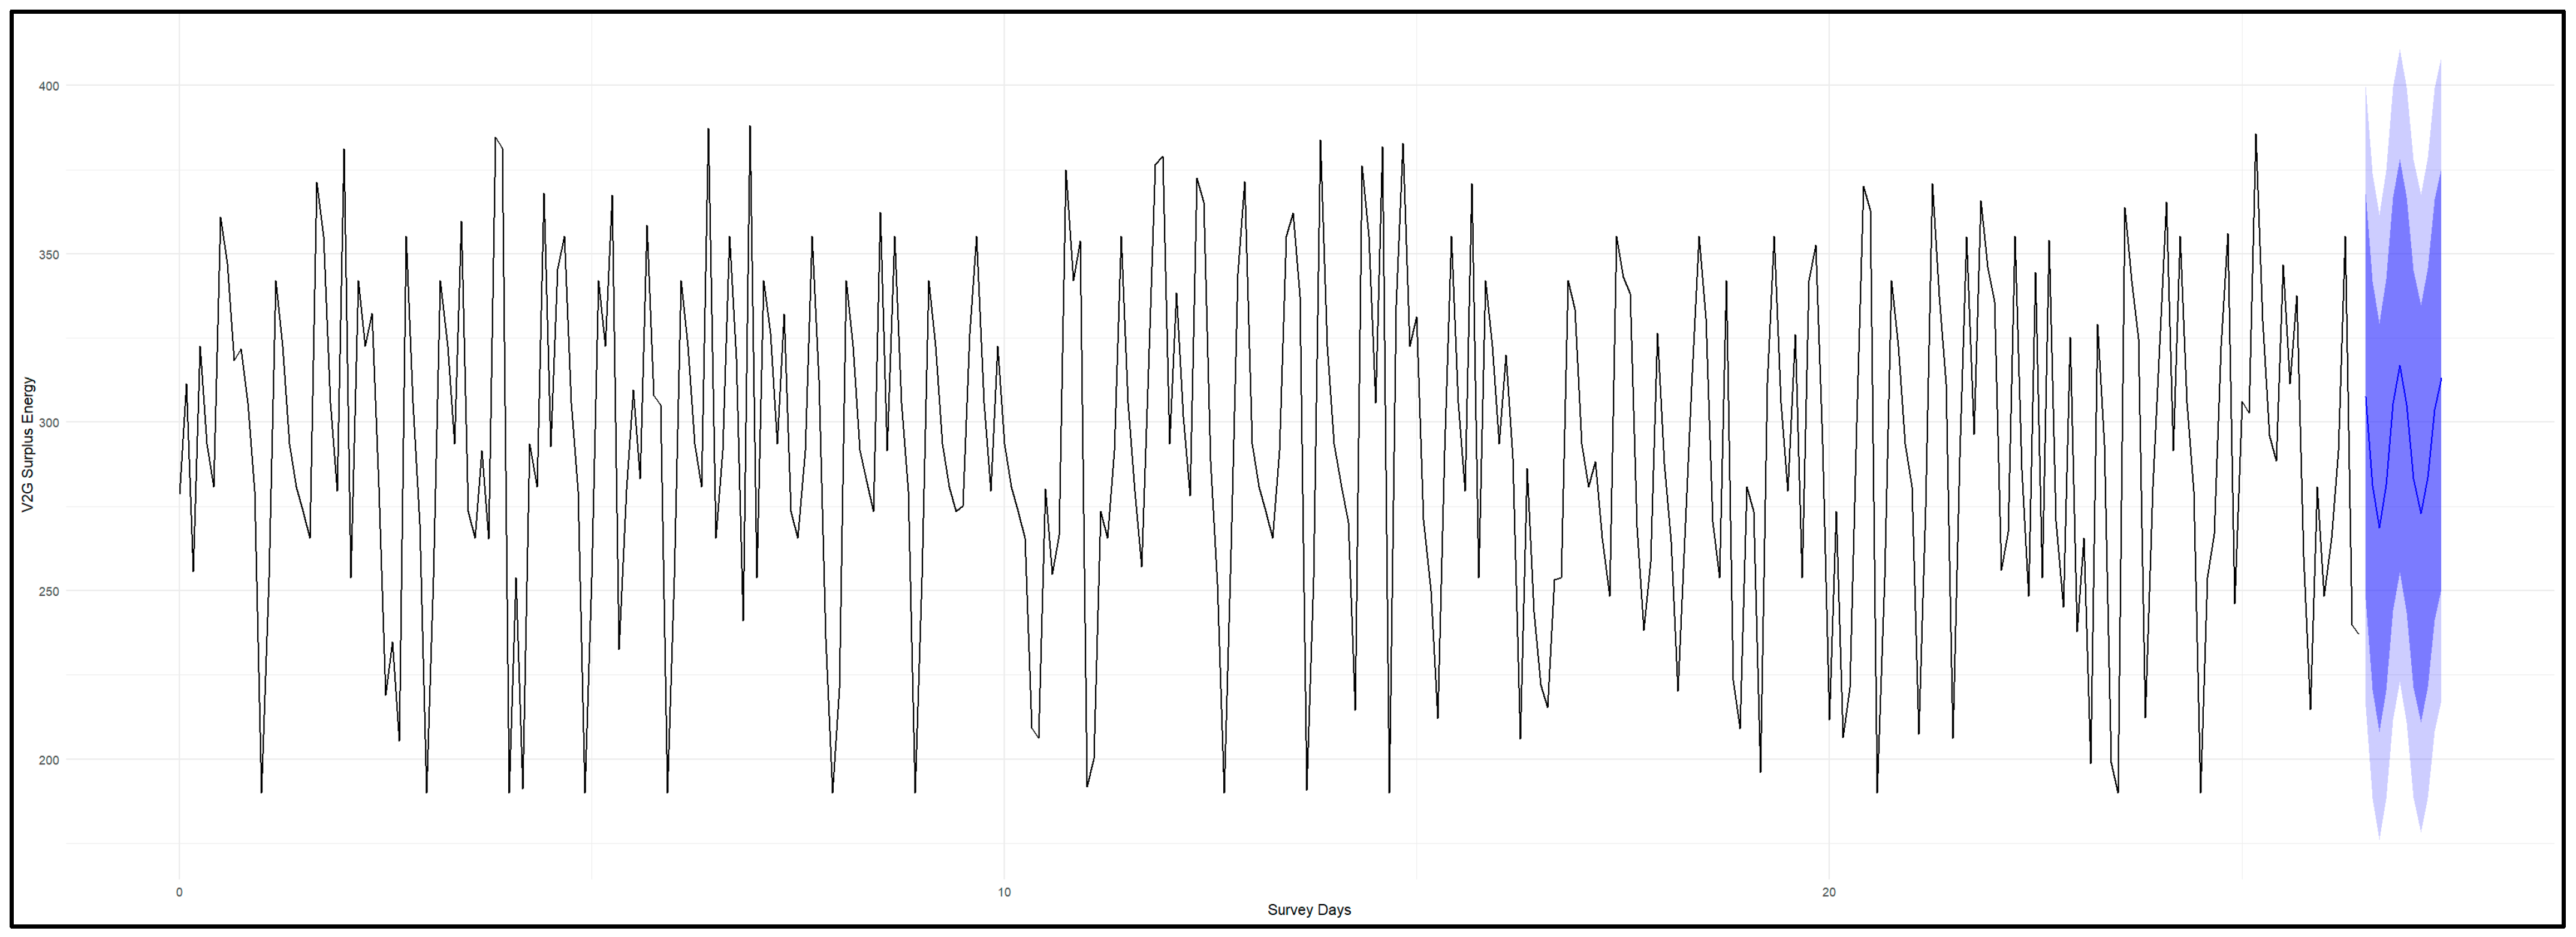
Once the accuracy of the model is deemed acceptable, the actual surplus energy to be harnessed from the selected V2G zone of the study area is forecasted. Consequently, the plot of actual data and forecast along with its 80% and 95% confidence intervals are shown in Figure 5. It can be seen that at the 95% confidence level, the forecast seems representative of the prevailing scenario. However, as can be seen in the actual data, the daily surplus energy output fluctuates across the 30 min intervals. This fluctuation is associated with the battery capacity of various vehicles used in this study and the surplus energy transfer that finishes before reaching the actual parking duration of the vehicle. On top of that, the disparity in arrival timing of the vehicles also played a vital role in the sharp rise and decline of energy output at the 30 min intervals.

4.2.4. Surplus Energy Forecasts with the LSTM Model

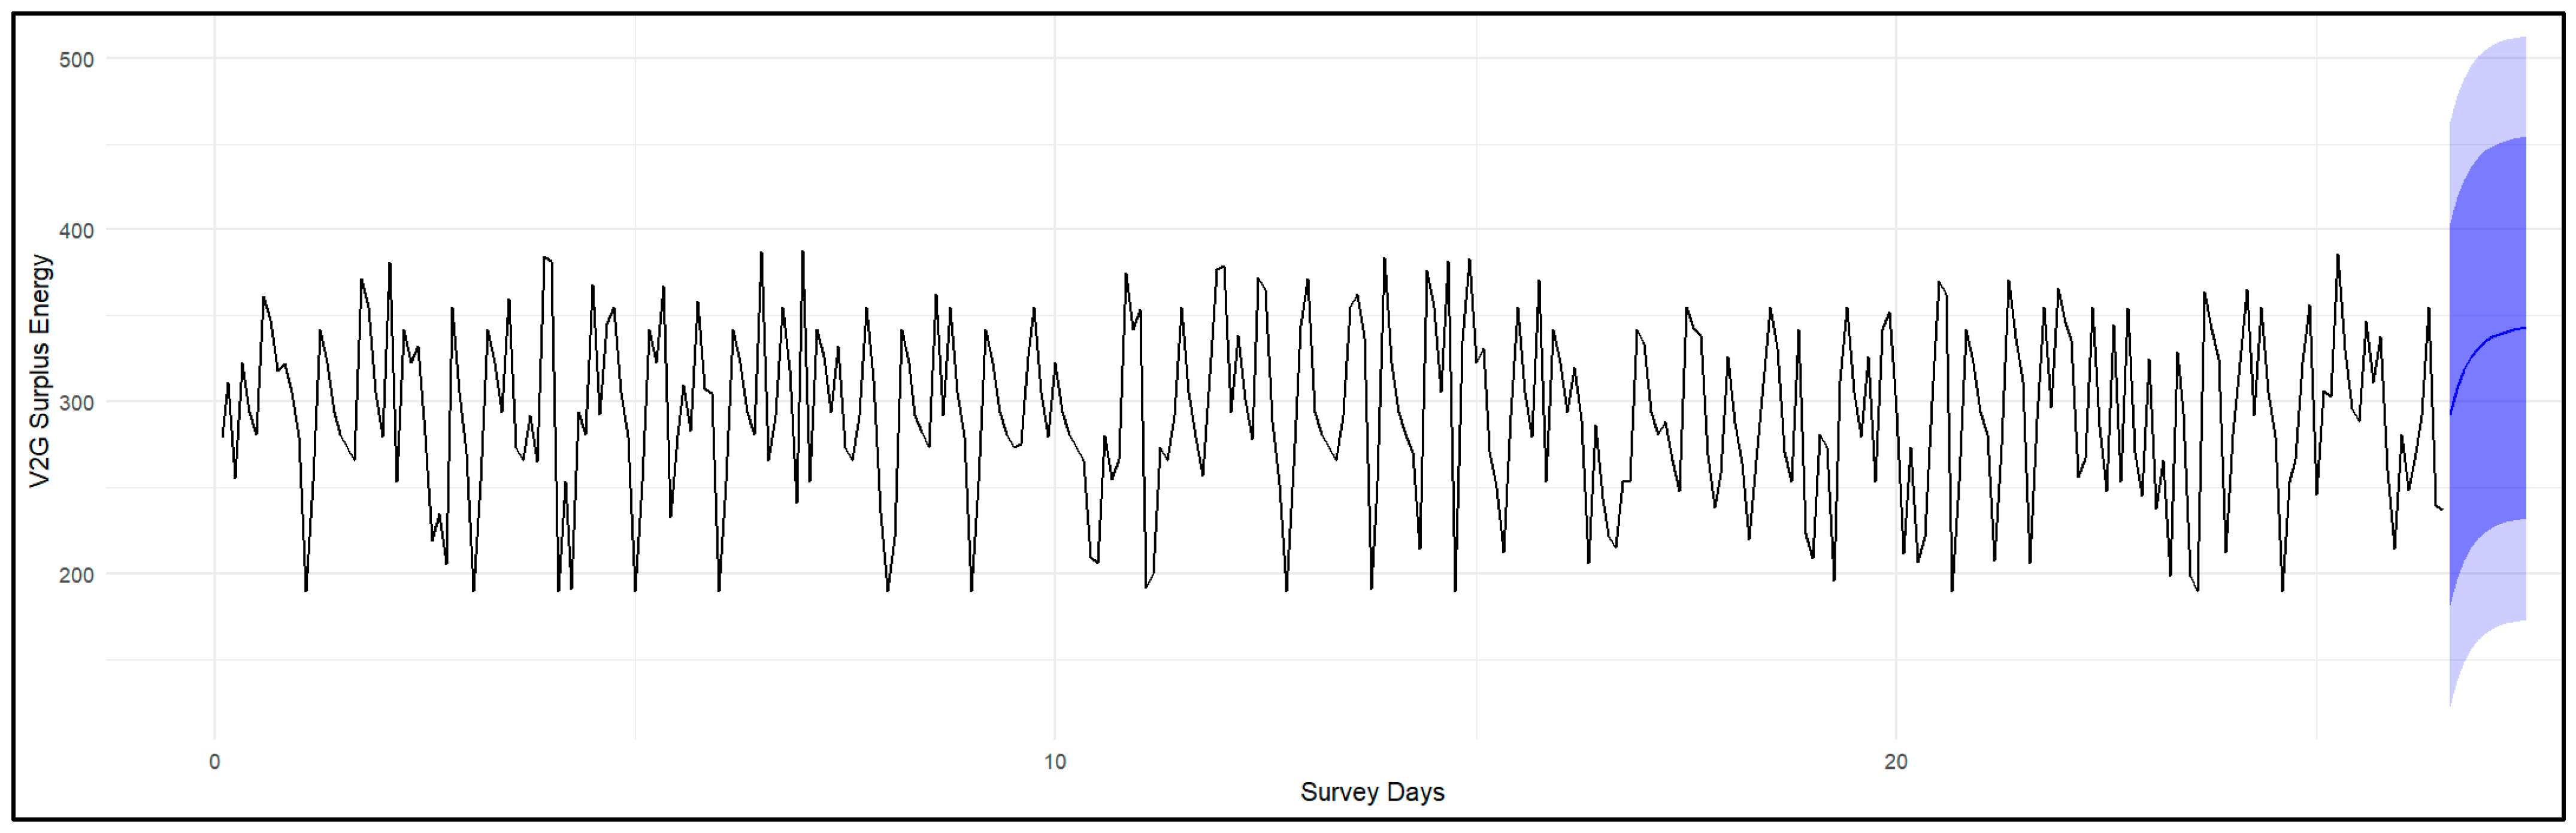
In this study, efforts were made to forecast the surplus energy for the next day that can be harnessed by the grid that implements the LSTM. The LSTM architecture was optimized through a grid search hyperparameter tuning process. The final configuration comprises an input sequence layer followed by two stacked LSTM layers, each with 50 units, designed to capture complex non-linear temporal dependencies. To mitigate overfitting (a critical concern given the size of the dataset), a dropout regularization layer with a rate of 0.2 was inserted between the LSTM layers. Regarding activation functions, the internal recurrent gates employ the standard sigmoid and tanh functions as described in Section 3.3, while the subsequent fully connected (dense) layers utilize the Rectified Linear Unit (ReLU) activation function to enhance training convergence. Model training was performed using the Adam optimizer with a learning rate of 0.001 and a batch size of 32 over 100 epochs, minimizing the Mean Squared Error (MSE) loss function. The finding shows that the developed model has an RMSE of 99.090, MAE of 80.351, and MAPE of 53.200 for the test, while they are 92.330, 77.376, and 21.622, respectively, for the training set. That implies that regardless of the optimal parameters used in the LSTM, its performance is low compared to the ARIMA model. Although there are studies in favor of the results of this study, the comparison of ARIMA and LSTM in previous works shows an opposite view. For example, in the study of Albeladi et al. [63], ARIMA was reported to forecast a time series rather than LSTM. On the other hand, in the study of Siami-Namini and Namin [61], the algorithm was found to improve average prediction by 85% compared to ARIMA. Generally, the settling argument is the limitation of deep learning algorithms when there is limited training data [64,65]. This study is also in agreement with this argument given by Ismail Fawaz et al. and Jason Brownlee, given that the vehicle data used in this study suffer from tailored electric vehicle penetration rate data. Comparison of the plot of the result of the LSTM in Figure 6 with the ARIMA also attests to the difference.
Figure 5. Plot of the actual and forecast by ARIMA with the confidence intervals along the surveyed workdays (blue area).
Vehicles 08 00030 g005
Figure 6. Plot of the actual and forecast by LSTM with the confidence intervals along the surveyed workdays (blue area).
Vehicles 08 00030 g006

4.2.5. Discussion

The empirical findings from Viterbo demonstrate that the proposed methodology based on FCD can effectively guide the planning of the V2G infrastructure through the systematic identification of optimal zones and reliable energy forecasting. Although FCD provides unbiased coverage throughout the city, superior to surveys or simulations, limitations warrant acknowledgment. Sampling biases may over-represent certain trip types, GPS signal loss in historic centers (narrow streets in Viterbo) can underestimate parking, and 58-day coverage may miss seasonal variations.
The current methodology provides a foundation for V2G planning, but requires several enhancements for operational deployment. The deterministic framework, while effective for initial planning, does not fully capture the real-world variabilities affecting the availability of V2G. Vehicle arrival times vary due to traffic congestion, personal schedule changes, and route choices. Energy demand fluctuates according to weather, grid conditions, and variability in renewable generation. A more robust approach would model these factors probabilistically, as demonstrated in EV fleet management research [66], where stochastic frameworks account for the uncertainties of the charging session and dynamic operating conditions. For Viterbo, this would involve deriving probability distributions for arrival/departure times from FCD temporal patterns and incorporating historical traffic data to model delay impacts on hub availability.
Battery degradation remains a primary concern for EV owners considering participation in V2G. The 20% contingency reserve incorporated in surplus energy calculations provides inherent degradation protection by limiting depth-of-discharge cycles. Additionally, the focus on locations with extended parking durations (Zone 1 average: 3970.30 h/day) enables slower charge–discharge rates over longer periods, reducing battery stress compared to rapid cycling scenarios [67]. However, explicit battery health modeling integrated with energy transfer scheduling would provide stronger guarantees, potentially tracking individual vehicle battery conditions and adjusting participation rates accordingly.
Economic viability determines whether technical potential results in actual participation. Although detailed cost–benefit analysis was beyond the scope of this study, emerging technologies offer promising frameworks for incentive structures. Blockchain-based platforms [68] could provide transparent and automated compensation systems in which electric vehicle owners receive tokens for grid services, with smart contracts that handle payment based on actual energy transfer, time-of-use values, and grid needs. For Viterbo, integrating local solar generation data through Internet-of-Things (IoT) sensors would enable preferential rewards for discharge during renewable surplus periods, aligning participation of V2G with sustainability objectives while ensuring fair and verifiable compensation.
The current methodology focuses on identifying optimal single zones (Zone 1), which reflects the realities of early deployment but requires evolution as EV penetration increases. At higher penetration levels, V2G planning should consider inter-zone coordination and grid-wide load balancing. Studies on EV charging networks demonstrate the benefits of coordinated control strategies [69], where the charging infrastructure acts as flexible assets that balance loads across interconnected microgrids. For Viterbo, this would involve expanding the spatial clustering methodology to incorporate grid load metrics, real-time demand levels, renewable generation capacity, and transmission constraints between zones, enabling dynamic allocation of V2G resources to under-supplied areas during peak periods. Optimal capacity sizing for each hub would prevent infrastructure over-provisioning while ensuring adequate local support capability.
The methodology is scalable to larger metropolitan areas, although implementation requires strategic adaptations. Larger cities benefit from the inherent flexibility of the spatial clustering framework, and increasing the number of clusters (k > 10 or k > 20) naturally accommodates mix land-use urban structures with multiple employment and commercial centers. The FCD-based approach strengthens with city size, as larger populations generate richer datasets, improving both location identification accuracy and forecasting model performance, potentially enabling earlier transition from ARIMA to LSTM or hybrid ensemble methods. The Viterbo application demonstrates the viability of the methodology on an urban scale; scalability to major urban centers depends on maintaining data quality, adapting the clustering parameters to urban complexity, and ensuring that the grid infrastructure can accommodate identified aggregation patterns.

5. Conclusions

This study attempted to locate the optimal zone for the implementation of V2G, identify the surplus energy that can be used from the selected zone, and forecast the surplus energy potential to be transferred to the grid on demand. Beyond that, this study utilized the advantages offered by floating car data to extract meaningful information. In that regard, this study witnessed that floating car data played a significant role in both identification of the potential V2G zone and computation of the available energy capacity. Therefore, the increased accessibility and availability of floating car data are of paramount importance to make an informed decision as the population of electric vehicles grows. In addition, it is inevitable that the EV population will grow and that the grids will suffer to satisfy the power demands. In that case, customized EV penetration data for the V2G energy potential appear to be crucial in shaping the likely decisions. Concerning the location of the optimal V2G zone, it is worth noting that the number of survey days is limited, and at implementation and micro-level analysis, other factors including land use and accessibility need to be addressed. The findings of this study, particularly the comparison of the performance of ARIMA and LSTM while forecasting the energy potential, require cautious interpretation due to the inherent issue of data hunger in deep learning models. Therefore, future studies are suggested to include more survey days in floating car data collection, implement more advanced spatial clustering approaches, and use multivariate models that incorporate external variables. Future research directions should incorporate stochastic frameworks to model arrival and departure uncertainties as well as traffic congestion impacts, thereby better reflecting operational variability. Integrating battery health monitoring with energy transfer scheduling would explicitly address degradation concerns, while the implementation of block-chain-based compensation systems with transparent energy attribution could enhance economic viability and user trust. Furthermore, expanding spatial optimization to include grid load metrics and inter-microgrid coordination would maximize system-wide benefits at higher penetration levels.
The proposed methodology can be transferred to other medium-sized cities characterized by FCD availability, compact urban morphology, and adequate grid infrastructure. Nevertheless, contextual adaptations, such as tuning clustering parameters, selecting models based on data abundance, and aligning with local regulatory frameworks, remain essential.
As EV adoption accelerates toward policy targets, the ability to plan V2G infrastructure based on empirical behavioural patterns rather than idealized assumptions becomes critical to maximize grid benefits while minimizing investment risks. This study demonstrates that such planning is both feasible and effective, offering cities worldwide a replicable framework to transform EV integration from a grid challenge into a sustainability opportunity during the pivotal early deployment phase.

Author Contributions

Conceptualization, A.C., E.A.A. and E.E.; methodology, A.C., E.A.A. and E.E.; software, E.A.A.; validation, A.C., E.A.A. and E.E.; formal analysis, A.C. and E.A.A.; investigation, A.C., E.A.A. and E.E.; resources, A.C.; data curation, E.A.A. and E.E.; writing—original draft preparation, A.C. and E.A.A.; writing—review and editing, A.C. and E.E.; visualization, E.A.A.; supervision, A.C.; project administration, A.C.; funding acquisition, A.C. All authors have read and agreed to the published version of the manuscript.

Funding

This research was funded by “Progetto ACCUMULO—1.2 Progetto Integrato Tecnologie di accumulo elettrochimico e termico—LA2.12-Analisi dell’offerta territoriale per la realizzazione di modelli di predizione della capacità aggregata fornita da veicoli elettrici a supporto delle esigenze della rete elettrica”, Ministero dell’Ambiente e della Sicurezza Energetica MASE (ex MiTE), Consiglio Nazionale delle Ricerche, Italy, CUP E87H23001620005; CUP (master) B53C22008540001.

Data Availability Statement

Part of the original data presented in this study are openly available on Geofabrik’s free download server. However, third-party restrictions apply to the availability of floating car data.

Acknowledgments

The authors would like to thank the editors and reviewers for their valuable suggestions and comments, which contributed to improve the quality of this paper.

Conflicts of Interest

The authors declare that they have no conflicts of interest.

Abbreviations

The following abbreviations are used in this manuscript.
EVElectric Vehicle
FCDFloating Car Data
ARIMAAutoregressive Integrated Moving Average Model
LSTMLong Short-Term Memory
GISGeographic Information System
AICAkaike Information Criterion
BICBayesian Information Criterion
RMSERoot Mean Square Error
MAEMean Absolute Error
MAPEMean Absolute Percentage Error
V2GVehicle-to-Grid

References

  1. International Energy Agency. CO2 Emissions in 2023; IEA: Paris, France, 2023. [Google Scholar]
  2. World Bank Group. Enhancing Transport Decarbonization in the European Union; World Bank: Washington, DC, USA, 2025. [Google Scholar]
  3. Armaroli, N.; Carraro, C.; Cazzola, P.; Cherchi, E.; Tanelli, M.; Tavoni, M.; Tilche, A.; Torsello, M. Decarbonising Transport Scientific Evidence and Policy Proposals; MIT: Roma, Italy, 2022. [Google Scholar]
  4. International Energy Agency. Energy Sector Investment to Meet Climate Goals; IEA: Paris, France, 2017. [Google Scholar]
  5. European Commission. Sustainable and Smart Mobility Strategy; EC: Brussels, Belgium, 2021. [Google Scholar]
  6. European Environment Agency. Electric Vehicles in Europe—2016—Approaching Adolescence; European Environment Agency: Copenhagen, Denmark, 2016. [Google Scholar]
  7. European Environment Agency New Registrations of Electric Vehicles in Europe|European Environment Agency’s Home Page. Available online: https://www.eea.europa.eu/en/analysis/indicators/new-registrations-of-electric-vehicles (accessed on 26 February 2025).
  8. Automobile Club of Italy. Statistical Yearbook: Statistiche Automobilistiche (TABII03); Automobile Club of Italy: Turin, Italy, 2024. [Google Scholar]
  9. Comi, A.; Crisalli, U.; Hriekova, O.; Idone, I. Analysis of the Willingness to Shift to Electric Vehicles: Critical Factors and Perspectives. Vehicles 2025, 7, 159. [Google Scholar] [CrossRef]
  10. Ministry of Economic Development. Integrated National Energy and Climate-Italy; National Energy and Climate Plans: Rome, Italy, 2019.
  11. Croce, A.I.; Musolino, G.; Rindone, C.; Vitetta, A. Traffic and Energy Consumption Modelling of Electric Vehicles: Parameter Updating from Floating and Probe Vehicle Data. Energies 2021, 15, 82. [Google Scholar] [CrossRef]
  12. Bibak, B.; Tekiner-Moğulkoç, H. A Comprehensive Analysis of Vehicle to Grid (V2G) Systems and Scholarly Literature on the Application of Such Systems. Renew. Energy Focus 2021, 36, 1–20. [Google Scholar] [CrossRef]
  13. International Energy Agency. Global Energy Review 2025; IEA: Paris, France, 2025. [Google Scholar]
  14. Croce, A.I.; Musolino, G.; Rindone, C.; Vitetta, A. Energy Consumption of Electric Vehicles: Models’ Estimation Using Big Data (FCD). Transp. Res. Procedia 2020, 47, 211–218. [Google Scholar] [CrossRef]
  15. Comi, A.; Hriekova, O.; Crisalli, U.; Napoli, G. A Methodology Based on Floating Car Data for Forecasting the Available Capacity for Vehicle-to-Grid Services. Transp. Res. Procedia 2024, 78, 47–54. [Google Scholar] [CrossRef]
  16. Cui, J.; Li, Y.; Zhang, W.; Chen, C. Research on Impact and Utilization of Electric Vehicle Integration into Power Grid. In Proceedings of the 30th Chinese Control and Decision Conference, CCDC, Shenyang, China, 9–11 June 2018; Volume 2018, pp. 1594–1597. [Google Scholar] [CrossRef]
  17. Shafiq, S.; Irshad, U.B.; Al-Muhaini, M.; Djokic, S.Z.; Akram, U. Reliability Evaluation of Composite Power Systems: Evaluating the Impact of Full and Plug-in Hybrid Electric Vehicles. IEEE Access 2020, 8, 114305–114314. [Google Scholar] [CrossRef]
  18. Amini, M.H.; Boroojeni, K.G.; Jian Wang, C.; Nejadpak, A.; Iyengar, S.S.; Karabasoglu, O. Effect of Electric Vehicle Parking Lots’ Charging Demand as Dispatchable Loads on Power Systems Loss. In Proceedings of the IEEE International Conference on Electro Information Technology, Grand Forks, ND, USA, 20–22 August 2016; Volume 2016, pp. 499–503. [Google Scholar] [CrossRef]
  19. Dulau, L.I.; Bica, D. Effects of Electric Vehicles on Power Networks. Procedia Manuf. 2020, 46, 370–377. [Google Scholar] [CrossRef]
  20. Kempton, W.; Tomic, J.; Letendre, S.; Brooks, A.; Lipman, T. Vehicle-to-Grid Power: Battery, Hybrid, and Fuel Cell Vehicles as Resources for Distributed Electric Power in California. Fuel Cell 2001. Available online: https://ww2.arb.ca.gov/sites/default/files/classic/research/apr/reports/l723.pdf (accessed on 9 October 2025).
  21. Kempton, W.; Letendre, S.E. Electric Vehicles as a New Power Source for Electric Utilities. Transp. Res. Part D Transp. Environ. 1997, 2, 157–175. [Google Scholar] [CrossRef]
  22. Ferreira, R.J.; Miranda, L.M.; Araújo, R.E.; Lopes, J.P. A New Bi-Directional Charger for Vehicle-to-Grid Integration. In Proceedings of the IEEE PES Innovative Smart Grid Technologies Conference Europe, Manchester, UK, 5–7 December 2011. [Google Scholar] [CrossRef]
  23. Shuguang, L.; Zhenxing, Y. Progress and Prospect of Electric Vehicle’s V2G Technology. In Proceedings of the 2019 6th International Conference on Information Science and Control Engineering (ICISCE), Shanghai, China, 20–22 December 2019; IEEE: New York, NY, USA, 2019; pp. 412–416. [Google Scholar]
  24. Neyestani, N.; Damavandi, M.Y.; Shafie-Khah, M.; Contreras, J.; Catalão, J.P.S. Allocation of Plug-In Vehicles’ Parking Lots in Distribution Systems Considering Network-Constrained Objectives. IEEE Trans. Power Syst. 2015, 30, 2643–2656. [Google Scholar] [CrossRef]
  25. Mortaz, E.; Valenzuela, J. Optimizing the Size of a V2G Parking Deck in a Microgrid. Int. J. Electr. Power Energy Syst. 2018, 97, 28–39. [Google Scholar] [CrossRef]
  26. Lopes, J.A.P.; Soares, F.J.; Almeida, P.M.R. Integration of Electric Vehicles in the Electric Power System. Proc. IEEE 2011, 99, 168–183. [Google Scholar] [CrossRef]
  27. Gonzalez Venegas, F.; Petit, M.; Perez, Y. Active Integration of Electric Vehicles into Distribution Grids: Barriers and Frameworks for Flexibility Services. Renew. Sustain. Energy Rev. 2021, 145, 111060. [Google Scholar] [CrossRef]
  28. Landi, M.; Gross, G. Battery Management in V2G-Based Aggregations. In Proceedings of the 2014 Power Systems Computation Conference, PSCC, Wroclaw, Poland, 18–22 August 2014; Volume 2014, pp. 1–7. [Google Scholar] [CrossRef]
  29. Guille, C.; Gross, G. A Conceptual Framework for the Vehicle-to-Grid (V2G) Implementation. Energy Policy 2009, 37, 4379–4390. [Google Scholar] [CrossRef]
  30. Sovacool, B.K.; Axsen, J.; Kempton, W. The Future Promise of Vehicle-to-Grid (V2G) Integration: A Sociotechnical Review and Research Agenda. Annu. Rev. Environ. Resour. 2017, 42, 377–406. [Google Scholar] [CrossRef]
  31. Bates, J.; Leibling, D. Spaced Out Perspectives on Parking Policy; RAC Foundation: London, UK, 2012. [Google Scholar]
  32. Yang, R.; Dong, G.; Sheng, C. Study of V2G Applications in Residence Community and Parking Lot. In Proceedings of the 2015 4th International Conference on Computer, Mechatronics, Control and Electronic Engineering, Hangzhou, China, 28–29 September 2015; Atlantis Press: Guangzhou, China, 2015. [Google Scholar]
  33. Katona, G.; Juhasz, J. The History of the Transport System Development and Future with Sharing and Autonomous Systems. Komunikácie 2020, 22, 25–34. [Google Scholar] [CrossRef]
  34. Thormann, B.; Braunstein, R.; Wisiak, J.; Strempfl, F.; Kienberger, T. Evaluation of Grid Relieving Measures for Integrating Electric Vehicles in a Suburban Low-Voltage Grid. In Proceedings of the 25th International Conference on Electricity Distribution, Madrid, Spain, 3–6 June 2019; pp. 3–6. [Google Scholar]
  35. Zhou, C.; Xiang, Y.; Huang, Y.; Wei, X.; Liu, Y.; Liu, J. Economic Analysis of Auxiliary Service by V2G: City Comparison Cases. Energy Rep. 2020, 6, 509–514. [Google Scholar] [CrossRef]
  36. Huda, M.; Koji, T.; Aziz, M. Techno Economic Analysis of Vehicle to Grid (V2G) Indonesia Power System. Energies 2020, 13, 1162–1177. [Google Scholar] [CrossRef]
  37. Liao, Y.; Tozluoglu, C.; Sprei, F.; Yeh, S.; Dhamal, S. Impacts of charging behavior on BEV charging infrastructure needs and energy use. Trasp. Res. Part D 2023, 116, 103645. [Google Scholar] [CrossRef]
  38. Kumar, M.; Vyas, S.; Datta, A. A Review on Integration of Electric Vehicles into a Smart Power Grid and Vehicle-to-Grid Impacts. In Proceedings of the 2019 8th International Conference on Power Systems (ICPS), Jaipur, India, 20–22 December 2019; pp. 1–5. [Google Scholar] [CrossRef]
  39. Khosrojerdi, F.; Taheri, S.; Taheri, H.; Pouresmaeil, E. Integration of Electric Vehicles into a Smart Power Grid: A Technical Review. In Proceedings of the 2016 IEEE Electrical Power and Energy Conference, EPEC 2016, Ottawa, ON, Canada, 12–14 October 2016. [Google Scholar] [CrossRef]
  40. Dwi Atmaja, T.; Susanti, V.; Mirdanies, M.; Muharam, A. V2G Development on Public Vertical Parking Lot to Support Community Energy Management System. MATEC Web Conf. 2018, 164, 01046. [Google Scholar] [CrossRef]
  41. Chukwu, U.C. The Impact of V2G Location on Energy Loss Reduction. In Proceedings of the 2020 Clemson University Power Systems Conference (PSC), Clemson, SC, USA, 10–13 March 2020; IEEE: New York, NY, USA, 2020; Volume 29117, pp. 1–4. [Google Scholar]
  42. Zheng, Y.; Shao, Z.; Lei, X.; Shi, Y.; Jian, L. The Economic Analysis of Electric Vehicle Aggregators Participating in Energy and Regulation Markets Considering Battery Degradation. J. Energy Storage 2022, 45, 103770. [Google Scholar] [CrossRef]
  43. Tan, K.M.; Ramachandaramurthy, V.K.; Yong, J.Y. Integration of Electric Vehicles in Smart Grid: A Review on Vehicle to Grid Technologies and Optimization Techniques. Renew. Sustain. Energy Rev. 2016, 53, 720–732. [Google Scholar] [CrossRef]
  44. Comi, A.; Elnour, E. Challenges for Implementing Vehicle-to-Grid Services in Parking Lots: A State of the Art. Energies 2024, 17, 6240. [Google Scholar] [CrossRef]
  45. Alnahhal, R.H.; Naiem, A.F.; Shaaban, M.F.; Ismail, M. Optimal Planning of Parking Lots of PEVs Incorporating V2G for Reliability Improvement of Distribution Systems. IEEE Access 2022, 10, 123521–123533. [Google Scholar] [CrossRef]
  46. Comi, A.; Elnour, E. Vehicle-to-Grid Services in University Campuses: A Case Study at the University of Rome Tor Vergata. Future Transp. 2025, 5, 89. [Google Scholar] [CrossRef]
  47. Nurul Habib, K.M.; Morency, C.; Trépanier Martin, M. Integrating Parking Behaviour in Activity-Based Travel Demand Modelling: Investigation of the Relationship between Parking Type Choice and Activity Scheduling Process. Transp. Res. Part A Policy Pract. 2012, 46, 154–166. [Google Scholar] [CrossRef]
  48. Al-Sahili, K.; Hamadneh, J. Establishing Parking Generation Rates/Models of Selected Land Uses for Palestinian Cities. Transp. Res. Part A Policy Pract. 2016, 91, 213–222. [Google Scholar] [CrossRef]
  49. Ottosson, D.B.; Chen, C.; Wang, T.; Lin, H. The Sensitivity of On-Street Parking Demand in Response to Price Changes: A Case Study in Seattle, WA. Transp. Policy 2013, 25, 222–232. [Google Scholar] [CrossRef]
  50. Parmar, J.; Das, P.; Dave, S.M. A Machine Learning Approach for Modelling Parking Duration in Urban Land-Use. Phys. A Stat. Mech. Its Appl. 2021, 572, 125873. [Google Scholar] [CrossRef]
  51. Tong, C.O.; Wong, S.C.; Leung, B.S.Y. Estimation of Parking Accumulation Profiles from Survey Data. Transportation 2004, 31, 183–202. [Google Scholar] [CrossRef]
  52. Nguyen, H.; Hansen, C.K. Short-Term Electricity Load Forecasting with Time Series Analysis. In Proceedings of the 2017 IEEE International Conference on Prognostics and Health Management, ICPHM, Dallas, TX, USA, 19–21 June 2017; Volume 2017, pp. 214–221. [Google Scholar] [CrossRef]
  53. Elsaraiti, M.; Ali, G.; Musbah, H.; Merabet, A.; Little, T. Time Series Analysis of Electricity Consumption Forecasting Using ARIMA Model. In Proceedings of the IEEE Green Technologies Conference, Virtual, 7–9 April 2021; Volume 2021, pp. 259–262. [Google Scholar] [CrossRef]
  54. Kong, W.; Dong, Z.Y.; Jia, Y.; Hill, D.J.; Xu, Y.; Zhang, Y. Short-Term Residential Load Forecasting Based on LSTM Recurrent Neural Network. IEEE Trans. Smart Grid 2019, 10, 841–851. [Google Scholar] [CrossRef]
  55. Lee, Y.S.; Tong, L.I. Forecasting Time Series Using a Methodology Based on Autoregressive Integrated Moving Average and Genetic Programming. Knowl.-Based Syst. 2011, 24, 66–72. [Google Scholar] [CrossRef]
  56. Comi, A.; Idone, I. The Use of Electric Vehicles to Support the Needs of the Electricity Grid: A Systematic Literature Review. Appl. Sci. 2024, 14, 8197. [Google Scholar] [CrossRef]
  57. Comi, A.; Atumo, E.A. Data-Driven Methodology for Identifying Vehicle-to-Grid Parking Regions in Urban Areas. J. Urban Mobil. 2025, 8, 100161. [Google Scholar] [CrossRef]
  58. Comi, A.; Crisalli, U.; Sportiello, S. Forecasting the Vehicle Energy Potential to Support the Needs of Electricity Grid: A Floating Car Data-Based Methodology. Front. Future Transp. 2024, 5, 1500224. [Google Scholar] [CrossRef]
  59. Cheng, Z.; Xu, H.; Wang, Y.; Zhou, H. Time Series Forecasting Based on ARIMA and LSTM Models. In Proceedings of the 2023 International Conference on Power, Electrical Engineering, Electronics and Control (PEEEC), Athens, Greece, 25–27 September 2023; pp. 359–364. [Google Scholar] [CrossRef]
  60. Hyndman, R.J.; Athanasopoulos, G. Forecasting: Principles and Practice; OTexts: Melbourne, Australia, 2018; Volume 2. [Google Scholar]
  61. Siami-Namini, S.; Namin, A.S. Forecasting Economics and Financial Time Series: ARIMA vs. LSTM. arXiv 2018, arXiv:1803.06386. [Google Scholar] [CrossRef]
  62. Zhang, Y.; Hao, X.; Liu, Y. Simplifying Long Short-Term Memory for Fast Training and Time Series Prediction. J. Phys. Conf. Ser. 2019, 1213, 042039. [Google Scholar] [CrossRef]
  63. Albeladi, K.; Zafar, B.; Mueen, A. Time Series Forecasting Using LSTM and ARIMA. Int. J. Adv. Comput. Sci. Appl. 2023, 14, 313–320. [Google Scholar] [CrossRef]
  64. Ismail Fawaz, H.; Forestier, G.; Weber, J.; Idoumghar, L.; Muller, P.-A. Deep Learning for Time Series Classification: A Review. Data Min. Knowl. Discov. 2019, 33, 917–963. [Google Scholar] [CrossRef]
  65. Jason, B. Deep Learning for Time Series Forecasting: Predict the Future with MLPs, CNNs and LSTMs in Python; SZTE TTIK Informatikai Intézet: Szeged, Hungary, 2018. [Google Scholar]
  66. Zhang, T.; Chen, X.; Wu, B.; Dedeoglu, M.; Zhang, J.; Trajkovic, L. Stochastic Modeling and Analysis of Public Electric Vehicle Fleet Charging Station Operations. IEEE Trans. Intell. Transport. Syst. 2022, 23, 9252–9265. [Google Scholar] [CrossRef]
  67. Comi, A.; Idone, I. Analysis of the Performances of Electric Vehicle Batteries: A Systematic Literature Review. J. Adv. Transp. 2026, ATR5546290. [Google Scholar]
  68. Chen, X.; Zhang, T.; Ye, W.; Wang, Z.; Iu, H.H.-C. Blockchain-Based Electric Vehicle Incentive System for Renewable Energy Consumption. IEEE Trans. Circuits Syst. II 2021, 68, 396–400. [Google Scholar] [CrossRef]
  69. Chen, X.; Wang, H.; Wu, F.; Wu, Y.; Gonzalez, M.C.; Zhang, J. Multimicrogrid Load Balancing Through EV Charging Networks. IEEE Internet Things J. 2022, 9, 5019–5026. [Google Scholar] [CrossRef]
Figure 2. Result of cluster analysis.
Vehicles 08 00030 g002
Figure 3. Daily total energy output.
Vehicles 08 00030 g003
Figure 4. The surplus energy output and its three additive components along the surveyed workdays.
Vehicles 08 00030 g004
Table 1. A comparative summary of representative V2G studies.
Ref.Data SourceV2G Hub
Location Method
Parking
Behavior
Surplus Energy EstimationForecastingTemporal
Resolution
Key
Limitations
[12]CyclesProfit maximizationRandomDegradation-awareNoneHourlySynthetic ≠ real mobility
[26]SyntheticNetwork
optimization
Fixed scenariosSimple SOCNoneHourlyHypothetical;
no behavior
[27]SimulatedMicrogrid sizingAssumed
participation
Degradation costNoneHourlyNo empirical
aggregation
[36]SurveyPre-defined areasDistributionsResidual post-tripsNone15-minBias; low
granularity
[45]Monte-CarloReliability
optimization
ProbabilisticResidual SOCNoneHourlyNo validation
[46]FCDPredetermined
(campus)
Trip detectionReal-time mobility-preservingARIMA/LSTM30 minFixed site;
campus-specific
this paperFCDk-means + duration maxObserved
arrival/departure
Residual + 20% contingencyARIMA/LSTM30 min
Table 2. Nomenclature of variables used in the energy computation.
VariableDefinitionUnit
E a s , v i The surplus energy to be transferred to the grid from a given vehiclekWh
E e p d , v i The transferred energy to the grid expected from a given vehicle when parkedkWh
Q r , v i The energy transfer rate from the vehicle to the gridkW
E t , v i Theoretical energy remaining after daily travel activitieskWh
Q v i The battery capacity of a given vehiclekWh
E c , v i The energy consumed for the distance traveled to parking lotkWh
L b p , v i Total distance traveled before parking in the V2G parking zonekm
E p k m , v i The energy consumption rate per kilometerkWh/km
E r , v i Energy required for the remaining travel (e.g., return trip)kWh
L a p , v i Total distance traveled before parking in the V2G parking zonekm
E c o n t , v i Contingency energy reserve (20% of battery capacity)kWh
Table 3. Coefficients of the autoregressive and moving average components of the ARIMA model.
ar1ar2ma1ma2Mean
Coefficients0.969−0.941−0.8440.833293.883
standard deviation0.0370.0370.0530.0743.016
Disclaimer/Publisher’s Note: The statements, opinions and data contained in all publications are solely those of the individual author(s) and contributor(s) and not of MDPI and/or the editor(s). MDPI and/or the editor(s) disclaim responsibility for any injury to people or property resulting from any ideas, methods, instructions or products referred to in the content.