Abstract
Understanding the behavior of tires on uneven and varied road surfaces poses a substantial challenge for vehicle ride engineers. To accurately predict road load forces on the axle, various numerical ride models must be utilized to incorporate a realistic road enveloping algorithm. This algorithm filters the geometries of uneven surfaces and must be seamlessly integrated with a rigid ring model. The complexity of predicting and calculating dynamic tire response increases with varying obstacle dimensions. A two-dimensional, five-degree-of-freedom rigid ring ride model based on Short Wavelength Intermediate Frequency (SWIFT) has been developed, employing a tandem cam enveloping algorithm to filter short wavelength road obstacles. Selecting generalized cam parameters to ensure high accuracy and an enhanced runtime performance poses a challenge in specific ride simulations. A design of experiments (DOE) approach is used to identify key control factors related to the quasi-static tandem cam enveloping model and dynamic rigid ring model, which significantly affect the enveloping response. DOE findings suggest optimization strategies for selecting tire parameters to achieve a high test-to-simulation correlation with improved computational efficiency. Additionally, the study confirms the robustness of these predictions against external noise factors, including variations in tires and road conditions.
1. Introduction
The automotive industry faces the significant challenge of accelerating vehicle development through virtual prototyping. For virtual simulations to effectively analyze vehicle behavior, precise mathematical models of critical vehicle components are essential. The tire is pivotal in vehicle dynamics, as it transmits all forces and moments—excluding aerodynamic forces—to the vehicle. Given that pneumatic tires, composed of rubber and air, exhibit behavior highly dependent on the frequency and amplitude of excitation (i.e., loading rate), developing a universal tire model that accurately predicts spindle forces across a wide frequency range and various loading conditions is complex. Consequently, multiple tire models have been developed to study tire characteristics and tire–road interactions, each tailored to meet the specific demands of different analyses within the industry.
For ride and durability analysis, vertical force generation against rough surfaces is considerable and cannot be ignored. The generation of vertical force depends on the amplitude and frequency of rough road excitation. In general, if the road obstacles are smaller than the circumference of the tire, it is considered a rough road. A simple tire model used in handling is not sufficient in this case. The most popular approach in modeling the response of tires rolling over short wavelength roads combines the enveloping (contact) model with a rigid ring model. The enveloping model, coupled with the rigid ring model, captures the essential dynamics of the tire in the intermediate frequency range. However, it does not account for the flexible tire vibrating modes in the high-frequency range. The contact or enveloping model is essential for accurately capturing the tire’s interaction with road irregularities, directly affecting ride comfort and vehicle handling. For instance, research in the tire dynamics literature often highlights the enveloping model’s role in distributing load and simulating the tire’s deformation under vertical loads (e.g., Pacejka’s work on tire and vehicle dynamics [1]). Additionally, the comprehensive review of tire models by Deur [2] underscores the significance of the contact model in tire–road interaction, particularly in vertical dynamics.
To understand the complete physics of the vehicle ride, engineers responsible for fully analytical full-vehicle multi-body simulations should understand the tire model used in the simulation. The industry’s most commonly used tire model to study the dynamics ranging from 0 to 100 Hz (intermediate frequencies), which primarily includes ride and comfort studies, is the rigid ring based tire model. In the case of rigid ring based models, understanding the effect of critical mathematical tire parameters on the overall dynamics of force generation is the first step in tuning a vehicle for ride and comfort. Although it is most commonly used, very few studies are available that comprehensively explain the effect of important tire modeling parameters on vertical and longitudinal tire response. Mancosu et al. [3] demonstrated the effect of 2D rigid ring tire parameters on the ride comfort of vehicles and also gave a technique for determining these parameters by measuring some physical tire parameters. Schmitz et al. [4] elaborated on the importance of SWIFT (Short Wavelength Intermediate Frequency) tire parameters with its parameterization technique for improving the tire parameter identification process for industrial applications.
Recent studies have extended the understanding of tire rigid ring modeling, providing novel insights into ride comfort applications and the impact of different tire models on vehicle dynamics [5,6,7]. The rigid ring model effectively captures the low- to mid-frequency range of tire dynamics. However, it falls short of accurately representing high-frequency vibrations. Advanced models incorporating flexible elements or hybrid approaches have been developed to address this. These models extend the frequency range and improve the simulation accuracy of tire dynamics, as discussed in studies focused on high-frequency vibration analysis. Yu et al. [8] present a theoretical three-dimensional ring-based model to analyze tires’ high-order bending vibrations. This model is developed to capture the complex dynamic behavior of tires, mainly focusing on high-frequency vibration modes critical for accurate simulation and prediction of tire performance.
By incorporating three-dimensional characteristics, the model offers a more comprehensive representation of tire dynamics than traditional models. The authors validate their model through comparisons with experimental data, demonstrating its effectiveness and potential application in improving tire design and performance evaluation. Barbaro et al. [5] extended the multiphysical magic formula tire model to improve ride comfort, showcasing its nonlinear dynamics. Their study enhancements allow for better simulation and assessment of tire behavior in various comfort scenarios. Mottola et al. [6] compared the effects of the MF-Tyre and MF-Swift models on the stability and ride dynamics of two-wheeled vehicles. Their findings highlighted significant differences in the handling and dynamic responses between the two models. Uhlar et al. [7] evaluated two physical tire models concerning their noise, vibration, and harshness (NVH) performance up to 300 Hz. The assessment revealed critical insights into the models’ effectiveness in simulating realistic NVH behavior for vehicle dynamics analysis. These studies emphasize the continuous development in tire modeling, and our research builds on this foundation by focusing on the sensitivity analysis of tire parameters using a DOE approach, which has not been extensively covered in previous works.
Enhanced models now address braking and steering forces’ integration within the tire’s contact patch, ensuring robust simulations across varying conditions of wheel slip and sideslip angles [9]. Research into rubber friction’s mechanisms highlights its critical role in tire traction, emphasizing load and velocity dependencies [10]. Studies on the structural dynamics of tires provide insights into tire responses to road excitations [9,11,12,13], revealing the influence of tread design modifications on tire dynamics [14]. The evolution of intelligent tire technologies has been instrumental in accurately determining tire forces and contact patch dynamics, facilitating significant improvements in vehicle control systems and tire performance evaluation [15]. Deploying strain-based sensors in intelligent tires captures real-time tire–road interaction data, enriching vehicle dynamics modeling [16].
Explorations into the stress fields of tire contact patches offer foundational insights into vehicle control forces and tire wear mechanisms [17]. Schütte and Sextro [18] examined the effects of operational parameters on tire lateral dynamics, which are crucial for understanding tire–road interactions and active safety systems. Research on stability control during tire blowouts, especially with run-flat tires, provides valuable data for developing safety features and optimizing tire performance post-blowout [19]. The selection of a slip model for a semi-empirical tire model is also crucial to give a good mix of complexity and simplicity, and the pragmatic slip model seems a reasonable approach in many studies as they incorporate both physical and empirical approaches [20].
This study utilizes a rigid ring-based tire model, simulated against short obstacles, to analyze tire modeling parameters and create a sensitivity index. The model includes a rigid ring representing the tire belt and a tandem cam enveloping model for filtering the road surface, which is partially based on the work of Schmeitz, Pacejka, and Zegelaar. The rigid ring is elastically suspended from the rim with spring-damper elements, simulating the tire sidewalls with pressurized air. Two models describe the tire–road contact: an enveloping model to create an effective road surface and a slip model.
This paper is structured as follows: Section 2 details the materials and methods, encompassing the tandem elliptical cam model, rigid ring model, and DOE-based Taguchi analysis utilized in the experiments. Section 3 outlines the Taguchi-based experimental setup for low- and high-speed tire rolling over the cleat. Section 4 presents the results and discussion, focusing on the sensitivity analysis of tire parameters and their robustness against noise factors. Section 4 and Section 5 provide a comprehensive discussion of the results, conclude the study, summarize key findings, highlight the effectiveness of the DOE approach in optimizing tire models, and suggest directions for future research.
2. Materials and Methods
2.1. Enveloping Model
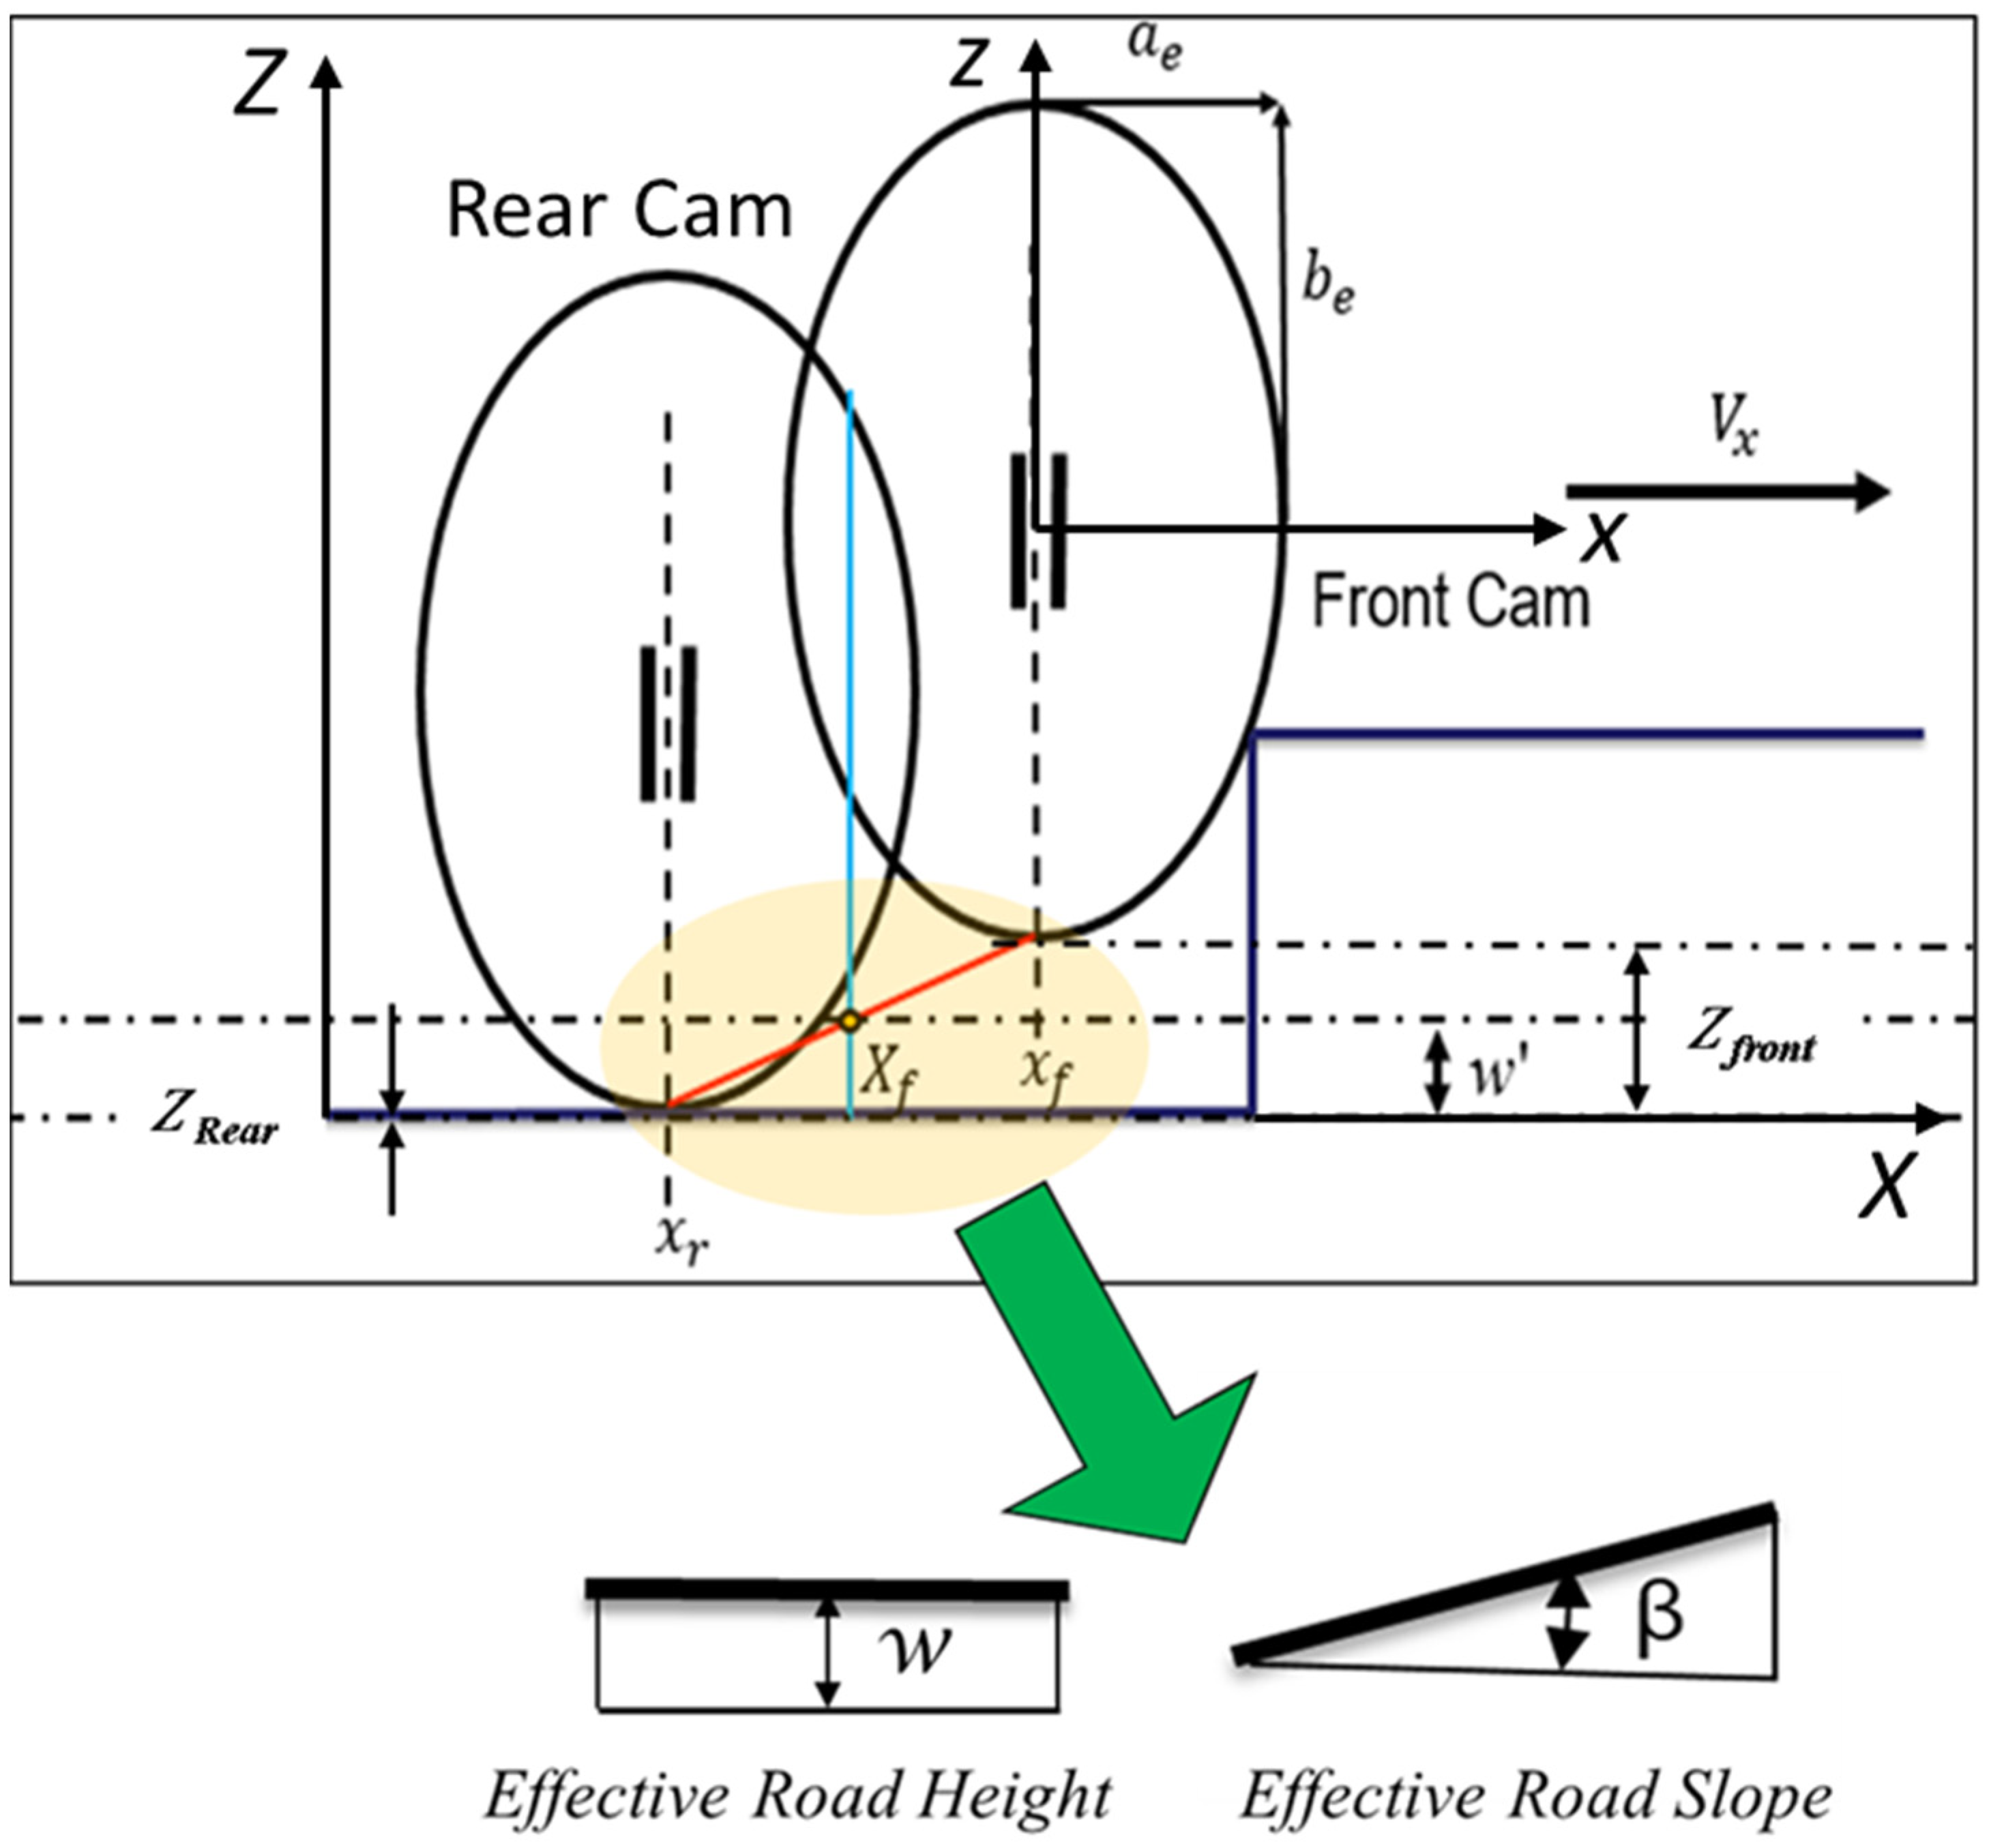
Figure 1 shows the schematic of the tandem elliptical cam model, which moves over obstacles. In this approach, cams move together to filter out sharp road irregularities, providing an effective road surface. In Figure 1, the cams move over the obstacle with a velocity along the X direction, and they move vertically in the Z direction while traversing the obstacle. The effective height, w, equals the height of the midpoint of the lower tandem rod.
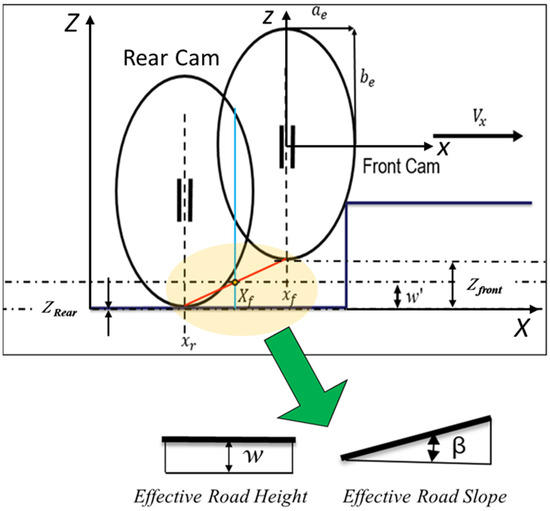
Figure 1.
Tandem Elliptical Cam Model [4].
The equation for the effective height reads:
The Zfront and Zrear are the vertical displacements at the front and rear of the tire’s contact patch, respectively.
The inclination angle of the tandem rod corresponds to the effective forward slope tan βy:
where ls represents the length of the segment or span between the front and rear contact points being considered on the tire or rod; it is the horizontal distance over which the inclination angle βy is defined.
The general equation of any given ellipse is given by
where x and z are the horizontal and vertical coordinates in the plane of the contact patch, respectively. Additionally, ae and be are half of the length and width of the contact patch in the longitudinal and lateral directions, respectively. ce is the deformation characteristics of the tire’s rubber and the pressure distribution within the contact patch.
2.2. Rigid Ring Model
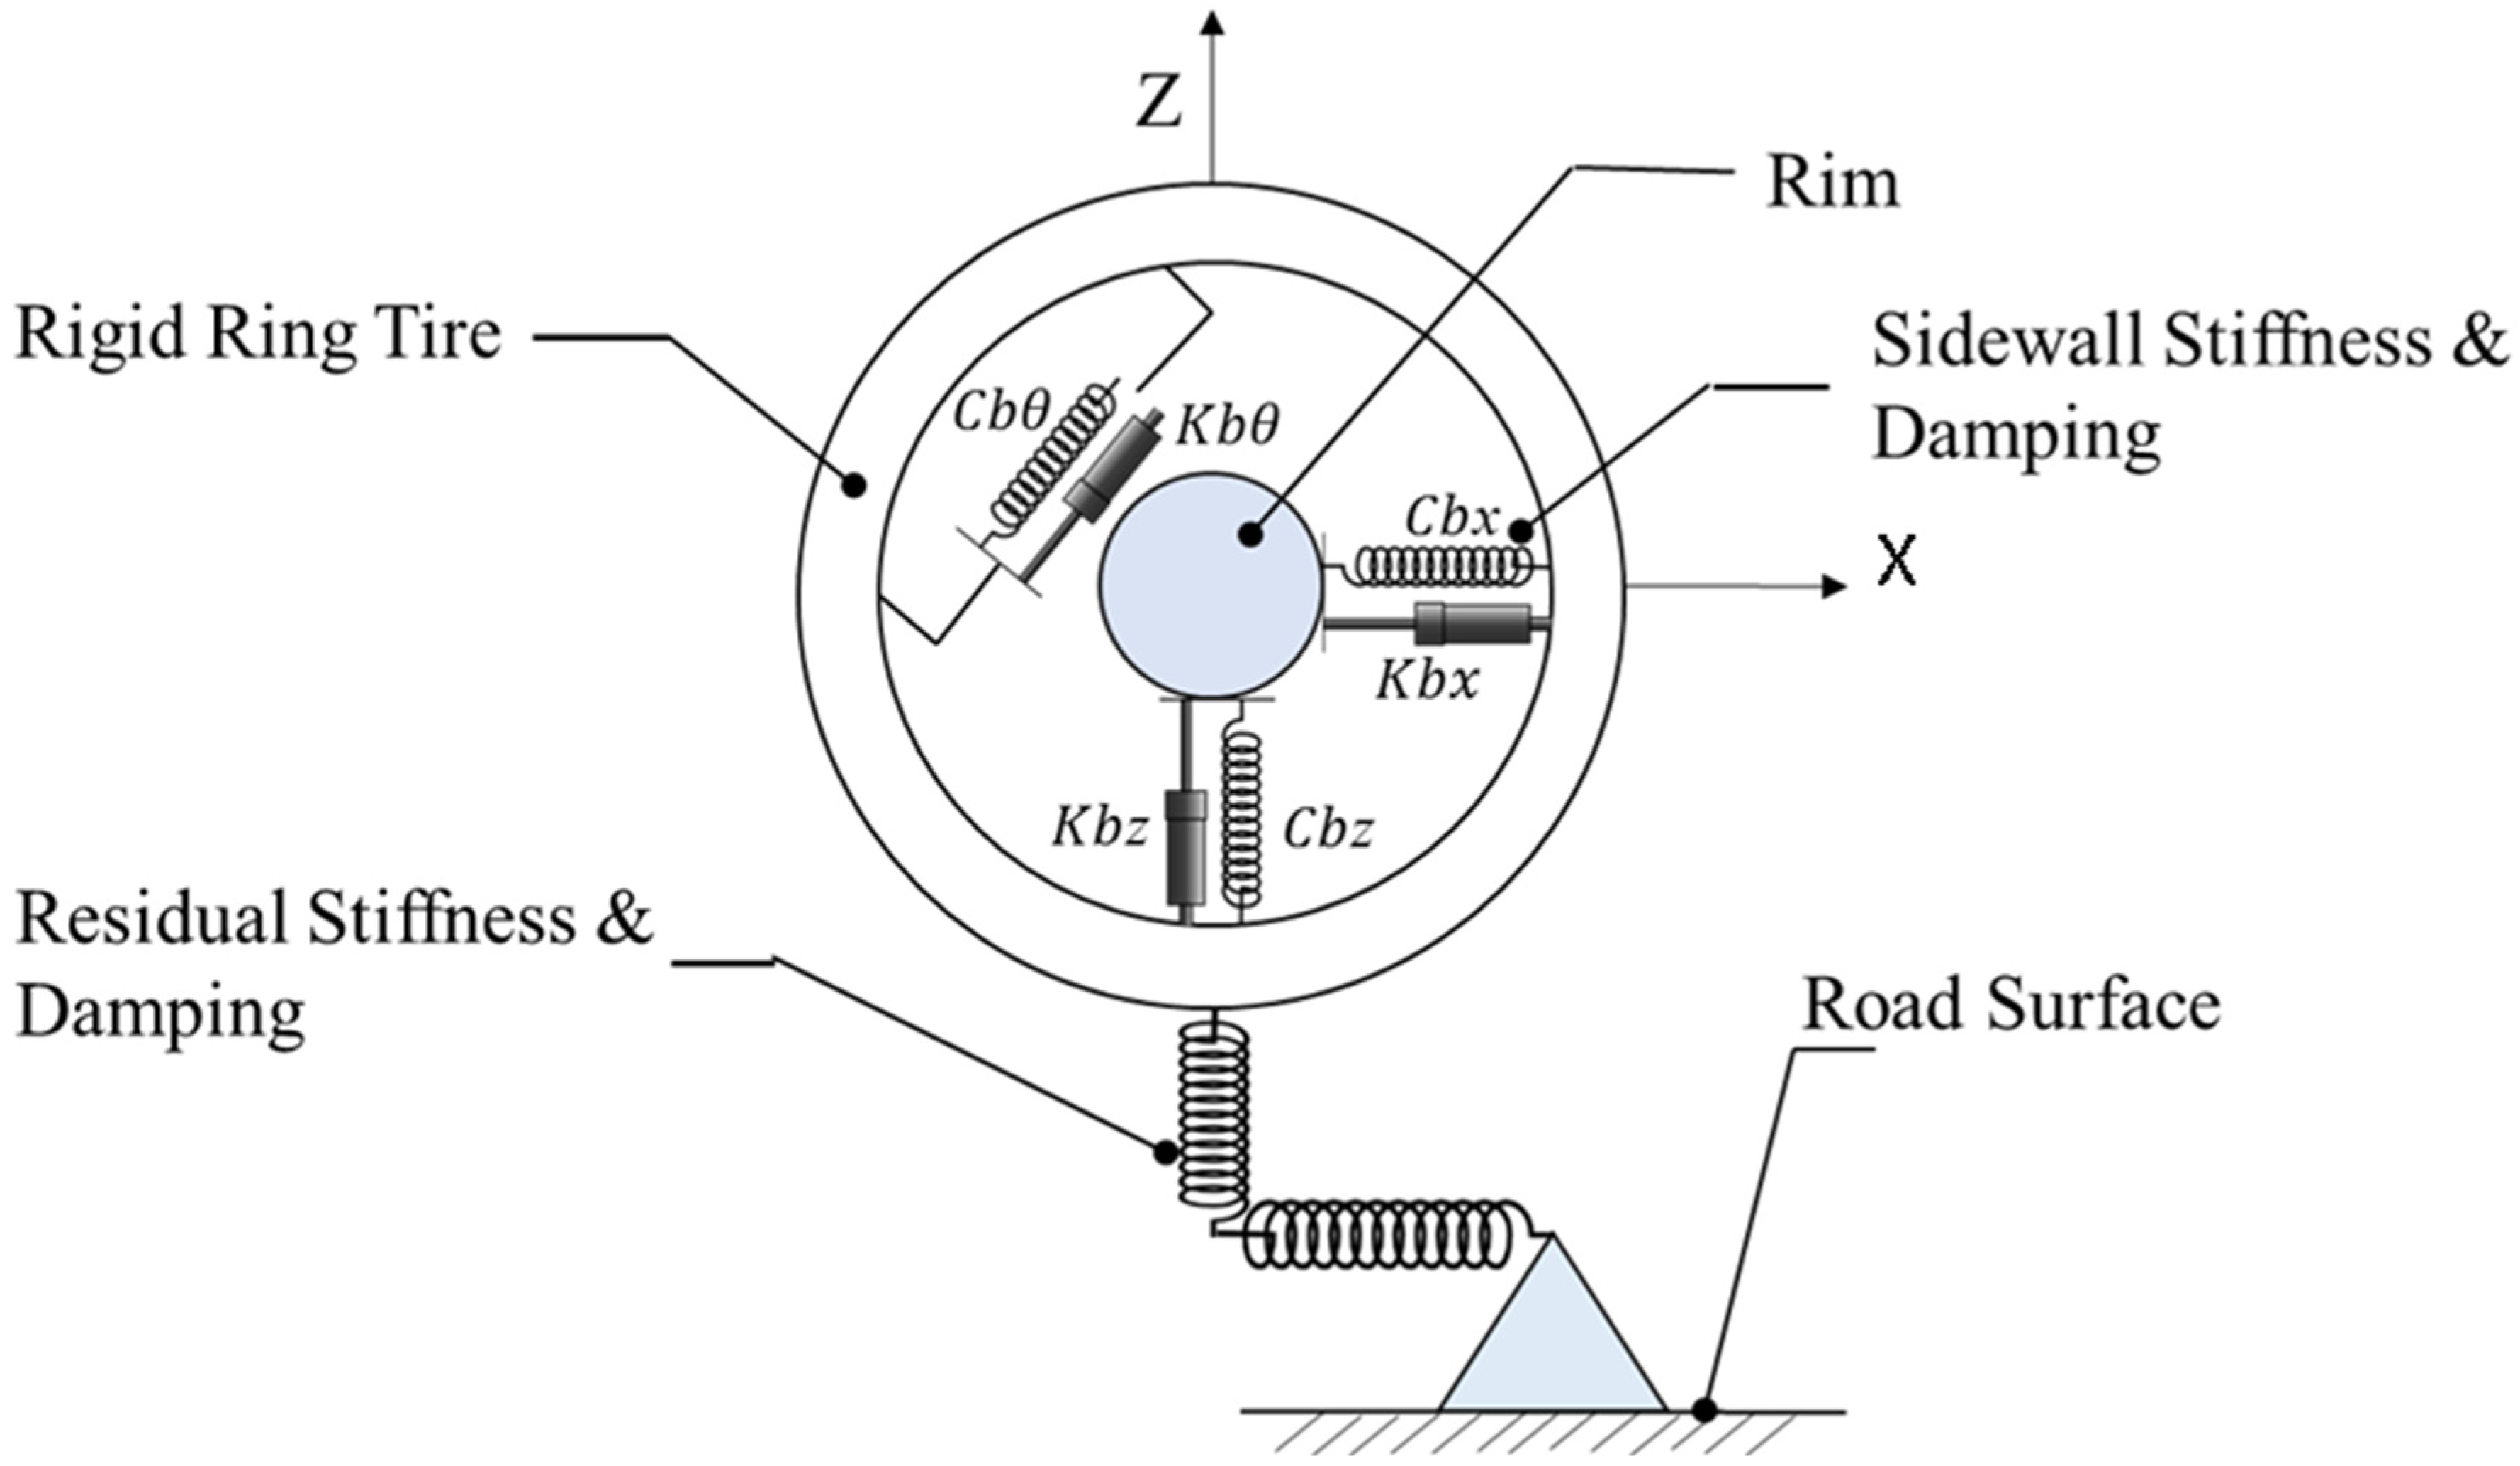
Figure 2 shows the schematic representation of the rigid ring model. It represents a pneumatic tire–wheel system with four components: tire tread-band, sidewalls with pressurized air, the rim, and a contact model. The tread-band is a rigid circular ring with three degrees of freedom: longitudinal, vertical, and rotational. The rim rotates freely around the wheel axis, connected to the tire belt through sidewalls modeled as springs and dampers. A sidewall is represented by longitudinal stiffness , longitudinal damping , vertical stiffness , vertical damping , rotational stiffness , and rotational damping . The contact model includes vertical residual stiffness and a slip model, focusing on primary tire vibration modes and accounting for static deformation of the tire.
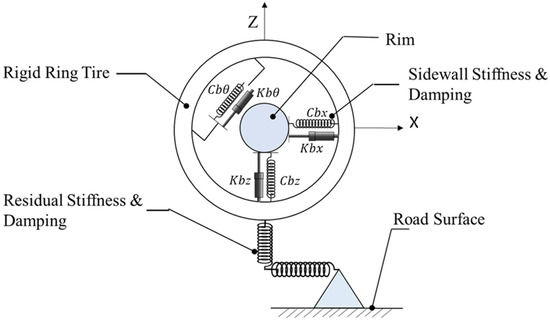
Figure 2.
Schematic representation of the rigid ring model [4].
The enveloping and slip models are coupled with the rigid ring model, resulting in the full-fledged tire model. please see the Supplementary Materials for the basic enveloping and rigid ring models with the integrated slip model.
3. Experimental Setup
3.1. DOE-Based Taguchi Analysis
Genichi Taguchi, a Japanese engineer and statistician, proposed a structured approach to determining optimal input parameter settings in any process or product design. This approach is known as the Taguchi method. This method, based on the design of experiments (DOE), classifies variables as control factors (design parameters) and noise factors (environmental factors difficult to control).
In our study, the control factors are parameters related to the mathematical tire model, and the noise factors include various road profiles, different tires, and loading conditions. We used the mixed-level Taguchi L18 method to analyze experiments involving low- and high-speed tire roll tests over obstacles. The Taguchi method was chosen for its efficiency and robustness in optimizing performance with minimal experimental runs. Unlike full factorial designs, which require exhaustive testing of all factor combinations, the Taguchi method uses orthogonal arrays to significantly reduce the number of experiments while still capturing essential factor interactions. Response Surface Methodology (RSM) is effective for detailed modeling of nonlinear interactions but often demands a more extensive experimental setup. The Taguchi method, by focusing on robust optimization and handling variable interactions and noise factors, offers a more practical approach for early-stage design and optimization, making it ideal for our study. It effectively handles the interaction of variables and noise factors, ensuring a robust design. This approach allows us to systematically investigate the influence of control factors on tire dynamics and determine the sensitivity of responses, providing a clear direction for optimization. For further understanding and justification of the Taguchi method’s advantages, we refer to the works by Genichi Taguchi, which demonstrate its effectiveness in optimizing engineering processes and product designs [21].
The SWIFT-based tire model is used to simulate two kinds of simulations. One is low-speed quasi-static simulation to analyze the enveloping behavior of the model, and the other is high-speed simulation to analyze the dynamic behavior of the tire.
Experiment 1: Low-speed Simulation to Analyze Enveloping Parameters
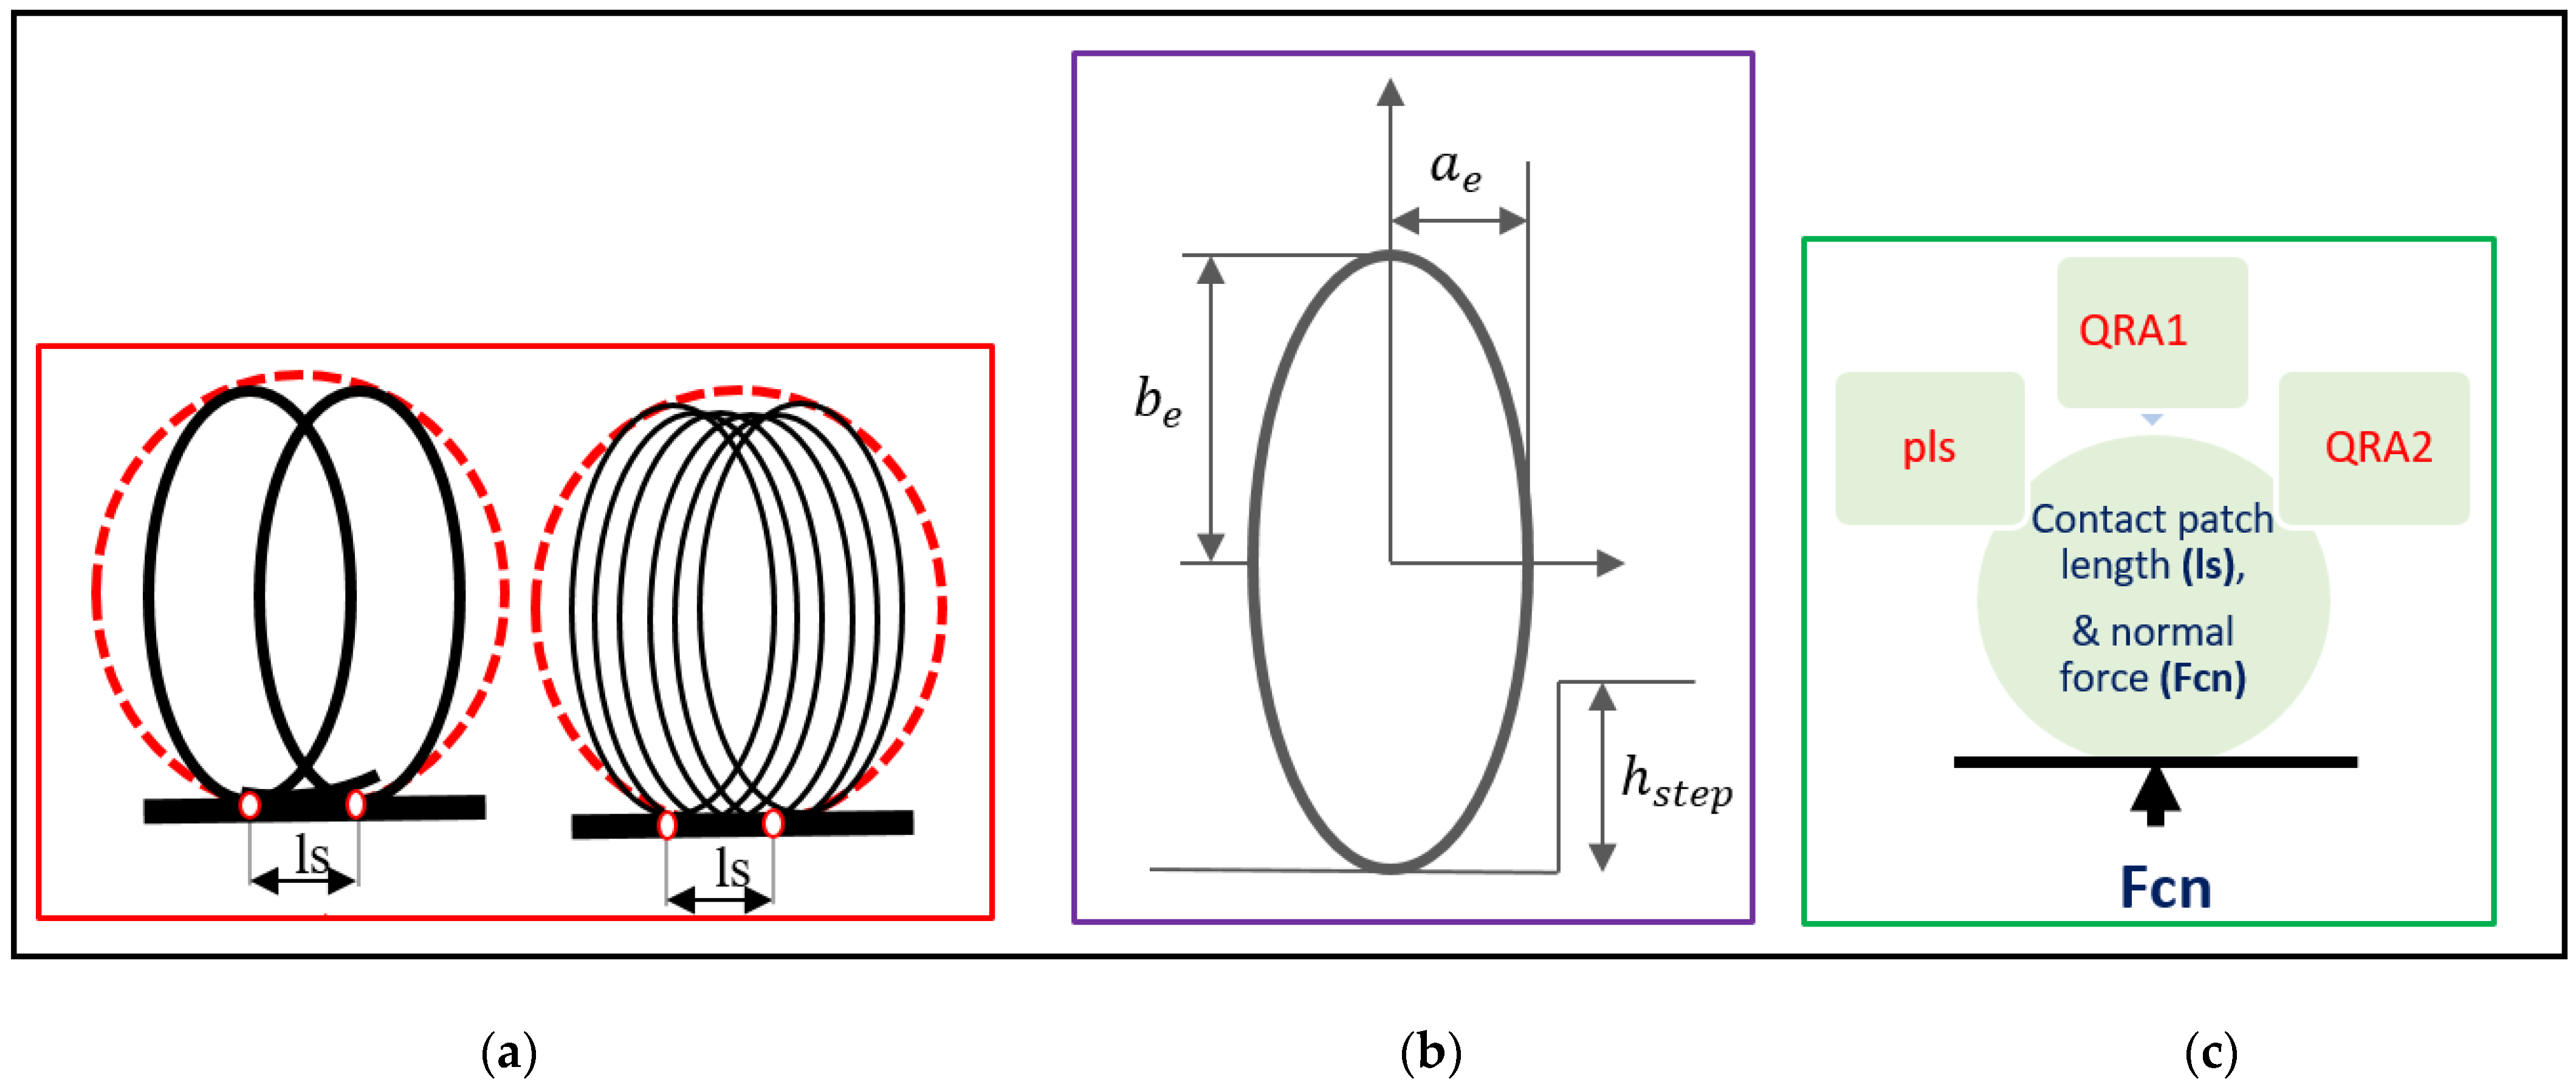
As stated above, low-speed simulation represents the quasi-static tire behavior which is primarily associated with the tire enveloping parameters. The tire is made to roll over cleats at low speed (enveloping speed: 1.12 kph), with the contact patch normal force being measured in a simulation environment. Initially, the parameters related to the tire enveloping model are handpicked, and one factor at a time sensitivity study is carried out against the considered response to shortlist the final set of control factors for this study. Finally, eight parameters (control factor) are selected, which could be classified broadly as Cam shape parameters, empirical coefficients, and number of cams. Figure 3 illustrates the control factors for the low-speed simulation.
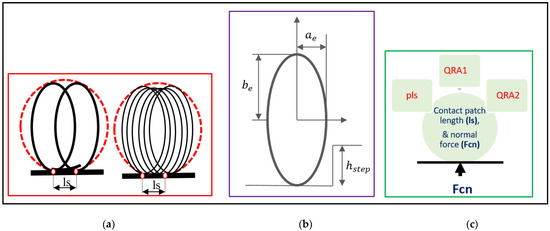
Figure 3.
Control factors for low-speed simulation (enveloping parameters). (a) Number of Cams. (b) Cam Shape Parameters. (c) Empirical Coefficients.
Low-Speed Simulations
Table 1 lists the 8 parameters (control factors) with their respective level values. These can be classified broadly in three categories as illustrated in Figure 3. Number of cams, geometrical properties of ellipse, which defines the shape of cam, and empirical coefficients, which define contact patch. Cam shape parameters are ellipse length or semi-major axis of ellipsoid (ae), ellipse height/semi-minor axis of ellipsoid (be) and ellipse order (ce). Hstep represents the maximum height of road obstacles. Empirical contact patch coefficients are as follows: ellipse shift (pls) which is the scaling of the distance between front and rear ellipsoid, QRA1 is square root term, and QRA2 is a linear term in contact length equation. These contact patch parameters govern the contact normal force (Fcn).

Table 1.
Control factors for low-speed simulation experiment.
The noise factors used for this study are the different road profiles, loading conditions, and tires. The details are listed in the table below. The Taguchi L18 technique is used to identify the dominant factors.
In total, one must run 18 simulations with the control factor levels defined in Table 2. Then, the tire contact patch normal force recorded in each run is compared with the reference response by using Pearson’s correlation coefficient. This correlation value is recorded as a response for each corresponding run.

Table 2.
Noise factors for low-speed simulation experiment.
Experiment 2: High-speed Simulation to Analyze Rigid Ring Dynamic Tire Parameters
This experiment deals with high-speed simulation, which is aimed at analyzing the parameters associated with tire dynamics. Mathematically, these parameters are related to the rigid ring model of SWIFT-based tires. In this experiment, the tire is also rolled over the cleat with a considerably high velocity, which could excite the tire dynamically. Velocities considered are 30, 60, and 90 kph to see if the analytical tire model behaves differently with different speeds.
The initial sensitivity study of rigid ring model parameters yielded a final set of 7 considered control factors for this experiment. The noise factors used are the same as in the case of experiment 1, as described in Table 3.

Table 3.
Control factors for high-speed simulation experiment.
These rigid ring factors calculate the tire sidewall stiffness and damping in vertical, horizontal, and rotational directions. Hence, it is of utmost importance to analyze the tire dynamics.
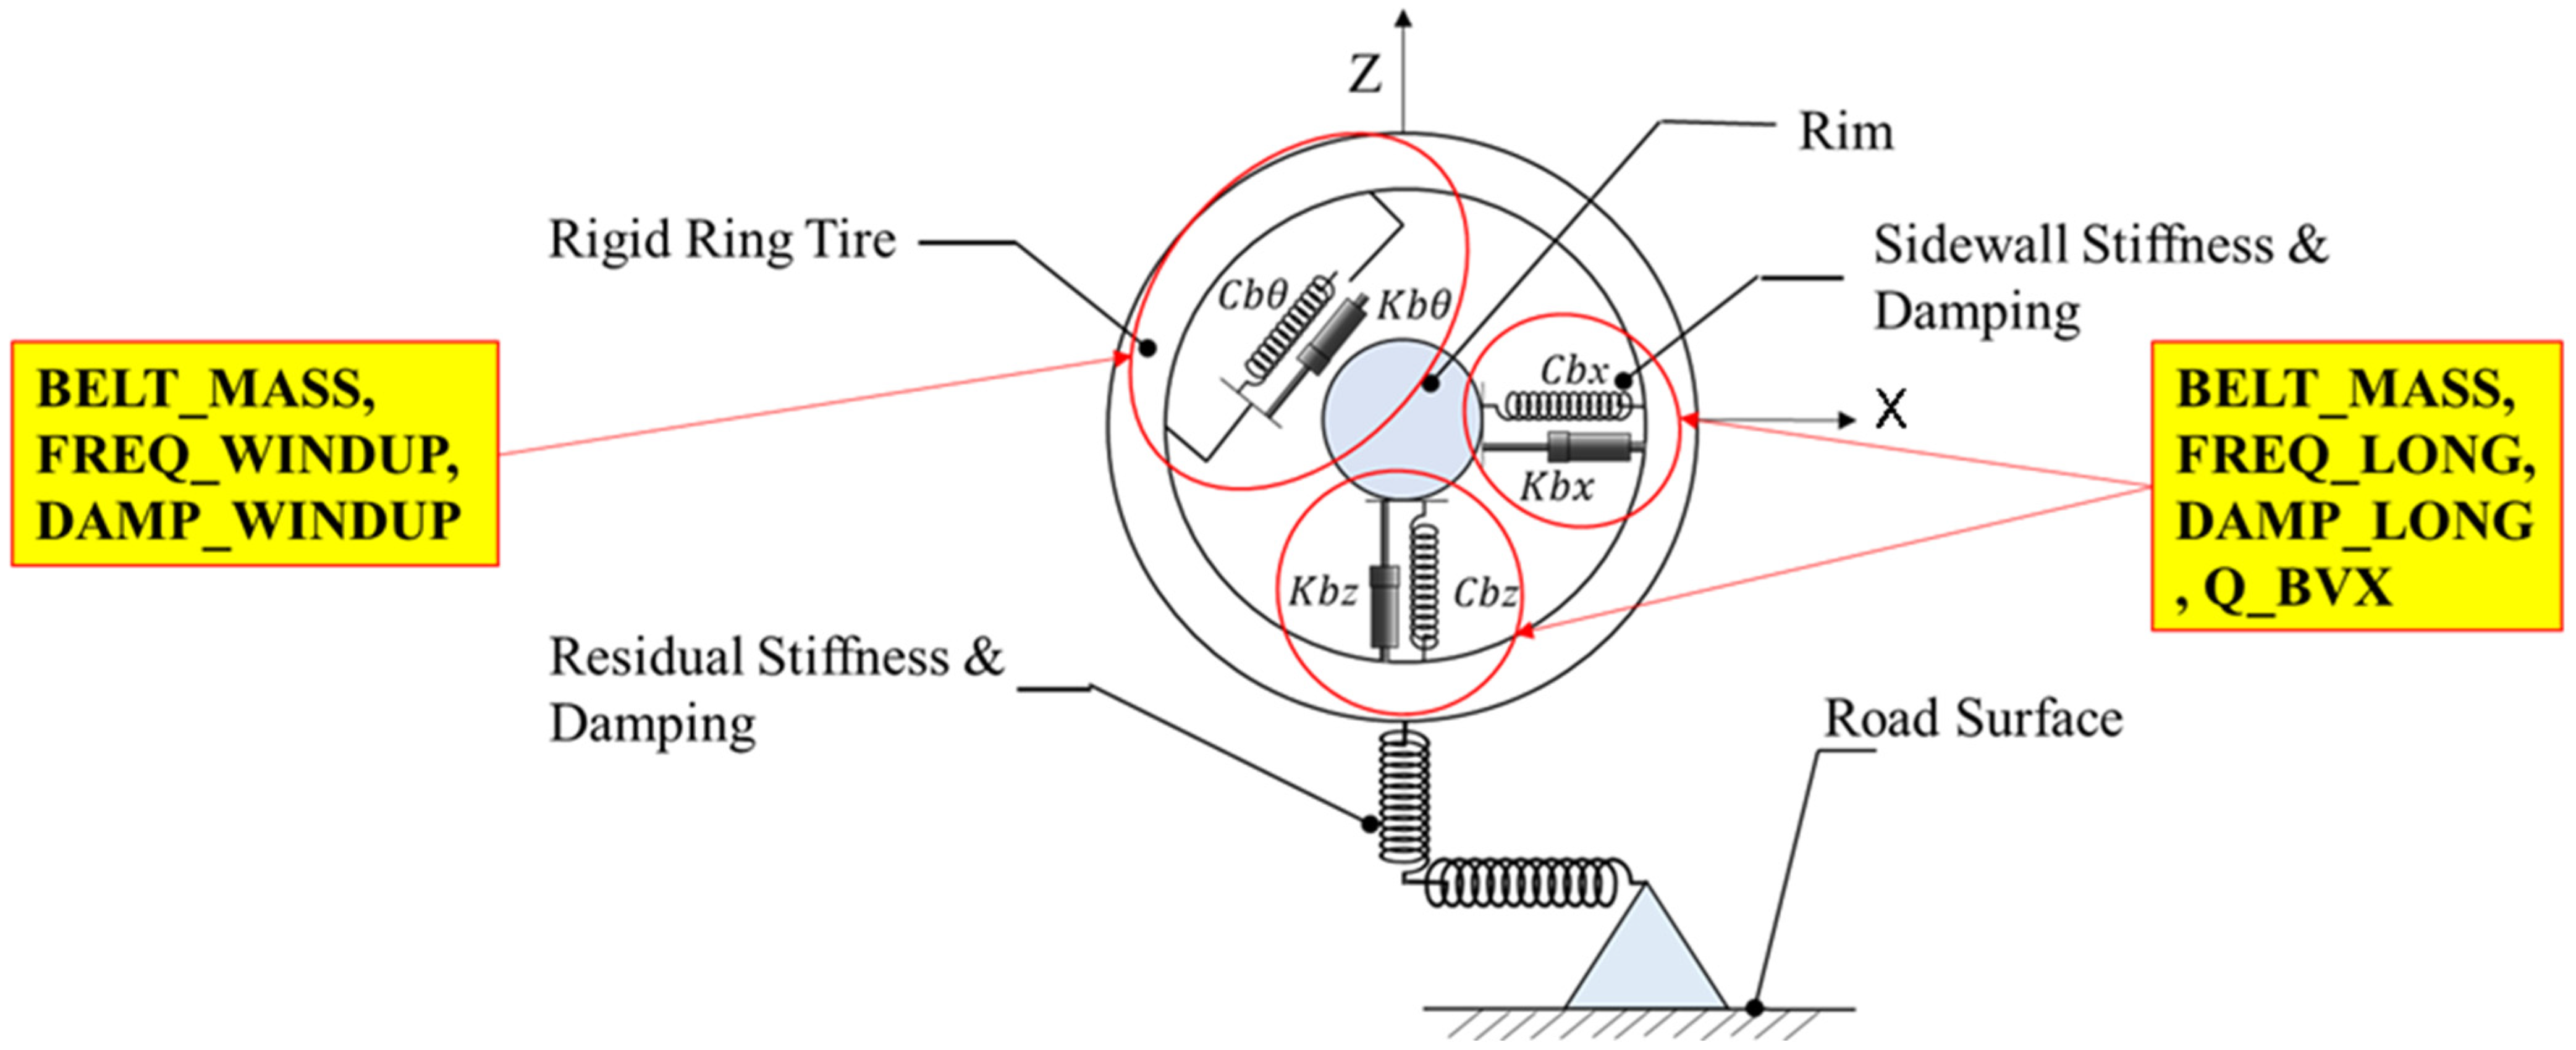
The control factors in our high-speed simulations are as follows: Damp_Residual (residual damping proportional to stiffness), Q_BVX (velocity-dependent sidewall stiffness), Freq_LONG (undamped frequency in fore/aft and vertical modes), Freq_WINDUP (undamped frequency in wind-up mode), Damp_LONG (dimensionless damping in fore/aft and vertical modes), and Damp_WINDUP (dimensionless damping in wind-up mode). Refer to Figure 4 for a visual representation of these control factors.
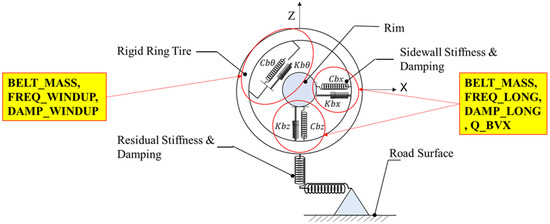
Figure 4.
Control factors for high-speed simulation (rigid ring parameters).
Again, the mixed-level Taguchi L18 orthogonal design method is used to develop factor dominance ranking and optimization direction. At each velocity, 18 individual simulations are run to record corresponding responses. To characterize tire dynamics quantitatively, vertical and horizontal forces at the axle are recorded and converted to the frequency domain by performing FFT. The resulting FFT response is characterized by three parameters: peak amplitude, frequency at peak amplitude, and damping ratio. Hence, for each velocity, there would be 6 responses, 3 for force in vertical and 3 for force in horizontal, and in total, there would be 18 responses for three velocities.
4. Results and Discussion
4.1. Low-Speed Experiment
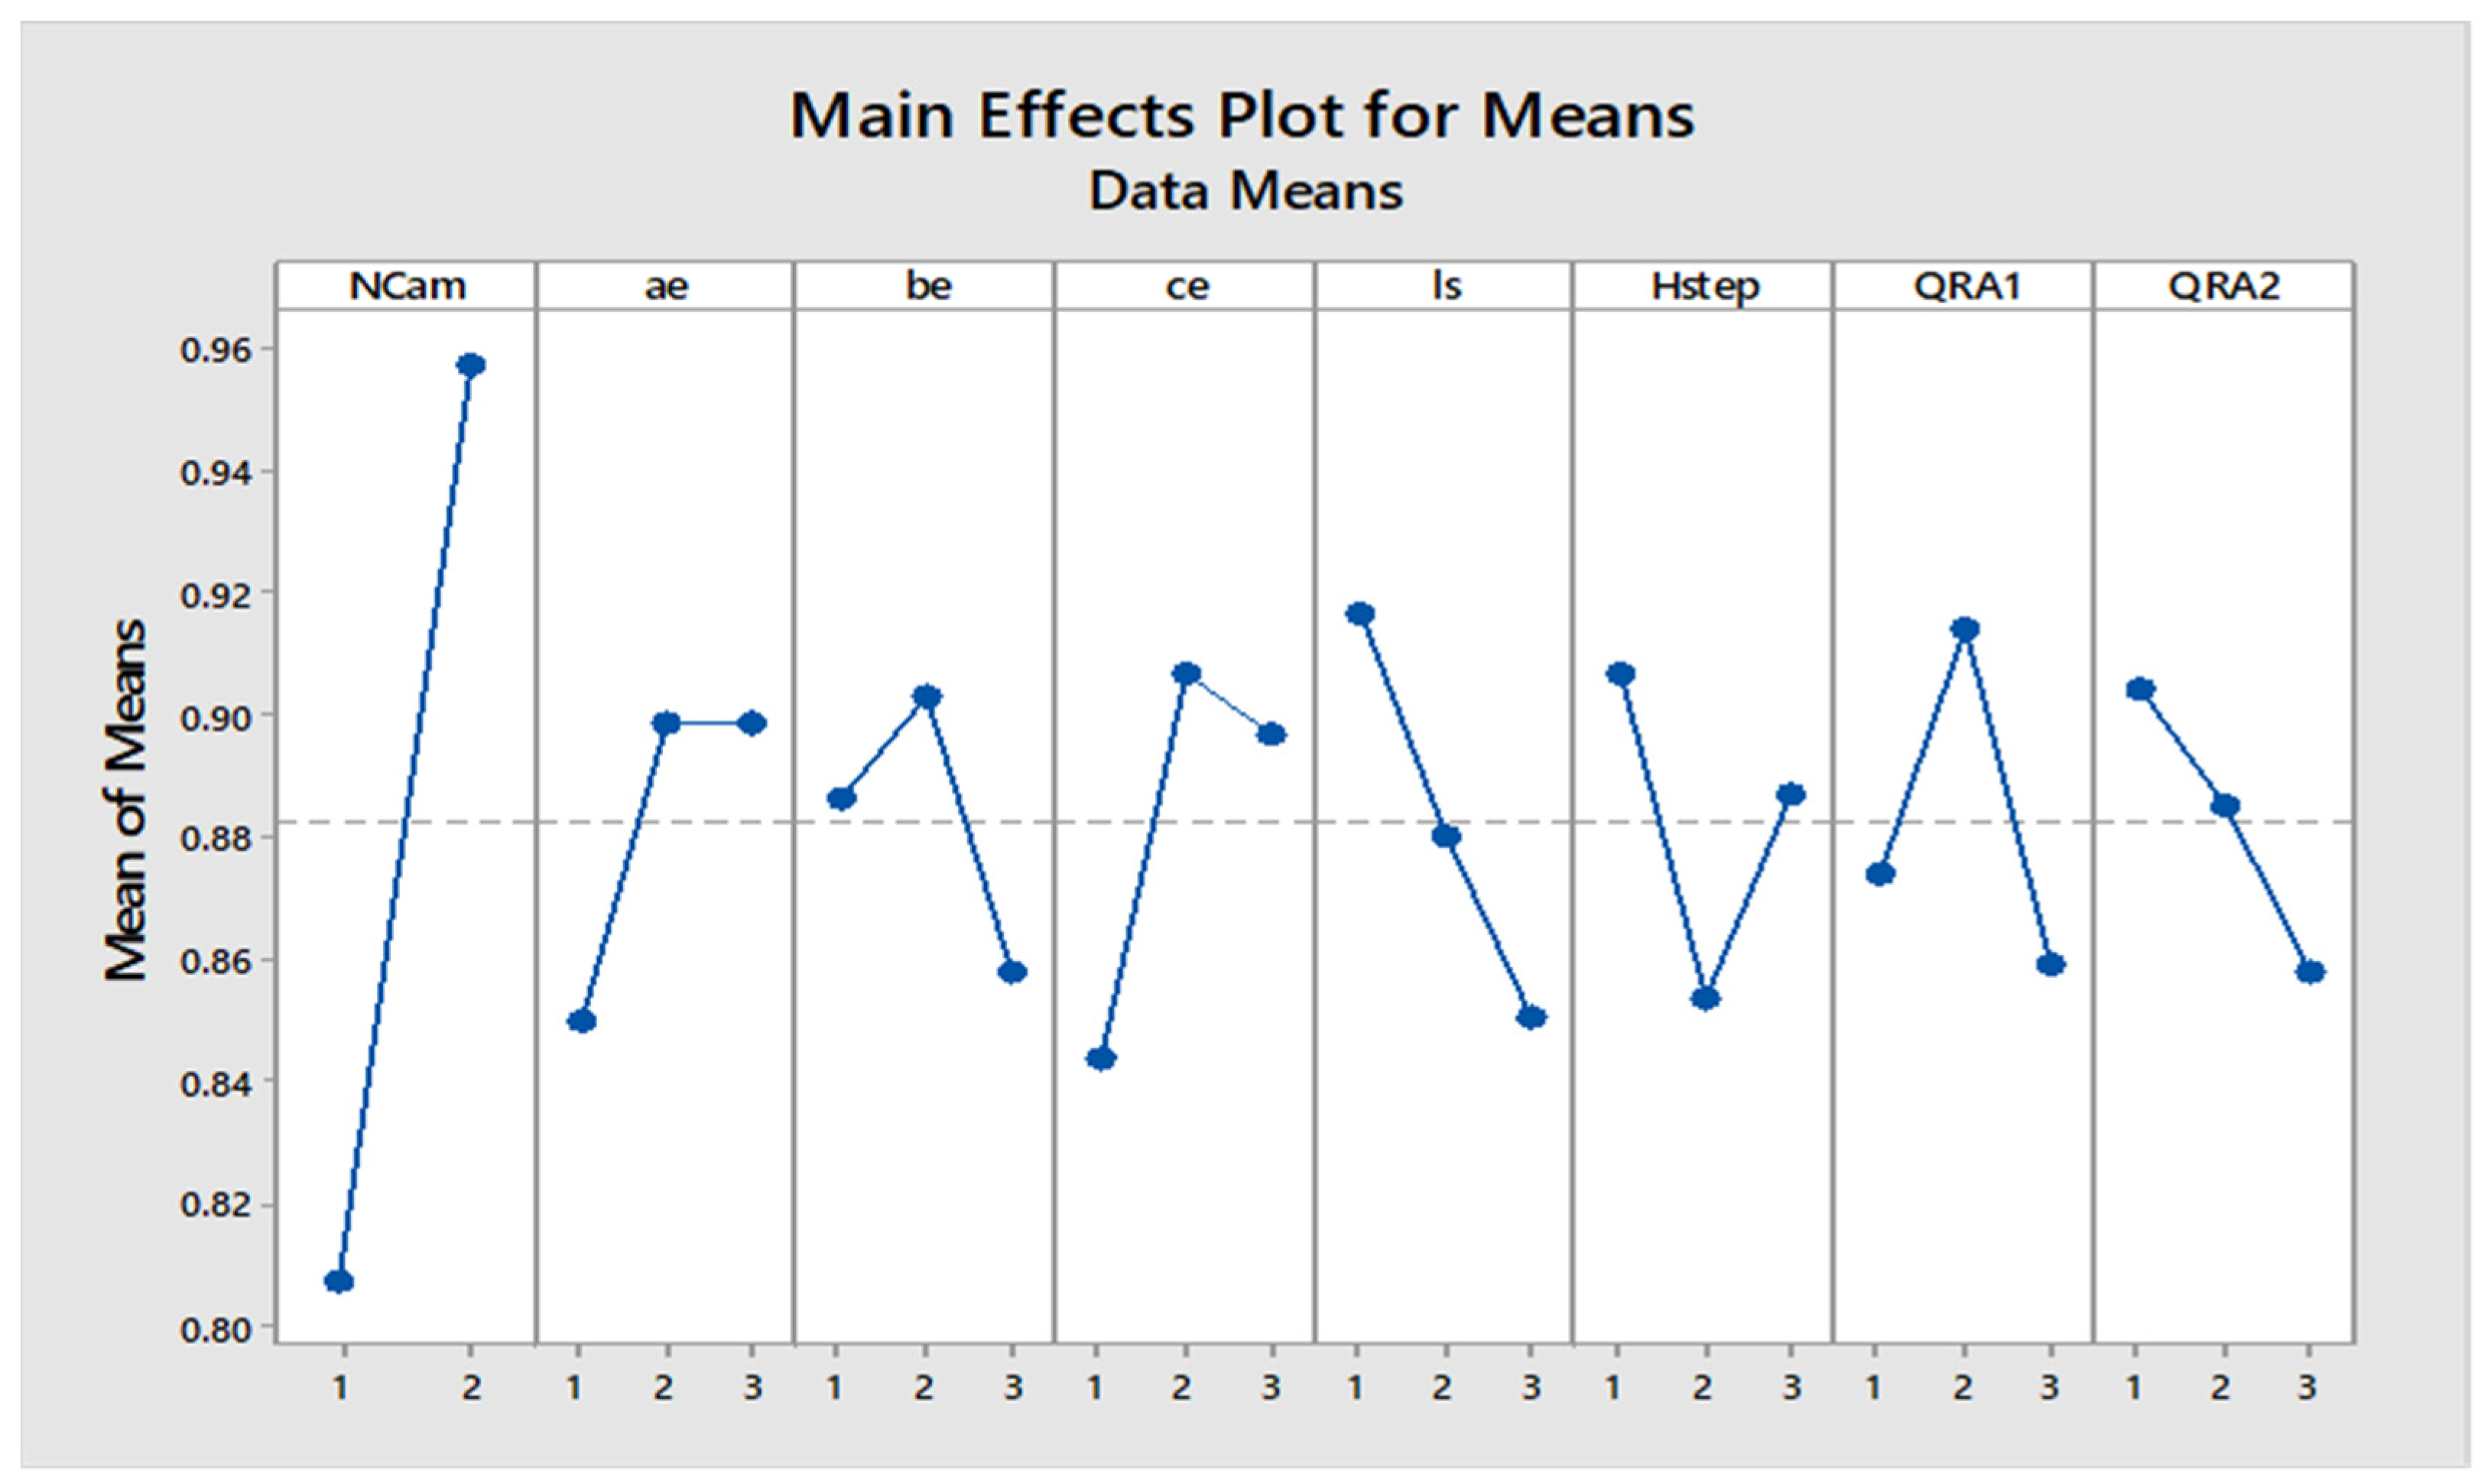
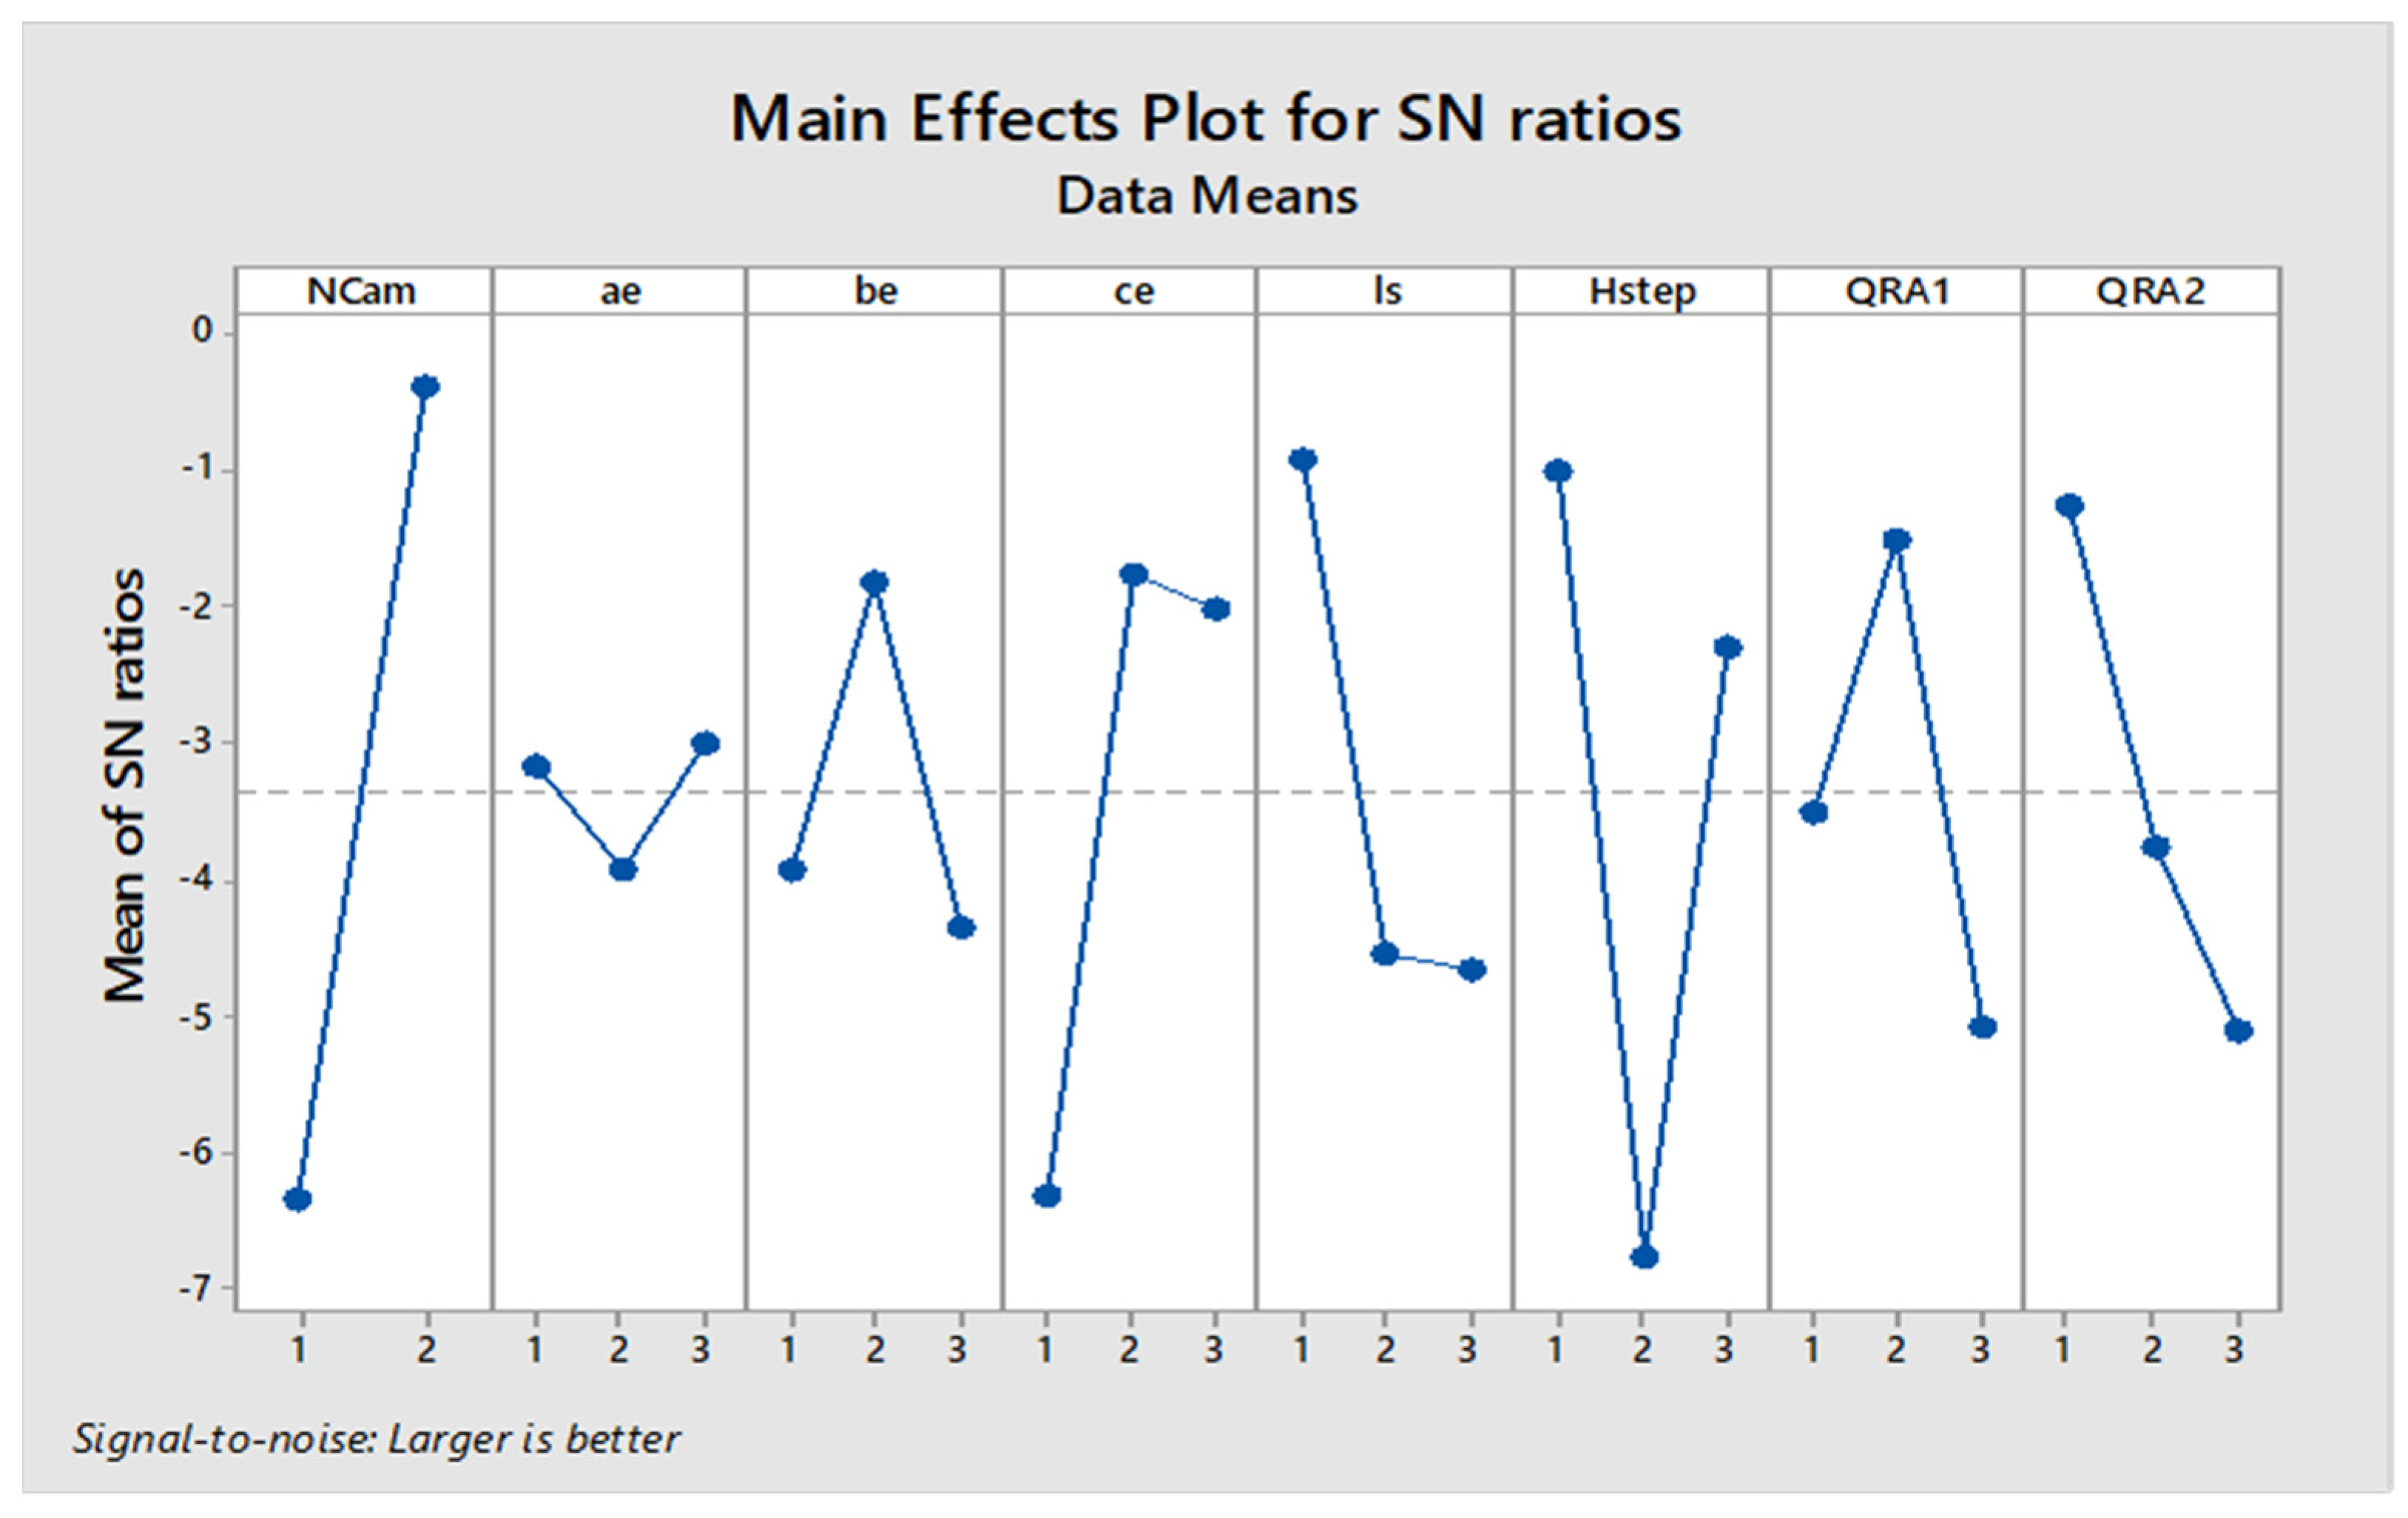
The Main Effects Plots provide insights into the influence of various factors on the response variable. The first plot shows the mean of means for each factor level, while the second plot displays the mean of signal-to-noise (SN) ratios. In the first plot, the x-axis represents different factors (NCam, ae, be, ce, ls, Hstep, QRA1, QRA2) and their levels, while the y-axis shows the mean response. A steep slope indicates a significant effect of the factor on the response. For example, NCam shows a sharp increase from level 1 to 2, indicating a strong influence. Conversely, flatter lines suggest minimal impact.
The second plot depicts the mean of SN ratios, which measure robustness (higher is better). The x-axis represents the same factors, and the y-axis shows the SN ratios. Here, a higher SN ratio indicates better performance under varying conditions. Again, NCam displays a significant impact with a steep increase from levels 1 to 2.
‘Number of Cam (‘NCam’), and empirical coefficients, ‘pls’ and ‘QRA2’ have been identified as the most sensitive factors for the mean response of (Pearson’s correlation coefficient) as shown in Figure 5. Moreover, these results show good robustness against the noise factor, giving almost a similar trend of dominance, as shown in Figure 6. An increase in the number of cams made the enveloping road filtering fine to produce a better correlation coefficient, and a decrease in ‘pls’ and ‘QRA2’ increased the correlation coefficient.
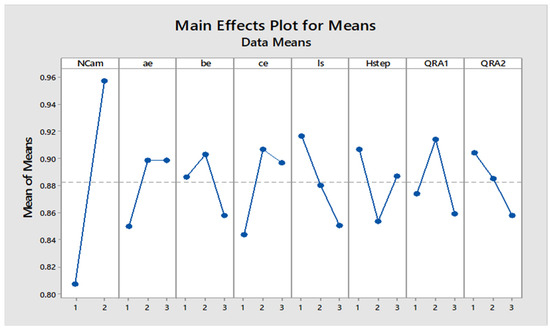
Figure 5.
Sensitivity of control factors for low-speed simulation (mean of means).
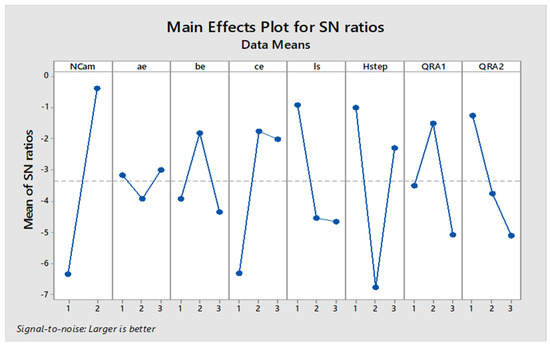
Figure 6.
Sensitivity of control factors for low-speed simulation (mean of SN ratio).
4.2. High-Speed Experiment
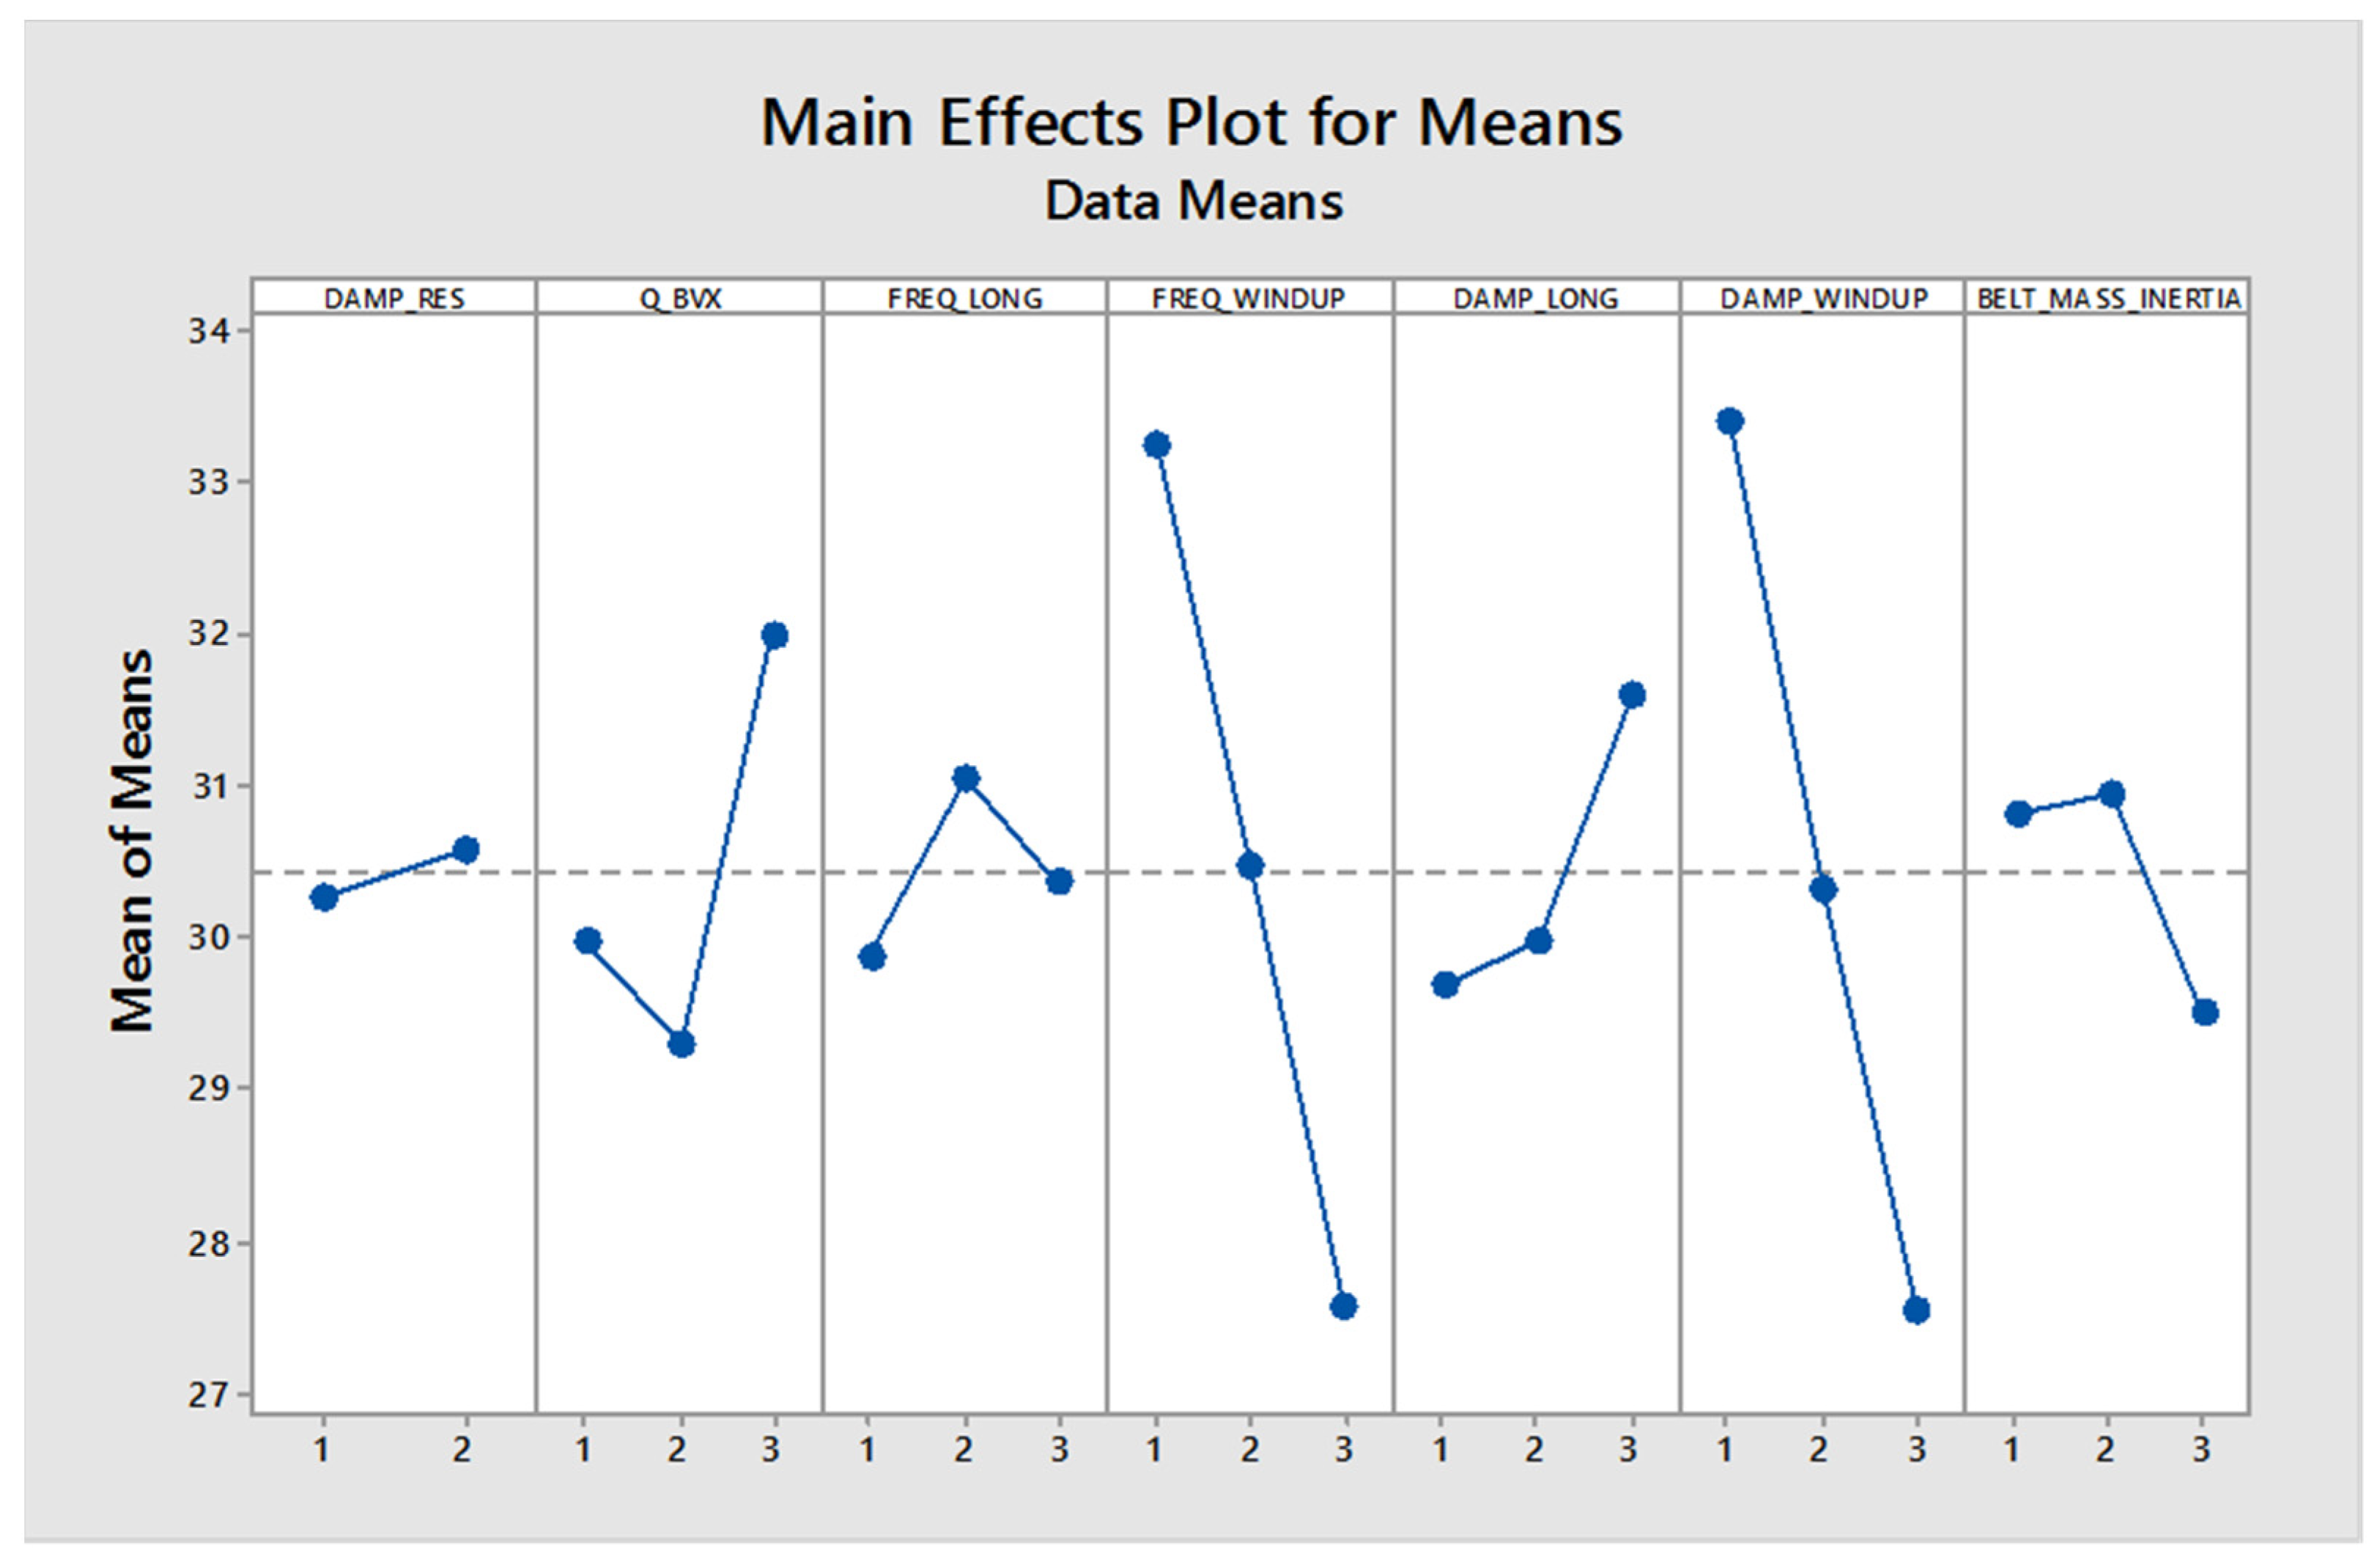
Figure 7 shows the sensitivity of the control factor “Frequency at Peak for the longitudinal force with a speed of 30 kph” (mean of means), which is used in design of experiments (DOE) to analyze the effect of several factors on a response variable.
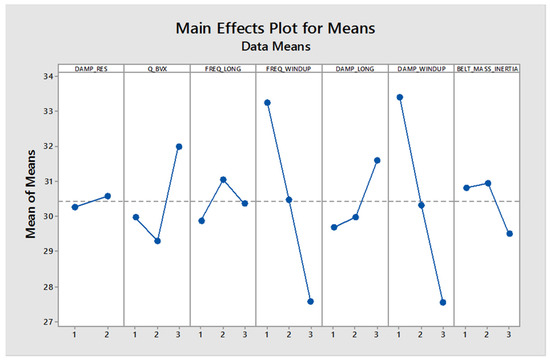
Figure 7.
Sensitivity of control factor’s frequency at peak for longitudinal force with speed 30 kph (mean of means).
Factors and Levels: The plot shows five factors (DAMP_RES, Q_BVX, FREQ_LONG, FREQ_WINDUP, DAMP_LONG, DAMP_WINDUP, BELT_MASS_INERTIA), each tested at three levels (1, 2, 3). These factors could represent any experimental conditions or input variables whose effects are being studied.
Response Variable: The y-axis represents the “Mean of Means”, which is likely the average response measured across replicates of the experiment at each level of the factor.
The dashed line across the plot might represent the overall mean of the response. Factors showing the most significant deviation from this line will likely affect the response significantly. The steepness of the slope between levels indicates the strength of the effect. For example, FREQ_WINDUP appears to strongly affect the response variable because it shows a steep slope between levels 1 and 2. To optimize the response, one would generally look for the levels of each factor associated with the desired response (either maximized or minimized, depending on the goal). For most factors, level 2 is often associated with higher means, except for FREQ_LONG and BELT_MASS_INERTIA, where level 2 is associated with lower means.
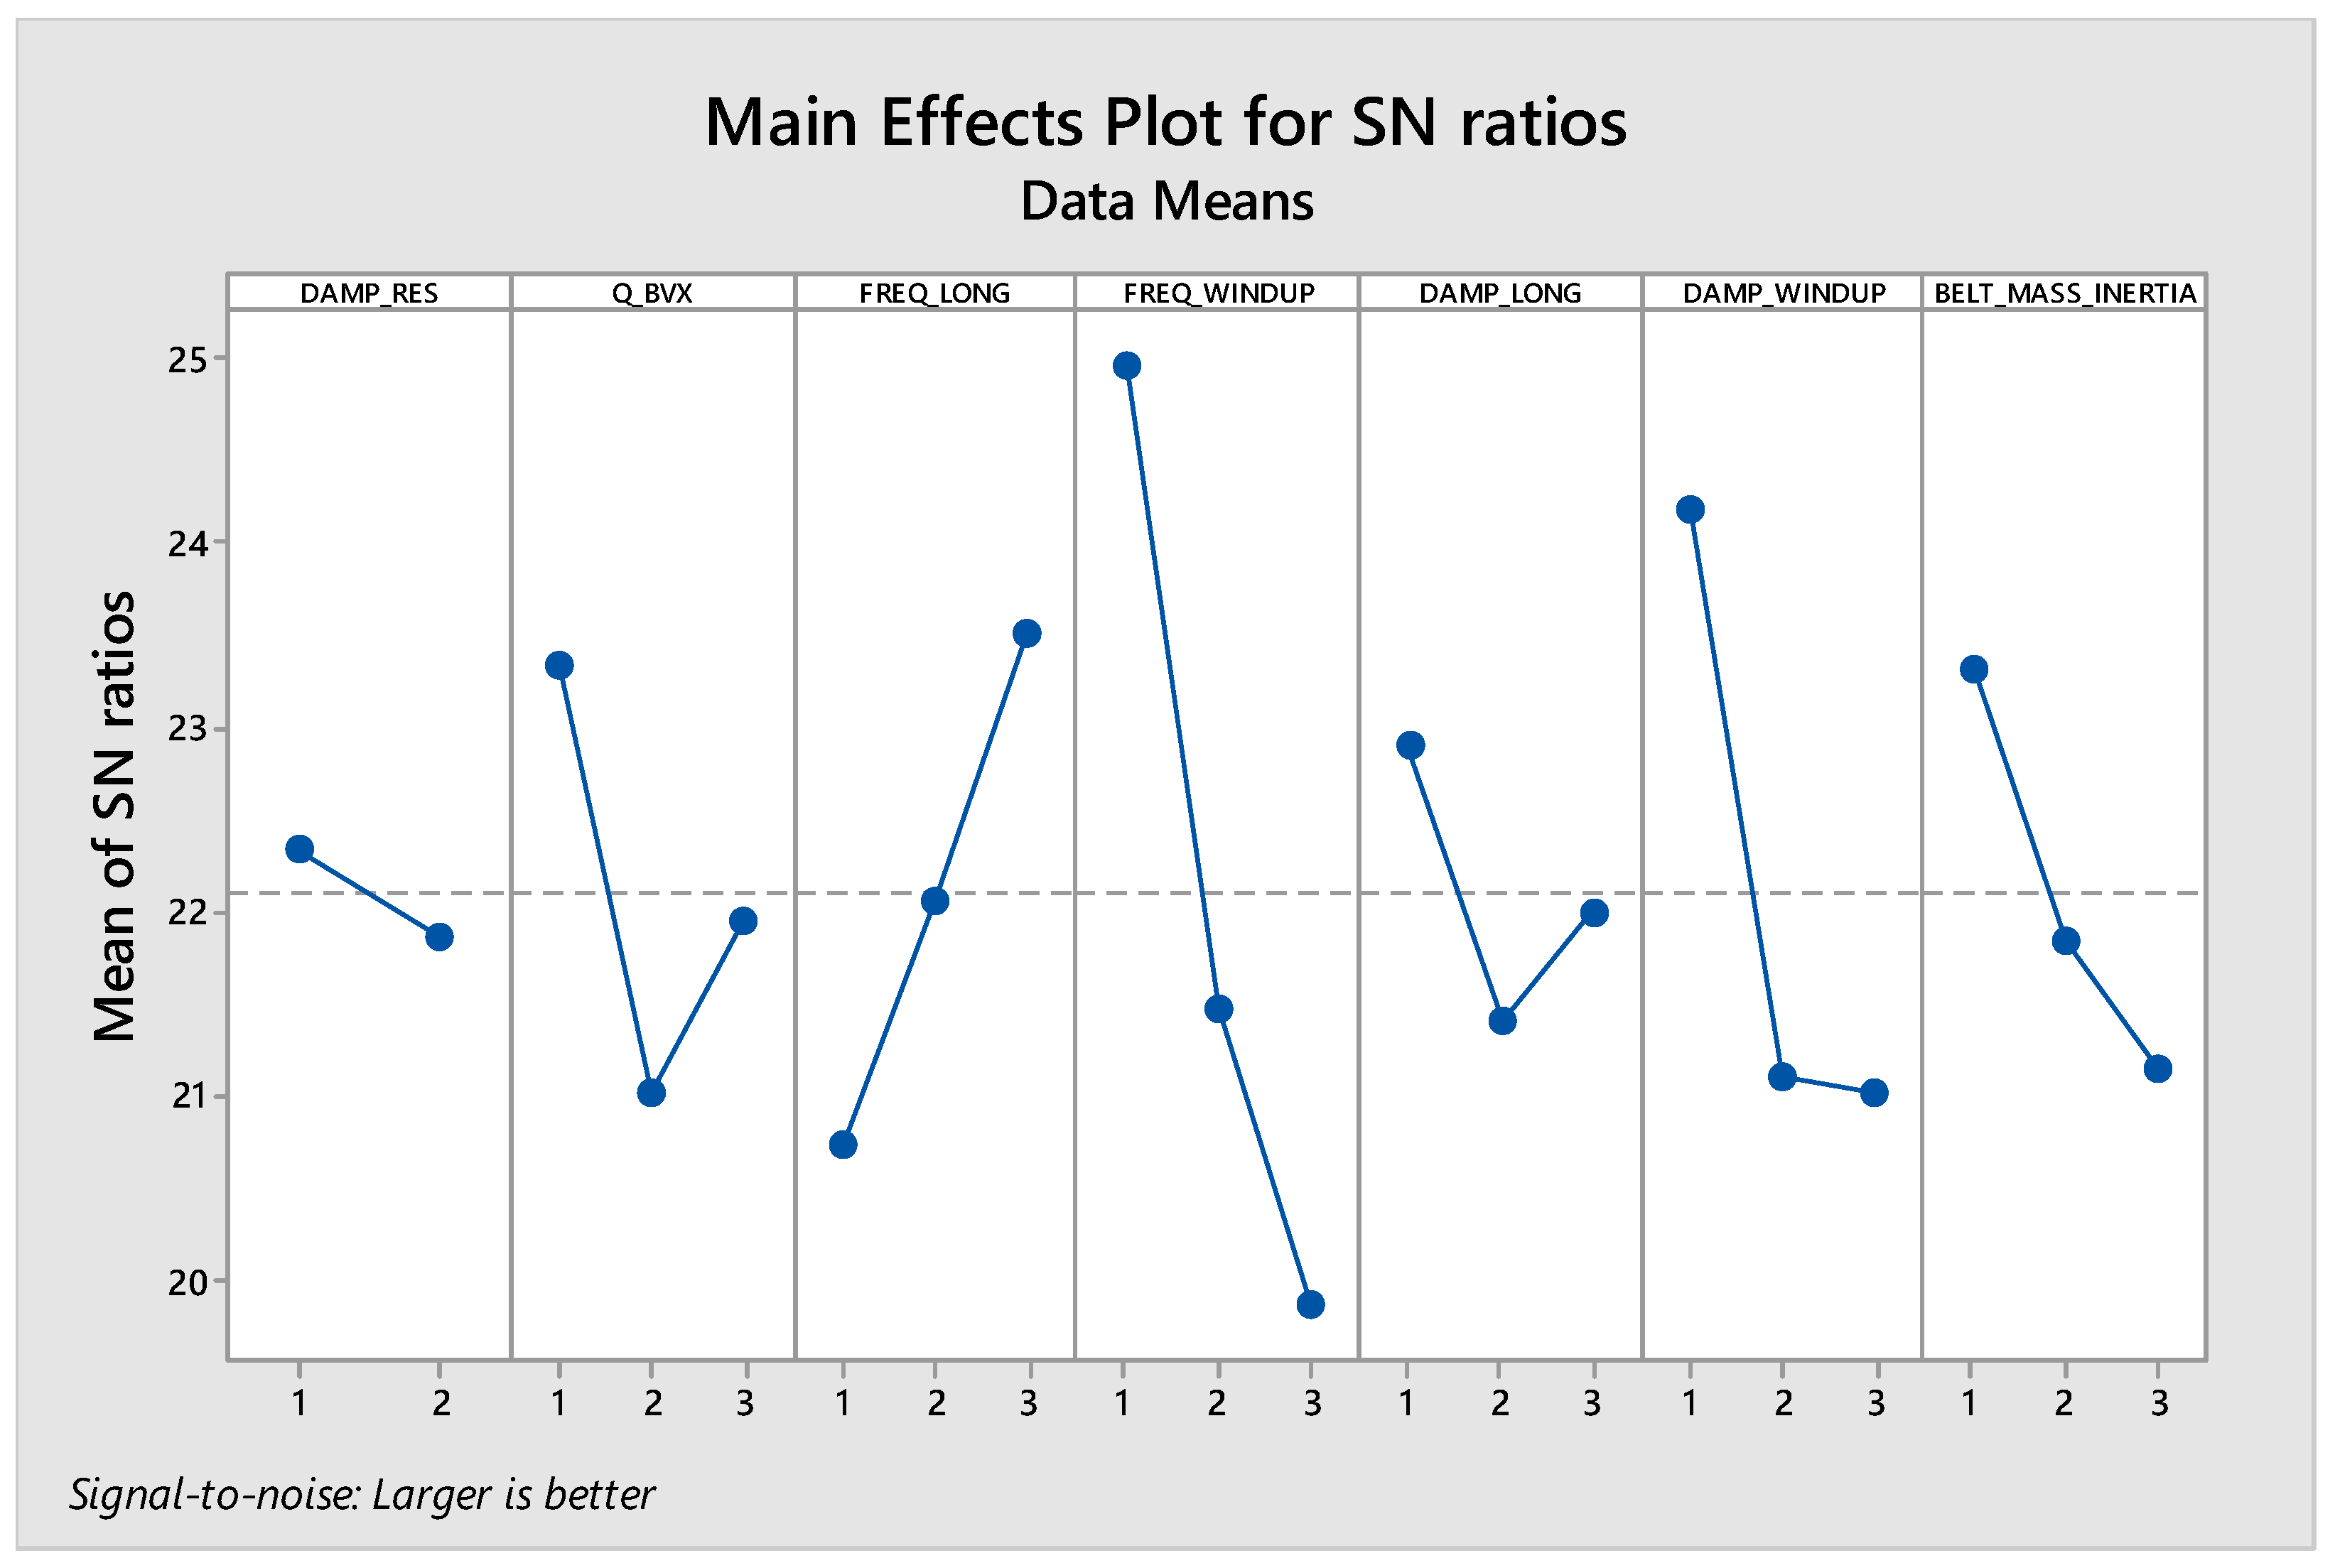
Figure 8 investigates a Main Effects Plot for Signal-to-Noise (SN) ratios, commonly used in DOE when applying the Taguchi method for quality improvement. The SN ratio is a measure of the robustness of a process, with higher SN ratios indicating better quality because they suggest a higher signal (desired output) relative to noise (variation or undesired output). In this context, the “larger is better” note implies that the goal is to maximize the SN ratio. The plot displays the same factors as previously discussed (DAMP_RES, Q_BVX, FREQ_LONG, FREQ_WINDUP, DAMP_LONG, DAMP_WINDUP, BELT_MASS_INERTIA) at three levels each. The y-axis indicates the mean of SN ratios for each factor level. Higher values on this axis represent better quality or performance according to the “larger is better” criterion.
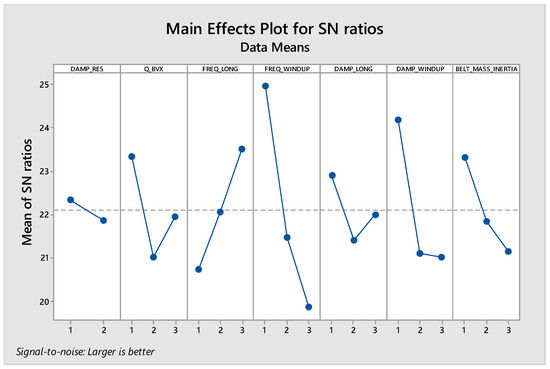
Figure 8.
Sensitivity of control factor’s frequency at peak for longitudinal force with speed 30 kph (mean of means).
The plot suggests that the mid-level (level 2) tends to yield higher SN ratios for most factors, indicating that this setting is often closer to the optimal level under the current experimental conditions. Factors such as FREQ_WINDUP and DAMP_WINDUP show significant increases in SN ratios from level 1 to level 2, suggesting these factors are critical to the robustness of the process and should be prioritized for control to improve quality. Conversely, BELT_MASS_INERTIA shows a consistent decrease in the SN ratio as the level increases, suggesting that lower settings of this factor contribute to a more robust process. The optimal settings for each factor to maximize SN ratios would be DAMP_RES at level 1, Q_BVX at level 2, FREQ_LONG at level 2, FREQ_WINDUP at level 2, DAMP_LONG at level 2, DAMP_WINDUP at level 2, and BELT_MASS_INERTIA at level 1. In the context of the specific control factor “Frequency at Peak for longitudinal force with Speed 30 kph”, which seems to be represented by FREQ_LONG, the analysis indicates that the mid-level setting is optimal for maximizing the SN ratio, thus enhancing the sensitivity and performance at this specific condition.
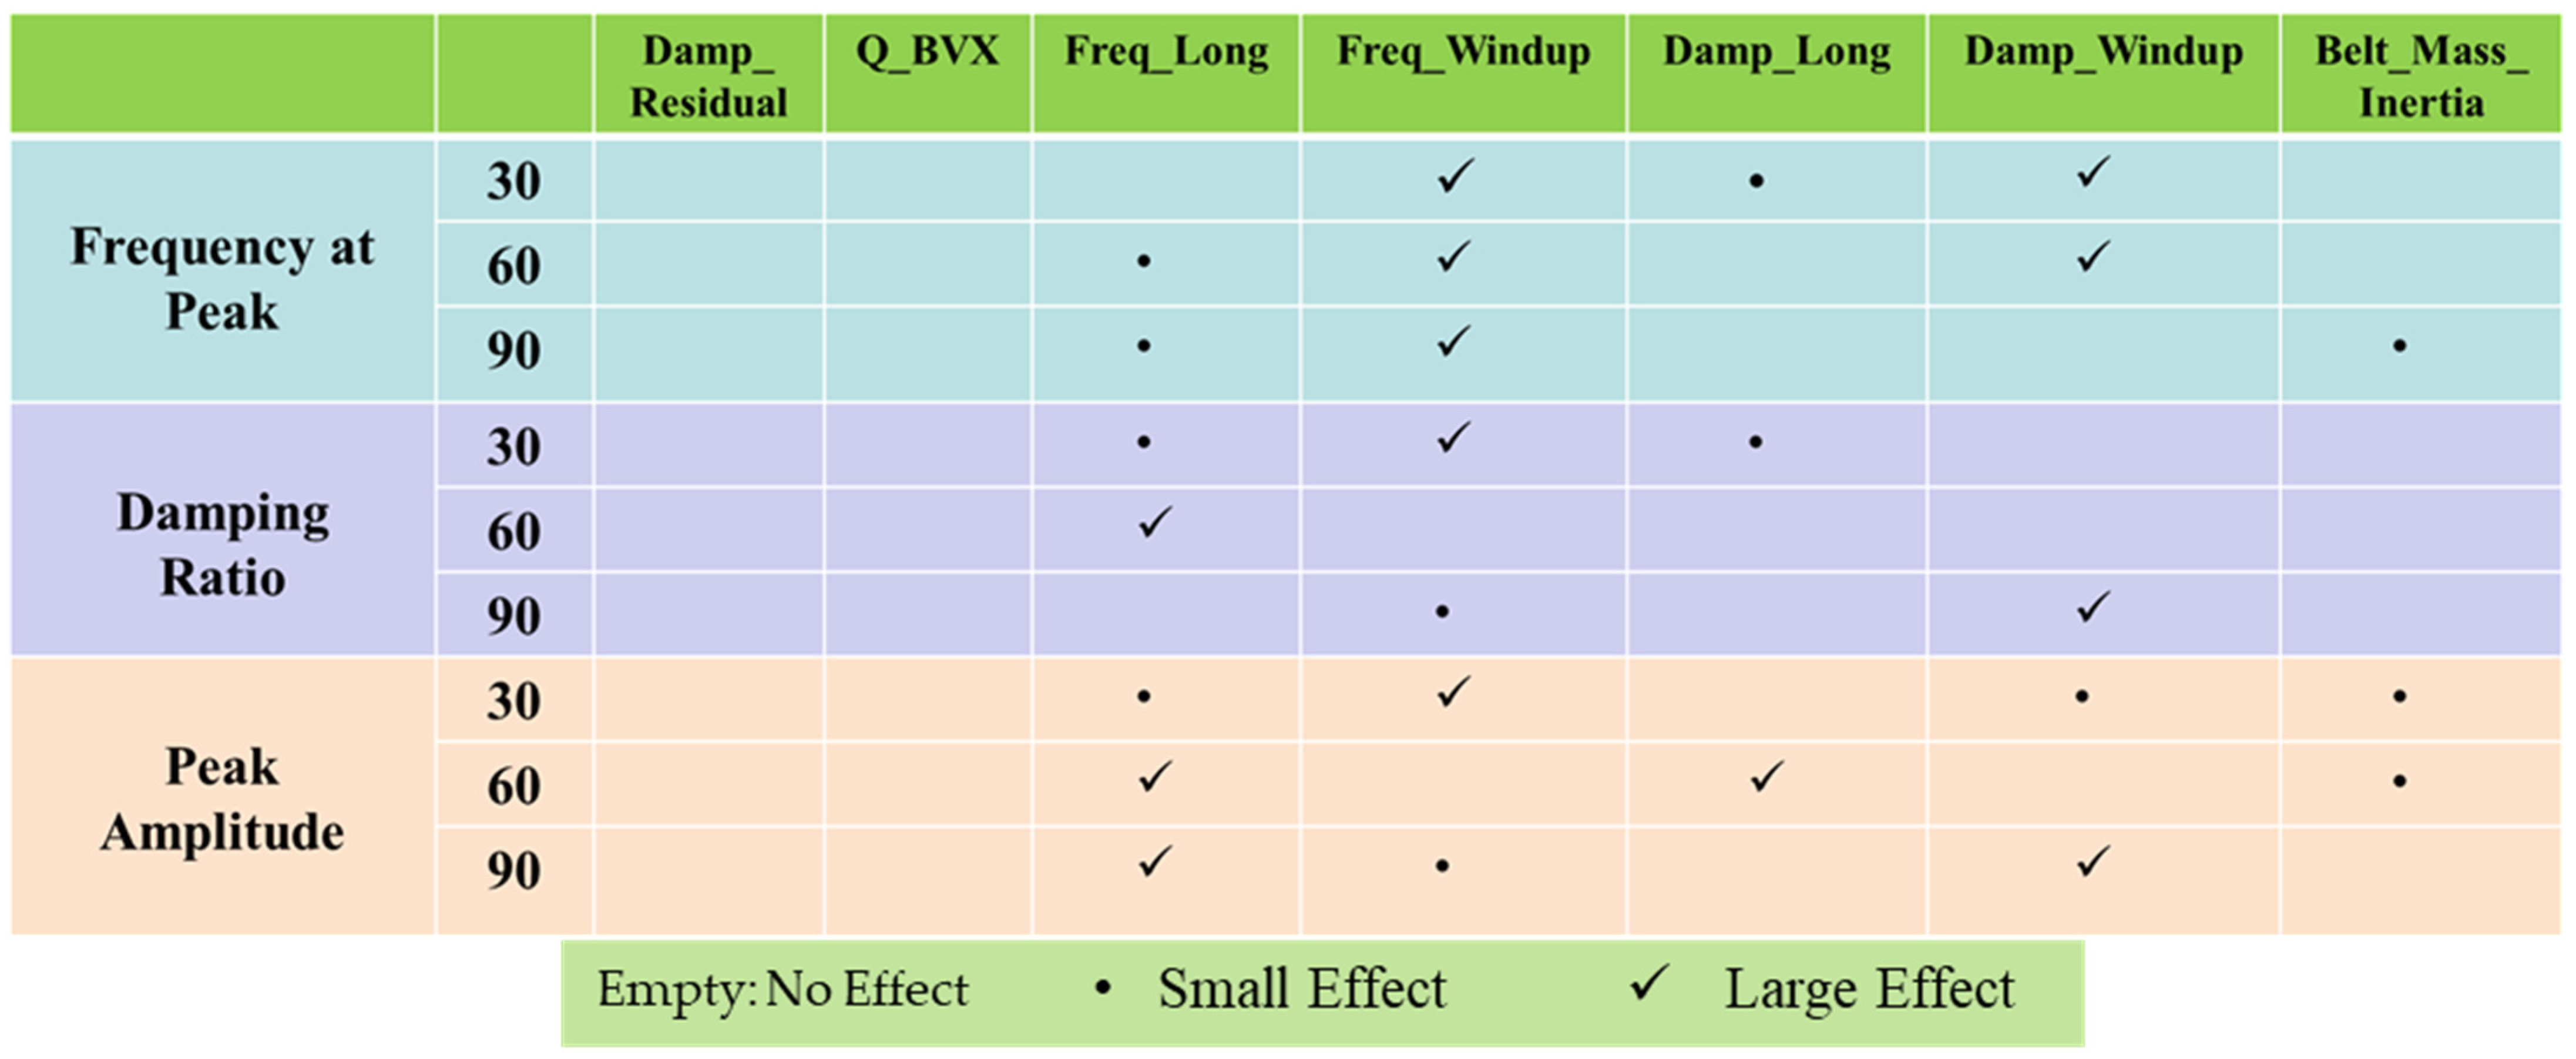
Figure 9 lists control factors along the y-axis, each tested at three levels (30, 60, 90). The x-axis represents the different conditions or variables (Damp_Residual, Q_BVX, Freq_Long, Freq_Windup, Damp_Long, Damp_Windup, Belt_Mass_Inertia) that could influence the response.
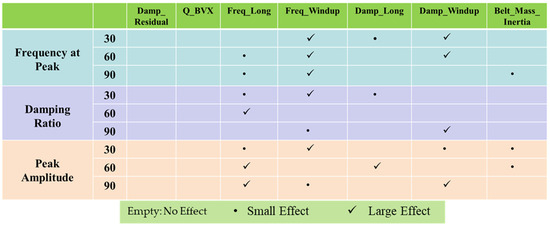
Figure 9.
Sensitivity index matrix of all control factor for force in longitudinal direction.
Frequency at Peak:
At 60 kph and 90 kph, there is a significant effect on Damp_Windup, suggesting that as the frequency at peak increases, the impact on Damp_Windup becomes more significant.
There is a negligible effect on Damp_Long at the 90 kph level, indicating a minor sensitivity to changes in frequency at peak.
Damping Ratio:
Shows a significant effect on Freq_Long at the 60 kph level, suggesting that the damping ratio mainly influences Freq_Long at this level.
A small effect is observed on Freq_Windup at the 30 kph level and Damp_Long at the 60 kph level.
Peak Amplitude:
It significantly affects Freq_Long and Damp_Windup at the 60 kph level and Damp_Residual at the 90 kph level.
Minor effects are observed at different levels for Q_BVX, Freq_Windup, and Belt_Mass_Inertia.
Overall Sensitivity:
Damp_Windup seems sensitive to both frequency at peak and peak amplitude, especially at higher levels. Freq_Long is influenced significantly by the damping ratio and peak amplitude at the 60 kph level. Belt_Mass_Inertia appears to be the least sensitive, with minor effects, observed only at higher levels of the control factors.
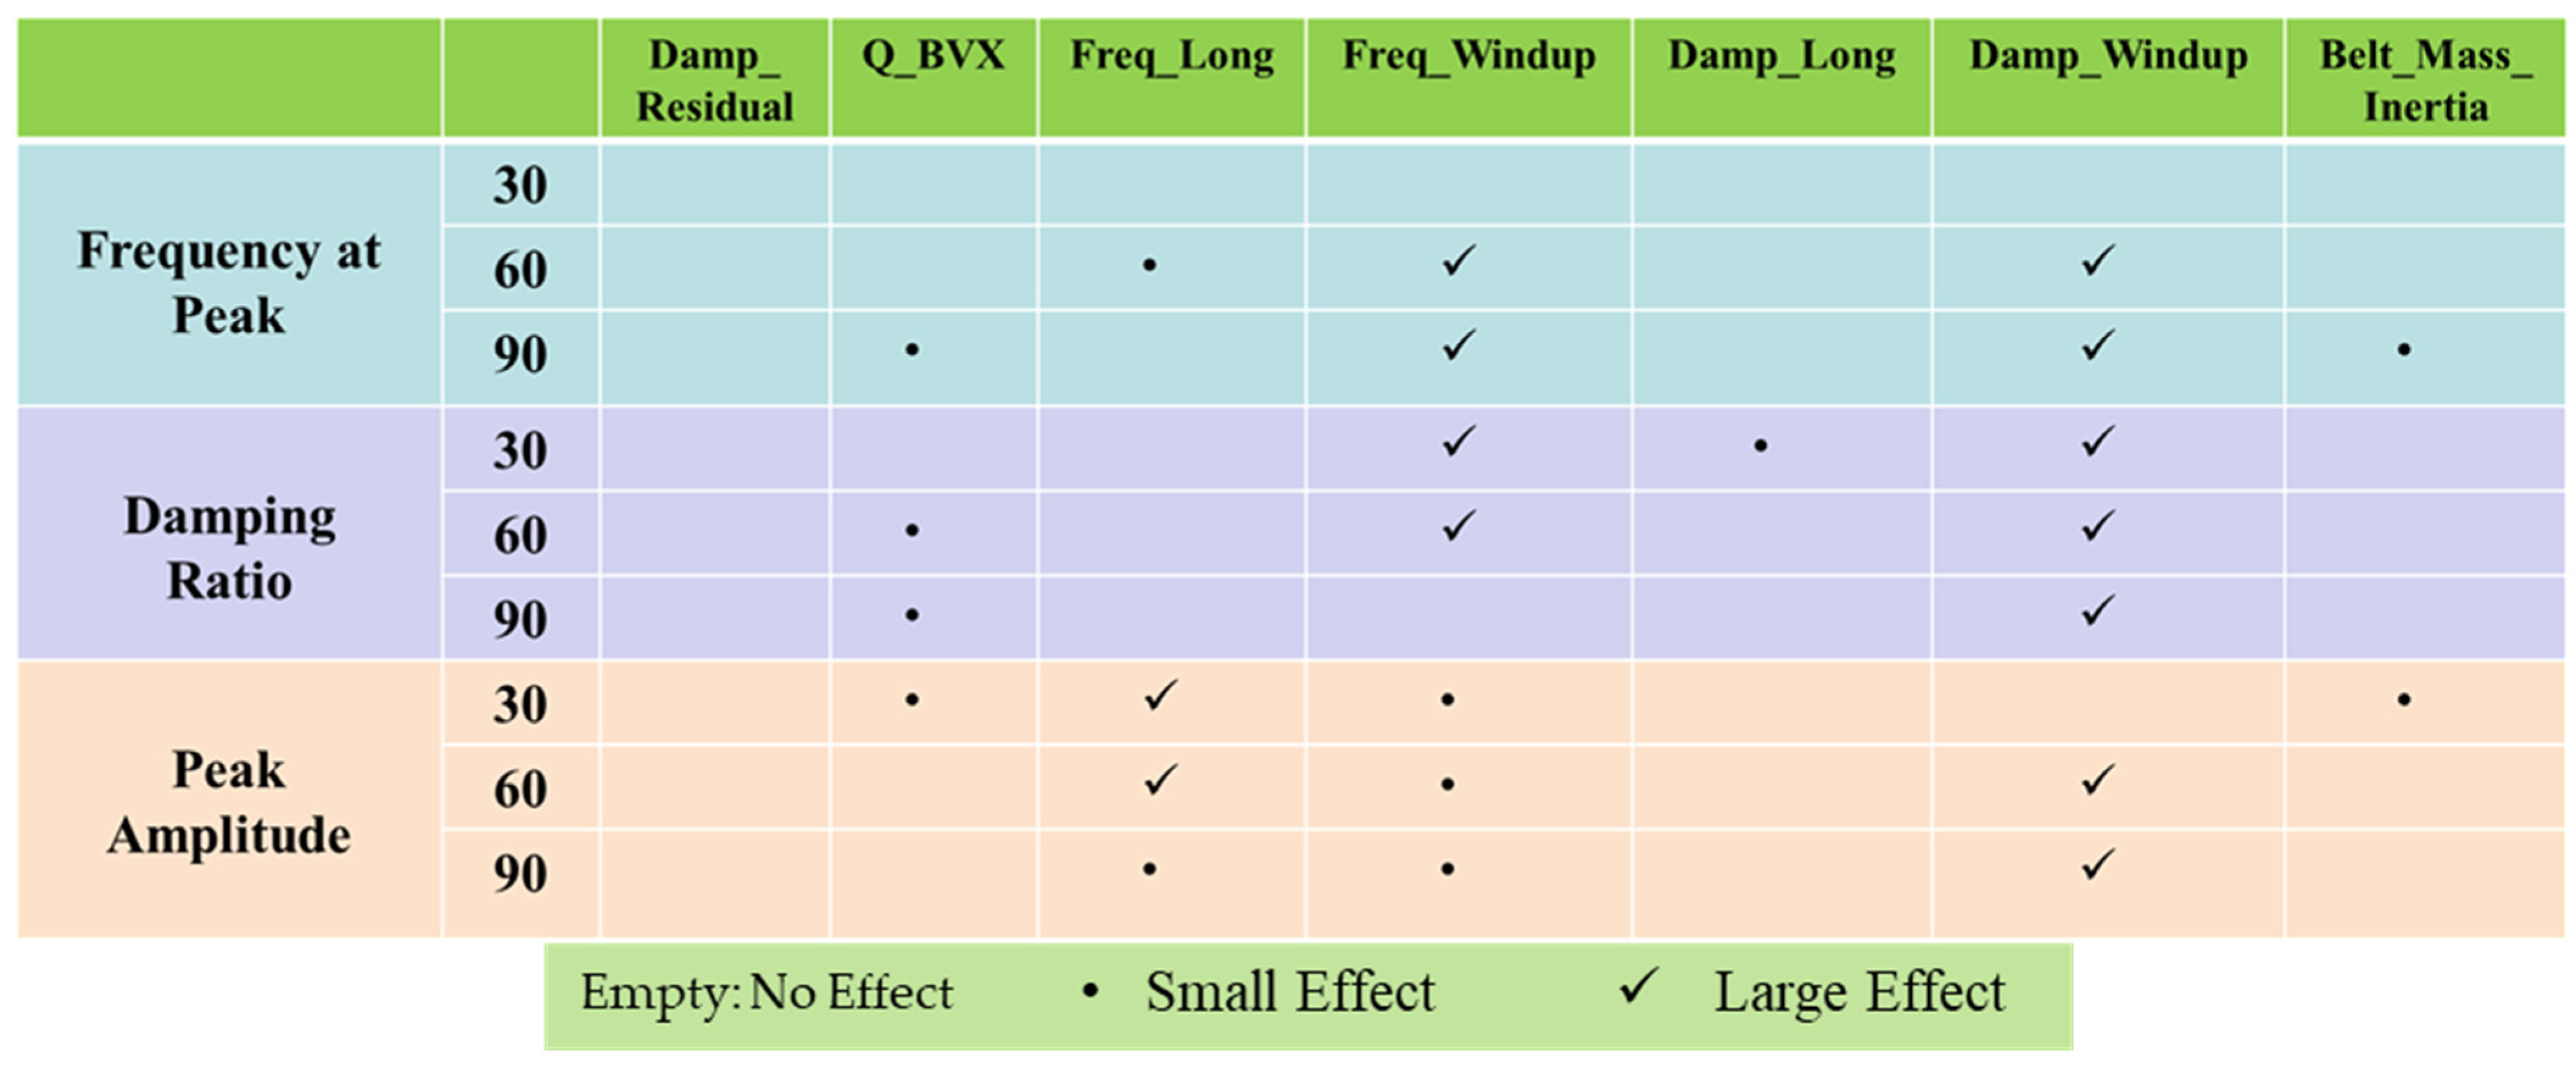
Figure 10 shows the sensitivity index matrix that details the effects of various control factors on force in the vertical direction. “Frequency at Peak” shows a significant effect due to Freq_Windup and Damp_Windup at 60 and 90 kph, indicating these factors significantly influence peak frequency. In addition, it has a negligible effect due to Q_BVX and Belt_Mass_Inertia. “Damping Ratio” exhibits a significant effect due to Damp_Windup at all speeds. “Peak Amplitude” is primarily influenced by Freq_Long and Damp_Windup at 60 kph, demonstrating their importance in determining amplitude at higher speeds, while Freq_Windup shows a negligible effect on “Peak Amplitude” at all speeds. It is important to note that this analysis should be accompanied by a quantitative assessment of the effects (e.g., through statistical analysis) to fully understand the implications of these control factors on the system performance.
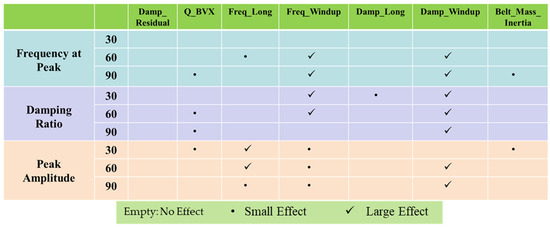
Figure 10.
Sensitivity index matrix of all control factors for force in vertical direction.
5. Conclusions
Based on the extensive analysis presented in the paper, it is clear that the design of experiments (DOE) methodology has been instrumental in understanding the complex interactions of tire parameters with the forces experienced at the contact patch.
- The study employed sensitivity analysis of control factors such as Cam shape parameter
- rs, empirical coefficients, number of cams, and rigid ring parameters.
- Sensitivity index matrices provided insights into the significant influence of these factors, guiding the optimization of tire designs for improved performance.
- The findings enhance the computational efficiency and robustness of tire–road interaction predictions, helping ride and dynamics engineers predict tire behavior more accurately and improving overall tire and vehicle dynamics performance.
- This study includes the comprehensive use of DOE methodology to optimize tire parameters and the robust analysis of sensitivity indices, which add significant value to existing research in this field.
However, the study has some limitations, such as not considering the impact of inflation pressure, a critical factor in tire performance, and the model’s frequency range limitation, which restricts its applicability to certain dynamic scenarios. Future research may build upon these findings to further refine tire models, potentially incorporating tire inflation pressure and some more variations in road profiles to ensure the robustness of the conclusion to serve the evolving demands of vehicle dynamics and road conditions.
Supplementary Materials
The following supporting information can be downloaded at: https://www.mdpi.com/article/10.3390/vehicles6040081/s1, Figure S1: Pragmatic longitudinal slip calculation algorithm; Figure S2: Comparison of simulation results of the enveloping model with SWIFT tire rolling with a constant vertical load of 4000 N over the trapezoidal cleat; Figure S3: Comparison of simulation results of the Vertical Force at Axle (Fz) with SWIFT model rolling with a constant vertical load of 4000 N over the trapezoidal cleat; Figure S4: Comparison of simulation results of the Longitudinal Force at Axle (Fx) with SWIFT model rolling with a constant vertical load of 4000 N over the trapezoidal cleat. References [4,20,22] are cited in the Supplementary Materials.
Author Contributions
Conceptualization, V.B. and J.B.; methodology, V.B., M.K., M.B. and J.B.; software, V.B. and M.K.; validation, V.B., M.K. and M.B.; formal analysis, V.B. and S.J.M.Y.; investigation, V.B.; resources, J.B.; data curation, V.B. and S.J.M.Y.; writing—original draft preparation, V.B. and S.J.M.Y.; writing—review and editing, S.J.M.Y. and J.B.; visualization, V.B.; supervision, J.B. and M.B.; project administration, J.B.; funding acquisition, J.B. All authors have read and agreed to the published version of the manuscript.
Funding
This research presented in this paper is partially supported by the Kettering University Faculty Research Fellowship #310307. Any opinions, findings, and conclusions or recommendations expressed in this material are those of the author(s) and do not necessarily reflect the views of the sponsoring organizations.
Data Availability Statement
Data are contained within the article.
Conflicts of Interest
The authors declare no conflicts of interest.
References
- Pacejka, H. Tire and Vehicle Dynamics; Elsevier: Amsterdam, The Netherlands, 2005. [Google Scholar]
- Deur, J. A brush-type dynamic tire friction model for non-uniform normal pressure distribution. IFAC Proc. Vol. 2002, 35, 409–414. [Google Scholar] [CrossRef]
- Mancosu, F.; Sangalli, R.; Cheli, F.; Ciarlariello, G.; Braghin, F. A Mathematical-physical 3D Tire Model for Handling/Comfort Optimization on a Vehicle: Comparison with Experimental Results. Tire Sci. Technol. 2000, 28, 210–232. [Google Scholar] [CrossRef]
- Schmeitz, A.; Besselink, I.; Jansen, S. Tno mf-swift. Veh. Syst. Dyn. 2007, 45, 121–137. [Google Scholar] [CrossRef]
- Barbaro, M.; Genovese, A.; Timpone, F.; Sakhnevych, A. Extension of the multiphysical magic formula tire model for ride comfort applications. Nonlinear Dyn. 2024, 112, 4183–4208. [Google Scholar] [CrossRef]
- Mottola, M.; Lovato, S.; Lot, R.; Massaro, M. The Effect of Tyre Models on the Stability and Ride Dynamics of Two-Wheeled Vehicles: MF-Tyre Vs. MF-Swift. In Proceedings of the International Design Engineering Technical Conferences and Computers and Information in Engineering Conference, Boston, MA, USA, 20–24 August 2023; p. V001T001A011. [Google Scholar]
- Uhlar, S.; Heyder, F.; König, T. Assessment of two physical tyre models in relation to their NVH performance up to 300 Hz. Veh. Syst. Dyn. 2021, 59, 331–351. [Google Scholar] [CrossRef]
- Yu, X.; Huang, H.; Zhang, T. A theoretical three-dimensional ring based model for tire high-order bending vibration. J. Sound Vib. 2019, 459, 114820. [Google Scholar] [CrossRef]
- Brach, R.M.; Brach, R.M. Modeling Combined Braking and Steering Tire Forces; 0148-7191; SAE Technical Paper; SAE International: Warrendale, PA, USA, 2000. [Google Scholar]
- Heinrich, G.; Klüppel, M. Rubber friction, tread deformation and tire traction. Wear 2008, 265, 1052–1060. [Google Scholar] [CrossRef]
- Patil, K.; Baqersad, J.; Behroozi, M. Experimental modal analysis on a tyre–lessons learned. Int. J. Veh. Noise Vib. 2017, 13, 200–215. [Google Scholar] [CrossRef]
- Mange, A.; Atkinson, T.; Bastiaan, J.; Baqersad, J. An optical-based technique to obtain vibration characteristics of rotating tires. SAE Int. J. Veh. Dyn. Stab. NVH 2019, 3, 197. [Google Scholar] [CrossRef]
- Patil, K.; Baqersad, J.; Bastiaan, J. Effects of Boundary Conditions and Inflation Pressure on the Natural Frequencies and 3D Mode Shapes of a Tire; 0148-7191; SAE Technical Paper; SAE International: Warrendale, PA, USA, 2017. [Google Scholar]
- Van Gennip, M.D.; Okamoto, K.; Miyanishi, K.; Kashimata, H. Effect of Tread Design Changes on Tire Patch Dynamics at High Speeds Using a Dynamic Contact Force Measurement Rig. Tire Sci. Technol. 2021, 49, 242–258. [Google Scholar] [CrossRef]
- Lee, H.; Taheri, S. Intelligent tires? A review of tire characterization literature. IEEE Intell. Transp. Syst. Mag. 2017, 9, 114–135. [Google Scholar] [CrossRef]
- Mendoza-Petit, M.F.; García-Pozuelo, D.; Díaz, V.; Olatunbosun, O. A strain-based intelligent tire to detect contact patch features for complex maneuvers. Sensors 2020, 20, 1750. [Google Scholar] [CrossRef] [PubMed]
- Pottinger, M. The Three-Dimensional Contact Patch Stress Field of Solid and Pneumatic Tires. Tire Sci. Technol. 1992, 20, 3–32. [Google Scholar] [CrossRef]
- Schütte, J.; Sextro, W. Tire Wear Reduction Based on an Extended Multibody Rear Axle Model. Vehicles 2021, 3, 233–256. [Google Scholar] [CrossRef]
- Alcázar Vargas, M.; Pérez Fernández, J.; Sánchez Andrades, I.; Cabrera Carrillo, J.A.; Castillo Aguilar, J.J. Modeling of the Influence of Operational Parameters on Tire Lateral Dynamics. Sensors 2022, 22, 6380. [Google Scholar] [CrossRef] [PubMed]
- Birajdar, V.; Baqersad, J.; Bastiaan, J.; Behroozi, M. Investigation and Development of a Slip Model for a Basic Rigid Ring Ride Model; SAE Technical Papers on CD-ROM/SAE Technical Paper Series; SAE Technical Paper; SAE International: Warrendale, PA, USA, 2018. [Google Scholar] [CrossRef]
- Taguchi, G. Introduction to Quality Engineering; Asian Productivity Organization: Tokyo, Japan, 1986. [Google Scholar]
- Zegelaar, P.W.A. The Dynamic Response of Tyre to Brake Torque Variations and Road Unevennesses. Ph.D. Thesis, Delft University of Technology, Delft, The Netherlands, 1998. [Google Scholar]
Disclaimer/Publisher’s Note: The statements, opinions and data contained in all publications are solely those of the individual author(s) and contributor(s) and not of MDPI and/or the editor(s). MDPI and/or the editor(s) disclaim responsibility for any injury to people or property resulting from any ideas, methods, instructions or products referred to in the content. |
© 2024 by the authors. Licensee MDPI, Basel, Switzerland. This article is an open access article distributed under the terms and conditions of the Creative Commons Attribution (CC BY) license (https://creativecommons.org/licenses/by/4.0/).

