Abstract
The assessment of driver assistance system effectiveness in crash scenarios can be conducted through simulations. This approach allows for system improvements and contributes to overall road safety. However, it is important to recognize that simulations are an approximation of reality. Specifically, simulation models can significantly impact the results. In our work, we focus on sensor models that provide environmental information to driver assistance systems. Real-world sensor data differ from idealized simulation data due to measurement errors and environmental influences. We evaluate various sensor models for their applicability in simulating effectiveness assessments. Our research is implemented using the open-source platform openPASS. We investigate the impact of inaccurate sensor data on the effectiveness of an autonomous emergency braking system based on longitudinal traffic crashes from the German In-Depth Accident Study database. To achieve this, we compare stochastic phenomenological models with ideal sensor models. In the evaluation of the modeled autonomous emergency braking, we observed a major influence on the effectiveness due to the less accurate, more realistic sensor data. This evaluation approach enables early optimization of the considered driver assistance system’s robustness against inaccuracies.
1. Introduction
With the increasing complexity of modern vehicle systems and the growing need for safer and more efficient means of transportation, the development and implementation of advanced driver assistance systems (ADASs) are becoming increasingly important [1]. These systems include technologies such as adaptive cruise control, lane-keeping assistance, autonomous emergency braking, and parking aids, all aimed at enhancing driving safety, reducing driver workload, or improving the overall driving experience. Assessing the effectiveness and reliability of ADASs is crucial to ensuring their contribution to traffic safety and their acceptance by users [2].
In Germany, traffic crashes continue to be a remarkable issue. According to the Federal Statistical Office, there were over 2.5 million traffic crashes in 2023, resulting in approximately 360,000 injuries and 2839 fatalities [3]. These figures highlight the ongoing need for effective measures to improve road safety. Autonomous emergency braking (AEB) systems, designed to prevent collisions or mitigate their severity, are measures with the potential to make a meaningful impact on reducing crash rates [4].
Given the importance of evaluating ADASs, conducting extensive real-world field tests can be impractical due to the high costs and time requirements [5]. In contrast, simulations offer a more feasible and cost-effective approach [6,7]. Simulations allow for the testing of a significantly larger number of scenarios than would be possible in field tests, enabling a comprehensive assessment of AEB systems under various conditions [8].
This study will specifically evaluate an AEB system. An AEB system is an important part of modern vehicles as it can potentially save lives by preventing collisions or reducing their severity. To evaluate the effectiveness and robustness of AEB systems, extensive simulations that replicate various driving scenarios and environmental conditions are necessary. For this purpose, the German In-Depth Accident Study (GIDAS) database will be utilized to provide realistic and comprehensive data on traffic crashes [9].
A key aspect of this evaluation is the use of phenomenological sensor models to simulate sensor perception and processing. These models replicate the physical properties and behavior of real sensors to achieve more realistic and precise results [10,11]. By applying these models, the robustness and performance of AEB systems can be tested in a wide range of situations without the need for costly and time-consuming real-world testing. The simulations will be conducted using the openPASS platform, an open-source tool that allows for detailed evaluations of ADAS functions and their interactions with the vehicle and environment.
In this paper, we will present the methodology and results of the simulated evaluation of AEB systems. Special emphasis will be placed on validating the simulations through phenomenological sensor models. The goal is to ensure the reliability of the simulation results, thereby making well-founded statements about the performance of AEB technology.
2. Materials and Methods
Within the field of effectiveness assessment of ADASs, both retrospective and prospective effectiveness assessment approaches are established. The retrospective assessment approach is best suited for systems whose effects can be expected to be noticeable in current statistics. For this study, we used the prospective effectiveness assessment approach in the form of crash scenario simulation, as it is well-suited to assess modern systems that may still be under development.
Applying the simulation method, real-world crash data can be used to examine whether a specific driver assistance system could have prevented a crash in a given scenario. The results of these simulations can be compared to the original crash outcome to assess the effectiveness of the system under consideration. The method of prospective simulative effectiveness assessment as proposed by [2] compares the number of scenarios in which a collision occurred to the total number of scenarios, which all resulted in a collision without the system. The difference in the number of collisions divided by the total number of scenarios defines the effectiveness of the system. In contrast to the retrospective effectiveness assessment, which separates a set of crashes into those with and those without driver assistance systems and compares them based on their frequency and outcome, the prospective effectiveness assessment could address modern assistance systems before their effect is visible in crash statistics. Our study focuses on the modeling of more realistic sensors and the determination of the influence of these on the effectiveness of an AEB. The simulation environment used for this approach, the simulation components, the analyzed crash data set, and the assessment criteria will be presented.
2.1. Simulation Platform openPASS
The simulation tool used for the effectiveness assessment is openPASS. openPASS is a harmonized open-source simulation framework, whose working group was established in 2016 [12]. The main goal of the tool is to create a harmonized transparent simulation base for various applications (e.g., virtual testing and functional development) [13].
To allow the user to freely define their desired test scenarios, e.g., real-world crash scenarios based on crash databases or constructed scenarios, openPASS supports the ASAM OpenX standard formats as its input. To specify the scenery, the user can define the road on which the scenario takes place as well as the environment around it in an ASAM OpenDRIVE® file [14]. The dynamics of the different participants are specified in an ASAM OpenSCENARIO® file [15]. These scenarios can then be used to assess the effectiveness of various driver assistance and crash avoidance systems using openPASS simulations. The simulation core imports the configurations to build up the virtual environment and run the defined maneuvers. To connect a variety of system components to defined agents, the standards ASAM open simulation interface® (OSI) and functional mock-up interface (FMI) are used [16,17]. The system components can be used for a wide range of vehicle functions.
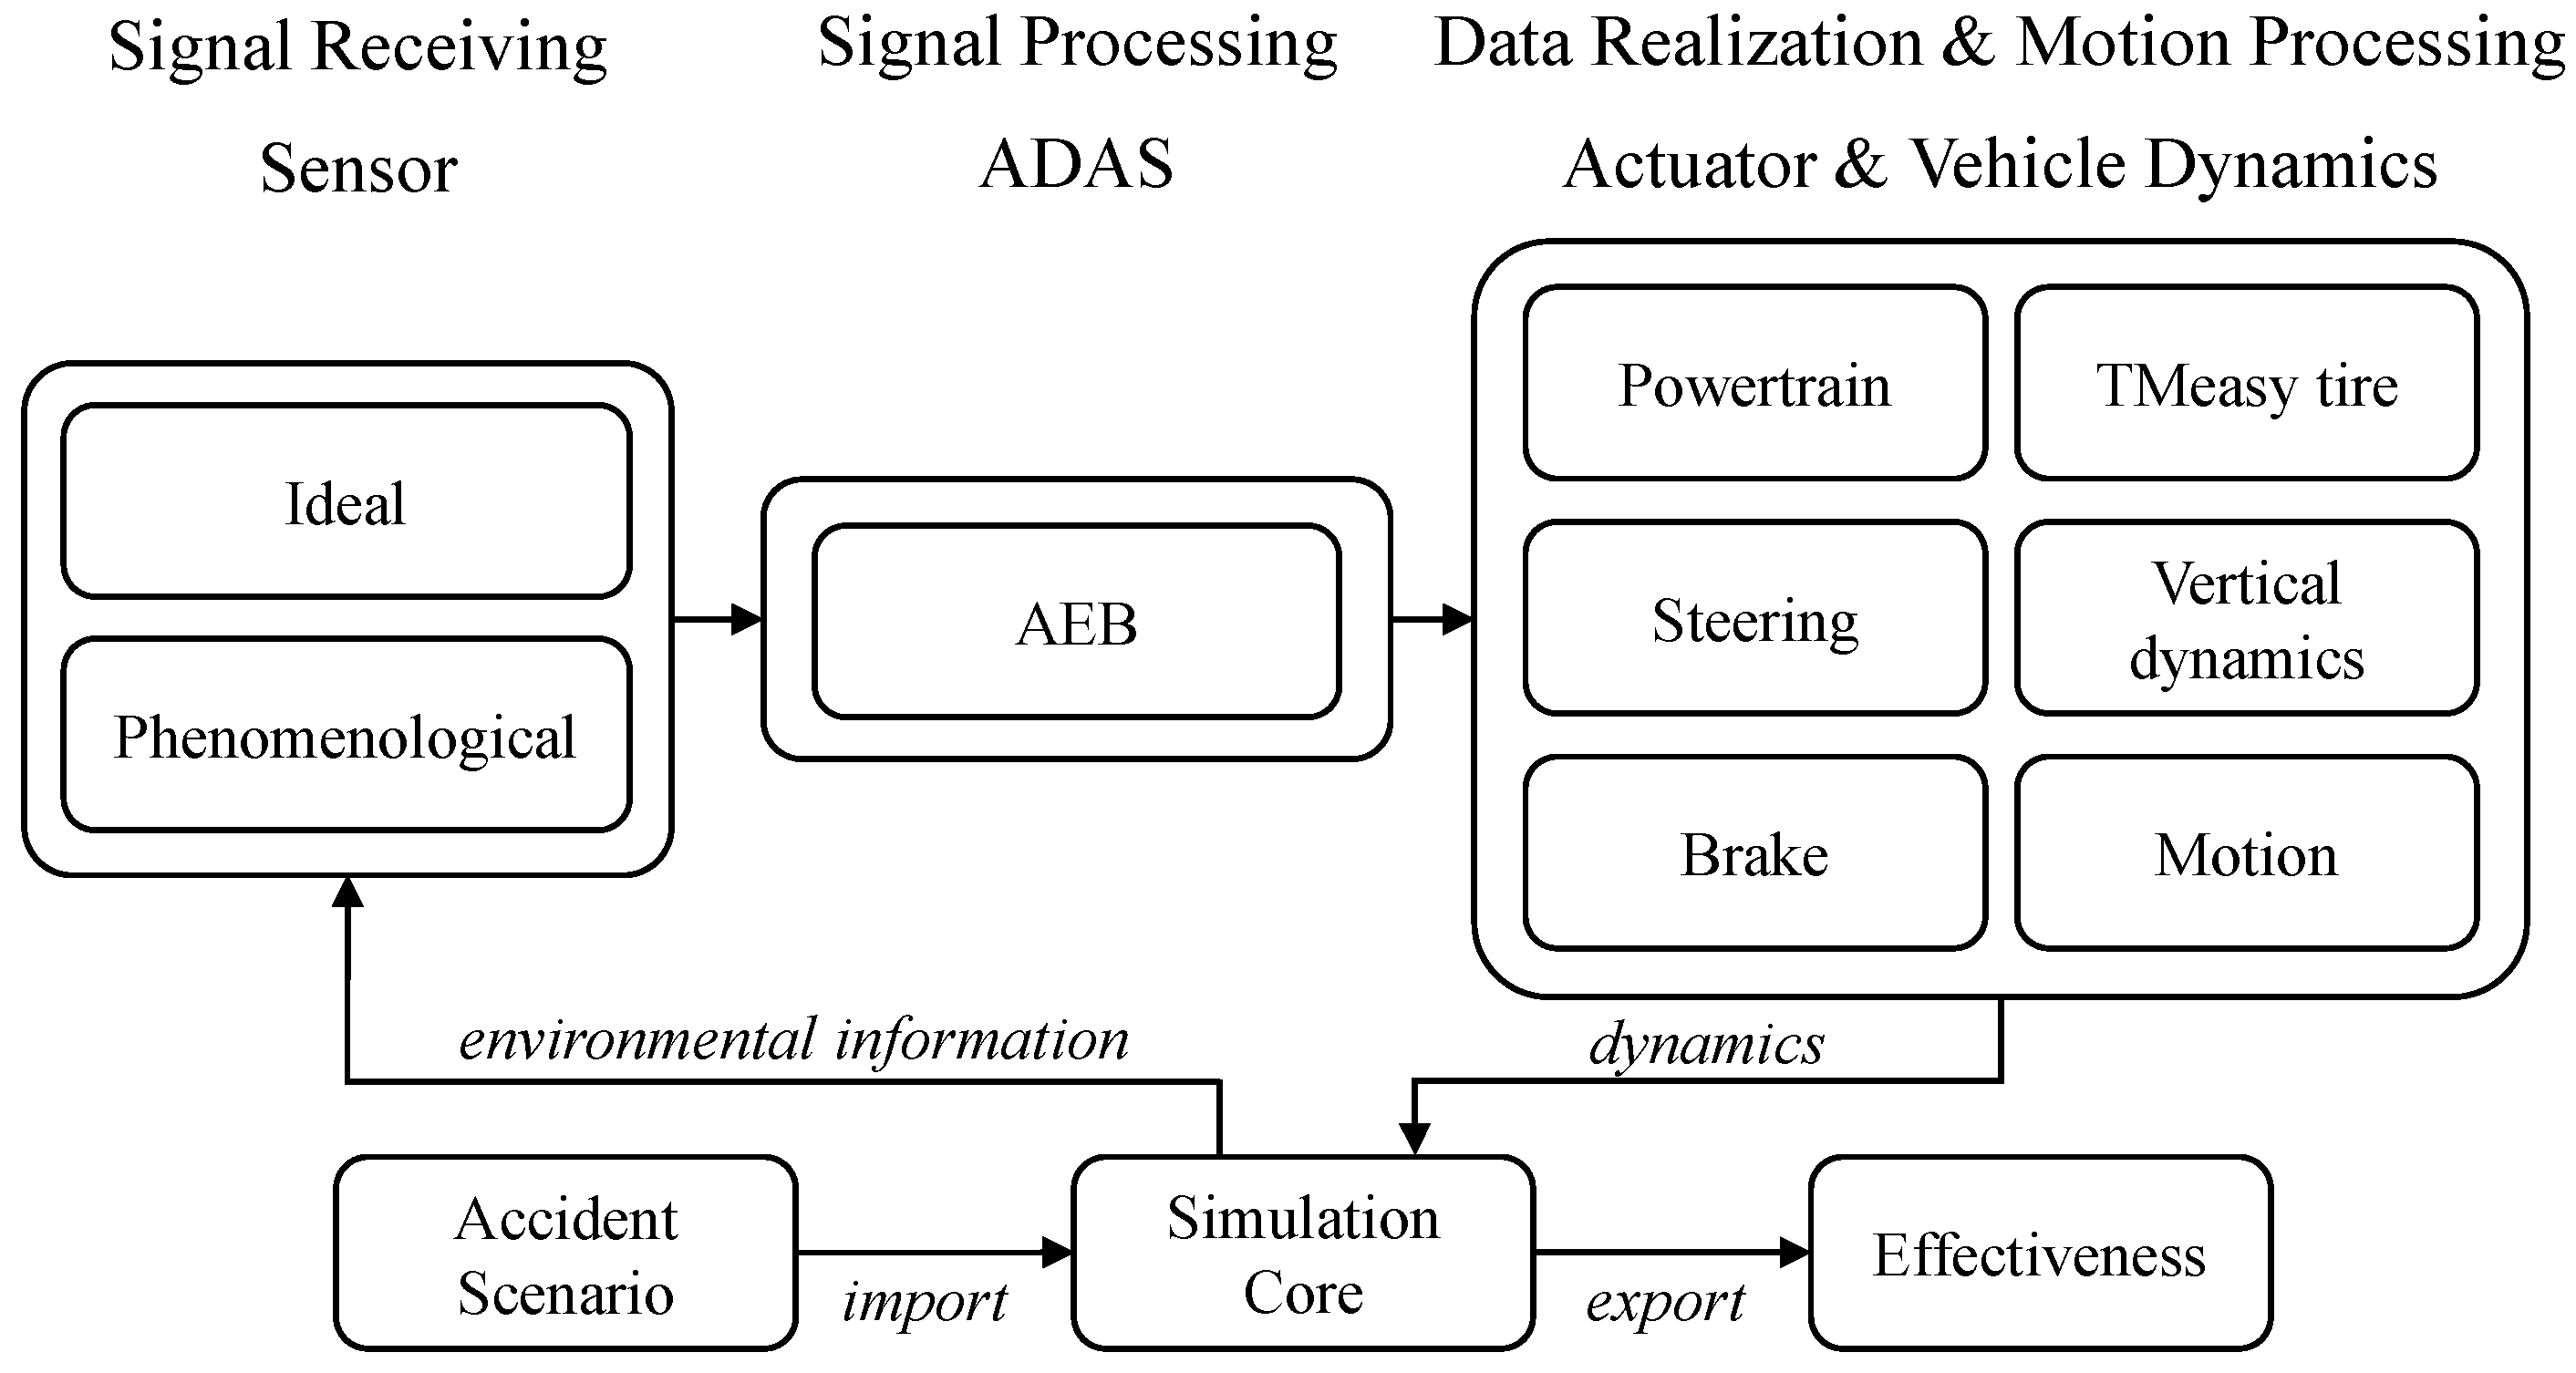
The following component types are required for the simulative effectiveness assessment (Figure 1):
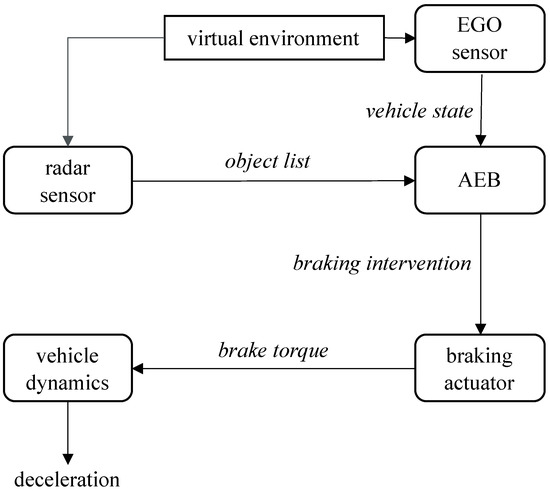
Figure 1.
Relation between data provision, procession, realization, and motion control by using AEB as an example.
- Sensors (data provision; e.g., radar sensor).
- Driver assistance systems (data processing; e.g., AEB).
- Actuators (data realization; e.g., braking actuator).
- Vehicle dynamics (motion control; e.g., vehicle dynamics model).
A data exchange between components is configured in so-called systems, which can be assigned to a scenario participant. It is possible to influence the participants’ motion by systems (closed-loop simulations) in the simulation runs. This allows interventions by driver assistance systems. In re-simulations of scenarios, the given trajectory is overruled by the system, which takes over the vehicle control from the point of the first intervention. The collision avoidance potential of the driver assistance system can thus be determined in crash scenarios, by processing the simulation result files [2].
One advantage of openPASS is the possibility of an easy variation of simulation parameters. Aspects like stochastic effects or different system parametrizations can be considered efficiently due to short simulation durations and parallel execution of multiple simulations.
2.2. Use of Different Sensor Models in a Simulative Effectiveness Assessment
Sensor models are the core components of data provision for driving assistance systems in the simulation environment. Their design defines the model’s level of realism compared to the behavior of a real sensor. According to [6,11,18,19], sensor models are classified into three categories. The categories differ in their modeling depth and degrees of abstraction of the real sensors. As [6] mentioned, ground truth sensor data are used in many simulations. However, these influence the proximity of the simulation results to real sensor behavior, as sensor-specific influences are not taken into account. According to [11], the validation effort will be greater if only ideal data are used for ADAS development. Furthermore, it is mentioned that many factors lead to error-prone data for driving functions. This includes object losses, but also inaccuracies in measurements (e.g., distance and velocity).
The following section introduces these categories and evaluates how the models can be used in a simulative effectiveness assessment.
2.2.1. Ideal Models
The ideal sensor model uses the ground truth information of the simulation environment to generate the required data. No errors (e.g., measurement inaccuracy) are provided to the data. Attached driving assistance systems use the exact information of the detected objects for their processing. The defined field of view restricts the sensor detections. Effectiveness evaluations of ADASs with ideal sensor sets were exemplarily carried out by [2].
2.2.2. Physical Models
In the physical approach, raw signals are generated based on the physical measurement principles (e.g., channel impulse response for a radar sensor). An exact modeling of sensor characteristics requires detailed modeling of the environment in the simulation framework. This leads to increased modeling, integration, and computational effort. Physical models are used in 3D simulation environments as shown in [20] for camera and radar sensors.
2.2.3. Phenomenological Models
The phenomenological approach is based on the ideal sensor model. The exact ground truth data are extended by sensor-specific measurement phenomena, measurement errors (stochastic, deterministic), and inaccuracies. This enables the generation of sensor output data that approximates real sensor performance. The implementation and computational effort are lower than that of the physical sensor model. In an application example, Bernsteiner [11] considered the detection probability of objects and measurement errors in a radar model to evaluate an AEB in a collision scenario.
2.2.4. Comparison of the Different Modeling Approaches
The advantages of the ideal model are the low computational effort and the simple implementation in a simulation framework. It is possible to achieve a simulative effectiveness assessment of the considered system with perfect measurement data. The focus of these evaluations is to obtain a best-case estimation of the system’s collision avoidance potential independent of sensor effects. With real sensors, these conditions cannot be achieved because the performance of real sensors will always be subpar compared to an ideal sensor.
A physical model requires substantially more computing time and a wide range of input information on the environment. The model supplies measurement data that is close to reality to evaluate the whole data flow from raw data to the driving assistance system via signal processing algorithms. In simulation runs with crash data, the information about the environment (e.g., material properties of objects) is typically not detailed enough to generate input data for physical sensor models.
The phenomenological model is a compromise between short calculation time and realistic data preparation. The models are easier to parametrize than the physical models and can be implemented in less detailed simulation environments. The robustness of driving assistance systems in case of measurement inaccuracies in reconstructed crash scenarios can be evaluated with these sensor models. Stochastic error models require multiple simulation runs of the scenarios to obtain statistically significant results.
2.3. Crash Database
This study’s crash dataset is based on the GIDAS database, especially the subset GIDAS pre-crash matrix (PCM). In the GIDAS project, about 2000 crash cases are recorded annually in the regions Dresden, Hannover, and a surrounding area around Munich [21,22]. Every case record contains about 3500 pieces of information about the crash incident, the participants, and the site. These data could be used for detailed analyses.
For the simulation of the recorded cases, we need a reconstruction of the pre-crash phase. These data are stored in the GIDAS-PCM. For 26% of the GIDAS cases, the PCM contains a detailed dynamics reconstruction and environment information of the last five seconds before the first collision occurred. The dynamics data include the trajectory of the participants as a time series with a step size of 10 ms. The participant data (e.g., dimensions, mass) are also stored. Environmental information, such as lane markings and objects, are described with polygons [23].
We focused our study on the effectiveness assessment of an AEB system in car-to-car collisions. AEB systems can potentially solve rear-end collisions. Therefore, we considered these cases from the entire PCM database (1589 scenarios out of 11,512). This way, the effectiveness of the system is not distorted by cases (e.g., lane departure scenarios) that are not within the system boundaries.
2.4. Simulation Models
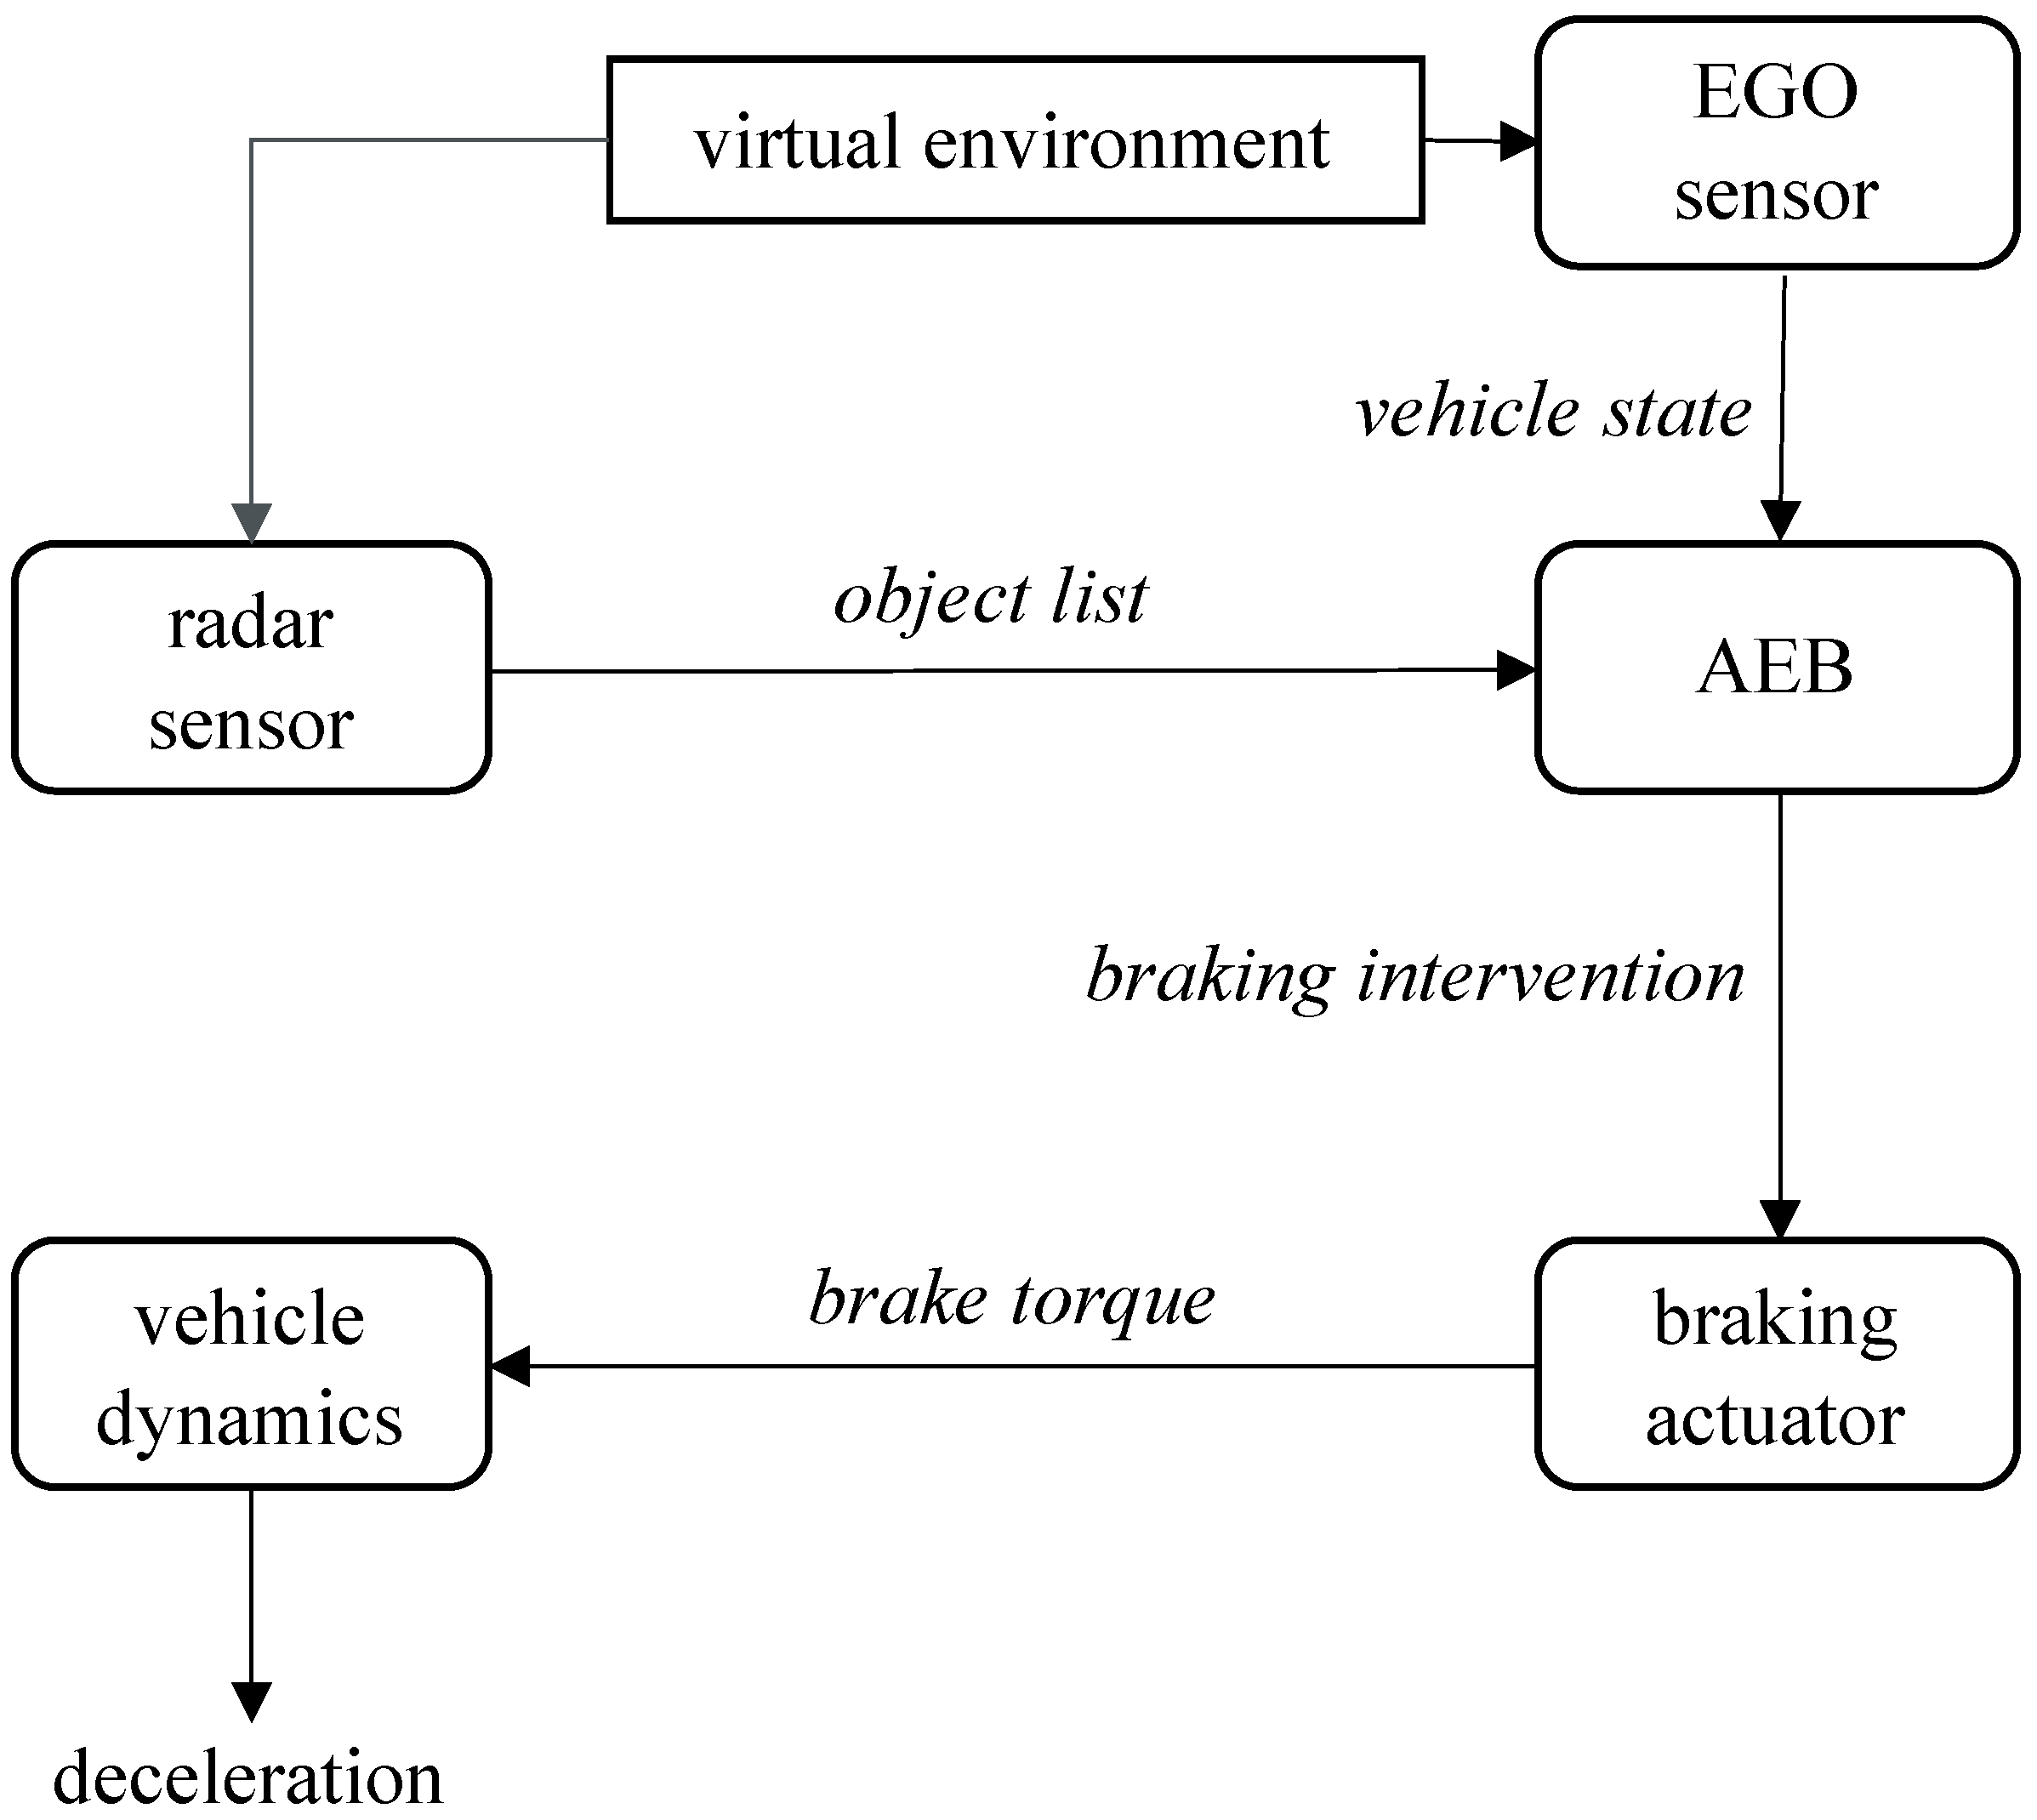
The following section provides an overview of the system components used and set up for our assessment. The system will be presented starting with the detection of the environment by a phenomenological radar sensor via the data processing by the AEB component up to the realization of the target variables in the vehicle dynamics model by actuators (Figure 2).
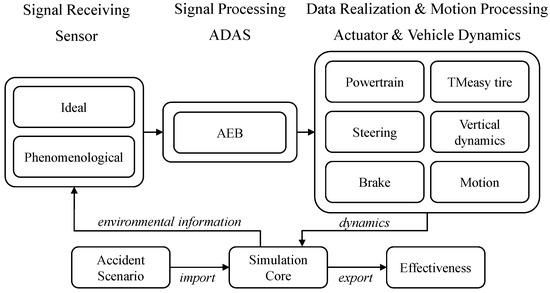
Figure 2.
Closed-loop simulation workflow in openPASS.
2.4.1. Phenomenological Radar Sensor Model for the Simulative Effectiveness Assessment (Data Provision)
The goal of our sensor model is to generate the object lists needed for the AEB system. By selecting and deselecting measurement effects, we achieve a simple switch between the ideal and the phenomenological model. Our model uses OSI standards for data flow. The input of the model is the OSI sensor view. For the output, we chose the OSI sensor data structure [24]. A cycle time specifies how often the sensor performs its measurements during simulation. A beam model is used to determine detection points on objects in the vehicle coordinate system. Each beam ends at the first intersection point with an object. The detection points are filtered by the sensor view, which can be defined by range and opening angle or by a polygon. In the next steps, a distinction is made between the ideal and the phenomenological state. In the ideal state, the model does not consider any measurement phenomena. If there is a detection point at an object and the object is measured for a specific consideration time, the radar sensor supplies the ground truth information for that object to the following driving functions. In the phenomenological state, we implemented main effects such as the signal-to-noise ratio (SNR) and measurement inaccuracies for velocity, distance, and azimuth angle. The SNR is defined according to [6] by the quotient of signal-to-noise power, as follows:
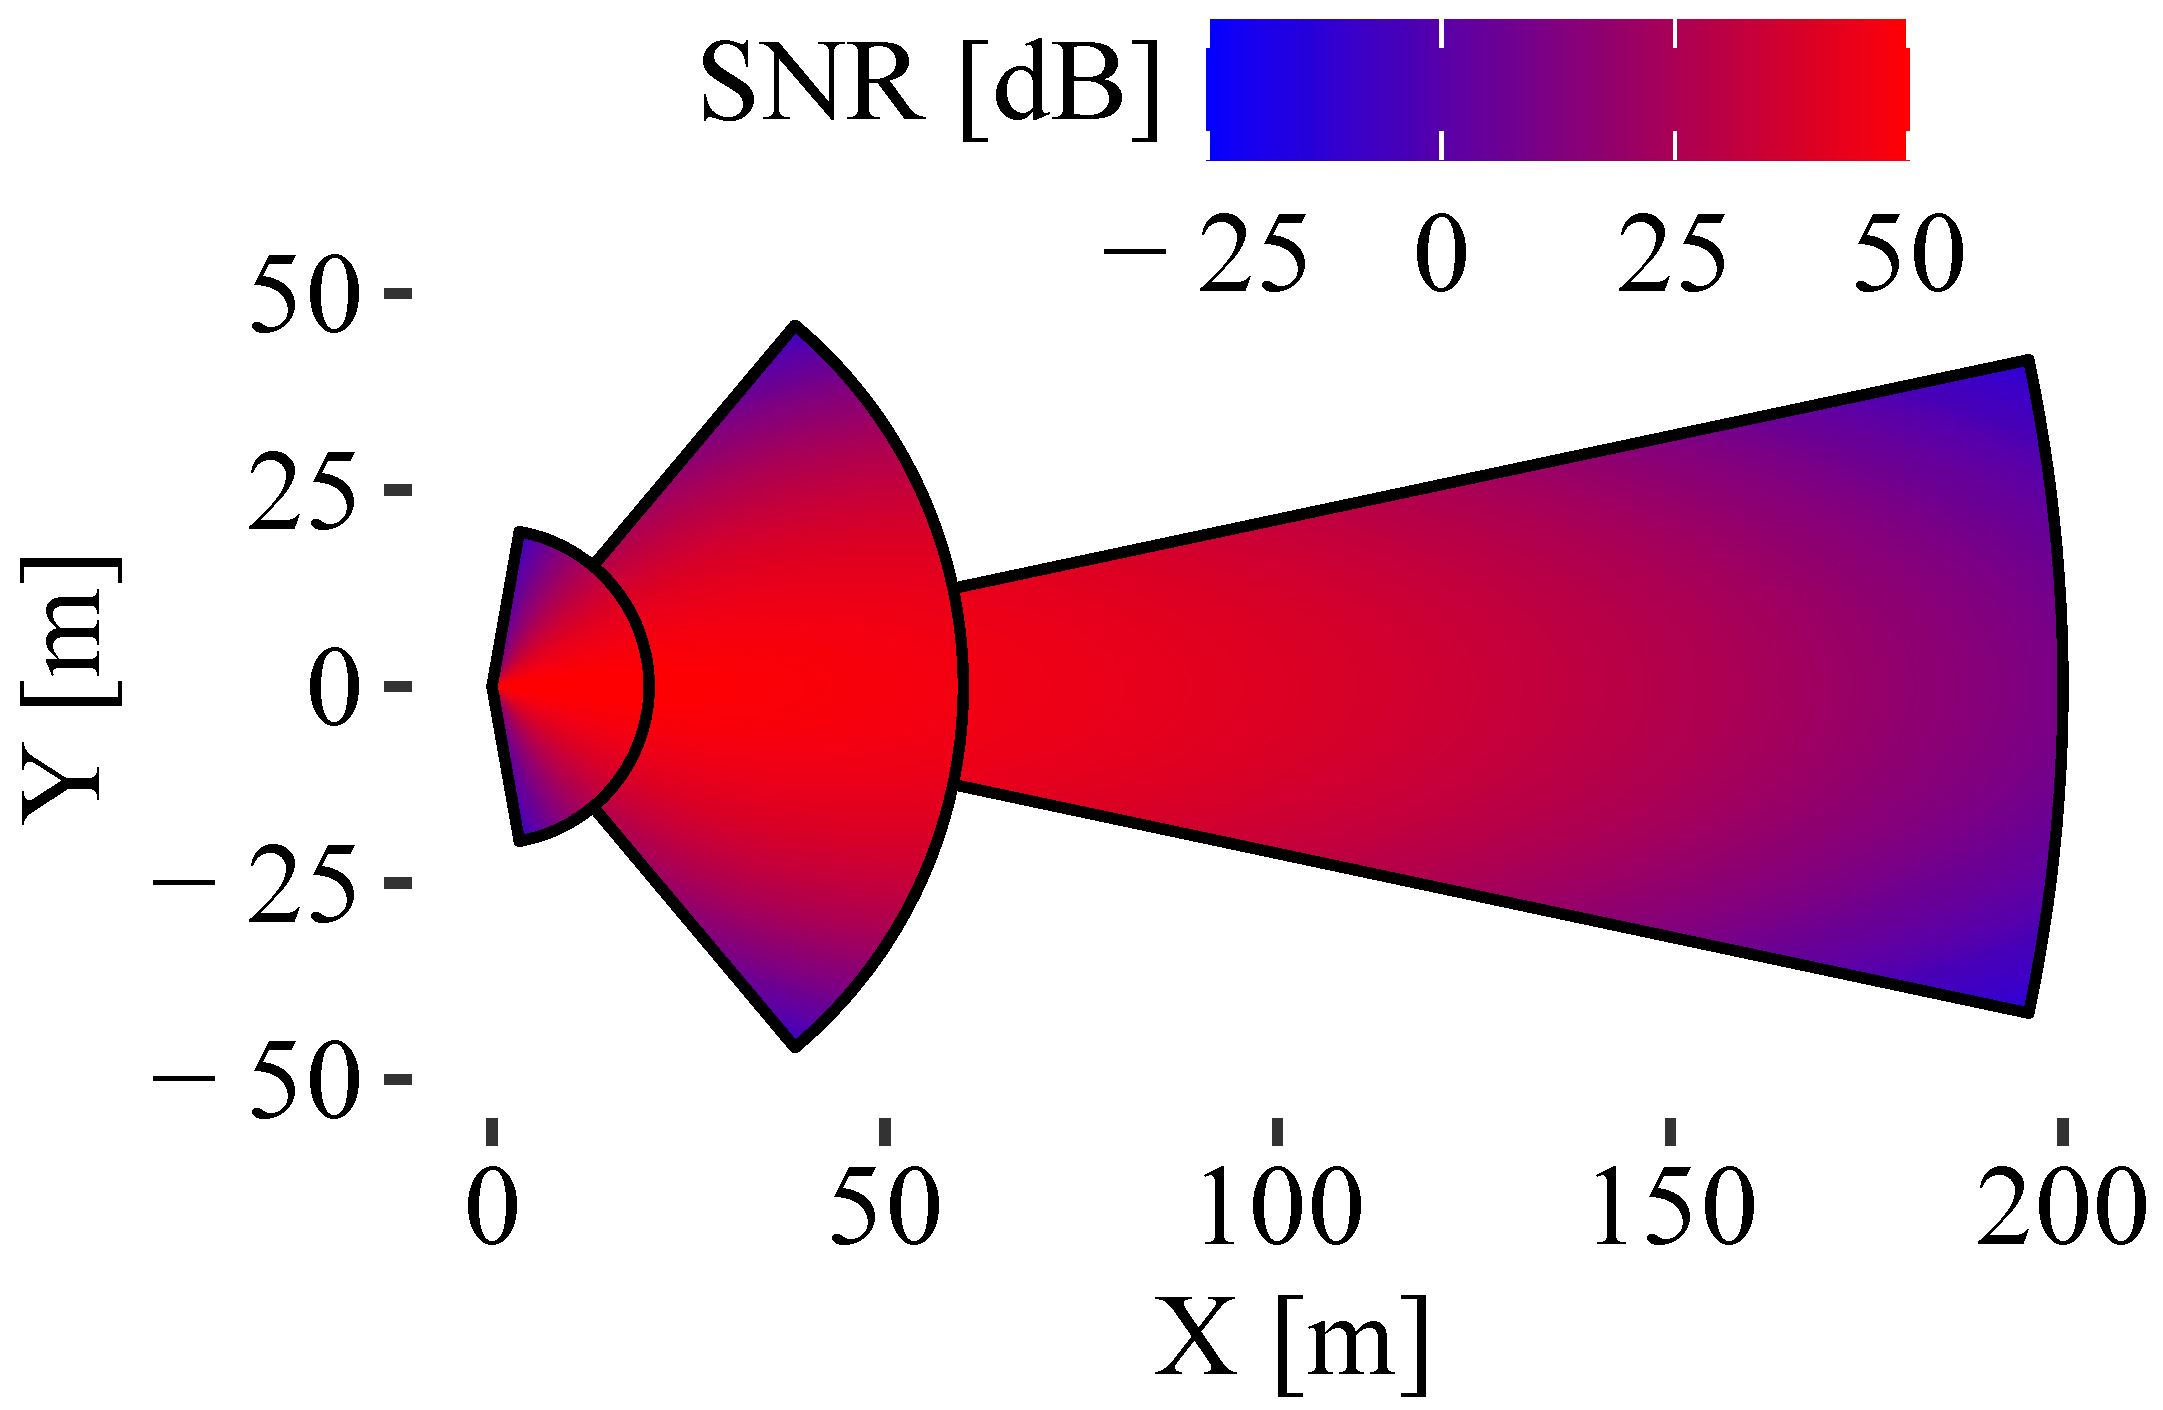
We used a similar approach to [11] to model a static SNR configuration for a radar sensor model depending on the azimuth angle and the distance r. The SNR characteristic of a radar system is defined by a uni- or bivariate polynomial of any degree in Cartesian or polar coordinates, e.g., the following equation shows a bivariate polynomial with a total degree of 2:
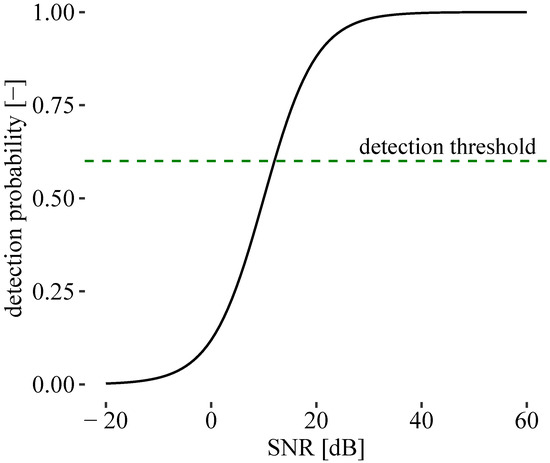
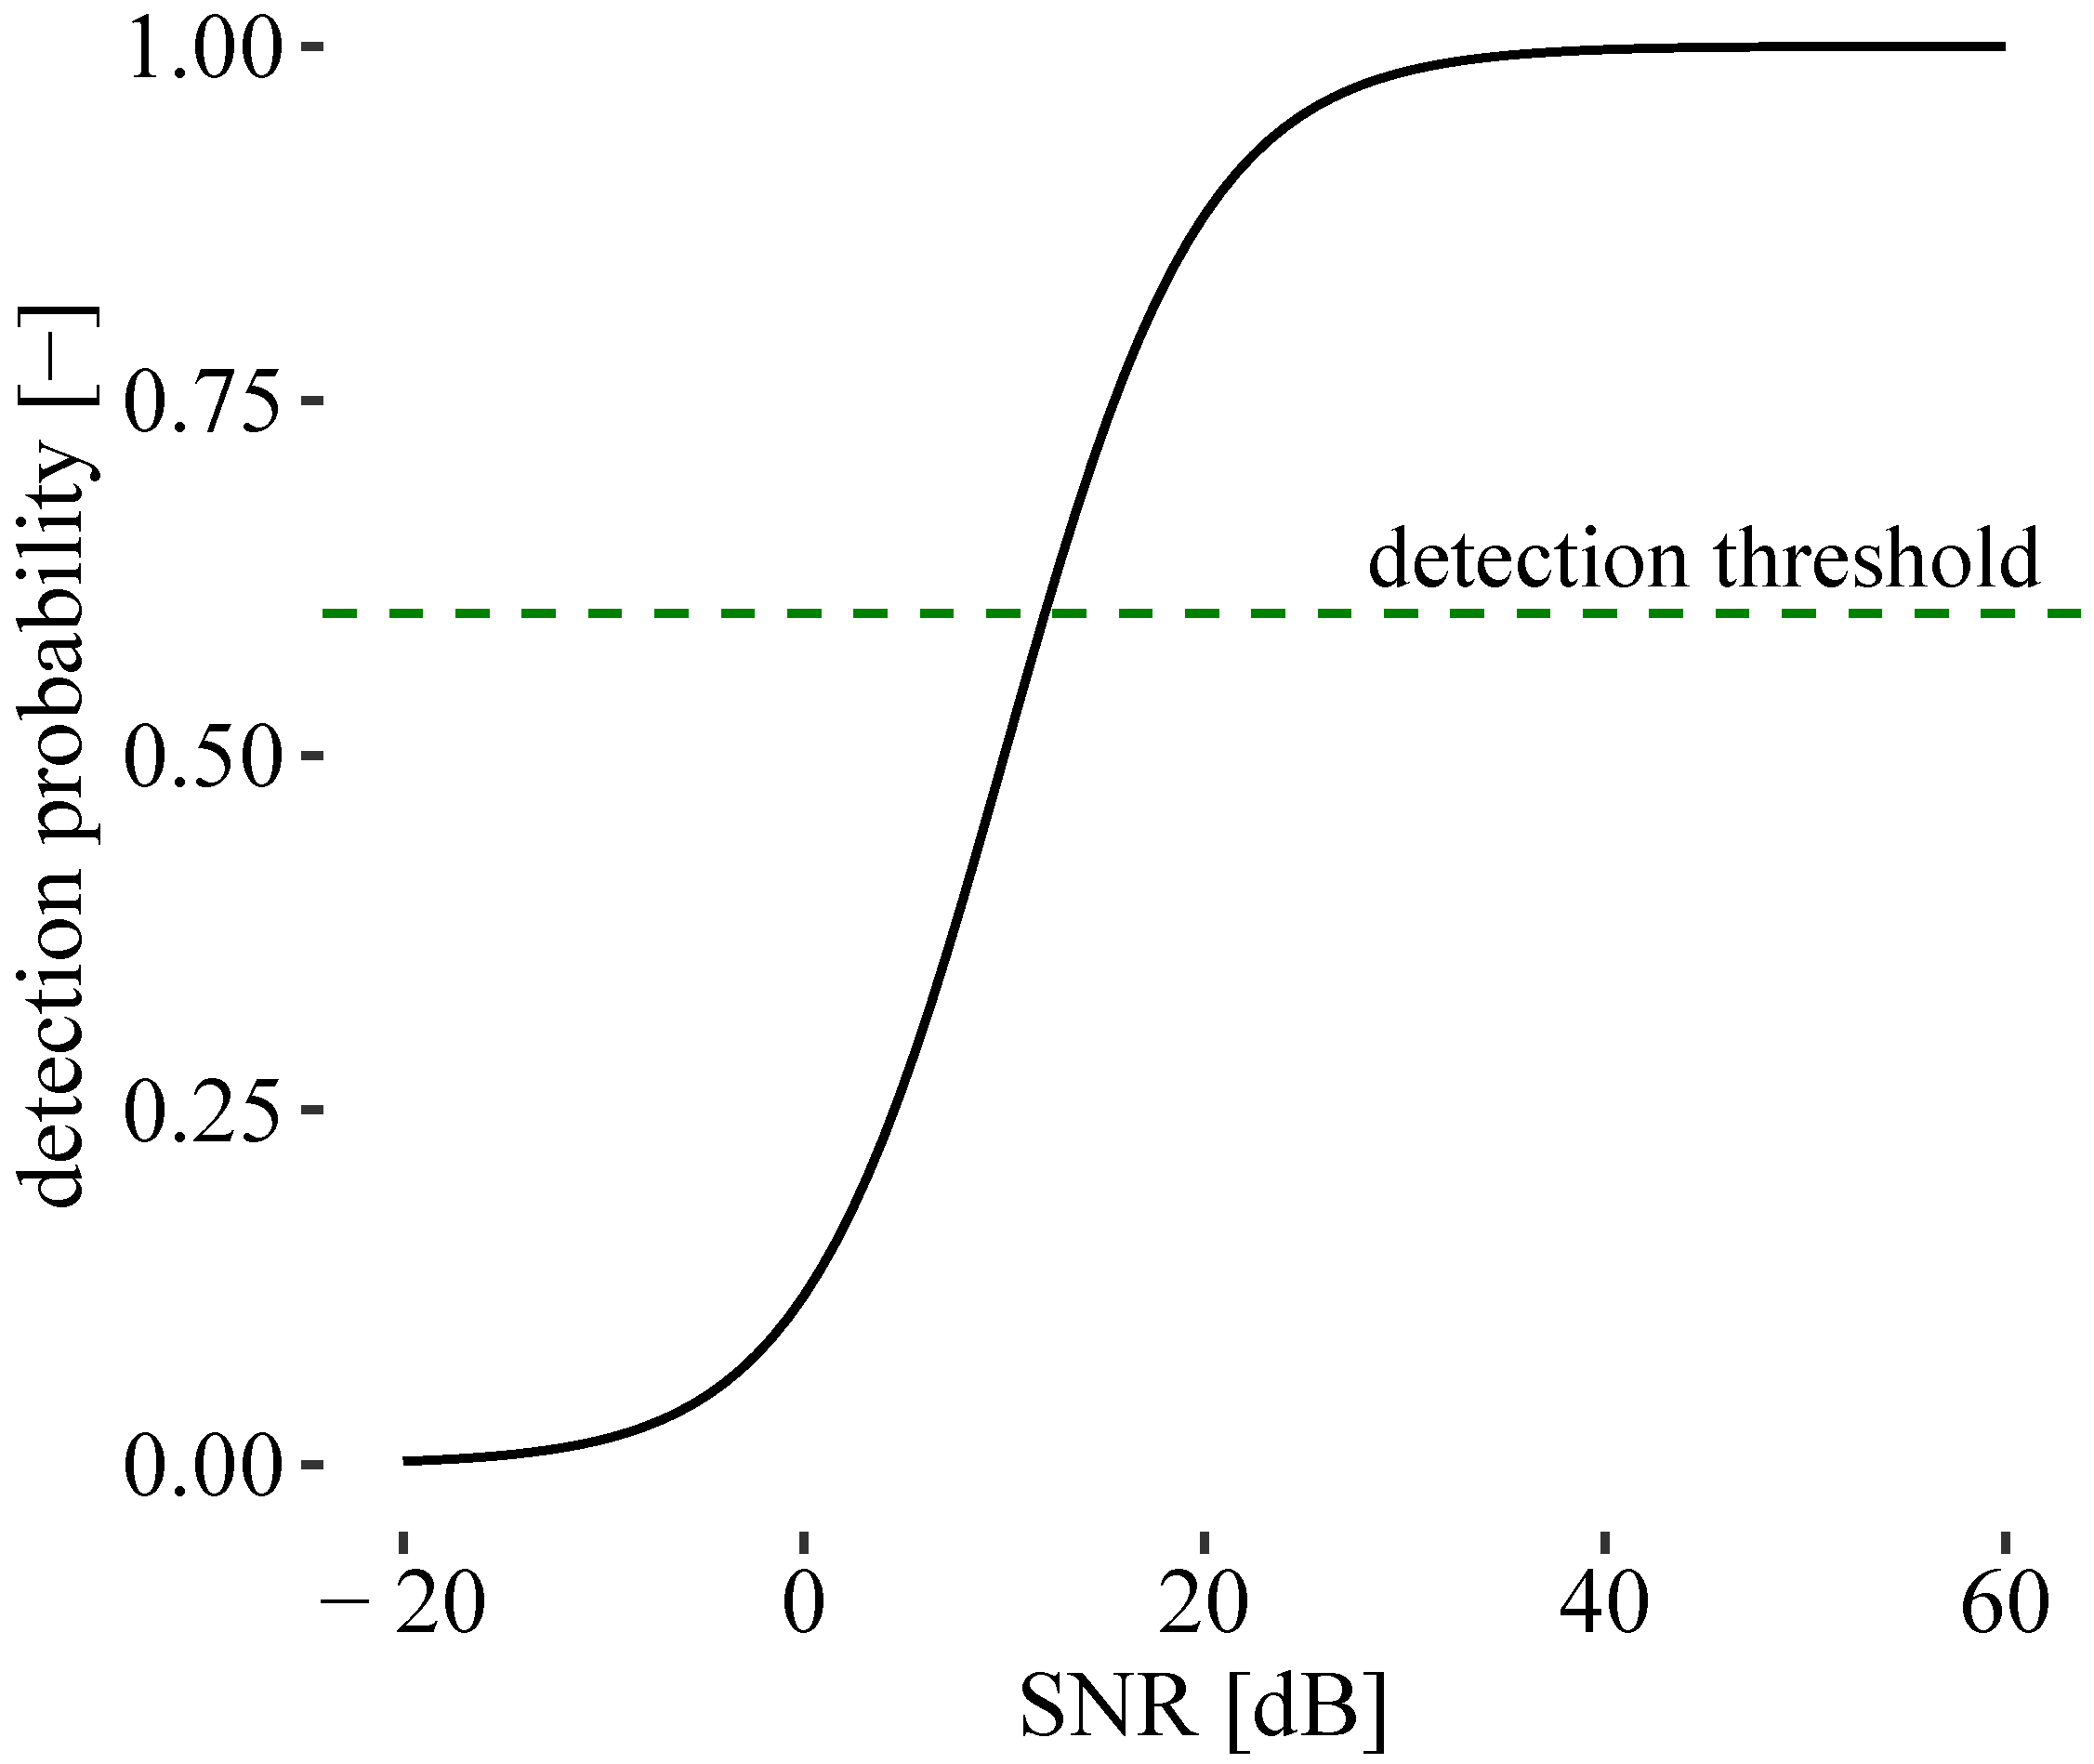
Currently, we have not implemented an object- or environment-specific adaptation of the SNR value. For every beam-object intersection point, an SNR value is calculated by the parametrized equation. A detection point is selected for further processing if its SNR value, and the according detection probability is higher than a parametrizable threshold [10]. An object is considered detected if there exist more than two detection points after SNR filtering. The detected object is sent from the sensor model to the driving function after a parametrizable consideration time if it is still being detected. Based on the detected points, the length and width of the object are estimated and the middle of the facing side as the object reference point can be determined.
Real radar measurements of position and velocity are inaccurate due to measurement principles or sensors’ resolution levels. To model these signals, we added a stochastic error to the object’s position and velocity data. Thereby, position measurement inaccuracy of a radar sensor is a combination of a distance and an azimuth angle error. We define every error as a standard deviation function equivalent to the SNR equation for the whole sensor view. For the currently detected objects, position (azimuth angle and distance) and velocity errors are stochastically chosen in the simulation runs from a normal distribution with calculated standard deviation.
The sensor (ideal and phenomenological) provides the following data, processing the ground truth data using OSI:
- Distance to the middle of the facing side (based on osi3::BaseMoving::position).
- Object velocity (relative; based on osi3::BaseMoving::velocity).
- Object acceleration (relative; based on osi3::BaseMoving::acceleration).
- Object type (osi3::MovingObject::Type).
- Object dimension (osi3::BaseMoving::Dimension3d).
- Object yaw angle (relative; based on osi3::BaseMoving::orientation).
Outside of the measurement cycles, objects are predicted based on the last measurements for a maximum definable time.
2.4.2. Autonomous Emergency Braking (Data Processing)
An AEB is an intervening collision avoidance system. In critical situations, the system can access the braking system to decelerate the vehicle without driver intervention. Critical scenarios are identified by the AEB by appropriate metrics [25].
In our study, we use the time to collision (TTC) as the trigger for the AEB interventions. Based on the sensor data, the TTC value is calculated for every single detected object. For uniform motions in longitudinal traffic, the time to collision is defined by the quotient of the object distance () and the relative object velocity () [25]:
In the case of relative decelerations between the object and vehicle, the TTC is determined as follows [25]:
The sensor object with the lowest TTC value is selected as the target object for the braking intervention. The AEB model calculates the needed collision avoidance deceleration for the target object. The braking intervention is possible from a TTC value equal to or lower than 1.5 s with a maximum deceleration of 3 m/s2. In the second stage, the maximum deceleration is limited to 10 m/s2 if the TTC value is equal to or lower than 0.6 s. For braking interventions, a lateral overlap of the target and own bounding box must exist.
2.4.3. Actuators and Dynamics Model (Data Realization and Motion Processing)
We use the contributed two-track motion model of openPASS to realize the motion of the vehicles. The model contains the following six modules (Figure 2):
- Powertrain model.
- Steering model.
- Brake model.
- TMeasy tire model [26].
- Vertical dynamics model.
- Motion model.
The powertrain and steering model are not relevant to the AEB interventions. They have been parametrized to a linear power output with a maximum engine speed and a static steering angle to be able to follow the trajectories of the scenario. The brake model is needed in the simulation framework to convert the brake requirements of the driver and the AEB request into separate wheel braking torque with 60% of the total torque on the front axle. We used a linear brake model for this assessment. The deceleration gradient is limited to 12 m/s3, and a response time of 0.12 s was additionally applied to model the pressure build-up time in a real braking system [27]. A braking coordinator manages the inputs and prioritizes the interventions of the AEB system. The requested deceleration is transformed into a brake pedal position under consideration of tire diameter and maximum brake torque. The tire model calculates the tire forces of the vehicle from slip and drive or brake torque. We used the following parameters for the TMeasy tire model (Table 1):

Table 1.
Parametrization of the TMeasy tire model.
Parameters for longitudinal and lateral directions are identical and normalized by the static vertical tire force.
The vertical dynamics model for the calculation of static and dynamic wheel loads as an input for the tire model was parametrized with constant spring and damper rates (Table 2):

Table 2.
Parametrization of the vertical dynamics model.
The motion model and vehicle dimensions were parametrized by following participant data of the PCM dataset:
- Mass.
- Track width.
- Center of gravity and geometric center.
- Dimension.
- Inertia.
2.5. Assessment Criteria
According to [2], we divided the simulated scenarios into three categories for evaluation. In the first category, the green spot, the situation is resolved by the system. If the system intervenes in the scenario, but the collision cannot be avoided, we assign the scenario to the gray spots (addressed and not resolved). With system adaptations, it could be possible to solve the situation. Without any interaction, we classify the case as a white spot (not addressed).
The radar sensor model is deterministic in the ideal state (configuration 1), so it is sufficient to simulate these crash scenarios only once. Also, due to the deterministic simulation tool, openPASS, each further run would produce the same results.
In the phenomenological state (configuration 2), the randomly distributed errors generate a stochastic behavior. It is no longer possible to assume that each simulation run will result in the same effectiveness. For statistically relevant results, we need to perform multiple simulation executions. We simulate every case a thousand times to obtain a reliable result. This results in 1000 calculated effectiveness values, which we can summarize using the median and a range. Our approach extends the evaluation methodology outlined by [2] and increases the significance of the evaluation by specifying a confidence interval in which a real system would perform. In addition, the comparison between ideal and phenomenological input data allows conclusions to be drawn about the robustness of the systems. Robust systems can process inaccurate sensor input data better, which would result in effectiveness close to the ideal state without a large span.
3. Results
We evaluate the presented system components in two configurations to determine the influence of different sensor characteristics. Therefore, in each configuration, the actors, AEB, and two-track model are parametrized as described in the previous section. The sensor model is considered in its two states.
In addition to constant parameters, the configurations differ in the preparation of the object data. Sensor viewing areas are identical in both configurations, so they do not affect the assessment. The used parameters are listed below (Table 3):

Table 3.
Constant sensor parameters.
Both sensor configurations differ in the following parameterizations.
- Sensor configuration 1:
- State: Ideal
- Detection Area: Figure 3
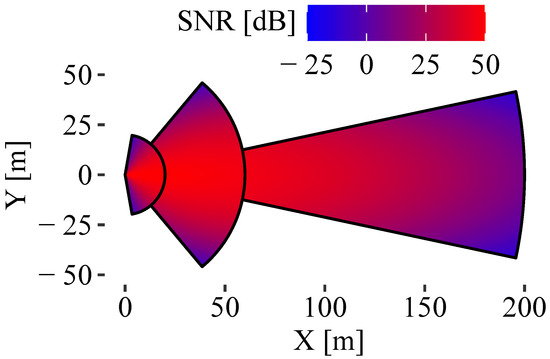 Figure 3. Sensor configuration (ideal and phenomenological with SNR).
- Sensor configuration 2:
Simulative Effectiveness Assessment
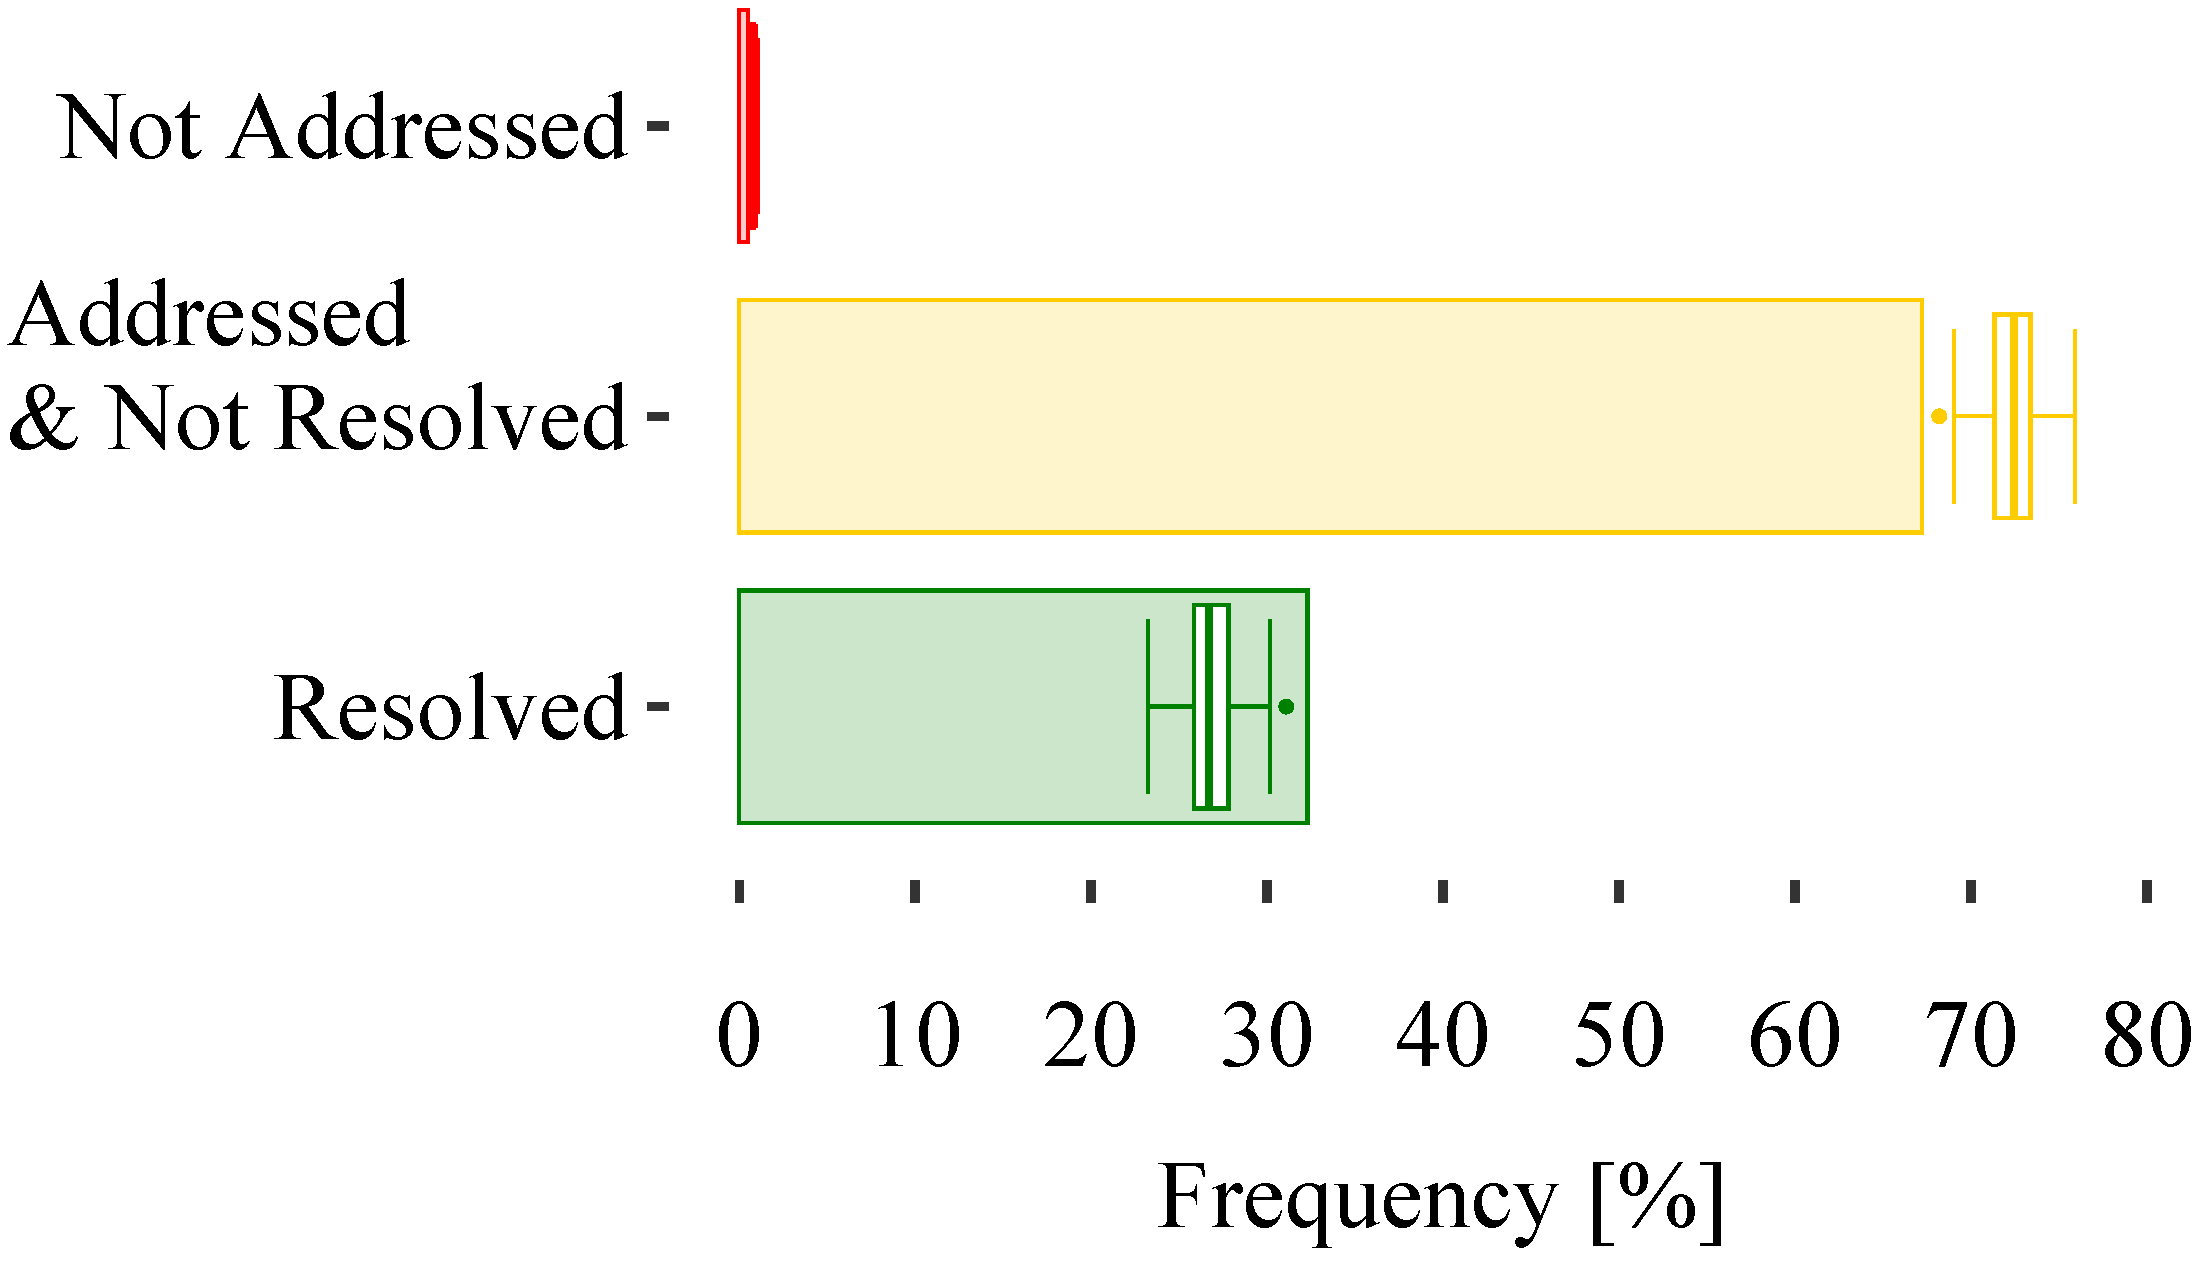
Using the ideal sensor model, the considered AEB resolves 32.3% of the 1589 rear-end collisions. In addition, 67.2% of the cases are addressed and categorized as a gray spot for the AEB. With a better situation analysis and an earlier intervention, these cases could be solved. Only 0.5% of all situations are not addressed and therefore a white spot for the system (Figure 5). The potential of the function, designed for the rear-end collisions, is thus directly recognizable.
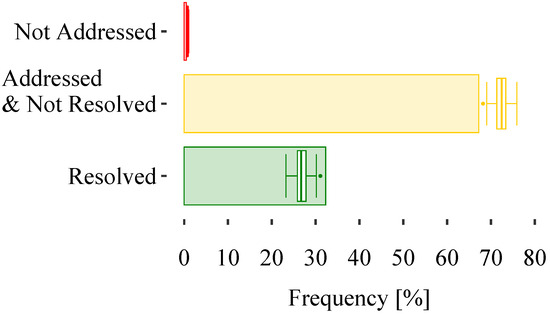
Figure 5.
Effectiveness of the simulated AEB in phenomenological and ideal configurations (boxplot: phenomenological configuration; bar plot: ideal configuration).
When using the phenomenological sensor model, the effectiveness of the system is reduced (Figure 5). A median of 26.7% of cases are resolved. This corresponds to a reduction of 5.6 percentage points (pp) related to the best-case assessment with the ideal sensor. Moreover, 72.4% (+6.2 pp) of the scenarios are addressed at the median, and in 0.8% (+0.3 pp), no intervention could be identified. The main dynamic of the noisy inaccurate phenomenological sensor signals can be seen in the gray and green spots. Cases that are not addressed in the ideal state are mostly not addressed in the phenomenological state. Only a few cases, in which the AEB calculates a lateral overlap due to a measurement error, switch in the category to the gray spots. That leads to a span in the white spots of 0.42% over the one thousand simulation runs. The span in the green spot is 7.84%, and in the gray spot with 7.72%—it is similarly large. This can be explained by the delayed intervention times, which can occur due to poorer object detection. Due to the inaccurate distance and speed measurement, the required avoidance acceleration and the TTC can be determined less accurately. Cases that could be solved in the ideal state are still addressed, but the time of intervention and delay are no longer sufficient. More robust driver assistance systems can handle these disturbances in a better way, resulting in a smaller span and effectiveness closer to the ideal condition. In terms of this AEB, the metrics shown in [25], which were used to model the system, need to be extended for a more robust intervention strategy in the case of inaccurate data. The following points can be added for a more robust design:
- Determination of standard deviations in measured variables of the sensor.
- Calculation of the variance of the TTC and the avoidance acceleration from the deviations of the measured variables.
- Addition of a safety factor to the used metrics.
4. Discussion
The use of phenomenological sensor models for effectiveness assessment is a key part of increasing the validity of the simulations. Compared to the assessment with ideal sensors, this is a step towards more realistic sensor input data for the driving assistance functions. However, phenomenological sensor models cannot fully represent the scope of physical sensor models. The simulation with phenomenological sensor models can be used to identify the cases that vary in the assignment to the evaluation category over the simulation runs. Then, these scenarios could be investigated further in a more detailed rendered and physical environmental simulation like the open-source framework CARLA [28]. It is challenging to reproduce a physical representation of road users sufficient for physical sensor models with the data contained in crash databases and must be modeled on several types of vehicles and objects in individual cases with increased effort. By pre-filtering using the phenomenological approach presented, the effort can be reduced by decreasing the number of relevant scenarios.
So far, an AEB for longitudinal collisions has been considered with the introduced sensor models. An effectiveness assessment of other state-of-the-art driving functions for longitudinal traffic such as an adaptive cruise control but also lane-keeping systems for lateral control could become more realistic with phenomenological sensor models while keeping the computing time low. Other phenomenological effects and sensor types are also to be incorporated into the models in further stages of development. This includes the adaptation of the SNR to different types of objects to be able to evaluate other crash constellations [29,30]. The influence of weather conditions can also be investigated in further work [31].
In addition to sensor modeling, the data basis is relevant for a robust effectiveness assessment. Not every case of a considered field of action is reconstructed for the simulation. The simulative evaluation may be limited if there is no similarity between the simulative subset and the overall field of action in relevant crash parameters such as collision velocity [32]. In addition to that the evaluation solely relies on German crash data provided by the GIDAS database. Crash data from other countries could be the focus in the future.
If the similarity is evaluated and a harmonized tool, such as openPASS with verified and validated models, is used, this study could enhance the realism of simulations in the context of collision avoidance evaluations. As a result, a simulative evaluation no longer yields a single value of effectiveness that represents the best-case scenario. The assessment presented here extends existing approaches by defining a range of determined effectiveness within which the system would perform under real road conditions. The significance of the simulations could be further increased compared to evaluations using an ideal sensor.
Author Contributions
Conceptualization, J.E.M.; methodology, J.E.M. and V.P.; software/simulation models, J.E.M. and V.P.; investigation, J.E.M. and V.P.; writing—original draft preparation, J.E.M., M.P. and S.S.; writing—review and editing, J.E.M. and S.S.; visualization, J.E.M. and M.P.; supervision, S.S. All authors have read and agreed to the published version of the manuscript.
Funding
This research received no external funding.
Institutional Review Board Statement
Not applicable.
Informed Consent Statement
Not applicable.
Data Availability Statement
The authors possess a valid data-use license for the GIDAS (221231_GIDAS2022, 230131_GIDAS_PCM_5.0_2022_2) dataset. The used actuators and motion models in this study are openly available in the Eclipse openPASS repository at https://gitlab.eclipse.org/eclipse/openpass. (accessed on 20 July 2024).
Acknowledgments
This research project is supported by Volkswagen AG. The results, opinions, and conclusions expressed in this publication are those of the authors and do not necessarily represent the views of Volkswagen AG.
Conflicts of Interest
The authors were employed by Volkswagen AG. They declare that the research was conducted in the absence of any commercial or financial relationships that could be construed as a potential conflict of interest.
Abbreviations
The following abbreviations are used in this manuscript:
| ADAS | advanced driver assistance system |
| AEB | autonomous emergency braking |
| ASAM | Association for Standardization of Automation and Measuring Systems |
| FMI | functional mock-up interface |
| GIDAS | German In-Depth Accident Study |
| openPASS | open Platform for Assessment of Safety Systems |
| OSI | open simulation interface |
| PCM | pre-crash matrix |
| SNR | signal-to-noise ratio |
| TTC | time to collision |
References
- Viadero-Monasterio, F.; Alonso-Rentería, L.; Pérez-Oria, J.; Viadero-Rueda, F. Radar-Based Pedestrian and Vehicle Detection and Identification for Driving Assistance. Vehicles 2024, 6, 1185–1199. [Google Scholar] [CrossRef]
- Stark, L.; Düring, M.; Schoenawa, S.; Maschke, J.E.; Do, C.M. Quantifying Vision Zero: Crash avoidance in rural and motorway accident scenarios by combination of ACC, AEB, and LKS projected to German accident occurrence. Traffic Inj. Prev. 2019, 20, 126–132. [Google Scholar] [CrossRef] [PubMed]
- Destatis: Pressemitteilung Nr. 261 vom 5. Juli 2024. Available online: https://www.destatis.de/DE/Presse/Pressemitteilungen/2024/07/PD24_261_46241.html (accessed on 20 July 2024).
- Schachner, M.; Sinz, W.; Thomson, R.; Klug, C. Development and evaluation of potential accident scenarios involving pedestrians and AEB-equipped vehicles to demonstrate the efficiency of an enhanced open-source simulation framework. Accid. Anal. Prev. 2020, 148, 105831. [Google Scholar] [CrossRef] [PubMed]
- Diewald, A.; Kurz, C.; Kannan, P.V.; Gießler, M.; Pauli, M.; Göttel, B.; Kayser, T.; Gauterin, F.; Zwick, T. Radar Target Simulation for Vehicle-in-the-Loop Testing. Vehicles 2021, 3, 257–271. [Google Scholar] [CrossRef]
- Ponn, T.; Muller, F.; Diermeyer, F. Systematic Analysis of the Sensor Coverage of Automated Vehicles Using Phenomenological Sensor Models. In Proceedings of the 2019 IEEE Intelligent Vehicles Symposium (IV), Paris, France, 9–12 June 2019; pp. 1000–1006. [Google Scholar]
- Iqbal, M.; Han, J.C.; Zhou, Z.Q.; Towey, D.; Chen, T.Y. Metamorphic testing of Advanced Driver-Assistance System (ADAS) simulation platforms: Lane Keeping Assist System (LKAS) case studies. Inf. Softw. Technol. 2023, 155, 107104. [Google Scholar] [CrossRef]
- Sippl, C.; Bock, F.; Wittmann, D.; Altinger, H.; German, R. From Simulation Data to Test Cases for Fully Automated Driving and ADAS. In Testing Software and Systems; Wotawa, F., Nica, M., Kushik, N., Eds.; Springer International Publishing: Cham, Switzerland, 2016; pp. 191–206. [Google Scholar]
- Putter, R.; Neubohn, A.; Leschke, A.; Lachmayer, R. Predictive Vehicle Safety—Validation Strategy of a Perception-Based Crash Severity Prediction Function. Appl. Sci. 2023, 13, 6750. [Google Scholar] [CrossRef]
- Bernsteiner, S.; Magosi, Z.F.; Lindvai-Soos, D.; Eichberger, A. Phänomenologisches Radarsensormodell zur Simulation längsdynamisch regelnder Fahrerassistenzsysteme. In Proceedings of the 16 Internationaler Kongress Elektronik im Fahrzeug, Düsseldorf, Germany, 16–17 October 2013; pp. 639–650. [Google Scholar]
- Bernsteiner, S.; Magosi, Z.; Lindvai-Soos, D.; Eichberger, A. Radarsensormodell für den virtuellen Entwicklungsprozess. ATZelektronik 2015, 10, 72–79. [Google Scholar] [CrossRef]
- Dobberstein, J.; Bakker, J.; Wang, L.; Vogt, T.; Düring, M.; Stark, L.; Gainey, J.; Prahl, A.; Mueller, R.; Blondelle, G. The Eclipse Working Group openPASS-an open source approach to safety impact assessment via simulation. In Proceedings of the 25th International Technical Conference on the Enhanced Safety of Vehicles (ESV), Detroit, MI, USA, 5–8 June 2017. [Google Scholar]
- Fahrenkrog, F.; Hammouda, M.; Fischer, F. Virtual Simulation Based Assessment of ADAS in Consumer Tests by openPASS. In Proceedings of the 27th International Technical Conference on the Enhanced Safety of Vehicles (ESV), Yokohama, Japan, 3–6 April 2023. [Google Scholar]
- Dupuis, M.; Strobl, M.; Grezlikowski, H. OpenDRIVE 2010 and Beyond—Status and Future of the de facto Standard for the Description of Road Networks. In Proceedings of the Driving Simulation Conference Europe 2010, Paris, France, 9–10 September 2010. [Google Scholar]
- Chen, H.; Ren, H.; Li, R.; Yang, G.; Ma, S. Generating Autonomous Driving Test Scenarios based on OpenSCENARIO. In Proceedings of the 9th International Conference on Dependable Systems and Their Applications (DSA), Wulumuqi, China, 4–5 August 2022; pp. 650–658. [Google Scholar]
- Blochwitz, T.; Otter, M.; Arnold, M.; Bausch, C.; Clauß, C.; Elmqvist, H.; Junghanns, A.; Mauss, J.; Monteiro, M.; Neidhold, T.; et al. The functional mockup interface for tool independent exchange of simulation models. In Proceedings of the 8th International Modelica Conference, Dresden, Germany, 20–22 March 2011; pp. 105–114. [Google Scholar]
- Hanke, T.; Hirsenkorn, N.; van-Driesten, C.; Garcia-Ramos, P.; Schiementz, M.; Schneider, S.; Biebl, E. Open Simulation Interface: A Generic Interface for the Environment Perception of Automated Driving Functions in Virtual Scenarios; Technische Universität München Technical Report 1: Munich, Germany, 2017. [Google Scholar]
- Herrmann, M. Sensormodelle für die Entwicklung und Absicherung automatisierter Fahrfunktionen. ATZelektronik 2019, 14, 50–53. [Google Scholar] [CrossRef]
- Schubert, R.; Mattern, N.; Bours, R. Simulation of Sensor Models for the Evaluation of Advanced Driver Assistance Systems. ATZelektronik Worldw. 2014, 9, 26–29. [Google Scholar] [CrossRef]
- Ahn, N.; Höfer, A.; Herrmann, M.; Donn, C. Real-time Simulation of Physical Multi-sensor Setups. ATZelektronik Worldw. 2020, 15, 8–11. [Google Scholar] [CrossRef]
- Otte, D.; Jänsch, M.; Haasper, C. Injury protection and accident causation parameters for vulnerable road users based on German In-Depth Accident Study GIDAS. Accid. Anal. Prev. 2012, 44, 149–153. [Google Scholar] [CrossRef] [PubMed]
- GIDAS 4.0: Neustart der Vertieften Straßenverkehrsunfall-Erhebung. Available online: https://www.bast.de/DE/Presse/Mitteilungen/2023/05-2023.html (accessed on 20 July 2024).
- Institute for Traffic Accident Research at Dresden University of Technology. Pre-Crash-Matrix (PCM): Format Specification V. 5.0; The Institute for Traffic Accident Research at Dresden University of Technology: Dresden, Germany, 2021. [Google Scholar]
- van Driesten, C.; Schaller, T. Overall Approach to Standardize AD Sensor Interfaces: Simulation and Real Vehicle. In Fahrerassistenzsysteme 2018; Bertram, T., Ed.; Springer Fachmedien Wiesbaden: Wiesbaden, Germany, 2019; pp. 47–55. [Google Scholar]
- Winner, H.; Hakuli, S.; Lotz, F.; Singer, C. Handbuch Fahrerassistenzsysteme; Springer Fachmedien Wiesbaden: Wiesbaden, Germany, 2015; pp. 900–901. [Google Scholar]
- Rill, G. Road Vehicle Dynamics: Fundamentals and Modeling, 1st ed.; CRC Press: Boca Raton, FL, USA, 2011. [Google Scholar]
- Küçükay, F. Grundlagen der Fahrzeugtechnik; Springer Fachmedien Wiesbaden: Wiesbaden, Germany, 2022; pp. 778–779. [Google Scholar]
- Dosovitskiy, A.; Ros, G.; Codevilla, F.; Lopez, A.; Koltun, V. CARLA: An open urban driving simulator. In Proceedings of the 1st Annual Conference on Robot Learning (CoRL), Mountain View, CA, USA, 13–15 November 2017; pp. 1–16. [Google Scholar]
- Bel Kamel, E.; Peden, A.; Pajusco, P. RCS modeling and measurements for automotive radar applications in the W band. In Proceedings of the 11th European Conference on Antennas and Propagation (EUCAP), Paris, France, 19–24 March 2017; pp. 2445–2449. [Google Scholar]
- Matsunami, I.; Nakamura, R.; Kajiwara, A. RCS measurements for vehicles and pedestrian at 26 and 79 GHz. In Proceedings of the 6th International Conference on Signal Processing and Communication Systems (ICSPCS), Gold Coast, Australia, 12–14 December 2012; pp. 1–4. [Google Scholar]
- Hasirlioglu, S.; Riener, A. Introduction to rain and fog attenuation on automotive surround sensors. In Proceedings of the 20th International Conference on Intelligent Transportation Systems (ITSC), Yokohama, Japan, 16–19 October 2017; pp. 1–7. [Google Scholar]
- Maschke, J.E.; Putter, R.; Schoenawa, S.; Gaas, T.; Leschke, A.; Lachmayer, R. Road Safety: A Similarity Analysis of the GIDAS Data and the Overall Incidence of Car-to-Car Accidents on German Roads. In Proceedings of the 7th International Conference on System Reliability and Safety (ICSRS), Bologna, Italy, 22–24 November 2023; pp. 229–236. [Google Scholar]
Disclaimer/Publisher’s Note: The statements, opinions and data contained in all publications are solely those of the individual author(s) and contributor(s) and not of MDPI and/or the editor(s). MDPI and/or the editor(s) disclaim responsibility for any injury to people or property resulting from any ideas, methods, instructions or products referred to in the content. |
© 2024 by the authors. Licensee MDPI, Basel, Switzerland. This article is an open access article distributed under the terms and conditions of the Creative Commons Attribution (CC BY) license (https://creativecommons.org/licenses/by/4.0/).

