Article

Electric Drive Units: A Set-Up for Investigating Function, Efficiency, and Dynamics

by
Lukas Pointner-Gabriel
1,*,†,
Thomas Franzelin
2,†,
Bernd Morhard
1,
Daniel Schweigert
1,
Katharina Voelkel
1 and
Karsten Stahl
1
1
Gear Research Center (FZG), Department of Mechanical Engineering, TUM School of Engineering and Design, Technical University of Munich, 85748 Garching near Munich, Germany
2
Institute for Mechatronic Systems (IMS), Department of Mechanical Engineering, Technical University of Darmstadt, 64287 Darmstadt, Germany
*
Author to whom correspondence should be addressed.
These authors contributed equally to this work.
Vehicles 2024, 6(3), 1415-1441; https://doi.org/10.3390/vehicles6030067
Submission received: 15 July 2024 / Revised: 6 August 2024 / Accepted: 12 August 2024 / Published: 22 August 2024
(This article belongs to the Special Issue Reliability Analysis and Evaluation of Automotive Systems)

Abstract

:
High-speed electric drive units promise improved power density and, theoretically, driving range of battery electric vehicles. An essential step of the development process is extensive testing of the drive unit on a test rig. In particular, at a high rotational speed level, experimental testing can be challenging. This paper describes a test rig for investigating the overall function of a high-speed drive unit and the transmission’s efficiency and dynamics. The high-speed drive unit developed in the Speed4E research project was the reference drive unit. The test rig is based on the concept of electrical power circulation. Thus, the test rig can be used universally for different drive unit designs and operating modes. A reaction torque measurement unit was developed to enable measurements at high rotational speeds. Simultaneously, this unit allows robust measurements at low costs. The expected measurement uncertainties of torque, rotational speed, transmission efficiency, and power losses were calculated using the Monte Carlo method. The results demonstrate that the developed torque measurement unit combines precise torque measurement with a robust design and low costs, making it competitive with state-of-the-art solutions for torque measurement at high speeds.

1. Introduction

Electric drive units (EDUs) comprise an electric motor, power electronics, and transmission. Operating the motor at high rotational speeds enables a reduction in its volume and mass and, thus, costs [1,2], promising improved power density and, theoretically, driving range of battery electric vehicles (BEVs). Today, the maximum speed for series applications is up to approx. 20,000 rpm [3,4,5,6]. However, at a certain speed, costs may increase due to the expensive technology necessary [2]. Also, with increasing speed, the transmission needs to be designed with a higher total gear ratio, which typically causes the transmission to have an increased volume, mass, and cost [1]. Nevertheless, an essential step of the development process is evaluating the drive unit’s overall function, efficiency, and dynamics. A recently published study [7] identified and compared three basic methods for testing EDUs: testing within the vehicle using chassis roll or chassis hub dynamometers or outside the vehicle on a dedicated test rig. Testing the EDU on a test rig is considered the most complex but robust and complete method since it requires more specialized knowledge and effort but enables highly accurate and flexible testing of the separate components [7]. In contrast, in-vehicle testing is considered straightforward but less flexible. Testing can also be performed on-road, which is proposed to efficiently benchmark commercial vehicles [8]. However, extensive investigations on the test rig are required to gain fundamental insights into the function and behavior of the EDU. The test rig concept is usually chosen based on the aim of the investigations and the drive unit’s design. The electrical power circulation concept (see Figure 1 (left)) has been used in various studies [9,10,11] since it enables investigations on the entire drive unit. Additionally, this concept enables the testing of different drive unit designs. A generator absorbs the power on the transmission output. The electrical power is typically fed back to the grid. A brake can also be used instead to reduce the electrical set-up’s complexity [12]. This concept also allows investigations into the shifting process of multi-speed transmissions. The input and output torque need to be measured to determine the transmission efficiency. In contrast, the mechanical power circulation concept (see Figure 1 (right)) has been widely applied for investigations on just the transmission [10,13,14,15,16]. This concept is also known as back-to-back configuration. The transmissions are preloaded through a torque-loading device. The external motor provides the rotational speed and the total torque losses of the system. This results in a smaller motor to run the tests. In the case of two identical transmissions combined in the power loop, the efficiency of the transmission can be easily determined based on the loss torque and load torque without the need for further investigations on the reaction transmission.
Generally, both test rig concepts have proven suitable for powertrain testing. However, the trend towards higher speeds poses new challenges for powertrain testing. In particular, investigations on efficiency require high accuracy, meaning there is a small amount of uncertainty allowed in the measurements.
This study aimed to develop a test rig for investigating the function, efficiency, and dynamics of electric drive units with speeds of up to 50,000 rpm. Using a test rig enables researchers and engineers to gain fundamental knowledge and investigate the drive unit’s components’ behavior at high speeds. The high-speed drive unit developed in the Speed4E research project (see Section 2.1) was the reference drive unit. Determining the measurement uncertainty according to the GUM method (see Section 2.2) was also part of this study.

2. Materials and Methods

2.1. Reference Drive Unit

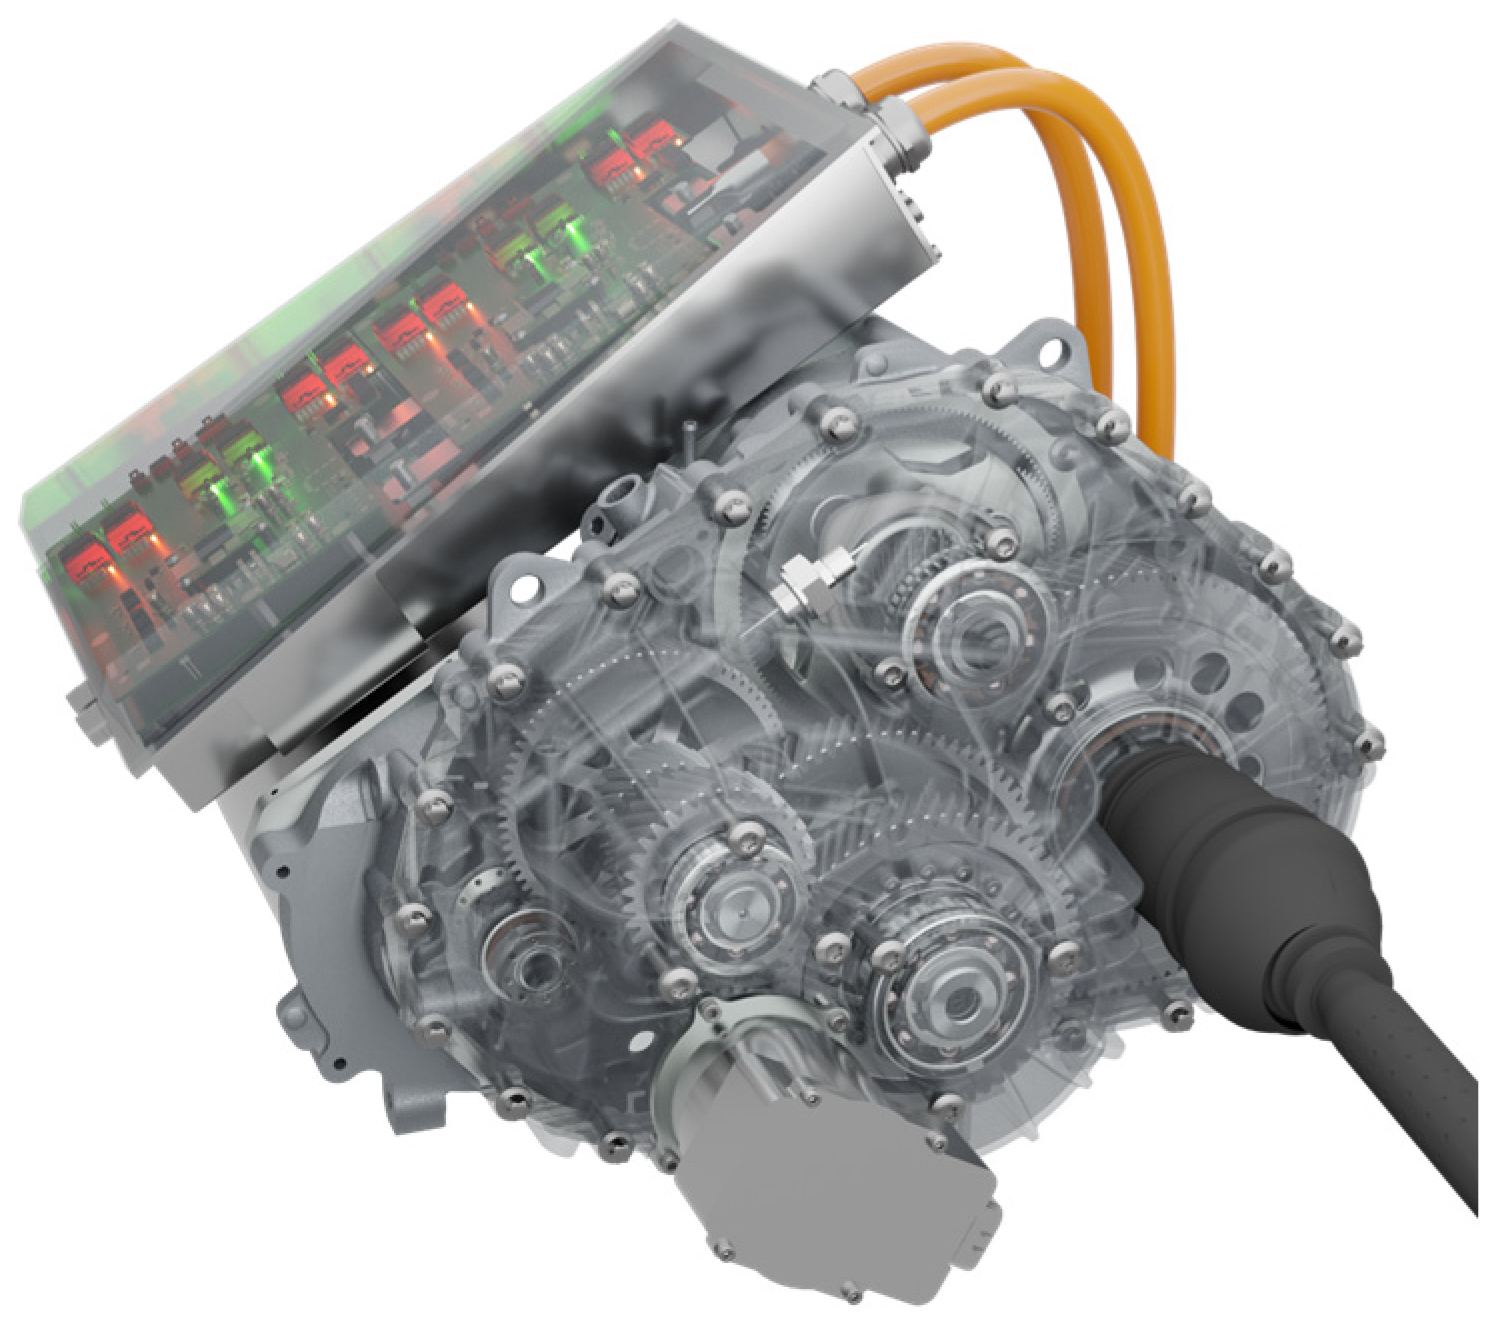
In the Speed4E research project, a high-speed drive unit was developed, designed, and investigated to improve the driving range of BEVs. This includes developing a drive unit with a maximum input speed of 50,000 rpm, integrating the drive unit into a test vehicle, and applying holistic thermal management based on a water-containing fluid [17,18]. Figure 2 shows a rendering of the drive unit. The drive unit is based on an architecture with two electric motors and a three-speed transmission. This architecture provides additional degrees of freedom to increase efficiency through an intelligent operating strategy.
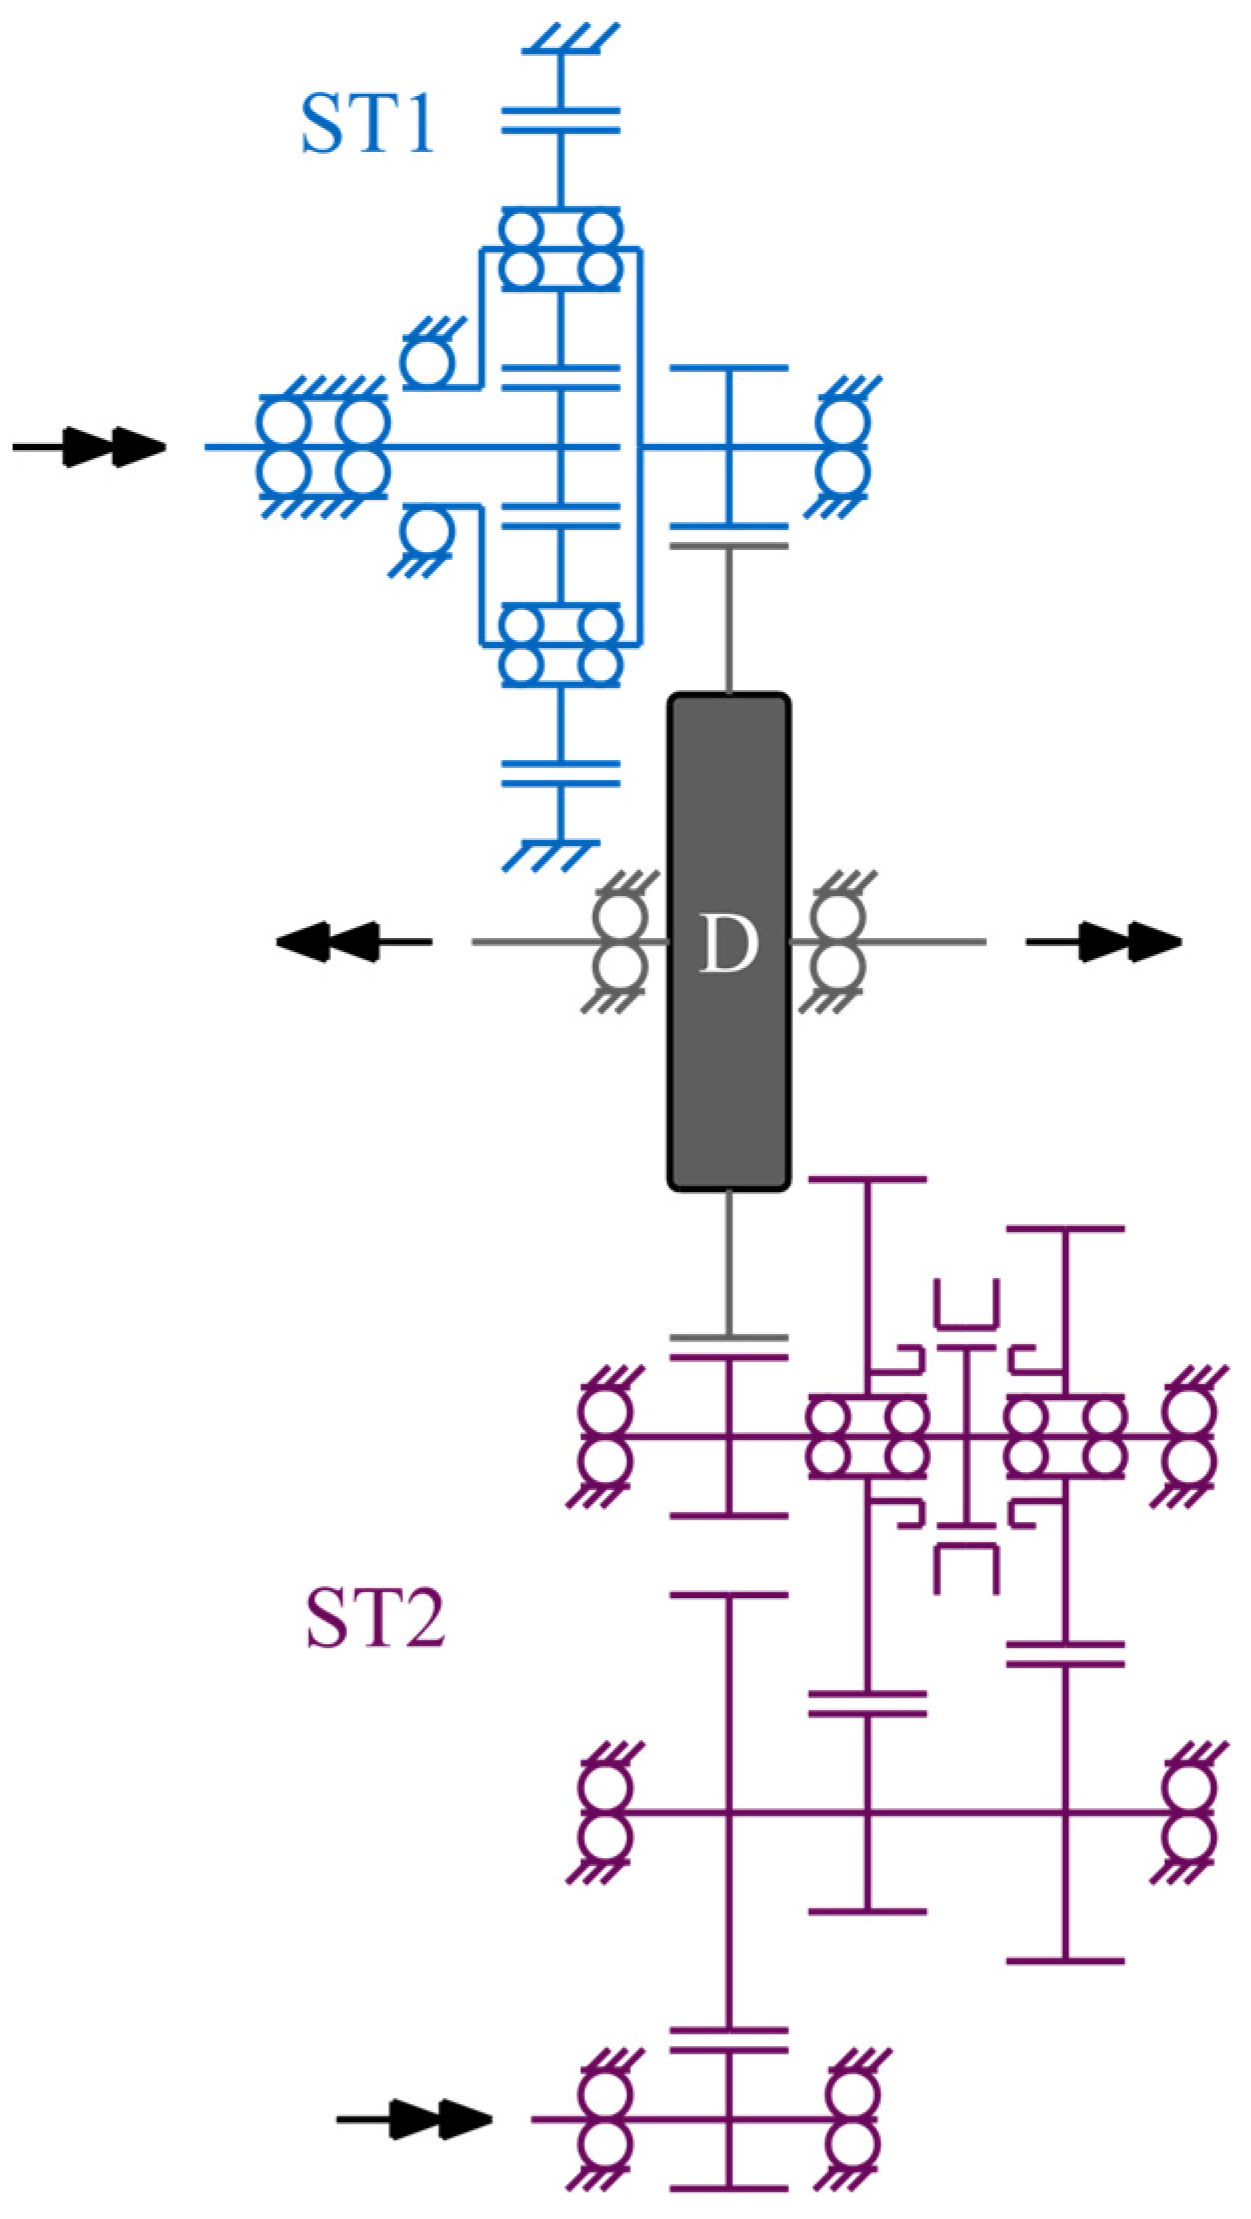
The power electronics are placed on top of the electric motors and comprise purpose-built SiC (silicon carbide) modules capable of switching frequencies of up to 42 kHz. A high-voltage battery supplies the power electronics at a nominal voltage level of 800 V. Two types of electrical motors are used for this research. Therefore, the individual characteristics of each motor can be exploited. Figure 3 shows the schematic structure of the high-speed transmission consisting of two sub-transmissions (ST) and a planetary differential (D). Sub-transmission 1 (ST1) is driven by an induction motor (IM or EM1). In contrast, sub-transmission 2 (ST2) is driven by a permanent magnet synchronous motor (PMSM or EM2). Both sub-transmissions mesh with the external gearing of the differential. ST1 has a fixed gear ratio and consists of a planetary gear stage and a helical gear stage (iST1 = 27.5). The high-ratio planetary gear stage leads to a compact design of ST1. ST2 provides two speeds and consists of three helical gear stages. The first speed (iST2,1 = 36.2) provides a high overall gear ratio to ensure high torque at low speeds. The second speed (iST2,2 = 20.4) is designed as an overdrive, enabling the drive unit’s operation in a more efficient range of the PMSM at high vehicle speeds. The shifting of the dog clutch is performed by a linear actuator. The electric motors take on the synchronization and traction bridging.

2.2. Measurement Uncertainty

In order to determine the uncertainty of the measurements, the methods described in the Guide to the Expression of Uncertainty in Measurements (GUM) are used. These methods include the standard GUM method described in ISO/IEC GUIDE 98-3:2008 [19] and the so-called Monte Carlo method (MCM) described in ISO/IEC GUIDE 98-3/SUPPL1:2008 [20]. Both methods are based on model equations, representing the measurement chain and containing all quantities contributing to the measurement uncertainty. This work established model equations of all necessary measurement chains (input, output, and drag torque). The standard GUM method relies on the propagation of uncertainties via Pythagorean Addition and the assumption of the validity of the Central Limit Theorem. It is, therefore, widely used for linear systems. However, for non-linear systems, systems with few or non-independent input quantities, or dominating uncertainty components, it can yield invalid results. In this case, the MCM is used frequently, either to confirm the results of the standard method or as a standalone approach. The MCM is based on a high number M of random draws from within the probability density function (PDF) of the input quantities. These draws are inserted in the model equation, which results in a PDF of the output variable. Based on the output variable, the expanded measurement uncertainty U of the output variable can be determined with a desired confidence interval p .
Preliminary results for the output torque measurement with the standard GUM method have shown dominating uncertainty components. Even though only minor differences were found compared to the MCM, the MCM was chosen to determine the uncertainty. The MCM leads to higher computational effort due to the high number of required calculations; however, there is no risk of invalid results [21]. Furthermore, there is no need for a partial derivation of the model equation required for the standard method, which can reduce computational effort, especially for complex model equations.
Many contributing factors must be considered to estimate the measurement uncertainty accurately. Unfortunately, not all parameters influencing the measurement can be precisely described, quantified, or even identified. Therefore, gathering as much information as possible about the measurement system and the surrounding environment is necessary. This work uses literature research, previous investigations, and information from equipment manufacturers (e.g., datasheets or calibration certificates) to quantify the known uncertainty factors. For the unknown quantities, assumptions are necessary. These are as follows:
  • Systematic errors: As the test rig is situated in a controlled environment and measurements are conducted only in stationary operating modes (except for driving cycle measurements), remaining systematic errors not already compensated by the design are also assumed to be stationary. Therefore, the influence of systematic errors on the test results can be minimized by performing an offset correction before the experiments. Systematic errors are, therefore, neglected. As the deviation caused by hysteresis is given in the datasheets/calibration protocols of the transducers, it is included in the uncertainty estimation.
  • Rotational inertia: Due to the developed measurement principle of the input torque (see Section 3.4), the angular acceleration of the rotors of the electric motors can influence the torque measurement. However, as most experiments are conducted during stationary conditions and constant input speeds, the rotors are not accelerated or decelerated. Therefore, the rotational inertia of the rotors and other rotating masses is neglected.
  • Correlation: The quantities influencing the measurement uncertainty are assumed to not be correlated.
The measurement uncertainty is determined for all measurement chains based on the information given in the datasheets and/or calibration certificates of the used components (“Type B evaluation of standard uncertainty” [19]), unless otherwise stated. The measurement uncertainties for the transmission efficiency and power loss are also calculated. These two quantities are not measured directly but are calculated based on the measured torque and speed values. For all quantities, the measurement uncertainty is calculated for a confidence level of 95.45%. All calculations were done with MATLAB (Mathworks Inc., Natick, MA, USA).
For a better understanding, the measurement uncertainties are initially calculated only for ST1 in Section 4.3 before presenting the results for the complete transmission using both sub-transmissions in Section 4.5. Furthermore, the measurement uncertainties for averaging over multiple measurements and for driving cycles are discussed in Section 4.6.

3. Test Rig Design

3.1. Requirements

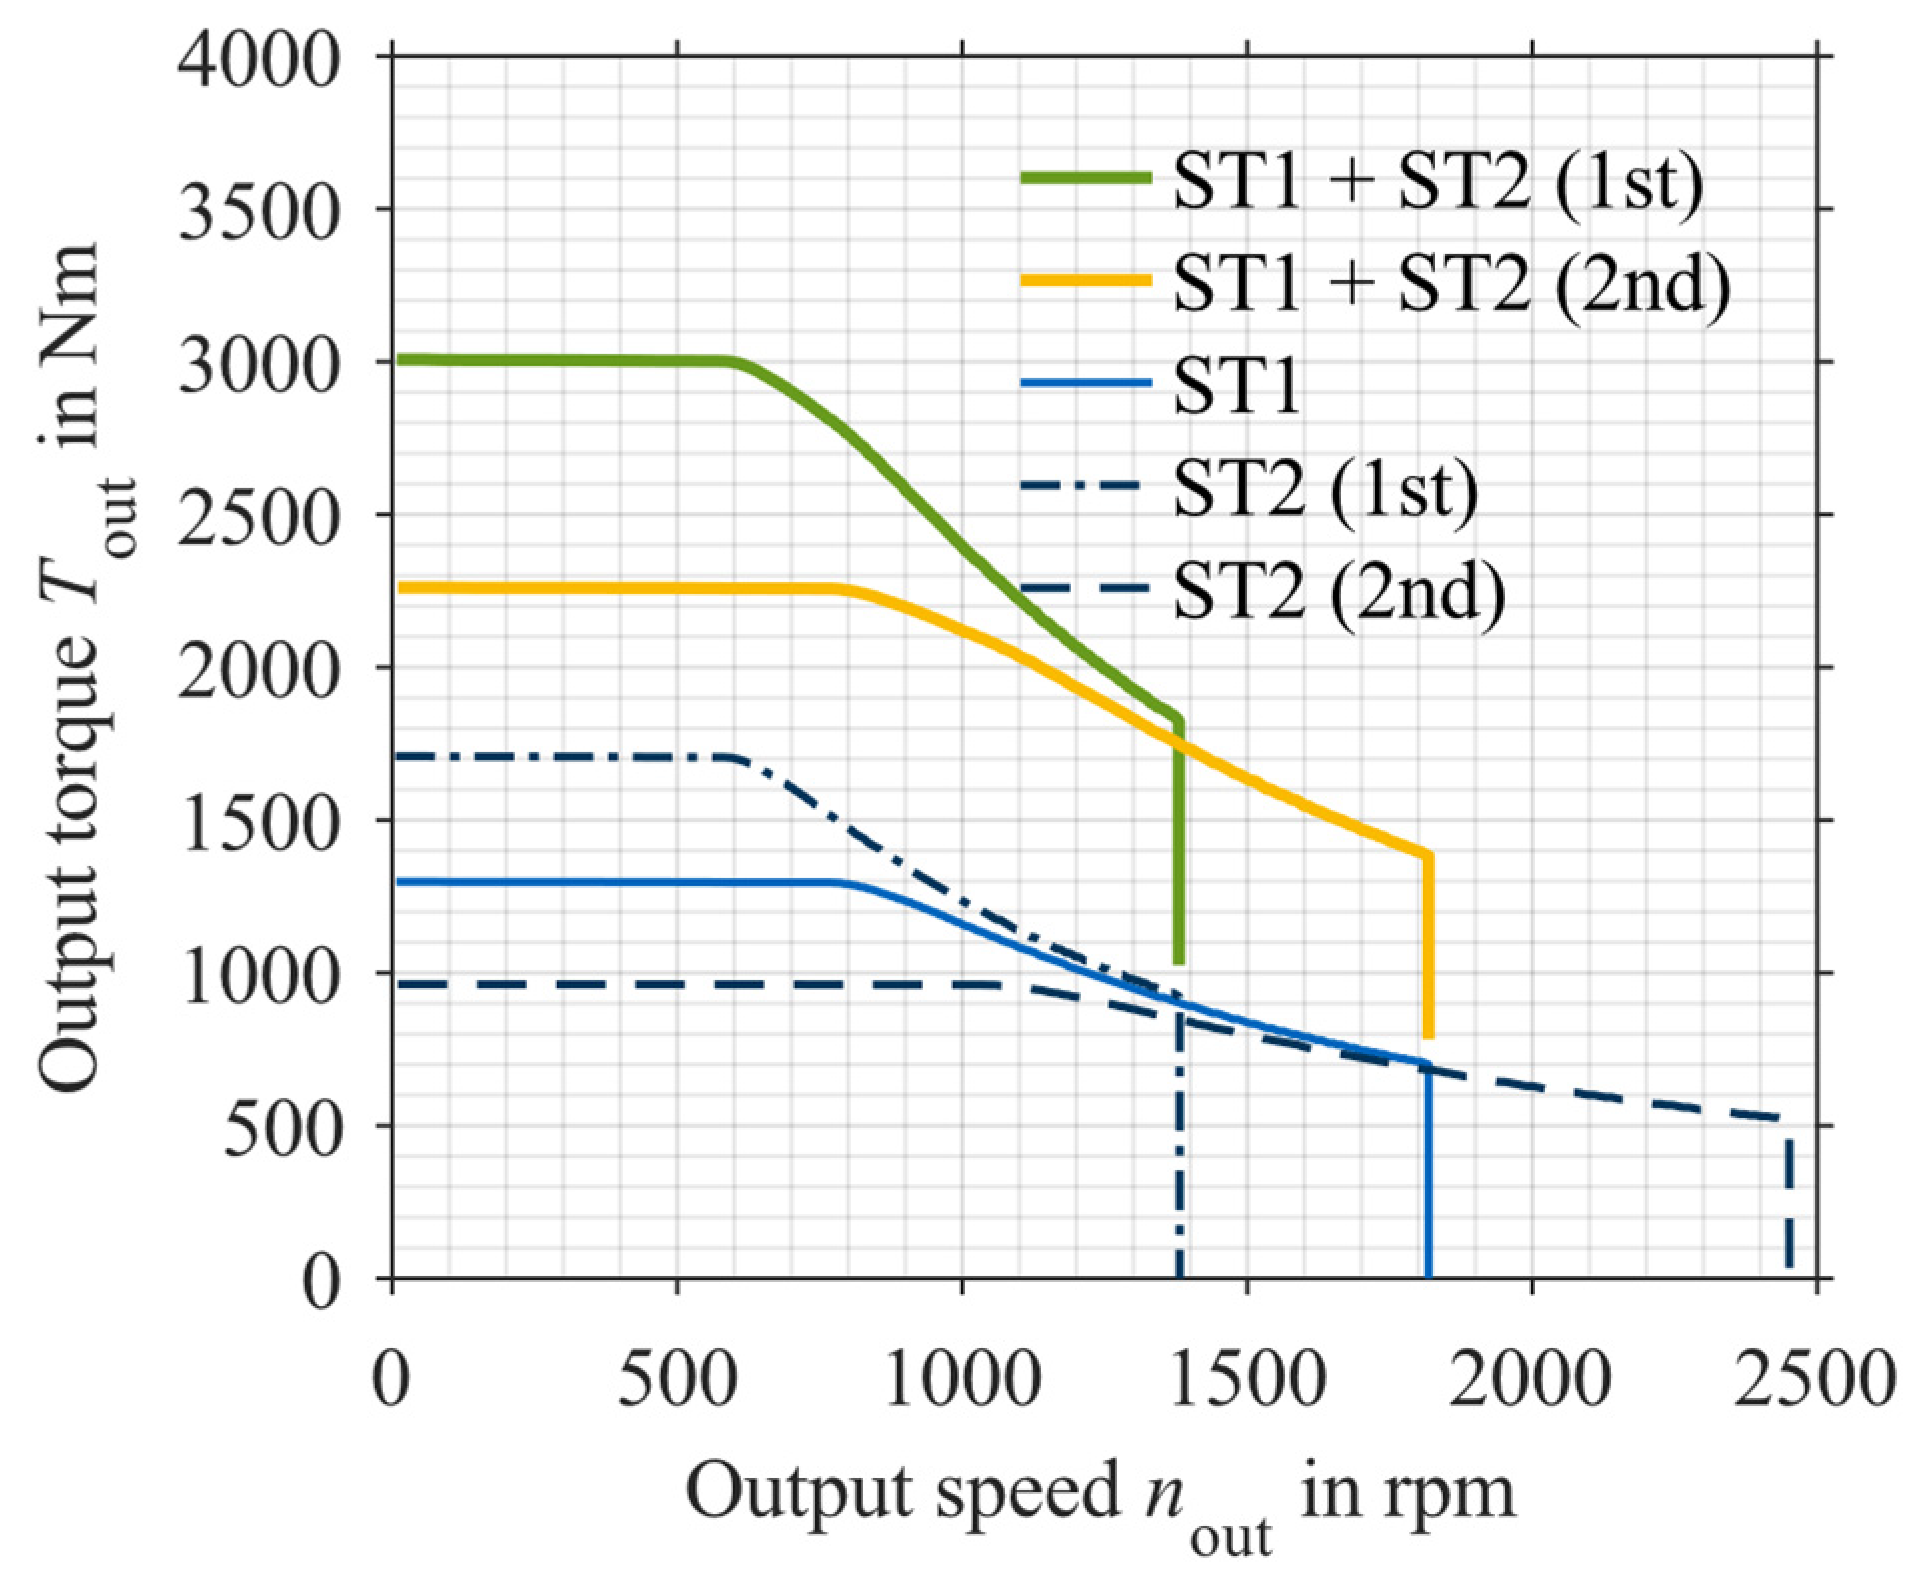
This study aimed to develop a test rig to investigate the overall function of a drive unit and the efficiency and dynamics of high-speed transmission. Hence, the electrical power circulation test ring concept was chosen. For testing on the test rig, the configuration of the drive unit was slightly different compared to the vehicle configuration described in Section 2.1. The investigations focused on evaluating the efficiency and NVH (noise, vibration, harshness) behavior of the transmission and the separate sub-transmissions. Thus, both sub-transmissions were driven by a PMSM (nmax = 50,000 rpm, Tmax = 43 Nm) on the test rig to allow the maximum input speed. Figure 4 shows the output torque maps for different transmission set-ups. The maximum output torque of approx. 3000 Nm is reached when both sub-transmissions are driven with maximum torque and in the first speed of ST2. The maximum output speed of approx. 2450 rpm is reached in the second speed of ST2.

3.2. Test Rig Layout

Figure 5 shows the mechanical layout of the test rig in standard configuration. In the center of the test rig lies the drive unit, consisting of the electric motors (EM1 and EM2) and the high-speed transmission (ST1, ST2, D, and shifting actuator S). In traction mode, the power at the transmission output is absorbed by two identical load machines (LM1 and LM2, operating in generator mode). The load machines are directly connected to the transmission output to avoid parasitic losses resulting from, e.g., support bearings. The load machines can absorb a maximum output torque of approx. 3200 Nm without further speed or torque adjustments. This results in a compact test rig design. The maximum speed of the load machines is 2500 rpm. Hence, according to Figure 4, all operating points of the drive unit can be tested with the chosen load machines. Using two load machines enables setting different transmission output speeds to simulate cornering. The electrical power generated is fed back to the grid via a regenerative power supply unit. On the test rig, the power electronics of the drive unit are supplied by an 800 V DC voltage source instead of a high-voltage battery to enable uninterrupted testing. In coast mode, the drive unit is driven by one of the load machines. In this case, the drive unit’s electric motors are loaded via braking resistors.
The cooling of the drive unit’s electric components and the lubrication of the transmission are handled by two separate units. All rotating parts are covered to guarantee safe operation.
The investigations require measurement of the input and output torque, among other things. The measurement points (MP) for the torque and speed measurements are marked in Figure 5. Particularly, efficiency investigations require high accuracy, meaning there should be small measurement uncertainty for torque measurements. One option to reduce the measurement uncertainty is to adjust the sensor’s measuring range for measurements in the partial-load range. The output torques and speeds (MP3 and MP4 in Figure 5) are measured via torque flanges (accuracy class 0.05) with an integrated magnetic rotational speed measuring system. Both load machines have different torque transducers to adapt the measurement range. At MP3, a torque transducer with a nominal torque of 1000 Nm is installed. In contrast, a torque transducer with a nominal torque of 2000 Nm is applied at MP4. Consequently, the differential has to be locked for loads higher than 2000 Nm. As the output torque is measured with two different torque transducers in the standard configuration, the total torque must be split between the load machines LM1 and LM2 to prevent overloading or damaging the torque transducers. This is achieved by a control loop. The reaction torques at the inputs (MP1 and MP2 in Figure 5) are measured via force transducers (accuracy class 0.02) with a nominal force of 200 N (see Section 3.4). For the efficiency investigations, the drive unit is equipped with various temperature sensors (see Section 5.1). The investigations of NVH behavior use accelerometer sensors placed at specific housing positions (see Section 5.1).

3.3. Test Rig Configurations and Operating Modes

The configuration of the test rig can be adjusted for investigations in the partial-load range. Depending on the output torque to be investigated, one of the load machines can be disconnected. In the low-load range, LM1 is connected to the output of the transmission (see Figure 6), resulting in a load range of up to 1000 Nm. In the mid-load range, LM2 is connected to the output of the transmission (see Figure 7), resulting in a load range of 1000 Nm to 2000 Nm. For investigations of the drag losses of the drive unit, LM2 is connected to the output of the transmission (see Figure 8) and operates as a motor in this case. At MP5, a torque transducer (accuracy class 0.001) with a nominal torque of 50 Nm is installed. The torque transducer is interchangeable to depict nominal torque levels over multiple magnitudes of the drag torque. The electric motors can be unmounted to investigate only the drag losses of the transmission. Table 1 lists the configurations and corresponding load ranges.
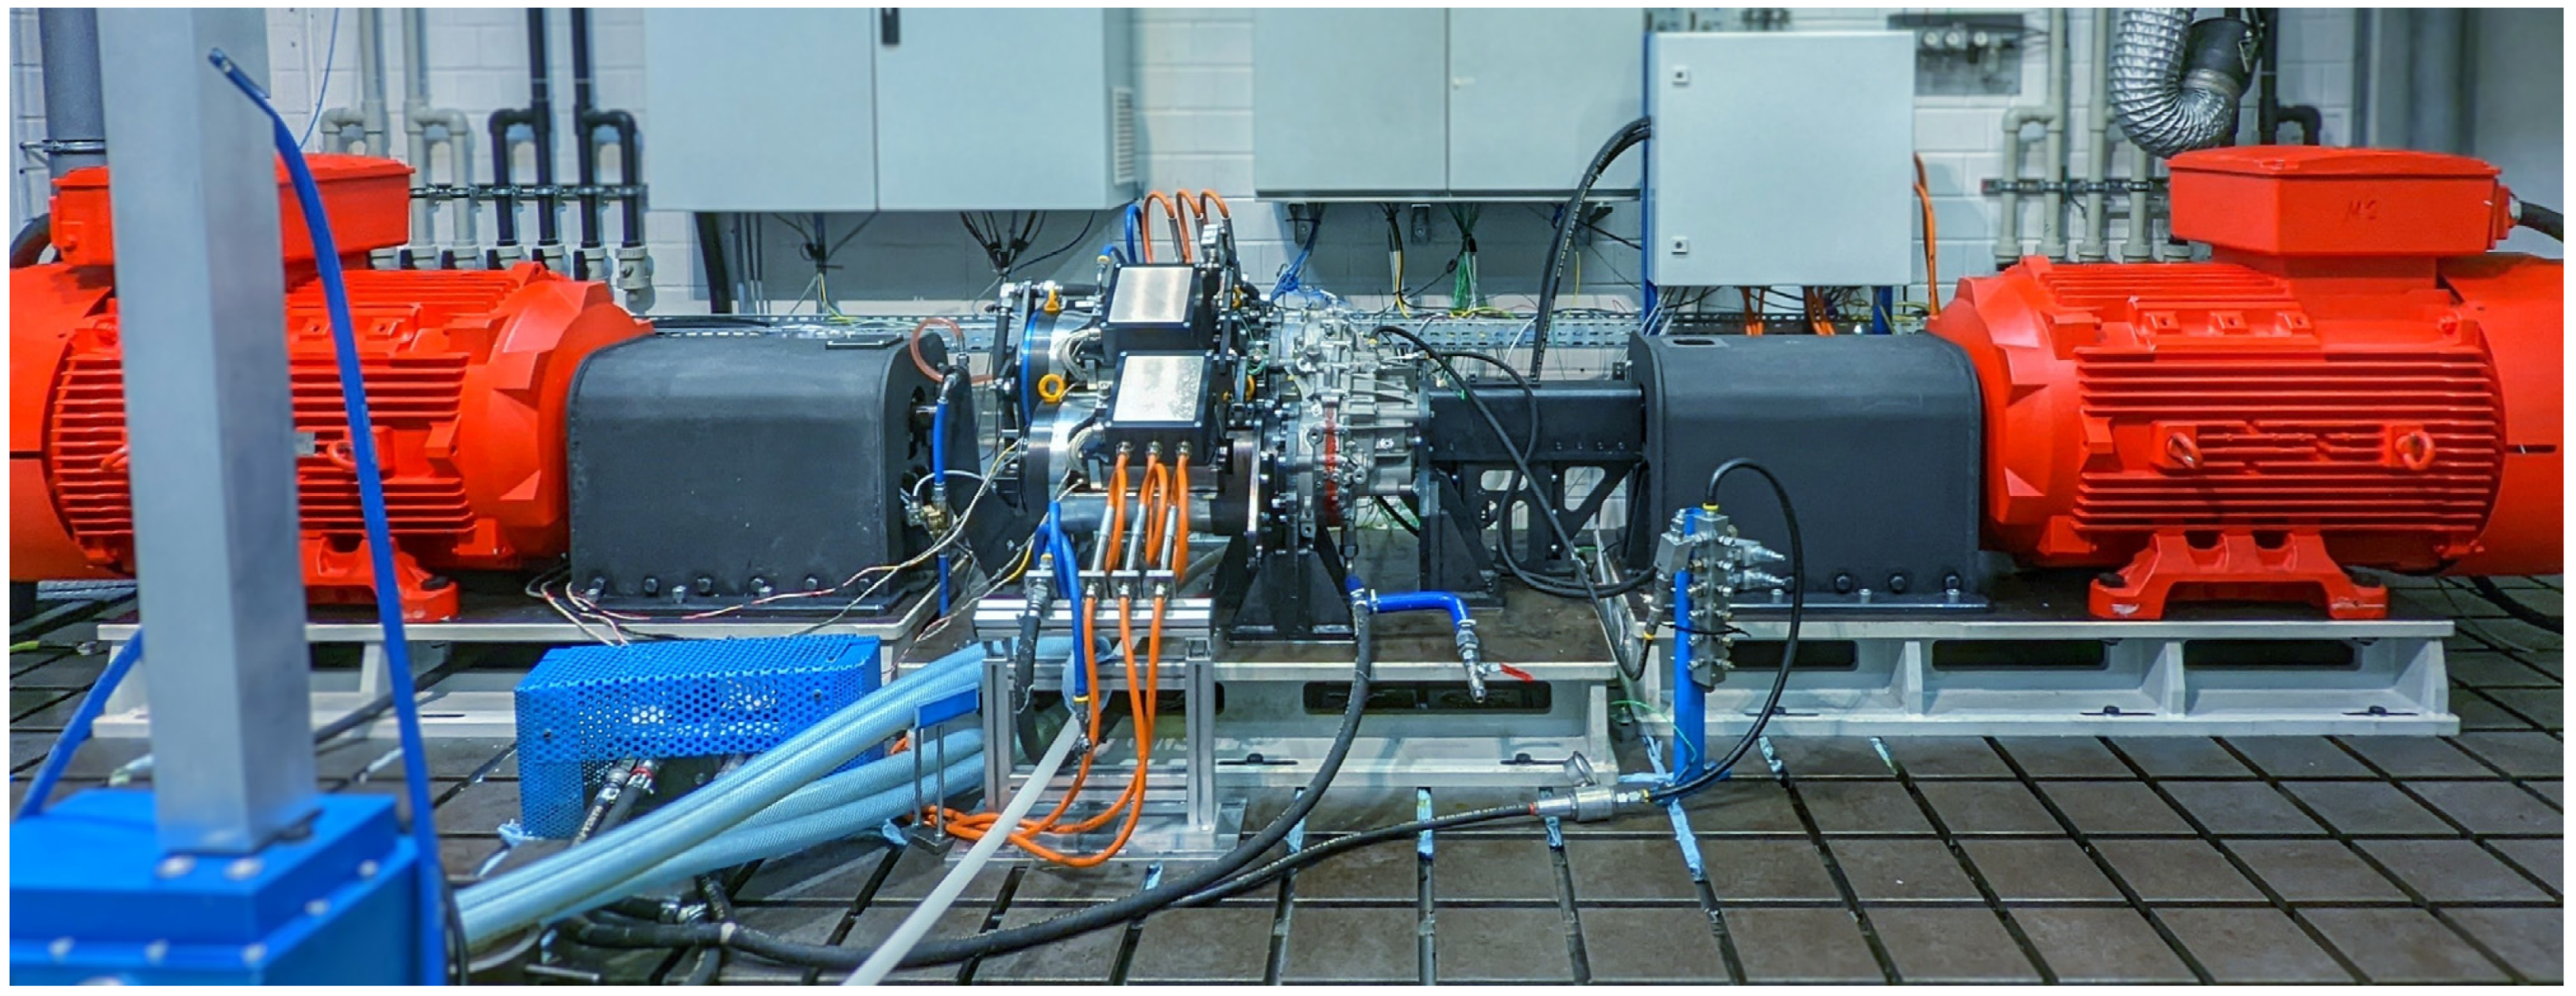
With this test rig, tests in different modes can be run. The input torques and output speed can be manually set in manual mode. In automatic mode, a set of pre-programmed load points is run automatically. Also, different cycles like WLTC can be performed. Figure 9 shows the front view of the test rig in the mid-load configuration.

3.4. Input Torque Measurement

Due to the high input speeds of up to 50,000 rpm, the measurement of the input torque is a significant challenge. Furthermore, extensive testing requires a robust torque measurement system. At the given speeds, the in-line measurement of the input torque via a torque sensor applied between the motor shaft and the input shaft of the corresponding sub-transmission is generally possible. However, it is associated with high costs due to the high-speed spinning sensor. For investigations in the partial-load range, one has to exchange the expensive sensor to adapt the measurement range. A significant advantage, however, is the simple mechanics required to install the sensor. Compared to other measurement concepts, more axial space is required. In contrast, the measurement of the reaction torque using a force transducer is unaffected by the rotational speed. Here, the torque generated by the rotatably mounted electric motor is supported by a lever of a known length. The measured force and the lever arm length can be used to calculate the input torque. In contrast to the in-line torque measurement, this concept requires more complex mechanics. Interference effects caused by hydraulic connections, cables, and bearings must be considered to prevent systematic measurement errors. Furthermore, this measurement principle is not suitable for dynamic torque measurements due to the inertia of the stator and the rotor. The force transducer can be easily replaced for investigations in partial-load ranges to adapt the measurement range. As no dynamic torque measurements are required, and the installation space is limited, the reaction torque measurement is most suitable and is therefore used. Consequently, the power electronics are not mounted to the electric motors in the test rig set-up to guarantee the rotational degree of freedom of the electric motors.
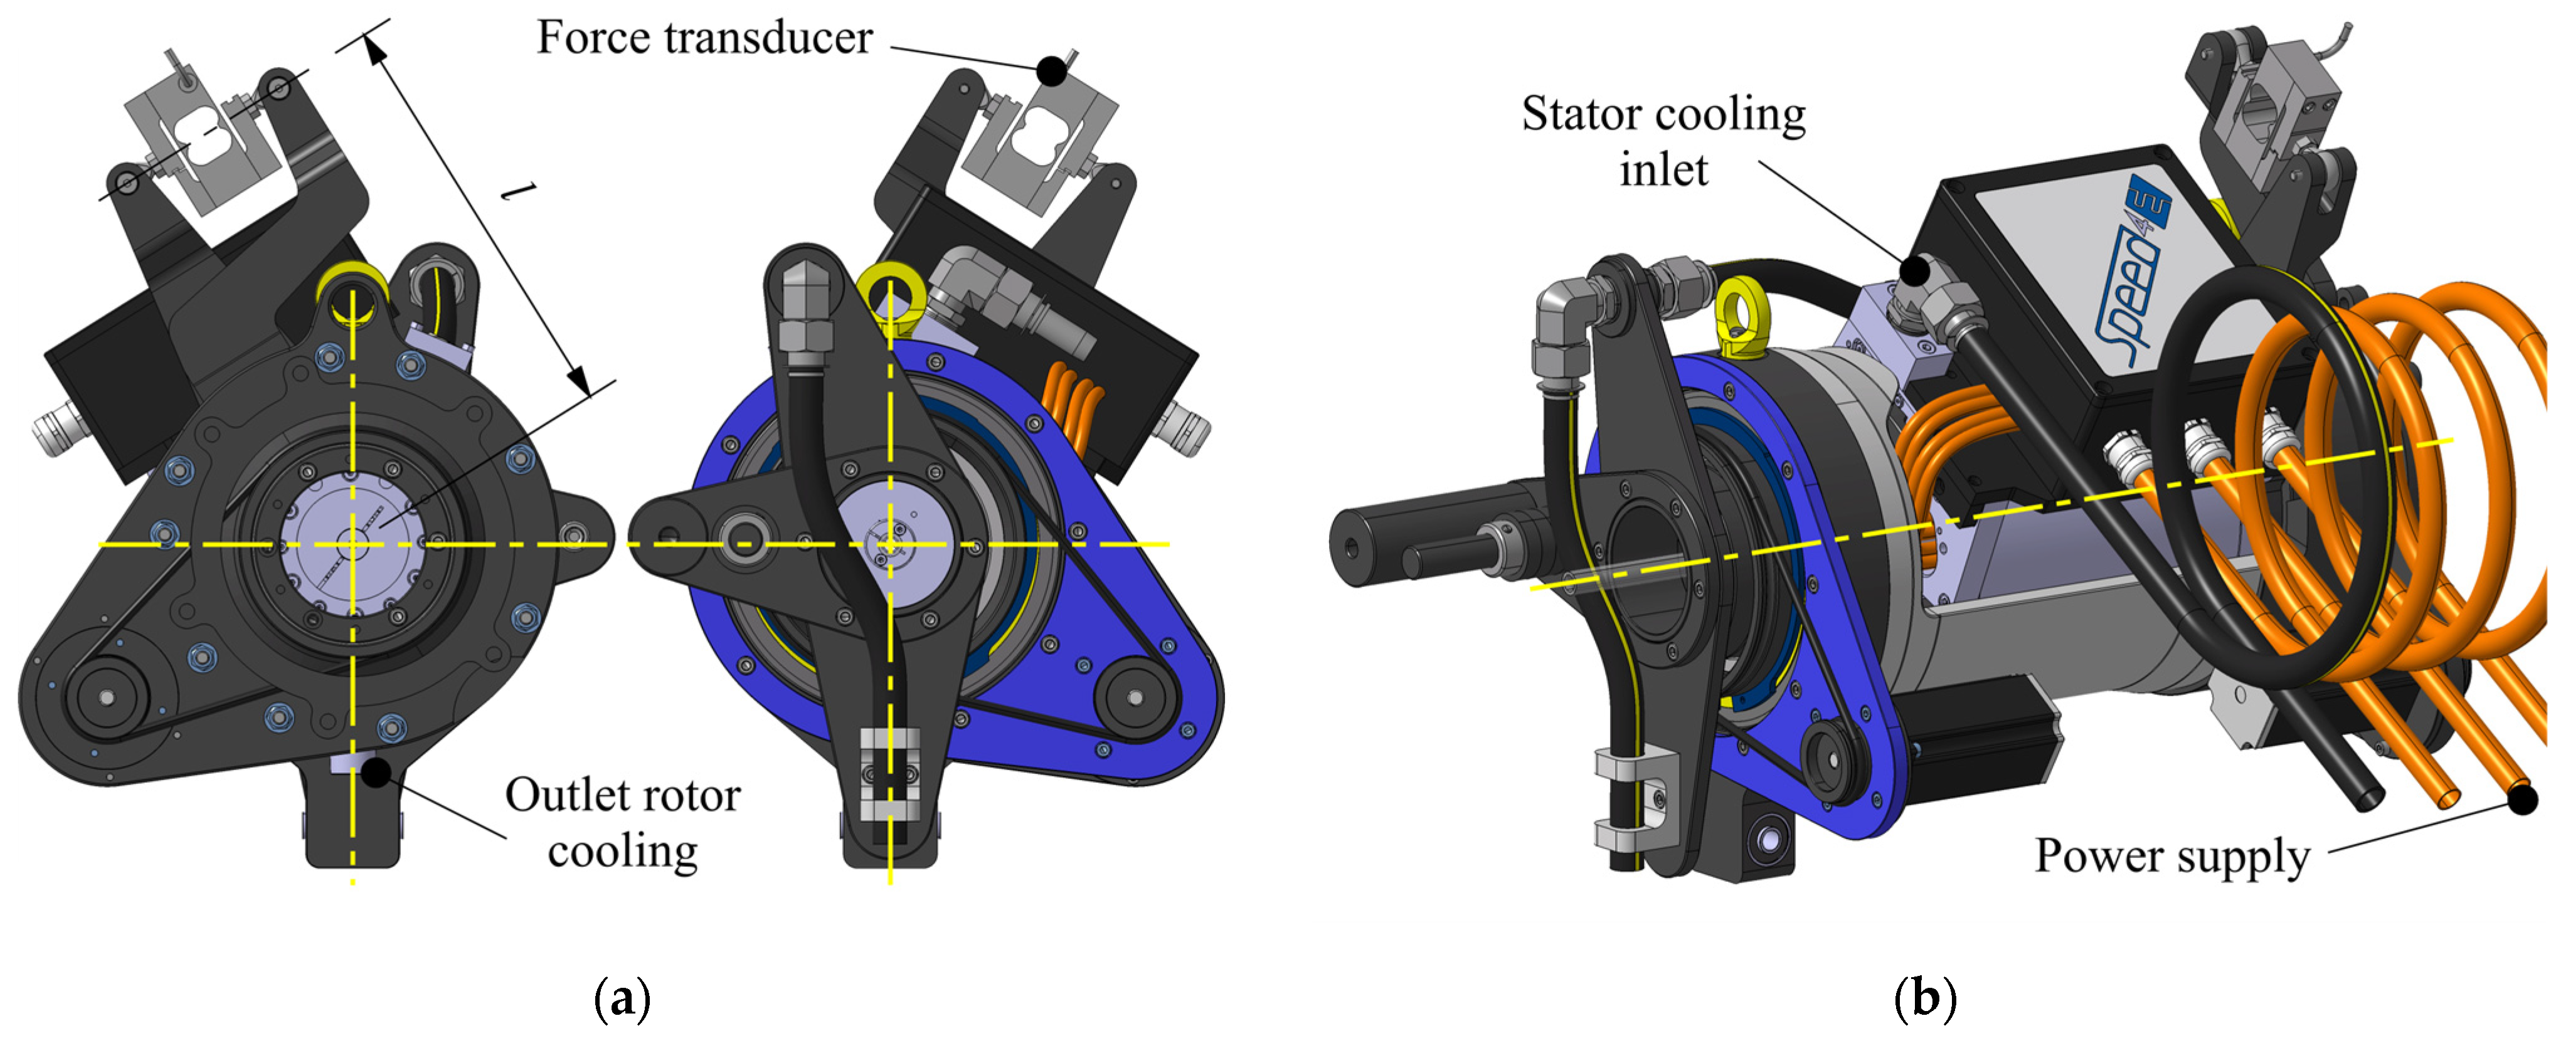
Figure 10 and Figure 11 show different assembly states of the input torque measurement unit. Figure 10a displays the electric motor with its cables for the power supply and the connections for cooling the rotor and the stator. Figure 10b shows Assembly State 1. The stator of the electric motor is supported by bearings in the stationary housing (see Positions A and B). However, the rotational movement of the stator is almost zero. In this specific case, the bearing losses are high according to Stribeck’s curve and can oscillate vigorously. Therefore, two deep-groove ball bearings are combined, resulting in a triple ring bearing (see details in Figure 10c,d). In this way, the bearing losses can theoretically be eliminated by driving the middle rings in opposite directions. The lever is integrated in the support part of Position A. Figure 10e shows Assembly State 2. A stepper motor drives each middle ring via a round belt. The speed of the middle rings is set to 20 rpm. Eccentric masses can be mounted to balance the static torques and calibrate the force transducer (see Figure 10f). The input torque measurement unit allows robust measurements at low costs. For investigations in the partial-load range, the force transducer can easily be replaced by a geometrically identical transducer with an adapted measuring range. Bellows coupling is used to connect the electric motor to the input shaft.
Figure 10f and Figure 11a show different views of Assembly State 3. The high-precision force transducer is mounted with a normal distance l to the axis of rotation. The outlets of the rotor and stator cooling are radially positioned. Therefore, the outlets theoretically do not influence the measurement. A highly flexible hose is used for the rotor cooling axial inlet. Figure 11b shows the final assembly state. The cables and the inlet hose for the stator cooling are helically arranged (see Figure 9) to reduce the mechanical resistance associated with the tilting of the motor.

4. Estimation of Measurement Uncertainty

4.1. Measurement Set-Up

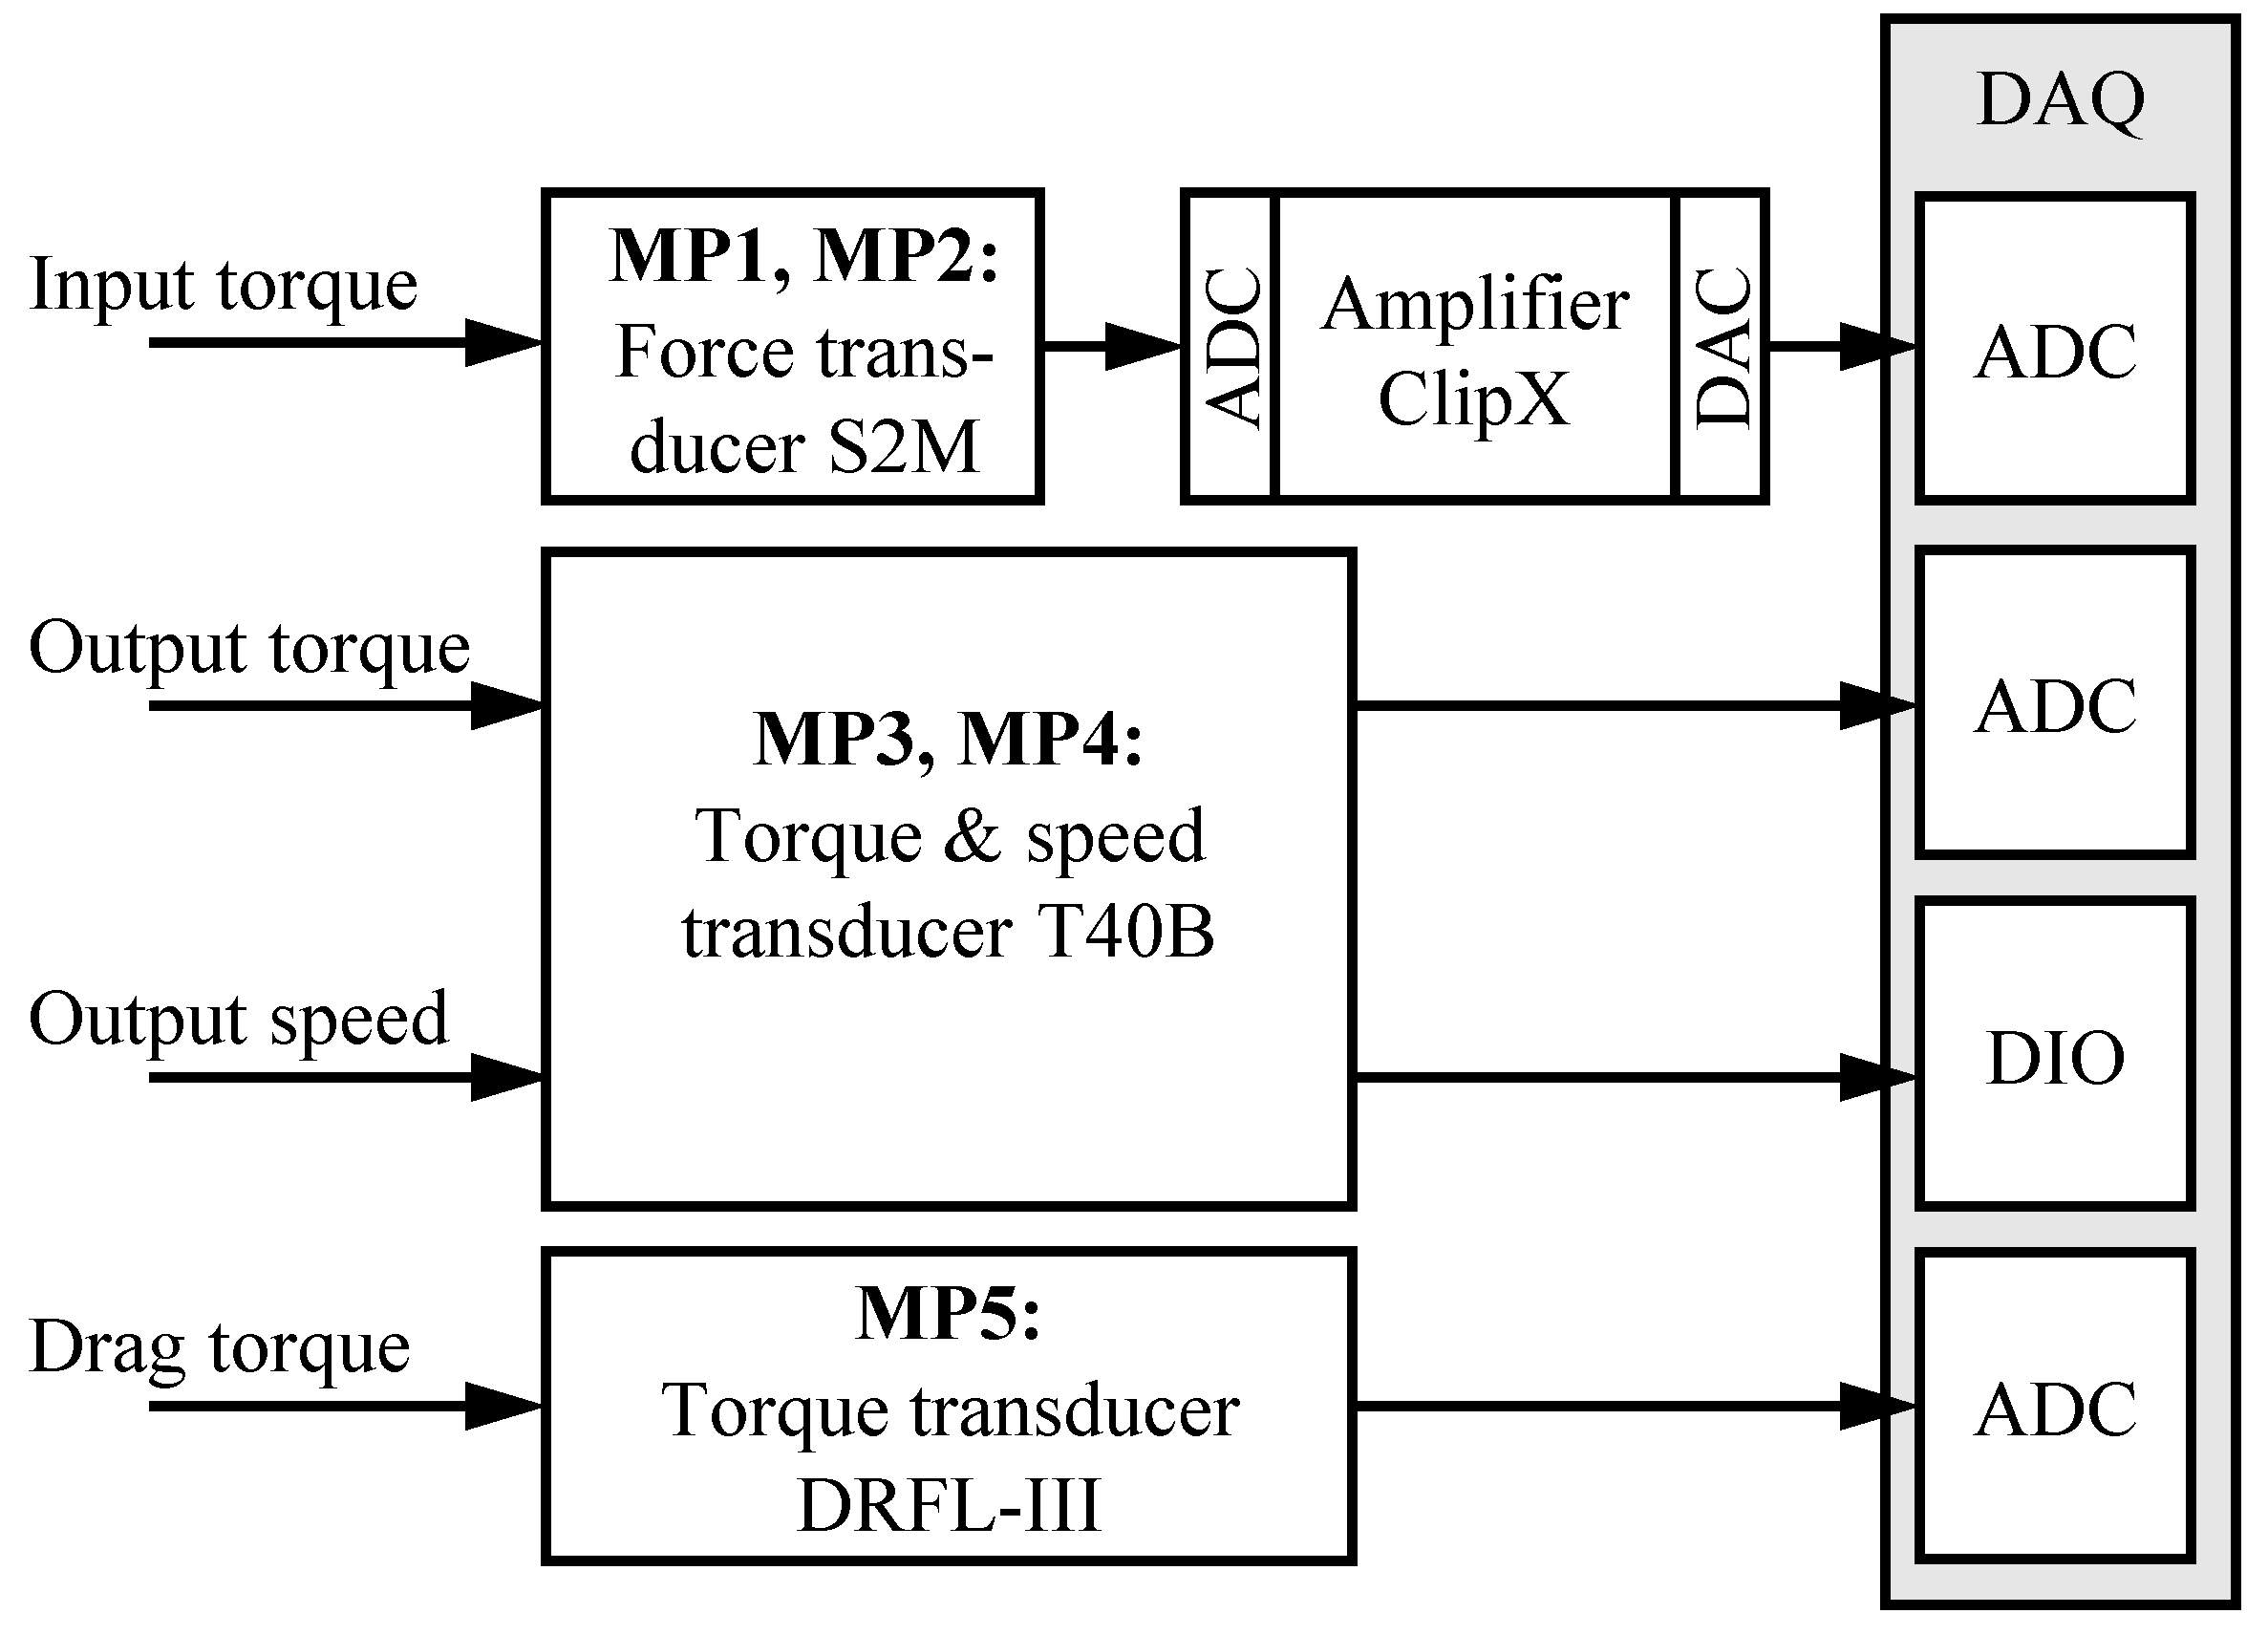
A simplified overview of the measurement set-up is shown in Figure 12. The input torques of both electric motors are measured at MP1 and MP2 using S2M force transducers by HBM (Darmstadt, Germany) [22] with a nominal force of 200 N. The transducer can be used for tension and compression forces, which allows torque measurement during regenerative braking. The measurement is free from parasitic forces, as the transducer is mounted with ball joints, which only allow forces in the intended measurement direction. The transducer is based on an S-shaped body, whose deformation is measured by strain gauges arranged in a Wheatstone Bridge Circuit. A designated signal amplifier from the same manufacturer supplies the bridge circuit with the required voltage and processes the force signal. The amplifier scales the force signal of the transducer to a range of ±10 V.
Depending on the operation mode, T40B transducers by HBM [23] for the output torque measurement (MP3 and MP4) and/or a DRFL-III transducer by ETH (Gschwendt, Germany) [24] for drag torque measurement (MP5) are mounted directly between the load machines and the output shafts of the transmission. Elastic couplings and shafts with l/d >> 1 are used between the transmission output, the transducers, and the load machines to minimize the effect of parasitic forces or torques influencing the measured torque. The deformation of the transducer bodies is measured by strain gauges. The electrical power needed for the measurement circuit and the measurement signals are transmitted wirelessly between the rotating shaft and the stationary housing. While the drag torque transducer is equipped with bearings to support the rotating shaft, the output torque transducers require no bearings for the rotor, which is supported by the output shafts. The bearings in the drag torque transducer introduce friction into the measurement chain, which has to be considered when estimating the measurement uncertainty. Both types of transducers provide a scaled voltage signal between ±10 V, proportional to the measured torque.
Rotational speed can be measured via the output torque transducer, which provides a square-wave signal with 1024 impulses per revolution. The period duration between two impulses is measured to deduce the rotational speed. The rotational speed is only measured at the output shafts, as the input speeds can be calculated via the known gear ratios of each sub-transmission and the currently selected gear. If experiments are conducted with an unlocked differential, for the uncertainty calculations, it is assumed that both output shafts rotate at the same speed.
All analog signals are digitized and recorded by a data acquisition system (DAQ) via an analog-to-digital converter (ADC). The frequency of the rotational speed signal is measured with a digital input/output module (DIO). Three transducers with different nominal torques T n o m of 10, 50, and 100 Nm are available to precisely measure drag torque over multiple magnitudes. Similarly, for the output torque, two variants of the transducer are used, with nominal torques T n o m   of 1000 and 2000 Nm, respectively (see Section 3.3).

4.2. Calculation of Measurement Uncertainty

To calculate the measurement uncertainty using the MCM described in ISO/IEC GUIDE 98-3/SUPPL1:2008 [20], it is first necessary to identify the quantities contributing to the uncertainty. Additionally, it is essential to know the probability density function (PDF) of the uncertainty component. The datasheets and calibration certificates of the used components are used for this. With the help of the sensors’ calibration certificates, the measurement device’s accuracy can be traced back to the national standard for a specific measurement unit (e.g., 1 m or 1 kg), which, in turn, is correlated to the SI Unit system. The deviations stated in the datasheets or certificates are given in relation to the input or output quantities of the device (e.g., force or voltage). Therefore, deviation amplitudes that are absolute (i.e., not dependent on the currently measured value) have to be converted to torque values. These values are multiplied by the respective gain factor of the component within the measurement chain (e.g., the length of the lever arm l or the gain factor of the amplifier) to achieve this. Relative deviation amplitudes based on the currently measured value can be used as they are. Table 2 shows the uncertainty types caused by the used components, including their absolute or relative magnitude and type of PDF.
The torque transducers were calibrated according to VDI/VDE 2646 [25]. The force transducers were calibrated according to the German National Metrology Institute’s DKD-R 3-3 guideline [26]. The respective manufacturers performed all the calibrations. Most component datasheets and/or calibration certificates state temperatures (or temperature ranges) at which the given deviations were determined and are valid. Any operation at other temperatures (or outside the temperature ranges) leads to additional deviations during the measurements. An operating temperature of 22 °C was chosen for all components, as the test environment is air-conditioned. Even though the temperature lies within the allowed ranges of the measurement equipment, deviation from the temperature during calibration was considered if the resulting uncertainty was given.
As the transducer shaft for the drag torque measurement (MP5) is supported by a bearing on each side, the bearing friction on the transmission side influences the measurement. During a previous experimental investigation of the bearing losses, the used transducer model showed torque deviations between 0 and a maximum of 0.02 Nm within the required speed range. However, the deviations appeared randomly with no correlation to the rotational speed. To cover the range, the expected value μ was set to 0.01 Nm, and the interval half-width of the uniform distribution to 0.01 Nm.
Table 2. The sources of deviations δ in the used components and their magnitude. The relative values are given as % of the measured value. The expected value μ for each uncertainty is zero if not otherwise declared. The magnitude values correspond to the interval half-width “a” for uniform distributions or the standard deviation σ for normal distributions.
Component and Source
of Deviation
Force Transducer
( δ T I )
Output Torque
Transducer ( δ T O )
Drag Torque Transducer
( δ T D r a g )
Amplifier ADC
( δ T A m p )
Amplifier ADC
( δ T A m p )
ADC
( δ T A D C , i )
DIO
( δ n )
Non-linearity 8 10 4   N m
(uniform)
6 10 5 T n o m
(uniform)
1 10 3 T n o m
(uniform)
5 10 3   N m
(uniform)
4.9 10 2   N m
(uniform)
2 10 2 %
(uniform)
/
Temperature 2.8 10 3 %
(uniform)
2.4 10 2 %
(uniform)
10 3 %
uniform)
10 3 %
(uniform)
1.2 10 3   N m
(uniform)
//
Hysteresis 10 3 %
(uniform)
included in linearity 1 10 3 T n o m
(uniform)
////
Noise/// 8 10 3   N m
(uniform)
6 10 2   N m
(uniform)
3.81 10 5 T n o m
(normal)
/
Resolution/// 2.3 10 8   N m
(uniform)
9.6 10 4   N m
(uniform)
//
Repeatability 2 10 2 %
(uniform)
3 10 4 T n o m
(normal)
/////
OtherCreeping:
8 10 3   N m
(uniform)
/Friction: 10 2   N m
(uniform,
μ = 10 2   N m )  1
///Counter dev.:
5 10 5 n + n 2 78125 n
(uniform) 2
1 Determined during previous investigations; 2 calculated according to Ref. [27].
The deviation influencing the rotational speed measurement (counter deviation) at MP3 and MP4 stems from two sources. Firstly, the oscillator base clock of the DAQ used to measure the time between two impulses can deviate by 50 ppm from the nominal value of 80 MHz. Secondly, a phase shift between the base clock and the speed signal can cause a deviation of ±1 impulses of the base clock. The impact of this second deviation depends on the number of impulses per revolution, the rotational speed, and the base clock itself.
In order to quantify the measurement uncertainty of the measured values, the deviations δ of the components of each measurement chain have to be combined. During this step, even small deviations should not be neglected, as they could have a large impact at certain operating points. A model equation for each measurement chain is generated, which serves as a mathematical representation. Equation (1) represents the input torque measurement T 1 / 2 , m   at transmission input 1 or 2. The index m denotes the measured torque value, which is the sum of the actual force value F 1 / 2 , a (the index a denotes actual values) multiplied by the lever arm length l and the contributing deviations δ . The sources of uncertainty (non-linearity, temperature, hysteresis) for each component are added together, i.e., in δ T F , for the deviation sources of the force transducer.
T 1 / 2 , m = F 1 / 2 , a l + δ T I + δ T A m p + δ T A D C , 1 / 2
Similarly, the model equations for the remaining measurement chains (output torques T 3 / 4 , m , output rotational speed n 3 / 4 , m , and drag torque T D r a g , m ) can be created (see Equations (2)–(4)).
T 3 / 4 , m = T 3 / 4 , a + δ T O + δ T A D C , 3 / 4
n 3 / 4 , m = n 3 / 4 , a + δ n
T D r a g , m = T D r a g , a + δ T D r a g + δ T A D C , 5
In contrast to the previous model equations, not all deviations contributing to the drag torque measurement have an expected value μ of zero.
The model equations above all represent physical quantities that can be measured directly or indirectly in the case of the input torque. More abstract quantities like transmission efficiency η and power loss P L o s s cannot be measured directly and have to be calculated with the measured torque and speed values. Equations (5) and (6) show the model equations for these quantities. The indices 1, 2, 3 and 4 correspond to MP1 to MP4.
η m = T 3 , m + T 4 , m / T 1 , m i S T 1 + T 2 , m i S T 2
P L o s s , m = T 1 , m i S T 1 + T 2 , m i S T 2 T 3 , m T 4 , m n 3 / 4 , m 2 π / 60
As these quantities are based on the previously discussed torque and speed measurements (see Equations (1)–(4)), all of the deviations influencing these measurements also contribute to the efficiency and power loss uncertainty.
To calculate the expanded measurement uncertainty U for all measurement chains with the MCM, each model equation has to be evaluated M times. Each evaluation simulates a measurement and is based on random samples for each deviation source by the respective PDF. During each evaluation, the theoretical measured value is calculated. All M values represent the distribution of these simulated measurements. Based on this distribution, the expected value μ and a symmetrical uncertainty interval can then be calculated for a desired confidence level p , which states how probable it is for the actual value to be within the given interval and represents the expanded uncertainty U . For this work, a confidence level of p = 95.45 % was chosen, as it is commonly used for reporting measurement uncertainty. Based on the value of p , a number of M = 220,000 iterations is chosen in accordance with GUM [20]. This procedure is repeated for each operating point.
The expected uncertainty U is calculated for input torque values from −60 to 60 Nm and input speed values from 500 to 50,000 rpm.

4.3. Results of Measurement Uncertainty Analysis for ST1

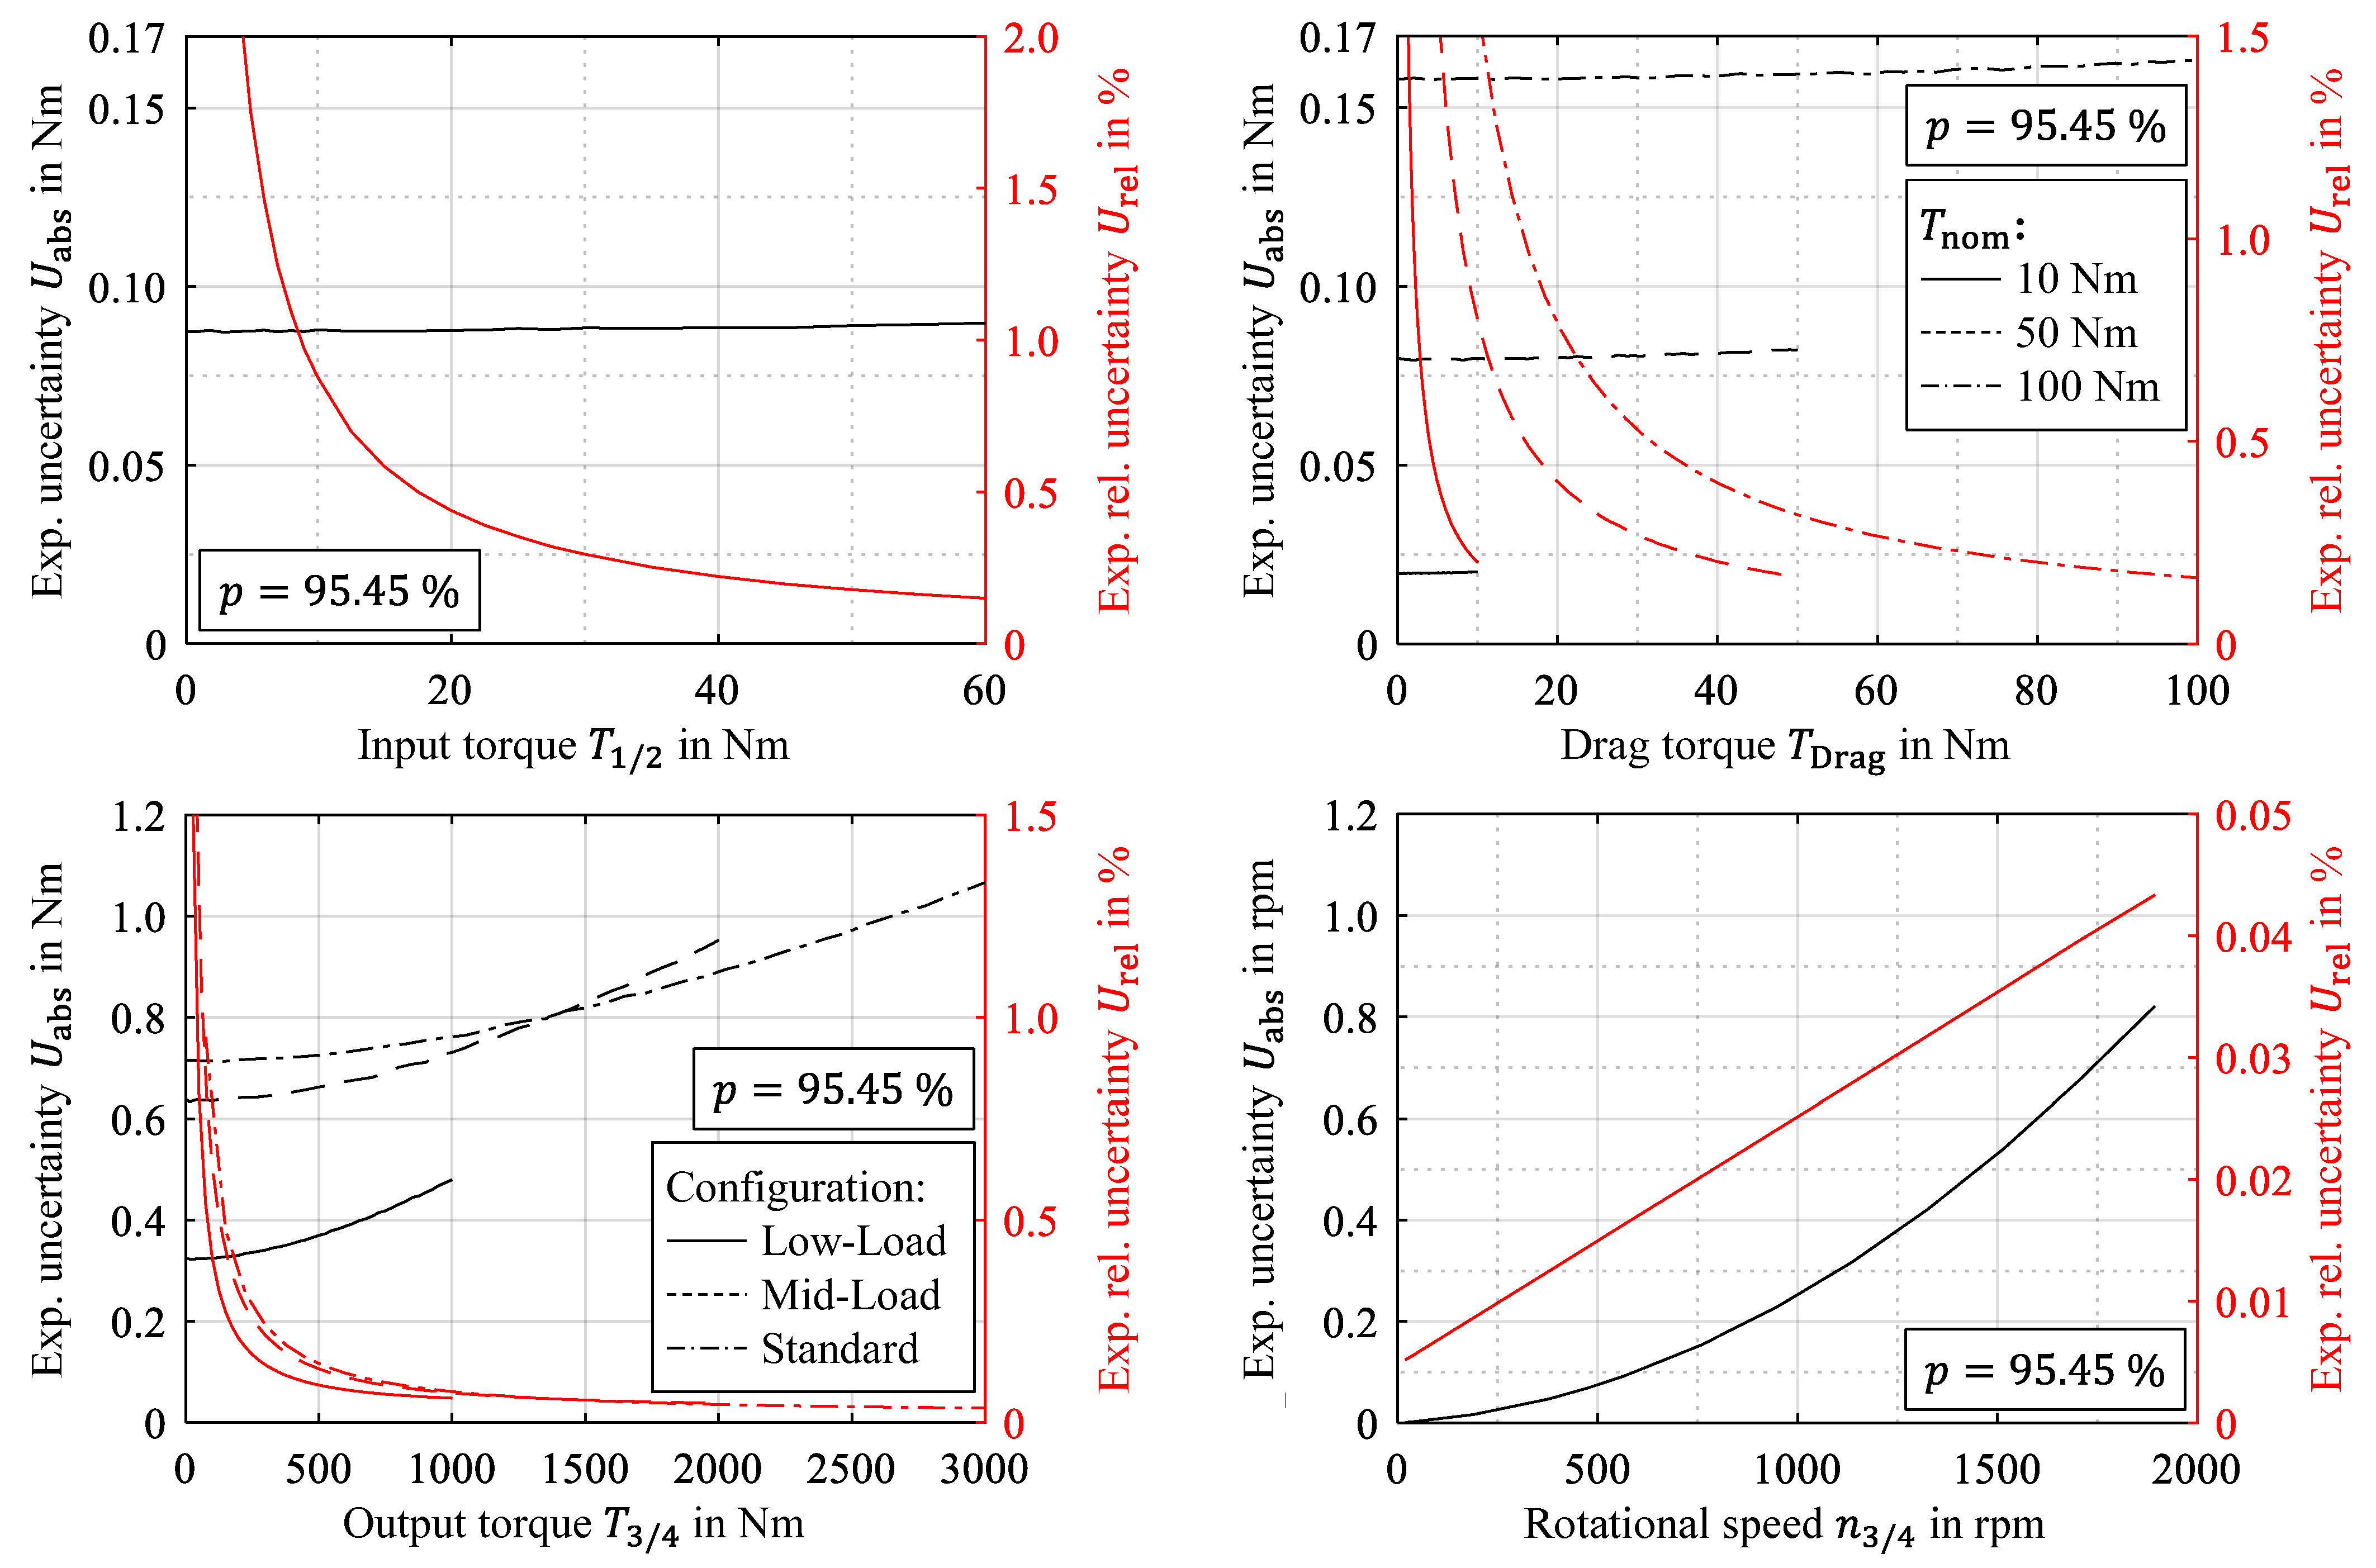
To aid in understanding the results of this analysis, the measurement uncertainty estimation results in this section are given for experiments during which only ST1 is in use. In this case, ST2 is not engaged. Figure 13 shows the absolute and relative measurement uncertainties for the input torque, the output torque, the rotational speed, and the drag torque. Negative measured values are omitted, as the measurement uncertainty is independent of the sign of the measured quantities.
It can be observed that the estimated absolute uncertainty U a b s of the input torque is primarily independent of the applied torque. This can be explained by the dominating effect of two deviation sources which together account for more than 90% of the measurement uncertainty: the deviation because of noise and the deviation because of the non-linearity of the ClipX DAC. Both sources are based on absolute reference values and, therefore, independent of the currently applied torque.
A similar behavior can be found for the drag torque, where the two dominating factors (hysteresis and non-linearity) are also absolute values based on the nominal torque. They account for more than 90% of the uncertainty of the transducers with a nominal torque of 50 and 100 Nm. For the smallest transducer ( T n o m = 10   N m ) , the bearing friction deviation is an additional absolute dominating source of deviation. All three sources account for at least 95% in all possible torque ranges.
For the total output torque, the measurement uncertainties U a b s are shown for the low-load, mid-load, and standard test rig configurations. A consistent split of 1/3 of the total output torque at MP3 and 2/3 at MP4 is assumed.
Comparing the output torque uncertainties for the range from 0 to 1000 Nm, it is visible that the measurement uncertainty is lowest when using only the smallest transducer at MP3. The standard configuration with both transducers at MP3 and MP4 leads to the largest measurement uncertainties in this region, which is why operation of the standard configuration in this region should be avoided. A similar result can be shown by comparing mid-load and standard configurations between 1000 and approx. 1400 Nm. However, above 1400 Nm, measurement at both MPs (standard configuration) results in a smaller uncertainty compared to measurement at only MP4 (mid-load configuration). This can be explained by the torque split, which results in a reduced torque at each transducer. The overall uncertainty is reduced in combination with the significantly lower measurement uncertainty of the 1000 Nm transducer. Even though this effect is significant when comparing the absolute measurement uncertainty, the difference is minimal in comparison with the respective torque values, which is why the relative measurement uncertainty U r e l is only slightly affected by this. The dominating uncertainty factors for the output torque measurement are the transducers’ repeatability and temperature deviations and the ADC’s non-linearity. The repeatability deviation is responsible for almost 90% of the expected uncertainty at torque values close to zero. As it is based on the nominal torque T n o m , its influence decreases with increasing torque values. At the same time, the transducer temperature deviation and the ADC non-linearity gain influence, as they are based on actual torque values. Both sources are responsible for 56.4% of the total expected uncertainty at T n o m .
The expected relative torque measurement uncertainties U r e l are naturally large for small torque values. At operating points very close to 0 Nm at the input or output, determining if the actual torque is positive or negative is often impossible because the uncertainty band is larger than the measured value. However, for most of the operating regions of each transducer, relative errors smaller than 0.5% are expected, reaching 0.14% for the input torque, 0.16% for the drag torque, and 0.05% for the output torque measurements.
The rotational speed measurement only depends on one uncertainty factor δ n N I , D I (see Equation (3)), which contains two terms (see Table 2). As the absolute measurement uncertainty U a b s nearly shows a square law characteristic, the relative measurement uncertainty U r e l increases nearly linearly with the rotational speed, in contrast to the torque measurements. However, the relative uncertainty of the speed signal with a maximum expected uncertainty of 0.43% is significantly smaller than the achievable torque uncertainties.

4.4. Expected Uncertainties for Efficiency and Power Loss Measurements at ST1

Using the model Equations (5) and (6), the results of the measurement uncertainty estimation of the torque and speed measurements can be further used to determine the efficiency and power loss of ST1. As the theoretical maximum output torque (no losses) is approx. 1600 Nm, the mid-load configuration of the load machines is chosen for the calculations (single 2000 Nm torque transducer). Additionally, in this case, ST2 is not used, which leads to a simplification of the model equations:
η a = T 4 , a / T 1 , a i S T 1
P L o s s , a = T 1 , a i S T 1 T 4 , a n 4 , a 2 π / 60
For the calculation of the expected measurement uncertainty, the M draws from the distributions of the input quantities can be reused here. The results are interpreted in the same way.
To determine the output torque for a given input torque, simulated results of the transmission efficiency are applied. The simulation results in a discrepancy between positive and negative torque values, as the losses in normal operation mode are different than during regenerative braking. As transmission efficiency cannot be calculated at an input torque of 0 Nm; values of ±0.5 Nm are used instead. As efficiency simulation is not the main focus of this work and is merely necessary to generate realistic efficiency and power loss values, it is not described in detail. A more in-depth description of a similar approach for the same transmission can be found in Ref. [18].
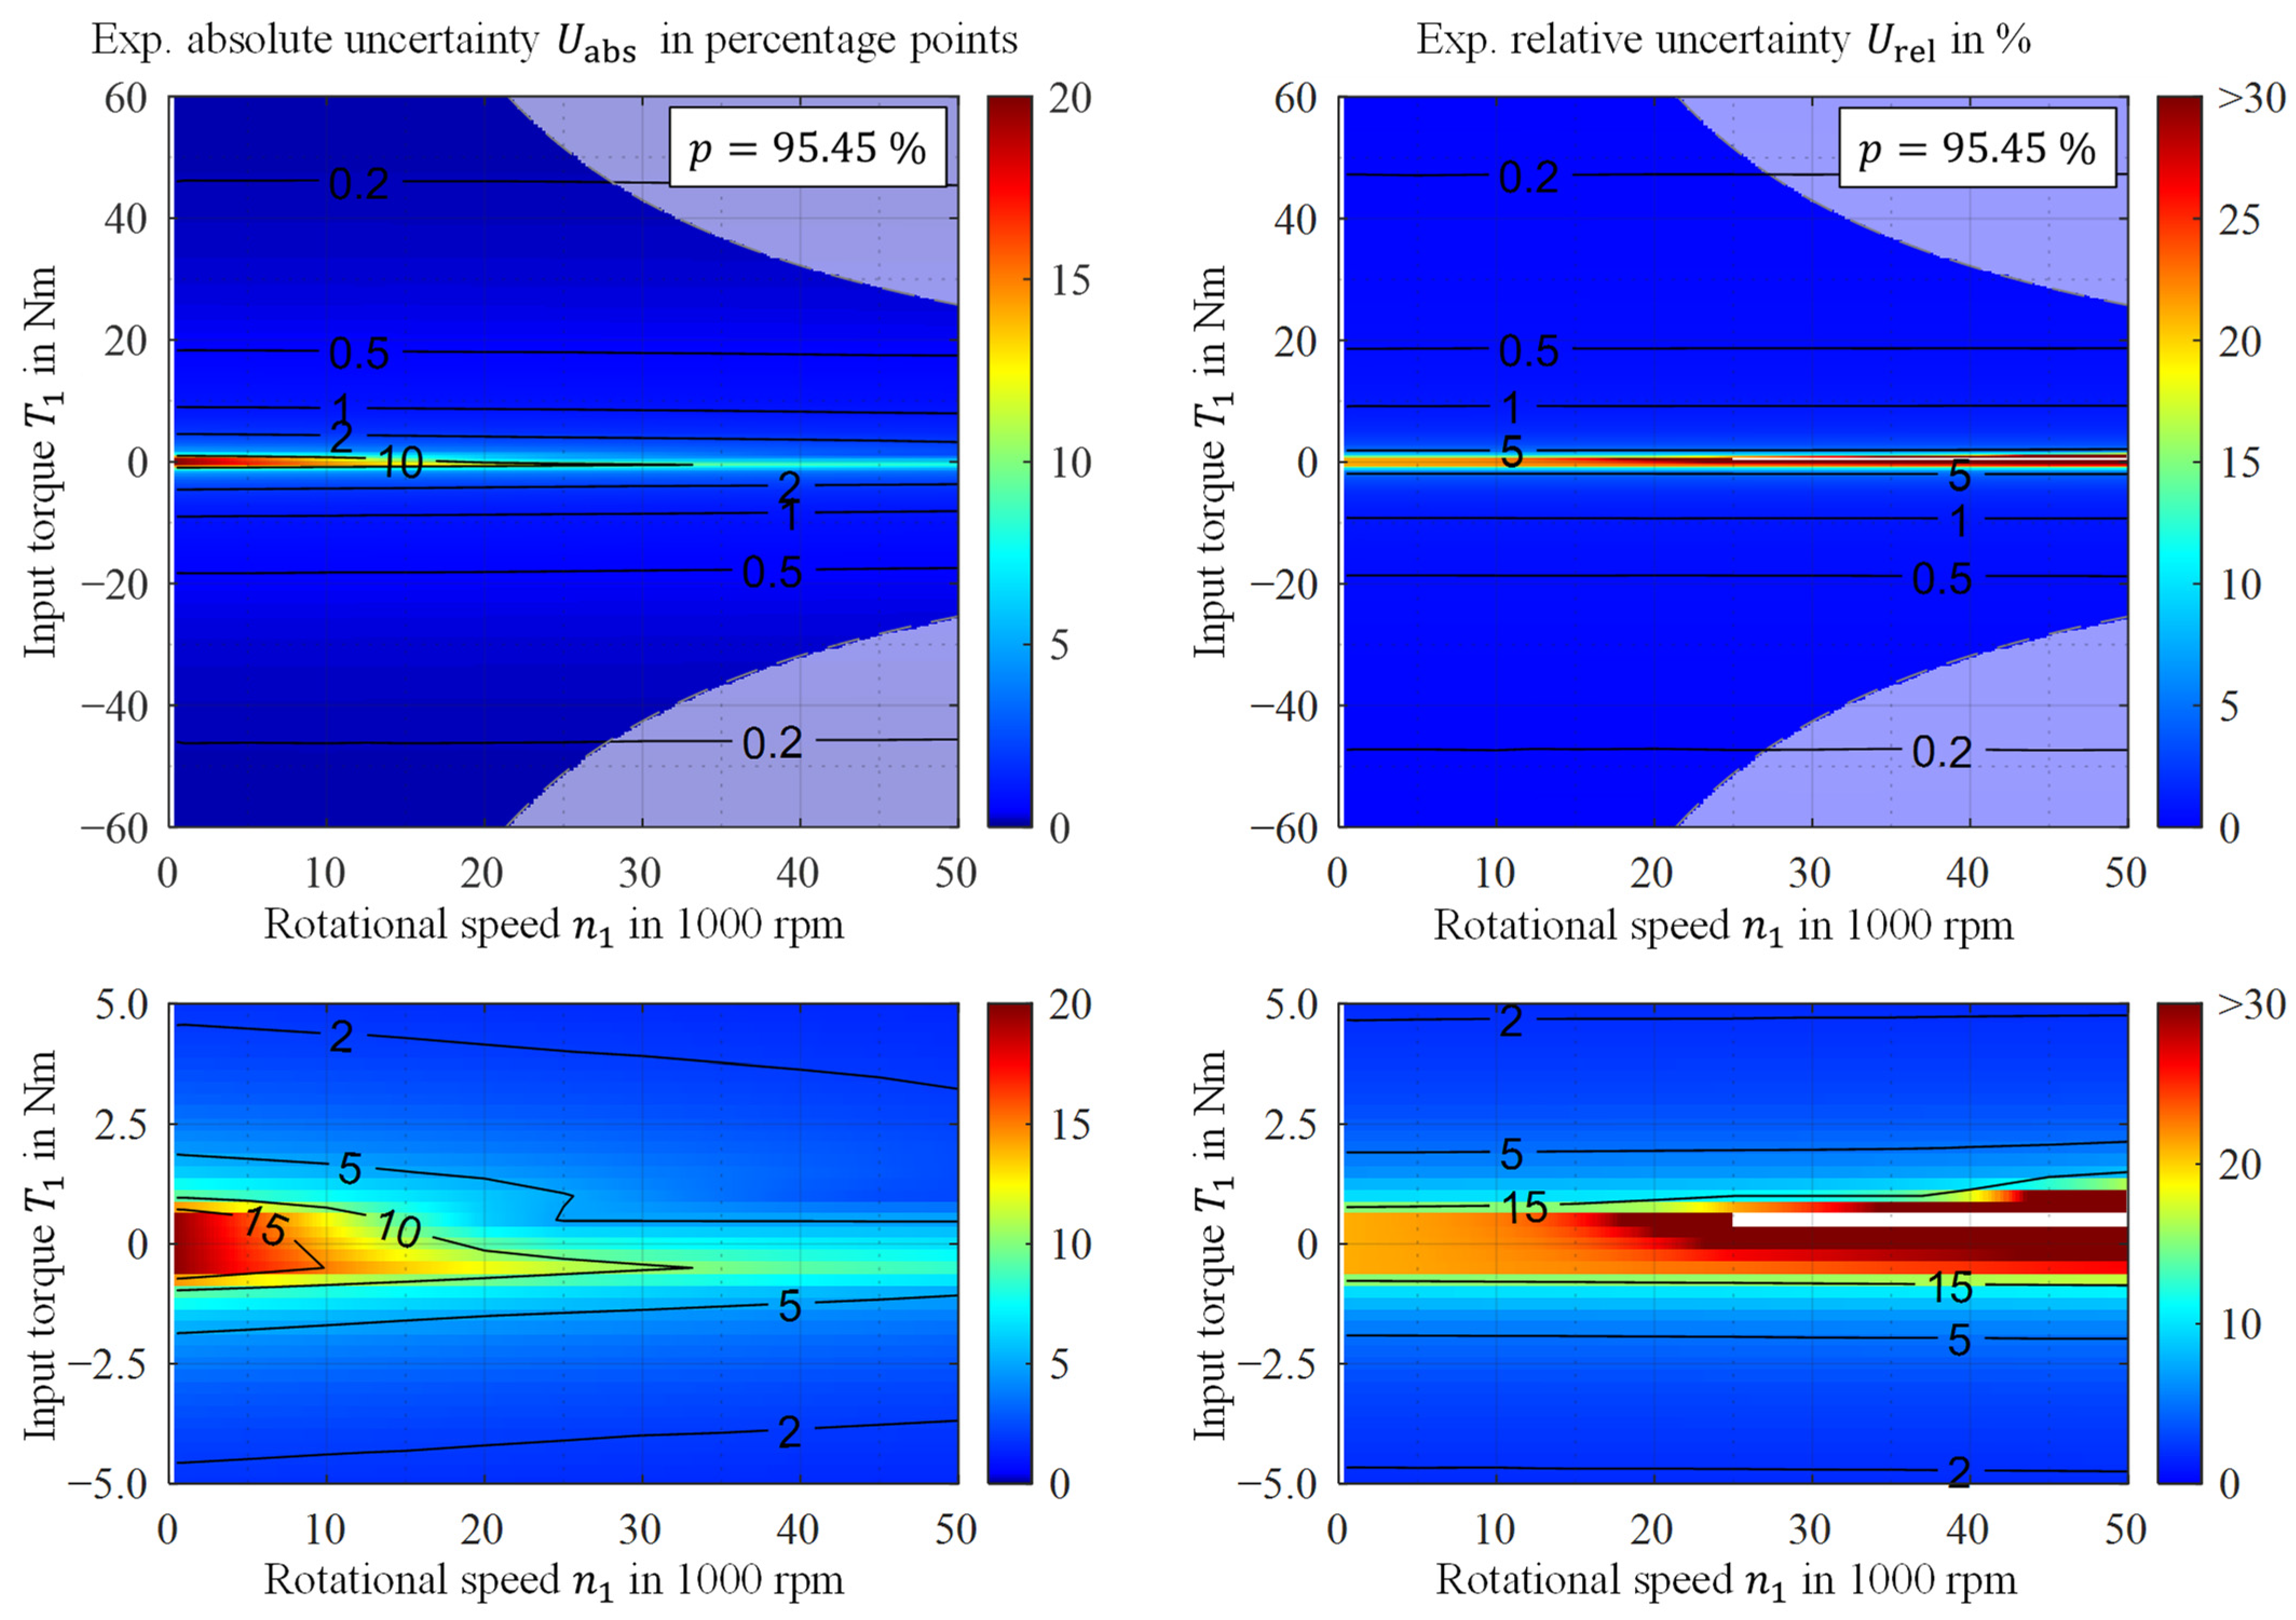
The expected measurement uncertainty of the efficiency measurement is shown in Figure 14. Even though the input speed n 1 at MP1 is not measured directly, it is used to denote the operating point in conjunction with the input torque T 1 .
Figure 14 shows that the absolute efficiency measurement uncertainty U a b s is virtually independent of the input speed. Only at minimal torque values can a dependency on speed be observed. This is not caused by the uncertainty of the rotational speed itself, which is not required to calculate the efficiency according to Equation (7), but rather, by the efficiency computation, which results in different efficiencies at different rotational speeds. At small input torque values, the expected measurement uncertainty reaches values of approx. 19.7% for torque values of 0.5 Nm. The dominating sources of uncertainty are the noise deviation (min. 49%) and the non-linearity deviation (min. 33%) of the amplifier DAC.
While the absolute uncertainty can be calculated for all operating points, the expected relative uncertainty U r e l cannot be calculated reasonably in some cases. For high rotational speeds and very low torque values, the simulated efficiency of the transmission is zero because the power losses are higher than the total input power. The relative uncertainty would be infinite at those operating points and can therefore not be shown. Naturally, the values for U r e l near this region are also very large, as the simulated efficiency is almost zero. However, in large regions of the operating spectrum, the relative uncertainty is very small and reaches a minimum of approx. 0.14% for the maximum input torque at all speeds.
Figure 15 shows the absolute measurement uncertainty for the power loss.
In comparison with the results of the efficiency measurement, the absolute expected uncertainty of the power loss measurement shows a different characteristic. At the same time, the relative uncertainty of the power loss measurement is significantly higher (between approx. 6% and 250%). Both effects can be explained by calculating the power loss (see Equation (8)). Although the rotational speed features a very small measurement uncertainty, the torque measurements are multiplied by the rotational speed, amplifying the uncertainty for increasing rotational speeds. This higher relative uncertainty can be explained by the subtraction of the output power from the input power. As the transmission is designed to be as efficient as possible, there is no large difference between the input and output values at most operating points. The power loss is, therefore, a relatively small value in comparison. However, the absolute measurement uncertainties of input and output power are combined via Pythagorean Addition. The result is an even larger overall uncertainty, which yields a large relative uncertainty in relation to the power loss. For example, the operating point’s highest relative uncertainty of 250% ( T 1 = 0.5   N m , n 1 = 500   r p m ) features a power loss of 1.9 W and an absolute uncertainty of 4.75 W.
Even though the expected uncertainty of the speed influences the power loss measurement, it only contributes marginally to the total uncertainty. The dominating factors and their influence are almost identical to the efficiency measurement (amplifier DAC noise deviation: min. 50%; amplifier DAC non-linearity deviation: min. 33%).
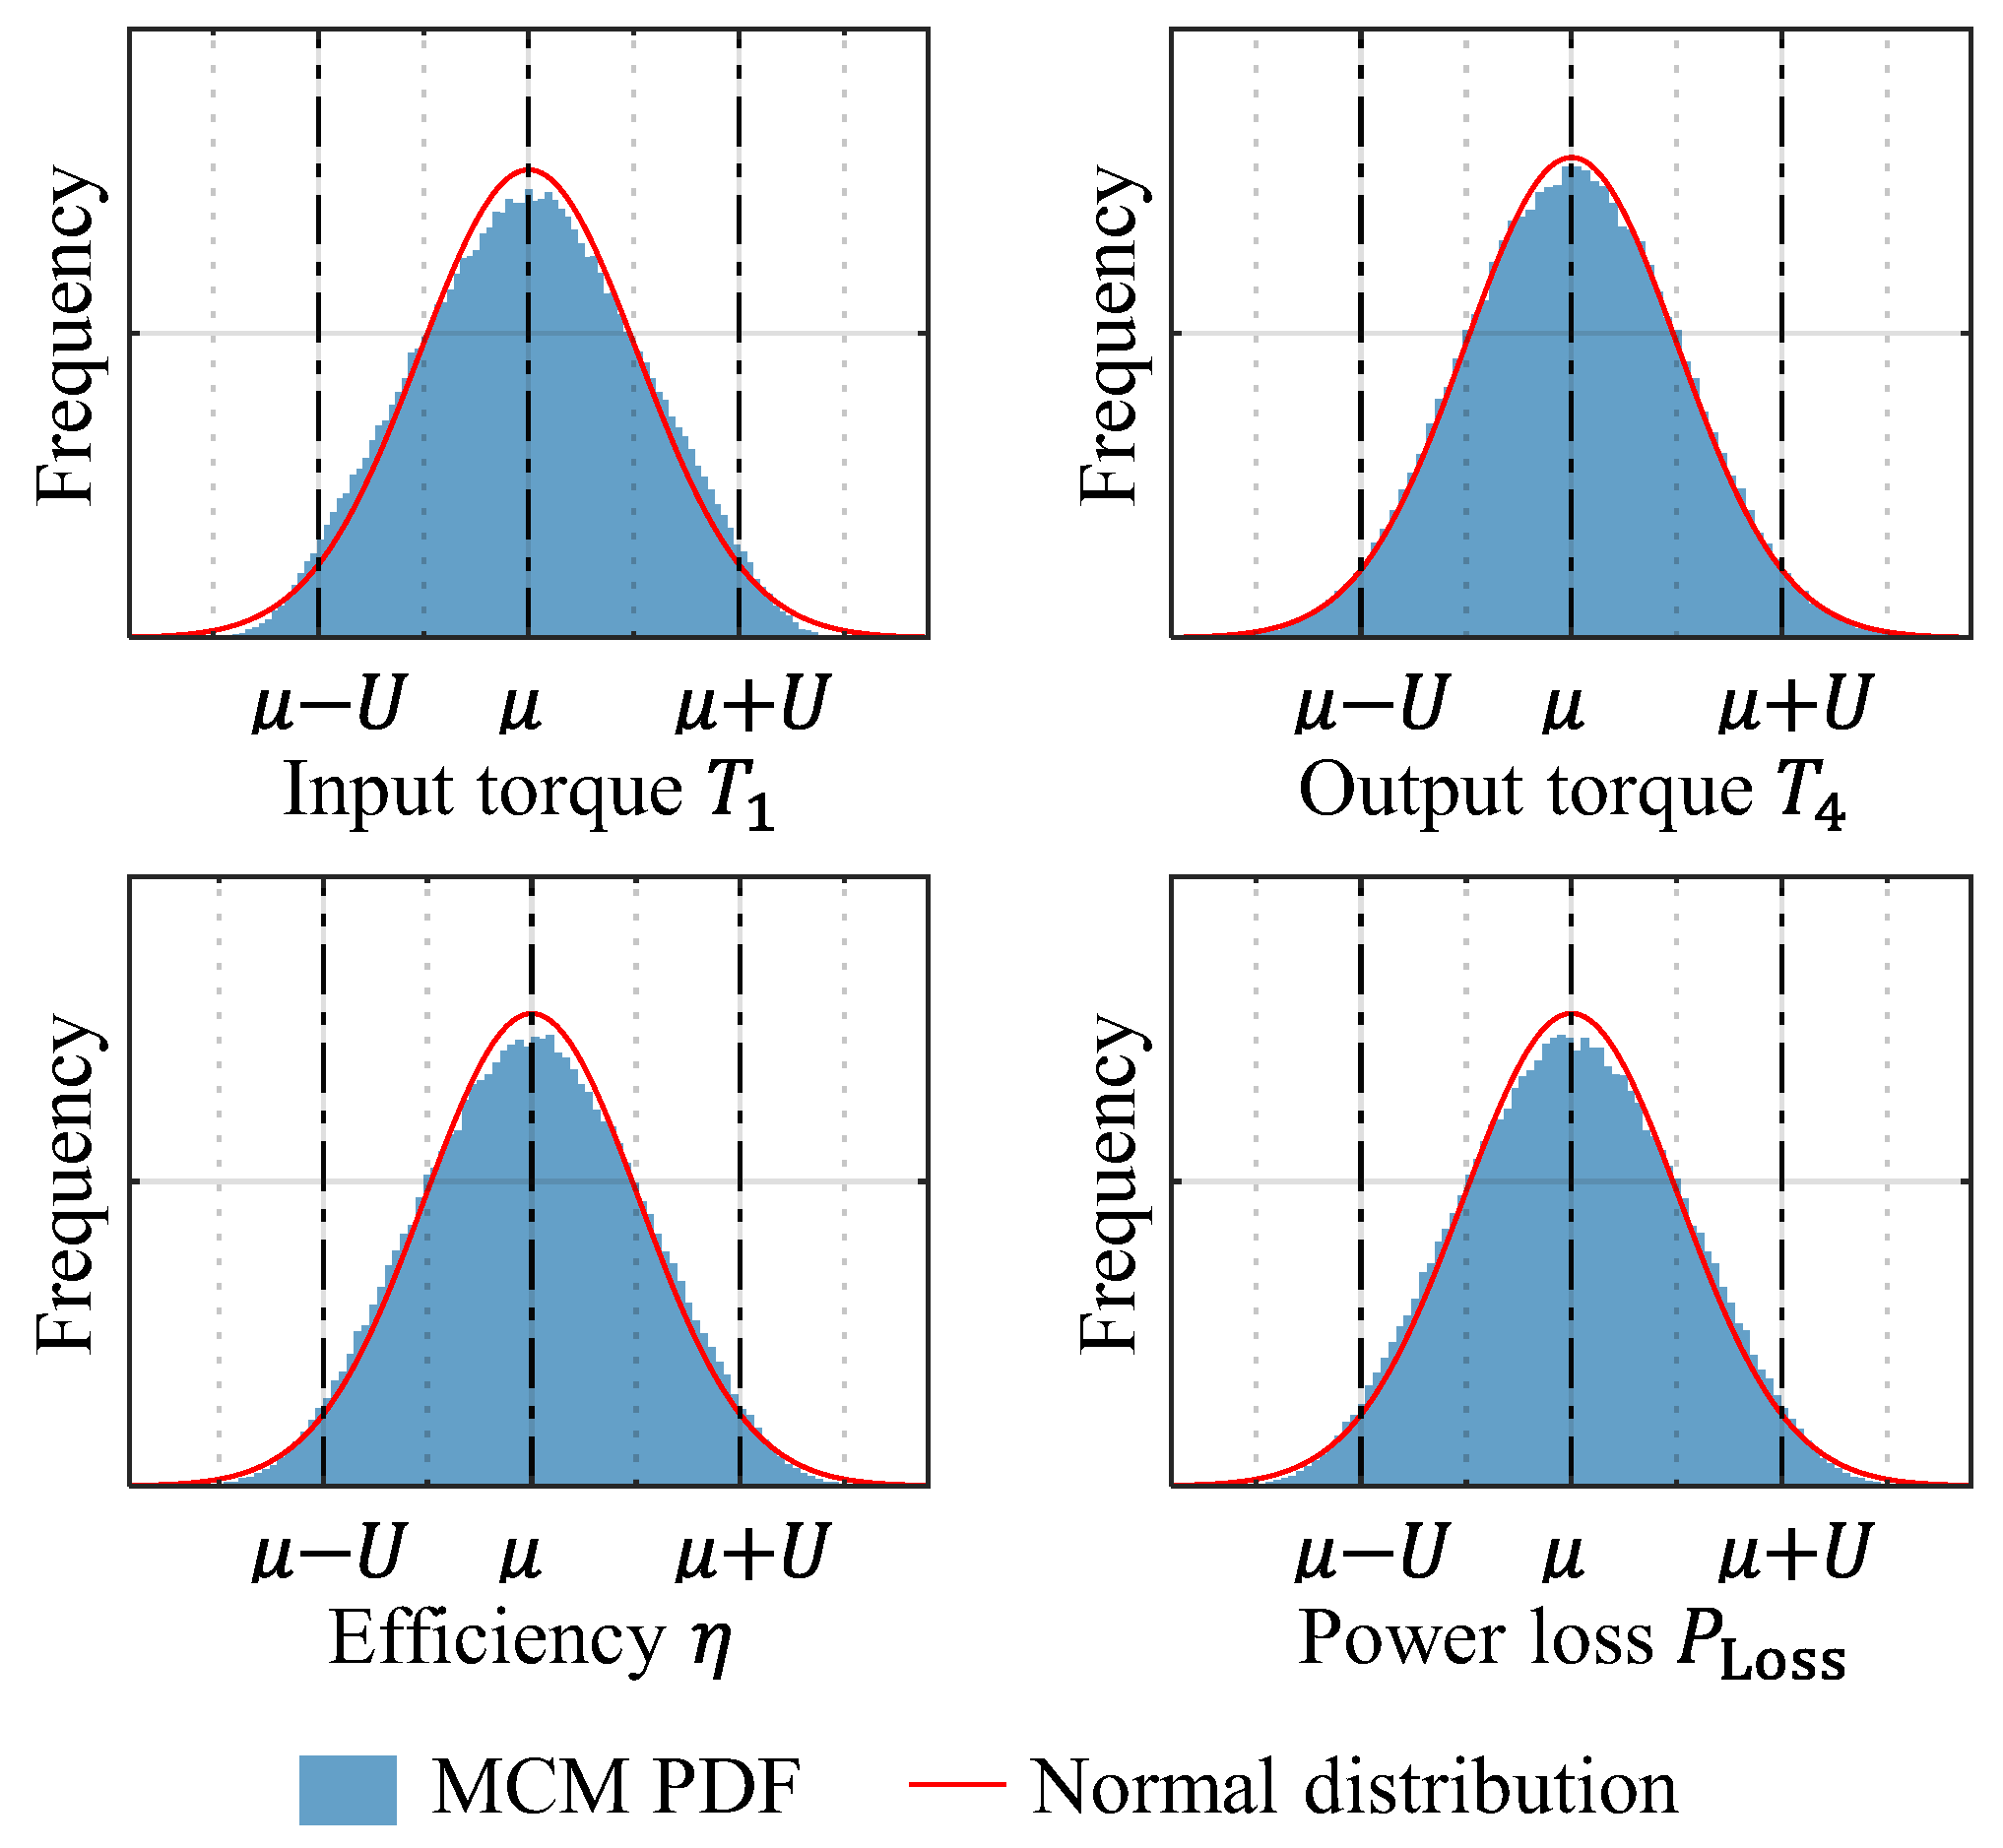
One of the main reasons for using the MCM instead of the standard GUM method was the presence of dominating factors and the uncertainty about the distribution of the measured uncertainties. To address this aspect, Figure 16 shows normalized histograms of the expected measurement uncertainties U a b s of the input and output torque and the efficiency and power loss of ST1 for one exemplary operating point. It can be seen that the input torque distribution calculated via the MCM does not follow a normal distribution. This can be attributed to the two dominating uncertainty factors (DAC noise and non-linearity), which are not normally distributed. While the output torque shows a greater resemblance to a normal distribution, the shape deviates from it, which is especially visible around the expected value μ . At this investigated operating point, the three dominating deviation sources are the repeatability (normal distribution), the ADC non-linearity, and the temperature deviation of the transducer (uniform distributions). The efficiency and power loss measurement distributions also show slight deviations from a normal distribution. Here, the distributions are more similar to the input torque than the output torque, corresponding with the dominant factors present: the DAC noise and non-linearity deviation at the transmission input.
These results show that MCM usage is required to accurately estimate the measurement uncertainties of the considered test rig. However, if required, the calculated PDFs are similar enough to a normal distribution to allow realistic, rough estimates of measurement uncertainties with the standard GUM method.

4.5. Expected Uncertainties for Efficiency and Power Loss Measurements of Complete Transmission

This section describes the expected measurement uncertainty of the complete transmission. The estimated uncertainties are given only for positive input torque values, as the efficiency and power loss can currently not be calculated in coast mode, during which the load machine drives the transmission. In this case, the power is split between the two sub-transmissions, which is currently impossible to model in the simulation tool used. Therefore, coasting mode is neglected from here on. The expected measurement uncertainties are calculated assuming that the load machines are configured for mid-load experiments to allow comparison between the results of ST1 and the complete transmission.
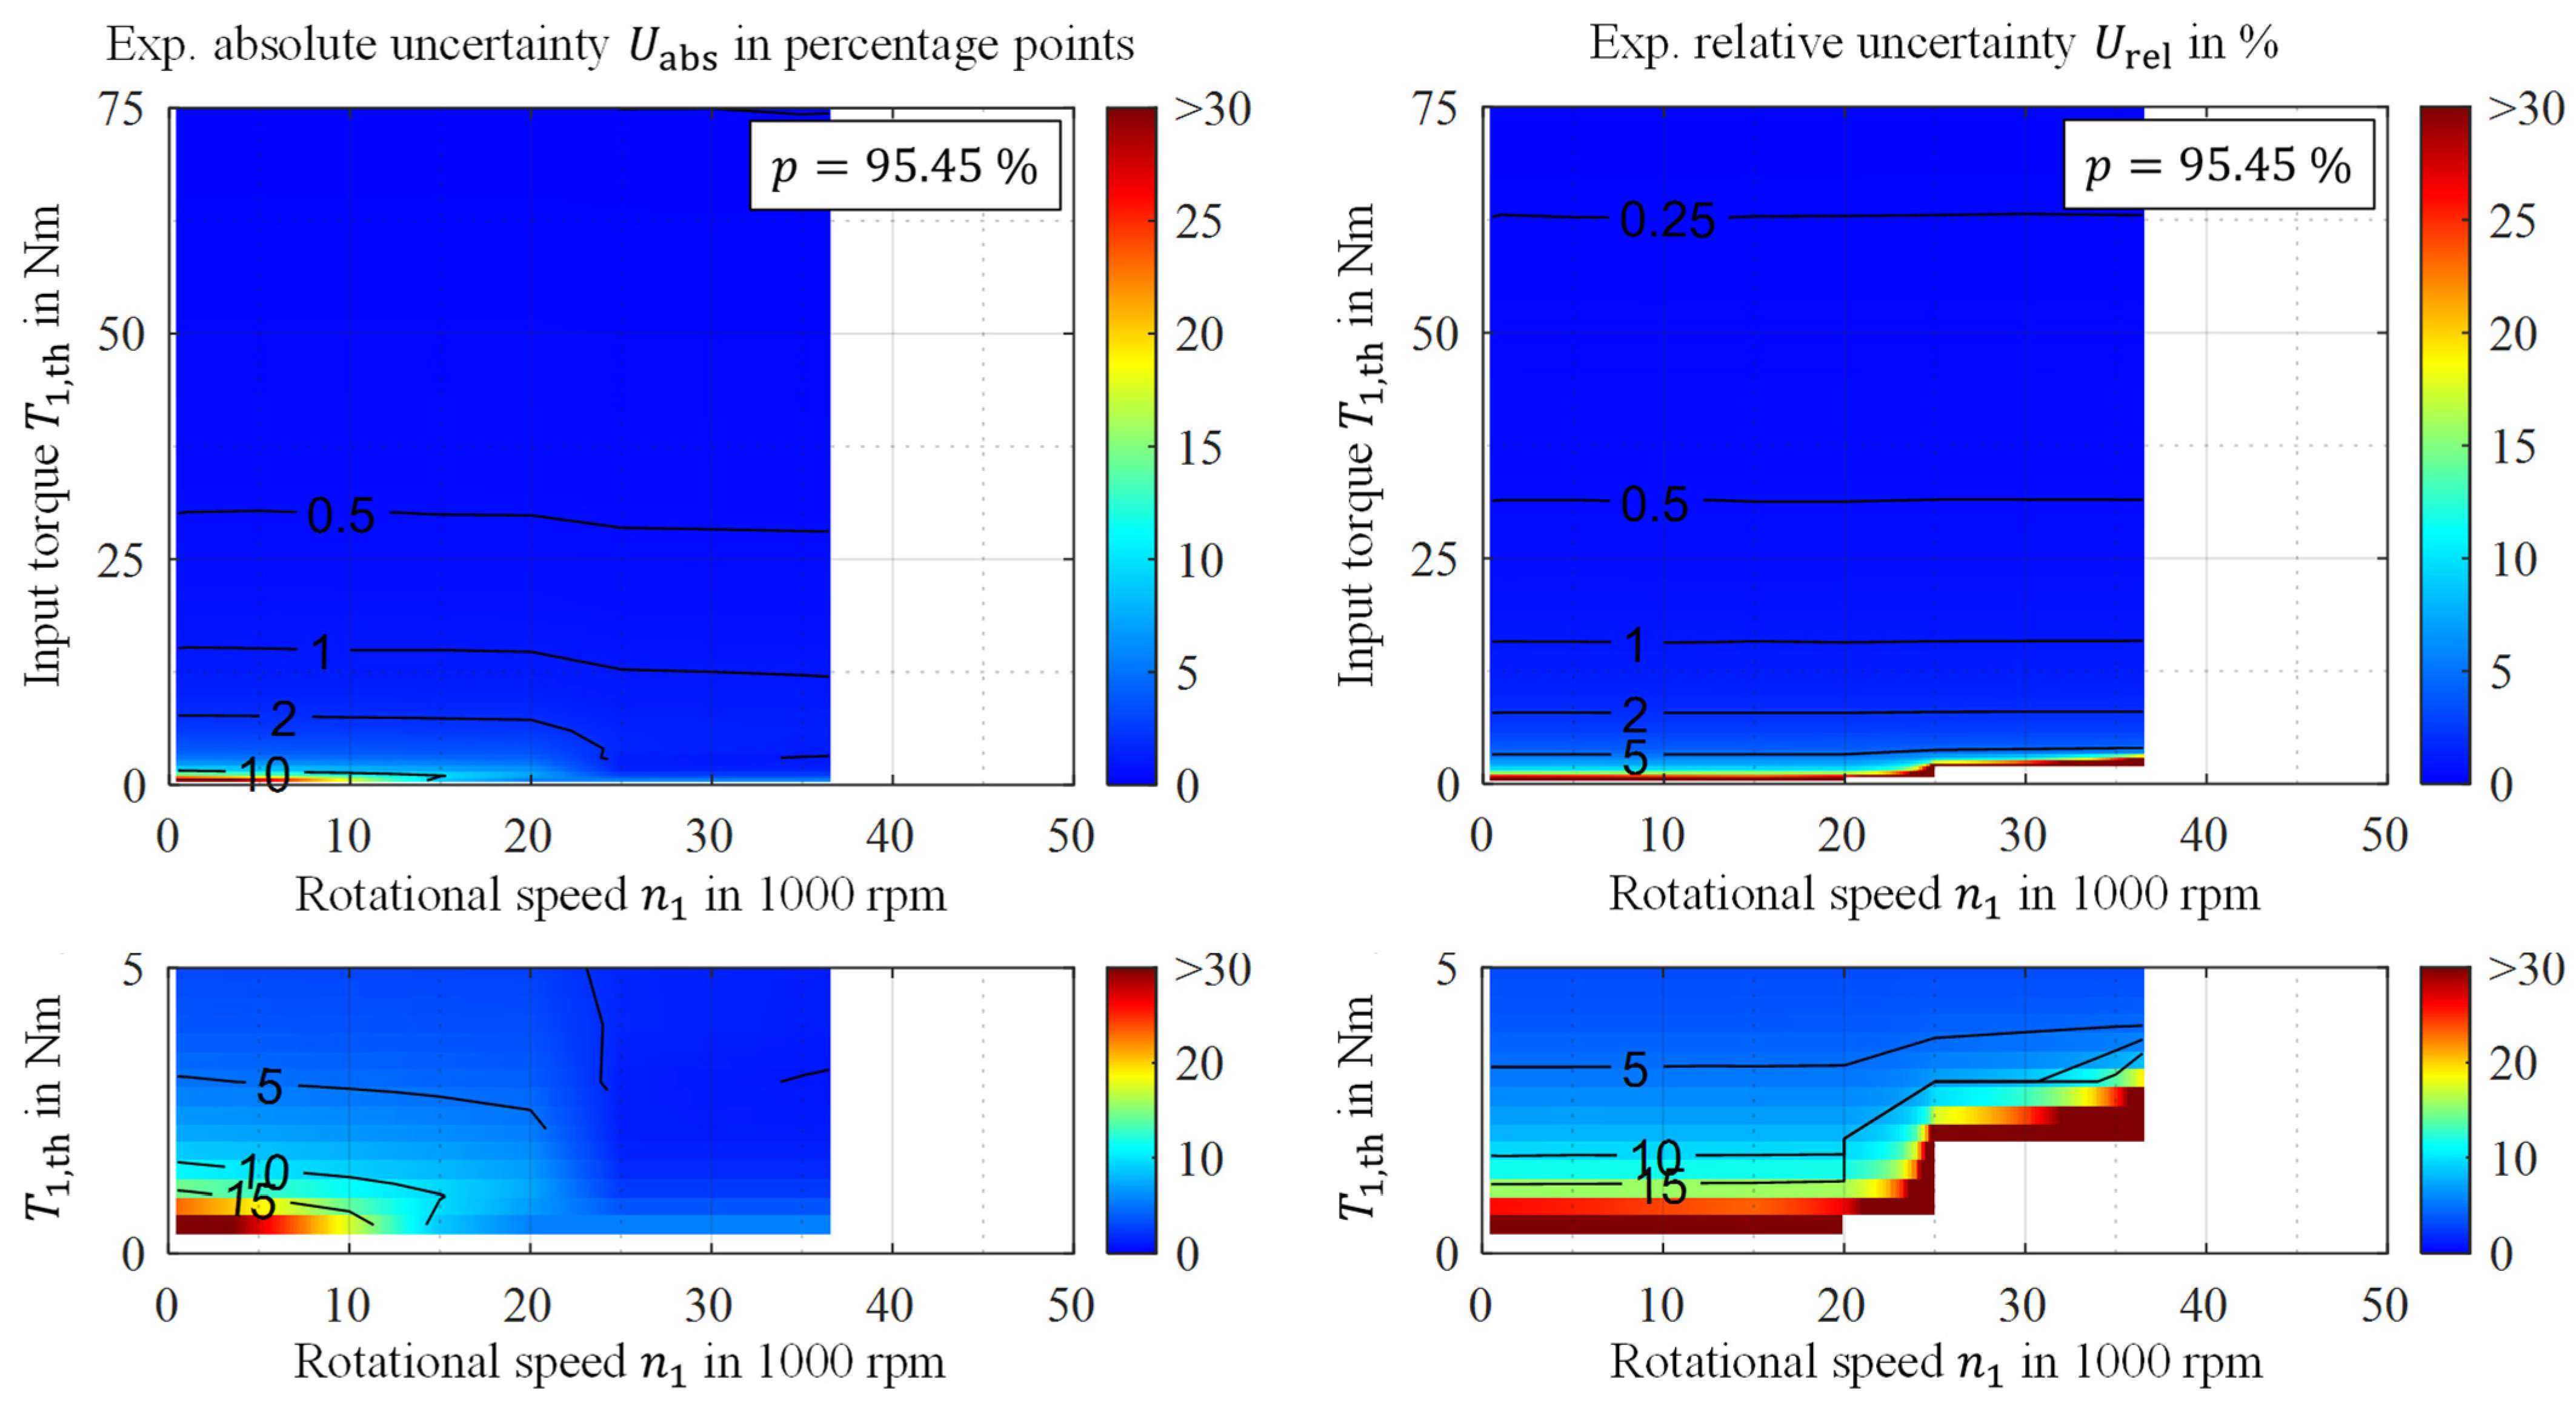
In regular operation, the transmitted power of each sub-transmission is combined at the differential stage. To improve efficiency, an optimal power distribution between ST1 and ST2 can be calculated for the required total input power. This is achieved with the so-called split factor, which specifies the power split between the two transmission inputs. At a split factor of 1, the required power is supplied solely by EM1, while at a split factor of 0, EM2 provides all the required power. This varying load distribution has to be considered when calculating the estimated measurement uncertainty. However, examinations have shown that the split factor has almost no influence on the measurement uncertainty of the input torque. This can be explained by the dominating uncertainty factors within the input measurement chains, as these are not dependent on the actual torque values but on the operational range of the measurement equipment. Therefore, the split factor is assumed to be 0.5 in all cases. Figure 17 shows the expected absolute and relative uncertainty of the efficiency measurement for the complete transmission in the first speed. For visualization, the input torques of EM1 and EM2 are combined into a theoretical total input torque T 1 , t h at the input of ST1, which would result in the same input power.
The results shown are limited to a range from 0 to approx. 36,500 rpm at ST1, as in the first speed, ST2 reaches the maximum input speed of 50,000 rpm. The estimated absolute uncertainty spans a range from 0.19 percentage points at T 1 , t h = 75   N m to a maximum of 35 percentage points at T 1 , t h = 0.5   N m and n 1 = 1000   r p m . The expected relative measurement uncertainty reaches values of less than 0.2% at maximum torque. Close to the region where the calculated efficiency is zero (missing data points on the lower right), the relative expected uncertainty values are very high as the efficiency decreases to zero.
An interesting observation is the abrupt change in absolute uncertainty in the region of 20,000–25,000 rpm. While the absolute uncertainty is mostly independent of the rotational speed above and below this region, a significant uncertainty decrease can be observed, especially at small input torques. It is suspected that the underlying calculation of the power loss causes this phenomenon. Morhard et al. [18] state that for different circumferential speeds of the transmission components, different approaches to calculating squeezing losses are available. The transition from one approach to the other causes increased power losses, which affects the calculated overall power loss and efficiency. This, in turn, influences the output torque, leading to a change in measurement uncertainty. However, this change does not visibly influence the relative measurement uncertainty, as torque and absolute torque measurement uncertainty are changing simultaneously.
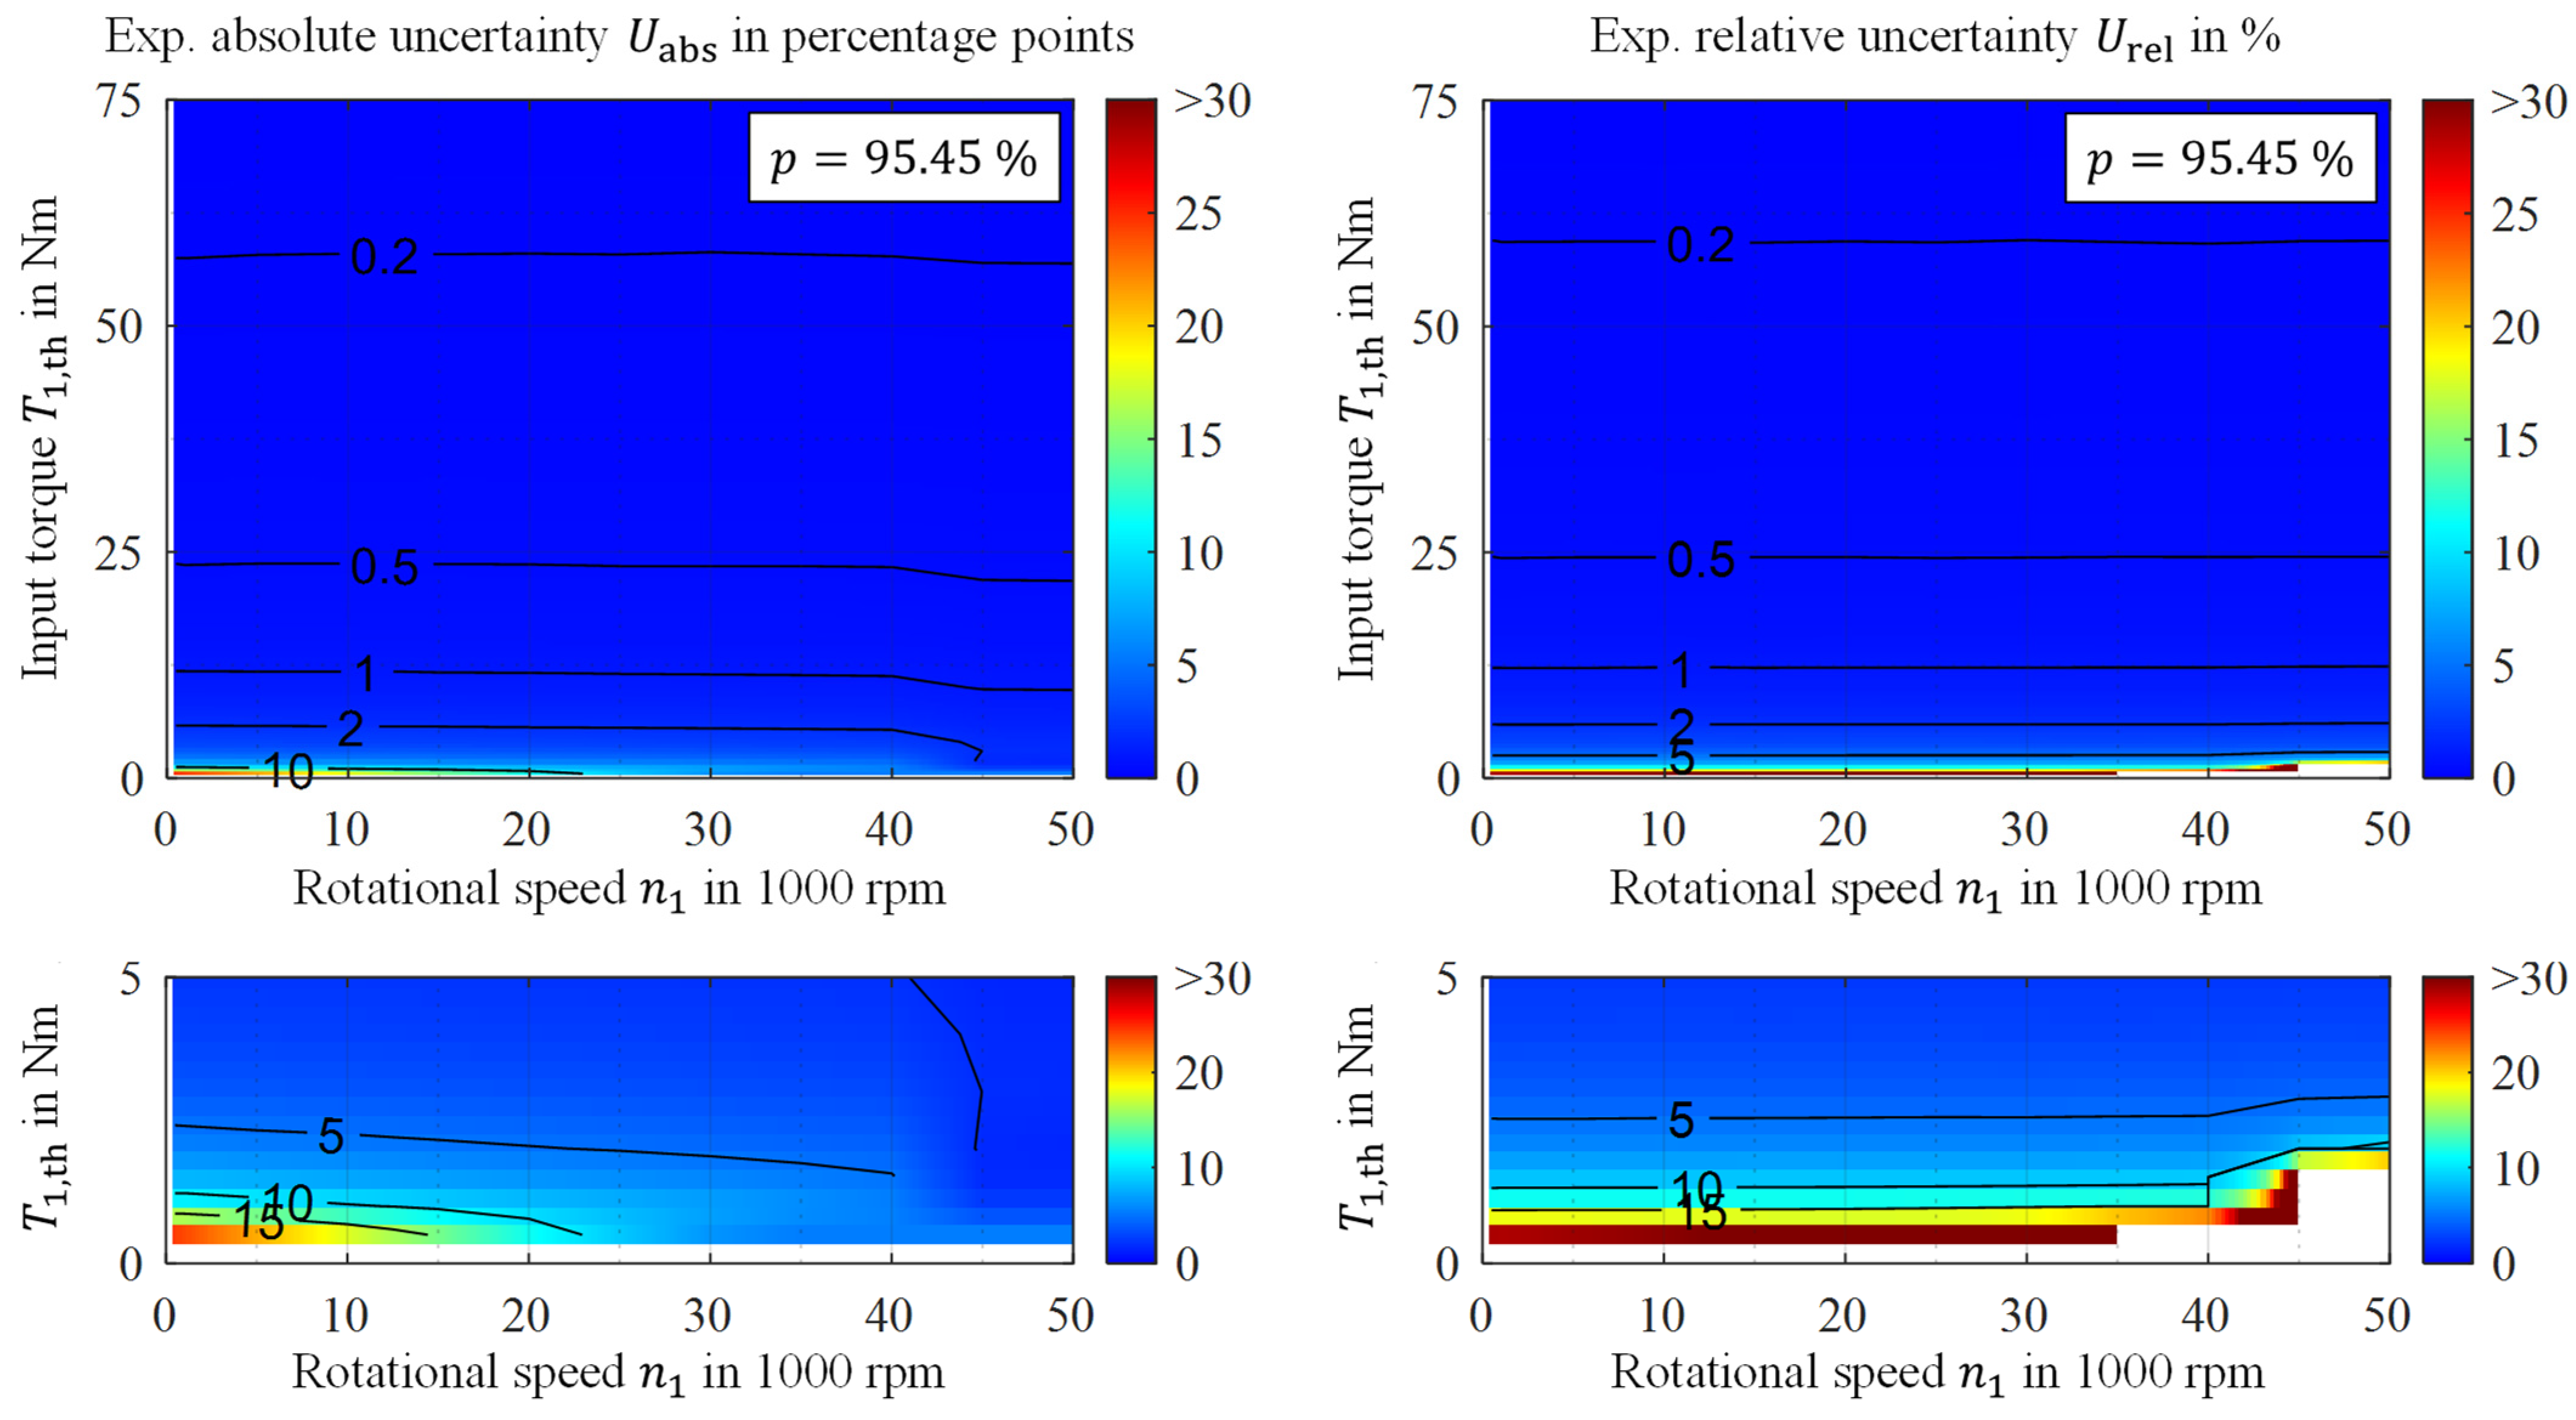
The results of the efficiency measurement uncertainty estimation while ST2 is in the second speed are shown in Figure 18. The results for the absolute measurement uncertainty also show an abrupt change, similar to the results in the first speed (Figure 17), but at a higher rotational speed. In the left graph (absolute uncertainty), the change from one calculation approach to the other is also visible, but at a higher range of 40,000–45,000 rpm. The absolute and relative uncertainties are slightly lower than in the first speed, as the smaller gear ratio in the second speed of ST2 leads to reduced output torque.
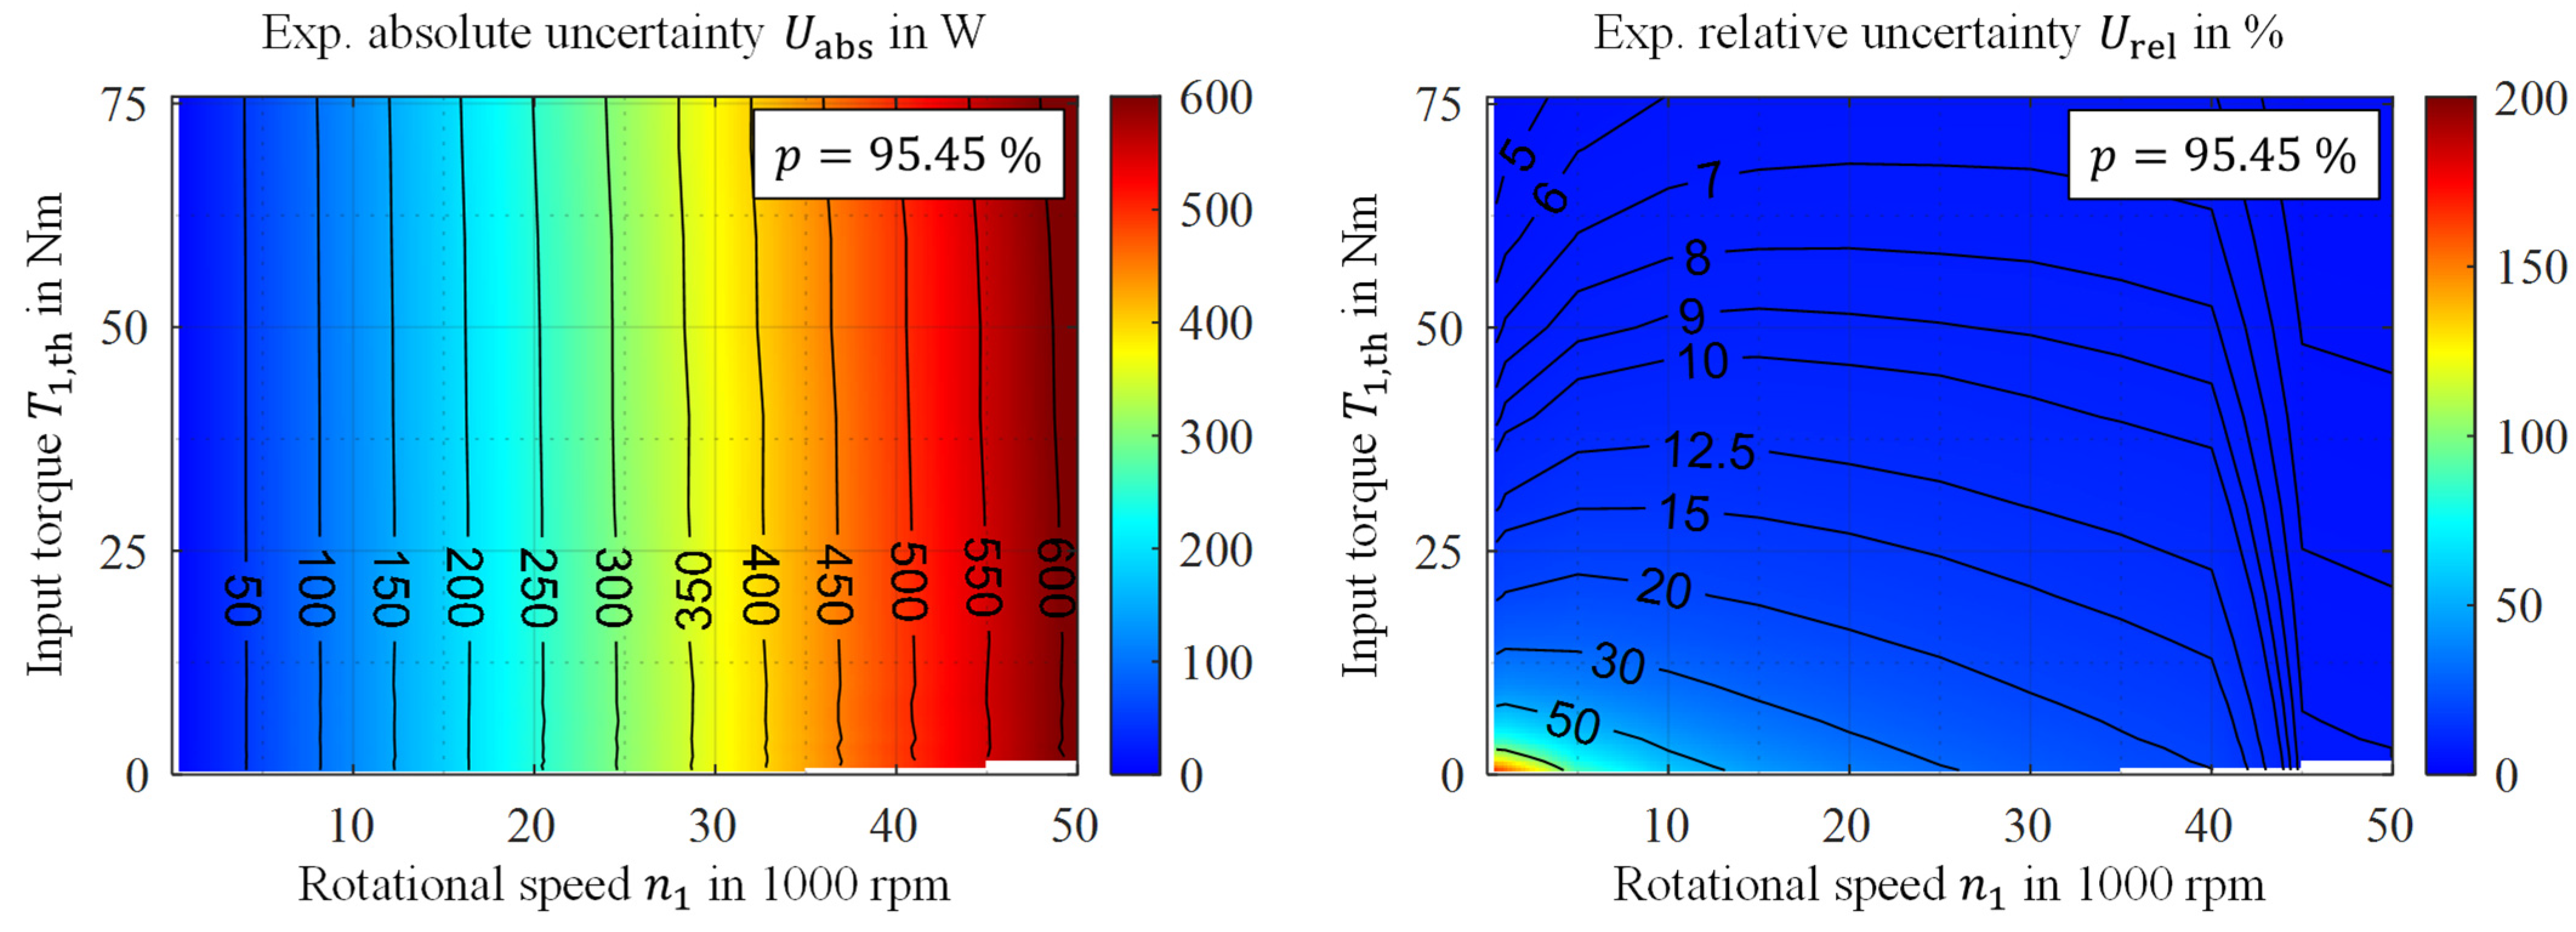
Figure 19 and Figure 20 show the absolute and relative measurement uncertainty of the power loss measurement in the first and second speeds, respectively. Similar to the results for ST1, the absolute power loss uncertainty for the complete transmission mainly depends on the input speed. It reaches maximum values of 600 W in the first speed and 628 W in the second speed at maximum torque and rotational speed. The relative measurement uncertainty at these operation points reaches its minimum at 3.7% for both gears. In contrast, the maximum values lie at minimal torque and speed (207% in the first speed and 162% in the second speed). The abrupt drop-off of the relative measurement uncertainty at rotational speeds of 20,000–25,000 rpm in the first speed and 40,000–45,000 rpm in the second speed is attributed to the change mentioned above to a different calculation approach of the squeezing losses.

4.6. Measurement Uncertainty for Averaging and Driving Cycles

In the previous sections, the measurement uncertainties are always given under the assumption that only one measurement is taken at each operating point. The uncertainties can, however, be further decreased by averaging over multiple measurements. In this case, if a normal distribution is assumed, the measurement uncertainty can be reduced roughly by a factor of N when conducting N independent measurements, similar to the calculation of the estimated standard error of the mean (SEM). For a typical measurement scheme, the mean of 600 measurements per minute is calculated for each operating point, resulting in a measurement uncertainty reduced by a factor of approx. 24.5. This factor can be applied to all previously shown results for typical measurement schemes. Of course, this factor is only valid for normally distributed quantities. Nevertheless, it gives a good indication of the potential increase in accuracy when averaging, as the calculated PDFs of the measured quantities are close to normal. In practice, however, the uncertainties of the successive measurements cannot be assumed to be completely independent, so the given factor should be seen as a theoretical lower limit to the measurement uncertainty.
Even though the test rig is intended for measurements in stationary conditions, one can attempt to calculate the measurement uncertainty for efficiency measurements during driving cycle tests. In this case, the rotor inertia of EM1 and EM2 influence the measured input torque, as it causes additional reaction forces at MP1 and MP2. This can be considered a systematic error and can be compensated, as the rotational inertia and the acceleration are known. While this might also introduce random deviations, they are neglected for now, as their magnitude is unknown. The energy consumption of the cycle can be considered another virtual measurement chain, which is the sum of the energy consumption in each time step. The overall measurement uncertainty can be calculated via the Pythagorean Addition of the uncertainties at each time step. For the WLTC Class 3 driving cycle, measurements are taken every second. Assuming the same independent uncertainty at each time step, an uncertainty reduced by a theoretical factor of 1800 42.4 can be achieved. Based on simulative results for the WLTC cycle using the efficiency data of ST1 of the transmission and a vehicle model, the energy consumption (disregarding the motor and power electronic efficiencies) for the cycle and operating points at each time step were calculated. The calculated overall energy consumption including measurement uncertainty is 13.055 ± 0.006 kWh/100 km ( p = 95.45 % ) , which is a relative measurement uncertainty of 0.043%. Even though this value does not represent the energy consumption in reality, it indicates the measurement uncertainty to be expected for driving cycle measurements.

5. Test Procedures

5.1. Investigation of Efficiency, Drag Torque, and Thermal Management

The principle of power difference measurement is used for investigations on transmission efficiency. Here, the efficiency η of ST1 is derived through a relative comparison of the measured output torque T 4 to the measured input torque T 1 under consideration of the transmission ratio i according to Equation (7). The mid-load configuration of the test rig is used for this. Before a test run, a sufficiently long heat-up phase is needed to ensure that the system temperatures are leveled out. At high injection temperatures up to 60 °C, a heat-up phase of 60 minutes before testing is recommended. During the efficiency investigations, it was noticed that the acting speed has a far more pronounced influence on the power losses and, thus, temperature than the acting torque. This is due to the investigated water-containing fluid. Water-containing fluids generally have a very low coefficient of friction combined with increased dynamic viscosity [28]. As both no-load and load-dependent power losses are temperature-sensitive, a test run should be completed without a standstill to avoid cooling down the transmission. As speed was found to be the primary influence on the temperature level, efficiency maps were derived by increasing the input torque stepwise at a constant speed. Each input torque level was held for 5 minutes, whereas the last 3 minutes were averaged to derive the efficiency value. Generally, the measurements were repeated once, and the average value from two measurements was used for the analysis. Exemplary results of efficiency measurements at ST1 are shown in Figure 21.
Here, two experiment runs for input torque values of 5 and 30 Nm are compared. As the measurement uncertainty is mostly independent of the input speed n 1 , the expected absolute uncertainty for a singular measurement at 5 Nm is approx. 1.7 percentage points and 0.3 percentage points at 30 Nm. However, as for each operating point, if 1800 measurements are conducted, the uncertainty could, in theory, be reduced by a factor of approx. 42.4 to 0.04 (5 Nm) and 0.07 percentage points (30 Nm). In practice, the measurements can most probably not be considered independent from each other. Therefore, the uncertainty for a single measurement can be used to estimate the upper bound of the measurement uncertainty.
A more detailed discussion of the measurement results can be found in Ref. [29]. Drag torque measurements are performed to derive the influence of the highest speeds on the no-load power losses. Here, the electric machines can either be installed or dismounted. The load machine is used for setting the speed of interest. Various temperature sensors (i.e., thermocouples and resistance thermometers) allow for investigations on the thermal management system. Temperature sensors in the power electronics and the electric motors track the component and coolant temperatures at the inlet and outlet. That way, the impact of adjusted coolant flow rates and the coolant temperature level can be assessed, and critical temperatures can be avoided. Temperature sensors in the transmission track the inlet and outlet temperatures of the oil, the temperature of the ring gear, and the temperatures of the outer rings of the bearings. That way, conclusions on frictional development in the planetary gear stage and the bearings can be drawn, and critical temperatures can be avoided. Adding highly accurate sensors for voltage and current measurements could also measure the efficiency of power electronics and electric motors. Using global efficiency optimization, measured component temperature and component efficiencies can be used to optimize the whole drive unit further. Additionally, a holistic thermal management approach with a mono-fluid cooling circuit could be investigated on that test rig. This means that a water-containing fluid can be used as a coolant for power electronics and electric motors and as a lubricant for the transmission in a mono-fluid thermal management cycle. Such thermal management can use the dissipated heat of electric components directly to heat the oil inlet temperature, leading to increased transmission efficiency. Additionally, components such as pumps, pipes, and coolant/oil amount can be reduced, leading to further package, cost, and CO2 advantages.

5.2. Investigation of Dynamics

The acoustic and vibration behavior of transmission systems play an even more critical role in electromobility compared to conventional drives since the masking effect of an internal combustion engine is eliminated. This results in significantly more stringent requirements for the NVH behavior of the transmission system and the gearing. One factor that further tightens these requirements is the increased max. transmission input speed compared to conventional drives, which is in the range of up to 20,000 rpm in series applications [3]. With a maximum input speed of up to 50,000 rpm, the transmission of the reference drive unit is thus well above the speed range standard in the state of the art. These investigations into NVH behavior aim to investigate excitation mechanisms in different speed ranges and identify ways of countering these excitation sources. Airborne acoustic measurements can also be performed with the proposed test set-up. This requires the test cell to be equipped and prepared in accordance with the DIN 45635-1 [30] and DIN 45635-23 [31] standards.
These investigations are conducted with acceleration sensors mounted on the housing surface, which record the vibrations during linear speed ramp-ups at a constant load. Due to the high input speeds and, thus, the wide frequency band of the gear excitation results, the sensors are evaluated in the frequency range of 0 to 20,000 kHz. A detailed description of the test evaluation and results can be found in Ref. [32]. In general, it can be stated that the NVH behavior in the low-speed range of 0 to approx. 10,000 rpm is primarily determined by global natural modes of the shaft-bearing system, as well as by natural frequencies of the housing. This is because in this speed range, the excitation frequencies of the gear teeth are low, and the critical eigenmodes mentioned are usually also in the lower frequency range of 0 to approx. 5 kHz. If the drive speed increases significantly above 10,000 rpm, the natural frequencies of the individual gears become the focus of NVH investigations. These are primarily torsional natural frequencies at which the wheel bodies of the gear stages vibrate against each other. If these natural frequencies coincide with the frequency of the gear excitation of the meshing, this typically results in resonance and strong vibration excitation. However, NVH-optimized gears can significantly reduce excitation in this critical speed range. These investigations further show that the vibration excitation of the input stage decreases again when the speed is increased further. In this so-called supercritical operating range, rotor dynamic excitations with the first, second, and third rotor-speed order develop into the determining excitation source for the reference drive unit. These low-frequency excitations reach significant vibration amplitudes, especially in the speed range above 40,000 rpm. On the other hand, gear excitation plays only a subordinate role since the acceleration levels drop sharply, and the gear excitation frequencies, up to and above 20 kHz, are already above the frequency range humans can perceive.

6. Discussion

The test rig was successfully used to investigate the function, efficiency, and dynamics of the Speed4E drive unit. Essential results are summarized in Refs. [17,29,32].
The reaction torque measurement concept was chosen for extensive testing at speeds of up to 50,000 rpm. This concept requires more complex mechanics and is more sensitive to external interference effects than the in-line torque measurement concept. Additionally, the reaction torque measurement concept is unsuitable for dynamic torque measurements. However, this measurement concept allows robust and low-cost measurements.
The estimation of the measurement uncertainty of the test rig yielded promising results. At most operating points, the expected relative measurement uncertainty is well below one percent for efficiency measurements, with a confidence interval of 95.45%. However, the power loss (difference in input and output power) shows a rather high relative uncertainty due to the propagation of the uncertainties of all measurement chains. This result shows that it is prudent to look at both the absolute and the relative expected uncertainty when determining the accuracy of a measurement system. The dominating uncertainty factors identified were the non-linearity and the noise uncertainty components of the force transducer amplifier DAC. In order to improve measurement uncertainty, an amplifier with a more suitable signal processing system is necessary.
While the power split factor at the transmission input has almost no influence on the overall uncertainty, the measurement uncertainty can be further improved by selecting the output torque split between both load machines in the standard configuration. For this work, a constant split was assumed; however, automatically selecting the output torque split could minimize the measurement uncertainty for the output torque measurement. However, this would only lead to a marginal increase in measurement accuracy, as the output torque measurement chains are not a source of dominant uncertainty factors.
While this paper only focuses on random deviations and errors, systematic deviations cannot always be compensated for in practice. An example of such a deviation would be the lever arm length. Even though the test environment is strictly controlled, temperature changes can still occur, influencing the arm length and the input torque measurement. While the lever arm length is relatively short, only a rather high temperature difference should cause significant deviations regarding the already considered factors. This should be investigated in more detail during practical experiments.
Most experiments are conducted in stationary conditions, so multiple measurements are available for each operating point. The measurement uncertainty can be further decreased by averaging over many independent measurements.

7. Conclusions

This paper describes a set-up for investigating the overall function of a high-speed drive unit and the transmission’s efficiency and NVH behavior. The high-speed drive unit developed in the Speed4E research project was used as a reference drive unit. The test rig is based on the electrical power circulation concept. Thus, the test rig can be used universally for different drive unit designs and operating modes. A reaction torque measurement unit was developed to enable measurements at high rotational speeds. Simultaneously, this unit allows robust measurements at low costs. First investigations were performed to show the function of the test rig and its separate components. Additionally, the measurement uncertainty was determined according to the GUM Monte Carlo method for the operating spectrum of the transmission. This includes the uncertainty for the measured input and output torques, drag torque, rotational speed, transmission efficiency, and power loss. Furthermore, dominant uncertainty factors were identified, and how the measurement uncertainty can be further decreased by conducting multiple measurements was investigated.

Author Contributions

Conceptualization, L.P.-G.; Test Rig Layout, L.P.-G.; Mechanical Design, L.P.-G.; Uncertainty Analysis, T.F.; Writing—Original Draft Preparation, L.P.-G., T.F., B.M. and D.S.; Visualization, L.P.-G. and T.F.; Writing—Review and Editing, K.V. and K.S.; Test Procedures, B.M. and D.S.; Supervision, K.S.; Resources, K.S.; Project Administration, L.P.-G. All authors have read and agreed to the published version of the manuscript.

Funding

The presented results are based on the Speed4E research project, funded by the Federal Ministry for Economic Affairs and Energy (BMWi) and supervised by the Project Management Agency DLR. The authors would like to express their thanks for the sponsorship and support received from BMWi and the Project Management Agency DLR. Many thanks go to all funding bodies and project partners from industry and universities for their great collaboration and support. Special thanks go to the Research Association for Drive Technology e.V. (FVA) for supporting this project.

Data Availability Statement

Data is contained within the article.

Conflicts of Interest

The authors declare no conflicts of interest.

Abbreviations

ADCAnalog-to-digital converter
BEVBattery electric vehicle
DDifferential
DACDigital-to-analog converter
DAQData acquisition system
DIODigital input/output module
EMElectric motor
EDUElectric drive unit
GUMGuide to the Expression of Uncertainty in Measurements
LMLoad machine
MCMMonte Carlo method
MPMeasuring position
PDFProbability density function
SShifting actuator
SEMStandard error of the mean
STSub-transmission
WLTCWorldwide Harmonized Light Vehicles Test Cycle

Nomenclature

SymbolUnitMeaning
FNForce
i-Gear ratio
lmmLever arm length
nrpmSpeed
p%Confidence level
PWPower
tSTime
TNmTorque
UNm, rpm, W, %Expanded measurement uncertainty
δ Nm, rpmDeviation
η %Efficiency
μ Nm, W, %Expected value

References

  1. Schweigert, D.; Gerlach, M.E.; Hoffmann, A.; Morhard, B.; Tripps, A.; Lohner, T.; Otto, M.; Ponick, B.; Stahl, K. On the Impact of Maximum Speed on the Power Density of Electromechanical Powertrains. Vehicles 2020, 2, 365–397. [Google Scholar] [CrossRef]
  2. Deiml, M.; Eriksson, T.; Schneck, M.; Tan-Kim, A. High-speed Electric Drive Unit for the Next Generation of Vehicles. ATZ Worldw. 2019, 121, 42–47. [Google Scholar] [CrossRef]
  3. Koenig, A.; Nicoletti, L.; Schroeder, D.; Wolff, S.; Waclaw, A.; Lienkamp, M. An Overview of Parameter and Cost for Battery Electric Vehicles. WEVJ 2021, 12, 21. [Google Scholar] [CrossRef]
  4. Angerer, C.R. Powertrain Concept Design Optimization for Battery Electric All-Wheel-Drive Vehicles. Ph.D. Thesis, Technical University of Munich, Munich, Germany, 2020. [Google Scholar]
  5. Grunditz, E.A.; Thiringer, T. Performance Analysis of Current BEVs Based on a Comprehensive Review of Specifications. IEEE Trans. Transp. Electrif. 2016, 2, 270–289. [Google Scholar] [CrossRef]
  6. Nemeth, T.; Bubert, A.; Becker, J.N.; De Doncker, R.W.; Sauer, D.U. A Simulation Platform for Optimization of Electric Vehicles with Modular Drivetrain Topologies. IEEE Trans. Transp. Electrif. 2018, 4, 888–900. [Google Scholar] [CrossRef]
  7. Schauer, E.; Moskalik, A.; Kargul, J.; Stuhldreher, M.; Butters, K.; Barba, D.; Drallmeier, J.; Gross, M. Development of Benchmarking Methods for Electric Vehicle Drive Units; SAE Technical Paper 2024-01-2270; SAE International: Warrendale, PA, USA, 2024. [Google Scholar] [CrossRef]
  8. Dépature, C.; Lhomme, W.; Bouscayrol, A.; Boulon, L.; Sicard, P.; Jokela, T. Characterisation of the electric drive of EV: On-road versus off-road method. IET Electr. Syst. Transp. 2017, 7, 215–222. [Google Scholar] [CrossRef]
  9. Dong, C.; Pei, W.; Liu, Y.; Wei, Y.; Li, D.; Guo, R.; Ren, Z. Experimental Research on Transmission Characteristics of Elliptic Gear Transmission Systems. Stroj. Vestn. J. Mech. Eng. 2022, 68, 702–712. [Google Scholar] [CrossRef]
  10. Lee, G.-H.; Park, Y.-J.; Nam, J.-S.; Oh, J.-Y.; Kim, J.-G. Design of a Mechanical Power Circulation Test Rig for a Wind Turbine Gearbox. Appl. Sci. 2020, 10, 3240. [Google Scholar] [CrossRef]
  11. Marzebali, M.H.; Faiz, J.; Capolino, G.-A.; Kia, S.H.; Henao, H. Planetary Gear Fault Detection Based on Mechanical Torque and Stator Current Signatures of a Wound Rotor Induction Generator. IEEE Trans. Energy Convers. 2018, 33, 1072–1085. [Google Scholar] [CrossRef]
  12. Boguski, B.; Kahraman, A.; Nishino, T. A New Method to Measure Planet Load Sharing and Sun Gear Radial Orbit of Planetary Gear Sets. J. Mech. Des. 2012, 134, 071002. [Google Scholar] [CrossRef]
  13. DIN ISO 14635-1; Gears—FZG Test Procedures—Part 1: FZG Test Method A/8,3/90 for Relative Scuffing Load-Carrying Capacity of Oils (ISO 14635-1:2000). DIN Media: Berlin, Germany, 2006.
  14. Ligata, H.; Kahraman, A.; Singh, A. An Experimental Study of the Influence of Manufacturing Errors on the Planetary Gear Stresses and Planet Load Sharing. J. Mech. Des. 2008, 130, 041701. [Google Scholar] [CrossRef]
  15. Hammami, A.; Del Fernandez Rincon, A.; Viadero, F.; Chaari, F.; Feki, N.; Haddar, M. Back to back planetary gearbox: Influence of non-stationary operating conditions. In Proceedings of the International Gear Conference 2014, Lyon, France, 26–28 August 2014; Elsevier: Amsterdam, The Netherlands, 2014; pp. 896–904, ISBN 9781782421948. [Google Scholar]
  16. Loevenich, J.; Trippe, M.; Brimmers, J.; Brecher, C.; Stark, S.; Krueger, D. Design and Manufacturing Strategy of a Back-to-Back Test Rig for Investigation of Ultra High Cycle Fatigue Strength Regarding Tooth Root Strength in Aerospace Applications. SSRN J. 2020, 78–85. [Google Scholar] [CrossRef]
  17. Schweigert, D.; Morhard, B.; Otto, M.; Stahl, K. Results of the joint project Speed4E, efficiency and vibration behavior of the high-speed gearbox. In Proceedings of the E-MOTIVE Expert Forum Electric Vehicle Drives, Wolfsburg, Germany, 21–22 September 2022. [Google Scholar]
  18. Morhard, B.; Schweigert, D.; Mileti, M.; Sedlmair, M.; Lohner, T.; Stahl, K. Efficient lubrication of a high-speed electromechanical powertrain with holistic thermal management. Forsch. Ingenieurwesen 2021, 85, 443–456. [Google Scholar] [CrossRef]
  19. ISO/IEC GUIDE 98-3:2008; Uncertainty of Measurement—Part 3: Guide to the Expression of Uncertainty in Measurement (GUM:1995). ISO/IEC: Geneva, Switzerland, 2008.
  20. ISO/IEC GUIDE 98-3:2008/SUPPL1:2008; Uncertainty of Measurement—Part 3: Guide to the Expression of Uncertainty in Measurement (GUM:1995)—Supplement 1: Propagation of Distributions Using a Monte Carlo Method. ISO/IEC: Geneva, Switzerland, 2008.
  21. Siebert, B.R.L.; Sommer, K.-D. Weiterentwicklung des GUM und Monte-Carlo-Techniken. Tm Tech. Mess. 2004, 71, 67–80. [Google Scholar] [CrossRef]
  22. HBM. S2M Force Transducer Datasheet. Available online: https://www.hbm.com/fileadmin/mediapool/hbmdoc/technical/B03594.pdf (accessed on 5 August 2024).
  23. HBM. T40B Torque Flange Datasheet. Available online: https://www.hbm.com/fileadmin/mediapool/hbmdoc/technical/B03406.pdf (accessed on 5 August 2024).
  24. ETH. Rotating Torque Sensors. Available online: https://www.eth-messtechnik.de/en/products/torque-sensors/rotating-torque-sensors (accessed on 5 August 2024).
  25. VDI/VDE 2646; Torque Measuring Devices/Measuring Chains—Minimum Requirements in Calibrations. DIN Media: Berlin, Germany, 2019.
  26. DKD-R 3-3; Kalibrierung von Kraftmessgeräten. PTB—German National Metrology Institute: Braunschweig, Germany, 2024.
  27. National Instruments. Making Accurate Frequency Measurements. Available online: http://www.ni.com/product-documentation/3619/en/ (accessed on 5 August 2024).
  28. Yilmaz, M.; Mirza, M.; Lohner, T.; Stahl, K. Superlubricity in EHL Contacts with Water-Containing Gear Fluids. Lubricants 2019, 7, 46. [Google Scholar] [CrossRef]
  29. Morhard, B.; Schweigert, D.; Paschold, C.; Lohner, T.; Stahl, K. Experimental results on the mechanical efficiency of the high-speed powertrain Speed4E. In Proceedings of the CTI Symposium, Berlin, Germany, 5–8 December 2022. [Google Scholar]
  30. DIN 45635-1; Measurement of Airborne Noise Emitted by Machines; Enveloping Surface Method; Basic Requirements for3 Accuracy Classes. DIN Media: Berlin, Germany, 1984.
  31. DIN 45635-23; Measurement of Noise Emitted by Machines—Airborne Noise Emission, Enveloping Surface Method—Part 23: Gear Transmission. DIN Media: Berlin, Germany, 2003.
  32. Schweigert, D.; Morhard, B.; Oberneder, F.; Pointner-Gabriel, L.; Otto, M.; Stahl, K. Numerical and experimental investigations on the vibration behavior of a high-speed planetary gearbox. Forsch. Ingenieurwesen 2024, 88, 7. [Google Scholar] [CrossRef]
Figure 1. Electrical power circulation concept (left) and mechanical power circulation concept (right).
Vehicles 06 00067 g001
Figure 2. Design of reference drive unit.
Vehicles 06 00067 g002
Figure 3. Layout of transmission.
Vehicles 06 00067 g003
Figure 4. Output torque maps for different transmission settings.
Vehicles 06 00067 g004
Figure 5. The mechanical layout of the test rig in the standard configuration.
Vehicles 06 00067 g005
Figure 6. The mechanical layout of the test rig in the low-load configuration.
Vehicles 06 00067 g006
Figure 7. The mechanical layout of the test rig in the mid-load configuration.
Vehicles 06 00067 g007
Figure 8. The mechanical layout of the test rig in the drag loss configuration.
Vehicles 06 00067 g008
Figure 9. A photograph of the test rig in the mid-load configuration.
Vehicles 06 00067 g009
Figure 10. Assembly states of input torque measurement unit: (a) isometric view: electric motor; (b) side view: Assembly State 1; (c) detail A: Triple ring bearing A; (d) detail B: Triple ring bearing B; (e) isometric view: Assembly State 2; (f) isometric view: Assembly State 3.
Vehicles 06 00067 g010
Figure 11. Assembly states of input torque measurement unit: (a) front and back views: Assembly State 3; (b) isometric view: final assembly.
Vehicles 06 00067 g011
Figure 12. Measurement chains for torque and speed measurements.
Vehicles 06 00067 g012
Figure 13. Expected absolute (black) and relative (red) measurement uncertainties for ST1.
Vehicles 06 00067 g013
Figure 14. Expected absolute (left) and relative (right) efficiency measurement uncertainties for ST1. The lower two graphs show an enlarged section of the upper graphs. It is essential to note the distinction between percentage points (arithmetic difference between two percentages) and percentages (ratio between two values), as the efficiency itself is given as a percentage.
Vehicles 06 00067 g014
Figure 15. Expected absolute (left) and relative (right) power loss measurement uncertainties for ST1.
Vehicles 06 00067 g015
Figure 16. Normalized histograms containing the MCM results for the measurement chains of input torque, output torque, efficiency, and power loss at the operating point T 1 = 60   N m , n 1 = 20,000   r p m , in mid-load configuration.
Vehicles 06 00067 g016
Figure 17. The expected absolute (left) and relative (right) transmission efficiency uncertainties for the complete transmission (ST2 in the first speed). The lower two graphs show an enlarged section of the upper graphs.
Vehicles 06 00067 g017
Figure 18. The expected absolute (left) and relative (right) transmission efficiency uncertainties for the complete transmission (ST2 in the second speed). The lower two graphs show an enlarged section of the upper graphs.
Vehicles 06 00067 g018
Figure 19. The expected absolute (left) and relative (right) power loss measurement uncertainties for the complete transmission (ST2 in the first speed).
Vehicles 06 00067 g019
Figure 20. The expected absolute (left) and relative (right) power loss measurement uncertainties for the complete transmission (ST2 in the second speed).
Vehicles 06 00067 g020
Figure 21. Exemplary results of efficiency measurements at ST1 and the corresponding measurement uncertainty for a single measurement.
Vehicles 06 00067 g021
Table 1. Configurations of the test rig.
ConfigurationModeConnected Load MachinesLoad Range
Low-load (see Figure 6)TractionLM1From 0 to 1000 Nm
Mid-load (see Figure 7)TractionLM2From 0 to 2000 Nm
Standard (see Figure 5)TractionLM1 + LM2From 0 to 3000 Nm
Drag loss (see Figure 8)CoastLM2From to 10/50/100 Nm
Disclaimer/Publisher’s Note: The statements, opinions and data contained in all publications are solely those of the individual author(s) and contributor(s) and not of MDPI and/or the editor(s). MDPI and/or the editor(s) disclaim responsibility for any injury to people or property resulting from any ideas, methods, instructions or products referred to in the content.