
An Analysis of the Correct Frequency of the Service Inspections of German Passenger Cars—A Case Study on Kazakhstan and Poland


 , ,
, ,  and
and 
Abstract
1. Introduction
2. Materials and Methods
2.1. Materials
2.2. The Data Analysis
2.3. Fulfillment of Warranty Conditions
2.4. The Algorithm for Calculating the Proper Date of Service Inspection
- Calculation of average mileage for each brand and type of vehicle.
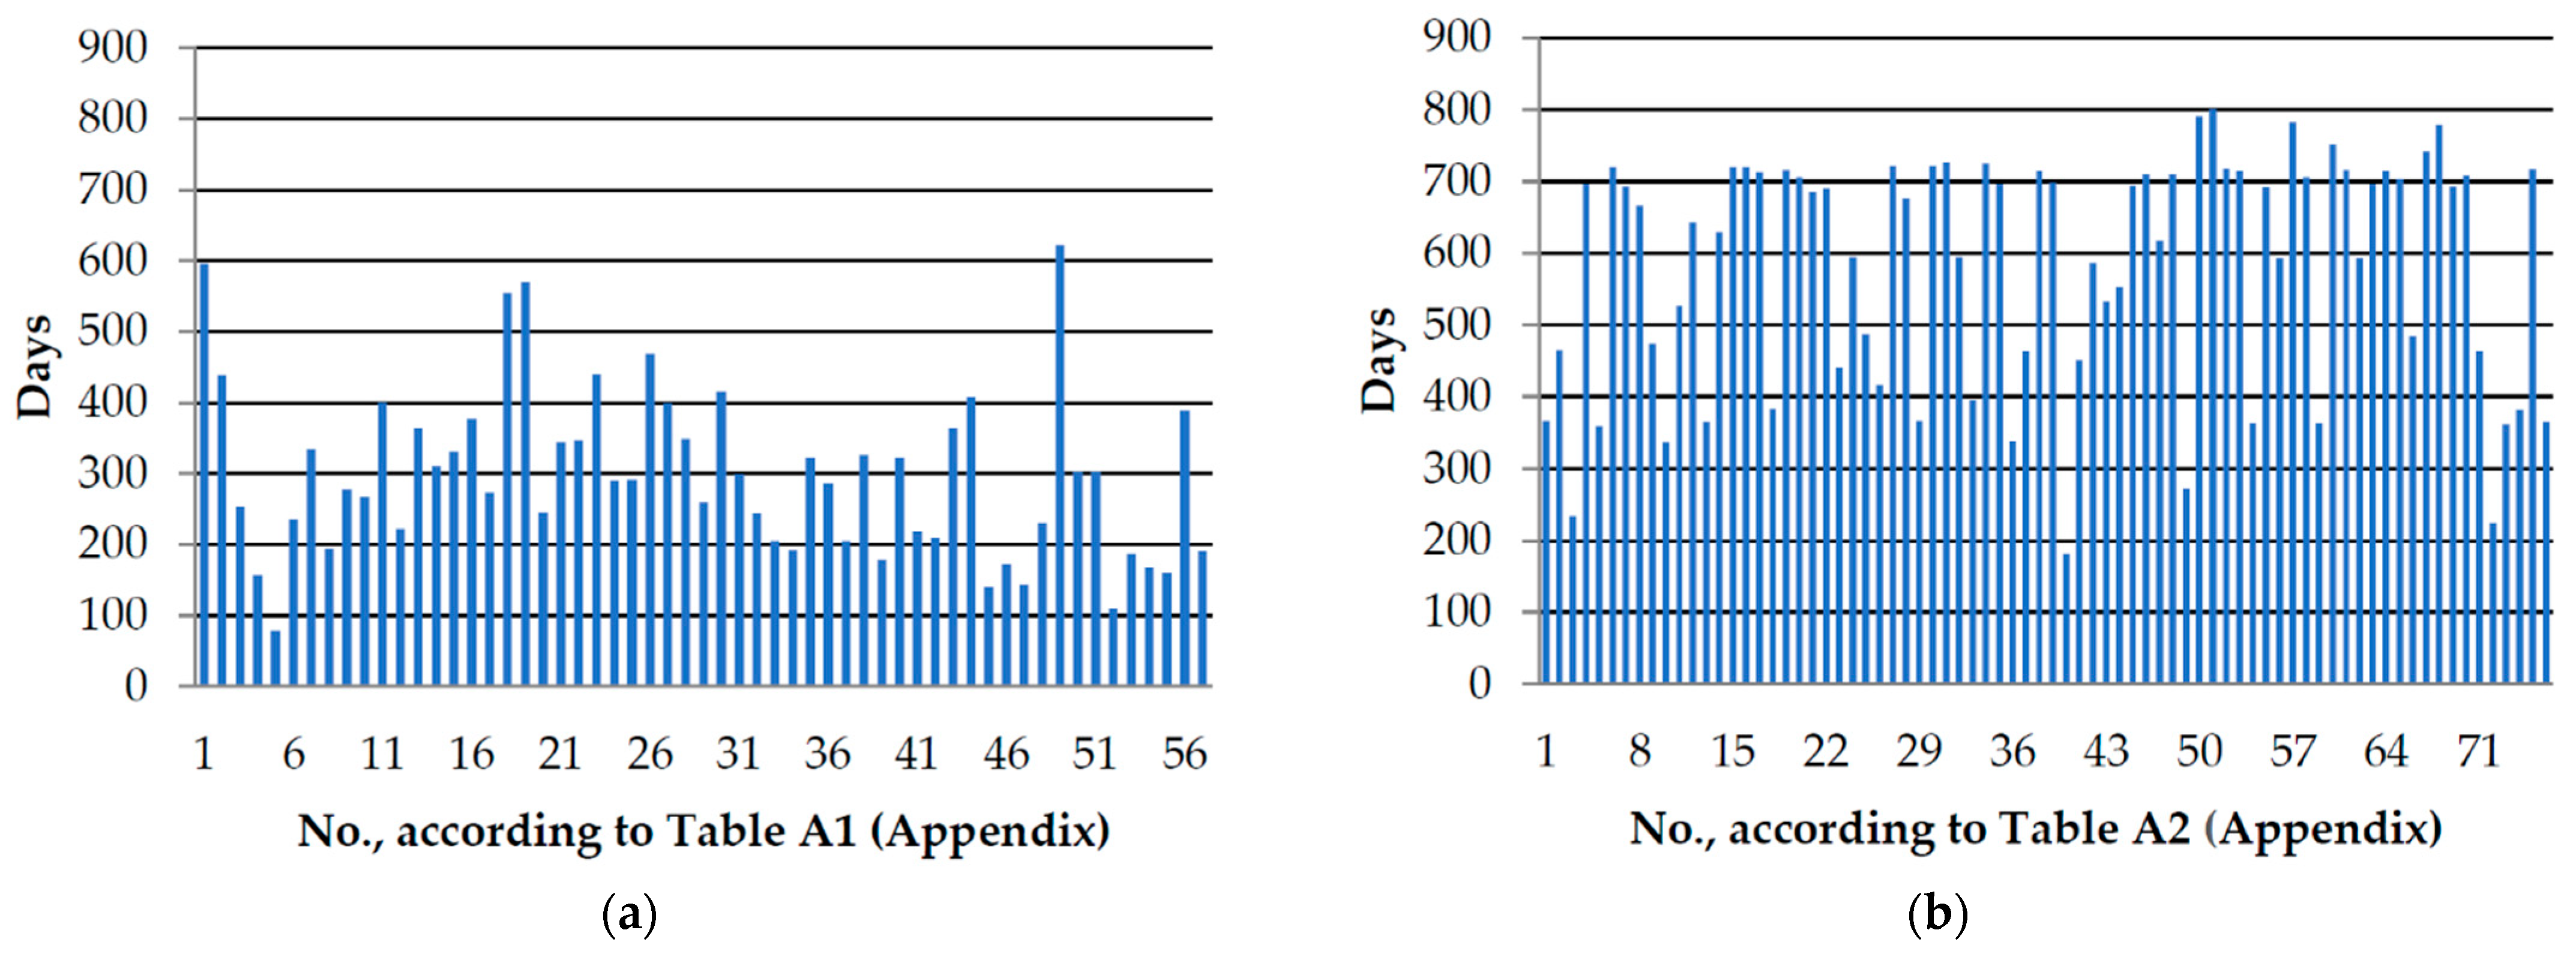
- Calculation of average days to first SI.
- Calculation of the hypothetical number of days when the car will reach the mileage recommended by the manufacturer for the first inspection (15,000 km for Kazakh cars or 30,000 km for Polish cars).
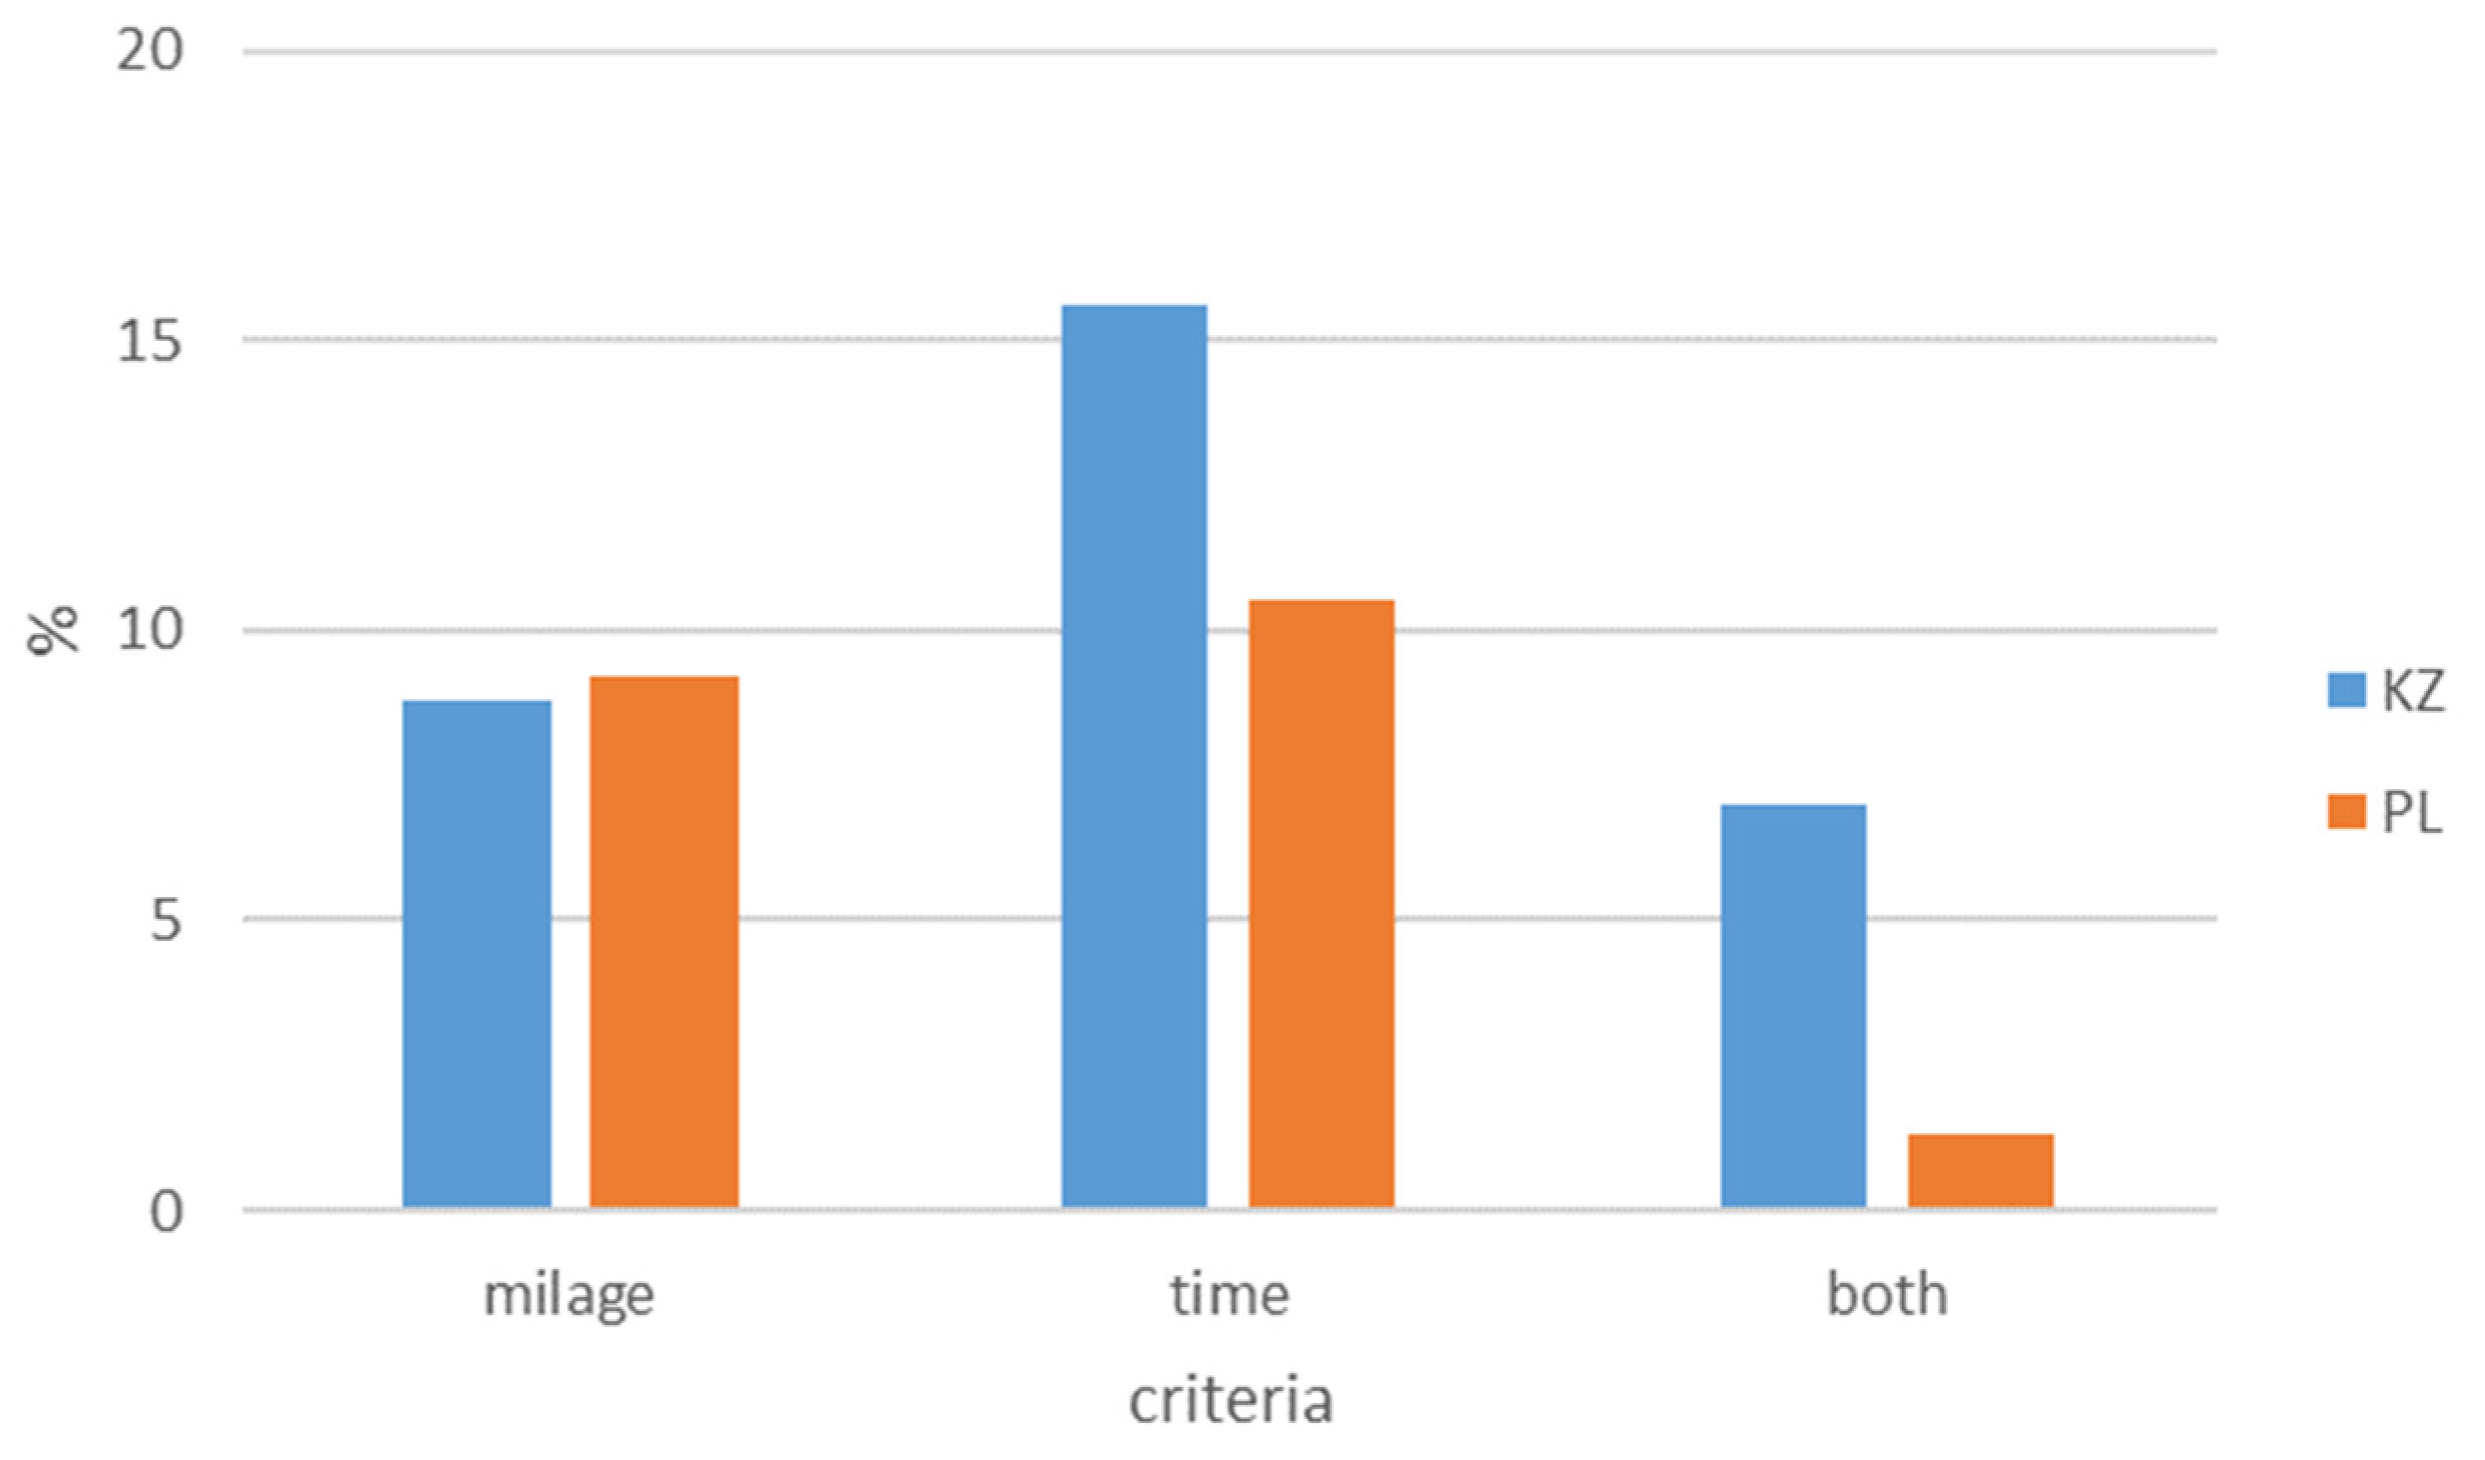
- Determining the criteria of time or mileage—which involves determining which of the parameters will be exceeded first—days (365 days in the case of Kazakh cars and 730 days for Polish cars), or the hypothetical exceeding of the mileage limit (15,000 km for Kazakh cars or 30,000 km for Polish cars).
- Determining the correct inspection time (the difference in days between when the inspection should be carried out as opposed to when the inspection was actually performed) according to the proper criterion. If the time criterion was selected, the average number of days had to be subtracted from the prescribed service deadlines: 365 days for Kazakh vehicles and 730 days for Polish vehicles. If the mileage criterion was selected, a proportional calculation of the number of days to reach the recommended mileage (15,000 km in the case of Kazakh cars, 30,000 km in the case of Polish cars) was performed.
2.5. Determining Weather Conditions in Kazakhstan and Poland
3. Results and Discussion
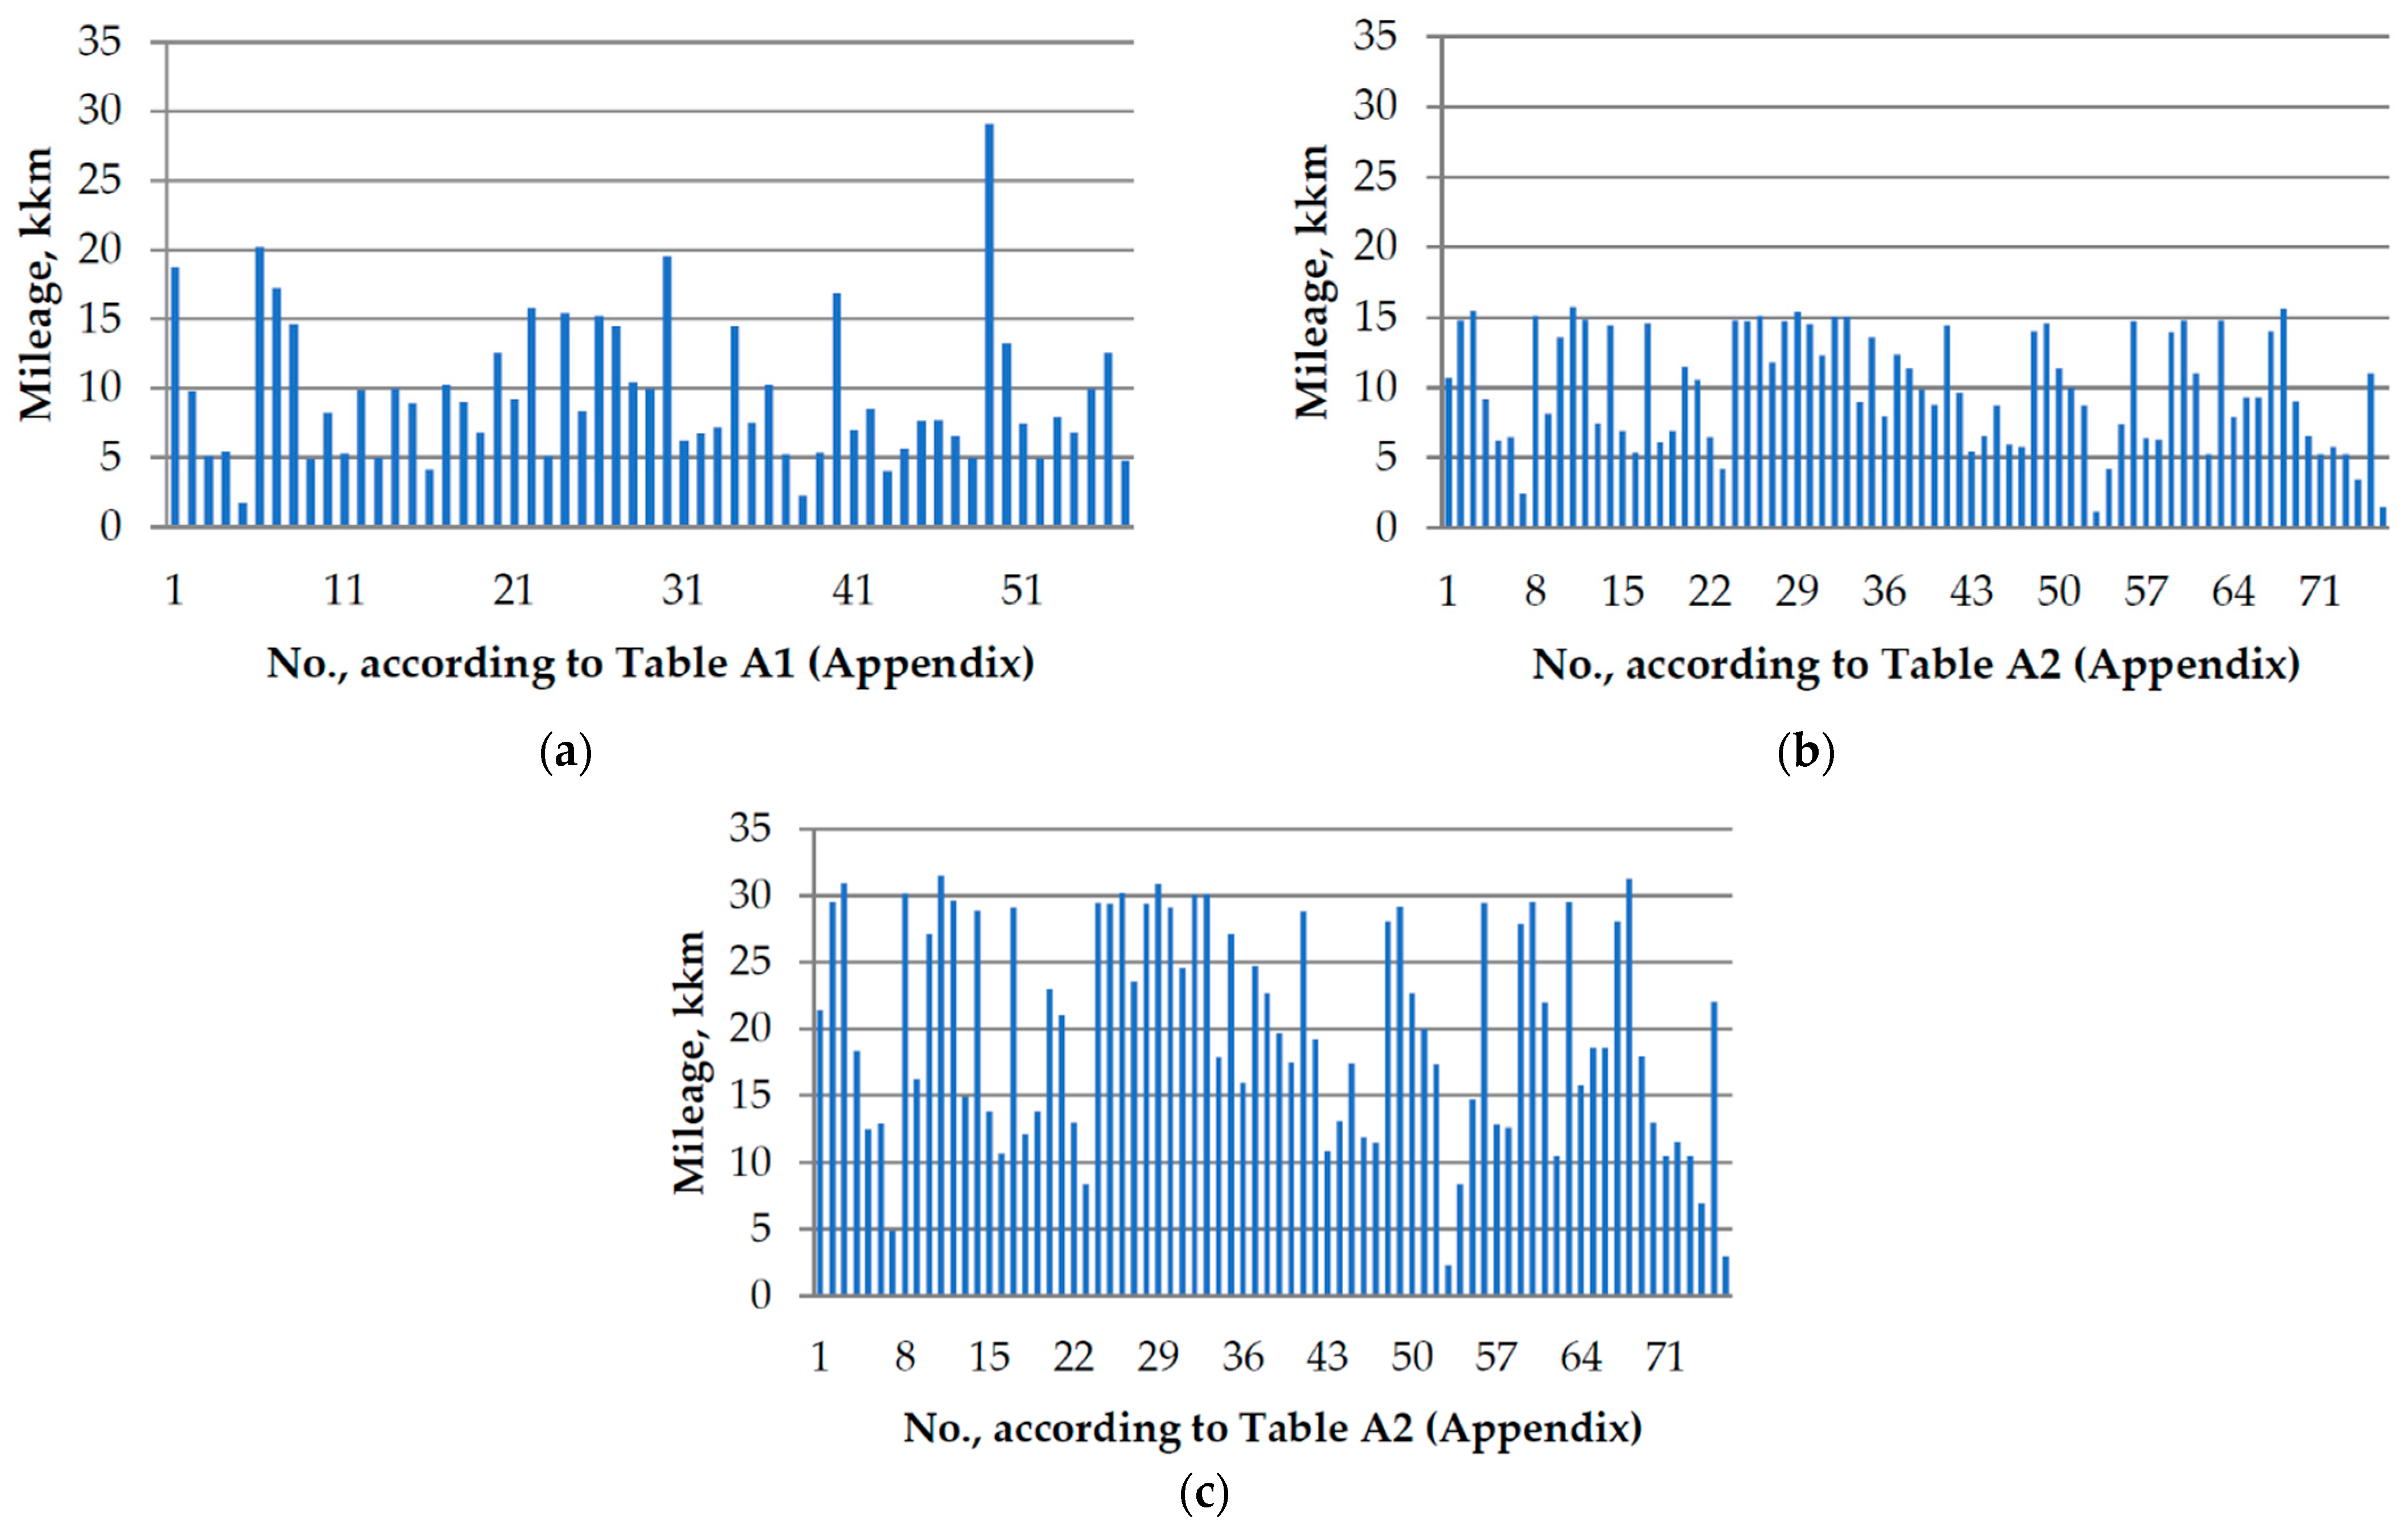
3.1. Analysis of Mileage Data and Time of the First Inspection in Kazakhstan and Poland
3.2. Analysis of the Proper Date of SI in Kazakhstan and Poland
3.3. Analysis of the Impact of Weather Conditions and Other Factors on the Frequency of First Inspections in Kazakhstan and Poland
4. Conclusions
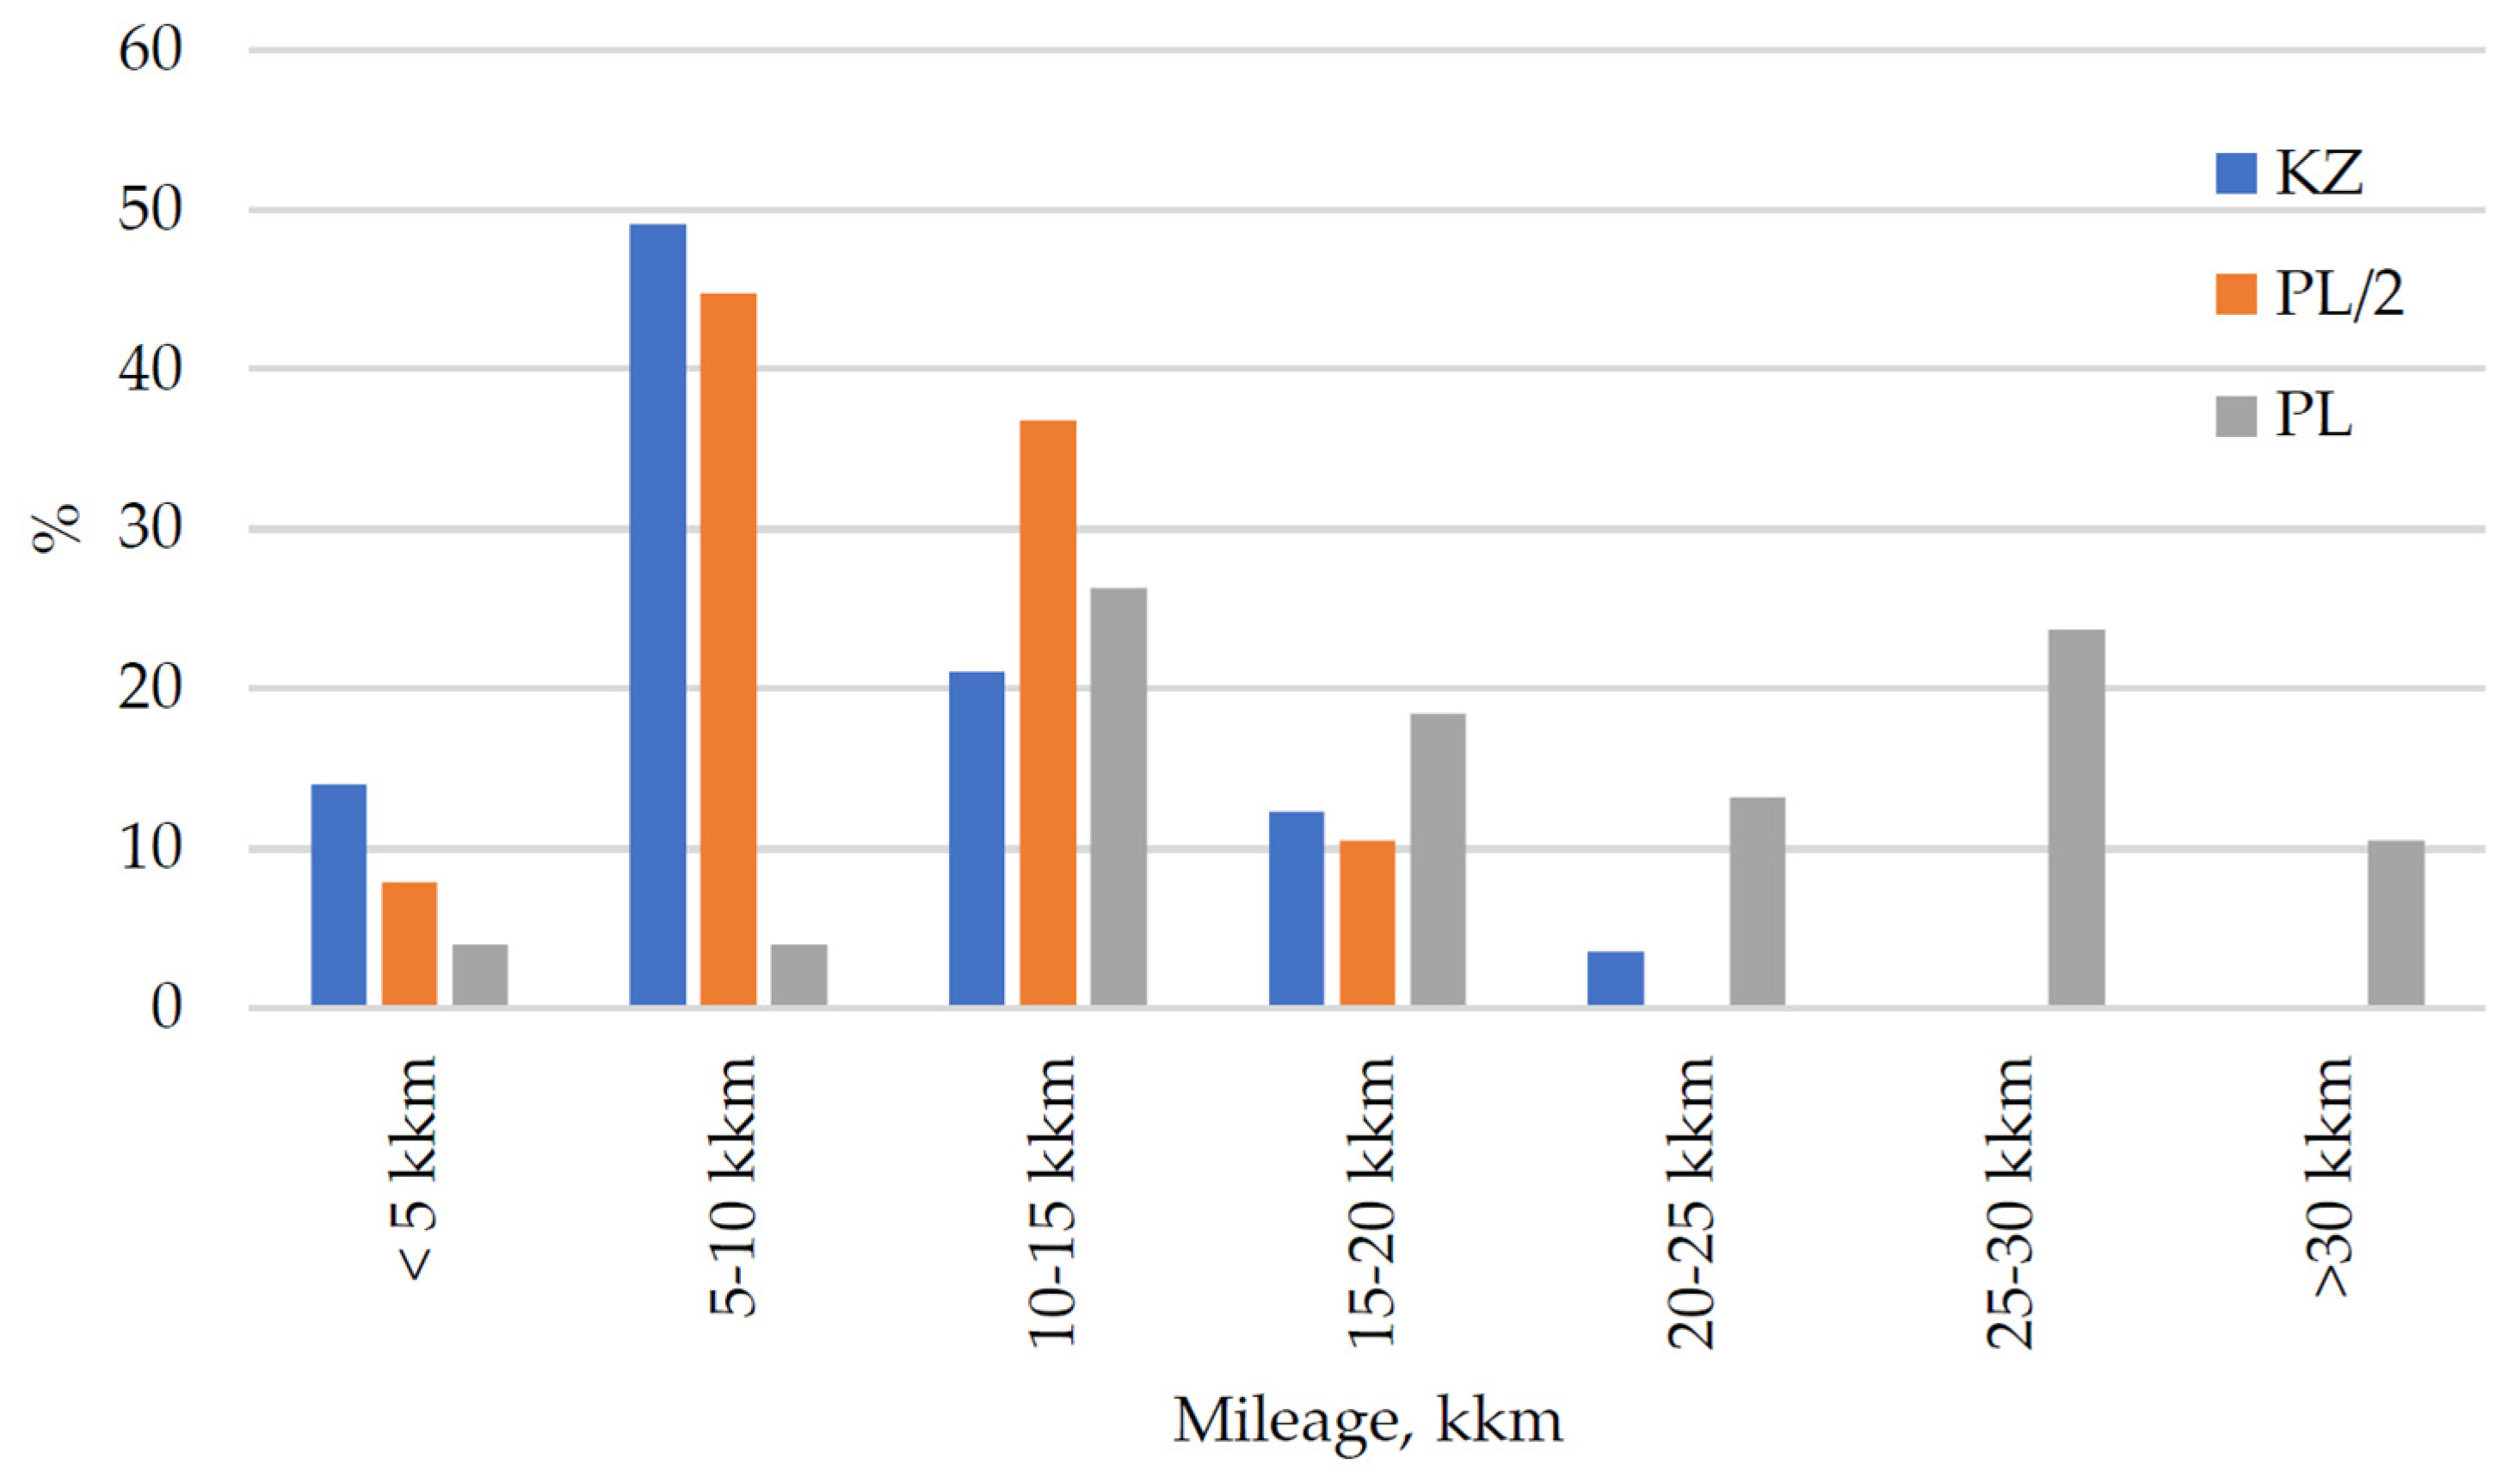
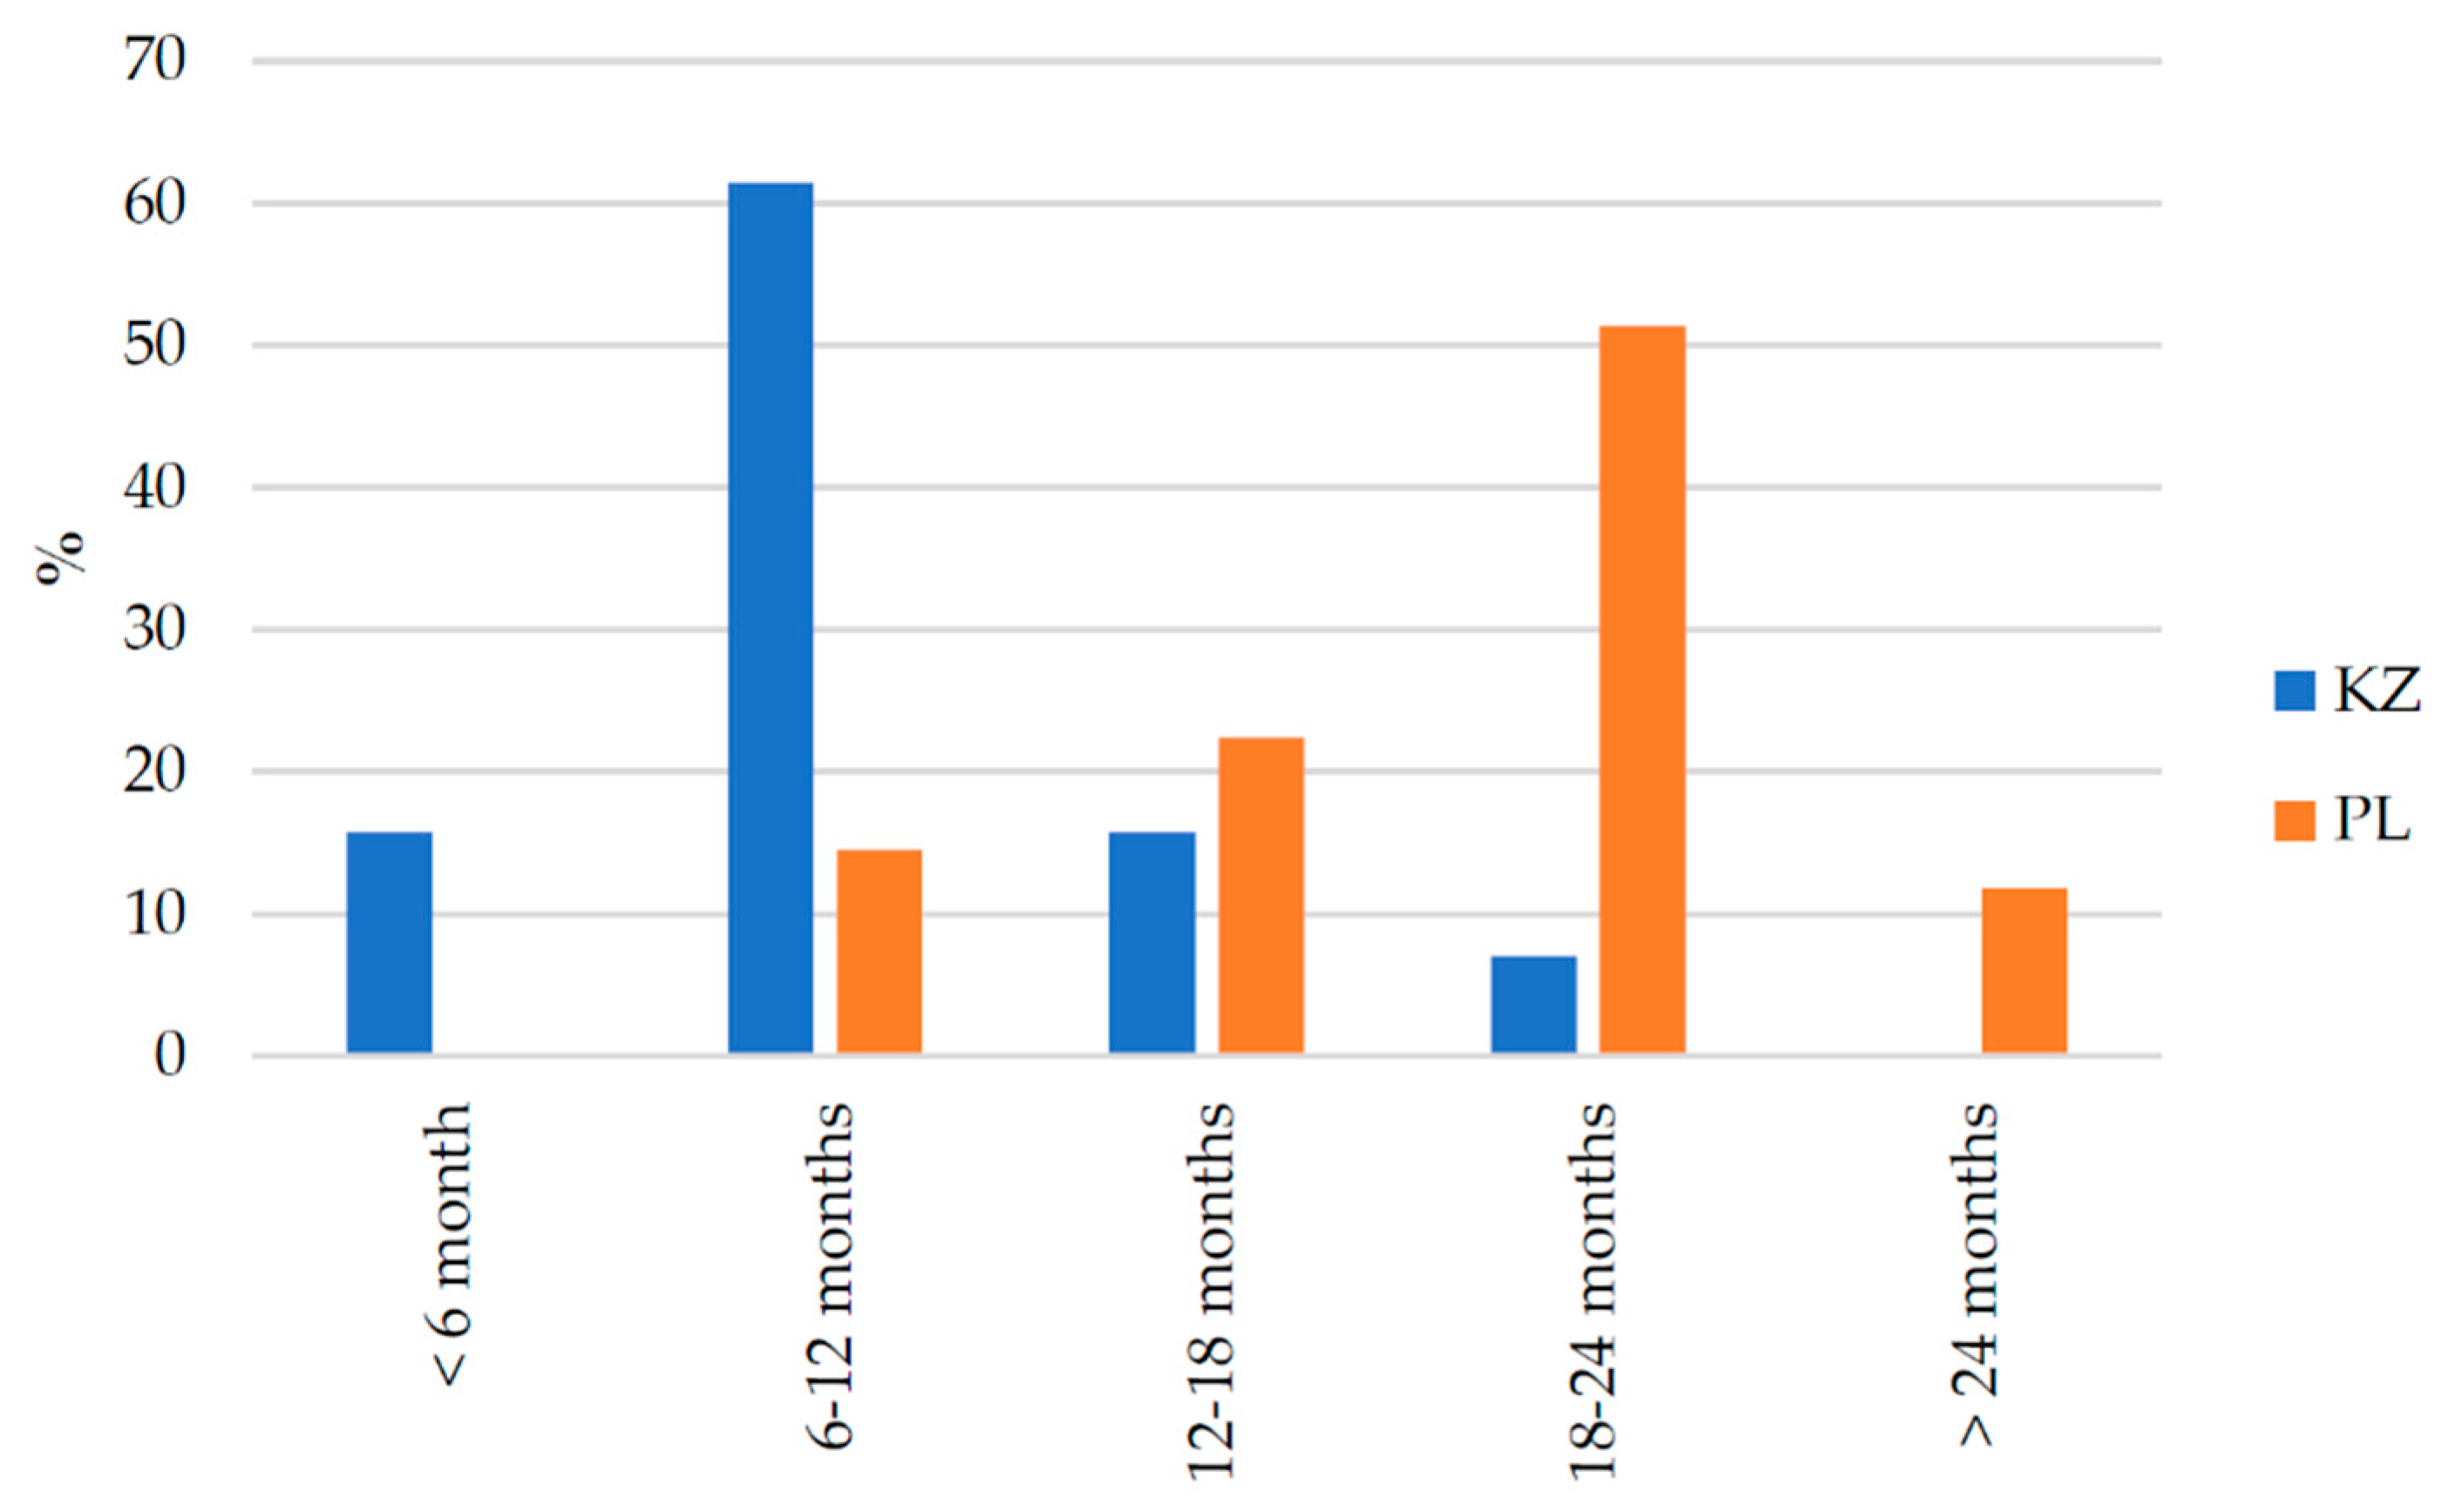
- Warranty Conditions In Kazakhstan: 31.4% of cars did not meet the warranty conditions, while in Poland, the percentage was 21.0%. The primary reason for not meeting the conditions was related to the time criterion. Based on the analysis of the mileage criterion (number of kilometers), the data reveal that 63% of drivers undergo SI before reaching 10,000 km, 21% fall within the range of 10,000 to 15,000 km, and only 16% reach values exceeding 15,000 km in Kazakhstan. On the contrary, in Poland, the distribution is different. Only 8% of drivers have their vehicles serviced before reaching 10,000 km, while a larger proportion, 26%, falls within the range of 10,000 to 15,000 km. The majority, 66%, wait until their mileage exceeds 15,000 km before undergoing vehicle servicing.
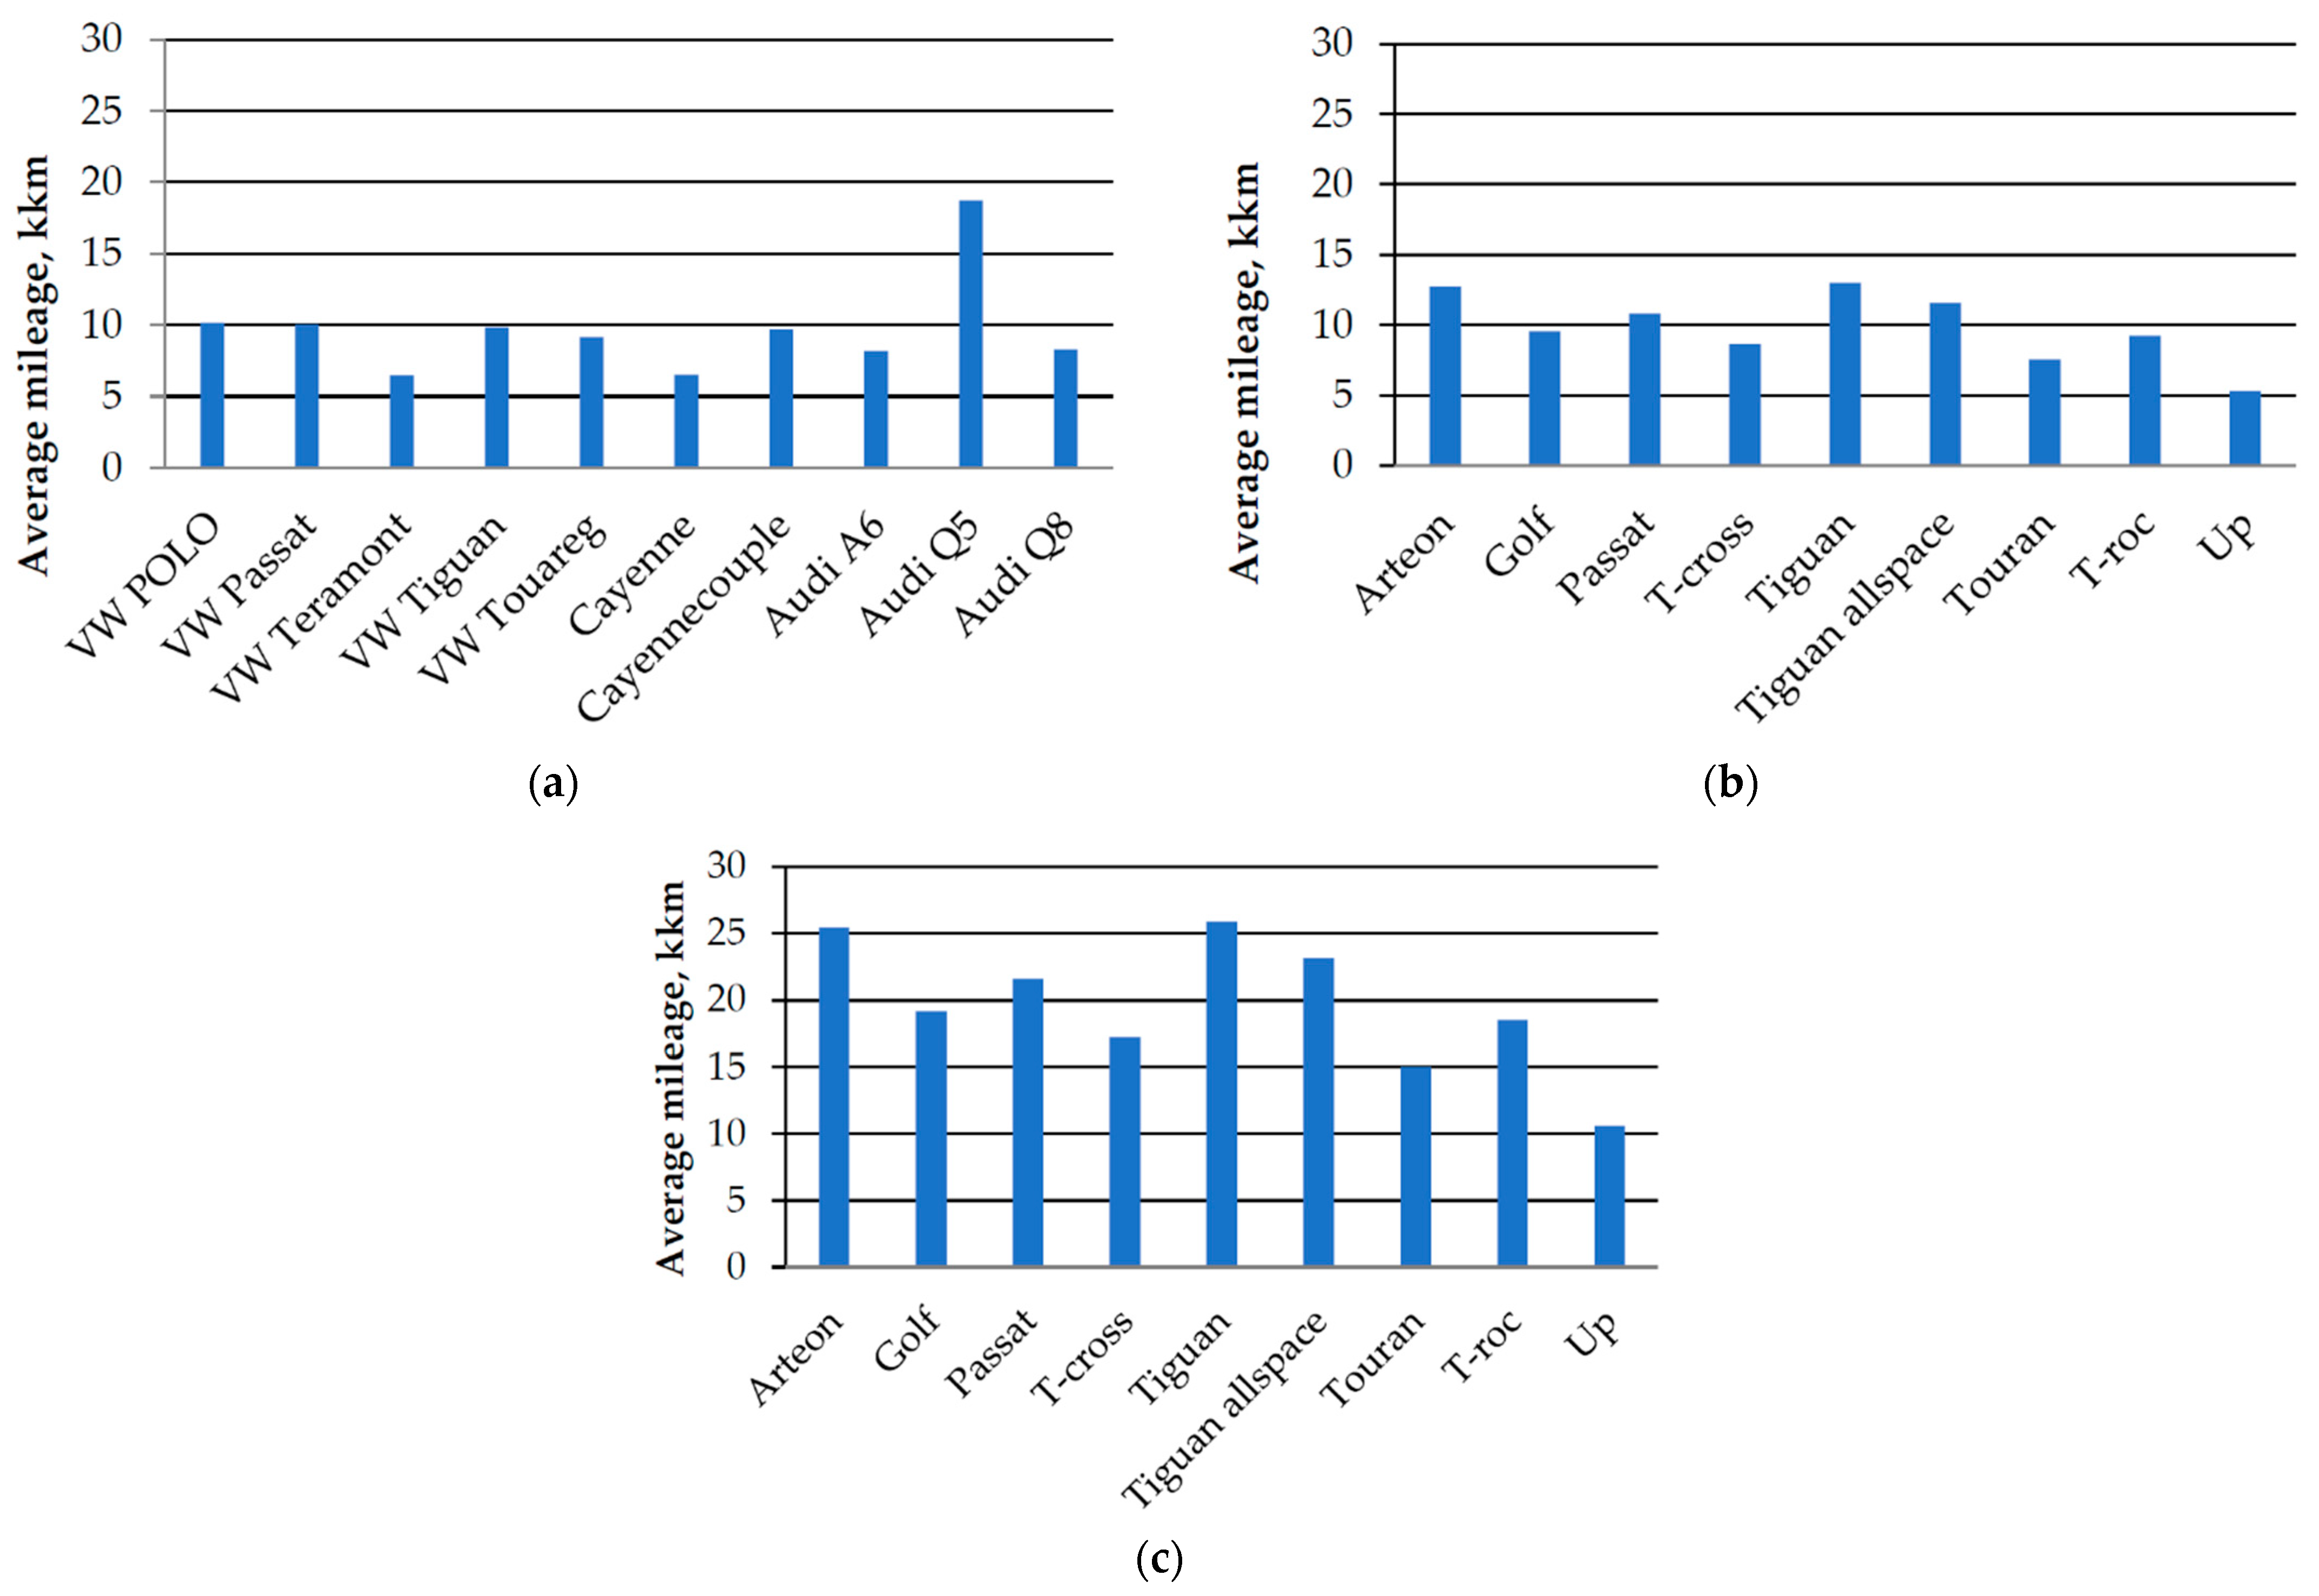
- The average mileage for the first technical service varies widely depending on the car model. In Kazakhstan, it ranges from 6462 to 18,738 km, with significant deviations observed in specific models. In Poland, the average mileage for the first technical service ranges from 10,616 to 25,926 km, indicating distinct mileage patterns across different car models.
- To facilitate data interpretation, the average mileage until the first inspection for cars in Kazakhstan was found to be 9526 km, while the average annual mileage for Polish cars (considering the half-cycle between inspections) was 10,029 km. These variations in optimal values reflect the specific characteristics and performance of each vehicle model in the Polish context. Despite the vast distances in Kazakhstan, the average mileage of Polish vehicles exceeds that of Kazakhstani vehicles. The data indicate that Polish drivers tend to accumulate higher mileage before undergoing vehicle servicing, as reflected in the larger proportion of vehicles reaching or exceeding the 15,000 km mark.
- As seen in Table 2, vehicles in operation in Poland do not exhibit negative values in the calculated intervals between average and estimated maintenance, suggesting a more consistent approach to maintenance scheduling compared to the varied patterns observed in Kazakhstan.
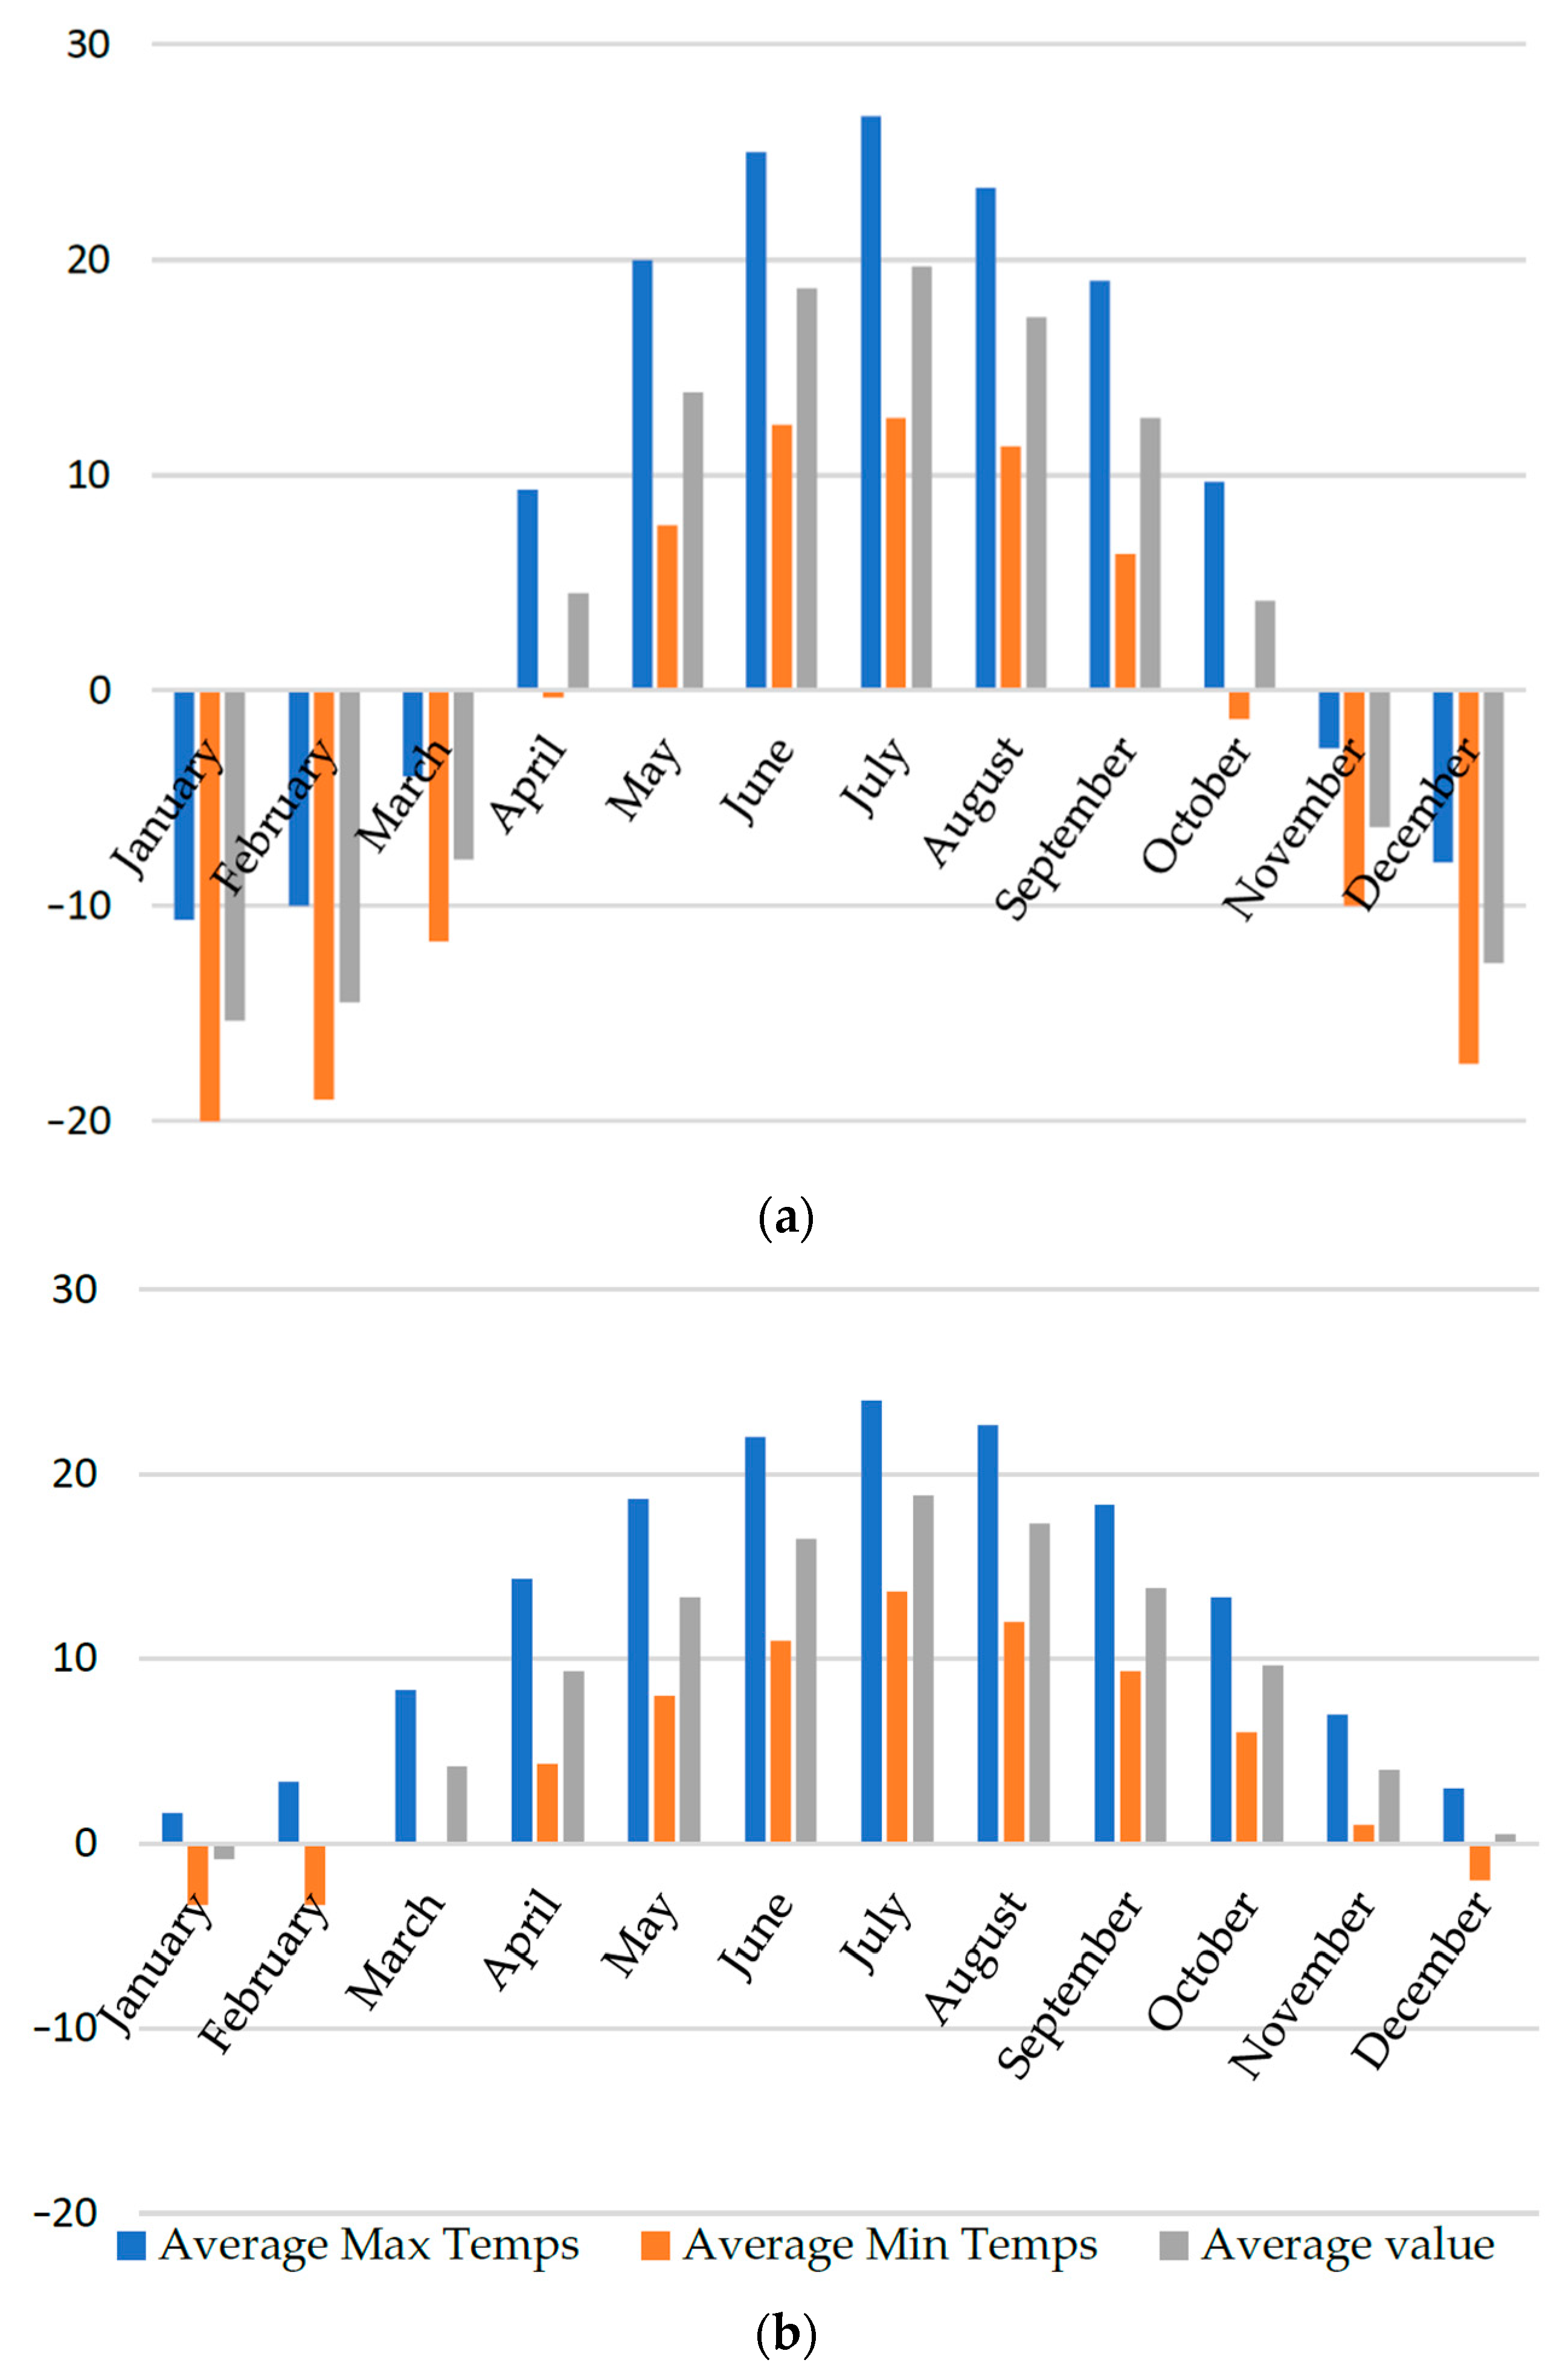
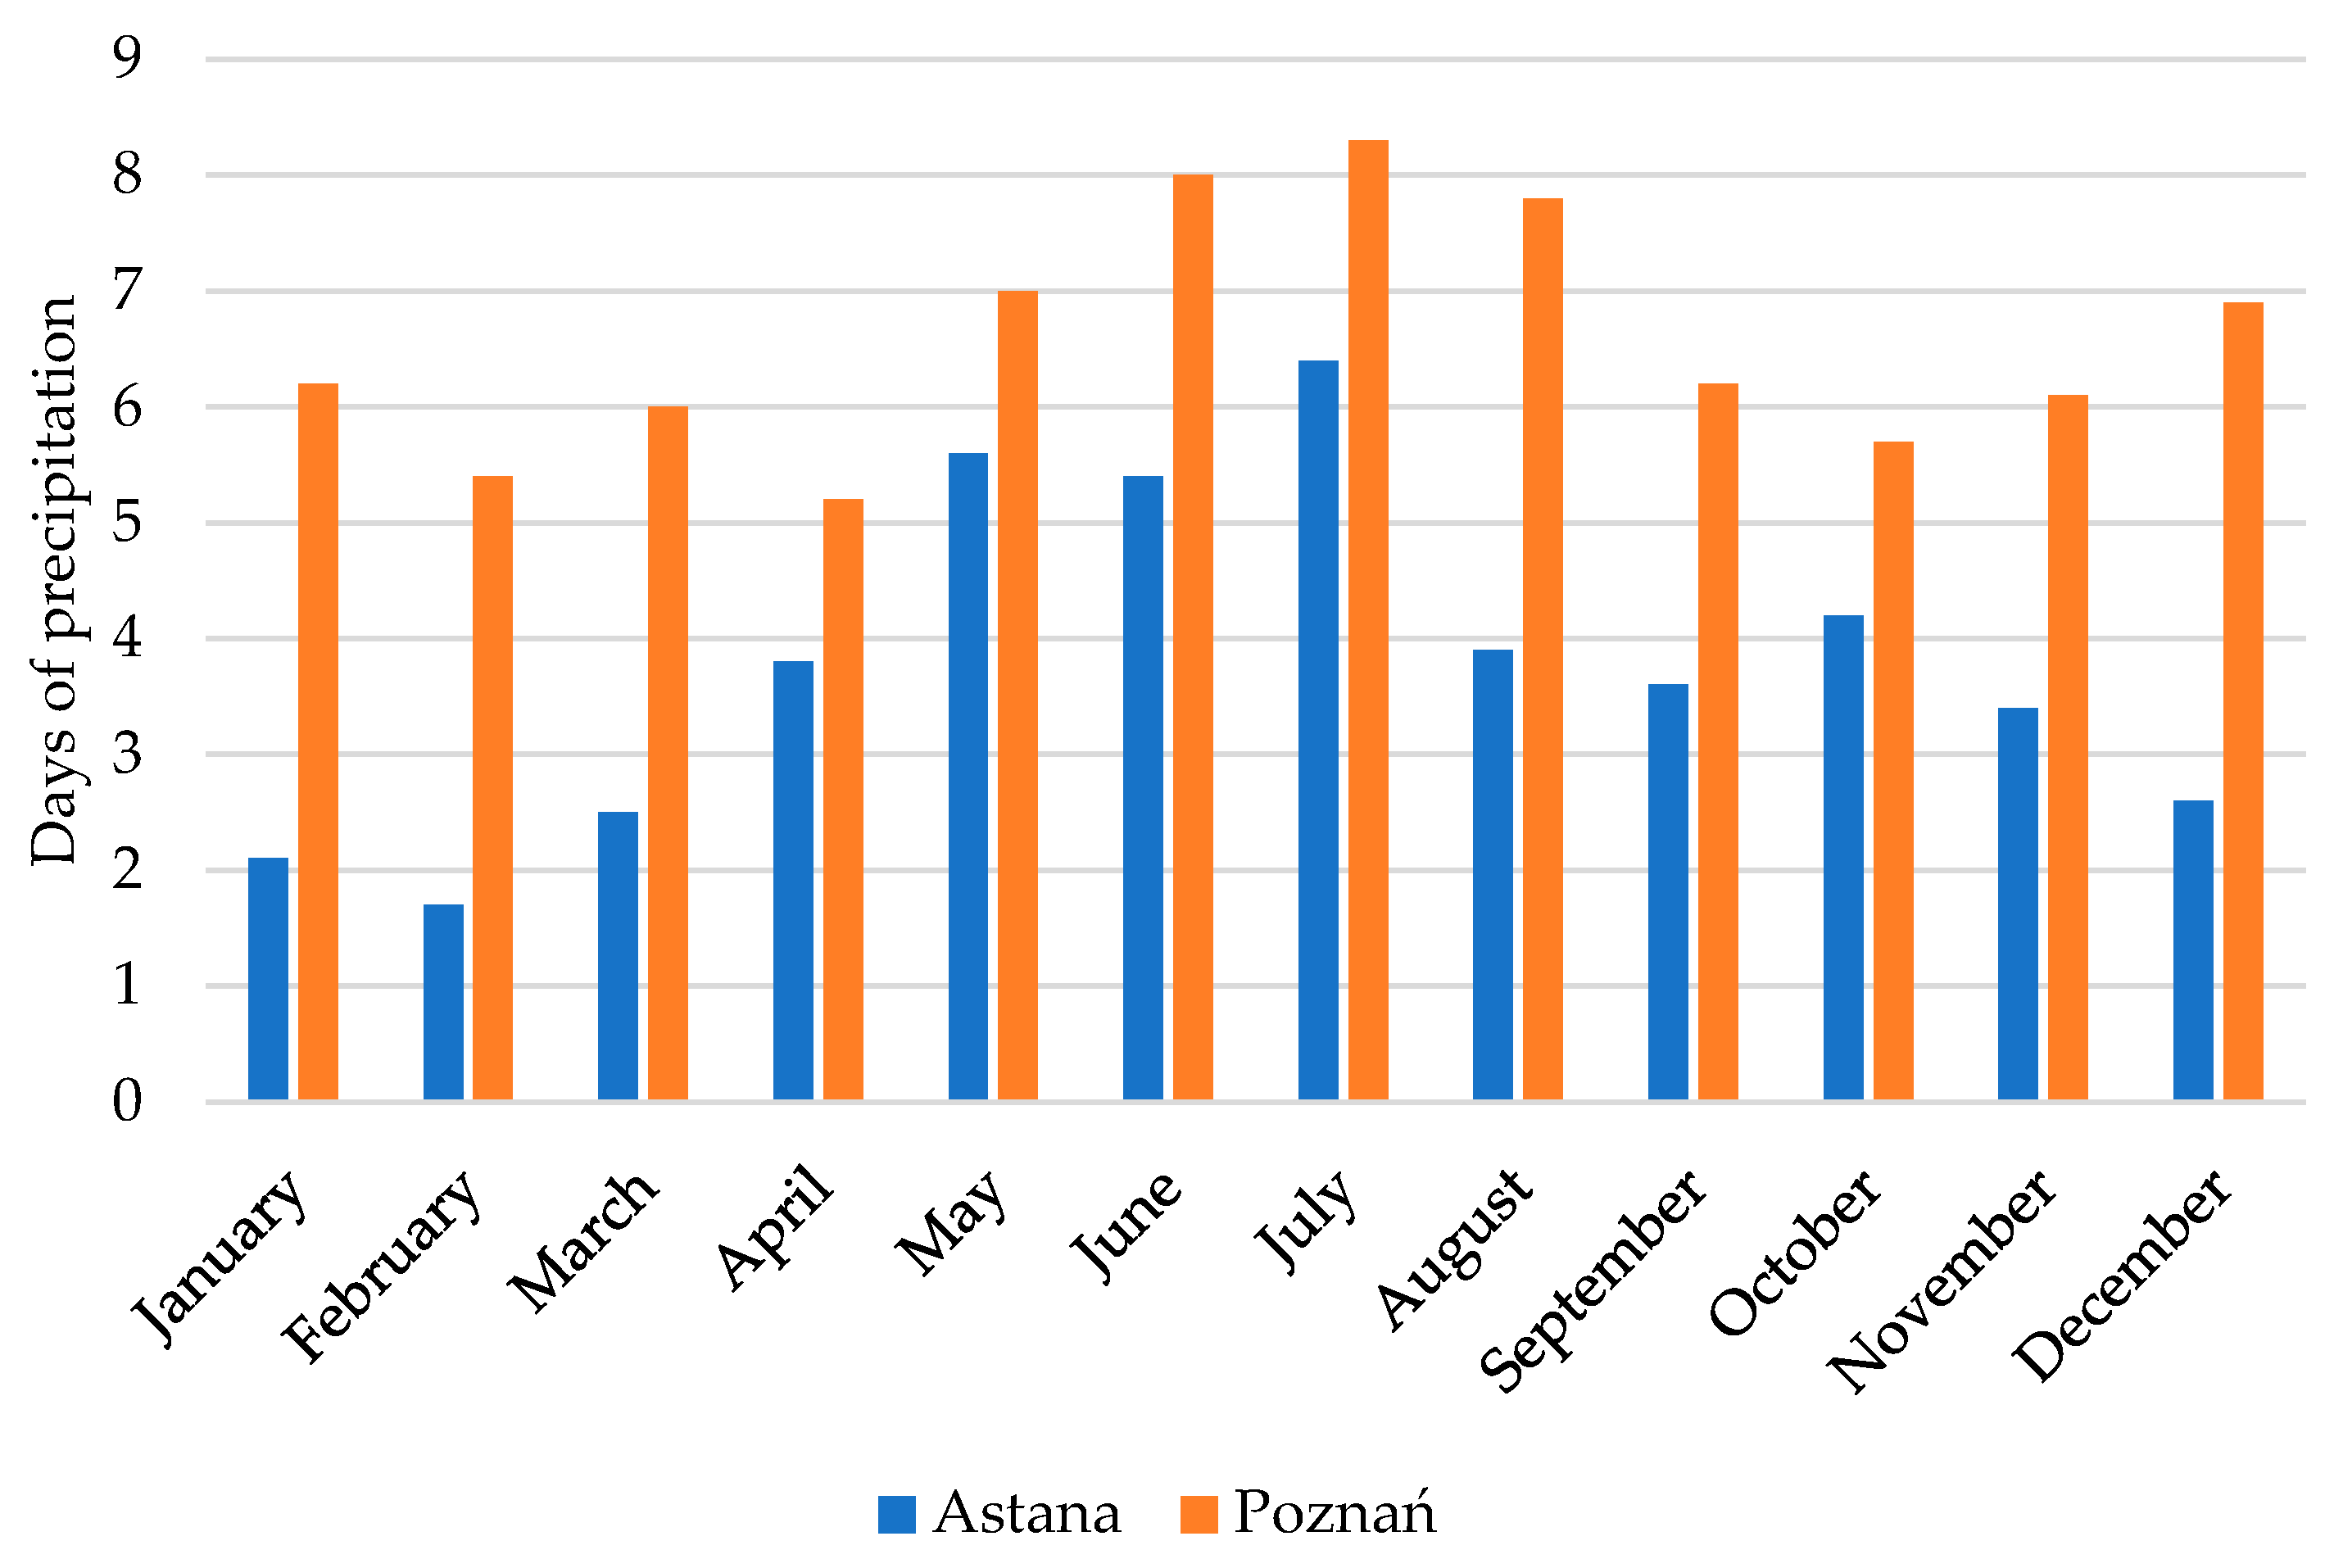
- Considering the impact of climate, humidity, driving style, and road quality on vehicle maintenance, it becomes evident that the combination of factors in each country can significantly influence the service intervals and maintenance requirements for vehicles. In Poland, favorable road conditions and drivers’ adherence to traffic regulations may contribute to relatively predictable wear patterns on vehicles. Conversely, in Kazakhstan, the diverse road quality and driving styles may lead to varying degrees of mechanical stress on vehicles, necessitating a more nuanced approach to maintenance scheduling. Additionally, it is necessary to consider that low temperatures can lead to increased strain on the engine and battery, while high temperatures can accelerate tire wear and affect the efficiency of cooling systems. Understanding the climate conditions of a specific area is crucial in determining the optimal service intervals for vehicles and ensuring their continued reliability. Moreover, humidity levels can affect the overall comfort and safety of the driving experience, making it essential to consider these factors when evaluating service intervals and maintenance requirements.
Author Contributions
Funding
Data Availability Statement
Acknowledgments
Conflicts of Interest
Appendix A

| Days from Sale to SI-1 | Date of SI-1 | Mileage at SI-1, km | Date of Sale | Model | Brand | No. |
|---|---|---|---|---|---|---|
| 596 | 2019.05.18 | 18,742 | 2017.09.22 | A6 | Audi | 1 |
| 438 | 2022.08.17 | 9786 | 2021.05.29 | A6 | Audi | 2 |
| 253 | 2022.12.13 | 5134 | 2022.03.31 | A6 | Audi | 3 |
| 157 | 2022.09.05 | 5412 | 2022.03.28 | A6 | Audi | 4 |
| 78 | 2022.06.18 | 1741 | 2022.03.31 | A6 | Audi | 5 |
| 235 | 2014.01.28 | 20,221 | 2013.06.03 | Q5 | Audi | 6 |
| 335 | 2014.02.09 | 17,256 | 2013.03.04 | Q5 | Audi | 7 |
| 194 | 2015.10.28 | 14,687 | 2015.04.14 | Q8 | Audi | 8 |
| 278 | 2019.12.08 | 4920 | 2019.02.28 | Q8 | Audi | 9 |
| 267 | 2021.02.13 | 8217 | 2020.05.16 | Q8 | Audi | 10 |
| 400 | 2021.07.28 | 5284 | 2020.06.18 | Q8 | Audi | 11 |
| 222 | 2020.12.28 | 9894 | 2020.05.16 | Q8 | Audi | 12 |
| 363 | 2021.05.10 | 4997 | 2020.05.07 | Q8 | Audi | 13 |
| 310 | 2021.12.05 | 10,000 | 2021.01.25 | Q8 | Audi | 14 |
| 331 | 2021.10.26 | 8910 | 2020.11.25 | Cayenne | Porsche | 15 |
| 377 | 2022.11.08 | 4125 | 2021.10.21 | Cayenne | Porsche | 16 |
| 273 | 2019.12.30 | 10,258 | 2019.03.27 | Cayenne coupe | Porsche | 17 |
| 554 | 2020.11.14 | 9001 | 2019.04.30 | Cayenne coupe | Porsche | 18 |
| 570 | 2021.08.30 | 12,558 | 2020.12.25 | Cayenne coupe | Porsche | 19 |
| 245 | 2021.08.31 | 6848 | 2020.01.30 | Cayenne coupe | Porsche | 20 |
| 344 | 2018.12.13 | 9235 | 2017.12.29 | Passat | Volkswagen | 21 |
| 347 | 2018.12.10 | 15,836 | 2017.12.23 | Passat | Volkswagen | 22 |
| 439 | 2022.02.19 | 5116 | 2020.11.30 | Passat | Volkswagen | 23 |
| 290 | 2018.11.17 | 15,223 | 2017.07.28 | Polo | Volkswagen | 24 |
| 291 | 2020.12.08 | 14,510 | 2019.10.31 | Polo | Volkswagen | 25 |
| 469 | 2020.11.19 | 10,458 | 2019.11.30 | Polo | Volkswagen | 26 |
| 398 | 2021.02.19 | 10,015 | 2020.05.29 | Polo | Volkswagen | 27 |
| 349 | 2021.06.16 | 19,532 | 2020.04.21 | Polo | Volkswagen | 28 |
| 260 | 2021.03.29 | 6258 | 2020.05.31 | Polo | Volkswagen | 29 |
| 415 | 2021.02.04 | 6767 | 2020.05.31 | Polo | Volkswagen | 30 |
| 299 | 2021.04.09 | 7188 | 2020.09.14 | Polo | Volkswagen | 31 |
| 244 | 2021.06.12 | 14,477 | 2020.11.30 | Polo | Volkswagen | 32 |
| 205 | 2021.12.22 | 7520 | 2021.01.30 | Polo | Volkswagen | 33 |
| 192 | 2021.11.20 | 15,452 | 2021.01.31 | Polo | Volkswagen | 34 |
| 322 | 2021.12.09 | 10,258 | 2021.02.23 | Polo | Volkswagen | 35 |
| 286 | 2021.12.25 | 5259 | 2021.05.31 | Polo | Volkswagen | 36 |
| 205 | 2022.06.18 | 2289 | 2021.07.22 | Polo | Volkswagen | 37 |
| 326 | 2022.03.04 | 5370 | 2021.09.06 | Polo | Volkswagen | 38 |
| 178 | 2021.12.18 | 16,877 | 2021.01.26 | Polo | Volkswagen | 39 |
| 322 | 2022.10.08 | 7000 | 2022.02.28 | Polo | Volkswagen | 40 |
| 218 | 2022.12.21 | 8371 | 2022.02.28 | Polo | Volkswagen | 41 |
| 209 | 2020.05.29 | 8553 | 2019.10.31 | Teramont | Volkswagen | 42 |
| 363 | 2021.03.16 | 4000 | 2020.03.13 | Teramont | Volkswagen | 43 |
| 408 | 2020.12.13 | 5656 | 2019.10.25 | Teramont | Volkswagen | 44 |
| 140 | 2023.05.11 | 7642 | 2022.12.21 | Teramont | Volkswagen | 45 |
| 173 | 2017.12.20 | 7682 | 2017.06.27 | Tiguan | Volkswagen | 46 |
| 143 | 2019.01.27 | 6523 | 2018.09.04 | Tiguan | Volkswagen | 47 |
| 230 | 2020.01.20 | 5012 | 2019.05.31 | Tiguan | Volkswagen | 48 |
| 622 | 2021.11.12 | 29,134 | 2020.02.20 | Tiguan | Volkswagen | 49 |
| 302 | 2021.07.26 | 13,258 | 2020.09.24 | Tiguan | Volkswagen | 50 |
| 302 | 2022.05.15 | 7491 | 2021.07.13 | Tiguan | Volkswagen | 51 |
| 110 | 2022.01.14 | 4940 | 2021.09.24 | Tiguan | Volkswagen | 52 |
| 187 | 2022.10.07 | 7923 | 2022.03.30 | Tiguan | Volkswagen | 53 |
| 167 | 2022.05.24 | 6803 | 2021.12.07 | Tiguan | Volkswagen | 54 |
| 160 | 2021.05.29 | 10,000 | 2020.12.19 | Touareg | Volkswagen | 55 |
| 389 | 2022.04.26 | 12,548 | 2021.03.27 | Touareg | Volkswagen | 56 |
| 191 | 2022.06.07 | 4800 | 2021.11.26 | Touareg | Volkswagen | 57 |
| Days from Sale to SI-1 | Date of SI-1 | Mileage at SI-1, km | Date of Sale | Model | Brand | No. |
|---|---|---|---|---|---|---|
| 367 | 2022.06.15 | 21,401 | 2021.06.08 | Arteon | Volkswagen | 1 |
| 465 | 2022.10.10 | 29,528 | 2021.06.25 | Arteon | Volkswagen | 2 |
| 234 | 2021.10.29 | 30,925 | 2021.03.05 | Golf | Volkswagen | 3 |
| 696 | 2023.02.16 | 18,360 | 2021.03.10 | Golf | Volkswagen | 4 |
| 359 | 2022.03.23 | 12,505 | 2021.03.24 | Golf | Volkswagen | 5 |
| 720 | 2023.04.21 | 12,923 | 2021.04.21 | Golf | Volkswagen | 6 |
| 693 | 2023.04.03 | 4902 | 2021.04.30 | Golf | Volkswagen | 7 |
| 667 | 2023.03.14 | 30,182 | 2021.05.07 | Golf | Volkswagen | 8 |
| 474 | 2022.11.15 | 16,249 | 2021.07.21 | Golf | Volkswagen | 9 |
| 337 | 2022.06.28 | 27,149 | 2021.07.21 | Golf | Volkswagen | 10 |
| 527 | 2022.06.21 | 31,542 | 2021.01.04 | Passat | Volkswagen | 11 |
| 643 | 2022.10.17 | 29,634 | 2021.01.04 | Passat | Volkswagen | 12 |
| 366 | 2022.04.22 | 14,917 | 2021.04.16 | Passat | Volkswagen | 13 |
| 629 | 2023.02.27 | 28,900 | 2021.05.28 | Passat | Volkswagen | 14 |
| 720 | 2023.06.02 | 13,820 | 2021.06.02 | Passat | Volkswagen | 15 |
| 720 | 2023.08.31 | 10,703 | 2021.08.31 | Passat | Volkswagen | 16 |
| 713 | 2023.01.05 | 29,138 | 2021.01.12 | T-Cross | Volkswagen | 17 |
| 384 | 2022.02.21 | 12,181 | 2021.01.27 | T-Cross | Volkswagen | 18 |
| 716 | 2023.02.13 | 13,822 | 2021.02.17 | T-Cross | Volkswagen | 19 |
| 706 | 2023.02.09 | 22,993 | 2021.02.23 | T-Cross | Volkswagen | 20 |
| 686 | 2023.02.01 | 21,068 | 2021.03.05 | T-Cross | Volkswagen | 21 |
| 691 | 2023.06.09 | 12,956 | 2021.07.08 | T-Cross | Volkswagen | 22 |
| 441 | 2022.10.21 | 8406 | 2021.07.30 | T-Cross | Volkswagen | 23 |
| 595 | 2022.09.16 | 29,485 | 2021.01.21 | Tiguan | Volkswagen | 24 |
| 488 | 2022.06.17 | 29,391 | 2021.02.09 | Tiguan | Volkswagen | 25 |
| 417 | 2022.04.15 | 30,237 | 2021.02.18 | Tiguan | Volkswagen | 26 |
| 722 | 2023.03.13 | 23,571 | 2021.03.11 | Tiguan | Volkswagen | 27 |
| 676 | 2023.02.02 | 29,404 | 2021.03.16 | Tiguan | Volkswagen | 28 |
| 367 | 2022.03.30 | 30,853 | 2021.03.23 | Tiguan | Volkswagen | 29 |
| 722 | 2023.04.24 | 29,088 | 2021.04.22 | Tiguan | Volkswagen | 30 |
| 726 | 2023.05.10 | 24,528 | 2021.05.04 | Tiguan | Volkswagen | 31 |
| 595 | 2022.12.30 | 30,077 | 2021.05.05 | Tiguan | Volkswagen | 32 |
| 396 | 2022.07.14 | 30,126 | 2021.06.08 | Tiguan | Volkswagen | 33 |
| 725 | 2023.06.19 | 17,877 | 2021.06.14 | Tiguan | Volkswagen | 34 |
| 696 | 2023.05.20 | 27,106 | 2021.06.14 | Tiguan | Volkswagen | 35 |
| 338 | 2022.06.06 | 15,947 | 2021.06.28 | Tiguan | Volkswagen | 36 |
| 464 | 2022.10.27 | 24,707 | 2021.07.13 | Tiguan | Volkswagen | 37 |
| 714 | 2023.07.14 | 22,691 | 2021.07.20 | Tiguan | Volkswagen | 38 |
| 698 | 2023.07.21 | 19,727 | 2021.08.13 | Tiguan | Volkswagen | 39 |
| 182 | 2021.07.22 | 17,509 | 2021.01.20 | Tiguan allspace | Volkswagen | 40 |
| 452 | 2022.08.29 | 28,845 | 2021.05.27 | Tiguan allspace | Volkswagen | 41 |
| 586 | 2022.10.01 | 19,234 | 2021.02.15 | Touran | Volkswagen | 42 |
| 533 | 2022.12.29 | 10,864 | 2021.07.06 | Touran | Volkswagen | 43 |
| 553 | 2022.07.21 | 13,068 | 2021.01.08 | T-Roc | Volkswagen | 44 |
| 694 | 2022.12.15 | 17,422 | 2021.01.11 | T-Roc | Volkswagen | 45 |
| 710 | 2023.01.09 | 11,906 | 2021.01.19 | T-Roc | Volkswagen | 46 |
| 618 | 2022.10.14 | 11,522 | 2021.01.26 | T-Roc | Volkswagen | 47 |
| 710 | 2023.01.16 | 28,080 | 2021.01.26 | T-Roc | Volkswagen | 48 |
| 272 | 2021.11.10 | 29,156 | 2021.02.08 | T-Roc | Volkswagen | 49 |
| 791 | 2023.05.22 | 22,700 | 2021.03.11 | T-Roc | Volkswagen | 50 |
| 800 | 2023.06.01 | 19,986 | 2021.03.11 | T-Roc | Volkswagen | 51 |
| 718 | 2023.03.13 | 17,390 | 2021.03.15 | T-Roc | Volkswagen | 52 |
| 714 | 2023.03.10 | 2347 | 2021.03.16 | T-Roc | Volkswagen | 53 |
| 363 | 2022.03.28 | 8417 | 2021.03.25 | T-Roc | Volkswagen | 54 |
| 692 | 2023.03.02 | 14,750 | 2021.03.31 | T-Roc | Volkswagen | 55 |
| 594 | 2022.12.01 | 29,456 | 2021.04.07 | T-Roc | Volkswagen | 56 |
| 783 | 2023.06.16 | 12,850 | 2021.04.13 | T-Roc | Volkswagen | 57 |
| 706 | 2023.04.05 | 12,631 | 2021.04.19 | T-Roc | Volkswagen | 58 |
| 363 | 2022.05.09 | 27,875 | 2021.05.06 | T-Roc | Volkswagen | 59 |
| 752 | 2023.06.12 | 29,512 | 2021.05.10 | T-Roc | Volkswagen | 60 |
| 716 | 2023.05.08 | 21,987 | 2021.05.12 | T-Roc | Volkswagen | 61 |
| 594 | 2023.01.10 | 10,504 | 2021.05.16 | T-Roc | Volkswagen | 62 |
| 697 | 2023.04.26 | 29,546 | 2021.05.19 | T-Roc | Volkswagen | 63 |
| 715 | 2023.05.15 | 15,775 | 2021.05.20 | T-Roc | Volkswagen | 64 |
| 704 | 2023.05.09 | 18,579 | 2021.05.25 | T-Roc | Volkswagen | 65 |
| 485 | 2022.10.06 | 18,584 | 2021.06.01 | T-Roc | Volkswagen | 66 |
| 742 | 2023.07.06 | 28,056 | 2021.06.14 | T-Roc | Volkswagen | 67 |
| 779 | 2023.08.29 | 31,289 | 2021.06.30 | T-Roc | Volkswagen | 68 |
| 693 | 2023.07.03 | 17,971 | 2021.07.30 | T-Roc | Volkswagen | 69 |
| 708 | 2023.07.20 | 13,000 | 2021.08.02 | T-Roc | Volkswagen | 70 |
| 464 | 2022.12.08 | 10,535 | 2021.08.24 | T-Roc | Volkswagen | 71 |
| 225 | 2022.04.09 | 11,587 | 2021.08.24 | T-Roc | Volkswagen | 72 |
| 362 | 2022.03.14 | 10,500 | 2021.03.12 | Up | Volkswagen | 73 |
| 382 | 2022.05.19 | 6930 | 2021.04.27 | Up | Volkswagen | 74 |
| 717 | 2023.05.08 | 22,038 | 2021.05.11 | Up | Volkswagen | 75 |
| 365 | 2022.06.30 | 2998 | 2021.06.25 | Up | Volkswagen | 76 |
References
- Danilecki, K.; Eliasz, J.; Smurawski, P.; Stanek, W.; Szlęk, A. Modeling inventory and environmental impacts of car maintenance and repair: A case study of Ford Focus passenger car. J. Clean. Prod. 2021, 315, 128085. [Google Scholar] [CrossRef]
- Meckel, S. Optimized Automotive Fault-Diagnosis based on Knowledge Extraction from Web Resources. In Proceedings of the IEEE International Conference on Emerging Technologies and Factory Automation-ETFA, Zaragoza, Spain, 10–13 September 2019; pp. 1261–1264. [Google Scholar]
- Kamlu, S.; Laxmi, V. An Effective Method for Maintenance Scheduling of Vehicles Using Neural Network. In Proceedings of the International Conference on Microelectronics, Computing & Communication Systems; Lecture Notes in Electrical Engineering; Springer Nature: Singapore, 2018; pp. 51–66. [Google Scholar] [CrossRef]
- Ramere, M.D.; Laseinde, O.T. Optimization of condition-based maintenance strategy-prediction for ageing automotive industrial equipment using FMEA. Procedia Comput. Sci. 2021, 180, 229–238. [Google Scholar] [CrossRef]
- Kamlu, S.; Laxmi, V. Condition-based maintenance strategy for vehicles using hidden Markov models. Adv. Mech. Eng. 2019, 11, 13. [Google Scholar] [CrossRef]
- Sun, Z.H.; Guo, Y.; Sun, Z.; Yang, S.; Hao, B. Maintenance cost prediction for the vehicle based on maintenance data. Proc. Inst. Mech. Eng. Part D J. Automob. Eng. 2023, 7. early access. [Google Scholar] [CrossRef]
- Khaliullin, F.; Akhmetzyanov, R.; Arslanov, F.; Caview, A. Methodology for Determining Standards of Technical Operation of Vehicles Taking into Account Their Technical Condition. In Proceedings of the International Scientific Conference Engineering for Rural Development, Jelgava, Latvia, 26–28 May 2021; pp. 912–918. [Google Scholar] [CrossRef]
- Available online: https://naceks.kz/services/technicheskiy-osmotr-avtotransporta/ (accessed on 12 January 2023).
- Martinod, R.M.; Bistorin, O.; Castañeda, L.F.; Rezg, N. Maintenance policy optimisation for multi-component systems considering degradation of components and imperfect maintenance actions. Comput. Ind. Eng. 2018, 124, 100–112. [Google Scholar] [CrossRef]
- Xie, M.J.; Tian, Z.G. Risk-based pipeline re-assessment optimization considering corrosion defects. Sustain. Cities Soc. 2018, 38, 746–757. [Google Scholar] [CrossRef]
- Le Vine, S.; Polak, J. The impact of free-floating carsharing on car ownership: Early-stage findings from London. Transp. Policy 2019, 75, 119–127. [Google Scholar] [CrossRef]
- Hussain, S.; Mahmud, U.; Yang, S.K. Car e-Talk: An IoT-Enabled Cloud-Assisted Smart Fleet Maintenance System. IEEE Internet Things J. 2021, 8, 9484–9494. [Google Scholar] [CrossRef]
- Varuvel, A.G.; Prasath, R. Software Driven Optimal Design for Maintenance Man Hour. In Mining Intelligence and Knowledge Exploration; Artificial Intelligence; Springer Nature: Cham, Switzerland, 2018; pp. 148–167. [Google Scholar] [CrossRef]
- Wang, Y.L.; Limmer, S.; Van Nguyen, D.; Olhofer, M.; Bäck, T.; Emmerich, M. Optimizing the maintenance schedule for a vehicle fleet: A simulation-based case study. Eng. Optim. 2022, 54, 1258–1271. [Google Scholar] [CrossRef]
- Szkoda, M.; Kaczor, G.; Pilch, R.; Smolnik, M.; Konieczek, Z. Assessment of the influence of preventive maintenance on the reliability and availability indexes of diesel locomotives. Transp. Probl. 2021, 16, 5–19. [Google Scholar] [CrossRef]
- Wang, Y.L.; Limmer, S.; Olhofer, M.; Emmerich, M.; Bäck, T. Automatic preference based multi-objective evolutionary algorithm on vehicle fleet maintenance scheduling optimization. Swarm Evol. Comput. 2021, 65, 100933. [Google Scholar] [CrossRef]
- Ilgin, M.A.; Tunali, S. Joint optimization of spare parts inventory and maintenance policies using genetic algorithms. Int. J. Adv. Manuf. Technol. 2007, 34, 594–604. [Google Scholar] [CrossRef]
- Gardner, J. Driving with Data in the Motor City: Understanding and Predicting Fleet Maintenance Patterns. In Proceedings of the 7th IEEE International Conference on Data Science and Advanced Analytics (DSAA), Sydney, Australia, 6–9 October 2020; pp. 380–389. [Google Scholar] [CrossRef]
- Aldurgam, M.M.; Elshafei, M. Optimal Maintenance Scheduling of N-Vehicles with Time-Varying Reward Functions and Constrained Maintenance Decisions. In Operations Research Proceedings; Springer: Berlin/Heidelberg, Germany, 2011; pp. 379–384. [Google Scholar] [CrossRef]
- Herberth, R.; Korper, S. Automated Scheduling for Optimal Parallelization to Reduce the Duration of Vehicle Software Updates. IEEE Trans. Veh. Technol. 2019, 68, 2921–2933. [Google Scholar] [CrossRef]
- Chang, F.; Dong, M.; Liu, M.; Wang, L.; Duan, Y. A Lightweight Appearance Quality Assessment System Based on Parallel Deep Learning for Painted Car Body. Trans. Instrum. Meas. 2020, 69, 5298–5307. [Google Scholar] [CrossRef]
- Soltanali, H.; Rohani, A.; Abbaspour-Fard, M.H.; Farinha, J.T. A comparative study of statistical and soft computing techniques for reliability prediction of automotive manufacturing. Appl. Soft Comput. 2021, 98, 106738. [Google Scholar] [CrossRef]
- Pandit, D.; Sharma, D. Expected service dimensions and service levels for paratransit considering future mobility needs in emerging countries. Transp. Res. Part A Policy Pract. 2022, 162, 1–13. [Google Scholar] [CrossRef]
- Dayawantha, A.J.M.; Premaratne, I.A. Vehicle Service Date Prediction System Using Lubricant Viscosity Degradation Pattern. In Proceedings of the 2017 International Conference on Computer, Communications and Electronics (Comptelix), Jaipur, India, 1–2 July 2017; pp. 403–407. [Google Scholar]
- Jiang, Y.; Liu, A.R.; Song, G.H.; Yin, H.; Zhai, Z.Q.; Wu, Y.Z.; Yu, L. Effect of cold start and vehicle trip characteristics on spatio-temporal distribution of vehicle emissions. Int. J. Sustain. Transp. 2023, 17, 1047–1057. [Google Scholar] [CrossRef]
- Shah, R.; Tung, S.; Chen, R.; Miller, R. Grease Performance Requirements and Future Perspectives for Electric and Hybrid Vehicle Applications. Lubricants 2021, 9, 16. [Google Scholar] [CrossRef]
- Zuska, A.; Wieckowski, D.; Frej, D. A Comparative Study of Vehicle Absorbers. In Proceedings of the 2018 Xi International Science-Technical Conference Automotive Safety, Žastá, Slovakia, 18–20 April 2018. 6p. [Google Scholar]
- Zhang, X.C.; Liu, Q.X.; Jiang, L. Implementation of Corrosion Prevention Practices for Ground Vehicles. In Proceedings of the 2016 6th International Conference on Applied Science, Engineering and Technology (ICASET), Qingdao, China, 29–30 May 2016; Volume 77, pp. 286–289. [Google Scholar]
- Aziz, M.; Oda, T. Simultaneous quick-charging system for electric vehicle. Energy Procedia 2017, 142, 1811–1816. [Google Scholar] [CrossRef]
- Abidin, S.F.Z.; Khalid, A.; Shafie, S.; Zahari, I.; Jalal, R.I.A. Vehicle Fuel Economy Improvement through Vehicle Optimization in 1-D Simulation Cycle towards Energy Efficient Vehicle (EEV). Int. J. Integr. Eng. 2020, 12, 365–375. [Google Scholar]
- Volkswagen Centre Astana. Available online: https://volkswagen-astana.kz/oficialnyj-servis-volkswagen/1685-2/ (accessed on 12 January 2024).
- Caban, J.; Droździel, P.; Krzywonos, L.; Rybicka, I.; Šarkan, B.; Vrábel, J. Statistical Analyses of Selected Maintenance Parameters of Vehicles of Road Transport Companies. Adv. Sci. Technol. Res. J. 2019, 13, 1–13. [Google Scholar] [CrossRef]
- Pipicelli, M.; Gimelli, A.; Sessa, B.; De Nola, F.; Toscano, G.; Di Blasio, G. Architecture and Potential of Connected and Autonomous Vehicles. Vehicles 2024, 6, 275–304. [Google Scholar] [CrossRef]
- Ferreira, C.; Silva, A.; de Brito, J.; Dias, I.S.; Flores-Colen, I. Optimization of Inspection Period in Natural Stone Claddings. Appl. Sci. 2020, 10, 8236. [Google Scholar] [CrossRef]
- Raimbekov, Z.; Syzdykbayeva, B. Assessing the impact of transport and logistics on economic growth in emerging economies: A case study for the conditions of the republic of Kazakhstan. Transp. Probl. 2021, 16, 199–211. [Google Scholar] [CrossRef]
- Shakhmov, Z.; Hafiz, K. Analysis of the study of the state of highways, taking into account the freezing and thawing of the roadbed in the climatic conditions of Kazakhstan. Bulletin of KazATK 2021, 119, 7–13. [Google Scholar]
- Borken-Kleefeld, J.; Berntsen, T.; Fuglestvedt, J. Specific Climate Impact of Passenger and Freight Transport. Environ. Sci. Technol. 2010, 44, 5700–5706. [Google Scholar] [CrossRef] [PubMed]
- Serikbayeva, G.K. Providing and using high-quality motor fuel for transport equipment. Gylym Zhane Bilim 2023, 2, 466–474. [Google Scholar]
- Senin, P.V.; Galin, D.A.; Krush, L.O. Using Diagnostics to Research the Operational Reliability of Electronic Engine Control Systems of Skoda Car. Eng. Technol. Syst. 2022, 32, 235–248. [Google Scholar] [CrossRef]
- Glavas, H.; Kljajin, M.; Desnica, E. Essential Preventive Automobile Maintenance during a Pandemic. Teh. Vjesn.-Tech. Gaz. 2021, 28, 2190–2199. [Google Scholar] [CrossRef]
- Zanchetta, M.; Tavernini, D.; Sorniotti, A.; Gruber, P.; Lenzo, B.; Ferrara, A.; Sannen, K.; De Smet, J.; De Nijs, W. Trailer control through vehicle yaw moment control: Theoretical analysis and experimental assessment. Mechatronics 2019, 64, 102282. [Google Scholar] [CrossRef]
- Choi, K. Novel Classifier Fusion Approaches for Fault Diagnosis in Automotive Systems. In Proceedings of the 42nd Annual Autotestcon Conference, Baltimore, MD, USA, 17–20 September 2007; p. 260. [Google Scholar]
- Chang, F.; Liu, M.; Dong, M.; Duan, Y. A mobile vision inspection system for tiny defect detection on smooth car-body surfaces based on deep ensemble learning. Meas. Sci. Technol. 2019, 30, 9. [Google Scholar] [CrossRef]
- Zraqou, J.S. Utilizing Smart GPS System for Monitoring and Tracking Vehicles. In Intelligent Computing; Advances in Intelligent Systems and Computing; Springer Nature: Cham, Switzerland, 2019; pp. 1098–1103. [Google Scholar] [CrossRef]
- Goryk, O.; Buchynskyi, A.; Romanyshyn, L.; Nurkusheva, S.; Bembenek, M. Evaluation of the State of Innovative Activity of Machine-Building Enterprise. Manag. Syst. Prod. Eng. 2024, 32, 1–11. [Google Scholar] [CrossRef]
- Gajdzik, B.; Wolniak, R. Influence of Industry 4.0 Projects on Business Operations: Literature and Empirical Pilot Studies Based on Case Studies in Poland. J. Open Innov. Technol. Mark. Complex. 2022, 8, 44. [Google Scholar] [CrossRef]
- Gajdzik, B.; Grabowska, S.; Saniuk, S. A Theoretical Framework for Industry 4.0 and Its Implementation with Selected Practical Schedules. Energies 2021, 14, 940. [Google Scholar] [CrossRef]
- Grosset, J.; Ndao, A.; Fougères, A.J.; Djoko-Kouam, M.; Couturier, C.; Bonnin, J.M. A cooperative approach to avoiding obstacles and collisions between autonomous industrial vehicles in a simulation platform. Integr. Comput.-Aided Eng. 2023, 30, 19–40. [Google Scholar] [CrossRef]
- Hu, P.; Chu, X.; Lv, L.; Zuo, K.; Ni, T.; Wang, T.; Shen, Z. An efficient and secure data collection scheme for predictive maintenance of vehicles. Ad Hoc Netw. 2023, 146, 103157. [Google Scholar] [CrossRef]
- Alpos, T.; Iliopoulou, C.; Kepaptsoglou, K. Nature-Inspired Optimal Route Network Design for Shared Autonomous Vehicles. Vehicles 2023, 5, 24–40. [Google Scholar] [CrossRef]
- Ou, S.Q.; Li, W.; Li, J.; Lin, Z.; He, X.; Bouchard, J.; Przesmitzki, S. Relationships between Vehicle Pricing and Features: Data Driven Analysis of the Chinese Vehicle Market. Energies 2020, 13, 25. [Google Scholar] [CrossRef]
- Weather Spark. Available online: https://weatherspark.com/ (accessed on 26 January 2024).
- Hussain, Z.; Yousaf, M.; Miao, C.F. Investigating the simultaneous impacts on transport infrastructure: Evidence from one-belt one-road countries. Int. J. Transp. Econ. 2020, 47, 401–417. [Google Scholar] [CrossRef]
- Coiret, A.; Vandanjon, P.-O.; Noël, R. Enhancement of Vehicle Eco-Driving Applicability through Road Infrastructure Design and Exploitation. Vehicles 2023, 5, 367–386. [Google Scholar] [CrossRef]
- Pao, W.Y.; Carvalho, M.; Hosseinnouri, F.; Li, L.; Rouaix, C.; Agelin-Chaab, M.; Hangan, H.; Gultepe, I.; Komar, J. Evaluating weather impact on vehicles: A systematic review of perceived precipitation dynamics and testing methodologies. Eng. Res. Express 2024, 6, 013001. [Google Scholar] [CrossRef]
- Li, C.; Zeng, R.; Niu, B.; Jin, G. Improvement of humidity stability for optoelectronic electric field sensor. In Proceedings of the International Conference on Optical Instruments and Technology, Beijing, China, 17–19 November 2013. 90441D. [Google Scholar]
- He, J.; Chen, K.-Q. Humidity effects on the electronic transport properties in carbon based nanoscale device. Phys. Lett. A 2012, 376, 869–874. [Google Scholar] [CrossRef]
- An, Y.; Su, M.; Hu, Y.; Hu, S.; Huang, T.; He, B.; Yang, M.; Yin, K.; Lin, Y. The Influence of Humidity on Electron Transport Parameters and Insulation Performance of Air. Front. Energy Res. 2022, 9, 806595. [Google Scholar] [CrossRef]
- Mikulić, I.; Bošković, I.; Zovak, G. Effects of Driving Style and Vehicle Maintenance on Vehicle Roadworthiness. Promet-Traffic Transp. 2020, 32, 667–677. [Google Scholar] [CrossRef]
- Pawłowski, W.; Goniewicz, K.; Schwebel, D.C.; Shen, J.; Goniewicz, M. Road traffic injuries in Poland: Magnitude and risk factors. Eur. J. Trauma Emerg. Surg. 2019, 45, 815–820. [Google Scholar] [CrossRef]
- Akhatova, A.; Kassymov, A.; Kazmaganbetova, M.; Rojas-Solórzano, L.R. CFD Simulation of the Dispersion of Exhaust Gases in a Traffic Loaded Street of Astana, Kazakhstan. J. Urban Environ. Eng. 2016, 9, 158–166. [Google Scholar] [CrossRef]
- Aubakirova, A.; Kossumov, A.; Igissinov, N. Road traffic accidents in Kazakhstan. Iran. J. Public Health 2013, 42, 231–239. [Google Scholar]


| Brand | Model | Average Mileage to First SI, km | Average Days to First SI | Estimated Days to Reach 15,000 km | Method of Criteria, Mileage (15,000 km) or Days (365 Days) | The Difference in Days between the Average and Estimated |
|---|---|---|---|---|---|---|
| Audi | A6 | 8163 | 304 | 559 | days | 61 |
| Q5 | 18,739 | 285 | 228 | mileage | −57 | |
| Q8 | 8286 | 291 | 527 | days | 74 | |
| Porsche | Cayenne | 6518 | 354 | 815 | days | 11 |
| Cayenne coupe | 9666 | 411 | 638 | days | −46 | |
| Volkswagen | Polo | 10,157 | 293 | 433 | days | 72 |
| Passat | 10,062 | 377 | 562 | days | −12 | |
| Teramont | 6463 | 280 | 650 | days | 85 | |
| Tiguan | 9863 | 248 | 377 | days | 117 | |
| Touareg | 9116 | 247 | 406 | days | 118 |
| Brand | Model | Average Mileage to First SI, km | Average Days to First SI | Estimated Days to Reach 30,000 km | Method of Criteria, Mileage (30,000 km) or Days (730 Days) | The Difference in Days between the Average and Estimated |
|---|---|---|---|---|---|---|
| Volkswagen | Arteon | 25,464 | 416 | 490 | mileage | 74 |
| Golf | 19,149 | 522 | 818 | days | 208 | |
| Passat | 21,586 | 601 | 835 | days | 129 | |
| T-Cross | 17,223 | 620 | 1080 | days | 110 | |
| Tiguan | 25,926 | 584 | 676 | mileage | 92 | |
| Tiguan allspace | 23,177 | 317 | 410 | mileage | 93 | |
| Touran | 15,049 | 560 | 1116 | days | 170 | |
| T-Roc | 18,499 | 633 | 1026 | days | 97 | |
| Up | 10,616 | 465 | 1314 | days | 265 |
Disclaimer/Publisher’s Note: The statements, opinions and data contained in all publications are solely those of the individual author(s) and contributor(s) and not of MDPI and/or the editor(s). MDPI and/or the editor(s) disclaim responsibility for any injury to people or property resulting from any ideas, methods, instructions or products referred to in the content. |
© 2024 by the authors. Licensee MDPI, Basel, Switzerland. This article is an open access article distributed under the terms and conditions of the Creative Commons Attribution (CC BY) license (https://creativecommons.org/licenses/by/4.0/).
Share and Cite
Nurkusheva, S.; Bembenek, M.; Berdychowski, M.; Gajdzik, B.; Wolniak, R. An Analysis of the Correct Frequency of the Service Inspections of German Passenger Cars—A Case Study on Kazakhstan and Poland. Vehicles 2024, 6, 553-570. https://doi.org/10.3390/vehicles6010025
Nurkusheva S, Bembenek M, Berdychowski M, Gajdzik B, Wolniak R. An Analysis of the Correct Frequency of the Service Inspections of German Passenger Cars—A Case Study on Kazakhstan and Poland. Vehicles. 2024; 6(1):553-570. https://doi.org/10.3390/vehicles6010025
Chicago/Turabian StyleNurkusheva, Saltanat, Michał Bembenek, Maciej Berdychowski, Bożena Gajdzik, and Radosław Wolniak. 2024. "An Analysis of the Correct Frequency of the Service Inspections of German Passenger Cars—A Case Study on Kazakhstan and Poland" Vehicles 6, no. 1: 553-570. https://doi.org/10.3390/vehicles6010025
APA StyleNurkusheva, S., Bembenek, M., Berdychowski, M., Gajdzik, B., & Wolniak, R. (2024). An Analysis of the Correct Frequency of the Service Inspections of German Passenger Cars—A Case Study on Kazakhstan and Poland. Vehicles, 6(1), 553-570. https://doi.org/10.3390/vehicles6010025