Article

Feasibility Study on MHEV Application for Motorbikes: Components Sizing, Strategy Optimization through Dynamic Programming and Analysis of Possible Benefits

Engineering Department “Enzo Ferrari”, University of Modena and Reggio Emilia, 41125 Modena, Italy
*
Authors to whom correspondence should be addressed.
Vehicles 2024, 6(3), 1442-1467; https://doi.org/10.3390/vehicles6030068
Submission received: 14 June 2024 / Revised: 19 July 2024 / Accepted: 20 August 2024 / Published: 23 August 2024

Abstract

:
Reducing CO2 emissions is becoming a particularly important goal for motorcycle manufacturers. A fully electric transition still seems far away, given the difficulties in creating an electric motorcycle with an acceptable range and mass. This opens up opportunities for the application of hybrid powertrains in motorcycles. Managing mass, cost, and volume is a challenging issue for motorcycles; therefore, an MHEV architecture represents an interesting opportunity, as it is a low-complexity and low-cost solution. Firstly, in this work, an adequate sizing of the powertrain components is studied for the maximum reduction in fuel consumption. This is performed by analyzing many different system configurations with different hybridization ratios. A 1D simulation of the motorcycle traveling along the homologation cycle (WMTC) is performed, and the powerunit use strategy is optimized for each configuration using the Dynamic Programming technique. The results are analyzed in order to highlight the impact of kinetic energy recovery and engine load-point shifting on fuel consumption reduction. The results show the applicability of MHEV technology to road motorcycles, thus providing a useful tool to analyze the cost/benefit ratio of this technology. The developed methodology is also suitable for different vehicles once a specific test cycle is known.

1. Introduction

Worldwide vehicle regulations are rapidly evolving in the direction of CO2 reduction [1,2]. This is becoming increasingly relevant for the motorbike market since a growing number of governments are starting to impose stringent constraints on emissions [3,4,5]. Therefore, the application of hybrid technologies to motorcycle engines represents an interesting solution to be investigated in order to reduce fuel consumption and, therefore, CO2 emissions [6,7].
Currently, regulations for motorcycle homologation are less stringent compared to those for cars. This allows motorcycle manufacturers to meet emission standards through the advanced optimization of traditional internal combustion engines. However, real-world examples of electrification exist. While some hybrid motorcycles are available in the market, they remain a niche segment, and in parallel, only a slightly higher number of fully electric applications exists [8,9]. This is largely due to the complexity of creating a hybrid architecture for motorcycles, which involves managing the space constraints and costs of integrating both electric and combustion systems.
In a motorbike, mass is a relevant constraint since it heavily affects the riding dynamics, but other constraints are also important. Firstly, the volume available for the installation of additional components is limited, and, given the layout, it is fragmented along the chassis. Furthermore, the cost of electrification is generally proportional to the power or energy capacity installed. Consequently, with high-performance motorcycles with comparable power installed with respect to standard passenger cars, the cost represents a more stringent constraint than that in a car, given the lower market price.
Considering all these aspects, a mild-hybrid (MHEV) application [10] might be worth investigating for a possible increase in the powertrain efficiency while limiting the modifications to the motorbike layout and containing the added mass. The minimum devices to be added are the electric motor, battery pack (including the cells, fuses, switches, and Battery Management System), motor controller (inverter), and a possible cooling system. Consequently, the benefits must be significant enough to justify the increased component costs and system complexity of implementing this solution in real-world scenarios.
During the preliminary development phase of a hybrid vehicle, it is important to evaluate the achievable benefit in terms of fuel consumption that can be obtained from the selected architecture. This is crucial in the case of an MHEV motorbike, where, given the lower mass compared to a car, the added mass of the electric components might erode the possible efficiency advantage. Therefore, it would be helpful to simulate the vehicle during a homologation test to estimate the benefits achievable with a possible hybrid architecture.
Homologation test cycles are an important benchmark for the evaluation of emissions since they are heavily regulated in order to obtain comparable results considering different vehicles. Among the various existing cycles, the World Motorcycle Test Cycle (WMTC) is the most relevant since it is used for homologation in many of the most important worldwide markets [3].
In the literature, many studies on hybrid motorbikes exist, but they are mainly focused on strategy development using different energy management techniques [11,12,13], transmission systems design [14,15,16], and battery pack development [17,18,19,20]. Furthermore, most of these studies tend to focus on utilitarian 2-wheel vehicles, such as city scooters [21,22], where cost is an important constraint but where mass and volume constraints marginally affect the functionality of the vehicle. This study, instead, is focused on the application of high-performance motorbikes, i.e., naked or sport-tourer motorbikes. In particular, the goal is to study a mild-hybrid powertrain to be fitted into an existing motorbike, limiting the number of modifications to be made and estimating the amount of fuel consumption reduction.
Correctly sizing of the components of the power unit (PU) is crucial to achieving the desired results. Therefore, many different configurations are analyzed here considering the same MHEV topology but with different hybridization ratios (HR) [23,24,25], evaluating for each case the possible reduction in fuel consumption and the corresponding mass increase with respect to the baseline internal combustion engine (ICE) motorbike.
In order to evaluate the fuel consumption of a hybrid power unit, an energy management strategy needs to be developed. Since the present contribution focuses on the feasibility of the MHEV architecture and on understanding the relevant factors acting in fuel consumption reduction, an optimal strategy is needed to avoid the influence of the strategy itself on the results.
Several energy management methodologies have been taken into consideration, ranging from simple heuristics [26] to more complex algorithms [27,28,29] capable of real-time calculations. Dynamic Programming (DP) offers a straightforward approach but requires prior knowledge of the mission, and it is too slow for real-time applications. However, this latter feature does not represent a limit in this study, and considering that the reference homologation cycle taken into account has a prescribed finite time horizon, DP appears to be the best tool to obtain the optimal strategy [30].
Therefore, DP optimization is executed for each of the different HRs analyzed, and the resulting strategy is used to evaluate fuel consumption throughout the cycle. Fuel consumption is linearly correlated to CO2 emissions; therefore, it has been chosen as the reference parameter to be minimized.
The range of the different HRs has been defined, varying the maximum electrical power of the system, while the ICE power characteristic has been kept constant. This approach has the benefit of keeping the ICE unaltered, enabling the use of an experimentally derived efficiency map of the stock engine. Consequently, all the analyzed PU configurations have slightly different maximum power values, but the differences have negligible effects since the electric motor power for an MHEV is low compared to the ICE power. Furthermore, the maximum power has no effect in this study since the peak power of the motorbike is never reached in the WMTC.
The different ways in which the MHEV topology can increase the overall power unit efficiency have been analyzed in depth. In fact, the MHEV topology offers three main ways to possibly reduce fuel consumption:
  • Kinetic energy recovery (regenerative braking);
  • ICE load-point shifting;
  • Electrified ancillaries or component removal.
The third bullet point refers, for example, to the starter motor removal or to the possible electrification of the water and/or oil pumps. These modifications are more related to mass and cost reduction, and their direct contribution to fuel consumption reduction is estimated to be limited compared to the other two. Therefore, this study is mainly focused on the estimation of the influence of kinetic energy recovery and on the shifting of the ICE operating point. Another important consideration to be made is the impact of losses in the electrical components. In fact, while these losses can be neglected in the preliminary design and sizing of the system, an analysis of their impact cannot be completely disregarded when analyzing the feasibility and convenience of the adoption of this technology. Moreover, this sensitivity analysis is also useful for setting an efficiency target for the design of electric components.
The paper is organized as follows. In the next section, the MHEV topology and the proposed system layout are described. Subsequently, the model used in this study is introduced. Specifically, it emulates the motorbike under the same conditions it experiences during a homologation test, and, as shown in the following, its validation is presented for the case of the pure ICE version of the motorbike. Then, the DP algorithm used is presented along with the constraints applied. Many different PU configurations, differing in their HR, are presented and compared in terms of total mass increase and fuel consumption reduction in order to define optimal sizing. Then, the optimized configuration results are analyzed, highlighting the effects of different factors impacting fuel consumption in an MHEV architecture. Finally, the results are compared and discussed, and conclusions are drawn.

2. Topology and System Description

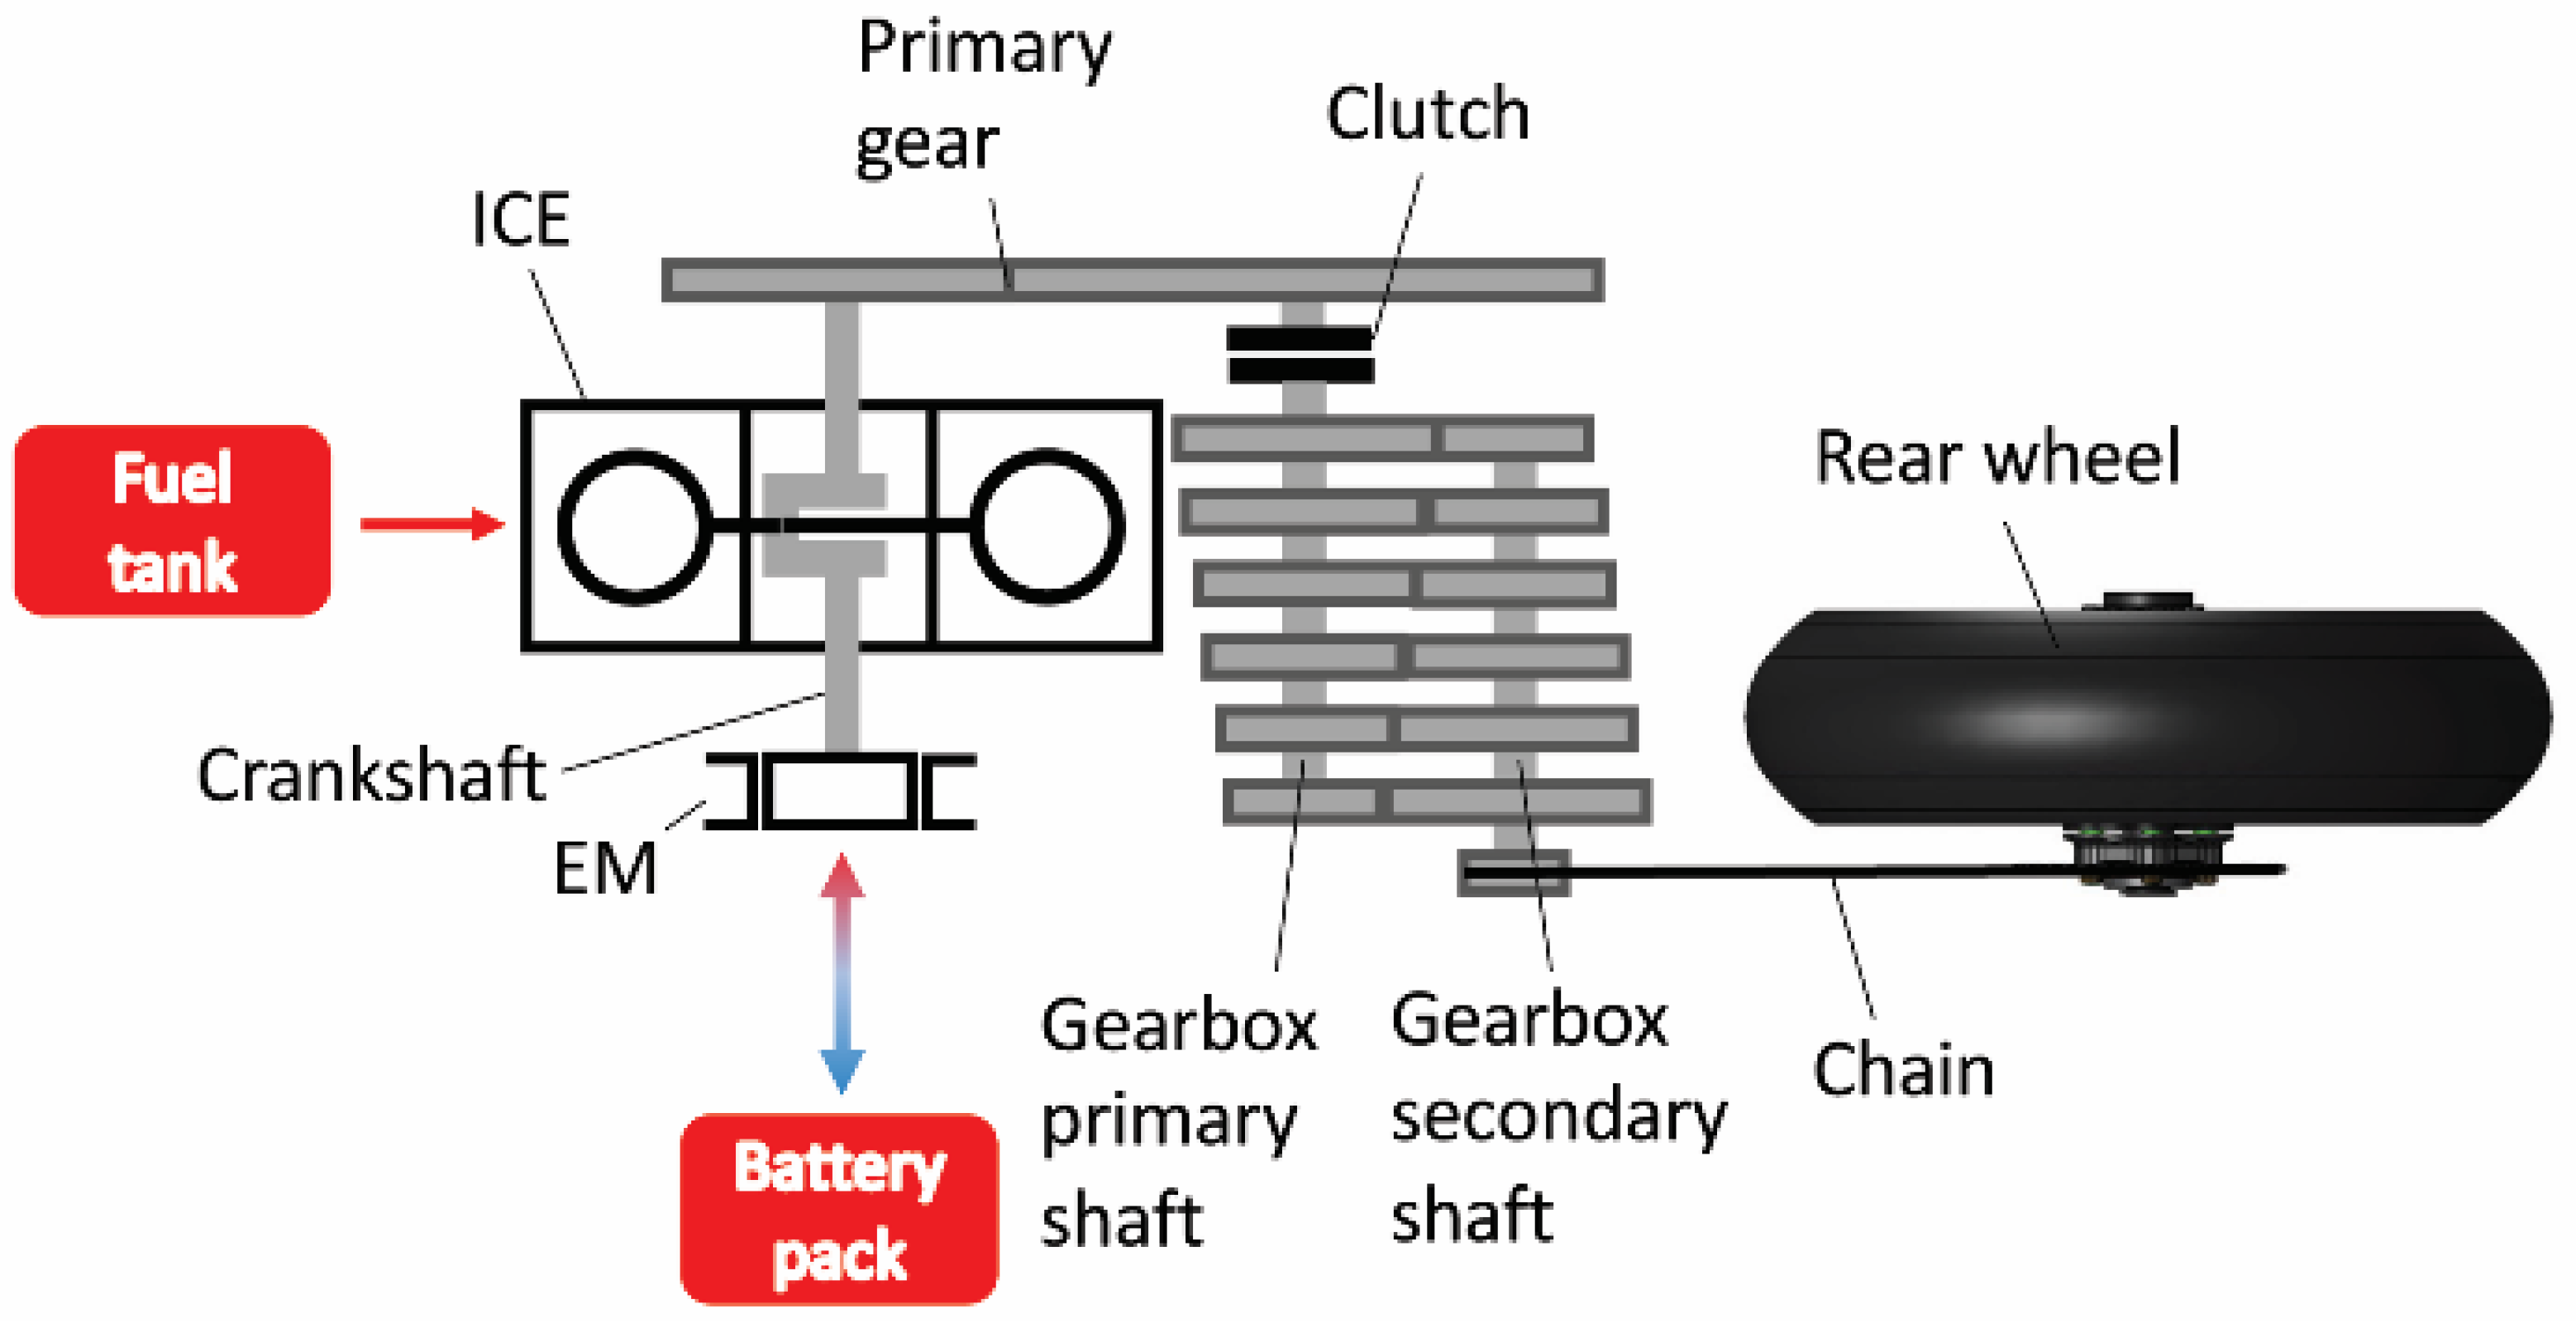
This section includes a description of the MHEV topology analyzed and, subsequently, of the various subsystems involved. In particular, the electric machine (EM), ICE, and accumulator characteristics are described below. The proposed PU scheme is shown in Figure 1.

2.1. MHEV Topology

The MHEV topology developed in this study is based on the P1 architecture [31]. This architecture has been chosen because of multiple reasons:
  • small component sizing (compared to full hybrids) reduces mass, volume, and cost, thus better suiting the characteristics of a motorbike;
  • simplicity of integration into an existing ICE, possibly even without modifications of the engine block since the EM can replace the alternator;
  • no transmission elements between the EM and ICE, which further saves mass, volume, and cost, thus not introducing additional mechanical losses.

2.2. Electric Motor

A radial flux configuration with an internal rotor has been chosen for the electric motor, with a direct axle-type installation on the ICE crankshaft to be housed in a place of the existing alternator of the stock ICE [32,33,34]. Therefore, the first constraint imposed on the EM is to fit the alternator case in terms of the external diameter to avoid extensive modifications to the engine block. This will require a suitable stator housing to be designed to replace the existing alternator cover.
A second important design parameter is the overall axial length of the EM, l . In this approach, the axial length for each different HR configuration size has been determined using an EM preliminary dimensioning method [35]. Starting from the power level required for each HR configuration, the maximum torque level has been derived for each size. The defined nominal torque, T , has then been linked to the rotor volume, adopting the following equation [35]:
T = π 2 D r o t 2 l A B
where D r o t is the external rotor diameter, l is the active length, A is the linear current density, and B is the magnetic flux density. Sensible values of the last two parameters have been chosen and set constant for each configuration, taking into account the foreseen EM operating conditions, with particular reference to the operating temperature. In fact, the housing temperature is related to the ICE oil temperature (ca. 120 °C), which is higher than that usually assumed for the housing of a stand-alone EM.
By manipulating (1) and introducing the split ratio λ, which represents the ratio between the rotor and stator volumes, the axial length can be finally calculated as follows:
l = T 2 A B π 4 D e x t 2 λ 1 + λ
where D e x t is the external stator diameter. Additionally, using the density for the different materials, the masses of the rotor and stator can be estimated.

2.3. Internal Combustion Engine

The ICE is a 90° twin-cylinder with a displacement of 930 cm³, delivering 80 kW of power at 9000 rpm. The ICE has been modeled by considering its power, torque, and efficiency maps. This model is highly consistent, as all maps have been experimentally obtained. Specifically, the ICE maps have been derived from a calibration procedure conducted on a dynamometer bench. Additionally, the fuel consumption data have been collected from tests of the motorcycle on a roller bench, performing the WMTC homologation cycle.

2.4. Accumulator

Regarding the accumulator, Li-ion cylindrical cells (18650 format) have been considered due to the previous knowledge of the authors and the widespread availability on the market. However, other cell formats can be analyzed by taking into account different gravimetric efficiencies.
Considering a nominal system voltage of 48 V, legislation requirements in terms of electrical safety are less stringent with respect to possible high-voltage configurations [36], and the corresponding complexity and mass increase are limited. On the other hand, the current circulating in the system would be higher, and the conductor sizing and mass would be higher accordingly. Nevertheless, the 48 V level solution has been chosen at this stage to keep the complexity at a minimum.
Several different accumulator configurations have been designed. Each configuration is based on a string of 13 cells in series to reach a nominal voltage of about 48 V. One or more of these strings are then connected in parallel depending on the total capacity target and the output power target (which needs to be set according to the maximum power value of the EM). The target capacities span from 500 kJ to 4000 kJ.

3. Modeling

3.1. 1D Model

A 1D quasi-static model of the motorbike has been prepared to study the problem since it is particularly suited for a DP application [30]. This kind of modeling facilitates the evaluation of the torque required for the PU, which is the main constraint to be verified by the optimization algorithm at every step. In this way, the complexity of the model is kept at a minimum. The model represents a motorbike during a homologation driving cycle on a test bench executed according to the test procedure [37]. The vehicle speed imposed by the WMTC cycle is the input parameter of the model. The model includes the PU, the whole transmission system, and the rear wheel (Figure 2).
The transmission is modeled considering all the transmission ratios, transmission losses, and inertia properties of all the moving elements. Conversely, the front wheel and the chassis are not represented in the model because these parts are standing still on the roller bench. Therefore, their contribution in terms of rolling and aerodynamic resistance must be added using fixed (equivalent) values according to the Economic Commission for Europe (ECE) homologation procedure [37]. These parameters depend on the inertia class of the motorbike, which in turn is determined by its mass in the running order. The rolling resistance of the rear wheel and the transmission losses are active parts in a bench test; therefore, their contribution needs to be modeled.
The quasi-static approach implies that the motorbike will exactly follow the input speed profile without requiring a driver model. The acceleration required to follow the profile is directly evaluated, and subsequently, a backward calculation of the corresponding torque to be delivered by the propulsion system is performed. The torque value, of course, depends on the selected gear, but the shifting pattern is strictly imposed by the ECE procedure [37]; thus, any further calculation is needed.
The workflow of this model and the equations involved are, therefore, quite simple. The main equation is the balance of the forces acting on the vehicle:
F w = F a e r o + F r e s , f r o n t + F r e s , r e a r + F i n e r t i a
where F w is the longitudinal force acting on the contact patch between the wheel and the bench roller (see Figure 2); F a e r o is the total aerodynamic force acting along the longitudinal direction; F r e s , f r o n t and F r e s , f r o n t are the forces representing the rolling resistance of the front and the rear wheel, respectively; F i n e r t i a is the inertial force acting along the longitudinal direction due to the acceleration of the vehicle.
As previously stated, the ECE procedure imposes aerodynamic resistance and front rolling resistance forces in a single expression:
F a e r o + F r e s , f r o n t = F 0 + F 2 v 2
where F 0 and F 2 are coefficients that depend on the inertia class of the motorbike and are predetermined according to the ECE procedure [37].
The contribution of the rear wheel rolling resistance must instead be mimicked in the model. It is evaluated using the following relation:
F r e s , r e a r = C 0 , r e a r · m R O · W B r e a r · g
where C 0 , r e a r is a dimensionless coefficient that depends on the tire characteristics (a typical value of this parameter for a sport-touring road motorbike tire is 0.015 [38], also considering the roller contact patch influence with respect to the standard flat-track [39]), m R O is the mass in running order defined in ECE procedure, W B r e a r is a dimensionless coefficient that represents the portion of the total weight of the motorbike acting on the rear tire (in this case, equal to 0.51), and, finally, g represents the gravity acceleration.
For each timestep, the speed of the motorbike is known; therefore, the acceleration at a given timestep can be calculated as follows:
a = v t + 1 v t 1 2
The inertia force can then be calculated as:
F i n e r t i a = m R O · a
Equation (3) can now be solved for the propulsion force F w , and the torque to the wheel can be calculated using the rolling radius of the rear wheel, R w :
M w = F w · R w
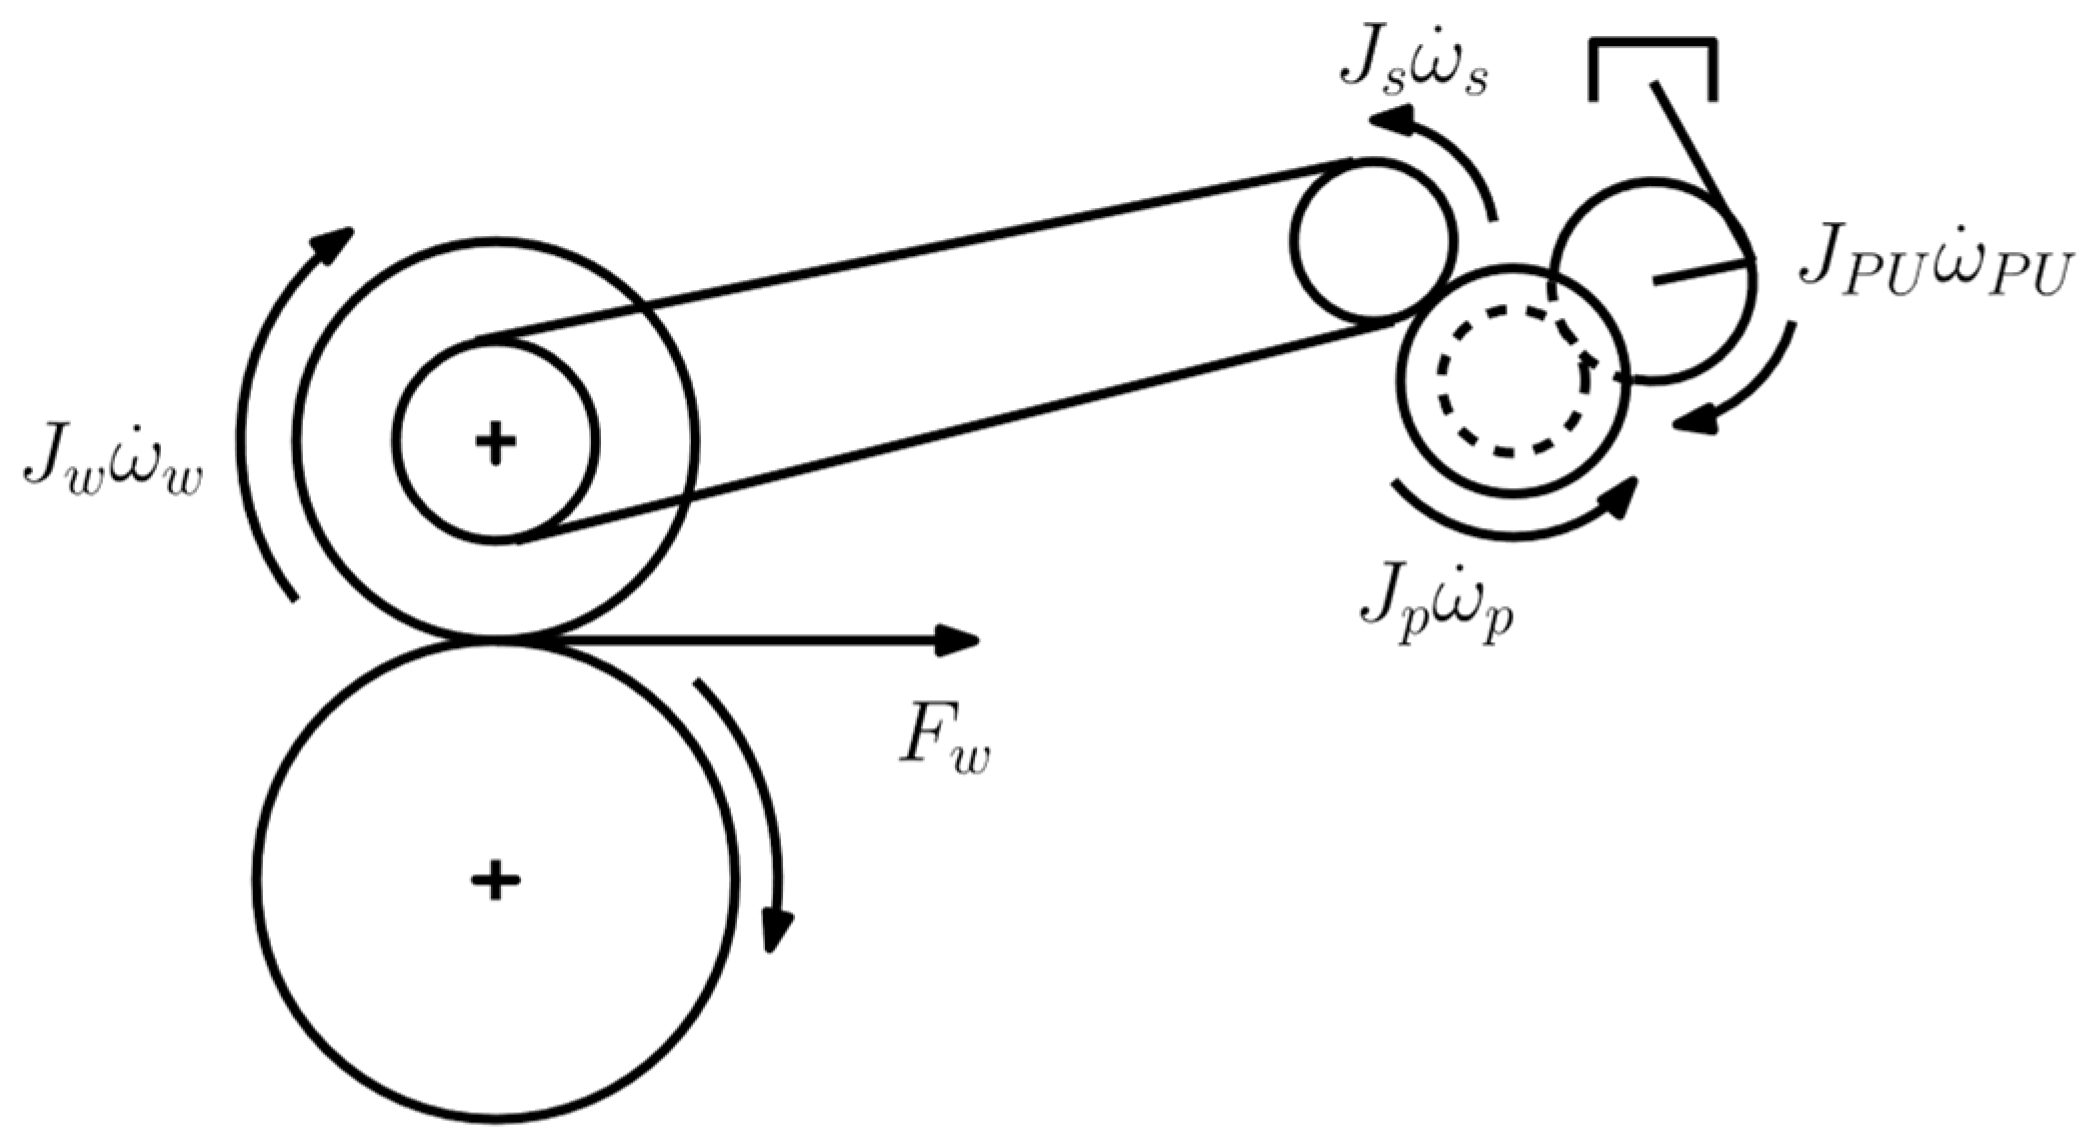
It is then possible to calculate the torque delivered by the PU, considering the inertias, efficiencies, and transmission ratios:
M PU = M w + J w ω ˙ w τ c η c + J s ω ˙ s τ g η g + J p ω ˙ p τ p η p + J PU ω ˙ PU
All the symbols of (9) are referenced in Figure 3 and in Table A2 in the Appendix A section. In particular, η p and τ p are the efficiency and the transmission ratio between the crankshaft and the primary shaft of the gearbox, while J p is the inertia of the primary shaft. Similarly, η g and τ g are the efficiency and the transmission ratio of the selected gear, while J s is the inertia of the secondary shaft.
The values of the moments of inertia have been obtained from the 3D model of the various components, while the transmission losses have been modeled as a 2% loss on each gear mesh and a 5% loss on the chain coupling.
Once the torque output of the PU is obtained, a power-split factor χ can be introduced:
χ = M EM M PU
Depending on the power-split χ acting at each timestep, the torque output of the ICE and of the EM can be calculated through the following equations:
M PU = M ICE + M EM
M EM = χ M PU
M ICE = 1 χ M PU
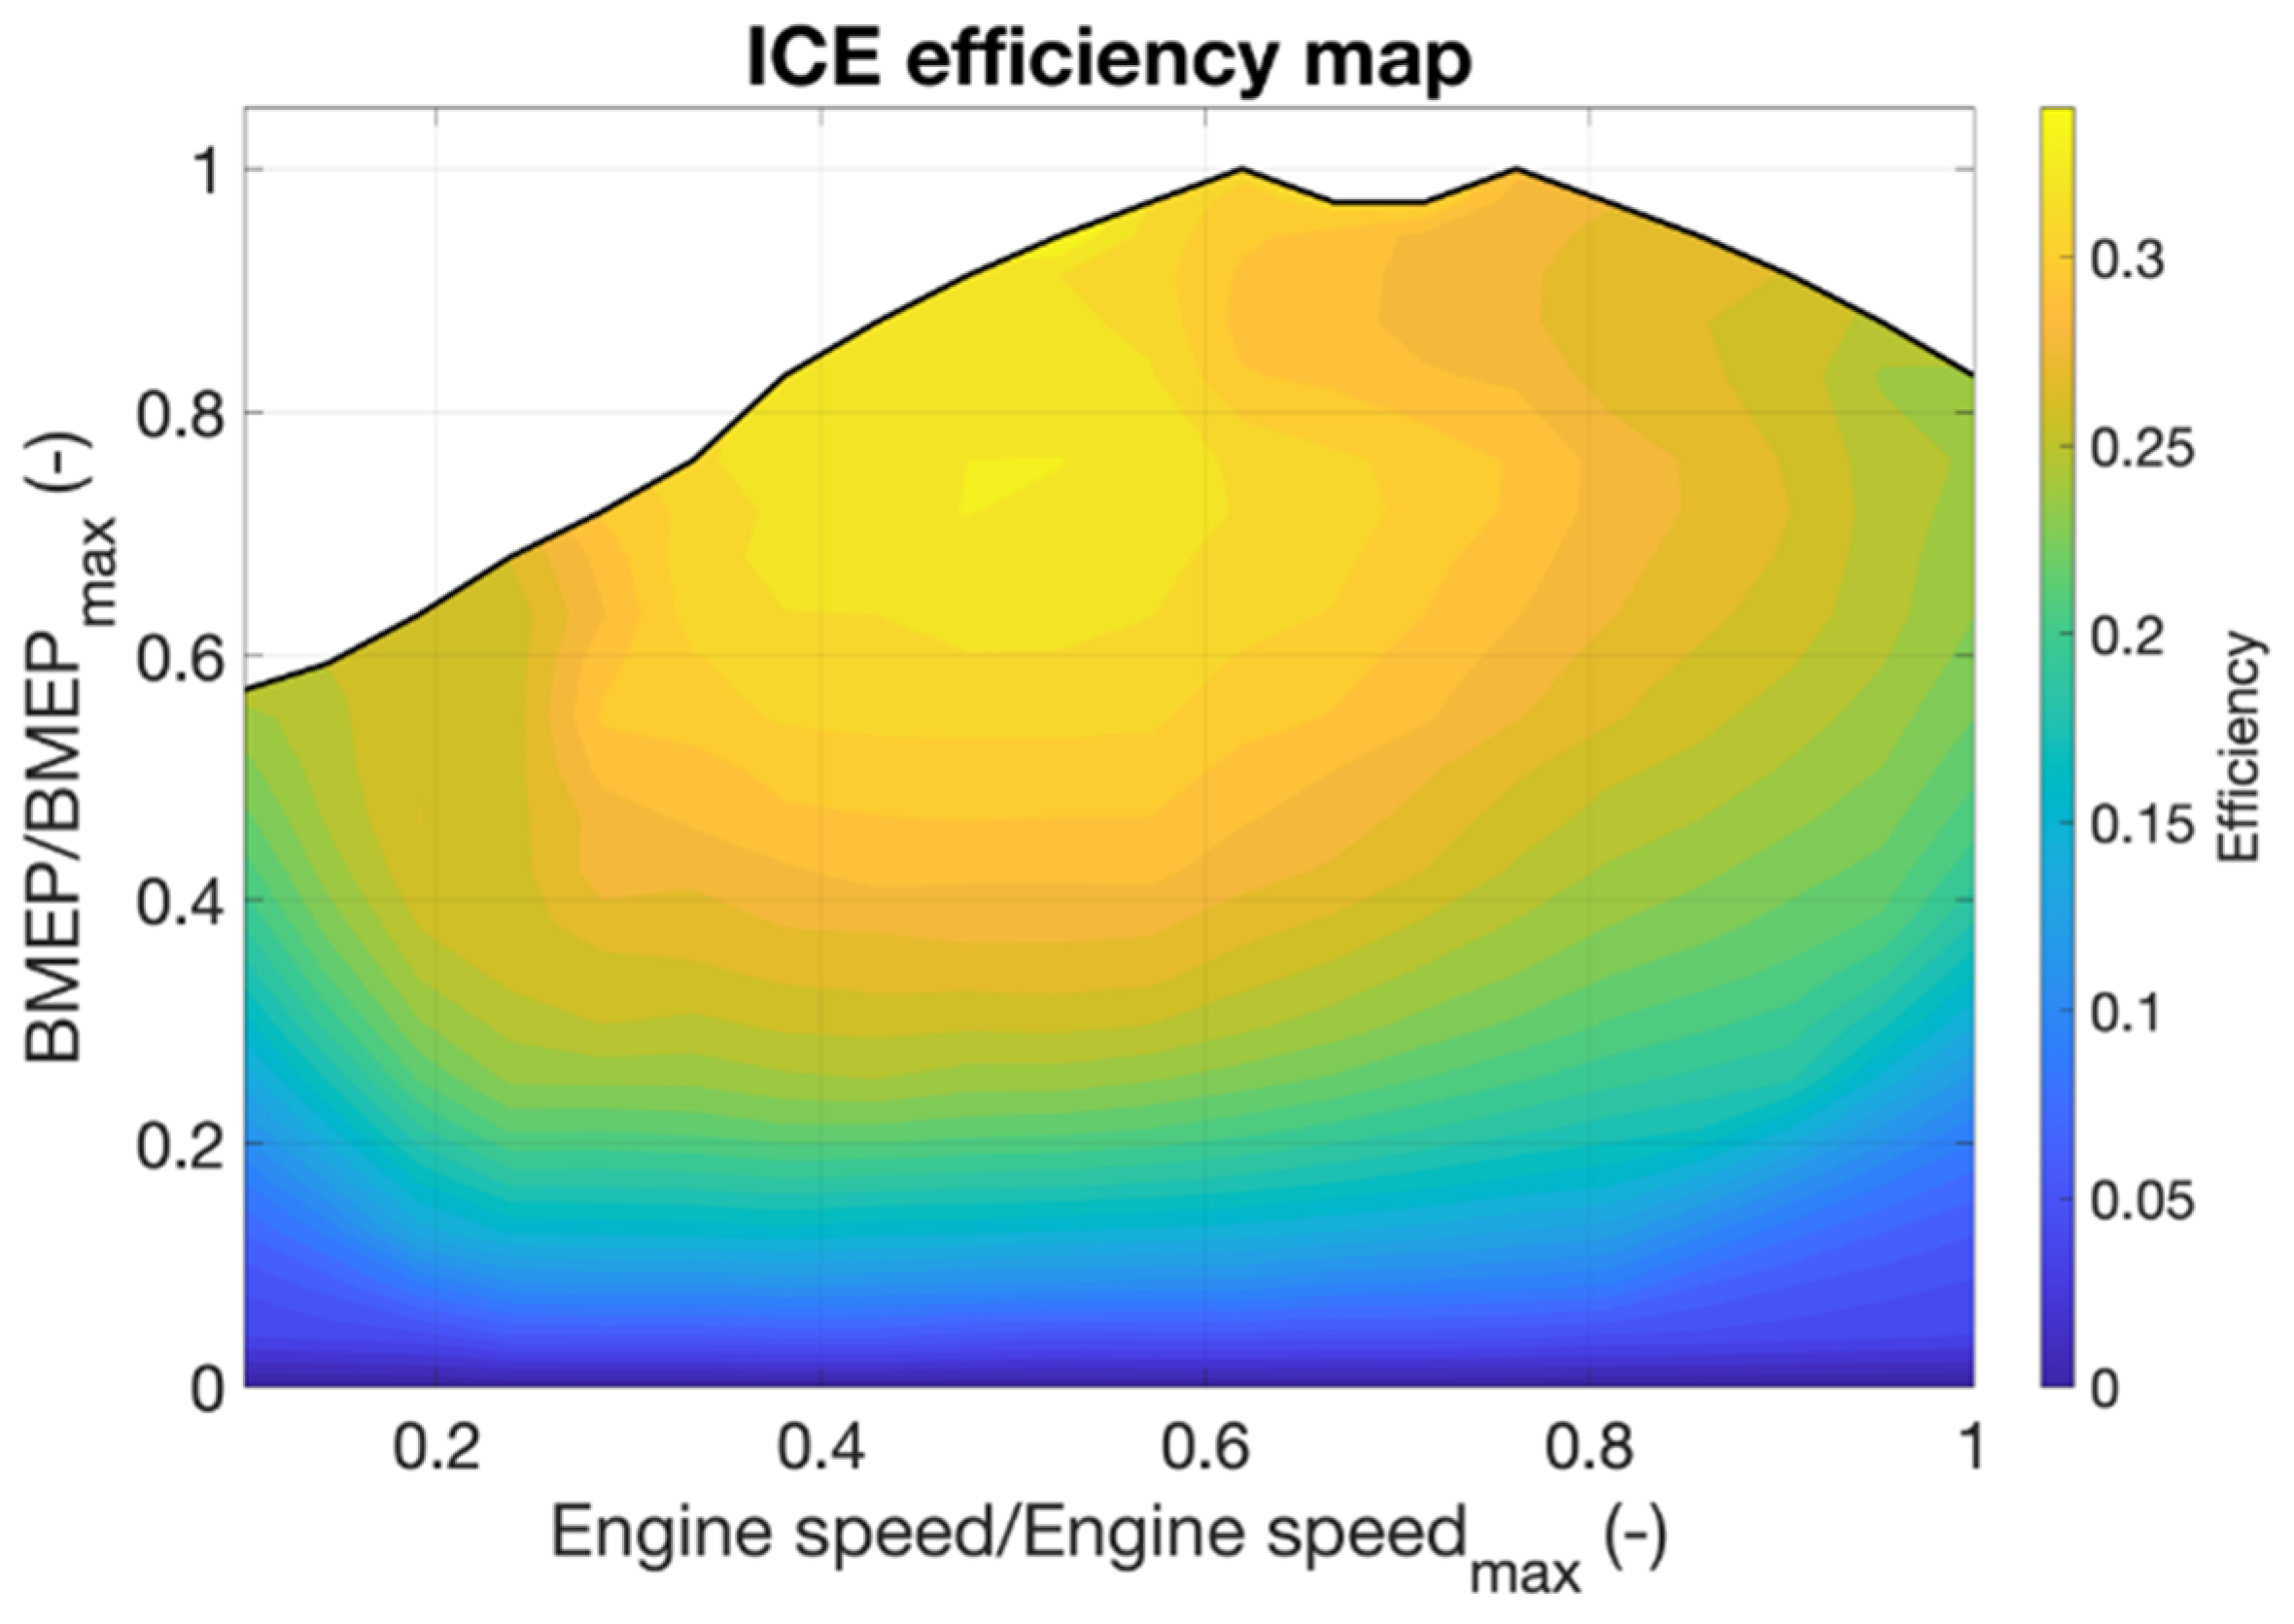
All rotational speeds of the transmission elements have been calculated using simple kinematic relations, back to the ICE speed. Therefore, the ICE operating point has been determined, and with the request of ICE torque, the brake mean effective pressure (BMEP) has also been evaluated. It is now possible to calculate instantaneous fuel consumption by interpolating the brake-specific fuel consumption (BSFC) map (Figure 4) [40,41].
The values of fuel consumption have then been corrected to take into account the mixture enrichment in the first phase of the cycle due to the warmup of the catalytic converter. The gain coefficient for this correction has been experimentally determined.
The integral, along the cycle, of the instantaneous fuel consumption determines the total fuel consumption in the cycle.
t s t a r t t e n d m f ˙ = m f
Similarly, it is possible to calculate the instantaneous power delivered by the EM. The integral along the timestep of the instantaneous power provides the electric energy consumption (or regeneration) in that timestep:
t 1 t P EM = E EM
Therefore, it is possible to calculate the state of energy (SOE) of the accumulator in that timestep as follows:
SOE t = SOE t 1 E EM
where the minus sign derives from the sign convention adopted for electric power. In particular, M EM , and therefore P EM and E EM , are positive if power is drained from the accumulator and negative if power is regenerated and stored in the accumulator.
The SOE has been chosen as the state variable of the accumulator instead of the more commonly used State of Charge (SOC). This helps reduce the complexity of the model because a proper electric model of the cells would be necessary to calculate the SOC. The use of the SOE, instead, allows to work with a single variable, which is energy, without any additional equation, thus enabling to treat the accumulator as a simple energy reservoir. The actual accumulator design should be based on the usage envelope obtained from this analysis.
It is worth noting that, for the first part of this study, no efficiencies have been considered in the calculations for the electric components of the PU. This decision has been made because the goal of the analysis is to find the maximum possible benefit from the adoption of an MHEV technology, regardless of the technology used for the EM, EM controller, and accumulator. This choice is in line with the use of an optimal strategy. The model used for the EM refers to a simple torque vs. speed curve. The model of the accumulator is that of an energy reservoir, as previously stated. The ICE, on the other hand, cannot be considered ideal; otherwise, it would not be possible to evaluate the impact of the load-point shifting strategy. Nevertheless, in the final part of this study, an analysis of the impact of the losses along the electric power path has been performed.
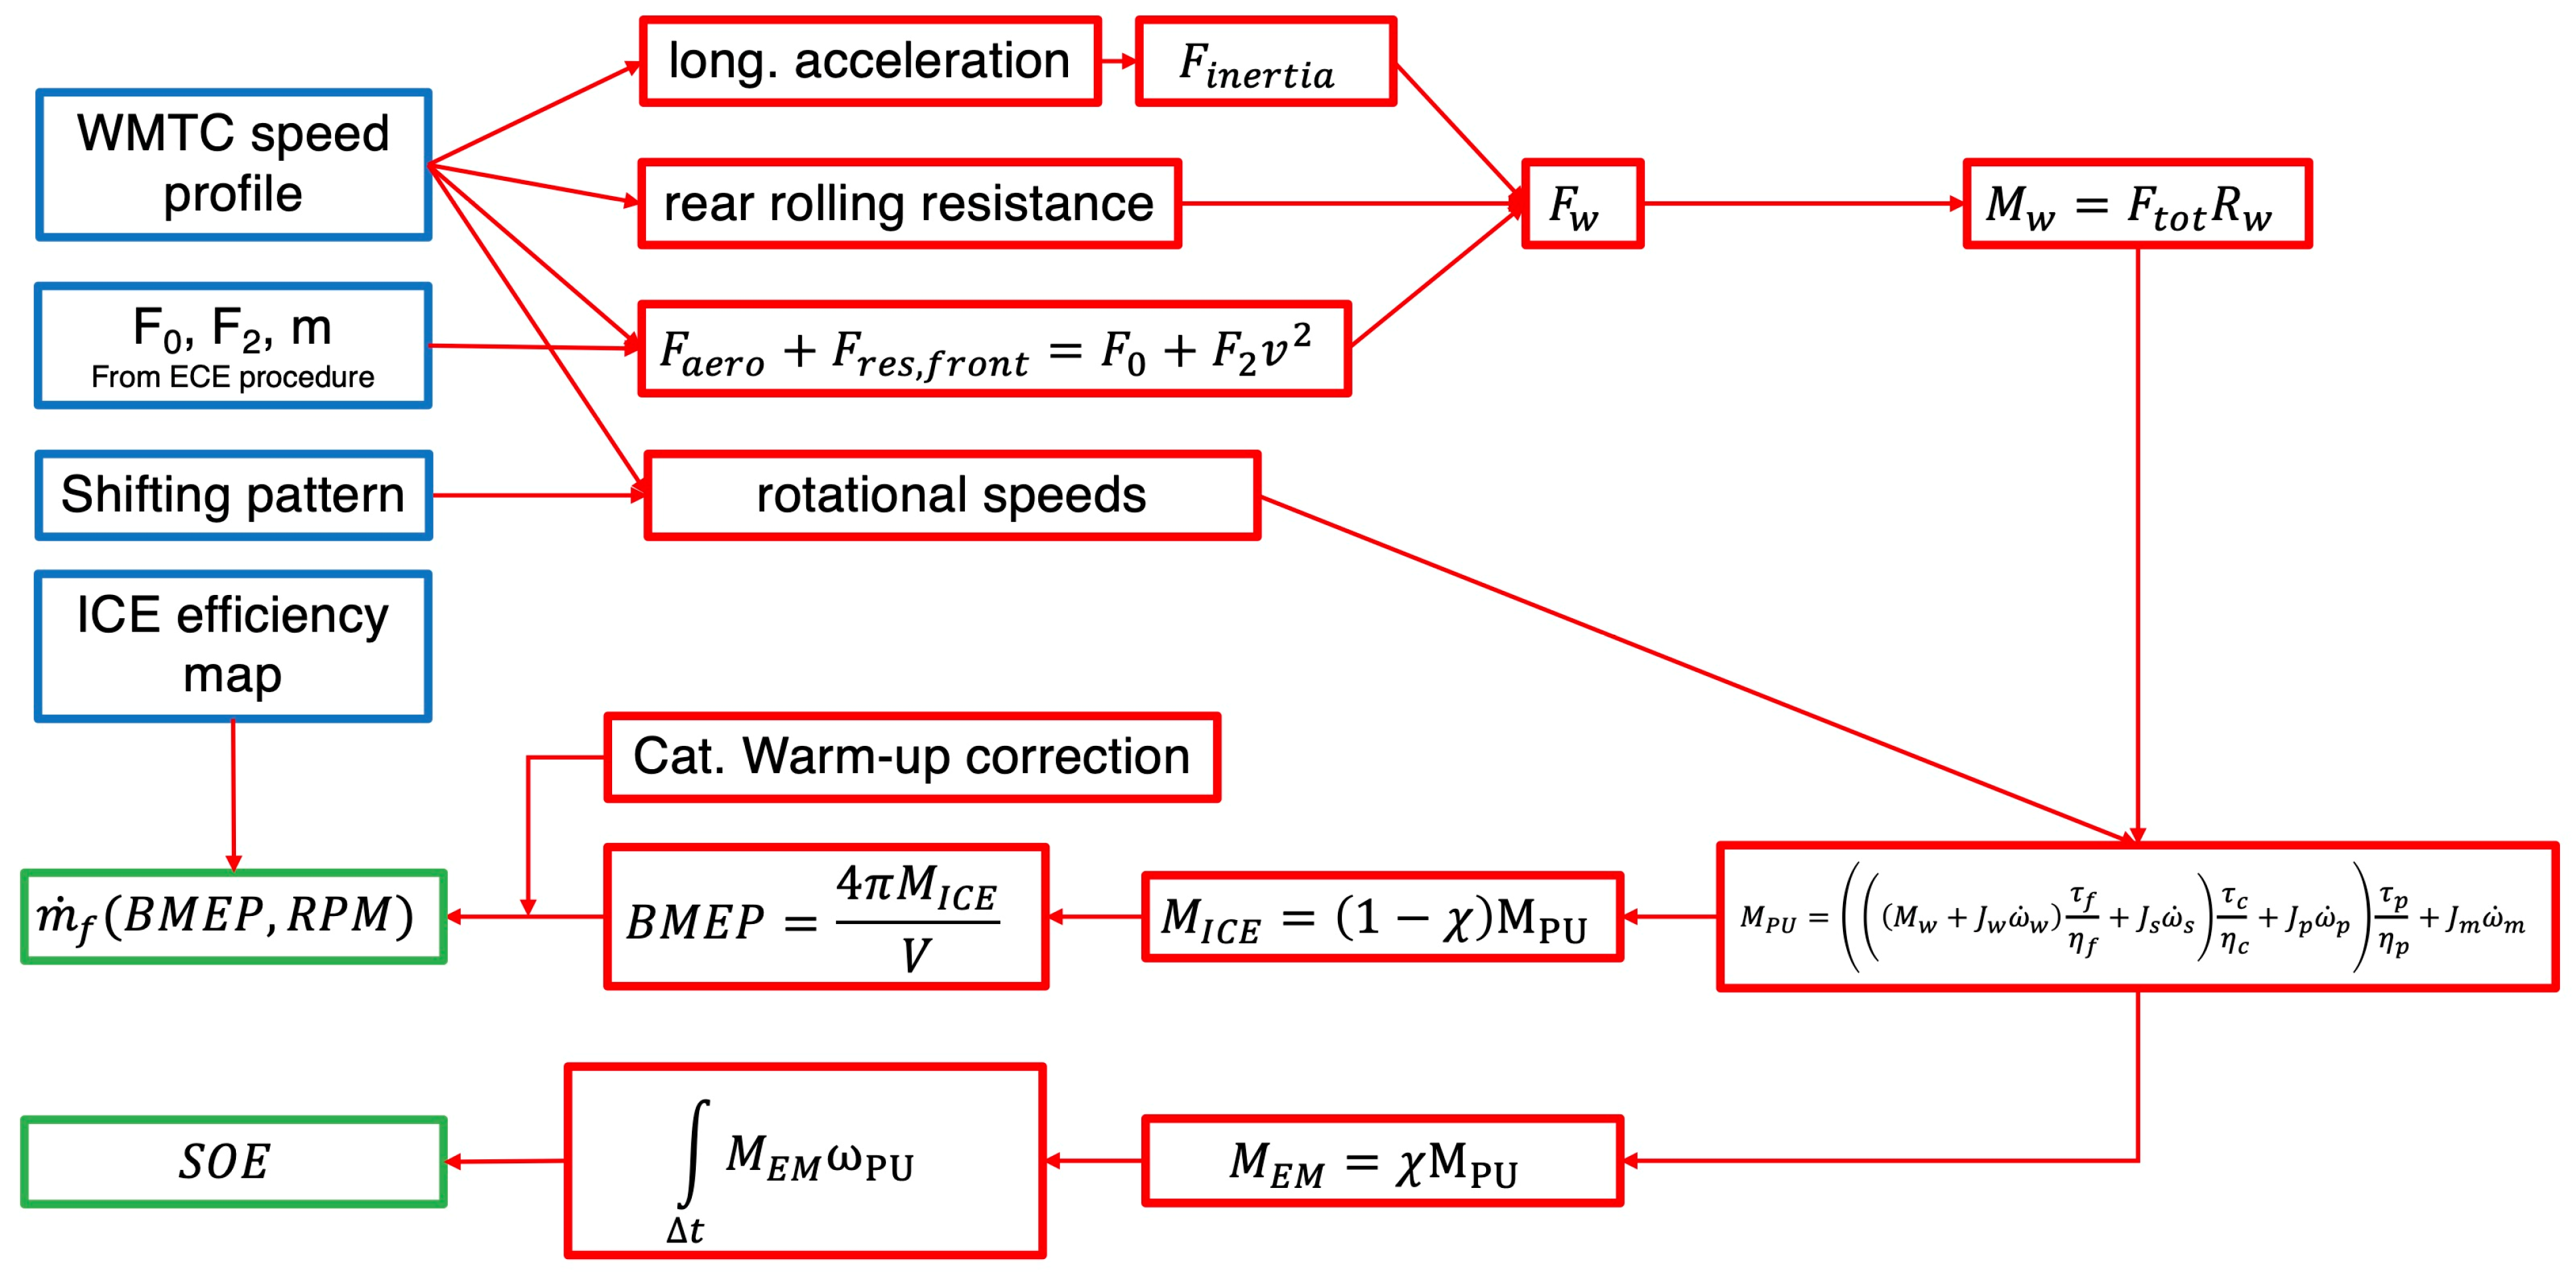
The mechanical link between the PU outlet and the gearbox requires a clutch to manage the starts from a standstill. However, the clutch has not been modeled to limit the complexity of the model. In fact, a clutch model introduces nonlinearity and requires many computations to be performed for each timestep. Instead of using a clutch model, the starts from standstill have been handled as follows: with the first gear selected, the vehicle speed starts increasing in order to follow the WMTC speed profile, and the engine starts rotating accordingly until the engine speed is below idle, instantaneous fuel consumption is kept constant and equivalent to that of the engine at idle; after reaching an engine speed above idle, standard instantaneous fuel consumption calculation is restored. This is a relevant simplification, but, in this case, its influence on the results is limited since the clutch is used only for very few seconds in the WMTC cycle. Figure 5 shows the schematic of the developed model.

3.2. Dynamic Programming

Once the total torque output of the PU for each timestep has been determined, it is necessary to choose a usage strategy for the PU. This means choosing the value of the power-split factor χ for each timestep (see Equations (10)–(12)). As mentioned before, the DP technique has been employed to investigate a possible optimal strategy [42] that minimizes fuel consumption along the cycle.
DP is an optimization method that can be used to find global minimum solutions when dealing with multistage discrete problems. It is based on Bellman’s principle of optimality [43]. It can determine the optimal control policy for the problem by operating backward in time. On the other hand, it needs a priori information on the whole optimization horizon, and it can require a high computational effort. It is particularly suitable for HEV energy management problems [30], which can usually be effectively discretized; however, it is not suitable for online calculations.

3.2.1. Problem Definition

To run DP optimizations, the governing equations of the problem have to be discretized. Therefore, the dynamical system representing the motorbike under operating conditions has been discretized as a sequence of quasi-static states as follows:
x k + 1 = f x k , u k k = 0 , 1 , , N
where x k is the variable representing the state of the system at k t h timestep and u k is the corresponding control variable driving the system. A time sequence of control actions applied to the system is defined as a policy π :
π = ( u 0 , , u N 1 )
Usually, for hybrid vehicle modeling, the state variable x is identified as the SOE of the accumulator, while the selected control variable, u , is the electric power flowing from (or to) the accumulator. Consequently, once the total required power at the generic k t h the timestep is known, and the control variable u k is defined, and the power-split factor χ can be computed.
The goal of this optimization procedure is to obtain a policy that minimizes the total cost from the first to the last timestep. Once the parameters of (16) have been chosen, further additional operations have to be performed as follows.

3.2.2. Cost Computation

For each of the k timesteps, an instantaneous cost (usually called arc-cost, L k ) is assigned to each possible taken control action, considering a specific admissible value of the control variable u applied from a specific state x at the k t h timestep, and landing at a different state in the following timestep, k + 1 .
For the particular case of the hybrid vehicle under consideration, the cost can be defined as the instantaneous fuel flow rate [30], which in turn depends on the total torque required M PU and on the value of the control applied:
L k x k , u k = m ˙ f ( BMEP ( M PU , u k ) , R P M )
Note that for every timestep k and state x k , multiple u k can be defined, and therefore multiple L k exist.
In addition, it would be possible to assign a cost also to the electrical energy consumption, with a suitable equivalency factor introduced in order to make the two costs comparable. This additional cost has not been used in the algorithm written for this study since the objective of the analysis is to quantify the maximum possible benefit in terms of fuel consumption reduction achievable from the application of the MHEV technology, thus increasing the freedom of action of the optimization algorithm. The addition of this cost would instead be necessary when taking into consideration phenomena like battery degradation.

3.2.3. Total Cost Minimization

After the cost computation phase, proceeding backward from the final timestep to the initial one, the total cost associated with moving from each specific state x k , performing a specific control action u k (within the constraints), up to the final timestep is computed. This cost is usually called cost-to-go, Y k , and a generic cost-to-go function, associated with moving from a specific state x k (at timestep k ) to the last timestep, can be defined as follows:
Y k = L k x k , u k + n = k + 1 N L n x n , u n
Bellman’s principle is then applied, reducing the computation effort. In fact, this principle states that once the optimized (cost-minimized) path from the state x k has been found, it is always the optimized path from that state and timestep moving forward, independently from what control actions have been taken in the precedent steps. This means that this calculation only needs to be performed once for each state x k and control input u k at timestep k , and the result can be stored and used for calculation when moving backward to timestep k 1 . Therefore, (20) can be rewritten as follows:
Y k = L k x k , u k + Y k + 1 ~ x k , u k
where Y k + 1 ~ ( x k , u k ) is the optimized (minimized) cost-to-go from the state x k + 1 , which will be reached at timestep k + 1 by applying the control action u k from the state x k at timestep k (hence the dependency of Y k + 1 ~ on x k and u k ). Therefore, for each state at timestep k the optimized (minimized) cost-to-go can be found by selecting the control action that minimizes it, u k ~ :
u k ~ = arg min u k U k L k x k , u k + Y k + 1 ~ x k , u k
Consequently, the optimized (minimized) cost-to-go ratio can be expressed as follows:
Y k ~ x k , u k ~ = L k x k , u k ~ + Y k + 1 ~ x k , u k ~
when these computations have been performed for all the N steps, the optimized (minimized) cost for moving along the prescribed cycle is obtained, together with the optimized control policy:
π ~ = u 0 ~ , , u N 1 ~

3.2.4. Problem Discretization

To determine the right compromise between the accuracy of the results and acceptable calculation times, the right discretization size must be chosen. Time discretization has been set to 1 s (which actually represents the timestep adopted in the ECE procedure) for a total duration of the cycle equal to 1800 s. Attempts have been made to reduce the size of the timestep, and no significant variation in the results has been observed.
The discretization step adopted within the range of variation of both the state variable and the control variable, instead, has been chosen following a sensitivity analysis, the results of which are beyond the scope of this article. Specifically, the battery, modeled as a simple energy reservoir as stated before, has been discretized in steps of 100 J. Similarly, the step for electric power is 100 W. The size of these steps is constant, regardless of the maximum power of the EM or the size of the accumulator. Therefore, the simulations for configurations considering different HRs and accumulator sizes will have different run times since the optimization space has different dimensions. As a reference, the computation time for an average accumulator size of 2000 kJ and an average HR of 3.75% is about 8 h on a 16-core machine.

3.2.5. Constraints

In the following, the primary constraints for the optimization algorithm are described as follows:
  • Final SOE equal to initial SOE
If the final SOE is lower than the initial SOE, the ECE procedure requires correction for fuel consumption and CO2 emissions [37]. Conversely, if the final SOE is higher than the initial SOE, the fuel consumption and emissions will be higher than necessary. The initial SOE value has been set at 50% for every configuration tested. Moreover, upper and lower SOE limitations are set respectively at 80% and 20% of the maximum accumulator capacity in order to limit battery aging issues, which are correlated to the depth of charge/discharge [44].
  • ICE power is always higher than the threshold P ICE , m i n
Considering that, due to the discretization of the different parameters in the algorithm, the minimum non-zero value of the EM power output is equal to 0.1 kW, the same minimum value has been considered for the P ICE , m i n parameter, in order to avoid a condition in which the ICE is driven by the EM, wasting energy.
  • Electric motor maximum power
Regarding the constraints governing maximum EM power, they depend on the specific operating mode of the PU. Specifically, three modes of operation for the PU have been established depending on the value of the required propulsion power, P PU . The modes are described as follows:
  • if P PU > 0 , the operating envelope is defined as follows:
    o
    if P PU P EM , m a x , the EM will have an operating envelope in the form [ P EM , m a x ÷ ( P PU P ICE , m i n )].
    o
    if P PU > P EM , m a x , the EM will have an operating envelope in the form [ P EM , m a x ÷ P EM , m a x ].
  • if P PU < 0 , kinetic energy recovery is activated:
    o
    if | P PU | P EM , m a x , all the kinetic energy is recovered, and none is wasted in heat through the brakes.
    o
    if | P PU | > P EM , m a x , the EM regenerates as much kinetic energy as possible, and the rest is wasted in mechanical braking.
  • if P PU = 0 , P ICE and P EM are set to 0.

3.2.6. Preliminary Model Validation

A first run of the model has been performed using χ = 0 for every timestep and no added mass, thus simulating the pure ICE motorbike along the WMTC cycle. DP optimization has not been performed, and only fuel consumption has been computed.
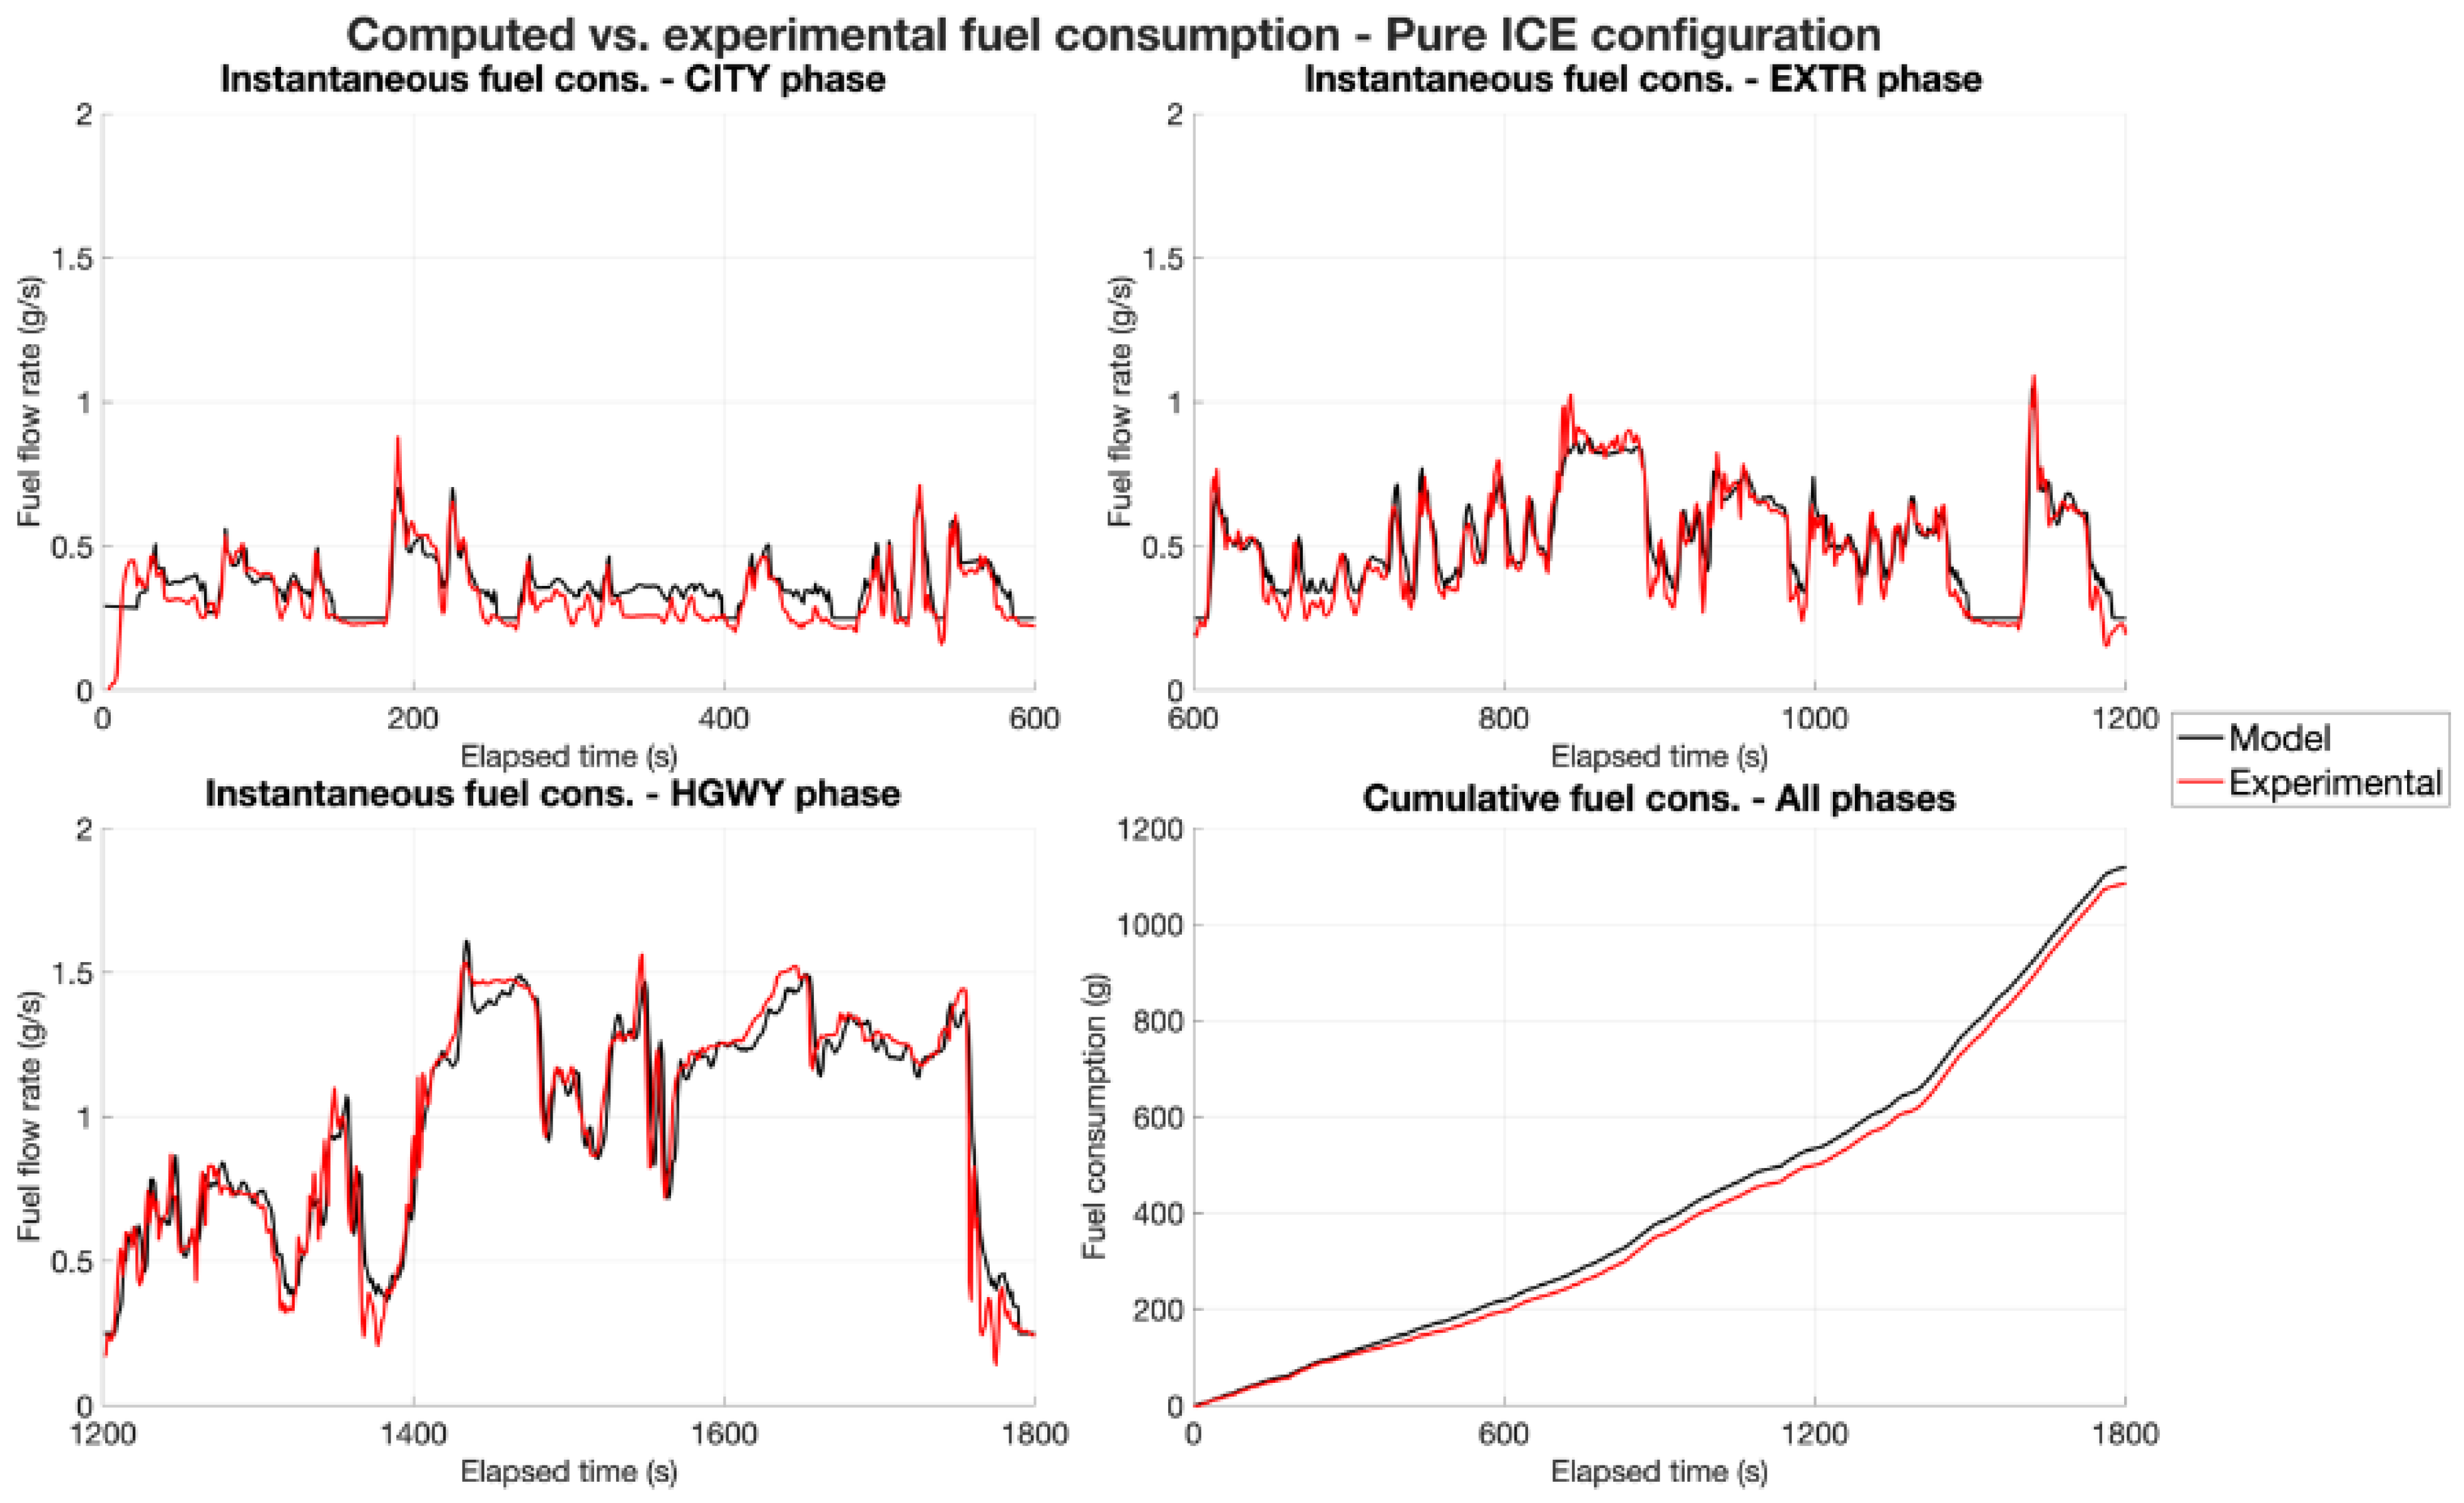
The output, in terms of instantaneous fuel consumption, has then been compared to the experimental data of the same motorbike in a real-world homologation test, performing the same cycle. The results of this comparison are shown in Figure 6. For the sake of clarity, the results have been split into three regions in time: the city cycle (CITY—from 0 s to 600 s), the extra-urban cycle (EXTR—from 600 s to 1200 s), and the highway cycle (HGWY—from 1200 s to 1800 s).
The results show a very good correlation between the model and experimental data, with a significant instantaneous error only for extremely low engine loads. In fact, in the corresponding regions of the efficiency map, the experimental data may be affected by a measurement deviation due to the extremely low values of the fuel flow rate. Nevertheless, the total error among the whole cycle is less than 3%.

3.2.7. Simulations Setup

The goal is to find an optimal sizing of the EM and of the accumulator. To do so, a set of simulations running different PU configurations (in terms of component sizing) have been performed. Since the proposed PU is based on MHEV technology, the range of analyzed EM sizes has been set between 0.5 kW and 7 kW, with 0.5 kW steps. Consequently, the resulting HR varies from 0.4% to 5.6% considering an unmodified ICE.
The accumulator size range, instead, has been set from 500 kJ to 4000 kJ, with 500 kJ steps. The minimum size is around the nominal energy content of a single accumulator string described in the “Topology and System Description” section. Each 500 kJ step adds a capacity value similar to that of the single string to consider only feasible configurations without altering the nominal voltage. The maximum size has been limited to contain the mass increase of the motorbike.
A grid of all the possible configurations is shown in Table 1. Some of the configurations are not feasible and are blanked out in the grid, corresponding to a high EM power and low accumulator capacity. In fact, if the power output from the battery does not match the EM power, the configuration is deemed unfeasible (dark gray). On the other hand, some of the configurations feature a high accumulator capacity with a low EM power (light gray). These configurations are technically feasible; however, it is assumed that such a high capacity would not be fully exploited with a small-sized EM, thereby adding unnecessary mass. Nonetheless, some of these configurations have been selected for testing so to confirm this hypothesis. Not all feasible configurations have been tested in order to reduce the total computation time.
The first configuration selected refers to an EM size of 3 kW, which corresponds to the average power level required during the WMTC cycle. An intermediate value of accumulator capacity of 2000 kJ has been chosen as a basis. From there, other configurations have been selected at the same power level but with different accumulator capacities and, vice versa, at the same accumulator capacities with different power levels to highlight potential trends in both directions as well as the effects of the different kinds of contributions to the total fuel consumption variation. Additionally, extremal configurations at the boundaries of the table have been selected.
The selected configurations are reported in Table 1, and a two-digit number (highlighted in yellow) has been used to identify each of them. For each configuration, a mass increase over the standard ICE motorbike has been estimated as described in the “Topology and System Description” section. The mass increase has also been reported in Table 1, along with the corresponding configuration.

4. Results

For all the configurations selected in Table 1, the instantaneous and the total fuel consumptions have been computed after optimizing the strategy using the DP algorithm. The computation algorithm procedure is described below.
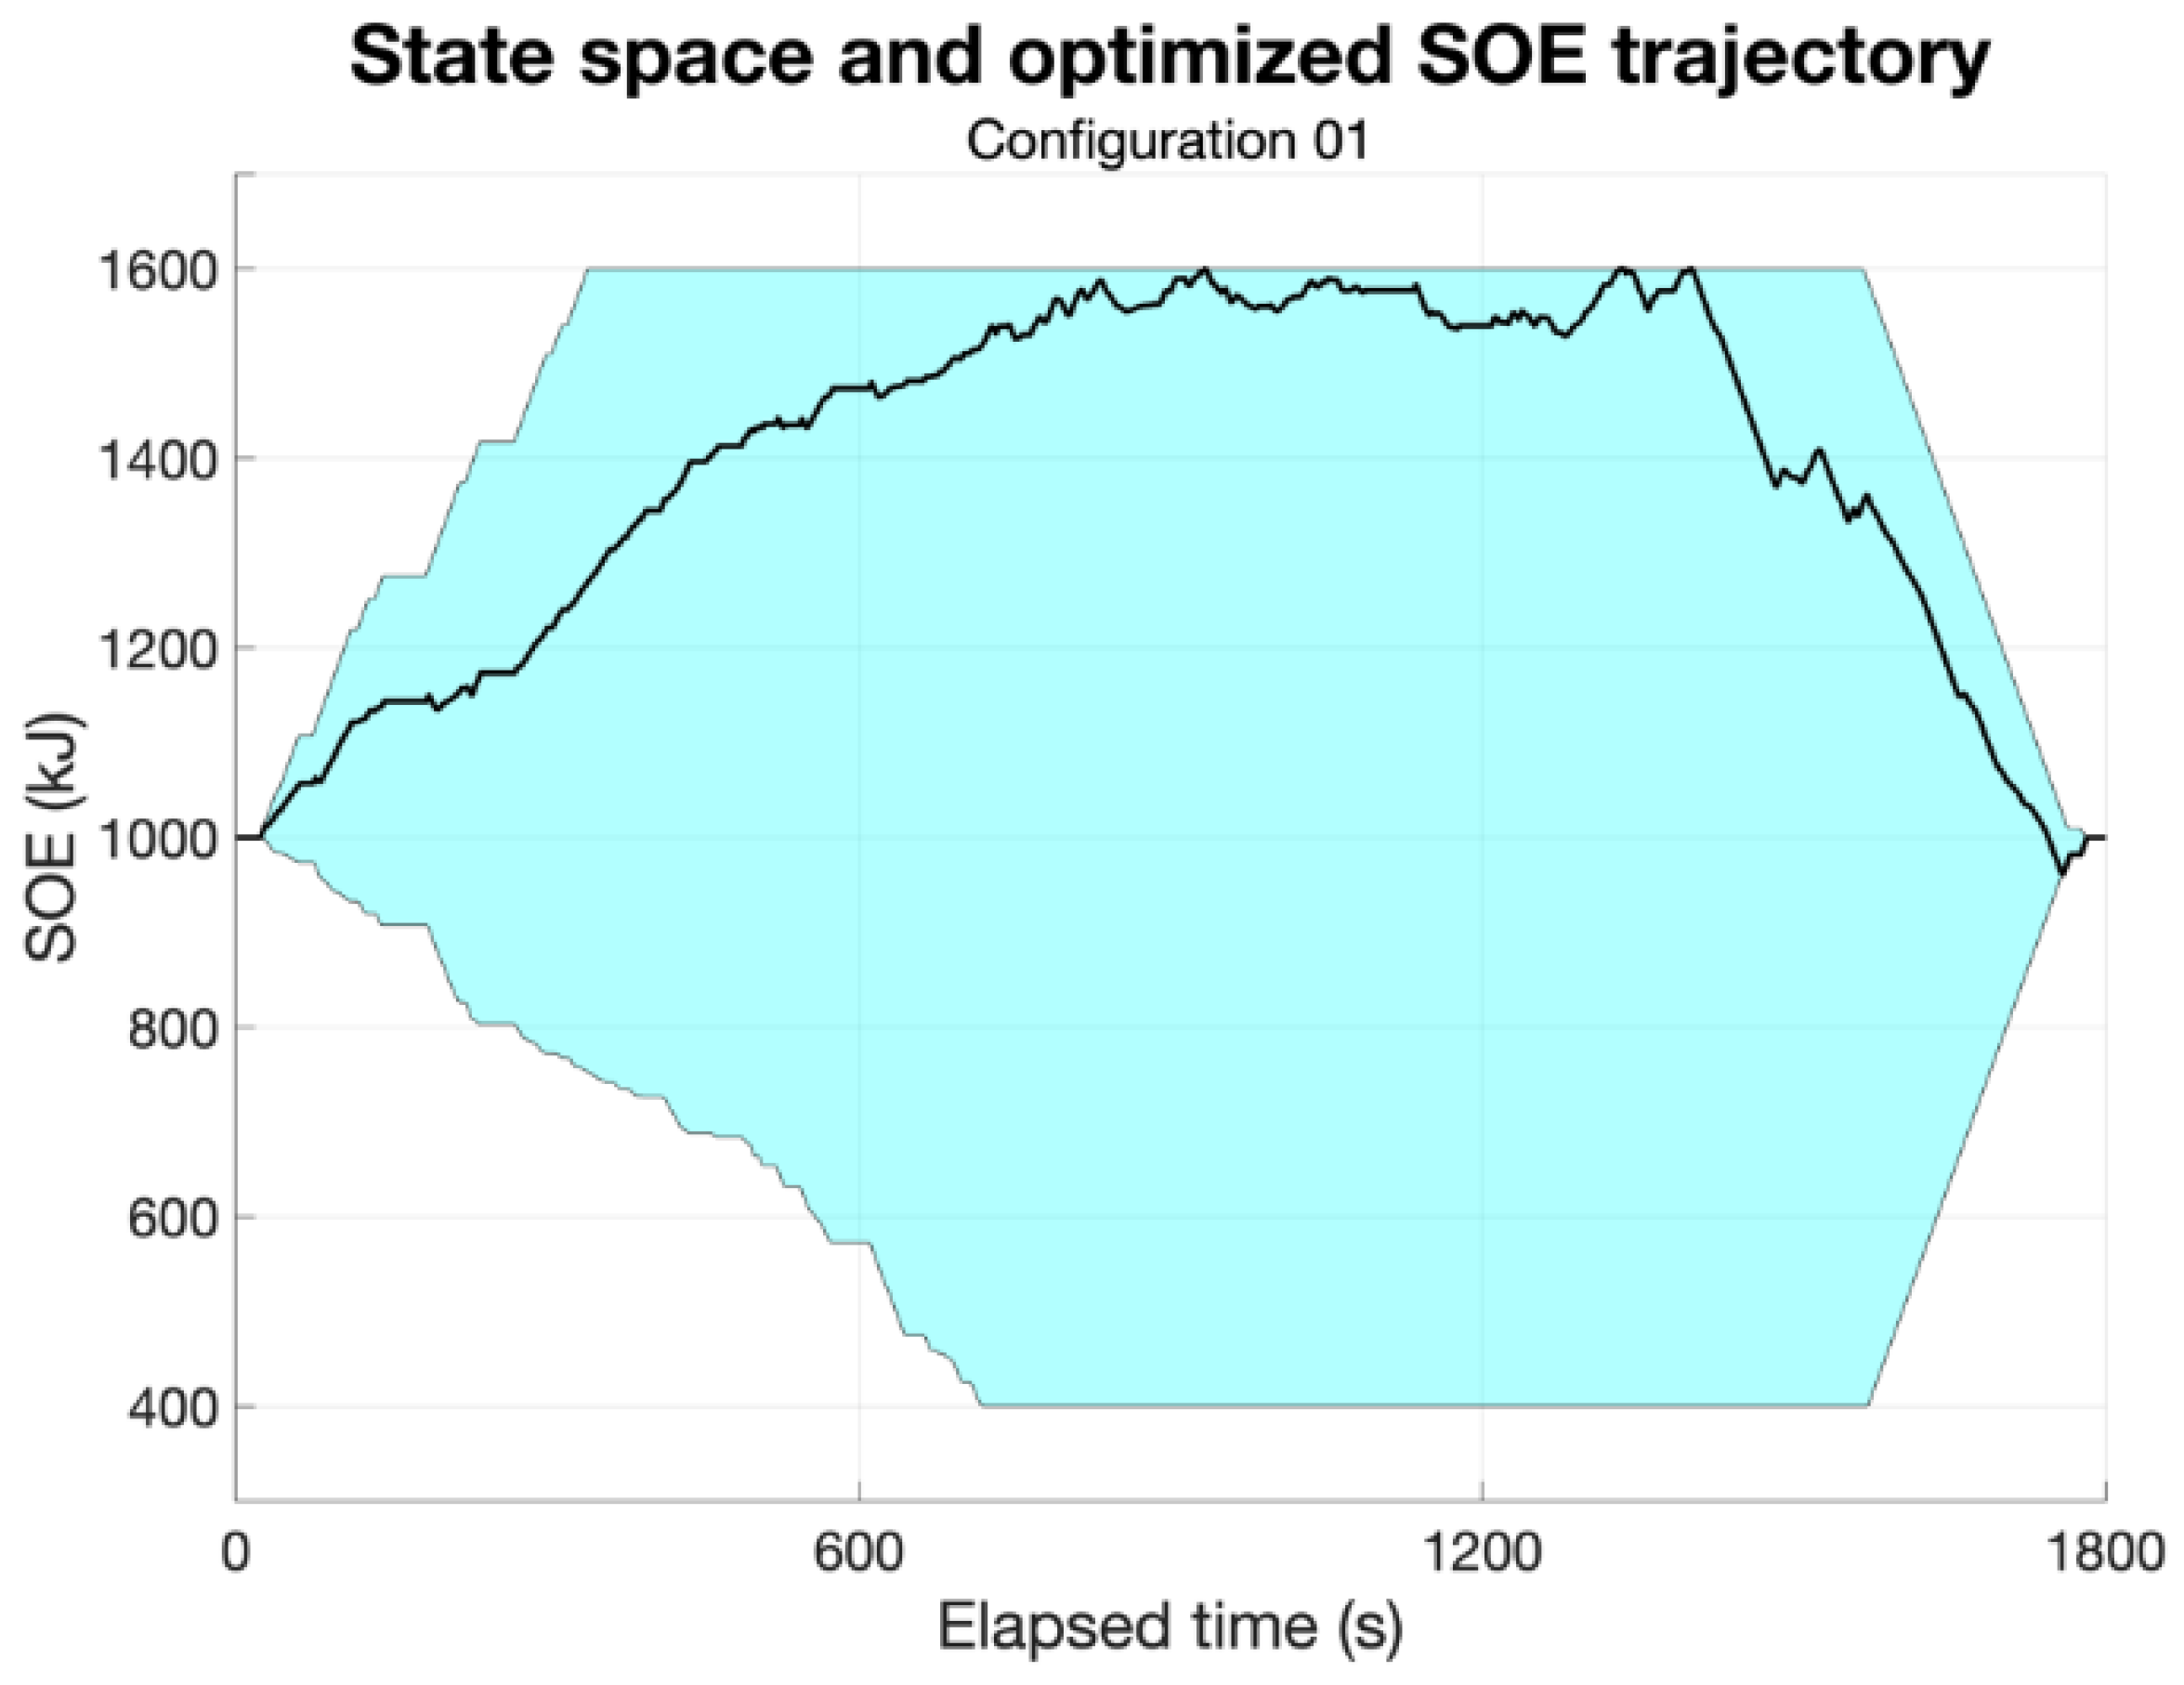
At the beginning of the simulation, the state space is calculated (cyan area in Figure 7). This is obtained by considering the electric power limits starting from the initial SOE. Therefore, the maximum increase and decrease in SOE for every timestep depends on the instantaneous operating envelope of the EM and the upper and lower SOE limitations, as described in the “Constraints” subsection. Figure 7 shows that in the CITY phase, the average available charging power is higher than the average available discharging power (slopes of the boundary of the state space on the left). This is due to the low average value of the required power, P P U . On the other hand, in the HGWY phase, the average value of P P U is higher than the charge and discharge power limits. Therefore, it is possible to utilize the whole EM power envelope, and thus, the slopes exactly represent the EM size (right boundary of the state space). Approaching the end of the cycle, the maximum and minimum values of the SOE are then limited to ensure landing at the prescribed target.
Then, DP strategy optimization is performed, and the optimized SOE trajectory along the cycle is shown for Configuration 01 (black curve in Figure 7). This trajectory shows an SOE increase in the CITY phase, an SOE hold in the EXTR phase, and a discharge down to the target SOE in the HGWY phase, and this trend is common for all configurations. In fact, in the CITY phase, the ICE operates in a remarkably low-efficiency zone of the map. Therefore, it is more convenient to increase the engine load and shift the operating point to a higher-efficiency zone. Of course, at this operating point, the PU delivers more power than required, but the excesse energy can be stored in the accumulator. The instantaneous fuel consumption increases, but the energy is converted more efficiently, and the stored energy can be used in the next phases. In the HGWY phase, the instantaneous fuel consumption is quite high because of the high power required; therefore, reducing the engine load and using most of the previously stored energy in this phase is particularly advantageous.
For the aim of this article, the comparison between the different phases of the WMTC in different configurations needs to be analyzed in terms of fuel consumption. In particular, each configuration has been compared to the baseline ICE configuration, evaluating the fuel consumption reduction with the proposed MHEV architecture. Table 2 shows the results for all the configurations tested along the whole WMTC, while Table 3, Table 4, and Table 5 show the results split for the CITY, EXTR, and HGWY phases, respectively. Note that the DP optimization has been run for each configuration considering the whole cycle and not split in each single phase.
Looking at each phase separately, it is clear that low-power/low-capacity configurations provide a considerable advantage in the CITY phase. This is due to the lower mass added since, in this phase, the amount of acceleration is higher due to a considerable amount of stop-and-go, which makes a higher mass more penalizing. Another key factor is that the average power required in this phase is comparable to the electric power of the low-power configurations.
On the other hand, high-power/high-capacity configurations show an important advantage in the HGWY phase. This is due to the average power required, which is much higher than that required in the other phases. A higher capacity helps to provide a good amount of energy to spend in this phase. In this case, a higher mass related to the higher capacity of the accumulator is not penalized because of the lower values of acceleration that characterize the HGWY phase.

4.1. Kinetic Energy Recovery Contribution

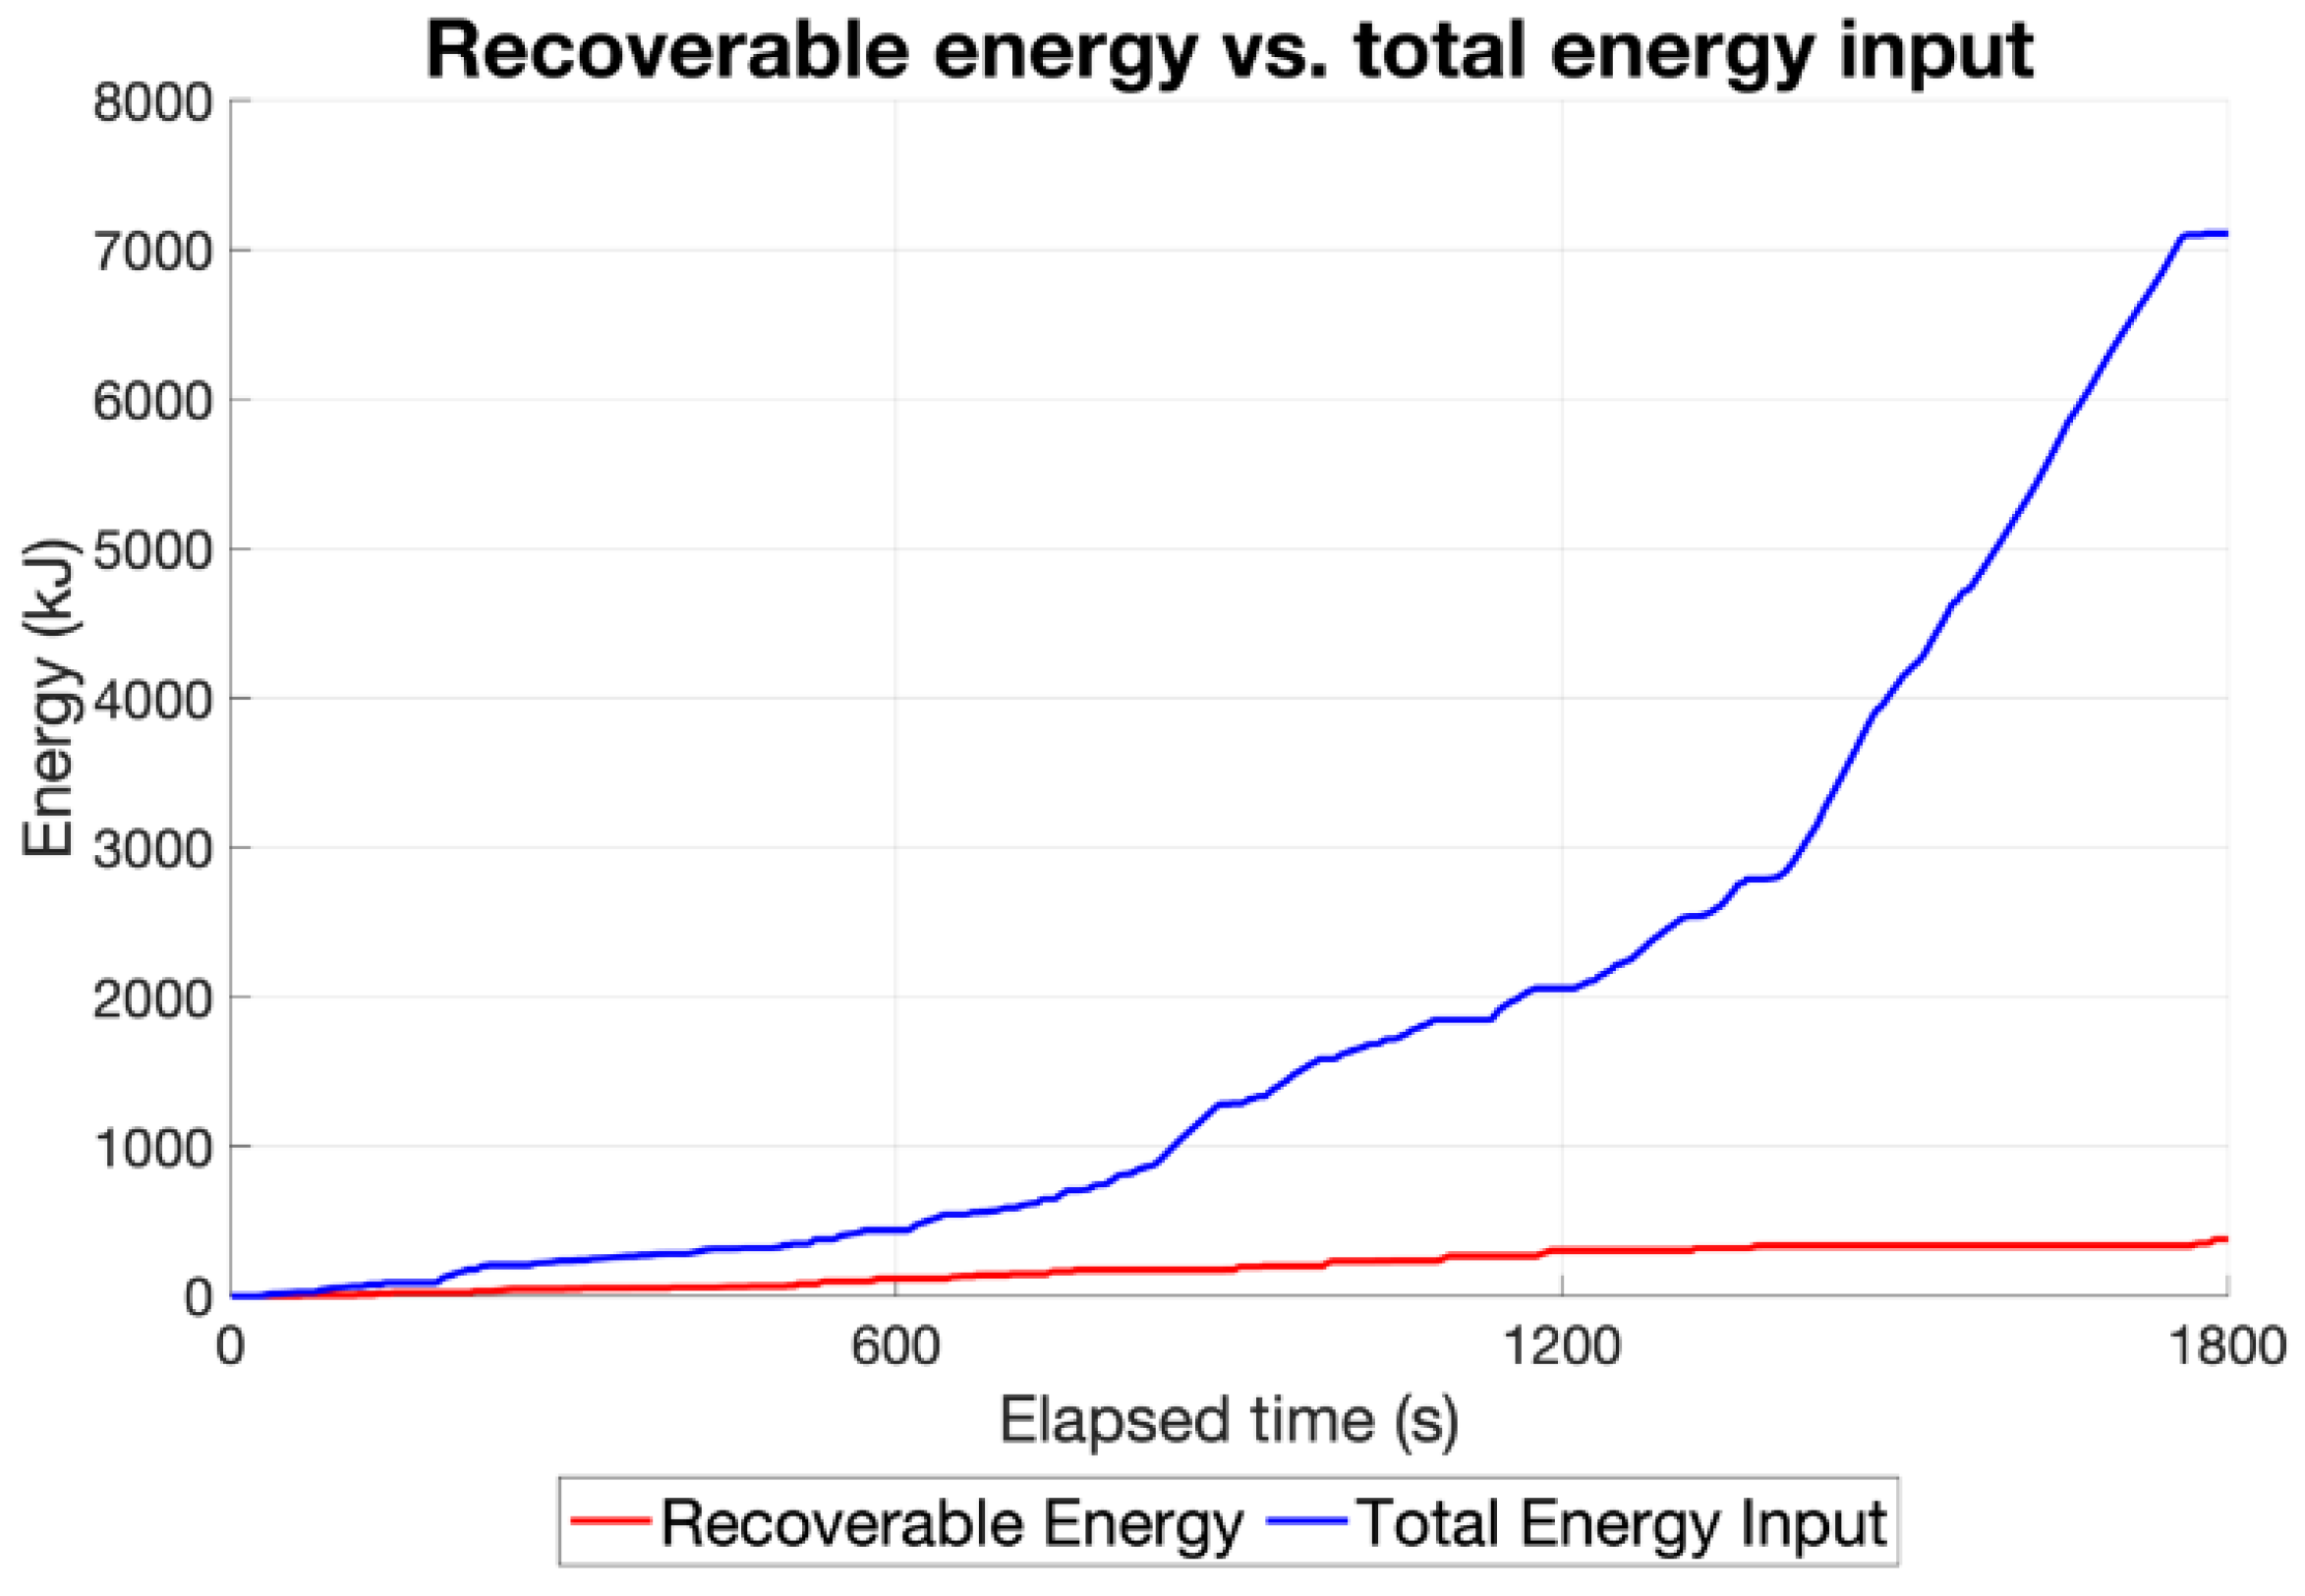
To understand the potential for kinetic energy recovery, it is necessary to evaluate the quantity of energy at stake during the homologation cycle. The resisting force also acts during the slow-down phases, thus reducing the amount of energy that can be recovered. Therefore, it is necessary to estimate the power flows in order to properly calculate the energy levels, rather than simply calculating the kinetic energy of the motorbike.
This analysis shows an order of magnitude difference along the cycle between the energy delivered by the powertrain and the energy dissipated through the brakes. The latter represents the total energy available for recovery and is indeed ca. 5.3% of the total energy delivered by the powertrain (Figure 8).
An important consideration for motorbikes is the fact that, with this topology, recovery can be achieved only through the rear wheel. The rear wheel generally transfers only a small part of the braking power due to the high load transfer during braking and dynamic stability issues. Consequently, the amount of energy that is actually recoverable, in practical terms, needs to be reduced by at least half in the best-case scenario. All these considerations have led to the conclusion that kinetic energy recovery is not a significant advantage in an MHEV motorbike. A small amount of energy can always be recovered once the system is installed on a motorbike, which increases the overall efficiency of the system; however, this increase is marginal.

4.2. Load-Point Shifting Contribution

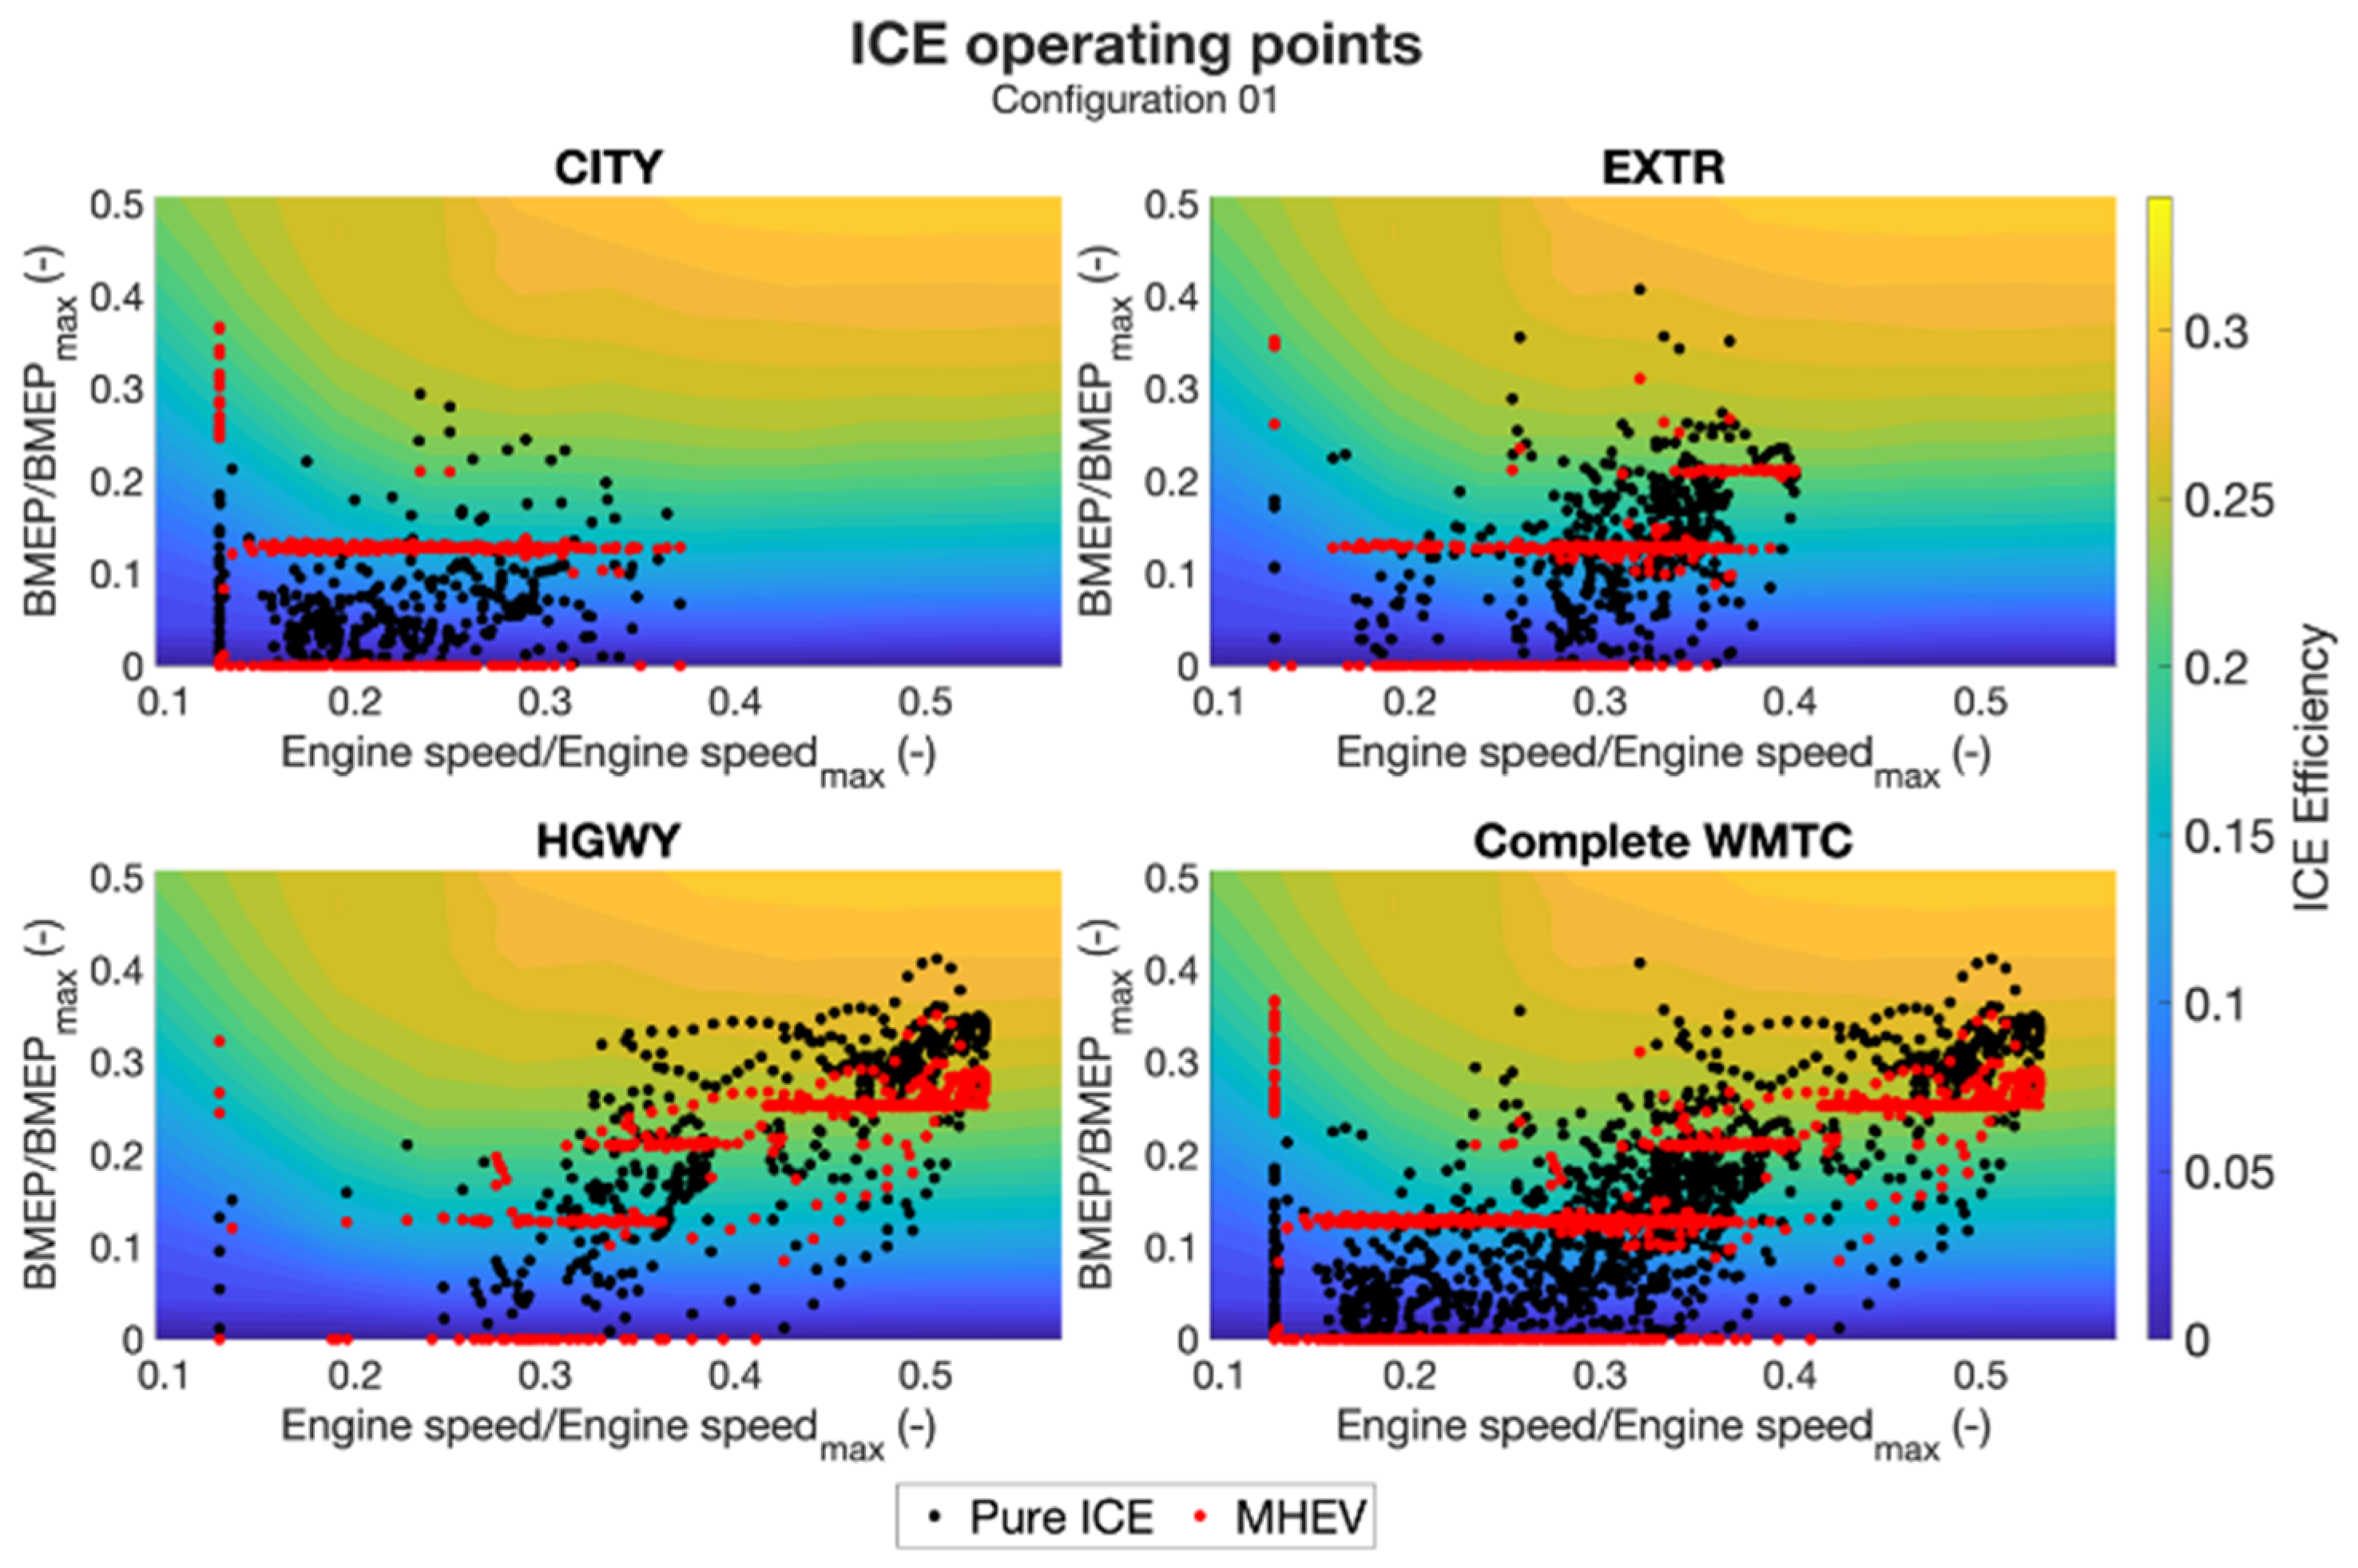
In this section, the effects of the adoption of a load-point shifting strategy are discussed. In Figure 9, the operating points of the ICE are shown for both the pure ICE (in black) and MHEV configurations (in red). Configuration 01 has been chosen as an example. For the sake of clarity, the results are subdivided into the three phases of the cycle, but a complete cycle chart is also shown. In the CITY phase, most of the operating points are condensed to a single BMEP level. In this phase, the ICE is operating at a higher load than required by the road load. A specific level is selected by the algorithm considering the EM operating envelope and represents the most efficient reachable operating point for the given engine speed and deliverable torque.
In particular, a single operating point can be shifted by considering the maximum power of the EM in a specific configuration. Similarly, in the other phases, where the power delivered is higher, different levels can be selected.
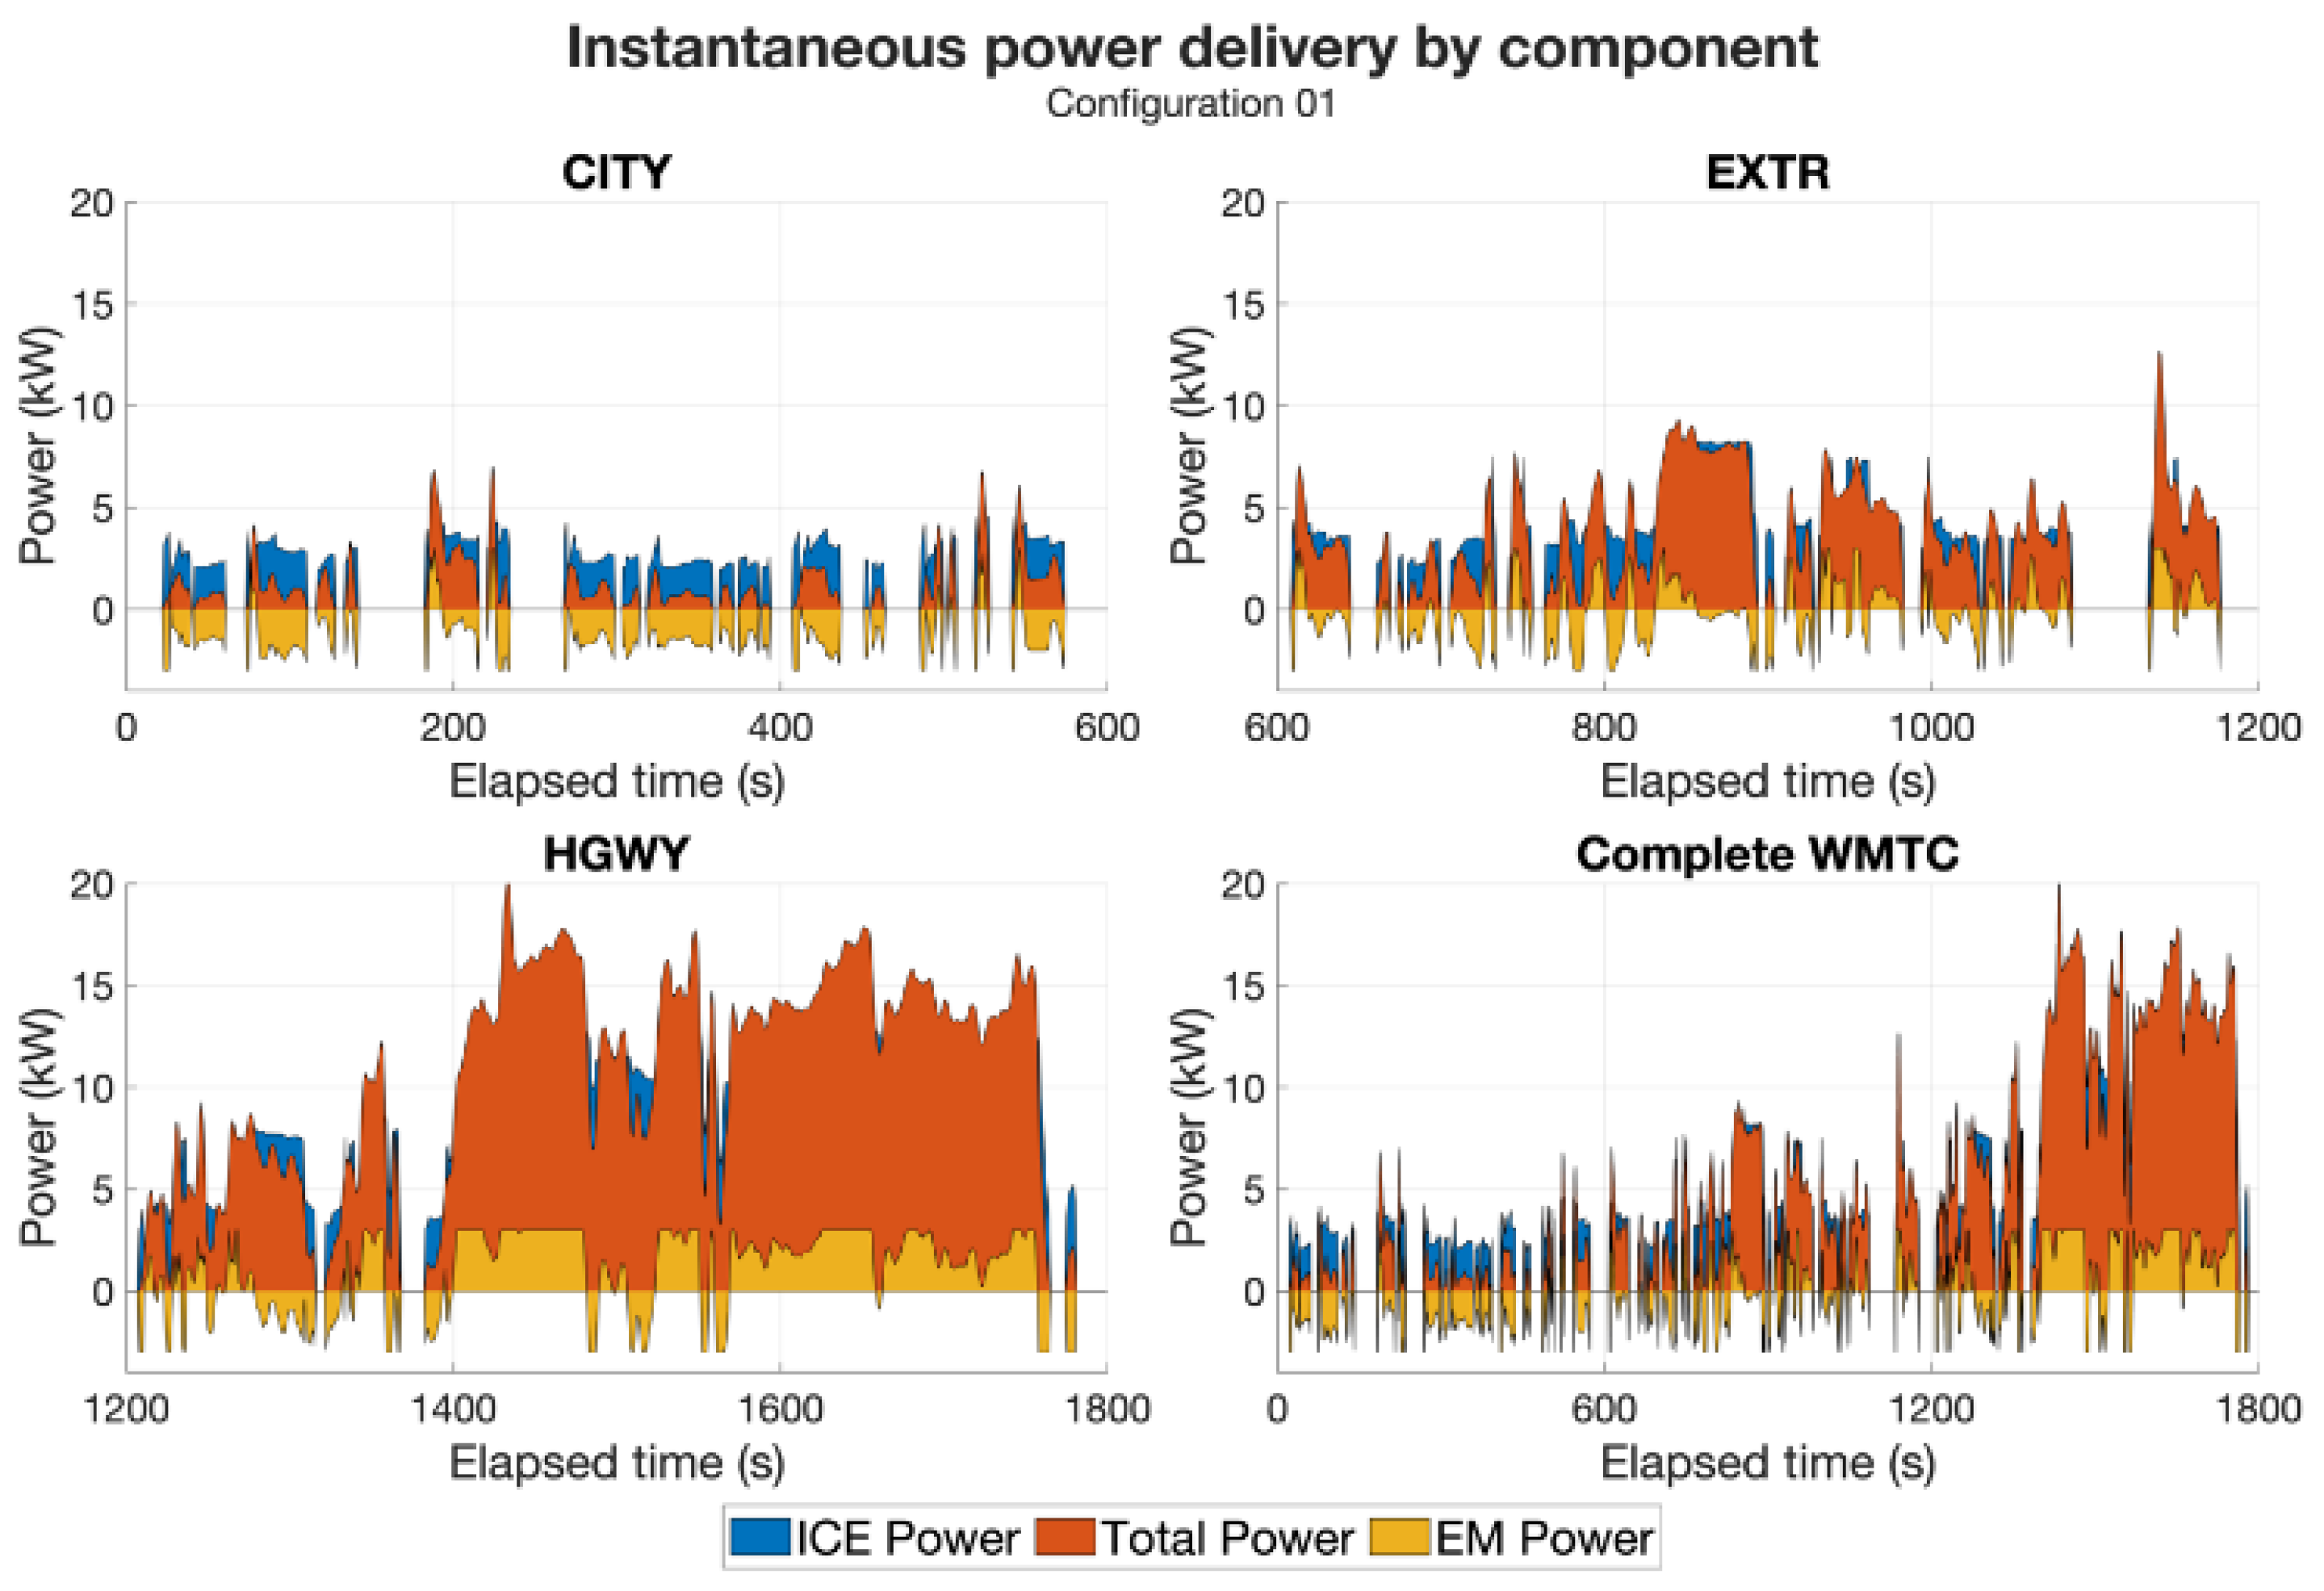
Figure 10 shows the instantaneous power delivery from the ICE and EM compared to the instantaneous total power delivery. It is possible to clearly identify the previously discussed trends in harvesting energy in the CITY phase and using it in the HGWY phase. In fact, looking at the instantaneous EM power, it is mostly negative in the CITY phase and mostly positive in the HGWY phase.

4.3. Effects of the EM Size

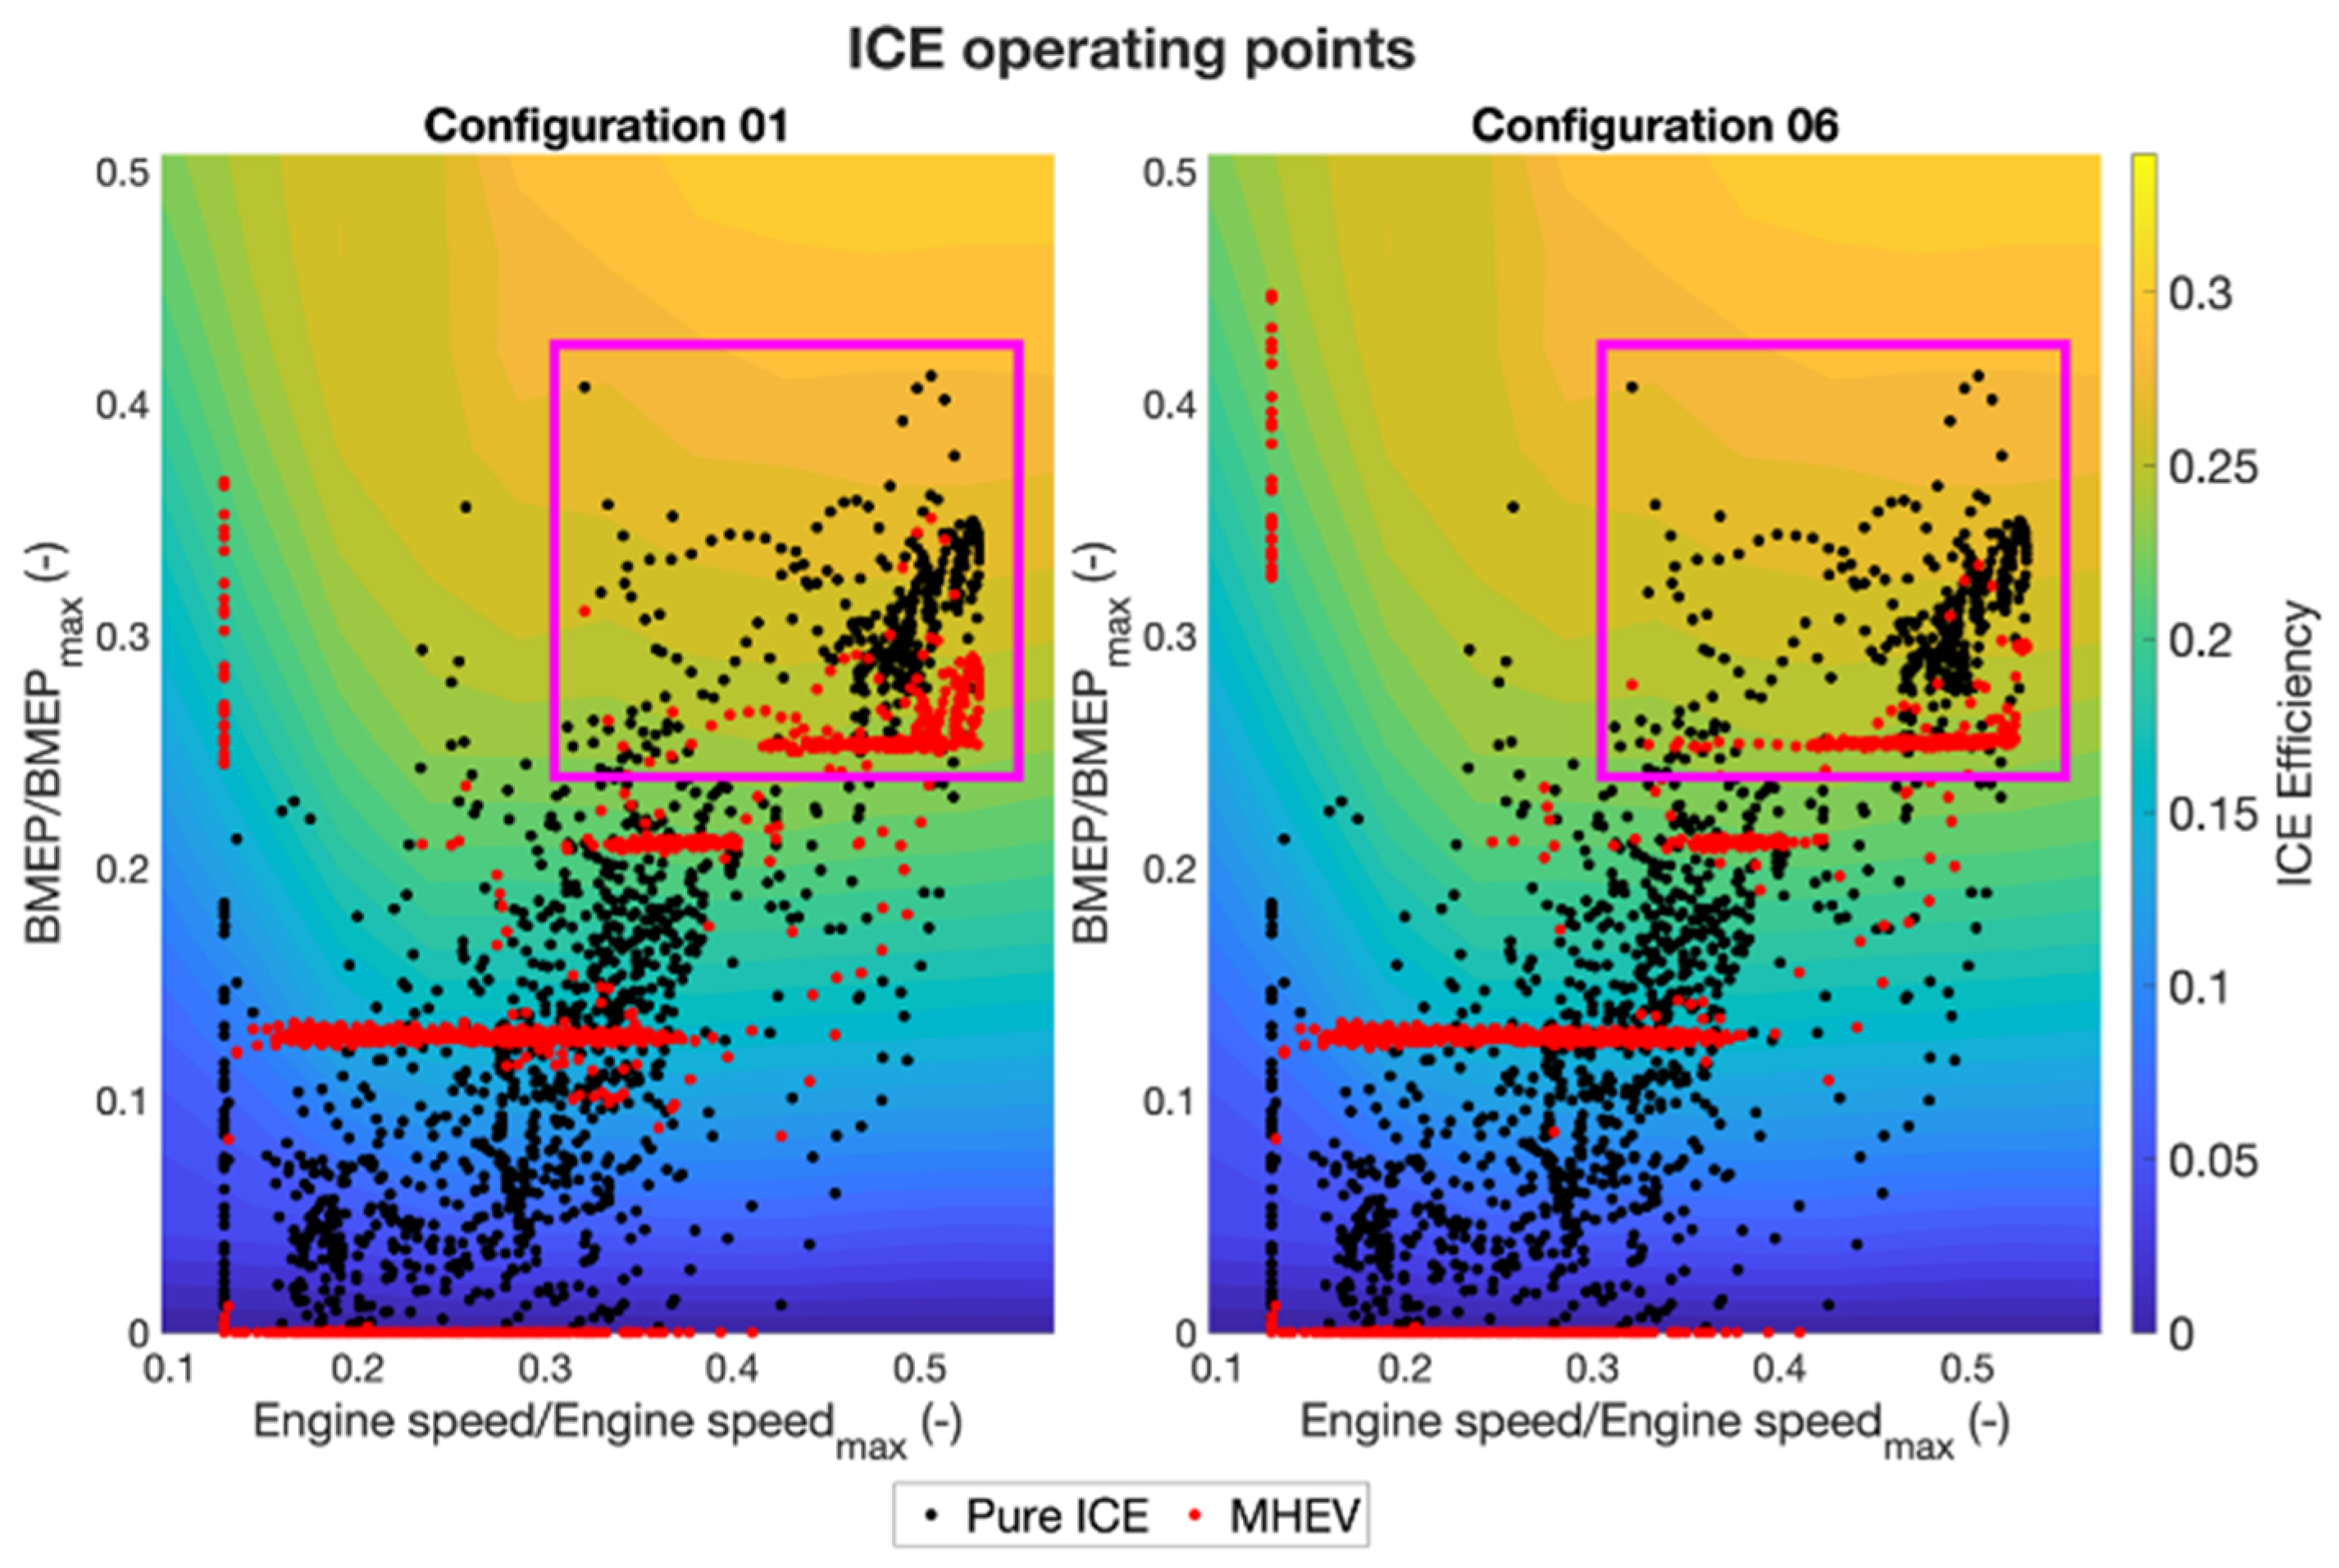
In this section, the effects of EM size on the results are discussed. A first consideration is that having a maximum EM power close to the average power used in the cycle, i.e., 4 kW, seems to be a good design starting point because it provides the DP algorithm the freedom to always choose the most convenient ICE operating point. This is clearly shown when analyzing configurations 01 and 06 (comparison in Figure 11), with the former having 3 kW EM power and the latter 4 kW, with the same accumulator capacity. The highest power operating points in the cycle, in configuration 01, are not condensed onto a single BMEP level, while they are in configuration 06.
From this comparison, it can be deduced that the level of power of configuration 06 is enough to allow the strategy to have maximum freedom in choosing the operating point of the ICE; having more electric power might help slightly in harvesting energy when possible, but would also add mass which is a penalty in the CITY phase and in general for a motorbike.
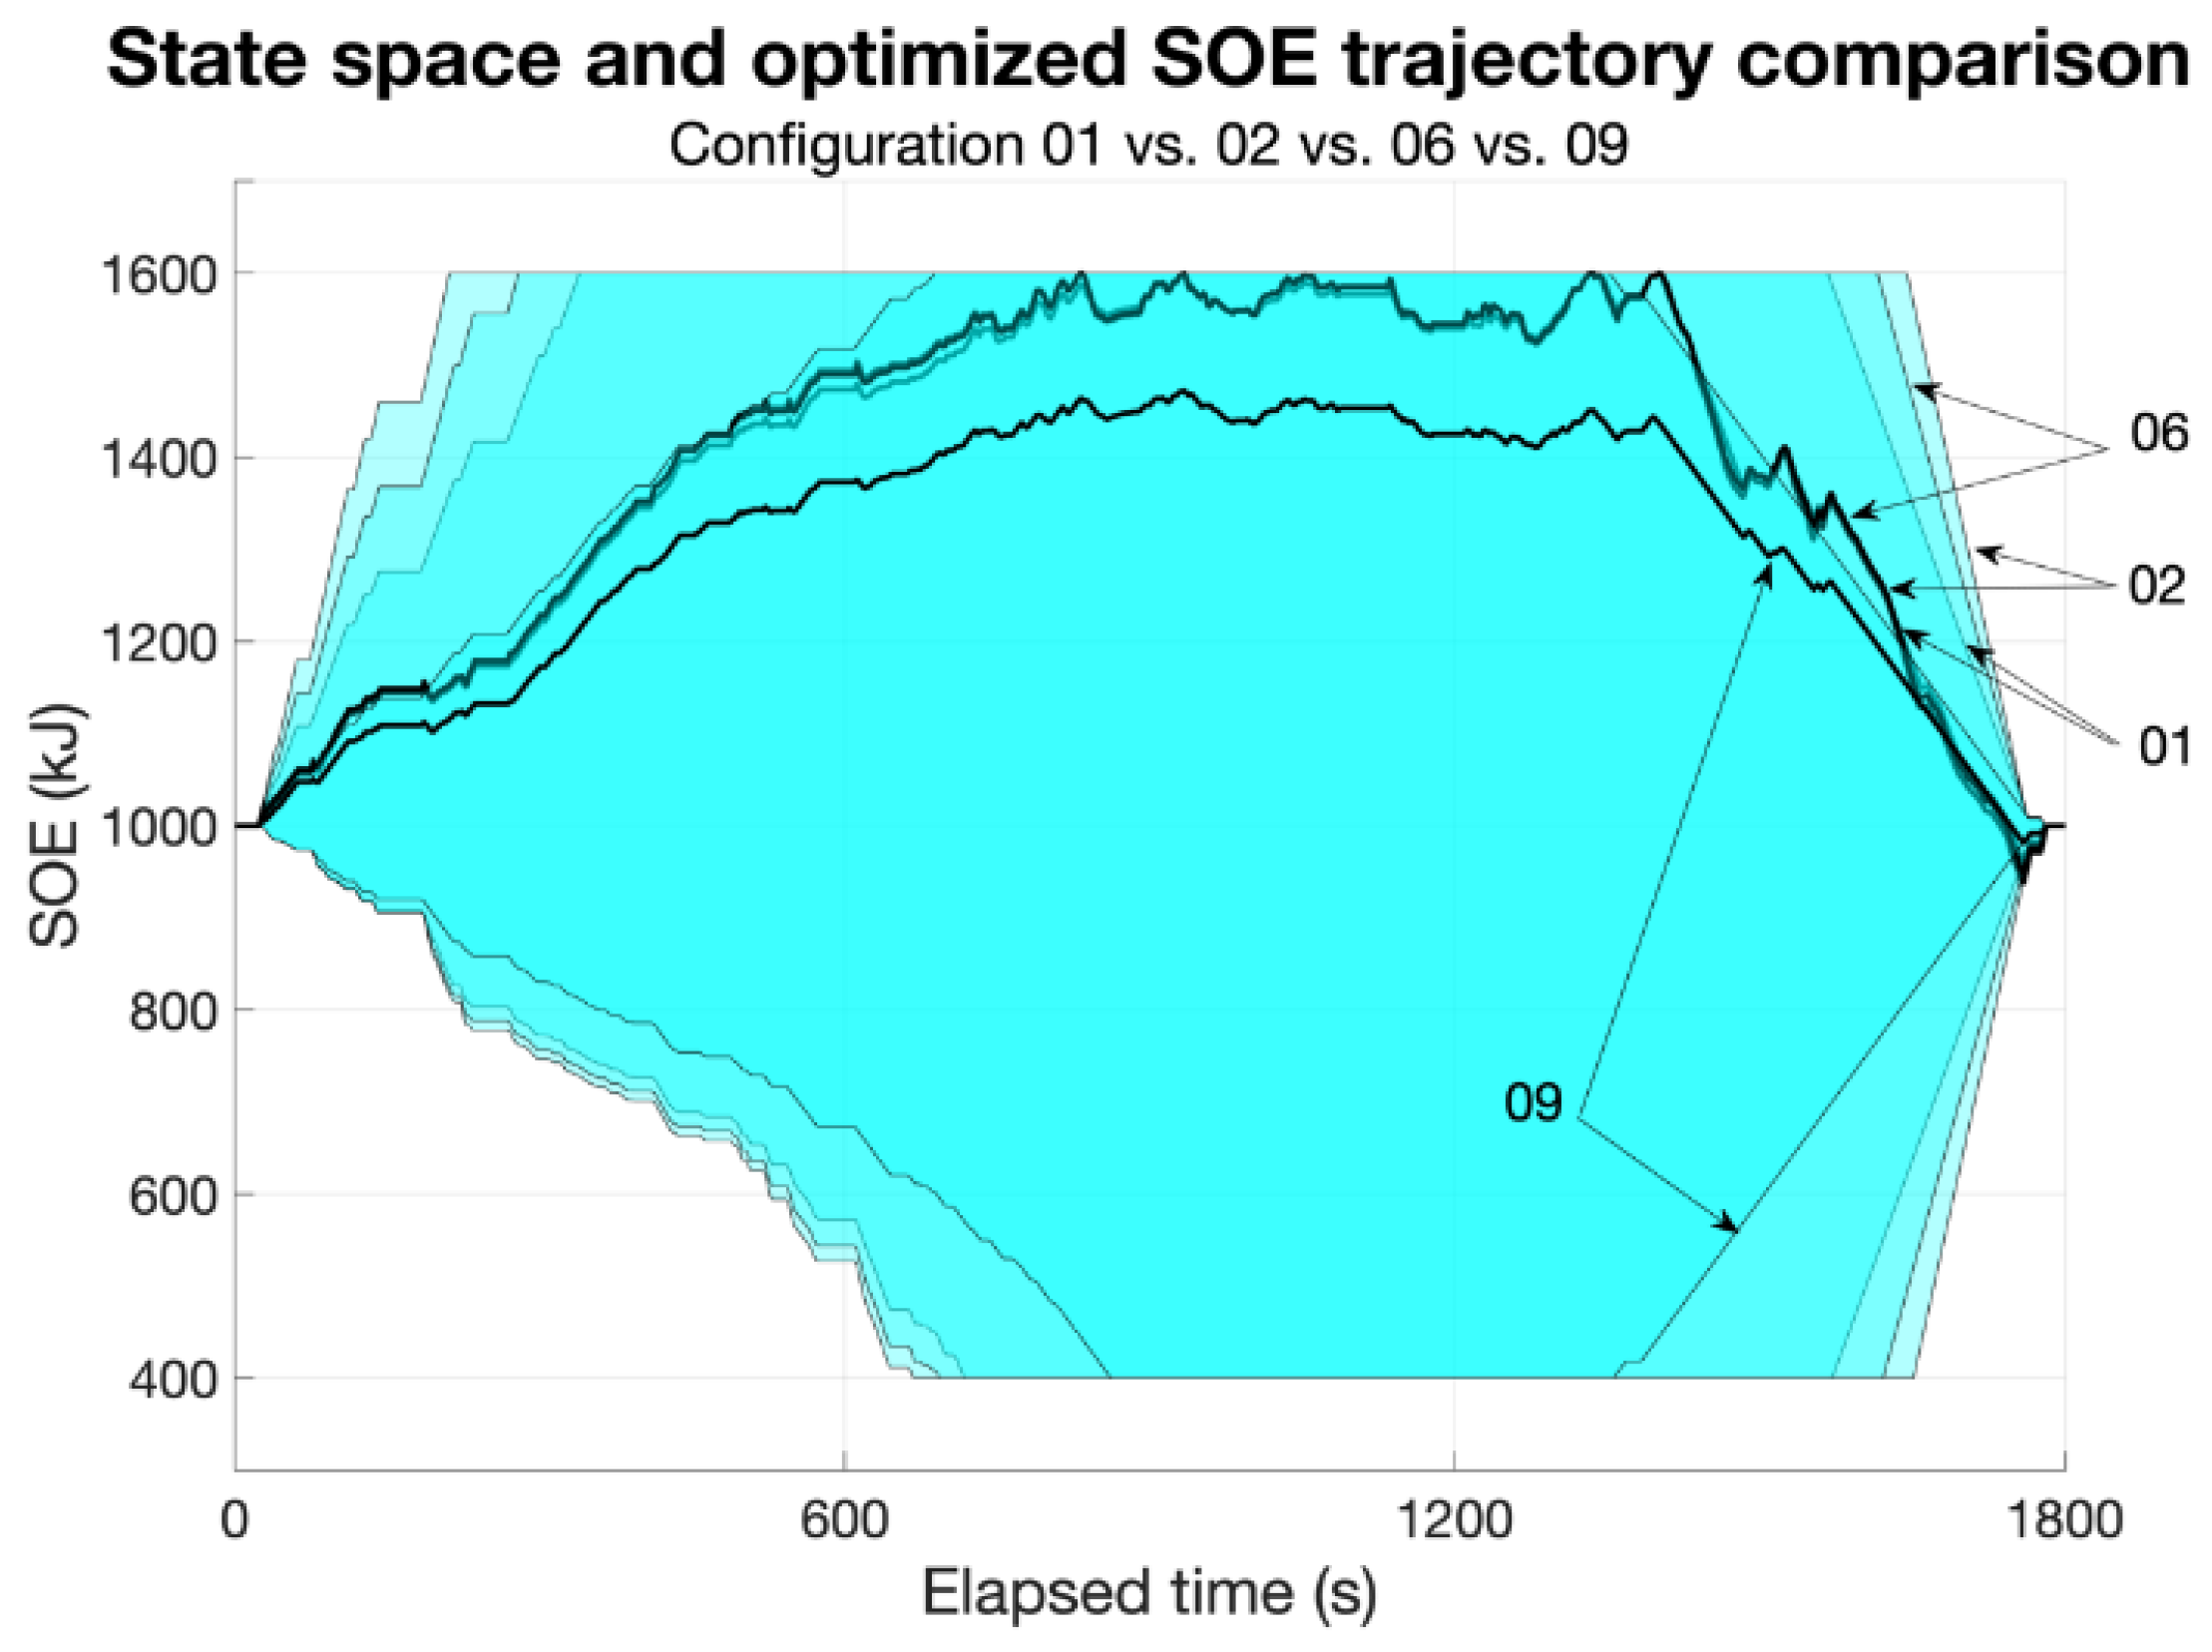
Other considerations can be made by making a comparison between the configurations with the same accumulator capacity but different EM power levels, as shown in Figure 12.
It is clearly visible that the configuration with the lowest power (09) has a different SOE trajectory compared to the other three configurations, which instead appear to be remarkably similar. Therefore, it seems unnecessary to increase the EM size above the 01 level of 3 kW with the same accumulator capacity. Combining the considerations from Figure 11 and Figure 12, it can be inferred that the maximum size of the EM should be in the range between 3 kW and 4 kW. However, Table 2 does not show a significant variation in fuel consumption between the two aforementioned EM sizes, while Table 1 shows a significant mass increment moving from 3 to 4 kW EM size. Therefore, a solution with a 3 kW power level appears advisable.

4.4. Effects of Accumulator Sizing

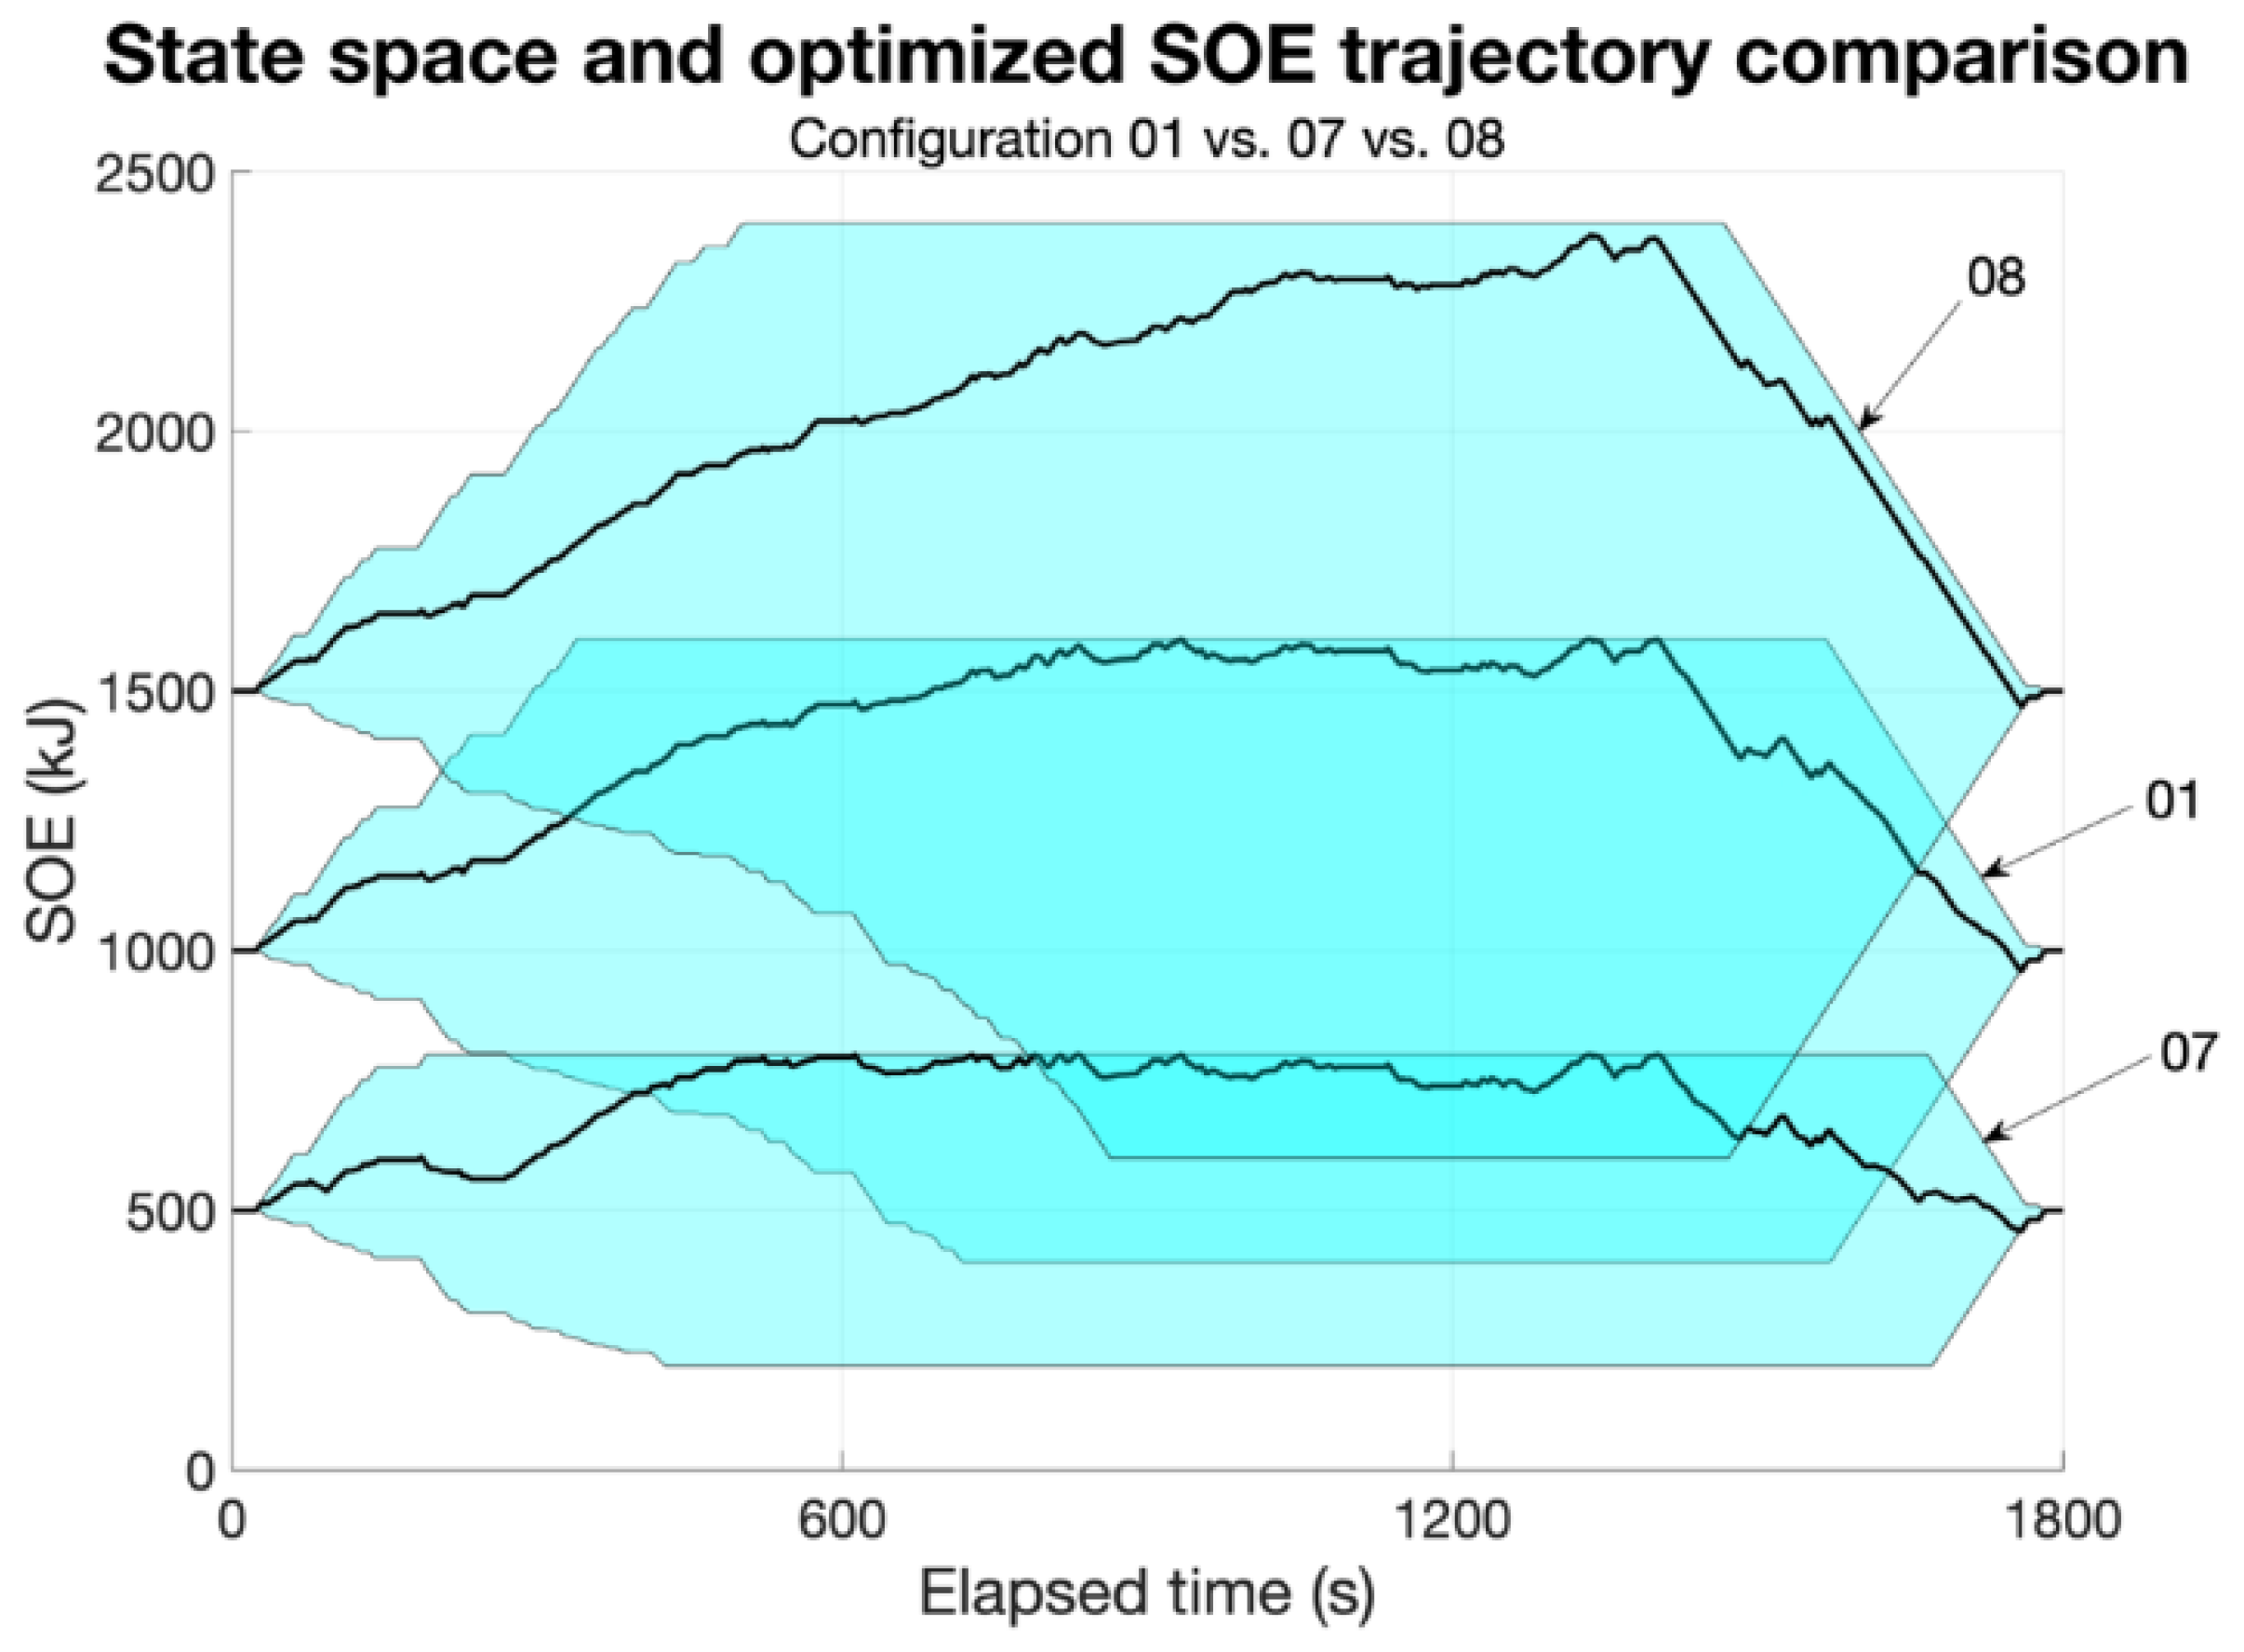
In this section, the effects of accumulator sizing are discussed. In Figure 13, three different configurations using the same EM power but different accumulator capacities are compared: configurations 01, 07, and 08. In particular, the vertical extent of the cyan area (Figure 13) for each configuration represents the storable energy within the accumulator. A larger area is correlated with a higher capacity for both charging and discharging the battery. This increased capacity enhances the potential for energy storage and utilization efficiency. The lowest capacity configuration (07) appears to be heavily limited in these terms. In this case, the optimized SOE path (black curve in Figure 13) reaches the maximum SOE limit very early during the simulation, failing to provide sufficient flexibility for the ICE load-point shifting strategy. Conversely, the higher capacity configurations (08 and 01) appear more promising in terms of strategy optimization. In particular, configuration 08 harvests ca. 50% more energy than configuration 01. However, Table 2 shows that the difference between configurations 01 and 08 is almost negligible in terms of the fuel consumption reduction. In fact, the optimized SOE path (black curve in Figure 13) of configuration 08 almost reaches the upper SOE limit close to the end of the simulation, thus proving that part of the storable energy remains unused for most of the cycle. This means that an excessively large battery adds unnecessary weight to the vehicle, which cannot be compensated for by the utilization strategy and, consequently, can negatively impact the performance and the efficiency of the system. Therefore, at least with this level of EM power, increasing the capacity above the 01 level is not advisable since that would lead to an unnecessarily heavier motorbike.

4.5. Optimized Configuration Selection

It is necessary to examine all these analyses to select the best configuration, which might also yield contrasting results. For example, comparing Configuration 01 to Configuration 06, the increment in the maximum electric power reflects more freedom in the load-point shifting strategy, as stated before, giving a slight advantage to Configuration 06 in the EXTR and HGWY phases. On the other hand, the SOE trajectory is almost identical for the two configurations, suggesting that the energy fluxes are very similar along the cycle, and therefore giving a slight advantage to Configuration 01, which has a lower mass. Finally, looking at the mass increment (Table 1) and global fuel consumption reduction (Table 2), Configuration 01 has a slight advantage over Configuration 06 in the WMTC cycle. Overall, the most promising configurations appear to be 01, 06, 08, and 12, as they offer the maximum fuel consumption reduction. Further increases in the EM power or accumulator capacity do not seem to offer any advantage in this cycle. Of all these configurations, considering that the total fuel consumption is very similar, it would be advisable to choose the lowest mass increase configuration, which would also limit the cost and volume of the system.

4.6. Effects of Round-Trip Electric Efficiency

In this final section, the impact of the losses due to the electrical components is investigated. These losses have not been considered until this section since the goal was to find the maximum possible benefit for an MHEV application. In order to increase confidence in the results shown in the previous sections, however, it is worth evaluating the impact of these losses on the final results in terms of fuel consumption. To do so, a sensitivity analysis has been performed on a wide range of electric efficiency values.
Since all the electrical components have been modeled as ideal, a single value of efficiency has been chosen to represent all the losses of the electrical system of the PU. This value represents the round-trip efficiency, so it has been applied to the energy stored in the accumulator and to the energy retrieved from the accumulator.
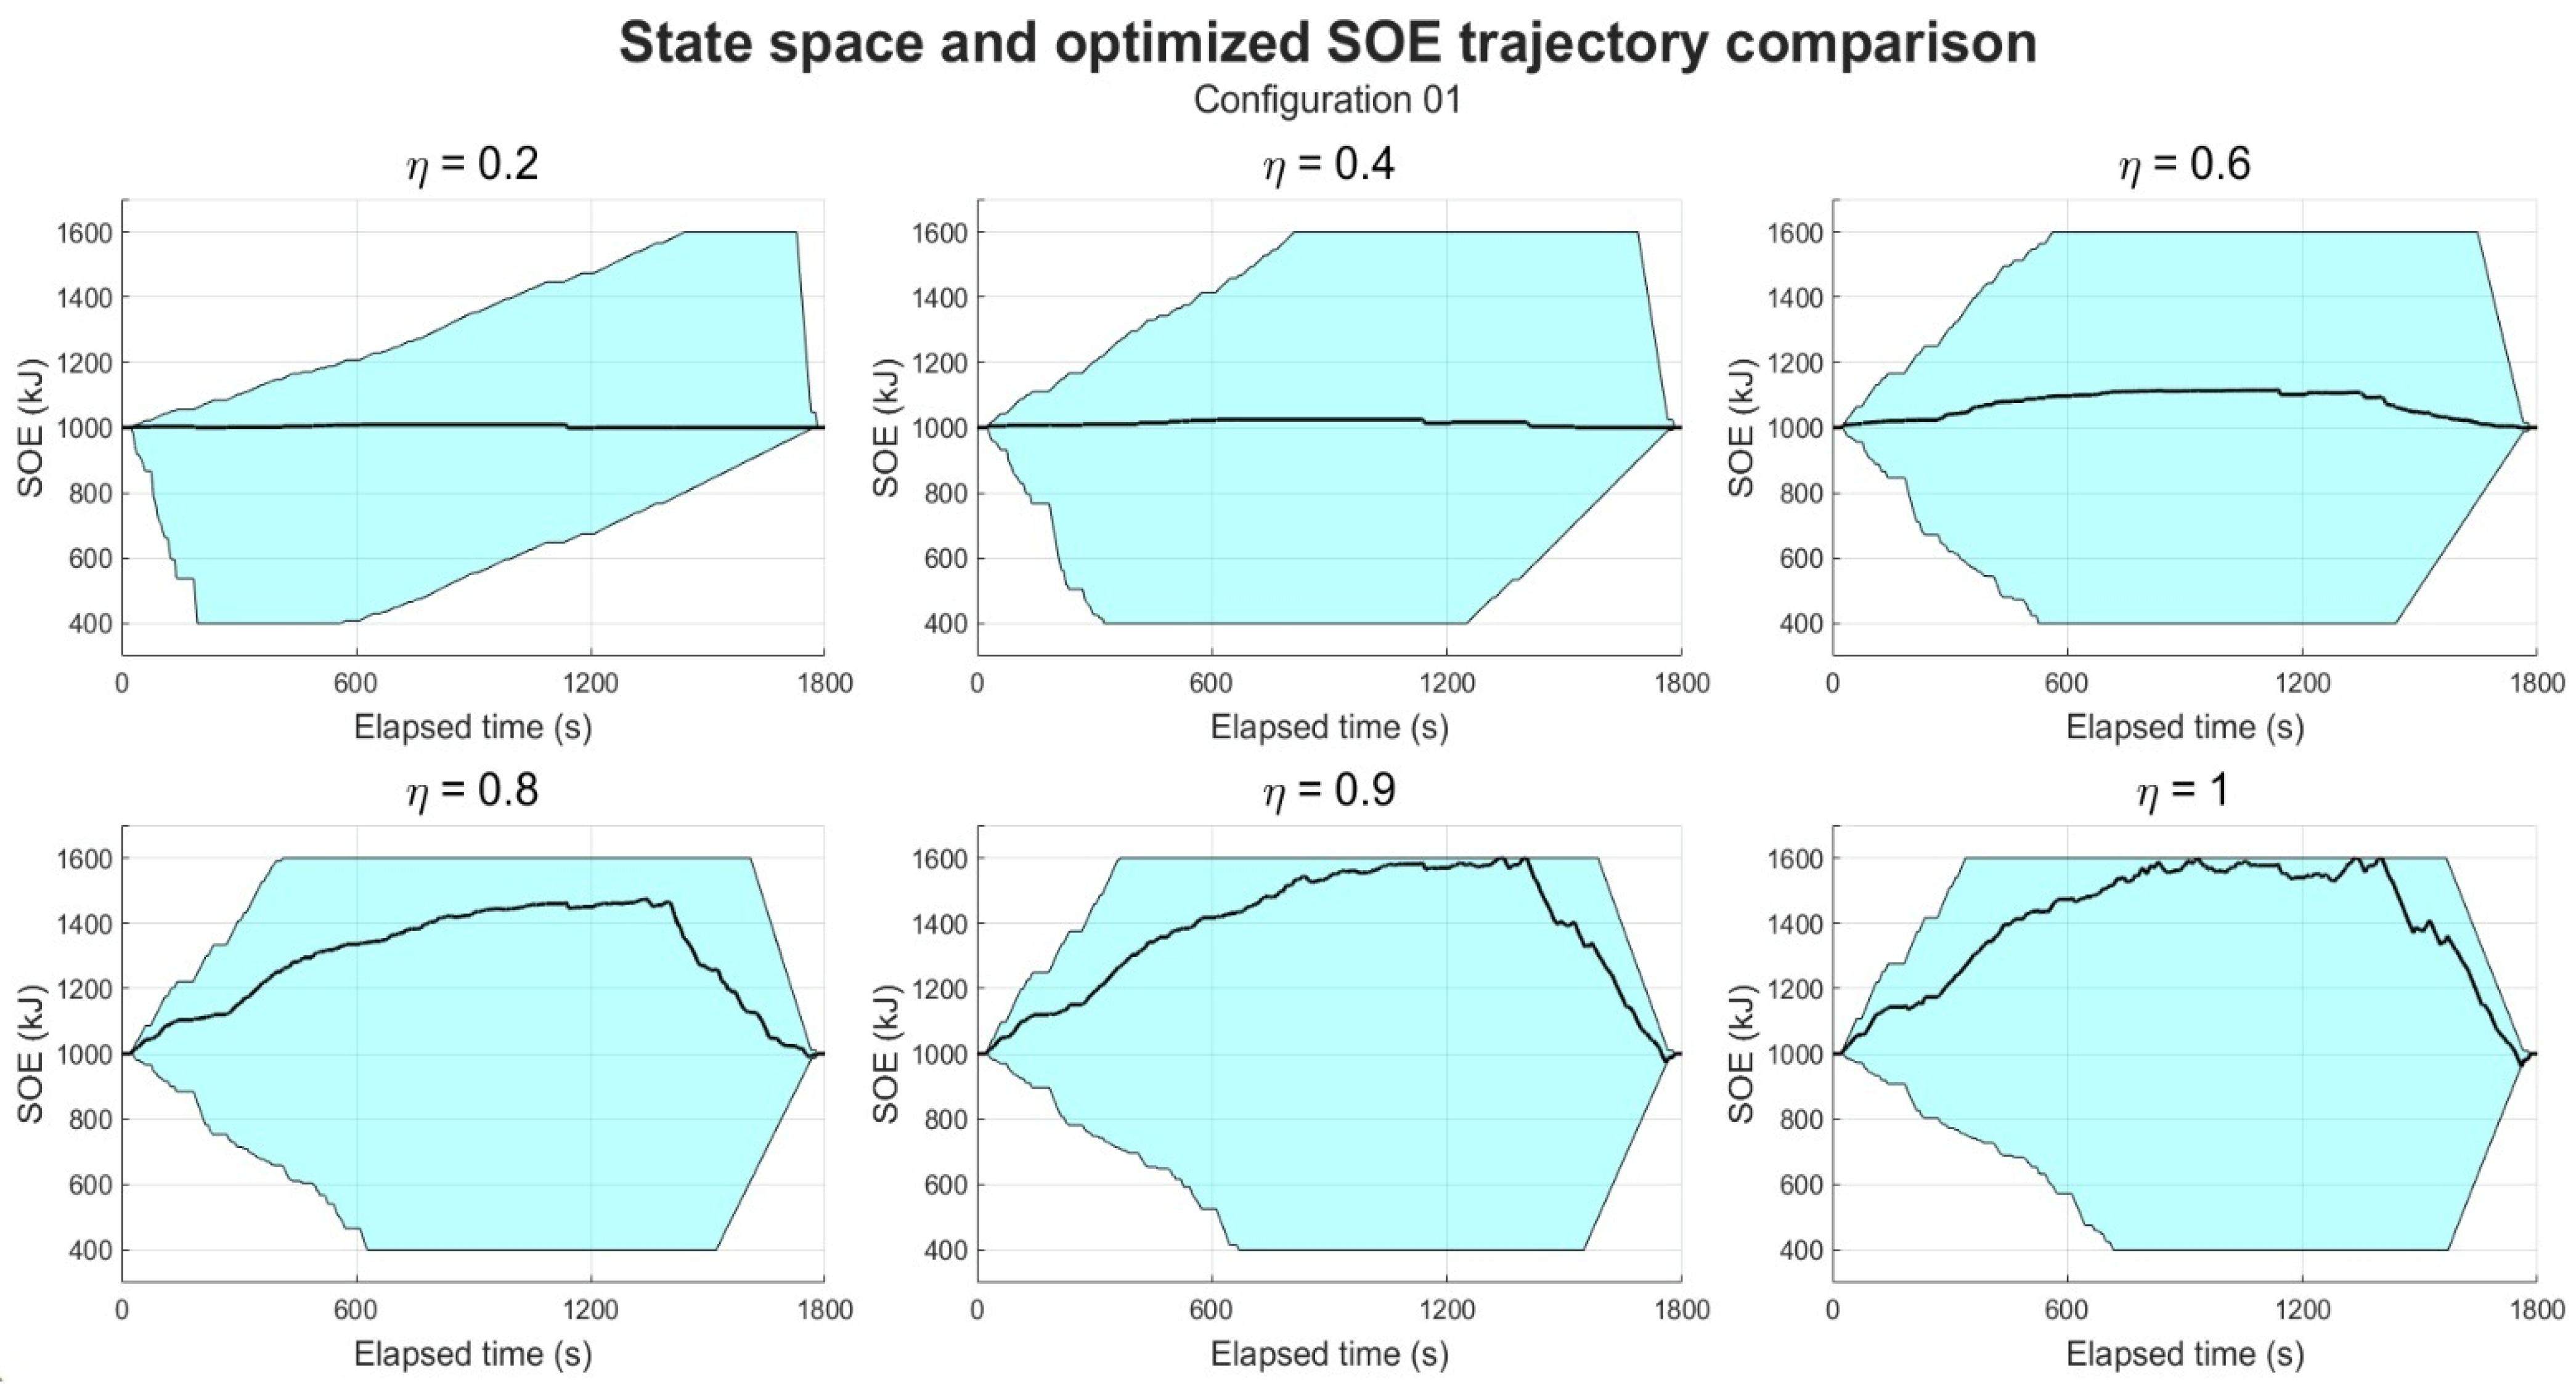
In order to better understand the impact of these losses, Configuration 01 has been used as a basis for a series of simulations. Different efficiency values have been applied, starting from 100% efficiency, which is the case reported in the previous sections, reduced to 90%, 80%, 60%, 40%, and 20%, as shown in Figure 14, which compares the results of these simulations.
Firstly, it can be noted that the state space varies significantly between the different cases. In fact, being equal to the mechanical power developed by the EM, the application of the round-trip efficiency modifies the amount of power flowing to or from the battery; therefore, the slope of the borders of the state space is modified accordingly. For example, in the simulation with 20% efficiency, the maximum SOE can only be reached in the highway phase, while it can be reached in the city phase with 100% efficiency. Conversely, the minimum SOE can be reached in the first 200 s of the simulation with 20% efficiency, while it can only be reached in the extra-urban phase with 100% efficiency. Another important result to note is the fact that the optimization algorithm chooses very different paths for different efficiency values. With lower efficiency, the algorithm progressively reduces the usage of the electric system, asymptotically tending to zero usage for a hypothetical 0% efficiency. In practical terms, the usage of the electric system is already almost negligible for an efficiency lower than 40%. It is also worth noting that there is a significant step in the usage of the electric system between 60% and 80% efficiency, with the latter appearing to be a practical lower efficiency limit in order to have a meaningful application of the MHEV technology.
Table 6 presents a sensitivity analysis designed to cover a wide range of values, including those that may not be entirely plausible. This approach is intended to test the robustness of the methodology and assess the feasibility of the proposed system. Table 6 shows the results of the different simulations in terms of the total fuel consumption variation. These results appear to confirm that 80% efficiency is the lowest acceptable value in order to have a meaningful fuel consumption reduction. It is also worth noting that an increase in the total fuel consumption is registered for low-efficiency values (lower than 60%) since the electric system is not exploited, but its weight negatively affects the performance and efficiency of the motorbike.
From the literature, a rough estimation of the efficiency of the electric system might consider a 1% loss for an IGBT inverter (both in discharge and recharge) [45], a 4% average loss for the EM (also both in discharge and recharge) [46], and a 5% round-trip loss for the lithium-ion accumulator. Consequently, the total efficiency can be evaluated as the combination of inverter efficiency (99%), EM efficiency (96%), and accumulator efficiency (95%), thus resulting in an overall efficiency of the electric drive system of about 90%. This target appears to be reachable in real-world applications [47,48].

5. Conclusions

The goal set for this paper was to study the feasibility of the application of MHEV technology to an existing motorcycle and evaluate its impact in terms of fuel consumption and, therefore, CO2 reduction. The sizing of the electric components of the power unit is of crucial importance; therefore, a study of different configurations in terms of electrical power and accumulator capacity has been performed. Dynamic Programming optimization has been employed to eliminate the influence of the particular strategy on the results. Electrical components have been initially modeled as ideal machines, with no losses, to exclude this factor from the results. However, the first principle design considerations have been applied in order to estimate the overall dimensions of the electric machine and accumulator in terms of volume and mass. The existence of an optimal size for the electric motor and accumulator has been discussed. A rule of thumb for electric motor sizing for mild-hybrid applications can be established. In particular, a maximum electric power near the average power required by a specific driving cycle appears to be the best compromise. This procedure and rules can be applied to different motorbikes with different engines and masses to obtain the optimal sizing of the power unit components. In the end, the effect of the electric system losses has been investigated, and an efficiency target for the design of the system has been established.
The applicability of the MHEV technology to an existing motorbike has shown a reduction in terms of CO2 emissions. However, the actual industrialization of the product requires further validation steps, such as producing a prototype of the motorbike to experimentally validate the possible fuel reduction and a cost/benefit analysis in comparison with other possible ways to increase the overall efficiency of the powertrain. Further developments on the optimized configuration in terms of packaging revision for the entire motorbike are planned.
This methodology can also be applied to different hybrid architectures, allowing for a rapid preliminary estimation of possible advantages in terms of fuel consumption reduction and overall efficiency increase. For example, a parallel analysis is ongoing and is focused on a possible fully hybrid architecture.
Author Contributions

Conceptualization, V.M., D.C., F.R. and M.G.; methodology, V.M. and D.C.; software, D.C.; validation, V.M. and D.C.; formal analysis, V.M. and D.C.; investigation, V.M., D.C., F.R. and M.G.; resources, F.R. and M.G.; data curation, D.C.; writing—original draft preparation, V.M. and D.C.; writing—review and editing, V.M., D.C., F.R. and M.G.; visualization, D.C. and F.R.; supervision, M.G.; project administration, V.M. and M.G.; funding acquisition, M.G. All authors have read and agreed to the published version of the manuscript.

Funding

This research received no external funding.

Data Availability Statement

The raw data supporting the conclusions of this article will be made available by the authors upon request.

Acknowledgments

The authors would like to acknowledge Ducati Motor Holding for their continuous and helpful support in supplying the engine models and experimental data used in this activity.

Conflicts of Interest

The authors declare no conflicts of interest.

Appendix A

Table A1. List of Abbreviations.
AbbreviationDefinition
MHEVMild-Hybrid Electric Vehicle
WMTCWorld Motorcycle Test Cycle
ECEEconomic Commission for Europe
PUPower Unit
ICEInternal Combustion Engine
DPDynamic Programming
BSFCBrake-Specific Fuel Consumption
SOEState of Energy
Table A2. List of Symbols.
SymbolsDefinition
D External rotor diameter
l Active length of the electric motor
A Linear current density
B Magnetic flux density
M PU Moment required to the PU
J PU Inertia moment of the PU, including ICE, EM and auxiliaries
η p Primary transmission efficiency
τ p Primary transmission ratio
J P Inertia moment of the primary shaft of the gearbox, including the clutch
M P Moment transmitted by the primary shaft
η g Gearbox efficiency for the selected gear
τ g Gearbox transmission ratio for the selected gear
J S Inertia moment of the secondary shaft of the gearbox
M S Moment transmitted by the secondary shaft
η c Efficiency of the final chain transmission
τ c Transmission ratio of the final chain transmission
J W Inertia moment of the complete rear wheel
M W Moment transmitted by the rear wheel
F W Longitudinal force acting on the contact patch between the wheel and the bench roller

References

  1. Zhou, Y. Worldwide Carbon Neutrality Transition? Energy Efficiency, Renewable, Carbon Trading and Advanced Energy Policies. Energy Rev. 2023, 2, 100026. [Google Scholar] [CrossRef]
  2. Benlemlih, M.; Yavaş, Ç.V. Economic Policy Uncertainty and Climate Change: Evidence from CO2 Emission. J. Bus. Ethics 2023, 191, 415–441. [Google Scholar] [CrossRef]
  3. Szymlet, N.; Rymaniak, Ł.; Lijewski, P. Two-Wheeled Urban Vehicles—A Review of Emissions Test Regulations and Literature. Energies 2024, 17, 586. [Google Scholar] [CrossRef]
  4. Singh, S.; Kulshrestha, M.J.; Rani, N.; Kumar, K.; Sharma, C.; Aswal, D.K. An Overview of Vehicular Emission Standards. Mapan J. Metrol. Soc. India 2023, 38, 241–263. [Google Scholar] [CrossRef]
  5. Pacura, W.; Szramowiat-Sala, K.; Gołaś, J. Emissions from Light-Duty Vehicles—From Statistics to Emission Regulations and Vehicle Testing in the European Union. Energies 2024, 17, 209. [Google Scholar] [CrossRef]
  6. Wang, P.; Duan, X.; Chen, C.; Liu, S. Experimental Investigation on the Exhaust Emissions and Performance of a Hybrid Electric Motor Coupled with an Energy Recovery System. Case Stud. Therm. Eng. 2023, 45, 102994. [Google Scholar] [CrossRef]
  7. Elango, P.; Mathivanan, A.; Kakani, R.; Das, H.B.; Asvathanarayanan, R. Numerical Evaluation of Fuel Consumption and Transient Emissions of Different Hybrid Topologies for Two-Wheeler Application. SAE Int. J. Electrified Veh. 2023, 12, 389–402. [Google Scholar] [CrossRef]
  8. Eccarius, T.; Lu, C.C. Powered Two-Wheelers for Sustainable Mobility: A Review of Consumer Adoption of Electric Motorcycles. Int. J. Sustain. Transp. 2020, 14, 215–231. [Google Scholar] [CrossRef]
  9. Cadavid, L.; Salazar-Serna, K. Mapping the Research Landscape for the Motorcycle Market Policies: Sustainability as a Trend—A Systematic Literature Review. Sustainability 2021, 13, 10813. [Google Scholar] [CrossRef]
  10. Ehsani, M.; Singh, K.V.; Bansal, H.O.; Mehrjardi, R.T. State of the Art and Trends in Electric and Hybrid Electric Vehicles. Proc. IEEE 2021, 109, 967–984. [Google Scholar] [CrossRef]
  11. Vargas, J.; Osorio Gómez, G.; Manrique Espíndola, T. Multi-Objective Optimal Driving Strategies for Hybrid Electric Motorcycles with Parallel Configuration. Int. J. Electr. Hybrid Veh. 2021, 13, 211. [Google Scholar] [CrossRef]
  12. Chen, H.C.; Li, S.S.; Wu, S.L.; Lee, C.Y. Design of a Modular Battery Management System for Electric Motorcycle. Energies 2021, 14, 3532. [Google Scholar] [CrossRef]
  13. Lenzo, B.; Lot, R. Optimal Torque Management Strategies for All-Wheel-Drive Electric Motorcycles. Veh. Syst. Dyn. 2024, 1–19. [Google Scholar] [CrossRef]
  14. Sheu, K.B.; Hsu, T.H. Design and Implementation of a Novel Hybrid-Electric-Motorcycle Transmission. Appl. Energy 2006, 83, 959–974. [Google Scholar] [CrossRef]
  15. Bui, T.A.; Nguyen, H.B.; Pham, V.H.; Nguyen, M.T. Design and Development of a Drive System Integrated a Continuously Variable Transmission (CVT) for an Electric Motorcycle. Int. J. Adv. Sci. Eng. Inf. Technol. 2020, 10, 1184–1190. [Google Scholar] [CrossRef]
  16. Mangeruga, V.; Renso, F.; Barbieri, S.G.; Giacopini, M.; Raimondi, F. Numerical Investigation of the Dynamic Effects on the Fatigue Behaviour of a Transmission Chain in a Hybrid Power Unit. J. Multiscale Model. 2023, 14, 1–29. [Google Scholar] [CrossRef]
  17. Nguyen Van, T.; Nguyen Duy, T.; Phạm, A.T. A Study on Optimizing the Characteristics of Lithium-Ion Battery Power Source and Operating Cost for Hybrid Motorcycle. Sci. Technol. Dev. J. Eng. Technol. 2021, 3, SI81–SI92. [Google Scholar] [CrossRef]
  18. Tsokanas, N.; Pastorino, R.; Stojadinović, B. Adaptive Model Predictive Control for Actuation Dynamics Compensation in Real-Time Hybrid Simulation. Mech. Mach. Theory 2022, 172, 104817. [Google Scholar] [CrossRef]
  19. Harrington, C.; Vaughan, N.; Allen, J.; Smither, B.D.; Farmer, G. Low Cost Hybrid Motorcycle Optimisation Model; SAE International: Warrendale, PA, USA, 2010. [Google Scholar] [CrossRef]
  20. Ga Bui, V.; Minh Tu Bui, T.; Tuan Hoang, A.; Nižetić, S.; Sakthivel, R.; Nam Tran, V.; Hung Bui, V.; Engel, D.; Hadiyanto, H. Energy Storage Onboard Zero-Emission Two-Wheelers: Challenges and Technical Solutions. Sustain. Energy Technol. Assess. 2021, 47, 101435. [Google Scholar] [CrossRef]
  21. Walker, P.D.; Roser, H.M. Energy Consumption and Cost Analysis of Hybrid Electric Powertrain Configurations for Two Wheelers. Appl. Energy 2015, 146, 279–287. [Google Scholar] [CrossRef]
  22. Boumediene, S.; Nasri, A.; Hamza, T.; Hicham, C.; Kayisli, K.; Garg, H. Fuzzy Logic-Based Energy Management System (EMS) of Hybrid Power Sources: Battery/Super Capacitor for Electric Scooter Supply. J. Eng. Res. 2023, 12, 148–159. [Google Scholar] [CrossRef]
  23. Finger, D.F.; Bil, C.; Braun, C. Initial Sizing Methodology for Hybrid-Electric General Aviation Aircraft. J. Aircr. 2020, 57, 245–255. [Google Scholar] [CrossRef]
  24. Jung, H. Fuel Economy of Plug-in Hybrid Electric and Hybrid Electric Vehicles: Effects of Vehicleweight, Hybridization Ratio and Ambient Temperature. World Electr. Veh. J. 2020, 11, 31. [Google Scholar] [CrossRef]
  25. Kasseris, E.P.; Heywood, J.B. Comparative Analysis of Automotive Powertrain Choices for the next 25 Years. SAETransaction. 2007, 116, 626–647. [Google Scholar] [CrossRef]
  26. Han, L.; You, C.; Yang, N.; Liu, H.; Chen, K.; Xiang, C. Adaptive Real-Time Energy Management Strategy Using Heuristic Search for off-Road Hybrid Electric Vehicles. Energy 2024, 304, 132131. [Google Scholar] [CrossRef]
  27. Li, Y.; Zhang, H.; Liang, X.; Huang, B. Event-Triggered-Based Distributed Cooperative Energy Management for Multienergy Systems. IEEE Trans. Ind. Inform. 2019, 15, 2008–2022. [Google Scholar] [CrossRef]
  28. Abomazid, A.M.; El-Taweel, N.A.; Farag, H.E.Z. Optimal Energy Management of Hydrogen Energy Facility Using Integrated Battery Energy Storage and Solar Photovoltaic Systems. IEEE Trans. Sustain. Energy 2022, 13, 1457–1468. [Google Scholar] [CrossRef]
  29. Chen, L.; Hu, R.; Deng, X.; Chen, H.; Li, Y.; Ding, T.; Yin, Y.; Wang, L.; He, H. Study of Modified Flux-Coupling-Type SFCLs for Stability Improvement of a Multi-Machine Power System Based on Energy Function. IEEE Trans. Appl. Supercond. 2021, 31, 0500207. [Google Scholar] [CrossRef]
  30. Onori, S.; Serrao, L.; Rizzoni, G. Hybrid Electric Vehicles: Energy Management Strategies; Springer: London, UK, 2016. [Google Scholar]
  31. Zhuang, W.; Li (Eben), S.; Zhang, X.; Kum, D.; Song, Z.; Yin, G.; Ju, F. A Survey of Powertrain Configuration Studies on Hybrid Electric Vehicles. Appl. Energy 2020, 262, 114553. [Google Scholar] [CrossRef]
  32. Morandin, M.; Ferrari, M.; Bolognani, S. Power-Train Design and Performance of a Hybrid Motorcycle Prototype. IEEE Trans. Ind. Appl. 2015, 51, 2216–2226. [Google Scholar] [CrossRef]
  33. Ching, T.W.; Chan, K.U. A Full Hybrid Electric Scooter. In Proceedings of the 2009 IEEE Electrical Power & Energy Conference (EPEC), Montreal, QC, Canada, 22–23 October 2009; pp. 1–6. [Google Scholar] [CrossRef]
  34. Balasaheb Bhongale, S. Architecture of Hybrid Vehicle. Int. Res. J. Mod. Eng. Technol. Sci. 2023, 5, 993–999. [Google Scholar]
  35. Soltani, M.; Nuzzo, S.; Barater, D.; Franceschini, G. Considerations on the Preliminary Sizing of Electrical Machines with Hairpin Windings. In Proceedings of the 2021 IEEE Workshop on Electrical Machines Design, Control and Diagnosis (WEMDCD), Modena, Italy, 8–9 April 2021; pp. 46–51. [Google Scholar] [CrossRef]
  36. UNECE Transport Standards. Uniform Provisions Concerning the Approval of Vehicles with Regard to Specific Requirements for the Electric Power Train—Regulation n. 100 Rev. 3. E/ECE/324/Rev.2/Add.99/Rev.3; UNECE Transport Standards: Geneva, Switzerland, 2022; Volume 1958. [Google Scholar]
  37. UNECE Transport Standards. Measurement Procedure for Twowheeled Motorcycles Equipped With a Positive or Compression Ignition Engine With Regard to the Emission of Gaseous Pollutants, CO2 Emissions and Fuel Consumption from the European Union—Regulation n. 2 ECE/TRANS/180/Add.2; UNECE Transport Standards: Geneva, Switzerland, 2005; Volume 1. [Google Scholar]
  38. Wiratkasem, K.; Pattana, S. The Effect of Motorcycle Tyre Rolling Resistance Coefficient on the Saving of Fuel Consumption. Energy Rep. 2021, 7, 248–252. [Google Scholar] [CrossRef]
  39. Ydrefors, L.; Hjort, M.; Kharrazi, S.; Jerrelind, J.; Stensson Trigell, A. Rolling Resistance and Its Relation to Operating Conditions: A Literature Review. Proc. Inst. Mech. Eng. Part D J. Automob. Eng. 2021, 235, 2931–2948. [Google Scholar] [CrossRef]
  40. Isermann, R. Engine Modeling and Control; Springer: Berlin/Heidelberg, Germany, 2014; ISBN 9783642399336. [Google Scholar]
  41. Martyr, A.J.; Plint, M.A. Engine Testing: Theory and Practice; Society of Automotive Engineers: Warrendale, PA, USA, 2007; ISBN 9780750684392. [Google Scholar]
  42. Bertsekas, D.P. Dynamic Programming and Optimal Control. Volume 1; Athena Scientific: Nashua, NH, USA, 2012; Volume 47. [Google Scholar]
  43. Bellman, R. The Theory of Dynamic Programming; American Mathematical Society: Providence, RI, USA, 1954; Volume 60. [Google Scholar]
  44. Woody, M.; Arbabzadeh, M.; Lewis, G.M.; Keoleian, G.A.; Stefanopoulou, A. Strategies to Limit Degradation and Maximize Li-Ion Battery Service Lifetime—Critical Review and Guidance for Stakeholders. J. Energy Storage 2020, 28, 101231. [Google Scholar] [CrossRef]
  45. Savi, F.; Barater, D.; Nuzzo, S.; Franceschini, G. Evaluation of Inverter Architectures for Output Voltage Overshoot Reduction in WBG Electric Drives. In Proceedings of the 2021 IEEE 30th International Symposium on Industrial Electronics (ISIE), Kyoto, Japan, 20–23 June 2021; pp. 1–6. [Google Scholar] [CrossRef]
  46. Cutuli, G.; Nuzzo, S.; Zou, T.; Franceschini, G.; Gerada, C.; Barater, D. Multi-Objective Optimizations of Copper and Aluminum Hairpin Windings: A Comparison. In Proceedings of the 2023 IEEE Energy Conversion Congress and Exposition (ECCE), Nashville, TN, USA, 29 October–2 November 2023; pp. 3796–3801. [Google Scholar] [CrossRef]
  47. Drobnik, J.; Jain, P. Electric and Hybrid Vehicle Power Electronics Efficiency, Testing and Reliability. World Electr. Veh. J. 2013, 6, 719–730. [Google Scholar] [CrossRef]
  48. Li, X.; Williamson, S.S. Efficiency Analysis of Hybrid Electric Vehicle (HEV) Traction Motor-Inverter Drive for Varied Driving Load. In Proceedings of the 2008 Twenty-Third Annual IEEE Applied Power Electronics Conference and Exposition, Austin, TX, USA, 24–28 February 2008; pp. 280–285. [Google Scholar]
Figure 1. Schematic representation of the chosen MHEV architecture.
Vehicles 06 00068 g001
Figure 2. Representation of the 1D model of the motorcycle during a bench homologation test considering the PU, transmission, rear wheel, and its interaction with the bench roller.
Vehicles 06 00068 g002
Figure 3. Schematic representation of the transmission system.
Vehicles 06 00068 g003
Figure 4. ICE efficiency map derived from dyno bench experimental tests.
Vehicles 06 00068 g004
Figure 5. Schematic representation of the model.
Vehicles 06 00068 g005
Figure 6. Comparison of computed and experimental fuel consumption for pure ICE configuration.
Vehicles 06 00068 g006
Figure 7. System state space, representing the optimization space for the DP algorithm, and the optimized SOE trajectory. Example of Configuration 01.
Vehicles 06 00068 g007
Figure 8. Recoverable energy vs. total energy input along the WMTC cycle.
Vehicles 06 00068 g008
Figure 9. ICE operating points: pure ICE vs. MHEV (configuration 01).
Vehicles 06 00068 g009
Figure 10. Instantaneous power delivery by component.
Vehicles 06 00068 g010
Figure 11. Comparison of ICE operating points of configurations 01 and 06. The purple box indicates the region where the load-points shifting occurs differently between the two configurations.
Vehicles 06 00068 g011
Figure 12. State space and SOE trajectory comparison between configurations 01, 02, 06, and 09.
Vehicles 06 00068 g012
Figure 13. State space and SOE trajectory comparison between configurations 01, 07, and 08.
Vehicles 06 00068 g013
Figure 14. Optimized SOE trajectory comparison for different values of electrical component efficiency.
Vehicles 06 00068 g014
Table 1. Estimated mass increase over the pure ICE configuration.
Accum. Size (kJ)Estimated Mass Increase over Pure ICE Motorbike (kg)
EM Size (Maximum Power in kW)
0.511.522.533.544.555.566.57
500041.6
1000 073.8
1500
2000 094.9 015.7 066.1 026.6
2500105.4 058.6
3000 087.5
3500
4000118.3 129.9 0311.5
Table 2. Fuel consumption reduction obtained along the WMTC for every configuration.
Accum. Size (kJ)Fuel Consumption Variation over Pure ICE Motorbike—Complete WMTC
EM Size (Maximum Power in kW)
0.511.522.533.544.555.566.57
50004−1.1%
1000 07−1.9%
1500
2000 09−1.9% 01−2.3% 06−2.2% 02−2.0%
250010−1.1% 05−1.5%
3000 08−2.3%
3500
400011−1.0% 12−1.7% 03−2.3%
Table 3. Fuel consumption reduction obtained in the CITY phase for every configuration.
Accum. Size (kJ)Fuel Consumption Variation over Pure ICE Motorbike—CITY Phase
EM Size (Maximum Power in kW)
0.511.522.533.544.555.566.57
50004+0.5%
1000 07+2.4%
1500
2000 09+3.7% 01+5.5% 06+6.3% 02+7.2%
250010+0.7% 05+10.6%
3000 08+6.4%
3500
400011+0.8% 12+8.4% 03+12.7%
Table 4. Fuel consumption reduction obtained in the EXTR phase for every configuration.
Accum. Size (kJ)Fuel Consumption Variation over Pure ICE Motorbike—EXTR Phase
EM Size (Maximum Power in kW)
0.511.522.533.544.555.566.57
50004−0.2%
1000 07−1.5%
1500
2000 090.0% 01+0.1% 06−0.1% 020.0%
2500100.0% 05+1.2%
3000 08+2.7%
3500
400011+0.1% 12+4.5% 03+4.7%
Table 5. Fuel consumption reduction obtained in the HGWY phase for every configuration.
Accum. Size (kJ)Fuel Consumption Variation over Pure ICE Motorbike—HGWY Phase
EM Size (Maximum Power in kW)
0.511.522.533.544.555.566.57
50004−2.1%
1000 07−3.7%
1500
2000 09−5.0% 01−6.4% 06−6.5% 02−6.4%
250010−2.3% 05−7.5%
3000 08−8.3%
3500
400011−2.3% 12−10.0% 03−10.4%
Table 6. Fuel consumption reduction for different values of electrical system round-trip efficiency (configuration 01).
Efficiency Effect Comparison (WMTC)
Configuration 01
η = 0.2η = 0.4η = 0.6η = 0.8η = 0.9η = 1
Fuel cons. variation0.4%0.3%0.1%−0.4%−1.1%−1.8%
Disclaimer/Publisher’s Note: The statements, opinions and data contained in all publications are solely those of the individual author(s) and contributor(s) and not of MDPI and/or the editor(s). MDPI and/or the editor(s) disclaim responsibility for any injury to people or property resulting from any ideas, methods, instructions or products referred to in the content.