Abstract
To address the low selectivity in the electrocatalytic conversion of furfural (FFR) to furfuryl alcohol (FFA) under alkaline conditions, a Zn-based metal–organic framework (MBON-2) featuring a 3D hierarchical flower-like architecture self-assembled from nanosheets was synthesized via a simple hydrothermal method. Under optimal conditions, MBON-2 exhibited an extremely high selectivity of FFA (100%) and a high Faradaic efficiency (FE) of 93.19% at −0.2 V vs. RHE. Electrochemical impedance spectroscopy (EIS) revealed the excellent electron transfer and mass transport properties of MBON-2. In addition, in situ Fourier transform infrared (FTIR) spectroscopy studies confirmed the adsorption of FFR molecules onto the Zn and B sites of MBON-2 during the ECH of FFR, providing key insights into the hydrogenation mechanism. The numerous exposed B and Zn sites of the MBON-2, as well as its robust structural stability contributed to its outstanding catalytic performance in the electrochemical hydrogenation (ECH) of FFR. This work provides valuable guidelines for developing efficient Zn-based catalysts for the ECH of FFR.
1. Introduction
As a sustainable, renewable, and carbon-neutral resource derived from non-fossil organic matter, biomass presents a versatile alternative to fossil fuels by enabling the production of clean energy (such as liquid biofuels) and serving as a primary feedstock for synthesizing value-added organic molecules, including platform chemicals and biomaterials [1,2,3]. Furfural (FFR), a versatile biomass-derived platform molecule obtained from agricultural wastes, serves as a critical feedstock in sustainable biorefineries. Through catalytic hydrogenation and other selective transformation pathways, FFR can be efficiently converted into various high value-added chemicals, such as furfuryl alcohol (FFA) [4,5]. FFA is a vital precursor for pharmaceuticals, resins, and industrial solvents, driving significant demand. Consequently, the hydrogenation of FFR to FFA is considered critical for biomass valorization [6]. Currently, the mainstream industrial method for FFR reduction relies on thermal hydrogenation using Cu-Cr catalysts under high-temperature and high-pressure conditions [7]. However, this process is energy-intensive and presents significant challenges associated with hydrogen transportation and storage, along with potential explosion hazards [8]. In contrast, FFR electrochemical hydrogenation (ECH) has garnered significant attention due to its environmental benignity, milder reaction conditions, compatibility with renewable electricity sources, and elimination of the need for external hydrogen supply [9]. Nevertheless, the inherent reactive properties of FFR presents significant challenges in achieving precise selectivity control in chemical transformations. Consequently, developing highly efficient catalysts for achieving highly selective conversion to FFA remains a formidable challenge.
Current research indicated that ECH of FFR typically suffers from sluggish kinetics and complex product distribution [10]. Thus, developing catalysts capable of efficiently achieving the electrocatalytic conversion of FFR to FFA holds significant applied value. In addition, the pH value of the electrolyte exerts a pronounced influence on the product selectivity of FFR ECH reaction [11,12]. The decrease in the stability of FFR under alkaline conditions will lead to the occurrence of side reactions (such as the Cannizzaro reaction), thereby reducing the selectivity of FFA [13,14]. Under alkaline conditions, the electrocatalytic conversion of FFR primarily proceeds via two distinct pathways: the ECH pathway involving an inner-sphere process, and the direct electroreduction pathway based on proton-coupled electron transfer (PCET) [15,16]. The dominant reaction pathway is determined by the relative potentials required for adsorbed hydrogen (Hads) formation versus C-OH intermediate generation. Furthermore, due to the shared Hads intermediate between the ECH process and the hydrogen evolution reaction (HER) in aqueous electrolytes, HER as a side reaction is inherently unavoidable [10,17]. Although numerous studies have reported the ECH of FFR to FFA under alkaline conditions, the selectivity for FFA in existing reports remains suboptimal. Meantime, mechanistic studies of FFR electroreduction to FFA in alkaline environments remain relatively scarce. Consequently, there remains an urgent need to develop catalysts effective for the alkaline electrocatalytic conversion of FFR, mitigating the issues of low Faradaic efficiency (FE) and selectivity caused by these competing side reactions.
Owing to their structural tunability and high specific surface area, metal–organic frameworks (MOFs) can provide abundant exposed active sites, which endows them with significant potential in catalysis [18]. However, the research on MOFs in the ECH of FFR to prepare FFA remains in its infancy [19,20], and fundamental understanding of the reaction mechanisms and active sites is lacking [21,22]. The design and synthesis of MOFs with highly active sites constitute a critical research direction for advancing the field of ECH of FFR. Extensive research confirms the effectiveness of Cu-based catalysts in activating aldehyde groups, leading to their widespread application in FFR electrocatalytic hydrogenation [23]. Conversely, investigations into the ECH of FFR utilizing Zn-based materials are comparatively scarce. Barton et al. reported that Zn metal achieved 73% FE for FFA at −0.7 V vs. RHE under near-neutral electrolytes [24].Subsequently, Chen et al. prepared ZnMn2O4 samples for converting FFR to FFA via electrocatalytic routes, confirming that Zn2+ vacancies may significantly lowered the energy barrier of FFR to FFA [13]. The inherent structural certainty and chemical tunability of Zn-based MOFs establish them as an ideal model system for probing the mechanistic pathways governing Zn-catalyzed ECH of FFR. Unlike conventional heterogeneous Zn catalysts with ill-defined surfaces, MOFs’ periodic structures allow precise correlation between active site geometry (e.g., open Zn2+ nodes, functionalized linkers) and reaction kinetics/selectivity.
Among various architectures, self-supporting nanoflower structures, owing to their unique in situ engineering features, demonstrate significant advantages in energy storage and catalysis, rendering them promising candidate materials [25,26]. Herein, a self-assembled 3D layered nanoflower-like Zn-based MOF (MBON-2) was successfully fabricated via a facile hydrothermal route and used for the FFR ECH reaction. This unique morphology provides numerous exposed active sites, which significantly facilitates the adsorption and activation process of FFR at catalytic sites. Specifically, under alkaline conditions, exceptional FFA selectivity (100%) and a high FE (93.19%) for the ECH of FFR to FFA was achieved. In situ FT-IR characterizations confirmed that the abundant Zn sites and B sites could jointly promote the adsorption of FFR, endowing MBON-2 with remarkable performance.
2. Materials and Methods
2.1. Preparation of MBON-2
Zn(NO3)26H2O (1.73 mmol, 0.5580 g) and H3BO3 (22.5 mmol, 1.3917 g) were added into 30 mL H2O and then stirred constantly at approximately 800 rpm for 15 min at room temperature. Subsequently, C3H4N2 (7.36 mmol, 0.5012 g) was added into the solution and continue stirring for another 15 min. After stirring, the solution was transferred into a 50 mL Teflon-lined autoclave. After heated at 150 °C for 6 h, the autoclave was cooled to room temperature naturally [27]. The precipitate was collected by centrifugation, washed three times with ethanol, and dried at 80 °C for 12 h to afford a white powder, designated as MBON-2.
2.2. Structural Characterization
Powder X-ray diffraction (PXRD) analyses were performed using an X-ray diffractometer (Rigaku, SHIMADZU, Tokyo, Japan) to determine the crystallinity and phase purity of the samples. Using a Cu Kα radiation source (λ = 0.15406 nm) operated at 40 kV and 30 mA, diffraction data were collected from 5° to 50°. The resulting patterns were then compared with the simulated spectrum of MBON-2. The morphology and elemental mapping analysis were characterized by field-emission scanning electron microscopy (SEM, S-4800, Hitachi, Tokyo, Japan) at an acceleration voltage of 20 kV. Transmission electron microscopy (TEM) was conducted with an instrument (FEI TECNAI G2 F20, Philadelphia, PA, USA) conducting at 200 kV. Nitrogen adsorption–desorption measurements were performed at 77 K using a low-temperature physisorption analyzer (Quantachrome, autosorb iQ, Boynton Beach, FL, USA). The material’s specific surface area, pore size distribution, and pore structure were examined using non-local density functional theory (NLDFT) and Brunauer–Emmett–Teller (BET) methods. X-ray photoelectron spectroscopy (XPS) measurements were performed using an EscaLab 250Xi photoelectron spectrometer (Thermo Fisher, Waltham, MA, USA). The C 1s peak at 284.8 eV was used as an internal reference to calibrate the binding energy scale to compensate for surface charge-induced shifts. FTIR spectra (Bruker, INVENIO-S, Billerica, MA, USA) were employed to identify the various vibrational modes, bonding characteristics and functional groups of MBON-2. To obtain stable and reliable signals for the ECH of FFR, a constant potential was applied to the catalyst electrode for 250 s prior to data acquisition. Subsequently, the FFR ECH process was monitored using an in situ IR cell at a fixed potential of −0.2 V RHE, with data collected at 30 s intervals.
2.3. Electrochemical Analysis
All experiments were performed using a CHI 660F electrochemical workstation (Shanghai Chenhua Instrument Corporation, Shanghai, China). All electrochemical analyses were conducted in a two-compartment H-cell (30 mL per compartment) separated by a Nafion 117 membrane, preventing re-oxidation of reduction products at the anode. The electrochemical performance of the synthesized materials was tested using Hg/HgO and Pt sheet as the reference electrode and counter electrode, respectively. With hydrophobic carbon paper (TGP-H-060) as the substrate for the working electrode, first prepare a mixed solution of 1000 μL perfluorosulfonic acid resin (Nafion, 5 wt.%), ethanol, and deionized water (5: 75: 20 v/v/v). Then, ultrasonicate for 30 min to obtain a uniformly dispersed solution. Finally, transfer 200 μL of the dispersion into a pipette, drop-cast it evenly onto a 1 cm × 2 cm carbon paper (test area: 1 cm × 1 cm), and dry at room temperature to obtain the working electrode. Before the reaction, fill both the cathode and anode compartments of the H-cell with 30 mL of 1.0 M KOH electrolyte, and purge with Ar for 30 min. Linear sweep voltammetry (LSV) curves were recorded at a scan rate of 10 mV s−1 in the potential range of −0.8 to −1.8 (V vs. Hg/HgO), both in the presence and absence of 20 mM FFR. Chronoamperometry was employed for potentiostatic electrolysis of 20 mM FFR at different potentials to identify the optimal FE potential for the products. A stability test was conducted through multiple cycling tests at −0.2 V vs. RHE, with electrolyte replacement after each cycle. The double-layer capacitance (Cdl) of all electrocatalyst samples was evaluated using cyclic voltammetry (CV) tests at various scan rates (20, 40, 60, 80, and 100 mV s−1) within the non-Faradaic region (−0.05 to 0.05 V vs. Hg/HgO, 1 M KOH). The Cdl value was determined by linearly fitting the Δj at 0 V vs. Hg/HgO against scan rates. Electrochemical impedance spectroscopy (EIS) measurements were performed in the frequency range of 0.1–105 Hz with an AC amplitude of 5 mV.
Convert the measured potentials to the reversible hydrogen electrode (RHE) scale using the following equation:
E (V vs. RHE) = E (V vs. Hg/HgO) + 0.0591 × pH + 0.095 V
2.4. Quantitative Analysis of Products
Quantitative analysis of the electrochemical conversion of FFR to FFA was performed using high-performance liquid chromatography (HPLC; Hitachi, Primaide, Tokyo, Japan) equipped with an Agilent C18 column and a variable wavelength detector. Calibration curves relating the peak areas of FFR and FFA to their concentrations were first established in HPLC (Figure S1). Post-reaction, 40 μL of the mixture was transferred to an HPLC vial. Subsequently, 960 μL of deionized water was added to the mixture to dilute the solution and 10 µL solutions was analyzed.
Calculate the FFR conversion (X), electrochemical selectivity (SE), and Faradaic efficiency (FE) of the product using the following equations:
where n is the electron transfer number of the product and F is the Faraday constant (96 485 C mol−1).
3. Results and Discussion
3.1. Catalyst Characterization
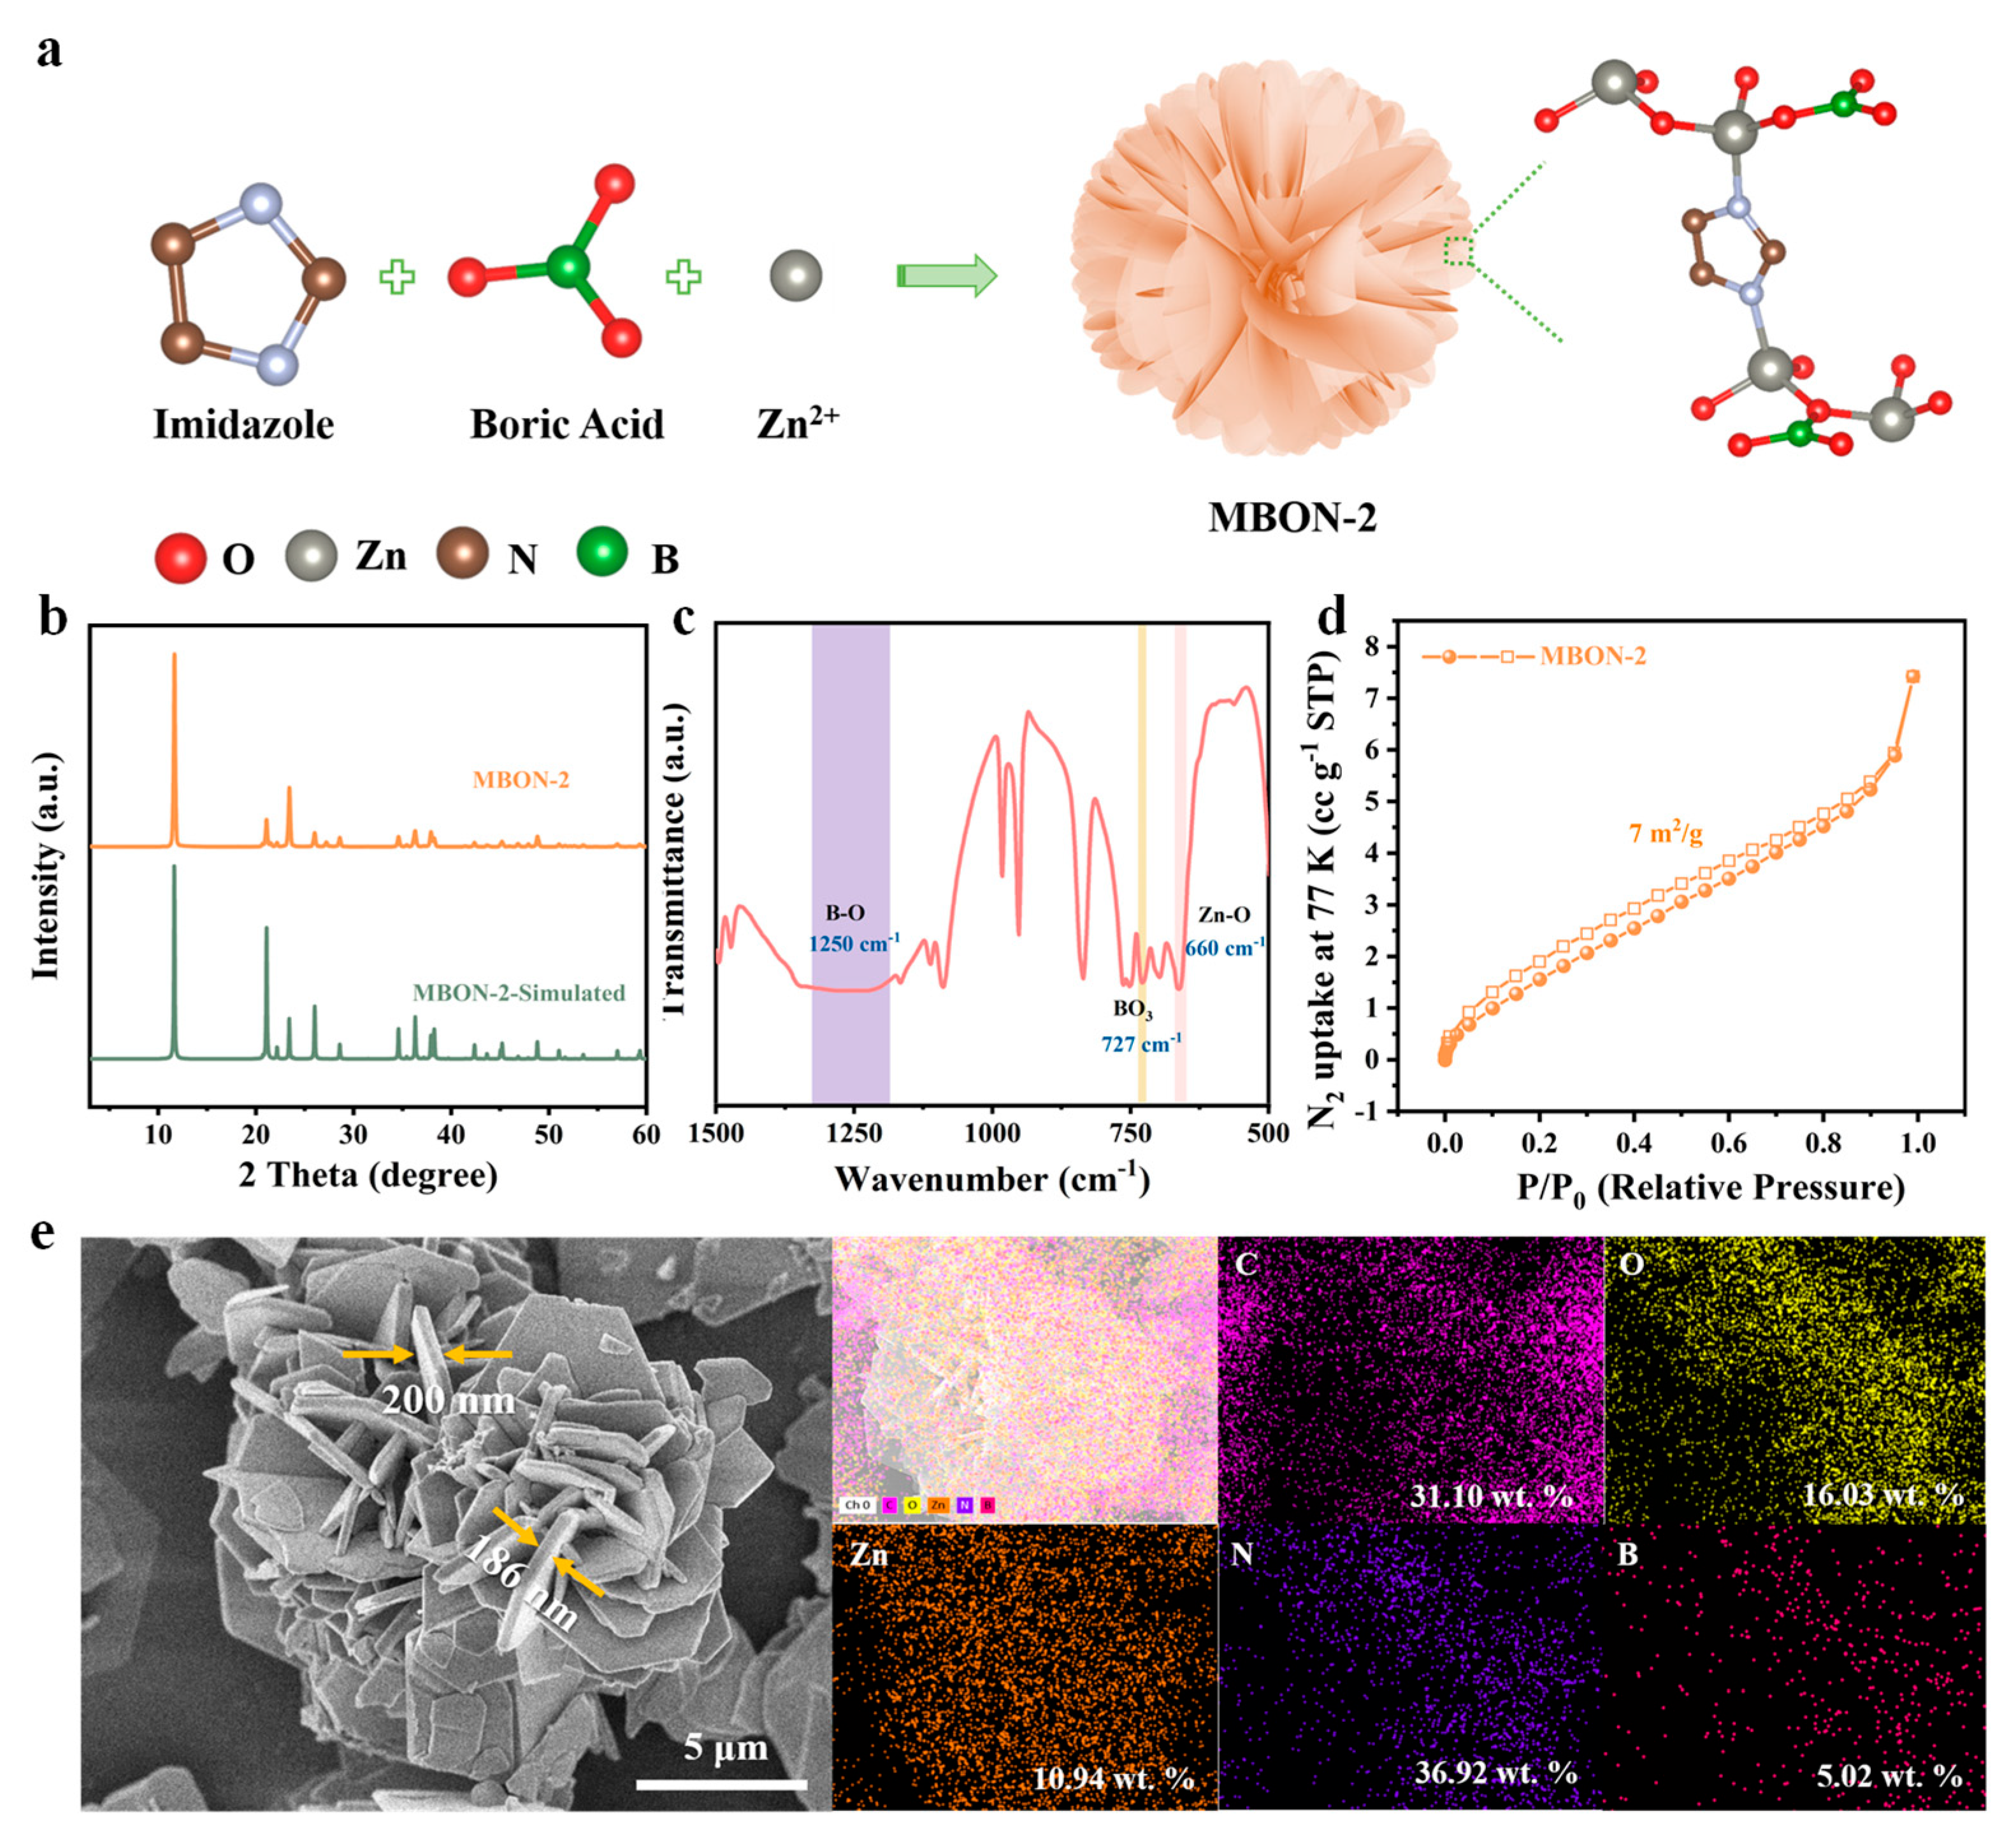
MBON-2, synthesized via a solvothermal method using Zn(NO3)26H2O, C3H4N2, and H3BO3, exhibits a 3D flower-like hierarchical architecture assembled from nanosheets (Figure 1a). Within this structure, imidazole ligands bridge graphene-like ZnBO layers via Zn-N coordination bonds, thereby forming a pillared-layer framework. To investigate the crystal structure of MBON-2, powder XRD was performed (Figure 1b). The XRD pattern of the MBON-2 sample exhibited characteristic peaks in close agreement with the simulated peak pattern reported in the literature, demonstrating successful preparation of a pure-phase MBON-2 with good crystallinity. To further verify the structural composition of the MBON-2, Fourier transform infrared (FTIR) spectroscopy was performed to identify its functional groups (Figure 1c). The sharp peak at 727 cm−1 is attributed to the bending vibration of the BO3 group [28]. In addition, the absorption peak at approximately 1250 cm−1 is assigned to the asymmetric stretching vibration of the B-O bond within the BO3 group [29]. The peak at approximately 660 cm−1 is attributed to Zn-O atomic coordination. Additionally, the peak at approximately 3140 cm−1 is attributed to the vibration of B-OH bond, indicating the presence of uncoordinated BO3 group at the edge (Figure S2) [30]. N2 physisorption measurements were further conducted to assess the pore structures of the synthesized MBON-2. The results show that it features an IV type isotherm with a H3 hysteresis loop, confirming its abundant mesoporous structure (Figure 1d and Figure S3). The well-developed mesoporous structure is conductive to facilitate reactant transport and provide ready access to the exposed catalytic sites, thereby accelerating the reaction kinetics. SEM image demonstrated that MBON-2 displays a distinctive 3D nanoflower-like hierarchical architecture with a diameter of less than 20 μm, assembled from nanosheets with a thickness of approximately 200 nm (Figure 1e). TEM images also prove the presence of ultrathin nanosheets in MBON-2 (Figure S4). The thick nanosheets can endow MBON-2 with robust structural stability in the reaction process. The 3D hierarchical flower-like architecture features microporous channels that facilitate maximized exposure of edge sites and mass transfer. Elemental mapping analysis and energy-dispersive X-ray (EDX) spectroscopy of MBON-2 demonstrates homogeneous spatial distribution of Zn, B, C, O, and N throughout the nanostructure, with no detectable impurities (Figure 1e, Figure S5 and Table S1).
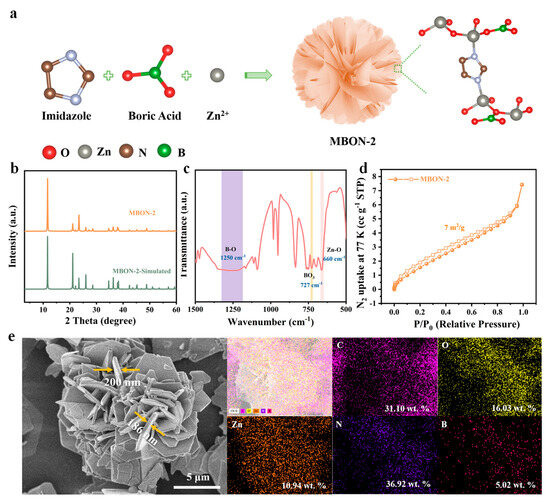
Figure 1.
(a) Schematic illustration of MBON-2 nanoflowers synthesized via facile hydrothermal method; (b) XRD pattern, (c) FT-IR spectrum, and (d) the low-temperature nitrogen adsorption–desorption isotherm of the prepared MBON-2; (e) elemental mapping analysis of MBON-2.
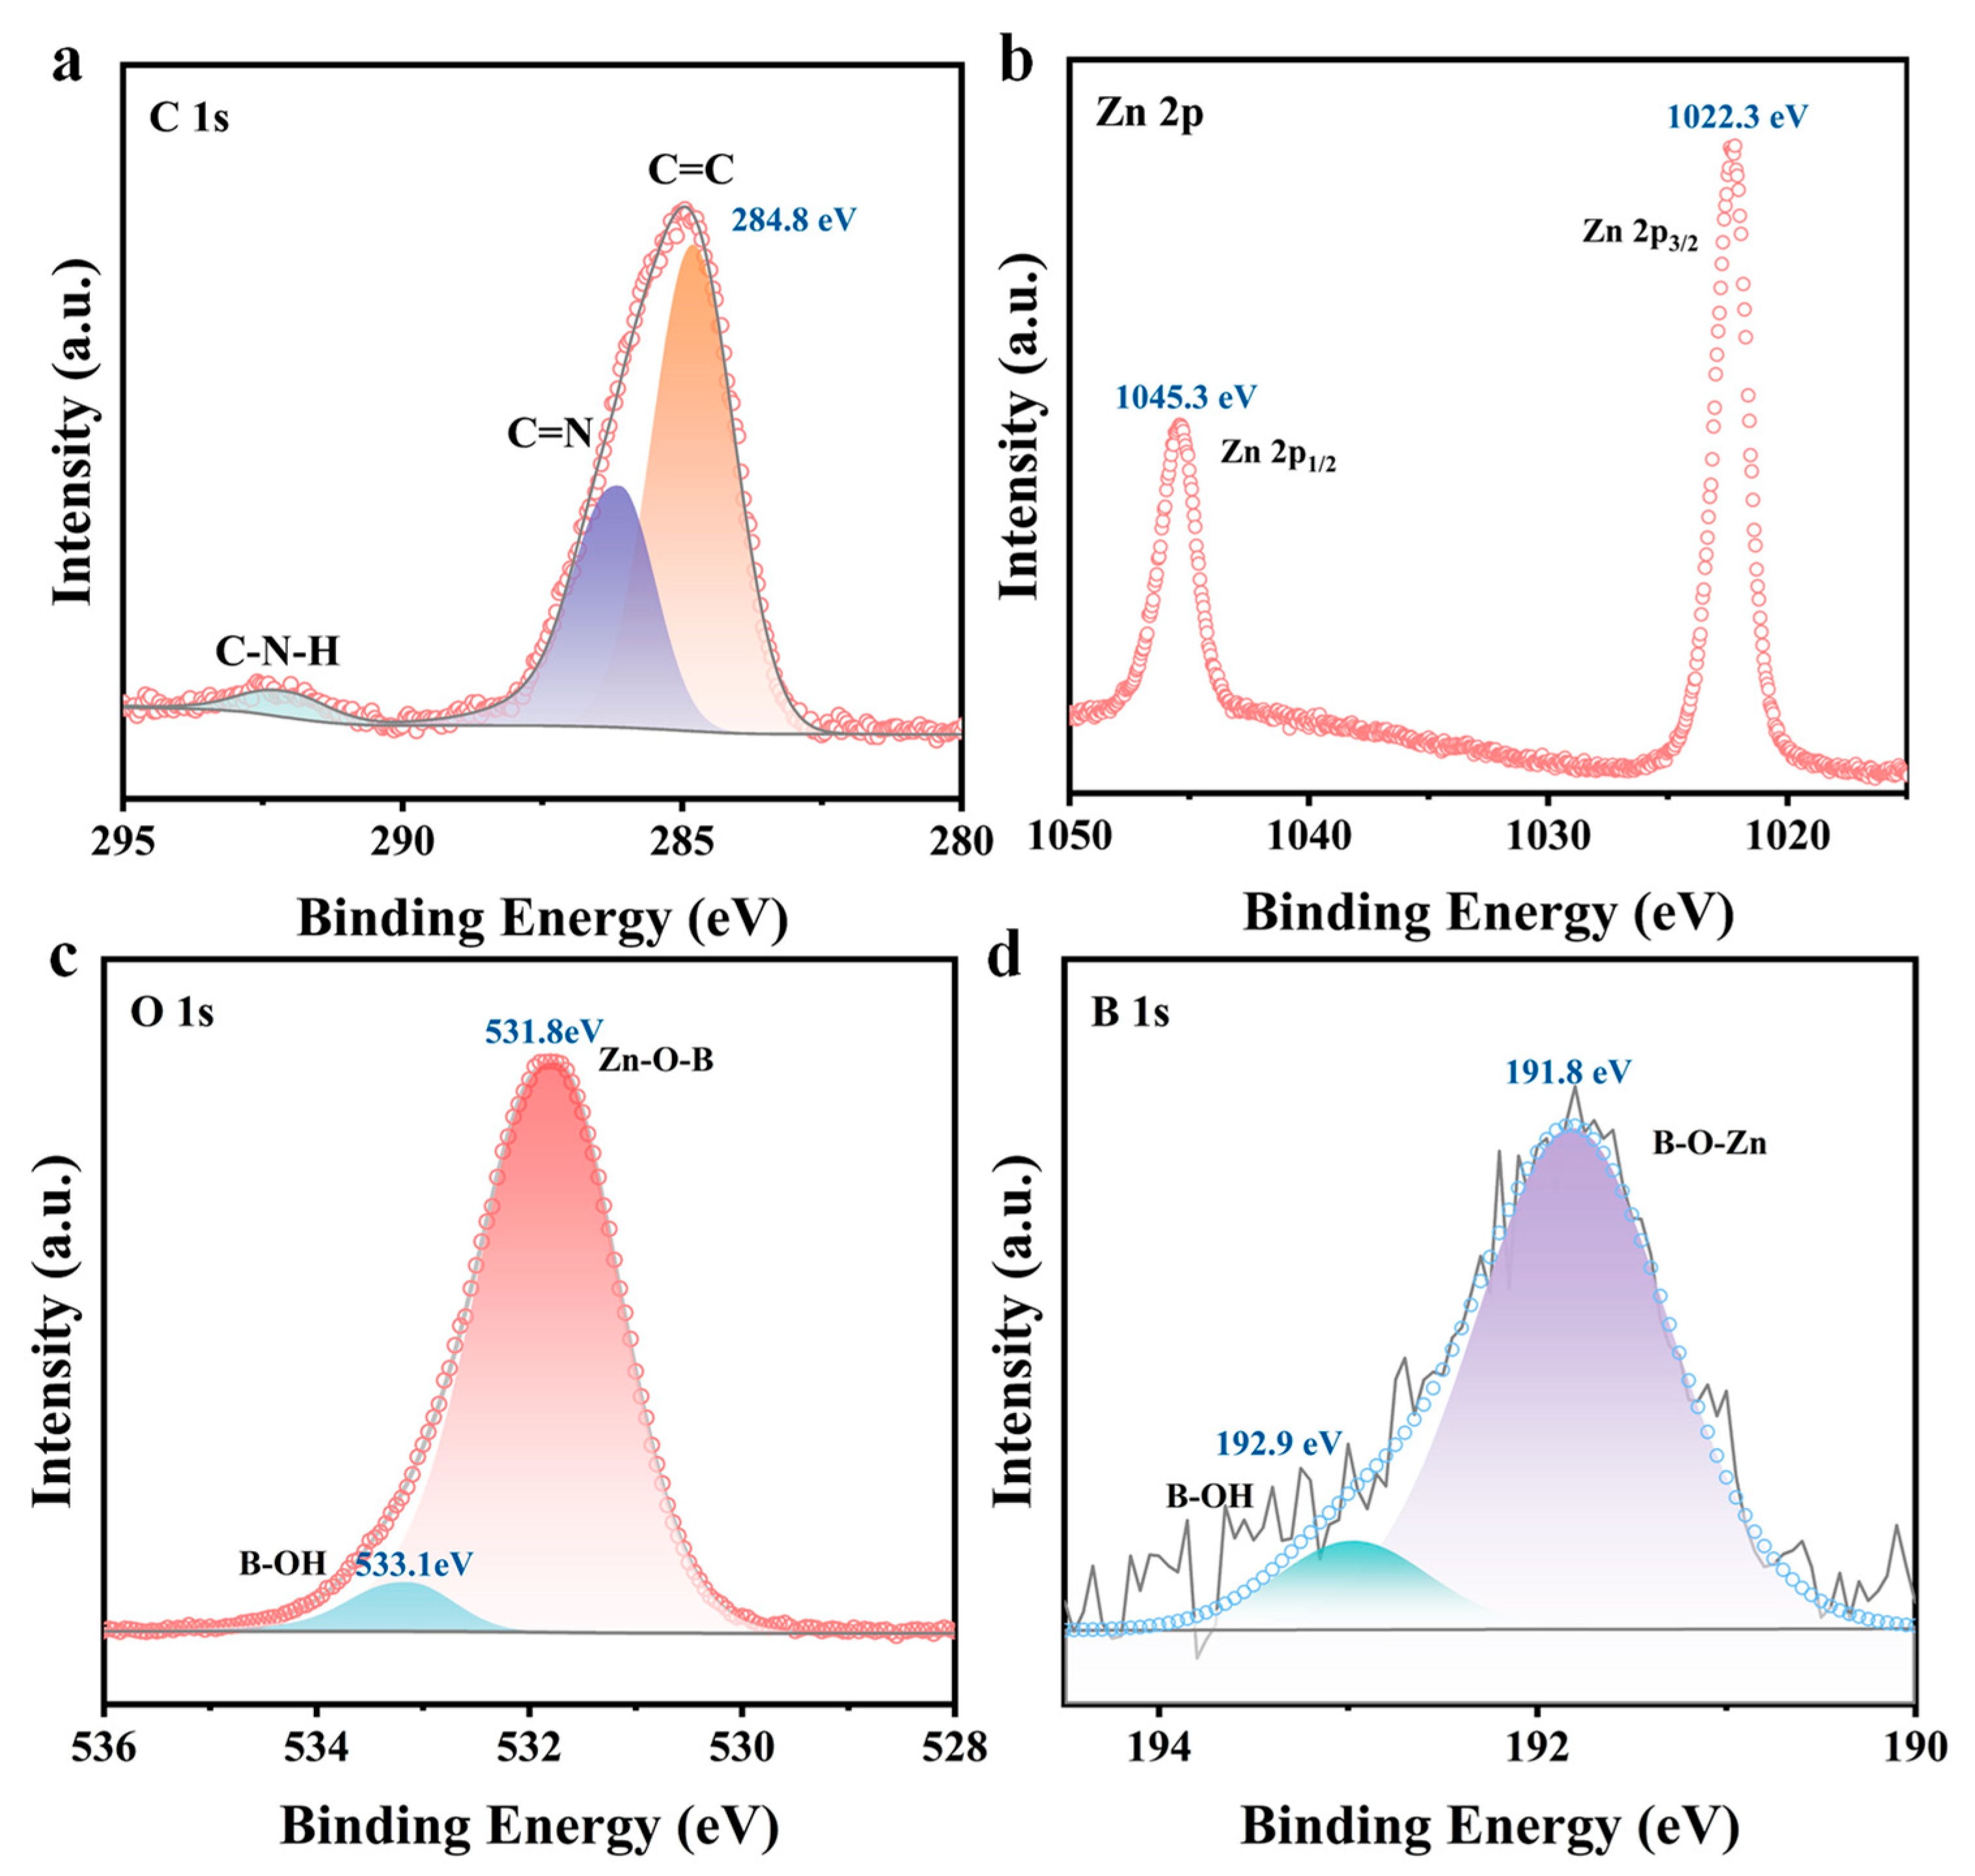
X-ray photoelectron spectroscopy (XPS) further confirms the chemical composition and valence state of MBON-2. The XPS survey spectrum verifies the presence of Zn, B, C, O, and N elements in MBON-2 (Figure S6a), with the C=C bond calibration peak positioned at 284.8 eV (Figure 2a). The Zn 2p high-resolution spectrum exhibits spin–orbit singlet peaks at 1045.3 eV (2p1/2) and 1022.3 eV (2p3/2) (Figure 2b) [31]. The N 1s spectrum can be deconvoluted into two peaks at 399.3 eV (N=C) and 401 eV (H-N-C) (Figure S6b). Similarly, the O 1s spectrum resolves into two peaks at 531.8 eV and 533.1 eV, consistent with Zn-O-B and B-OH bonds, respectively (Figure 2c). In the B 1s spectrum (Figure 2d), peaks located at 192.9 eV and 191.8 eV are attributed to B-OH and B-O-Zn species, respectively.
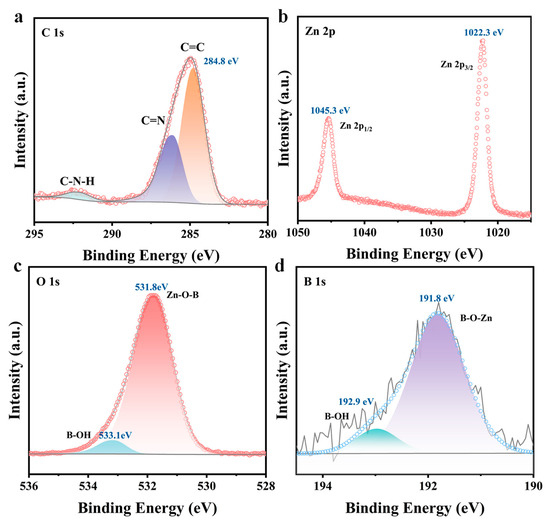
Figure 2.
High magnification XPS spectra in the (a) C 1s, (b) Zn 2p, (c) O 1s, and (d) B 1s.
3.2. Electrocatalytic Furfural Hydrogenation
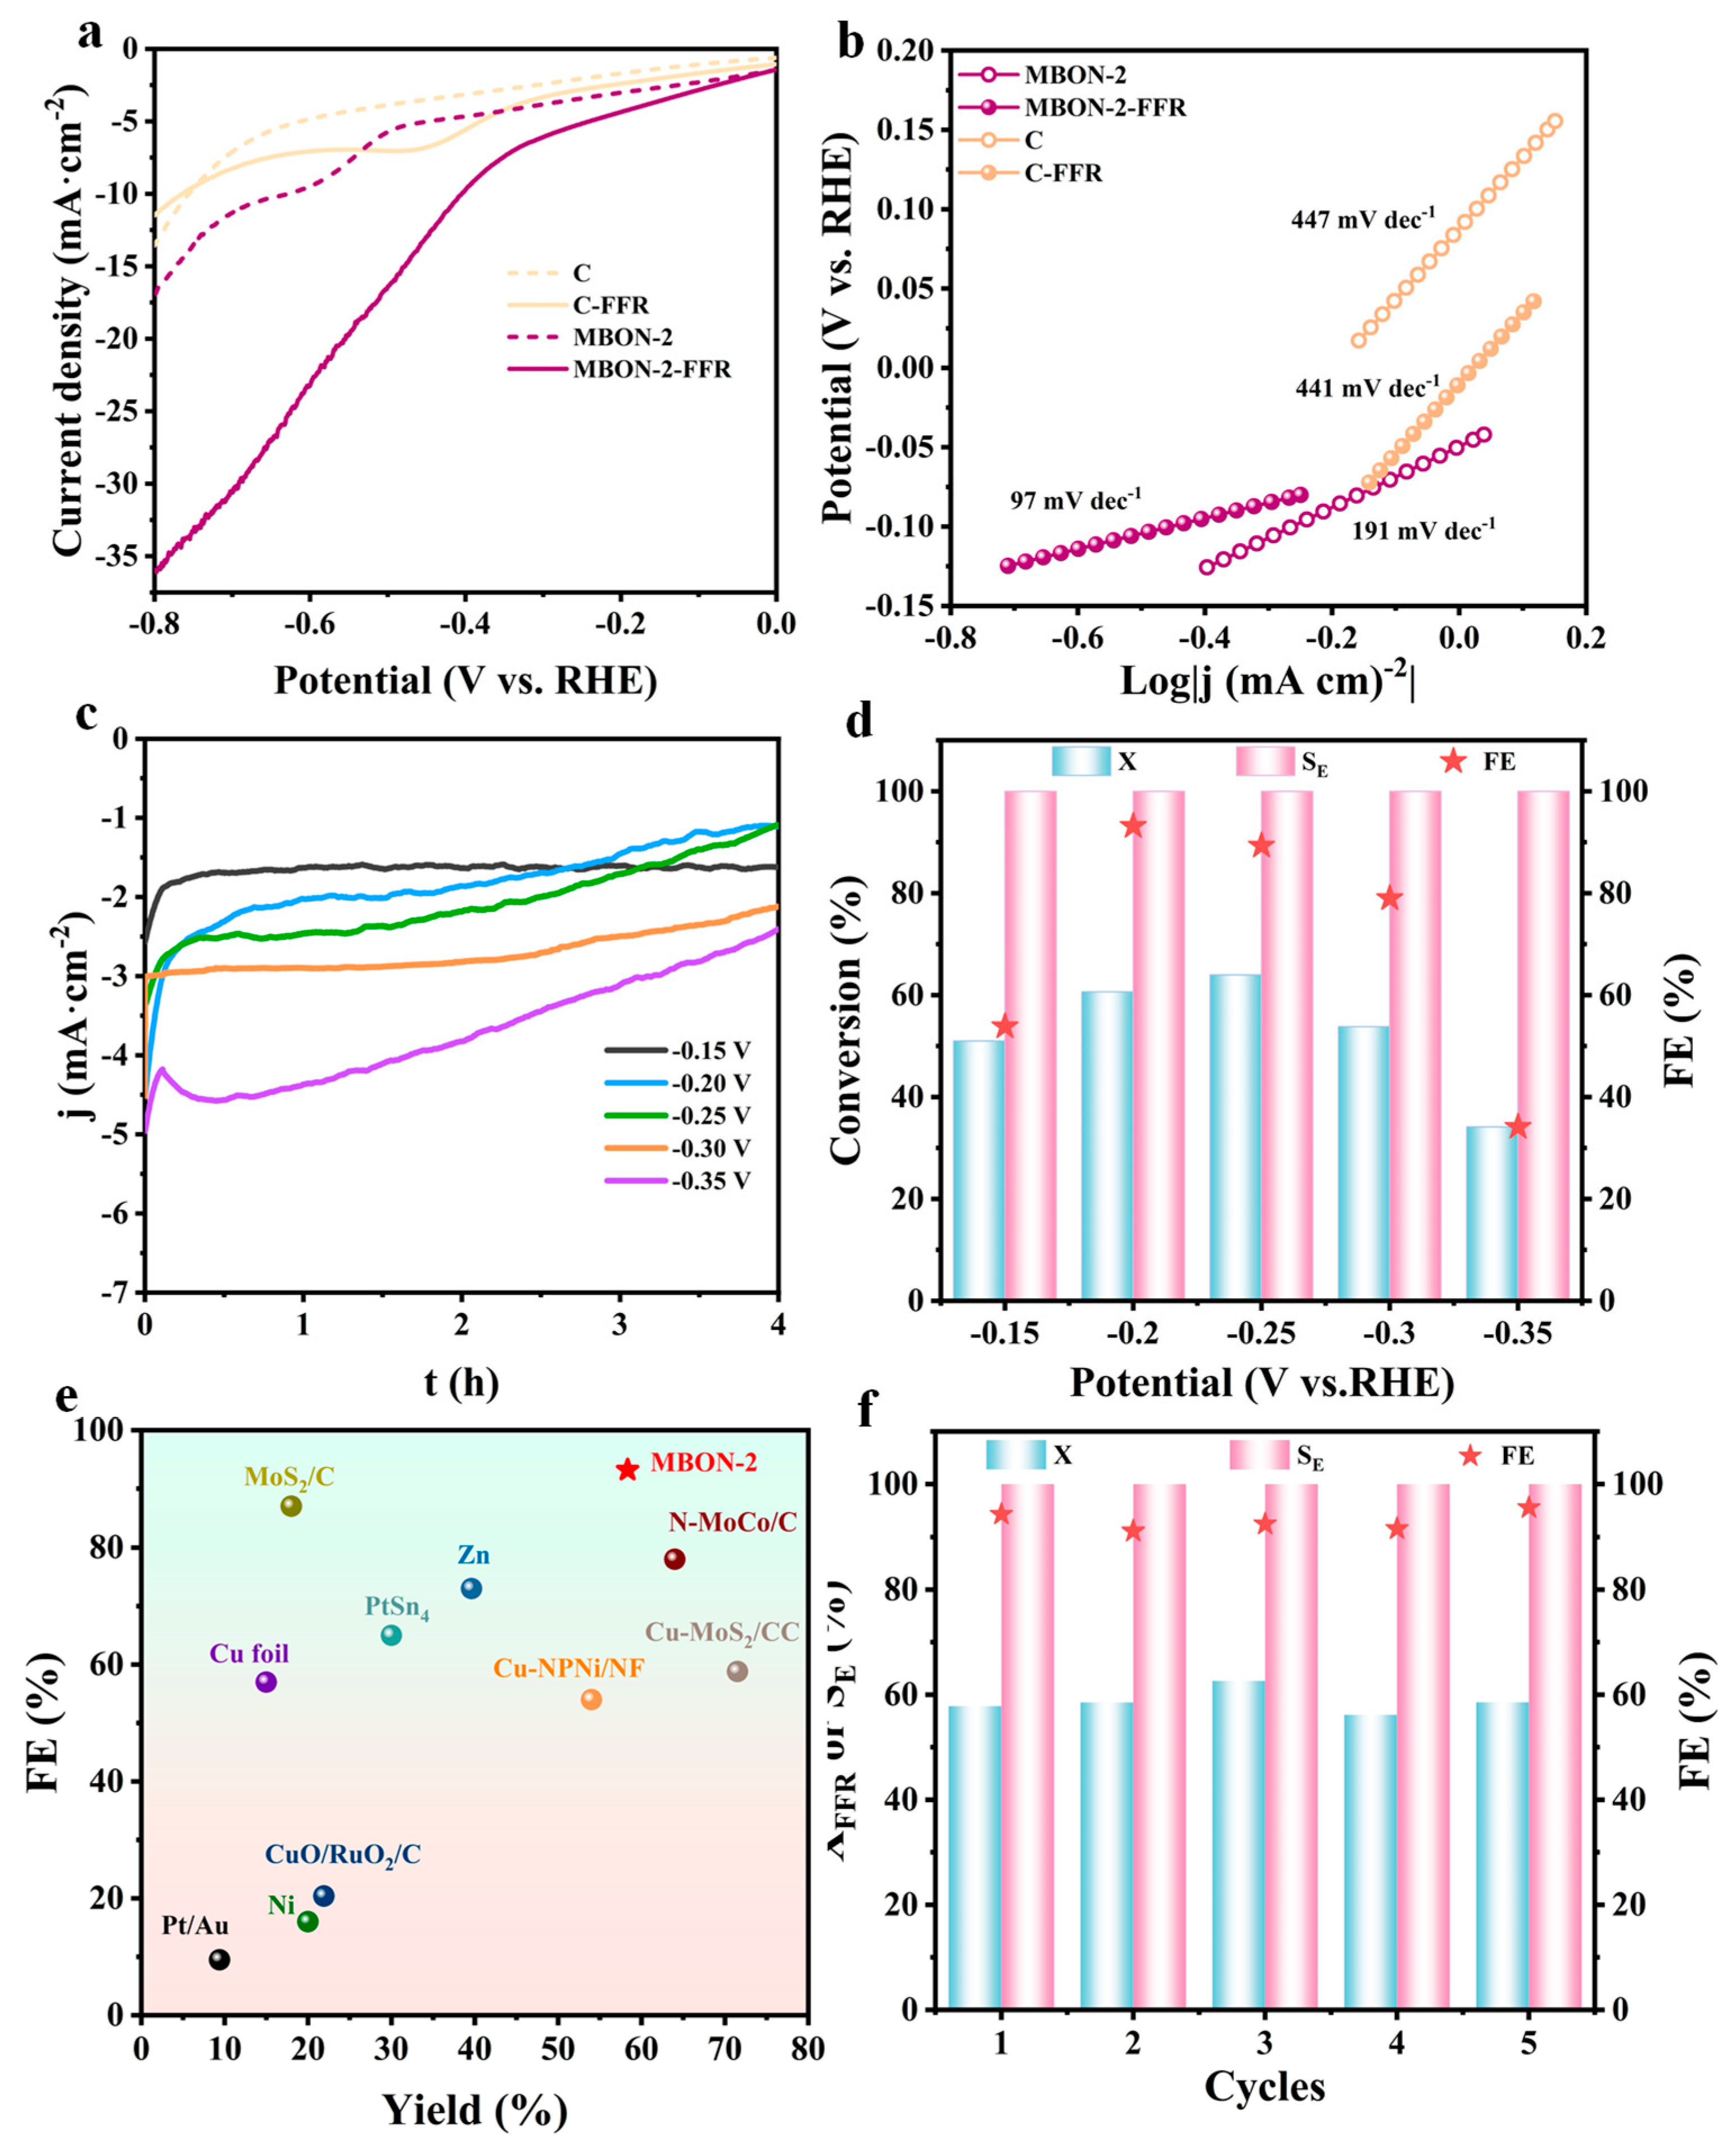
The electrocatalytic performance of the synthesized MBON-2 for the ECH of FFR was evaluated under alkaline conditions. After the introduction of FFR, the LSV curve of MBON-2 revealed a distinct increase in current density within the range of −0.8 to 0 V vs. RHE, confirming the occurrence of the FFR reduction reaction (Figure 3a) [32]. In comparation, only a negligible increase in current density was obtained on the pure carbon paper (C) substrate upon FFR addition. Furthermore, the current density initiates earlier upon FFR addition compared to the FFR-free electrolyte, indicating that FFR ECH is thermodynamically more favorable than the HER. Concurrently, Tafel slopes were converted and fitted via the Tafel equation derived from the cathodic LSV curves. As shown in Figure 3b, MBON-2 nanoflowers exhibit a lower Tafel slope (97 mV dec−1) than C (441 mV dec−1) under the presence of FFR, suggesting a relatively rapid electrochemical kinetics on MBON-2. For HER, Tafel slopes exceeding 120 mV dec−1 in all cases confirm the Volmer step as the rate-determining step. Furthermore, upon the addition of FFR, the Tafel slope on C remained essentially unchanged. This suggests that the electrochemical processes on C were almost unaffected by FFR, and the rate-determining step (RDS) likely remained the Volmer step. In contrast, the significant decrease in the Tafel slope for MBON-2 upon FFR addition indicates that ECH was favored over the HER, which consequently altered the RDS. Additionally, the double-layer capacitance (Cdl) of the catalyst was determined to be 0.10 mF cm−2 through CV at varying scan rates, and the electrochemical surface area (ECSA) of MBON-2 was subsequently calculated to be 2.5 cm2 based on the Cdl value (Figure S7 and Table S2). The ECH behavior of FFR over the catalyst was further investigated under different potentials during 4 h of electrolysis (Figure 3c,d). Simultaneously, the concentrations of both compounds in the post-electrolysis reaction mixture were quantified by establishing calibration curves (Figure S1). With prolonged reaction time, FFR was gradually consumed, accompanied by a progressive decrease in current density. Comparative analysis of FFR conversion, FFA selectivity, and FE across different potentials indicated that the selectivity for FFA is consistently 100%, demonstrating that the MBON-2 has exceptional high selectivity in the electrochemical reduction process of FFR to FFA. Notably, potential variations significantly influenced FFR conversion and FE, which exhibited a volcano trend between −0.15 V and −0.35 V vs. RHE. The optimal catalytic performance was achieved at −0.20 V vs. RHE, with a 58.34% conversion of FFR, 100% FFA selectivity, and a high 93.19% FE, surpassing most previously reported noble- and non-noble-based catalysts (Figure 3e). The diminished FE at high potentials likely stems from the competitive HER, which sequesters hydrogen radicals that available for FFR hydrogenation. Conversely, lower potentials diminish current densities, slowing electron transfer rates and impeding the electrocatalytic process. Consequently, unreacted FFR undergoes decomposition in the electrolyte due to insufficient reaction time. The cycling stability of MBON-2 nanoflowers was evaluated (Figure 3f). After five consecutive cycles, the selectivity toward FFA remained virtually unchanged, demonstrating excellent stability. The XRD pattern of post-reaction MBON-2 shows no significant changes, indicating high structural stability under alkaline conditions (Figure S8). Additionally, SEM image revealed that MBON-2 can retained its 3D layered nanoflower structure after five consecutive cycles, also confirming its excellent structural stability (Figure S9).
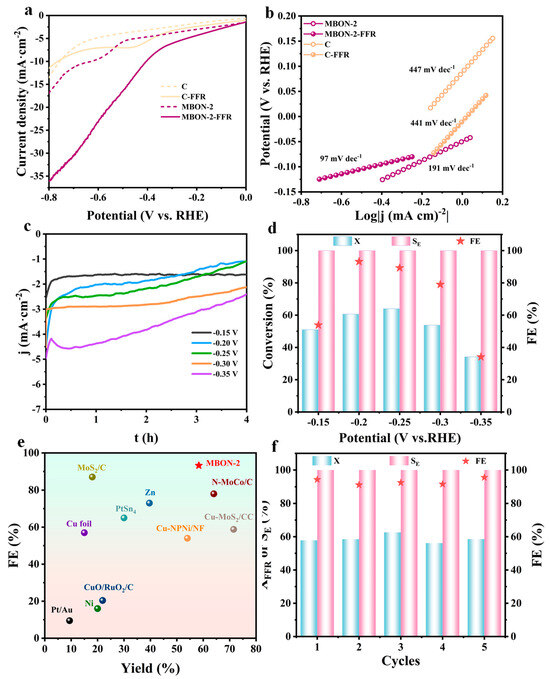
Figure 3.
(a) LSV curves of C and MBON-2 in 1 M KOH with and without 20 mM FFR; (b) Tafel slopes of C and MBON-2 before and after the addition of FFR; (c) chronoamperometric analysis curves at different potentials; (d) X of FFR, FE, and SE of FFR over MBON-2 nanoflowers at −0.15 to −0.35 V vs. RHE; (e) comparisons of the activity (FE and Yield of FFA) of MBON-2 with reported catalysts [15,23,24,32,33,34,35,36,37,38,39]; (f) catalysts performance of five consecutive electrolysis cycles with MBON-2 nanoflowers.
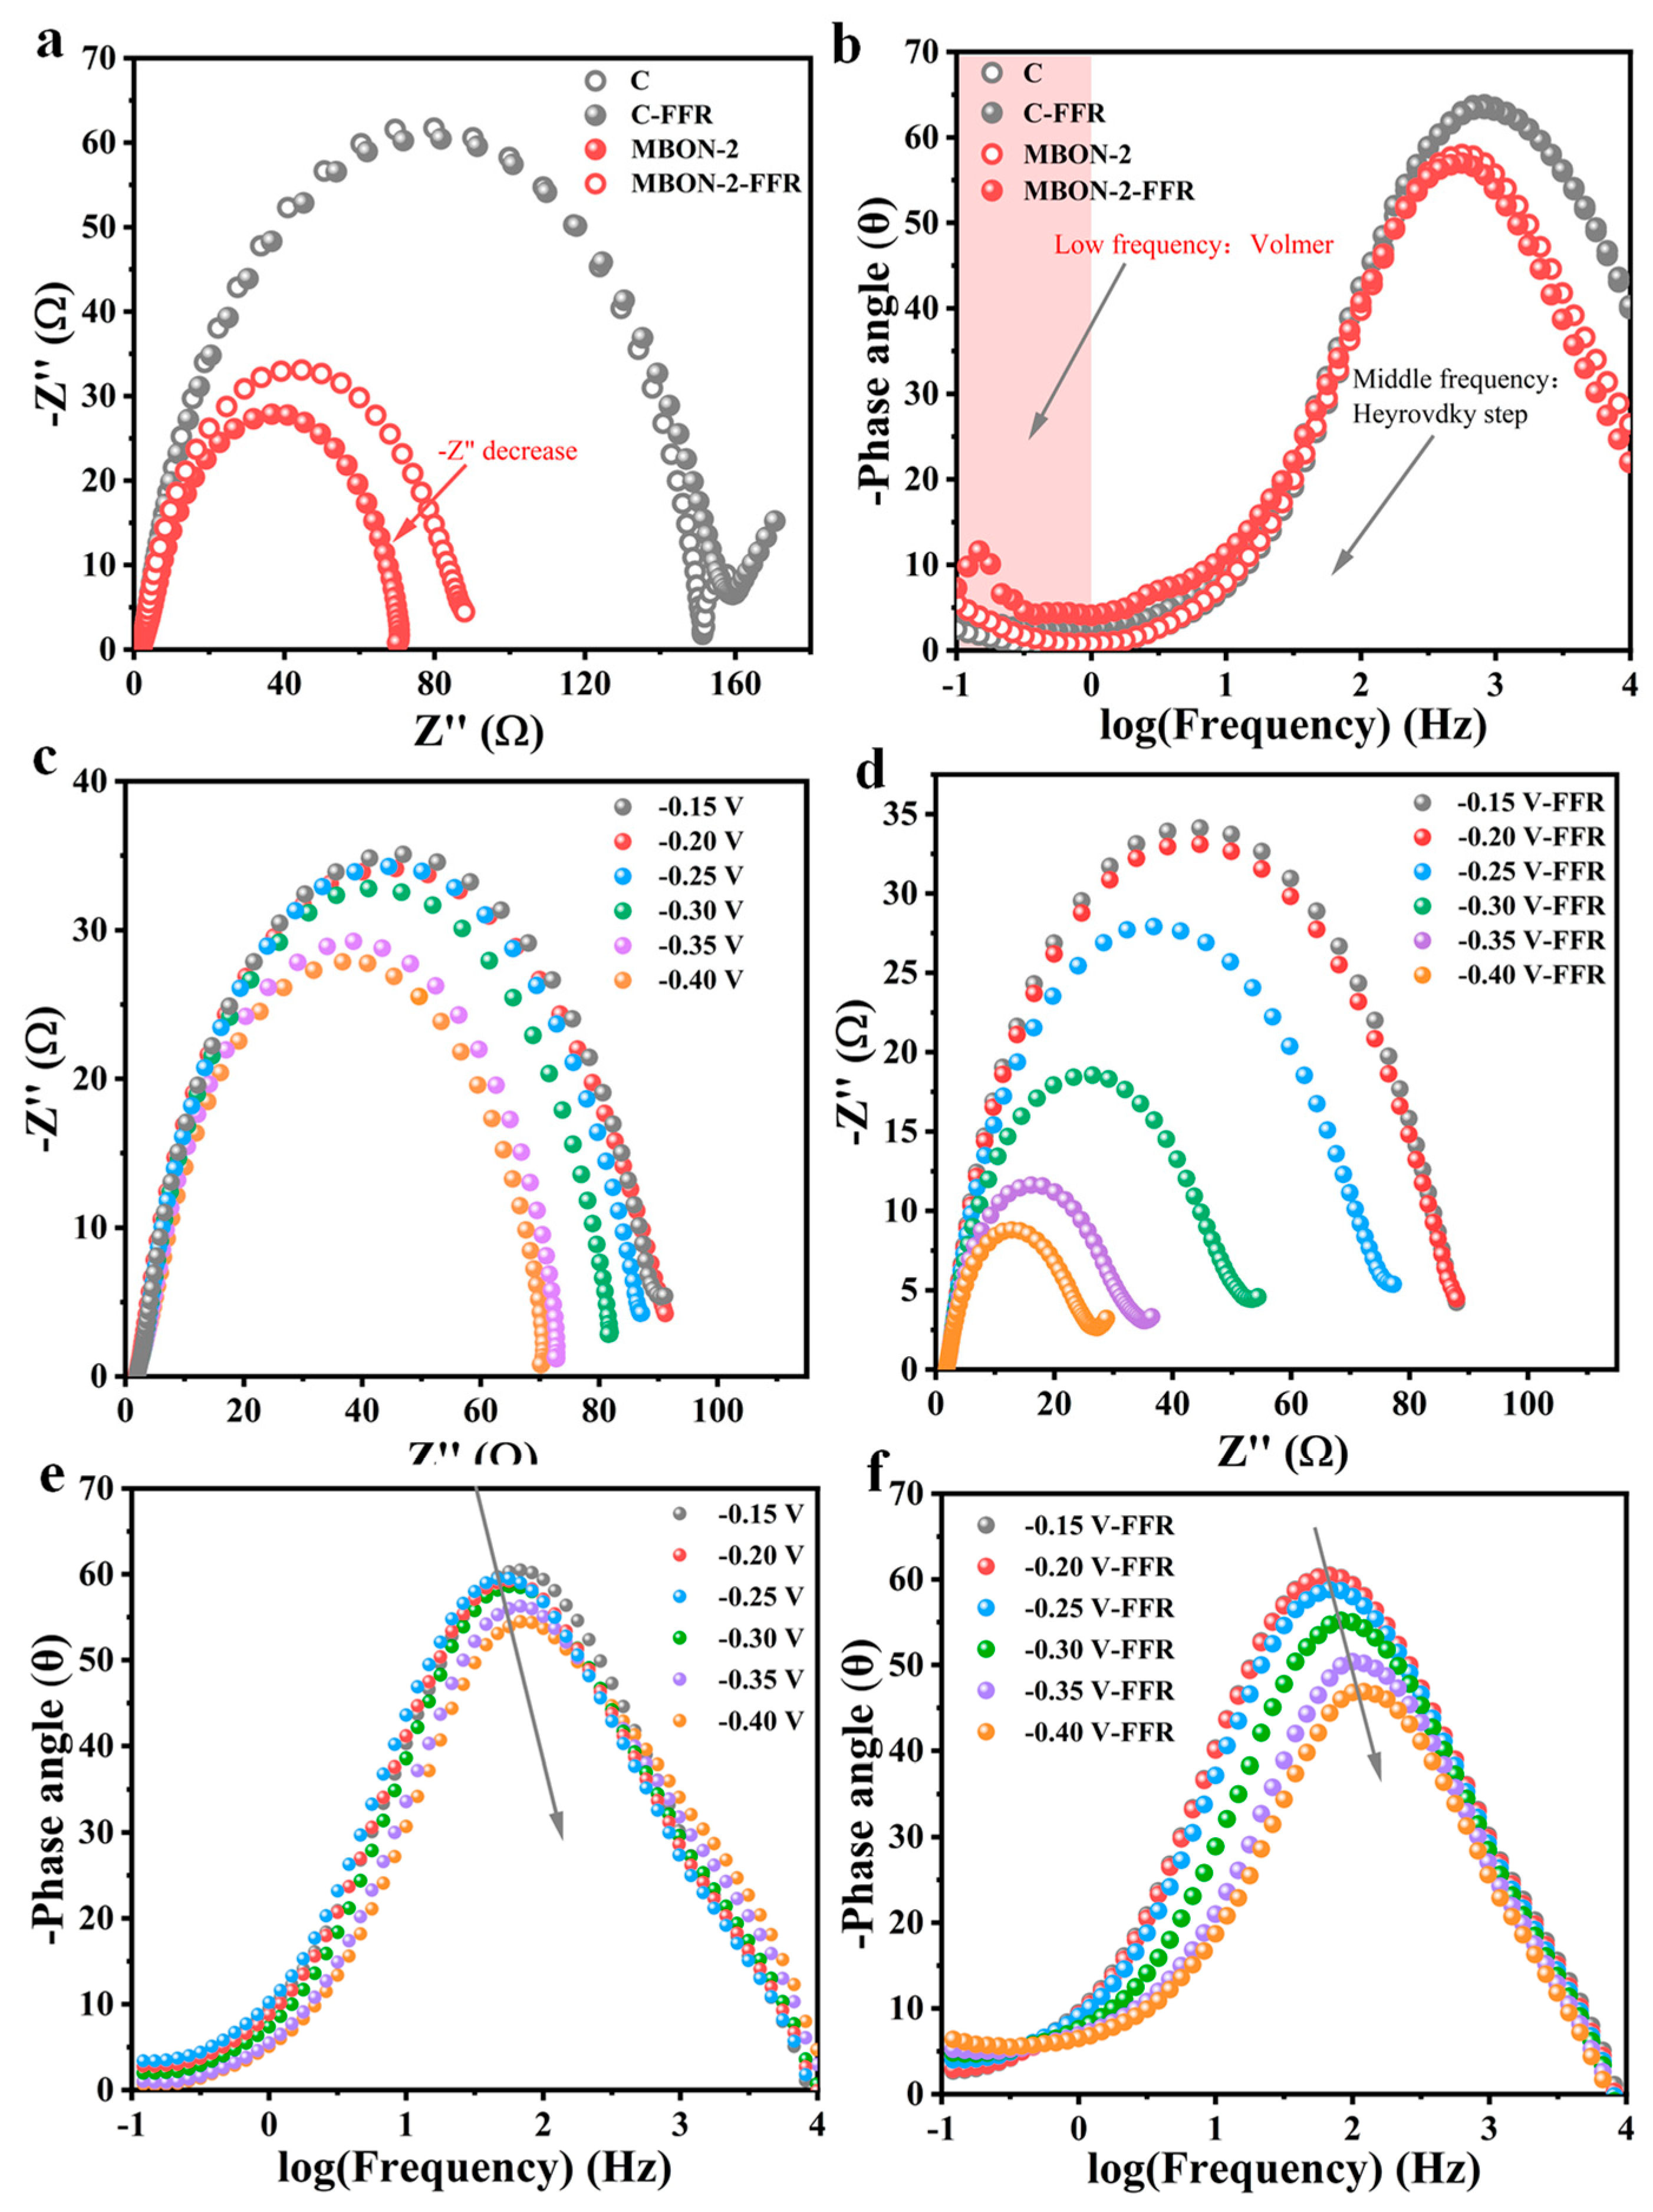
In situ electrochemical impedance spectroscopy (EIS) at varying potentials was employed to investigate the catalytic kinetics of FFR ECH. Bode phase plots were utilized to analyze electrochemical and charge–transfer interfaces during the reaction. Nyquist and Bode plots for the HER and ECH reactions on carbon paper (C) and MBON-2 at −0.2 V vs. RHE are compared (Figure 4a,b). The low-frequency region (<1 Hz) in Bode plots corresponds to the Volmer step, while the mid-frequency region (1 Hz to 102 Hz) relates to the Heyrovsky step [40]. Charge transfer resistance (Rct) can qualitatively reflect electron transfer kinetics. MBON-2 exhibited a smaller semicircle diameter in Nyquist plots and lower Rct at identical potentials, indicating accelerated charge transfer. Bode plots were employed to further investigate charge transfer dynamics. Upon the introduction of FFR, the low-frequency relaxation on C remained virtually unchanged, whereas this phenomenon was significantly decreased on MBON-2. This reduction facilitates electron transfer during the Volmer step. Additionally, EIS measurements were conducted from −0.15 to −0.35 V vs. RHE to probe potential-dependent catalytic kinetics of FFR ECH (Figure 4c–f). With increasing potential, both catalysts exhibited decreasing Rct and phase angles regardless of FFR presence, indicating accelerated kinetics for both HER and FFR ECH. Upon FFR introduction, Bode plots showed distinct peak shifts toward higher frequencies accompanied by reduced phase angles. This phenomenon likely stems from disruption of the Volmer step equilibrium, leading to predominant FFR hydrogenation. The above-mentioned results highlighted the superior intrinsic activity of MBON-2 toward FFR ECH.
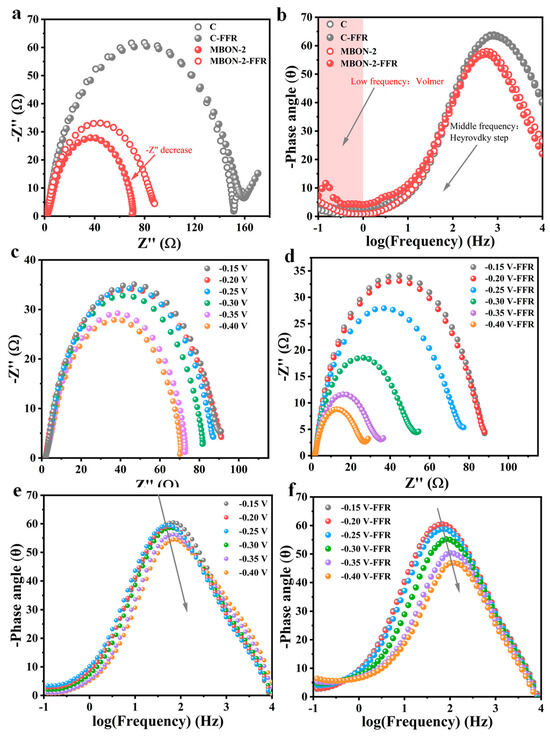
Figure 4.
(a) Nyquist and (b) Bode plots of C and MBON-2 in 1 M KOH before and after the addition of FFR at −0.2 V vs. RHE; Nyquist plots for MBON-2 at different potentials in 1 M KOH (pH = 14) (c) without and (d) with the addition of 20 mM FFR; Bode plots for MBON-2 at different potentials in 1 M KOH (pH = 14) (e) without and (f) with the addition of 20 mM FFR.
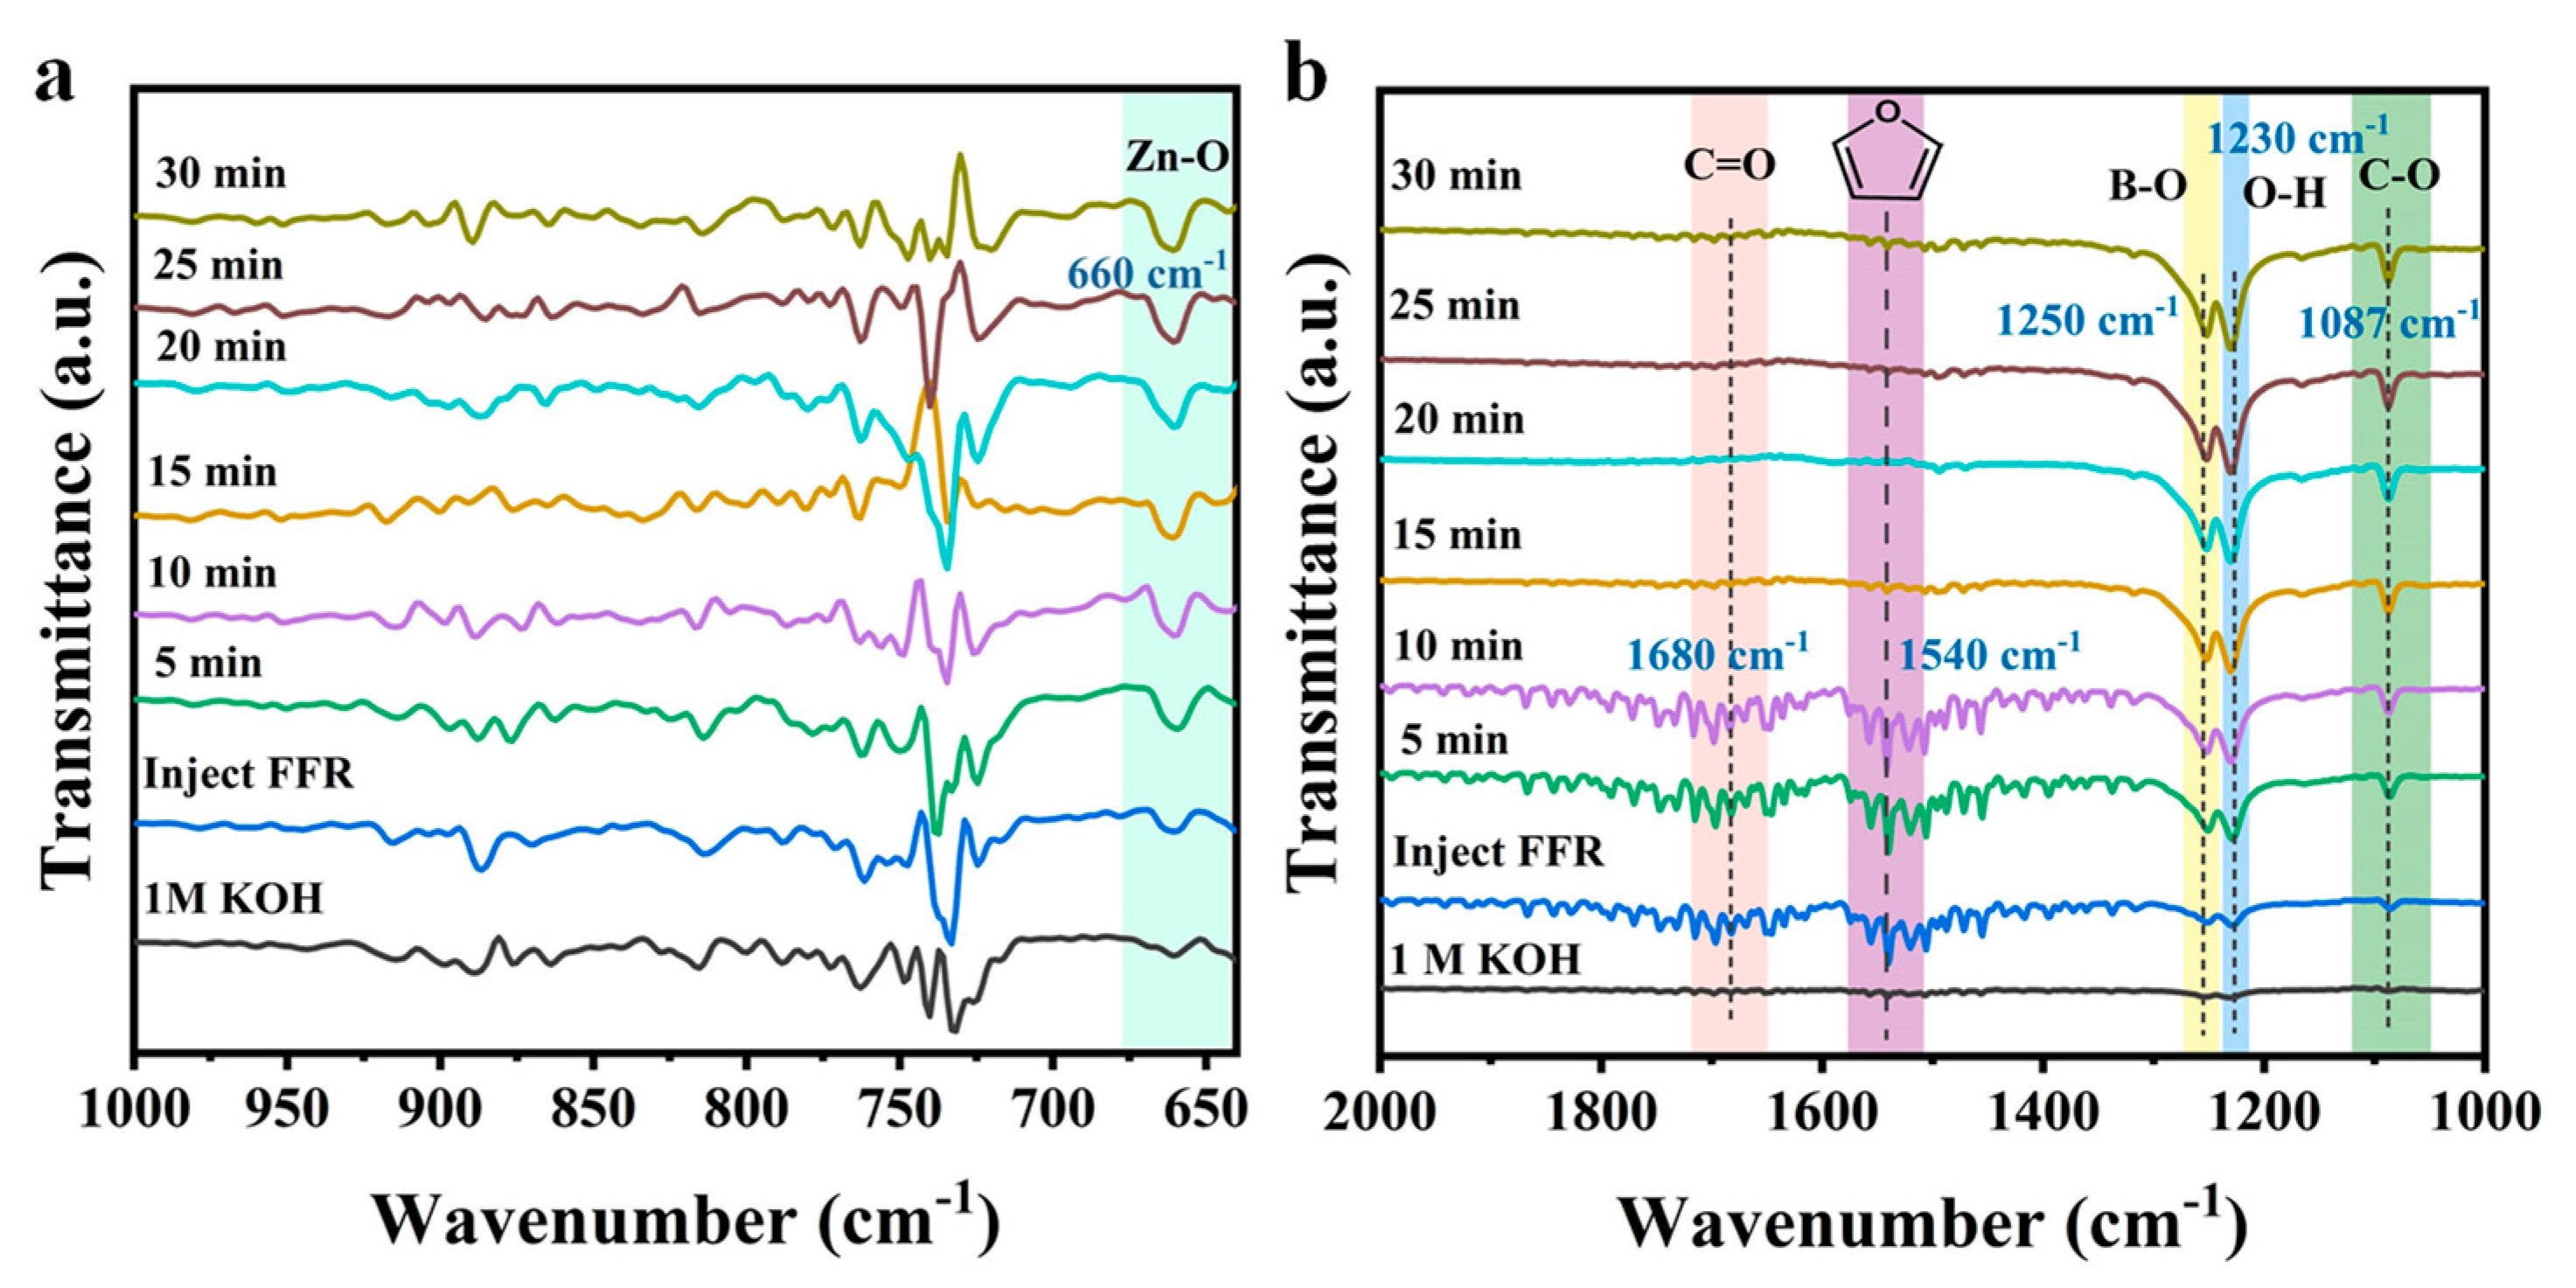
The adsorption behavior of FFR on the catalyst surface was further analyzed using in situ Fourier transform infrared (FTIR) spectroscopy. After introducing FFR, the characteristic peaks attributed to C=O of aldehyde group and C=C of the furan ring can be clearly observed (Figure S10). As evidenced by Figure 5a,b, the characteristic vibrational modes of Zn-O (660 cm−1) and B-O (1250 cm−1) bonds show markedly enhanced intensities as increasing the reaction time. The above results indicated that FFR molecules can adsorb at the Zn and B sites, and simultaneously undergo hydrogenation reactions. Therefore, featured with abundant Zn and B sites, MBON-2 exhibited excellent catalytic performance in FFR ECH. An infrared absorption peak observed at ~1680 cm−1 is attributed to the stretching vibration of the C=O in the FFR molecule [41,42]. The intensity of the C=O peak gradually decreases with prolonged reaction time, indicating the reduction in FFR molecules in the electrolyte. Meantime, the characteristic peaks appearing at ~1087 cm−1 and ~1230 cm−1 are attributed to the C-O stretching vibration and O-H in-plane bending vibration in FFA, respectively [43]. The increased intensity of characteristic peaks belonging to FFA, observed with prolonged reaction time, confirms the generation of FFA in the electrolyte. Furthermore, a characteristic peak detected at ~1540 cm−1 corresponds to the C=C stretching vibration of the furan ring [44], reflecting the planar adsorption of FFR molecules on the MBON-2.
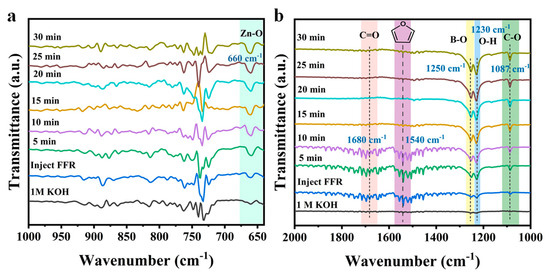
Figure 5.
In situ FTIR spectra of MBON-2 at −0.2 V: (a) 650–1000 cm−1, (b) 1000–2000 cm−1.
4. Conclusions
In summary, a Zn-based metal–organic framework (MBON-2) featuring a unique 3D flower-like hierarchical structure was synthesized via a facile hydrothermal method. To the best of our knowledge, this represents the first application of Zn-based MOFs in the ECH of FFR, with MBON-2 demonstrating 100% FFA selectivity and a high FE of 93.19% under alkaline medium. In situ EIS analysis confirmed the exceptional charge transfer capability of MBON-2 during the ECH of FFR, where its robust and porous flower-like architecture significantly mitigated mass transfer resistance. In situ FTIR spectroscopy studies directly captured the synergistic catalytic mechanism involving the dual-active sites (B/Zn). The numerous Zn and B active centers act cooperatively, enabling MBON-2 to concurrently achieve high catalytic activity and extremely high FFA selectivity (100%). Concurrently, cyclic stability testing confirmed the exceptional mechanical stability endowed by its hierarchical porous architecture. This work not only elucidates the mechanism of B and Zn active sites in the ECH of FFR but also offers new guidance for the precise construction of highly effective Zn-based catalysts for the upgrading of FFR.
Supplementary Materials
The following supporting information can be downloaded at: https://www.mdpi.com/article/10.3390/chemistry7040124/s1, Figure S1: calibration curves of HPLC for (a) FFR and (b) FFA; Figure S2: FT-IR spectrum of the prepared MBON-2; Figure S3: the pore size distribution of MBON-2; Figure S4: the EDS spectrum of MBON-2; Figure S5: (a) XPS spectra and (b) N 1s spectrum of MBON-2; Figure S6: CV curves of (a) MBON-2 at different scan rates in 1 M KOH solution, (b) relation between current density and scan rates; Figure S7: SEM image of the MBON-2 after reaction; Figure S8: in situ FTIR spectra after introducing FFR; Figure S9: SEM image of the MBON-2 after reaction; Figure S10: in situ FTIR spectra after introducing FFR; Table S1: quantitative results of MBON-2 determined from EDS analysis; Table S2: Cdl and ECSA of MBON-2.
Author Contributions
Resources, Y.Z., C.S. and S.H.; software, H.Q.; writing—original draft, Y.Z.; writing—review and editing, Q.F. and X.Z.; supervision, X.Z.; funding acquisition, X.Z. All authors have read and agreed to the published version of the manuscript.
Funding
This research was funded by Colleges and Universities Twenty Terms Foundation of Jinan City grant number 202228053, and the Science, Education, and Industry Integration Innovation Pilot Project of Qilu University of Technology (Shandong Academy of Sciences) grant number 2024RCKY019.
Institutional Review Board Statement
Not applicable.
Informed Consent Statement
Not applicable.
Data Availability Statement
Data are contained within the article.
Conflicts of Interest
The authors declare no conflicts of interest.
References
- Ji, K.; Liu, Y.; Wang, Y.; Kong, K.; Li, J.; Liu, X.; Duan, H. Steerings selectivity in electrocatalytic furfural reduction via electrode-electrolyte interface modification. J. Am. Chem. Soc. 2024, 146, 11876–11886. [Google Scholar] [CrossRef]
- Liu, L.; He, Y.; Li, Q.; Cao, C.; Huang, M.; Ma, D.D.; Wu, X.T.; Zhu, Q.L. Self-supported bimetallic array superstructures for high-performance coupling electrosynthesis of formate and adipate. Exploration 2024, 4, 20230043. [Google Scholar] [CrossRef]
- Zeng, L.; Chen, Y.; Sun, M.; Huang, Q.; Sun, K.; Ma, J.; Li, J.; Tan, H.; Li, M.; Pan, Y.; et al. Cooperative Rh-O5/Ni(Fe) site for efficient biomass upgrading coupled with H2 production. J. Am. Chem. Soc. 2023, 145, 17577–17587. [Google Scholar] [CrossRef]
- Oh, Y.; Theerthagiri, J.; Kumari, M.L.A.; Min, A.; Moon, C.J.; Choi, M.Y. Electrokinetic-mechanism of water and furfural oxidation on pulsed laser-interlaced Cu2O and CoO on nickel foam. J. Energy Chem. 2024, 91, 145–154. [Google Scholar] [CrossRef]
- Bao, Y.; Du, Z.; Liu, X.; Liu, H.; Tang, J.; Qin, C.; Liang, C.; Huang, C.; Yao, S. Furfural production from lignocellulosic biomass: One-step and two-step strategies and techno-economic evaluation. Green Chem. 2024, 26, 6318–6338. [Google Scholar] [CrossRef]
- Han, S.; Kim, J.; Shim, J.; Lee, W.B.; Ryu, J.; Yoon, J. Optimizing electrochemical furfural hydrogenation on Pt via bimetallic colocalization of Cu. ACS Catal. 2024, 14, 17525–17534. [Google Scholar] [CrossRef]
- Akhade, S.A.; Singh, N.; Gutierrez, O.Y.; Lopez-Ruiz, J.; Wang, H.; Holladay, J.D.; Liu, Y.; Karkamkar, A.; Weber, R.S.; Padmaperuma, A.B.; et al. Electrocatalytic hydrogenation of biomass-derived organics: A Review. Chem. Rev. 2020, 120, 11370–11419. [Google Scholar] [CrossRef]
- Xia, Z.; Li, Y.; Wu, J.; Huang, Y.-C.; Zhao, W.; Lu, Y.; Pan, Y.; Yue, X.; Wang, Y.; Dong, C.-L.; et al. Promoting the electrochemical hydrogenation of furfural by synergistic Cu0-Cu+ active sites. Sci. China-Chem. 2022, 65, 2588–2595. [Google Scholar] [CrossRef]
- May, A.S.; Biddinger, E.J. Speciation of potential-dependent fouling on copper foil electrodes during electrochemical hydrogenation and hydrogenolysis of furfural in strong acid. Green Chem. 2023, 25, 8687–8697. [Google Scholar] [CrossRef]
- Yao, Z.C.; Chai, J.; Tang, T.; Ding, L.; Jiang, Z.; Fu, J.; Chang, X.; Xu, B.; Zhang, L.; Hu, J.S.; et al. Manipulating hydrogenation pathways enables economically viable electrocatalytic aldehyde-to-alcohol valorization. Proc. Natl. Acad. Sci. USA 2025, 122, e2423542122. [Google Scholar] [CrossRef] [PubMed]
- Wen, H.; Fan, Z.; Dou, S.; Lam, J.C.-H.; Zhang, W.; Chen, Z. Electrochemical hydrogenation of furfural under alkaline conditions with enhanced furfuryl alcohol selectivity by self-grown Cu on a Ag electrode. Inorg. Chem. Front. 2024, 11, 4449–4458. [Google Scholar] [CrossRef]
- Chen, X.; Li, R.; Zhong, Y.; Liu, H.; Hu, D.; Liang, C. Insights on the hydrogenation of furfural and its derivatives to 1,5-Pentanediol over Ni/La-substituted CeO2 catalysts. Chem. Eng. J. 2024, 499, 155854. [Google Scholar] [CrossRef]
- Qin, M.; Fan, S.; Li, X.; Duan, J.; Chen, G. Electrocatalytic reduction of furfural to furfuryl alcohol using carbon nanofibers supported zinc cobalt bimetallic oxide with surface-derived zinc vacancies in alkaline medium. J. Colloid Interface Sci. 2024, 660, 800–809. [Google Scholar] [CrossRef]
- Dixit, R.J.; Gayen, P.; Saha, S.; De, B.S.; Anand, A.; Basu, S.; Ramani, V.K. Tuning product selectivity during electrocatalytic hydrogenation of biomass-derived furfural through oxygen vacancy control in metal oxides. Ind. Eng. Chem. Res. 2024, 63, 5039–5052. [Google Scholar] [CrossRef]
- Dixit, R.J.; Bhattacharyya, K.; Ramani, V.K.; Basu, S. Electrocatalytic hydrogenation of furfural using non-noble-metal electrocatalysts in alkaline medium. Green Chem. 2021, 23, 4201–4212. [Google Scholar] [CrossRef]
- Zhang, X.; Han, M.; Liu, G.; Wang, G.; Zhang, Y.; Zhang, H.; Zhao, H. Simultaneously high-rate furfural hydrogenation and oxidation upgrading on nanostructured transition metal phosphides through electrocatalytic conversion at ambient conditions. Appl. Catal. B Environ. 2019, 244, 899–908. [Google Scholar] [CrossRef]
- Zhan, P.; Liu, X.; Zhu, Q.; Zhao, H.; Zhang, S.; Zhang, C.; Ren, C.; Zhang, J.; Zhang, C.; Cai, D. Selective furfuryl alcohol production from furfural via bio-electrocatalysis. Catalysts 2023, 13, 101. [Google Scholar] [CrossRef]
- Fang, G.; Bao, S.-X.; Zhou, G.-X.; Ge, C.-C. Activity regulation and applications of metal-organic framework-based nanozymes. Rare Met. 2023, 43, 900–914. [Google Scholar] [CrossRef]
- Lee, Y.S.; Huang, C.W.; Yueh, C.T.; Kung, C.W.; Yu, W.Y. Electrochemical hydrogenation and hydrogenolysis of furfural on copper electrode enhanced by surface environment modulation with metal-organic framework. Chem. Eng. J. 2025, 506. [Google Scholar] [CrossRef]
- Yang, Z.H.; Chou, X.Y.; Kan, H.Y.; Xiao, Z.H.; Ding, Y. Nanoporous copper catalysts for the fluidized electrocatalytic hydrogenation of furfural to furfuryl alcohol. ACS Sustain. Chem. Eng. 2022, 10, 7418–7425. [Google Scholar] [CrossRef]
- Jiao, L.; Jiang, H.-L. Metal-organic frameworks for catalysis: Fundamentals and future prospects. Chin. J. Catal. 2023, 45, 1–5. [Google Scholar] [CrossRef]
- Feng, Y.; Smith, R.L.; Fu, J.; Qi, X. In situ transformation of Co-MOF nanorods into Co3S4/Ni3S2 nanotube arrays for electrochemical biomass upgrading. Green Chem. 2023, 25, 8698–8705. [Google Scholar] [CrossRef]
- Spadetto, C.; Hachemi, C.; Nouaille-Degorce, M.; Pendu, L.; Bossert, L.; Temperton, R.; Shavorskiy, A.; Cardenas, L.; Prévot, M.S. Electrocatalytic hydrogenation of furfural with improved activity and selectivity at the surface of structured copper electrodes. ACS Catal. 2024, 14, 4489–4500. [Google Scholar] [CrossRef]
- Dhawan, M.S.; Yadav, G.D.; Barton, S.C. Zinc-electrocatalyzed hydrogenation of furfural in near-neutral electrolytes. Sustain. Energy Fuels 2021, 5, 2972–2984. [Google Scholar] [CrossRef]
- Afshariazar, F.; Morsali, A. Mixed-valence metal-organic frameworks: Concepts, opportunities, and prospects. Chem. Soc. Rev. 2025, 54, 1318–1383. [Google Scholar] [CrossRef] [PubMed]
- Su, L.; Zhang, S.; Wu, H.; Zhou, S.; Cui, C.; Pang, H. Mechanism insights and design strategies for metal-organic framework-based alkaline hydrogen evolution reaction electrocatalysts. Mol. Catal. 2024, 130, 110177. [Google Scholar] [CrossRef]
- Zhang, C.; Zhang, Y.; Li, Y.; Xu, T.; Sun, Y.; Bai, J. Palladium-modified zirconium dioxide as a selective catalyst for hydrogenation of furfural to furfuryl alcohol. Mater. Res. Bull 2024, 179, 112946. [Google Scholar] [CrossRef]
- Cheng, X.; Zhang, Y.; Wang, J.; Zhang, X.; Sun, C.; Yang, Y.; Wang, X. B-O oligomers or ring species in AlB2: Which is more selective for propane oxidative dehydrogenation? ACS Catal. 2023, 13, 1630–1637. [Google Scholar] [CrossRef]
- Zhao, P.; Lin, Z.-E.; Wei, Q.; Cheng, L.; Yang, G.-Y. A pillared-layered zincoborate with an anionic network containing unprecedented zinc oxide chains. Chem. Commun. 2014, 50, 3592–3594. [Google Scholar] [CrossRef]
- He, M.; Yao, J.; Liu, Q.; Wang, K.; Chen, F.; Wang, H. Facile synthesis of zeolitic imidazolate framework-8 from a concentrated aqueous solution. Microporous Mesoporous Mater. 2014, 184, 55–60. [Google Scholar] [CrossRef]
- Cao, L.; Dai, P.; Wen, S.; Jiang, Y.; Liu, D.; Gu, X.; Zhang, Q.; Xia, Y.; Zhong, G.; Zhao, X.; et al. A thermostable pillared layered metal-borate- organic network featuring neighboring boron sites for oxidative dehydrogenation of propane. Matter 2023, 6, 4376–4387. [Google Scholar] [CrossRef]
- Naik, S.S.; Theerthagiri, J.; Min, A.; Moon, C.J.; Lee, S.J.; Choi, M.Y. Selective furfural conversion via parallel hydrogenation-oxidation on MOF-derived CuO/RuO2/C electrocatalysts via pulsed laser. Appl. Catal. B Environ. 2023, 339, 123164. [Google Scholar] [CrossRef]
- Parpot, P.; Bettencourt, A.P.; Chamoulaud, G.; Kokoh, K.B.; Belgsir, E.M. Electrochemical investigations of the oxidation–reduction of furfural in aqueous medium: Application to electrosynthesis. Electrochim. Acta 2004, 49, 397–403. [Google Scholar] [CrossRef]
- Ketkaew, M.; Assavapanumat, S.; Klinyod, S.; Kuhn, A.; Wattanakit, C. Bifunctional Pt/Au Janus electrocatalysts for simultaneous oxidation/reduction of furfural with bipolar electrochemistry. Chem. Commun. 2022, 58, 4312–4315. [Google Scholar] [CrossRef]
- Chen, P.; Zhang, W.; Tan, J.; Yang, Y.; Jia, Y.; Tang, Y.; Gao, Q. In situ reconfiguration of plasma-engineered copper electrodes towards efficient electrocatalytic hydrogenation. Catal. Sci. Technol. 2022, 12, 4032–4039. [Google Scholar] [CrossRef]
- Huang, S.; Jin, Y.; Zhang, M.; Yan, K.; Feng, S.-P.; Lam, J.C.-H. MoS2-catalyzed selective electrocatalytic hydrogenation of aromatic aldehydes in an aqueous environment. Green Chem. 2022, 24, 7974–7987. [Google Scholar] [CrossRef]
- Zhao, B.; Chen, M.; Guo, Q.; Fu, Y. Electrocatalytic hydrogenation of furfural to furfuryl alcohol using platinum supported on activated carbon fibers. Electrochim. Acta 2014, 135, 139–146. [Google Scholar] [CrossRef]
- Sabri, M.A.; Bharath, G.; Hai, A.B.; Haija, M.A.; Nogueira, R.P.; Banat, F. Synthesis of molybdenum-cobalt nanoparticles decorated on date seed-derived activated carbon for the simultaneous electrochemical hydrogenation and oxidation of furfural into fuels. Fuel Process. Technol. 2022, 238, 14. [Google Scholar] [CrossRef]
- Lv, Q.; Yi, J.J.; Lam, J.C.H.; Wang, H.; Zhang, H.; Huang, S.Q.; Luo, Y.M. Engineering a Cu cluster supported on 1T-rich MoS2 for the efficient electrocatalytic hydrogenation of Furfural to Furfuryl Alcohol in a Neutral Aqueous Solution. ACS Sustain. Chem. Eng. 2025, 13, 1677–1688. [Google Scholar] [CrossRef]
- Wen, H.; Li, T.; Fan, Z.; Jing, Y.; Zhang, W.; Chen, Z. Electrocatalytic hydrogenation of furfural over copper nitride with enhanced hydrogen spillover performance. Green Chem. 2024, 26, 8861–8871. [Google Scholar] [CrossRef]
- Xia, Z.; Xu, L.; Ma, C.; An, Q.; Bu, C.; Fan, Y.; Lu, Y.; Pan, Y.; Xie, D.; Liu, Q.; et al. Enhancing the electrocatalytic hydrogenation of furfural via anion-induced molecular activation and adsorption. J. Am. Chem. Soc. 2024, 146, 24570–24579. [Google Scholar] [CrossRef]
- Xu, H.; Xu, G.; Huang, B.; Yan, J.; Wang, M.; Chen, L.; Shi, J. Zn-organic batteries for the semi-hydrogenation of biomass aldehyde derivatives and concurrently enhanced power output. Angew. Chem. Int. Ed. 2023, 11, 8642–8650. [Google Scholar]
- Jung, O.; Jackson, M.N.; Bisbey, R.P.; Kogan, N.E.; Surendranath, Y.J.J. Innocent buffers reveal the intrinsic pH-and coverage-dependent kinetics of the hydrogen evolution reaction on noble metals. Joule 2022, 6, 476–493. [Google Scholar] [CrossRef]
- Wu, J.; Xu, L.; Li, Y.; Dong, C.-L.; Lu, Y.; Nga, T.T.T.; Kong, Z.; Li, S.; Zou, Y.; Wang, S. Anodic cross-coupling of biomass platform chemicals to sustainable biojet fuel precursors. J. Am. Chem. Soc. 2022, 144, 23649–23656. [Google Scholar] [CrossRef]
Disclaimer/Publisher’s Note: The statements, opinions and data contained in all publications are solely those of the individual author(s) and contributor(s) and not of MDPI and/or the editor(s). MDPI and/or the editor(s) disclaim responsibility for any injury to people or property resulting from any ideas, methods, instructions or products referred to in the content. |
© 2025 by the authors. Licensee MDPI, Basel, Switzerland. This article is an open access article distributed under the terms and conditions of the Creative Commons Attribution (CC BY) license (https://creativecommons.org/licenses/by/4.0/).